A genetic assessment of Bay Scallop restoration in
Bogue Sound, North Carolina
Sherman, M.1, D. Schmidt2, A.E. Wilbur1
1Department of Biology and Marine Biology, Center for Marine Science, University of North Carolina
Wilmington, Wilmington, NC 284092 Goose Creek Rd. Newport, NC 28570

Background Methods Results Conclusions
State of the scallop fishery in North Carolina– Declining fishery likely due to several factors
• Red tide in 1987– Recruitment failure
• Predation– Cownose rays
• Hurricanes
– low scallop abundance has prompted the investigation of restoration practices
NC Scallops Landings (1950-2005)

Background Methods Results Conclusions
Types of restoration strategies– Preserve and protect
• Releases population from pressures
– Rebuild habitat• Useful for substrate limited organisms
– Supplementation• Transplantation• Hatchery production
– Traditional hatchery practices» Spawn, grow to size, and release
– Larval releases» May be inexpensive and efficient

Background Methods Results Conclusions
Larval releases in Florida- Pine Island Sound (Arnold 2008)
– In 2003, 1,500,000 larvae released from hatchery stock from 12 Anclote broodstock scallops
– In 2005, found an increase in abundance by a factor of 18
• indicative of enhancement
• Retrospective genetic analysis
– Microsatellite analysis (9 loci) (Hemond 2006)
• Genotypes of broodstock not determined
• Broodstock source population (Anclote, FL)
• Pine Island scallops from before (2001) and after (2005) the 2003 larval release
– Could not confidently assign a source population
• Lack of differentiation between sources limits assignment success
Jay Leverone releasing larvae in Pine Island Sound
Frequentist method (Praetkau et al. 1995)Based on probabilistic framework
Log
L (P
ine
Isla
nd s
ourc
e)
Log L (Anclote source)
Pine Island Sound Assignment Test

Broodstock scallops are genetically characterized
Broodstock scallops are spawned
Larvae are grown to the pediveliger stage
Larvae are released into the wild
Spat and adult assessment scallops
collected and genetically
characterized
Genetic signatures of broodstock and assessment scallops are compared to identify potential hatchery
offspring
Background Methods Results Conclusions

Background Methods Results Conclusions
Fall 2007- A total of 85 wild scallops were collected for broodstock
- Separated into five sets of broodstock
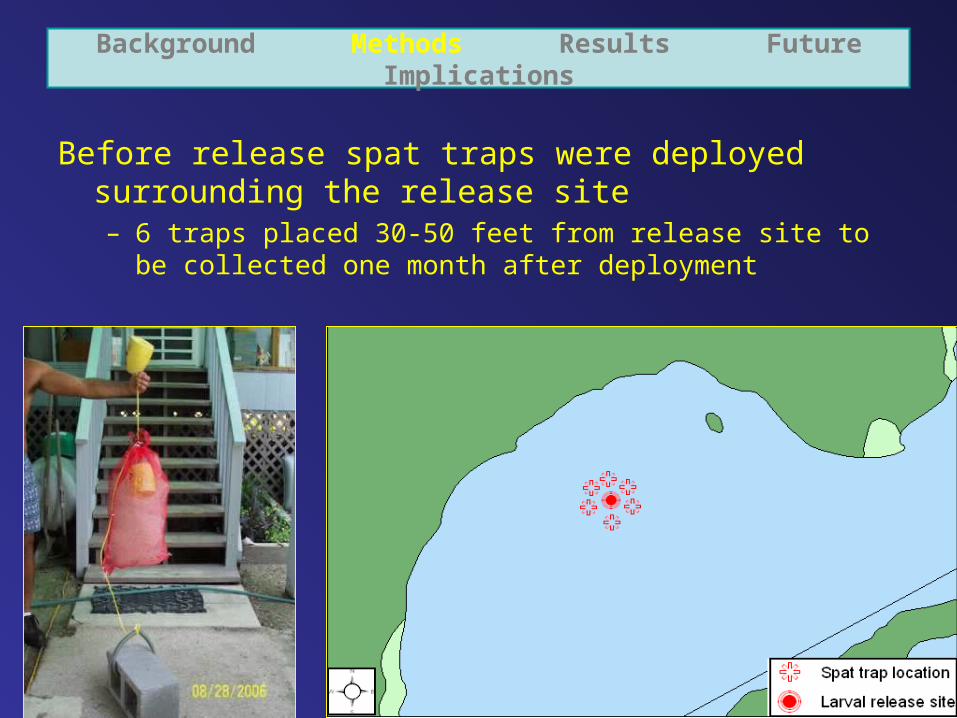
Background Methods Results Future Implications
Before release spat traps were deployed surrounding the release site– 6 traps placed 30-50 feet from release site to be collected one
month after deployment

Background Methods Results Conclusions
• Scallops were then introduced to the release siteo Healthy subtidal seagrass bedo Low tide
o Limit vertical profile

Background Methods Results Conclusions
Larval Release Summary
Broodstock LocationAge at larval release (days)
Number of
BroodstockNumber of
larvaeTotal larvae
per site
Red Taylor Bay 13 24 250,000
Green Taylor Bay 11 17 1,000,000 Purple Taylor Bay 14 12 154,000 1,404,000
Orange Piney Island 10 17 572,000 Yellow Piney Island 9 15 515,000 1,087,000
Total 85 2,491,000
Releases took place in September and October 2007
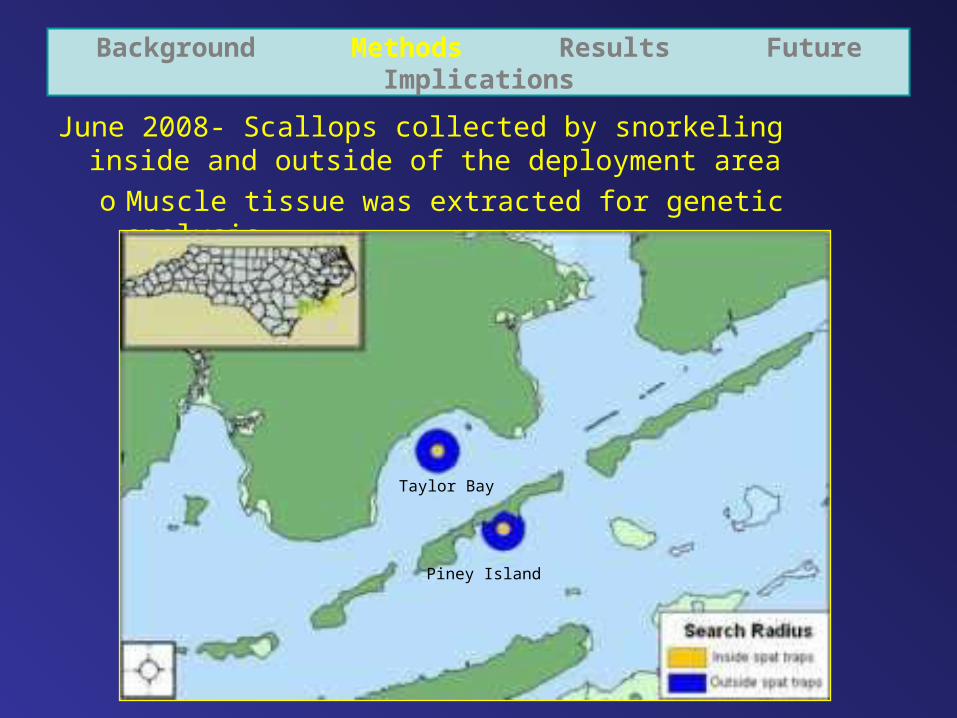
Background Methods Results Future Implications
June 2008- Scallops collected by snorkeling inside and outside of the deployment areao Muscle tissue was extracted for genetic analysis
Taylor Bay
Piney Island
Background Methods Results Conclusions
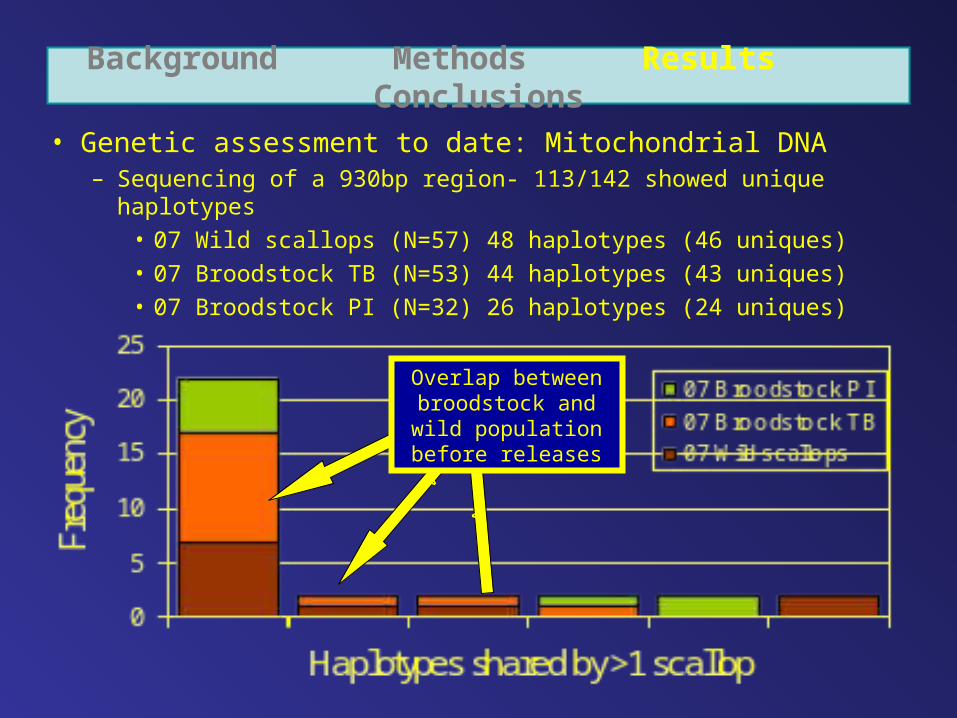
• Genetic assessment to date: Mitochondrial DNA – Sequencing of a 930bp region- 113/142 showed unique haplotypes
• 07 Wild scallops (N=57) 48 haplotypes (46 uniques)• 07 Broodstock TB (N=53) 44 haplotypes (43 uniques)• 07 Broodstock PI (N=32) 26 haplotypes (24 uniques)
vv v
Overlap between broodstock and wild
population before releases

Background Methods Results Conclusions
Genetic assessment to date• Mitochondrial DNA
– In 2007- 11/57 (19.3%) wild scallops exhibited broodstock haplotypes – In 2008- 69/265 (24%) assessment scallops exhibited broodstock
haplotypes
v
Mostly Haplotype 1where overlap between
broodstock and wild population greatest
08-Assessment PI
08-Assessment TB
07-Broodstock PI
07-Broodstock TB
07- Wild Scallops
Background Methods Results Conclusions
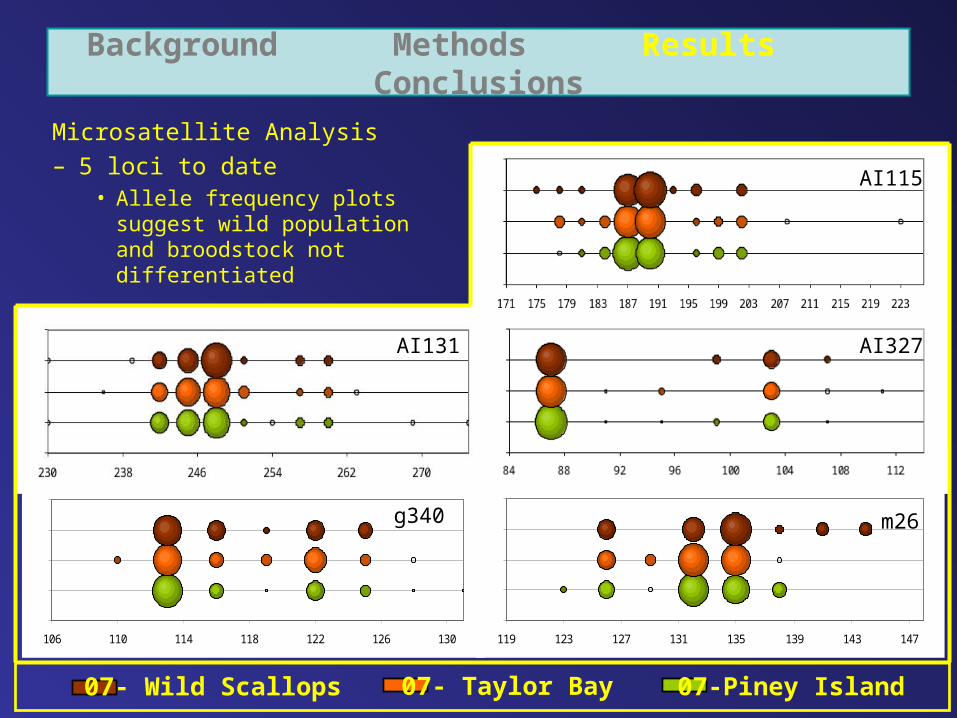
Microsatellite Analysis– 5 loci to date
• Allele frequency plots suggest wild population and broodstock not differentiated
106 110 114 118 122 126 130 119 123 127 131 135 139 143 147
AI115
AI327
m26
AI131
g340
07-Piney Island07- Taylor Bay07- Wild Scallops

Background Methods Results Conclusions
Assignment test of potential source populations– 25/57 wild correctly assigned to wild– 18/85 broodstock scallops correctly assigned to hatchery– Less than ½ of broodstock and wild scallops assigned correctly
-13
-11
-9
-7
-5
-3
-1
-12 -10 -8 -6 -4 -2 0
LOG L [WILD SOURCE]
LO
G L
[H
AT
CH
ER
Y S
OU
RC
E]
GRN
ORG
PUR
RED
YEL
07 Wild

Background Methods Results Conclusions
Assignment of assessment scallops• Taylor Bay
– 41 mtDNA matches• 22 assigned to broodstock released at Taylor Bay • 2 assigned to broodstock released at Piney Island • 17 assigned to wild population
• Piney Island– 14 mtDNA matches
• 4 assigned to broodstock released at Piney Island
• 10 assigned to broodstock released in Taylor Bay

Background Methods Results Conclusions
• Conclusions– Potential enhancement looks promising, but significant
impact not detected with microsatellites to date• 22/157 (~14%) properly assigned scallops in Taylor Bay• 4/108 (~4%) properly assigned scallops in Piney Island• Increased loci will likely increase the power to detect hatchery
scallops
• Suggestions for future assessments– Broader perspective
• Larval transport away from release site• Broader geographic sampling
– Density survey • Larval releases may work- how well?• Are there more scallops?

Acknowledgements
• NC Sea Grant Fisheries Resource Grant 06-EP-07
• UNCW DNA Analysis Core Facility• Bill Arnold (FFWRI), Skip Kemp (CCC),
Tina Moore (NCDMF), Don Morlock
Recommended