KIT – The Research University in the Helmholtz Association
Institute for Applied Computer Science
www.kit.edu
A Generic Microservice Architecture for Environmental Data Management
Clemens Düpmeier, Eric Braun, Thorsten Schlachter, Karl-Uwe Stucky,
Wolfgang Suess
Institute for Applied Computer Science2
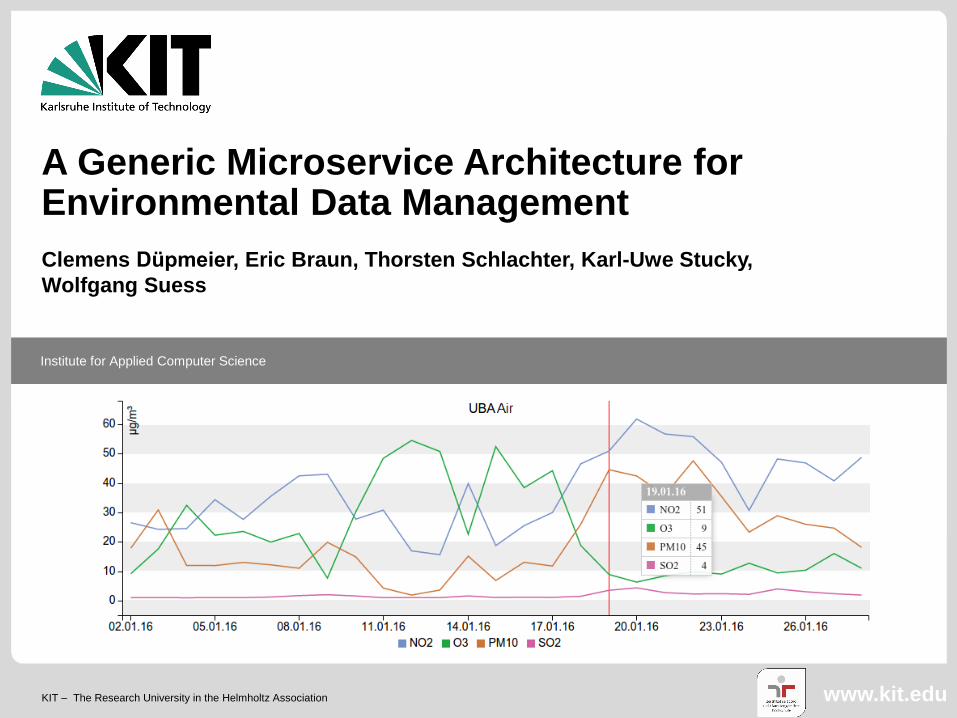
Motivation
New IT trends influencing e.g. environmental information systems (and
other applications), such as
Internet of Things (IoT) applications,
Sensor networks
Large scale crowdsourcing applications for gathering data with the help of
the General Public
Mobile apps providing instant access to context-aware information
Lead to new requirements on managing and serving data to
applications
E.g. „Big Data“ storage with high „velocity“ and „volume“
Needs to add data analytics as part of the backend system of applications
(e.g. using “Machine Learning Algorithms”)
Older (web-based) environmental information systems are not
designed to cope with such requirements
15.05.2017
Institute for Applied Computer Science3
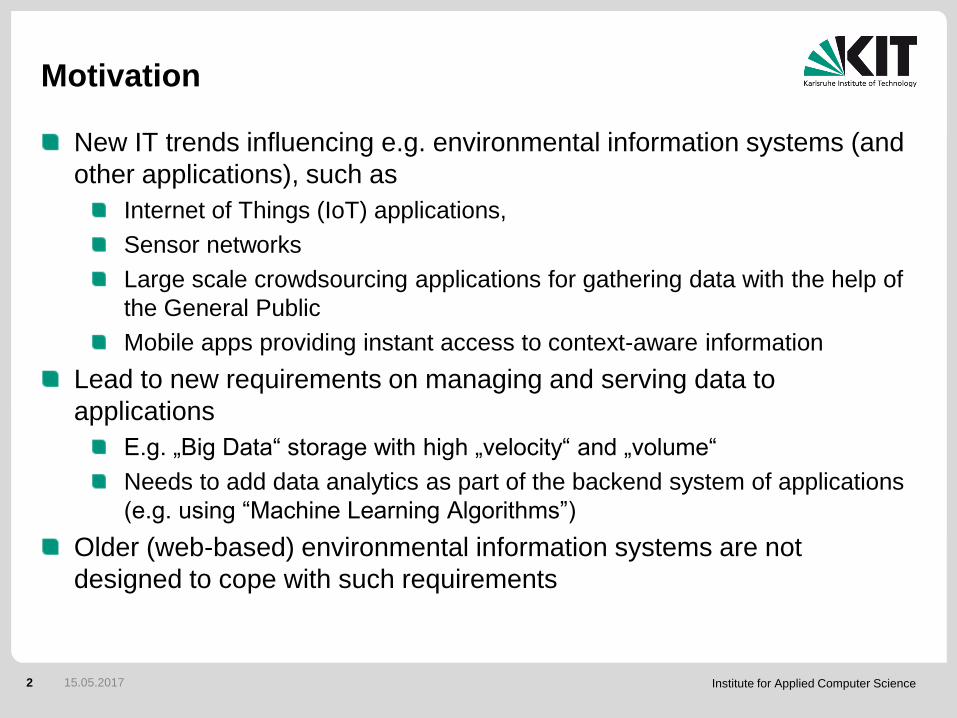
Disadvantages of older Public Environmental
Information Systems (PEIS)
Larger monolithic applications which have grown in functionality over years
Often multitier
And installed only on one bigger application server (e.g. JEE)
Dedicated proprietary solution with one large integrated data model
Such large software applications are difficult to innovate because of their
complexity
Updates take years
This hinders further development and innovation of the software slows down
The software architecture is typically tied to one technology stack and often
uses proprietary data semantics and interfaces
Changing the technology stack fosters a complete redesign of the whole
application
Proprietary data semantics and interfaces complicate integration with third
party software
Overall, this slows down technical innovation of the applications
15.05.2017
Institute for Applied Computer Science4
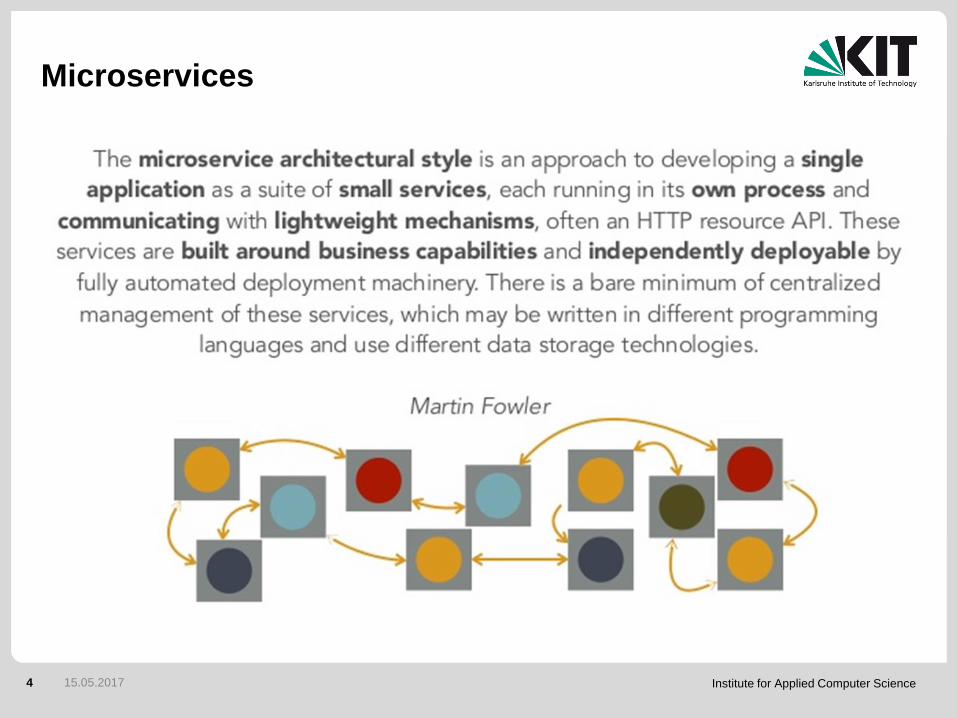
Microservices
15.05.2017
Institute for Applied Computer Science5
Advantages of Microservices
Microservices focus on one functionality. This leads to a more modular
design
Smaller, separated codebases, easier to understand, „fun to develop
and deploy“
=> Flexible and agile software development
Each Microservice can use its own technology stack
=> This drives fast innovation
Governance focus on (REST based) service interfaces by using
standards
=> better interoperability possibilities
Each Microservice provides its own runtime environment
=> faults are separated
Each Microservice is designed to be horizontally scalable
=> flexible scalable system, where each service can be scaled
independently from each other
15.05.2017
Institute for Applied Computer Science6
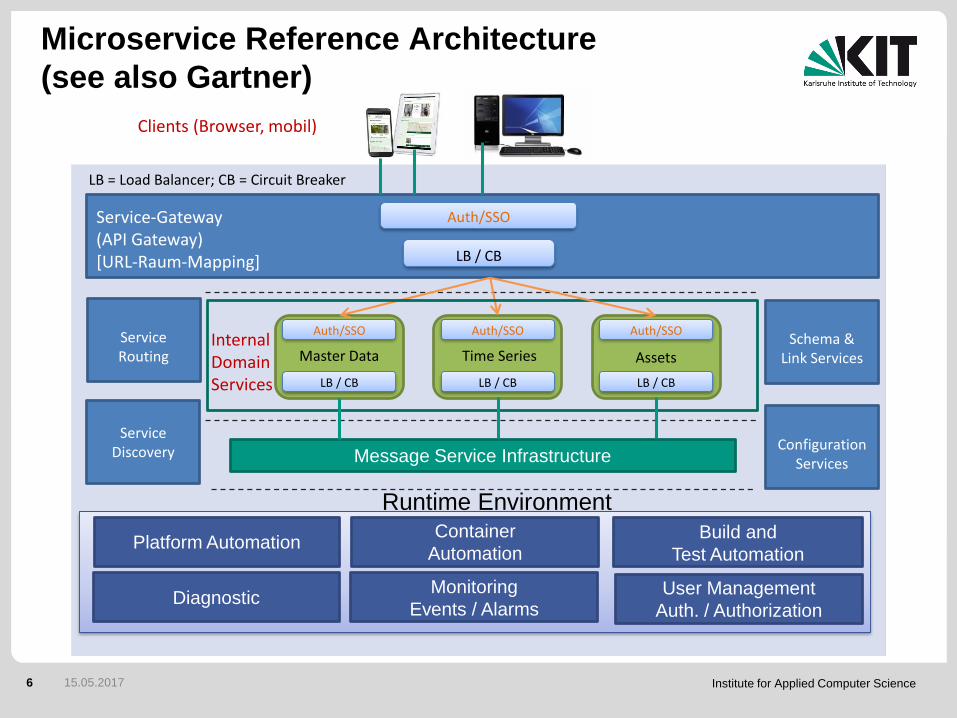
Microservice Reference Architecture
(see also Gartner)
Auth/SSO
LB / CB
Service-Gateway (API Gateway)[URL-Raum-Mapping]
ServiceDiscovery
ServiceRouting
Schema &Link Services
ConfigurationServices
Clients (Browser, mobil)
InternalDomainServices
Master Data
LB / CB
Auth/SSO
Time Series
LB / CB
Auth/SSO
Assets
LB / CB
Auth/SSO
LB = Load Balancer; CB = Circuit Breaker
Message Service Infrastructure
Platform Automation
Diagnostic
Container
Automation
Monitoring
Events / Alarms
Build and
Test Automation
User Management
Auth. / Authorization
Runtime Environment
15.05.2017
Institute for Applied Computer Science7
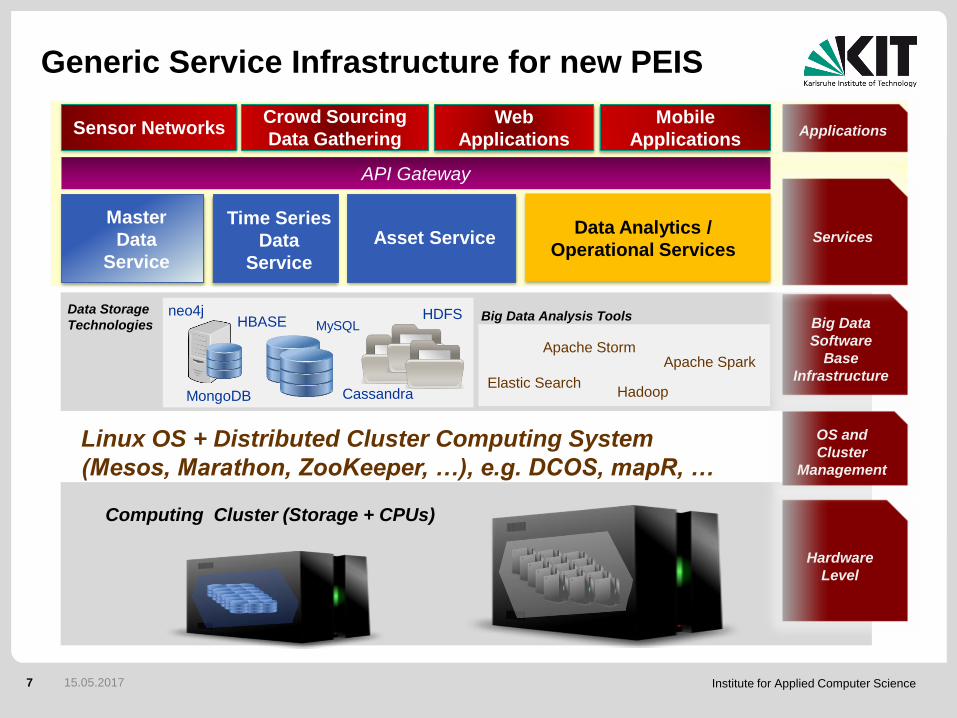
Generic Service Infrastructure for new PEIS
Linux OS + Distributed Cluster Computing System
(Mesos, Marathon, ZooKeeper, …), e.g. DCOS, mapR, …
Computing Cluster (Storage + CPUs)
neo4jMySQL
MongoDB
HBASEHDFS
Cassandra
Big Data Analysis ToolsData Storage
Technologies
Apache StormApache Spark
HadoopElastic Search
Hardware
Level
Big Data
Software
Base
Infrastructure
Services
OS and
Cluster
Management
Master
Data
Service
Asset Service
API Gateway
Time Series
Data
Service
Data Analytics /
Operational Services
ApplicationsSensor NetworksCrowd Sourcing
Data Gathering
Web
Applications
Mobile
Applications
15.05.2017
Institute for Applied Computer Science8
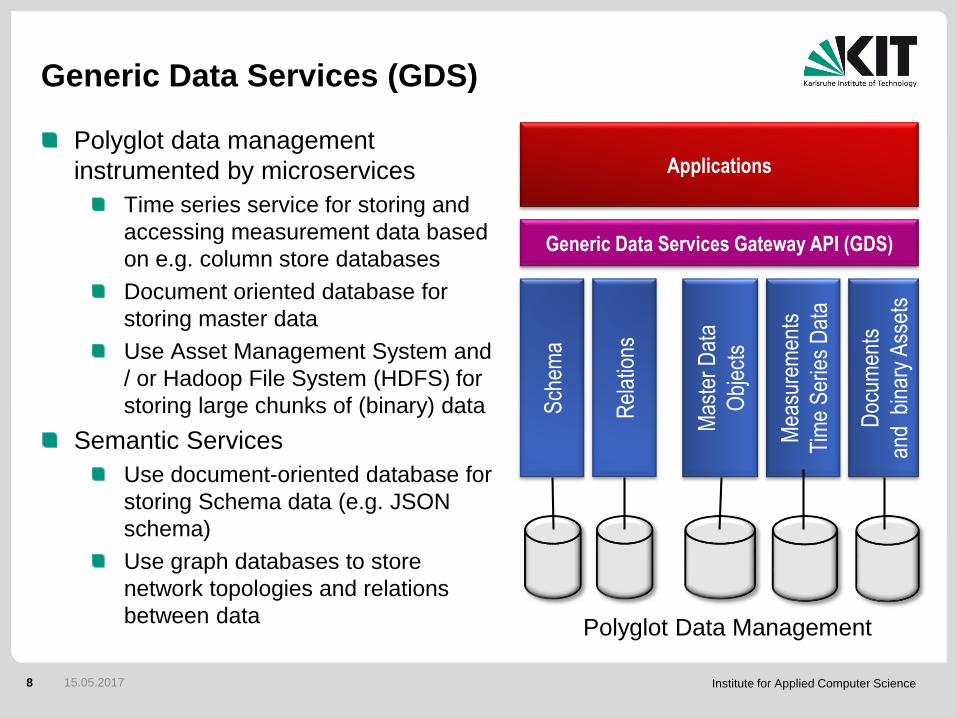
Generic Data Services (GDS)
Polyglot data management
instrumented by microservices
Time series service for storing and
accessing measurement data based
on e.g. column store databases
Document oriented database for
storing master data
Use Asset Management System and
/ or Hadoop File System (HDFS) for
storing large chunks of (binary) data
Semantic Services
Use document-oriented database for
storing Schema data (e.g. JSON
schema)
Use graph databases to store
network topologies and relations
between data
Mas
ter
Dat
a
Obj
ects
Mea
sure
men
ts
Tim
e S
erie
s D
ata
Doc
umen
ts
and
bin
ary
Ass
ets
Sch
ema
Generic Data Services Gateway API (GDS)
Polyglot Data Management
Applications
Rel
atio
ns
15.05.2017
Institute for Applied Computer Science9
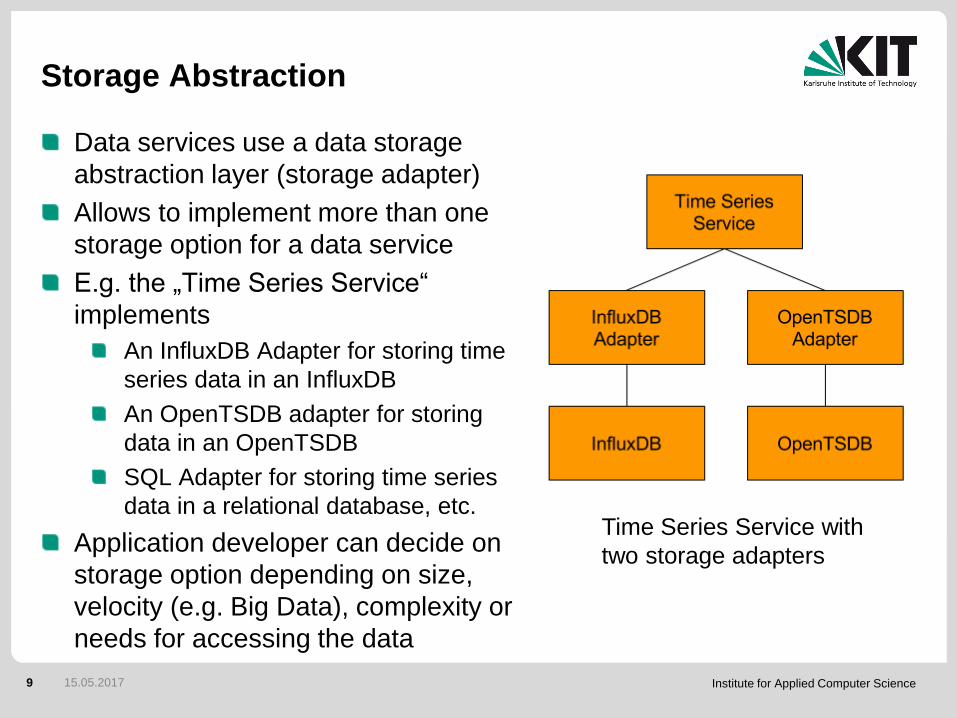
Storage Abstraction
Data services use a data storage
abstraction layer (storage adapter)
Allows to implement more than one
storage option for a data service
E.g. the „Time Series Service“
implements
An InfluxDB Adapter for storing time
series data in an InfluxDB
An OpenTSDB adapter for storing
data in an OpenTSDB
SQL Adapter for storing time series
data in a relational database, etc.
Application developer can decide on
storage option depending on size,
velocity (e.g. Big Data), complexity or
needs for accessing the data
15.05.2017
Time Series Service with
two storage adapters
Institute for Applied Computer Science10
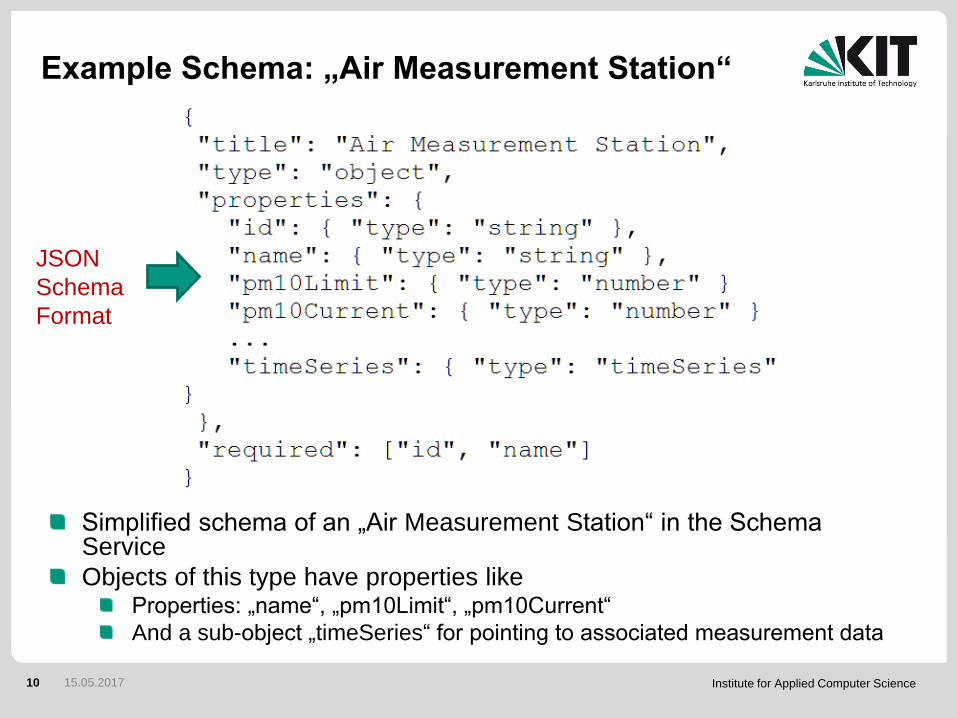
Example Schema: „Air Measurement Station“
Simplified schema of an „Air Measurement Station“ in the Schema Service
Objects of this type have properties like Properties: „name“, „pm10Limit“, „pm10Current“
And a sub-object „timeSeries“ for pointing to associated measurement data
15.05.2017
JSON
Schema
Format
Institute for Applied Computer Science11
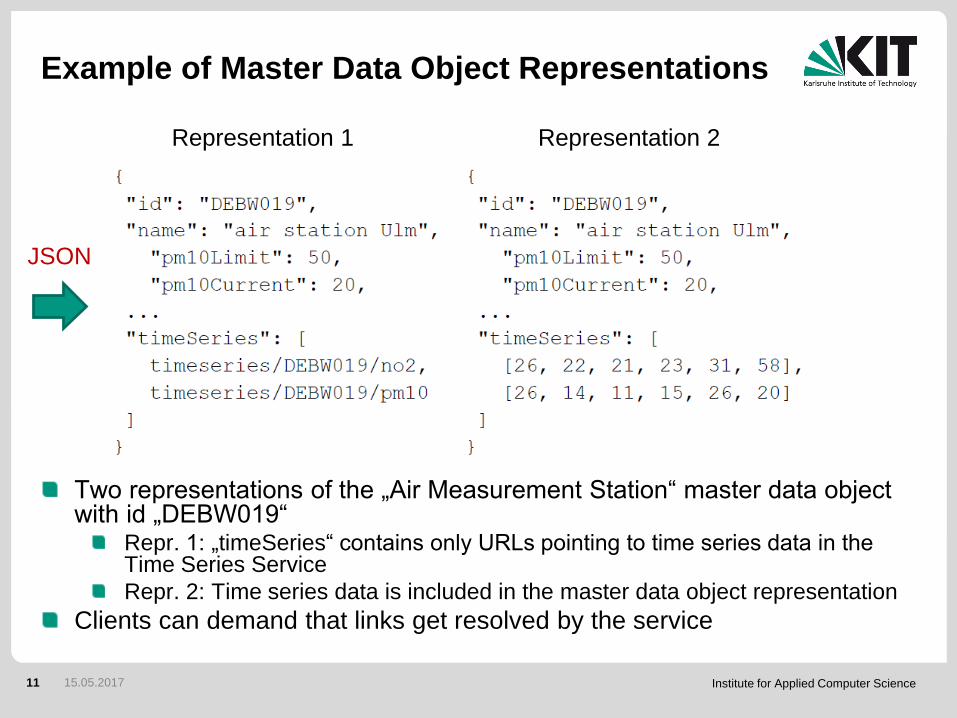
Example of Master Data Object Representations
Two representations of the „Air Measurement Station“ master data object with id „DEBW019“
Repr. 1: „timeSeries“ contains only URLs pointing to time series data in the Time Series Service
Repr. 2: Time series data is included in the master data object representation
Clients can demand that links get resolved by the service
15.05.2017
Representation 1 Representation 2
JSON
Institute for Applied Computer Science12
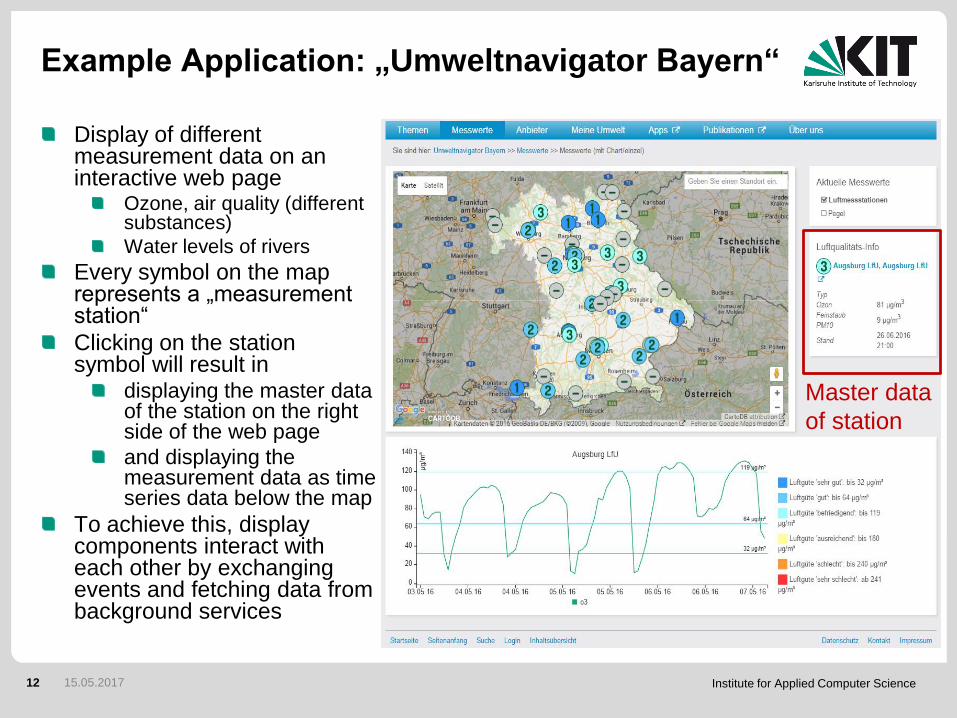
Example Application: „Umweltnavigator Bayern“
Display of different measurement data on an interactive web page
Ozone, air quality (different substances)
Water levels of rivers
Every symbol on the map represents a „measurement station“
Clicking on the station symbol will result in
displaying the master data of the station on the right side of the web page
and displaying the measurement data as time series data below the map
To achieve this, display components interact with each other by exchanging events and fetching data from background services
Master data
of station
15.05.2017
Institute for Applied Computer Science13
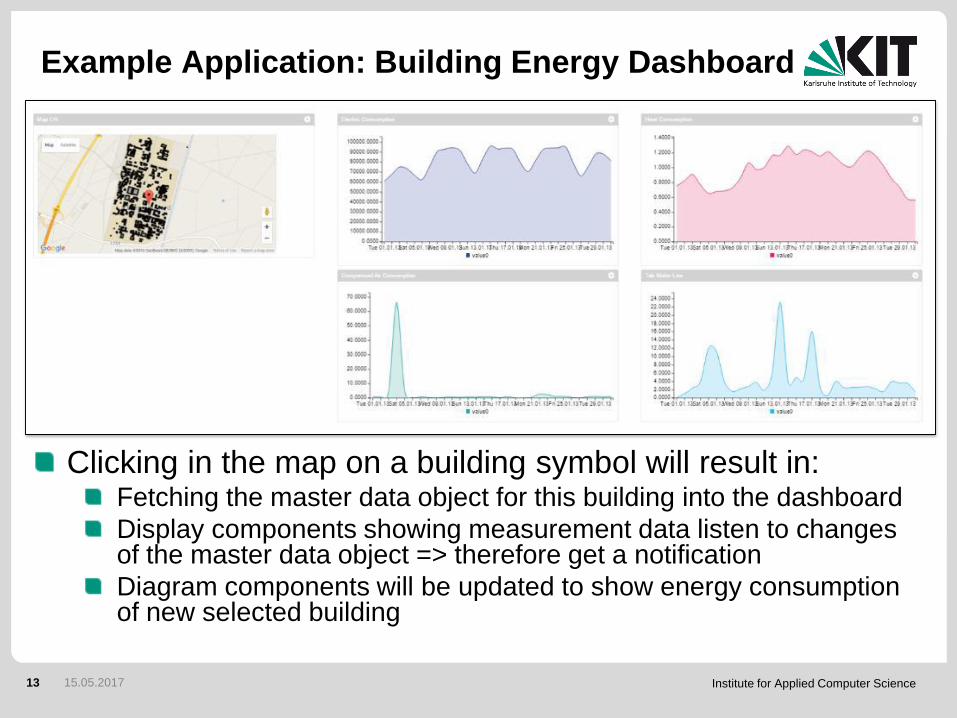
Example Application: Building Energy Dashboard
Clicking in the map on a building symbol will result in:Fetching the master data object for this building into the dashboard
Display components showing measurement data listen to changes of the master data object => therefore get a notification
Diagram components will be updated to show energy consumption of new selected building
15.05.2017
Institute for Applied Computer Science14
Conclusion and Outlook
Conclusion
Microservices allow the development of services which provide highly
reusable generic functionalities for e.g. data management (or data
analytics, etc.)
Usable for many kinds of applications
Very agile development and application environment
Allowing fast innovation
And functional extensions in a very short time
Corresponding modular display components (web components) for e.g.
web applications and / or mobile apps allow to reuse services easily in
different application contexts
Further work
Building up a library of reusable web components for instrumenting
services on the client side (based on Polymer and the Web Component
Standards)
Adding generic data analytics and operational services to the service
backend (e.g. for data analysis, data ingestion, …)
15.05.2017
Recommended