A Demonstration of
Qualtrics.com Online Survey Hosting and Reporting
Brian Pickerill, Office of Institutional Effectiveness
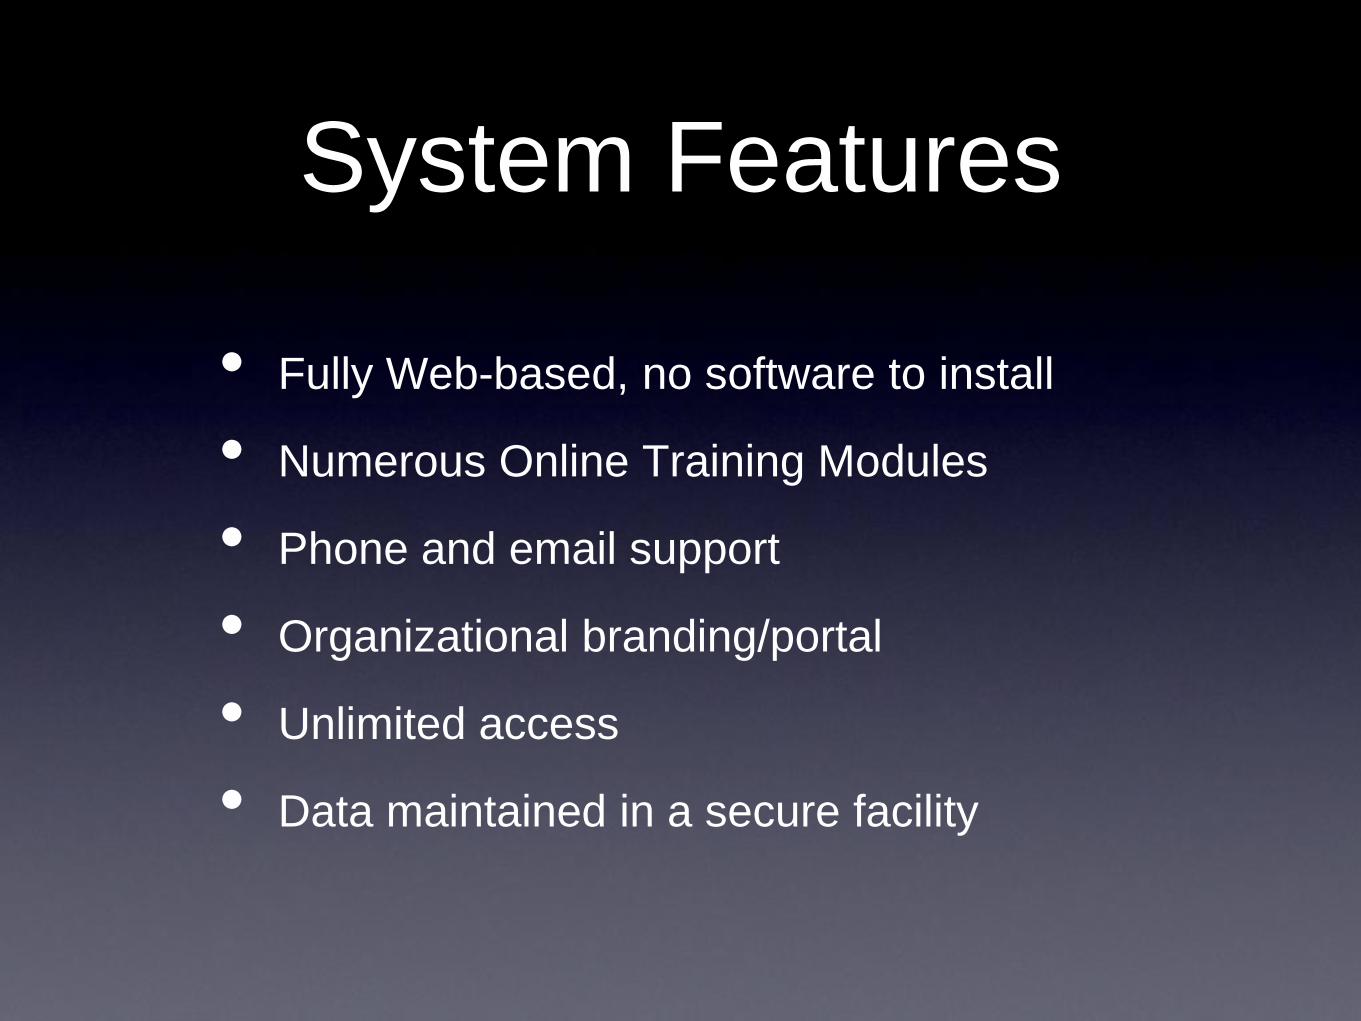
System Features
• Fully Web-based, no software to install
• Numerous Online Training Modules
• Phone and email support
• Organizational branding/portal
• Unlimited access
• Data maintained in a secure facility
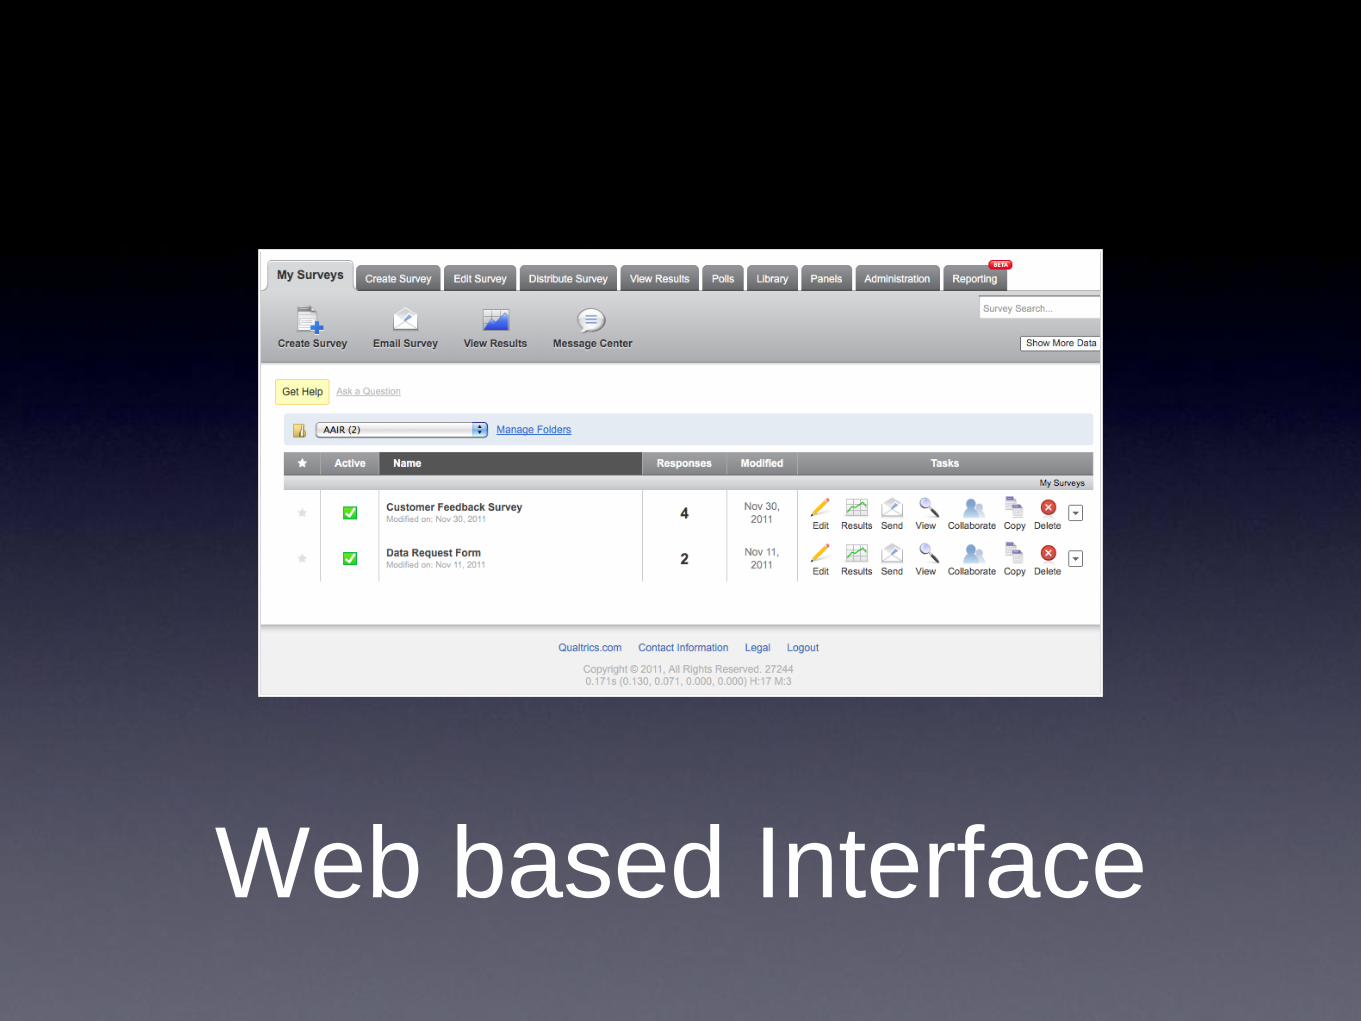
Web based Interface
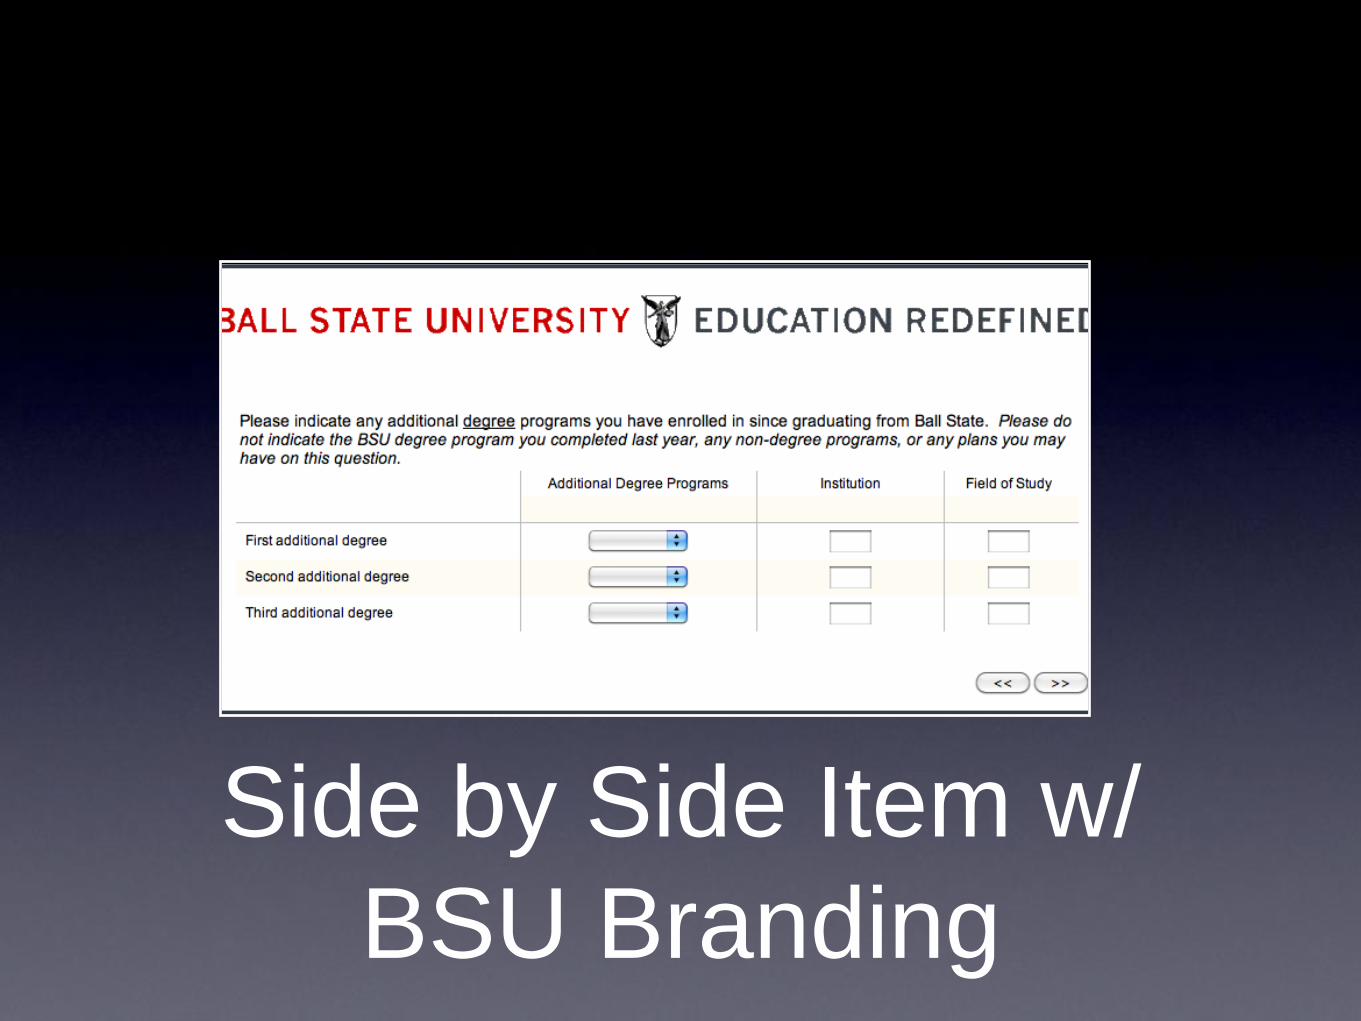
Side by Side Item w/
BSU Branding
Respondent Features:
• Allows Partial/Deferred Completion
• Progress Display
• Wide Variety of Question Types
• Branching to Eliminate Irrelevant Questions
• Automatic Feedback/Redirection on Survey
Completion

The BSU Qualtrics
Portal The BSU Qualtrics Portal is Currently being Set-up by
Information Technology
Four Main Areas (Tabs)
• My Surveys Tab
• Edit Tab
• Distribution Tab
• Results Tab
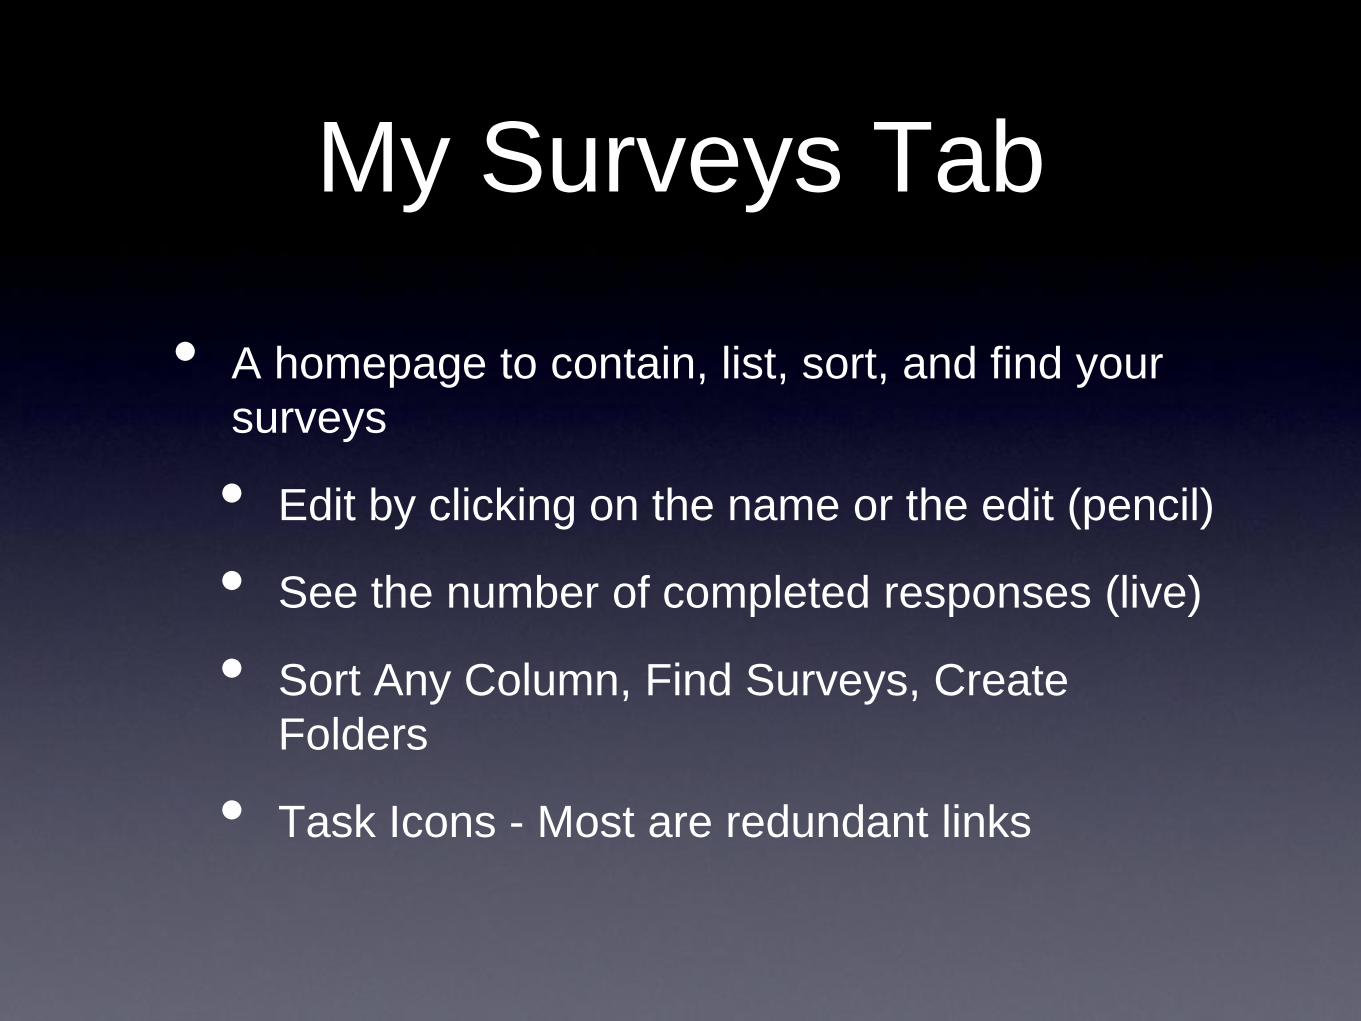
My Surveys Tab
• A homepage to contain, list, sort, and find your
surveys
• Edit by clicking on the name or the edit (pencil)
• See the number of completed responses (live)
• Sort Any Column, Find Surveys, Create
Folders
• Task Icons - Most are redundant links
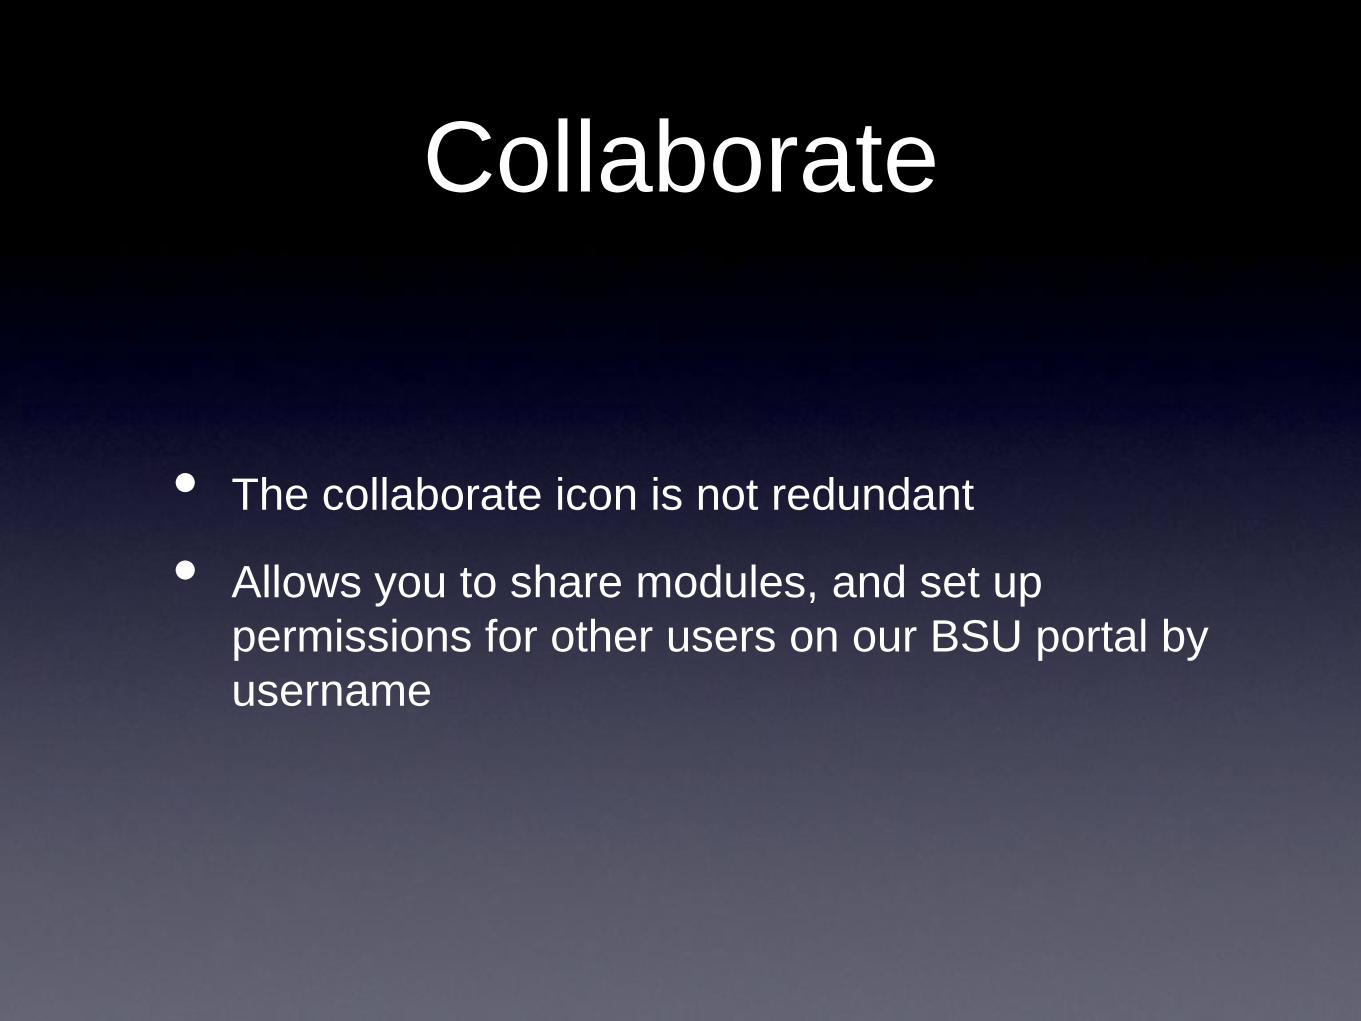
Collaborate
• The collaborate icon is not redundant
• Allows you to share modules, and set up
permissions for other users on our BSU portal by
username
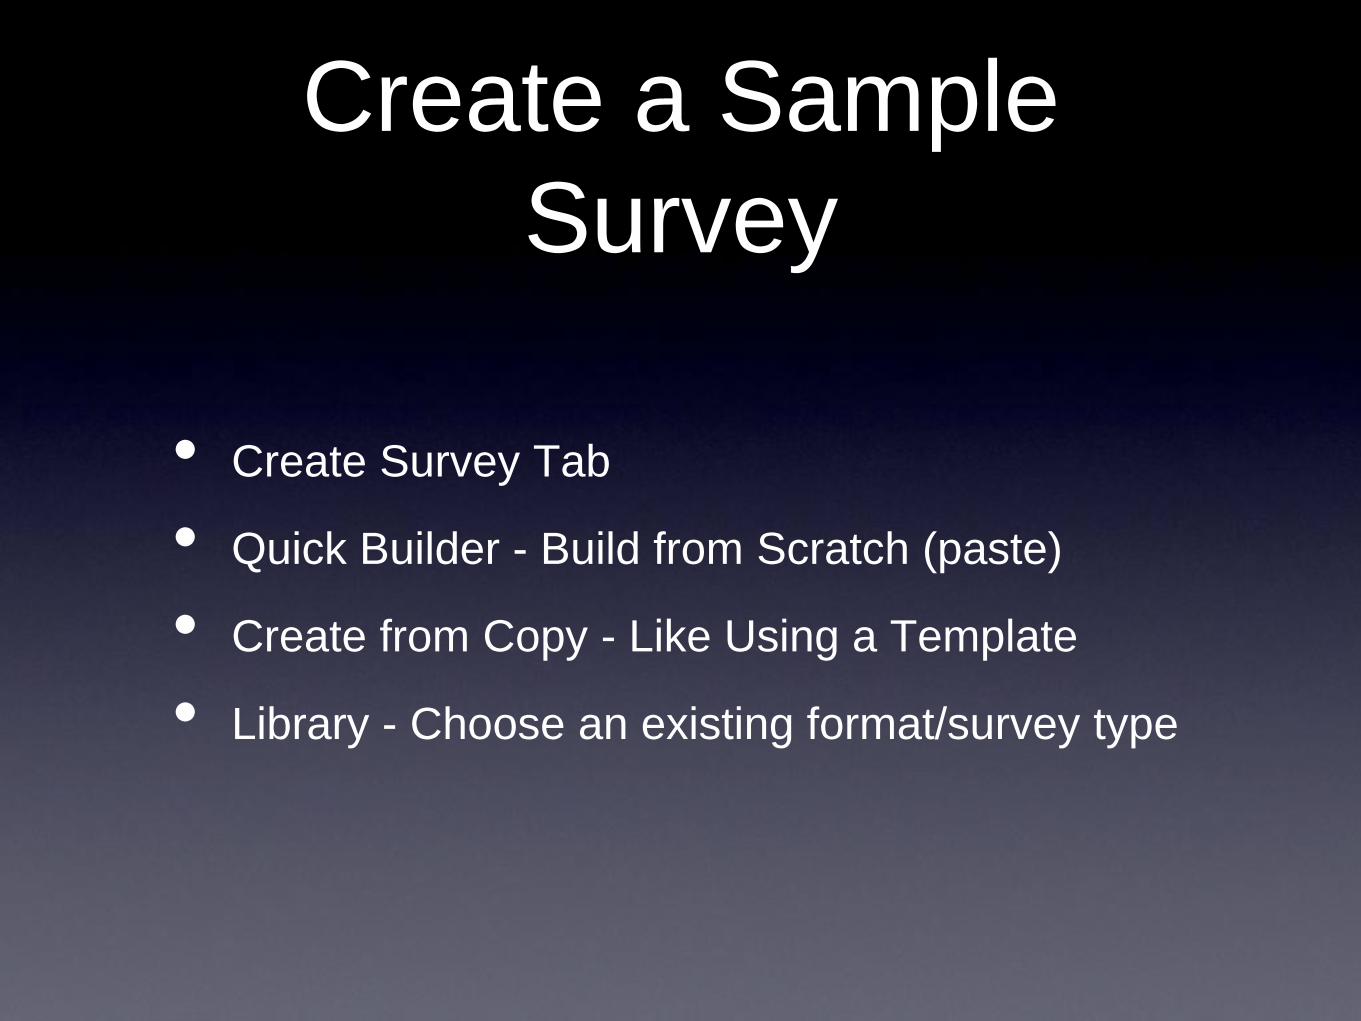
Create a Sample
Survey
• Create Survey Tab
• Quick Builder - Build from Scratch (paste)
• Create from Copy - Like Using a Template
• Library - Choose an existing format/survey type
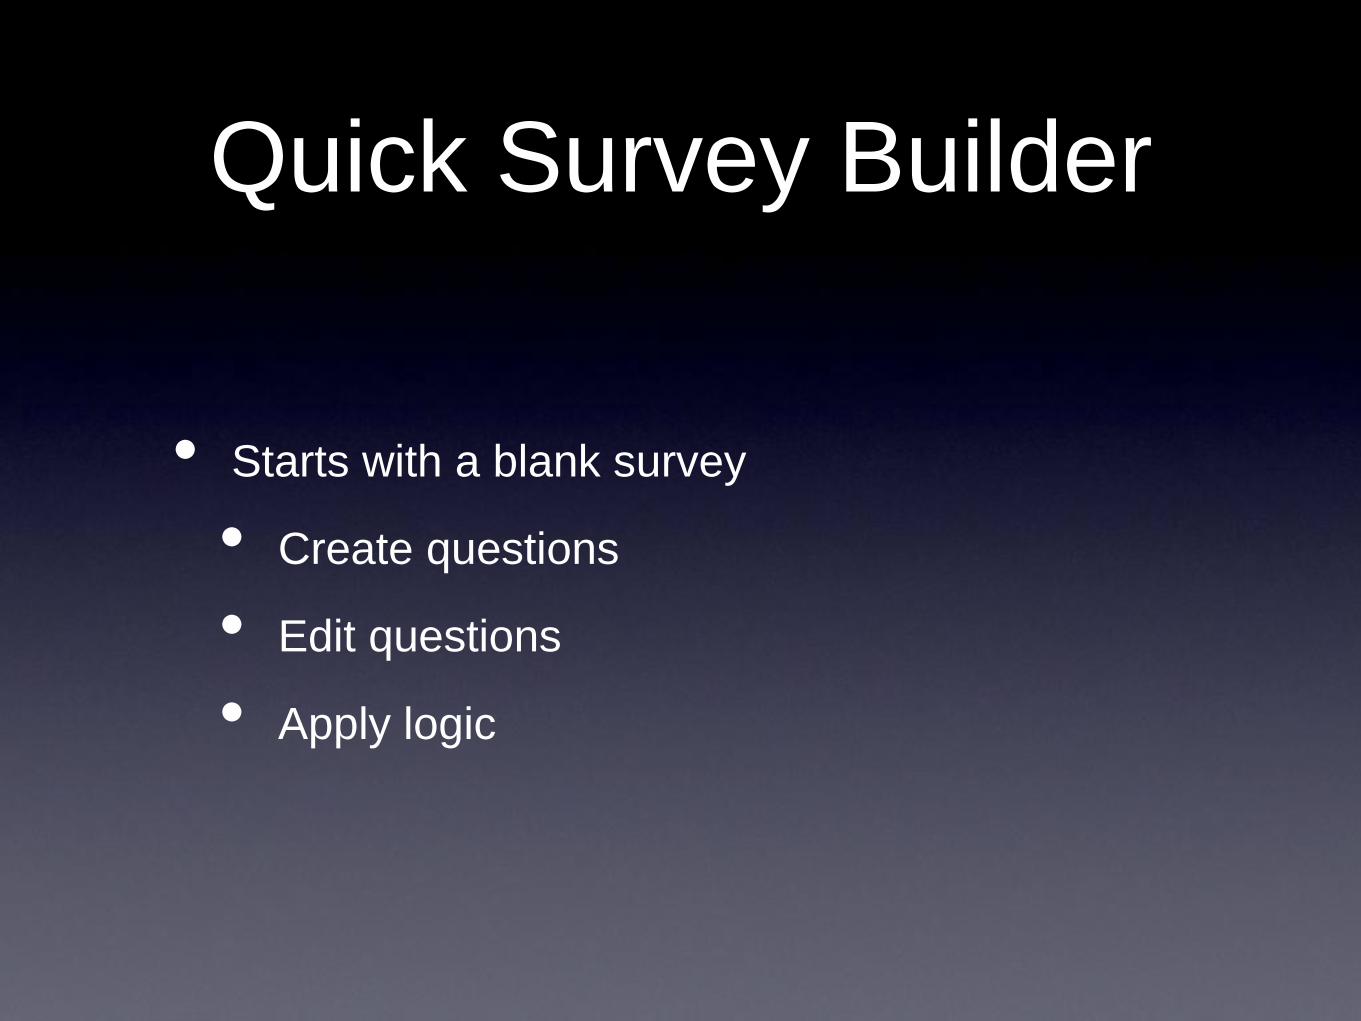
Quick Survey Builder
• Starts with a blank survey
• Create questions
• Edit questions
• Apply logic
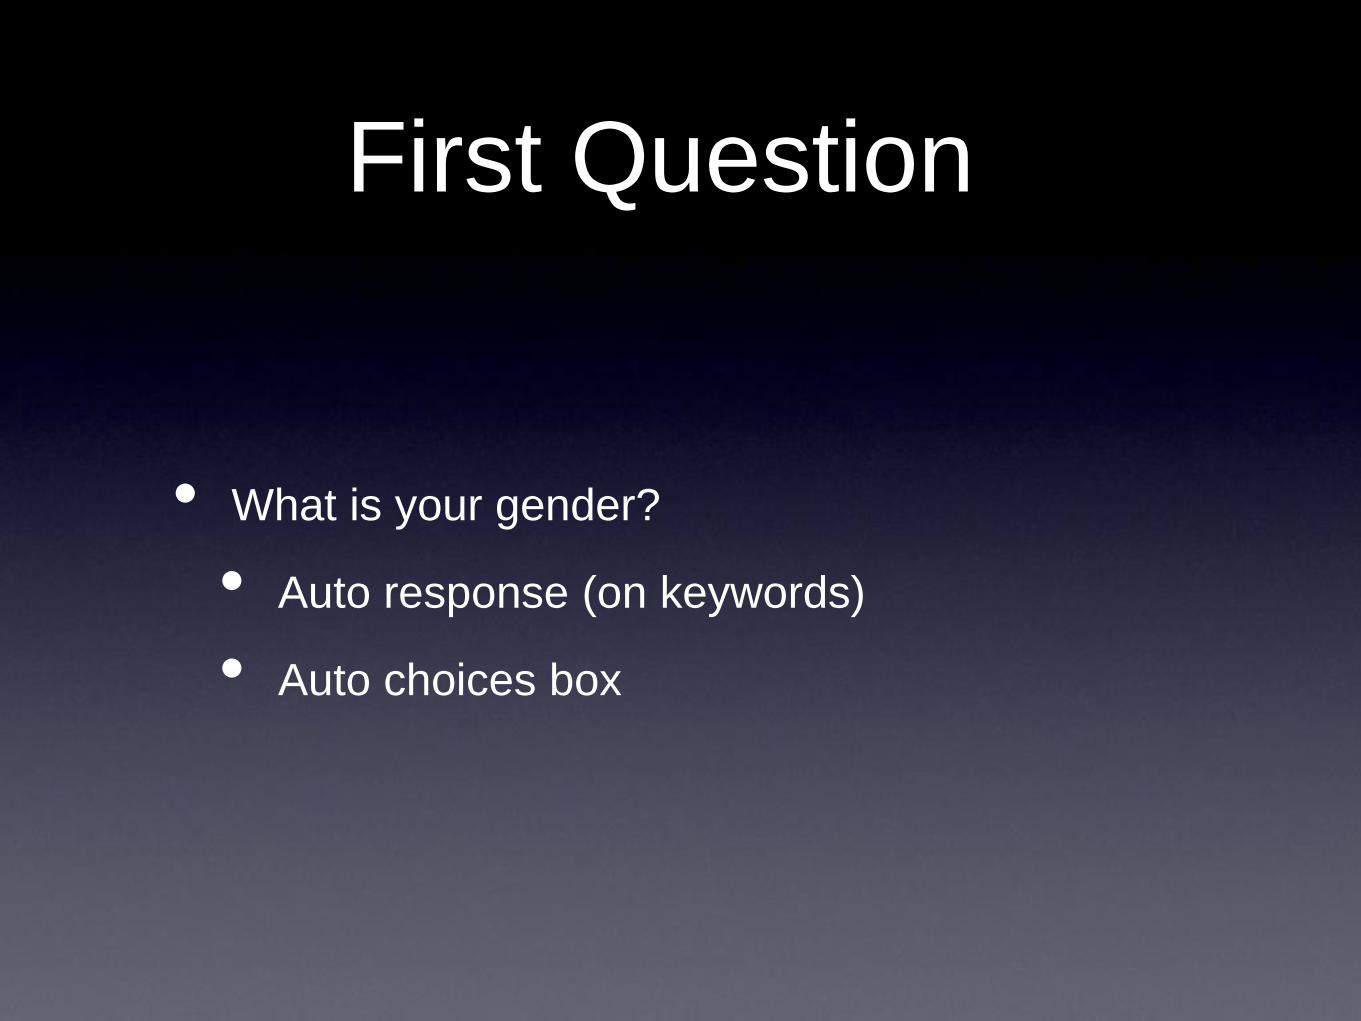
First Question
• What is your gender?
• Auto response (on keywords)
• Auto choices box
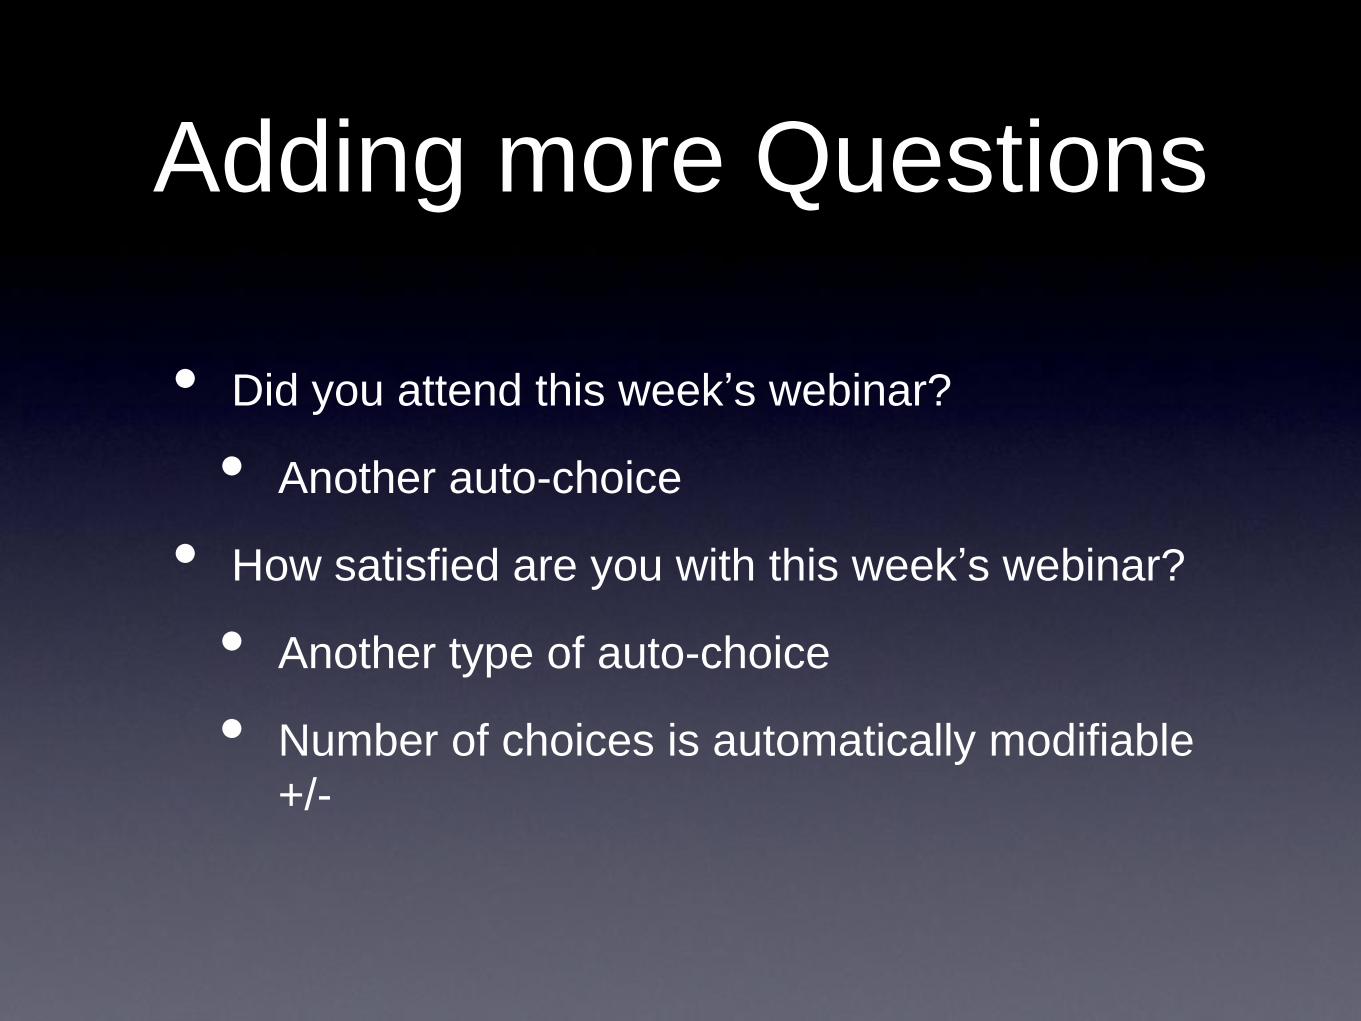
Adding more Questions
• Did you attend this week’s webinar?
• Another auto-choice
• How satisfied are you with this week’s webinar?
• Another type of auto-choice
• Number of choices is automatically modifiable
+/-
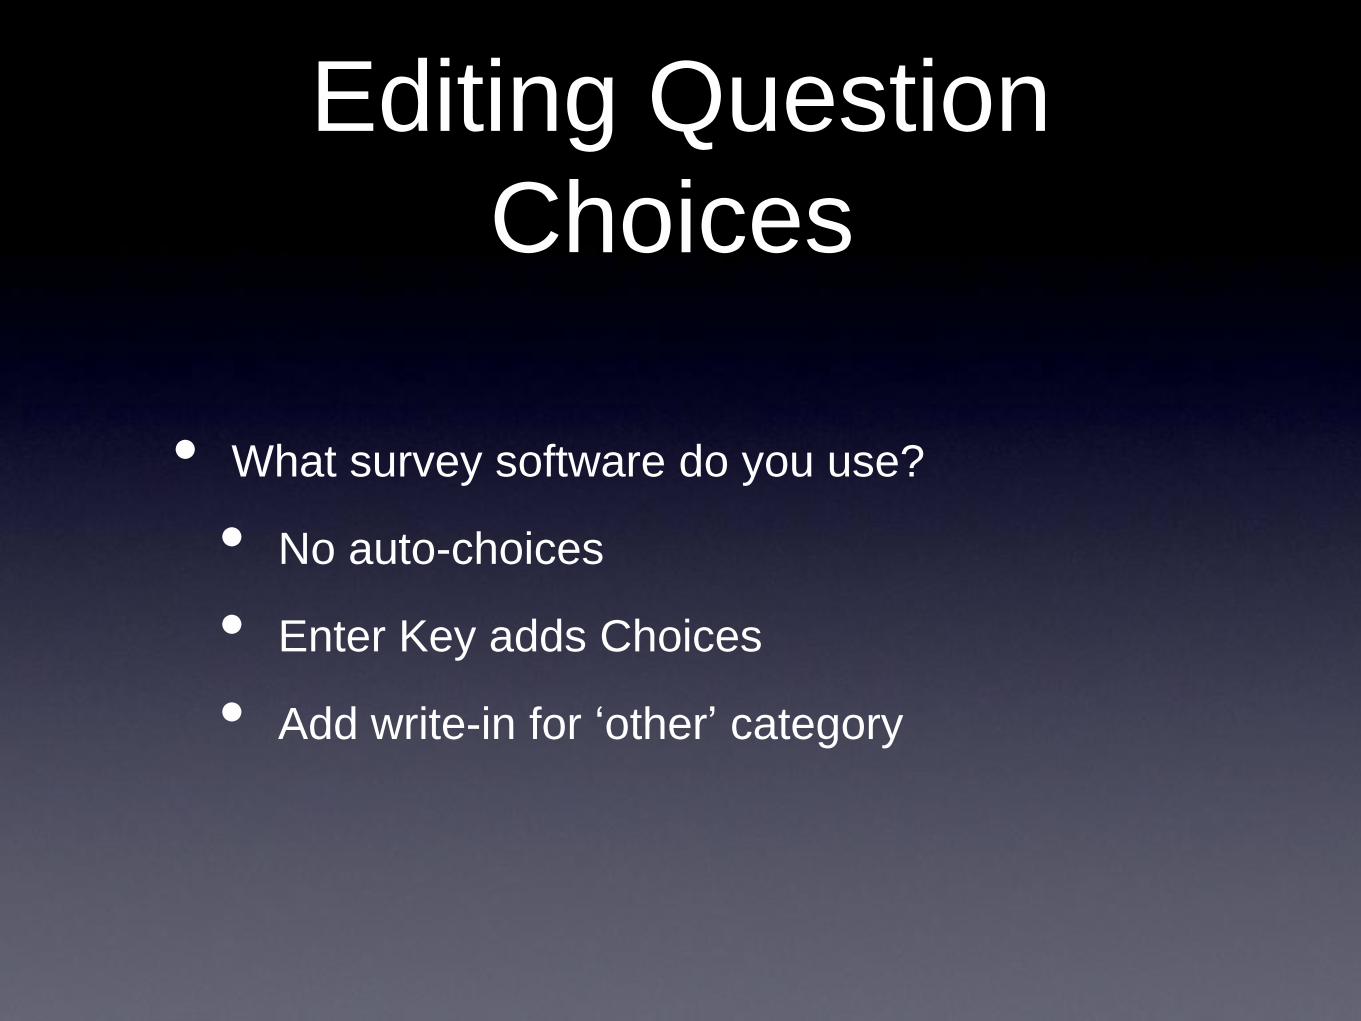
Editing Question
Choices
• What survey software do you use?
• No auto-choices
• Enter Key adds Choices
• Add write-in for ‘other’ category
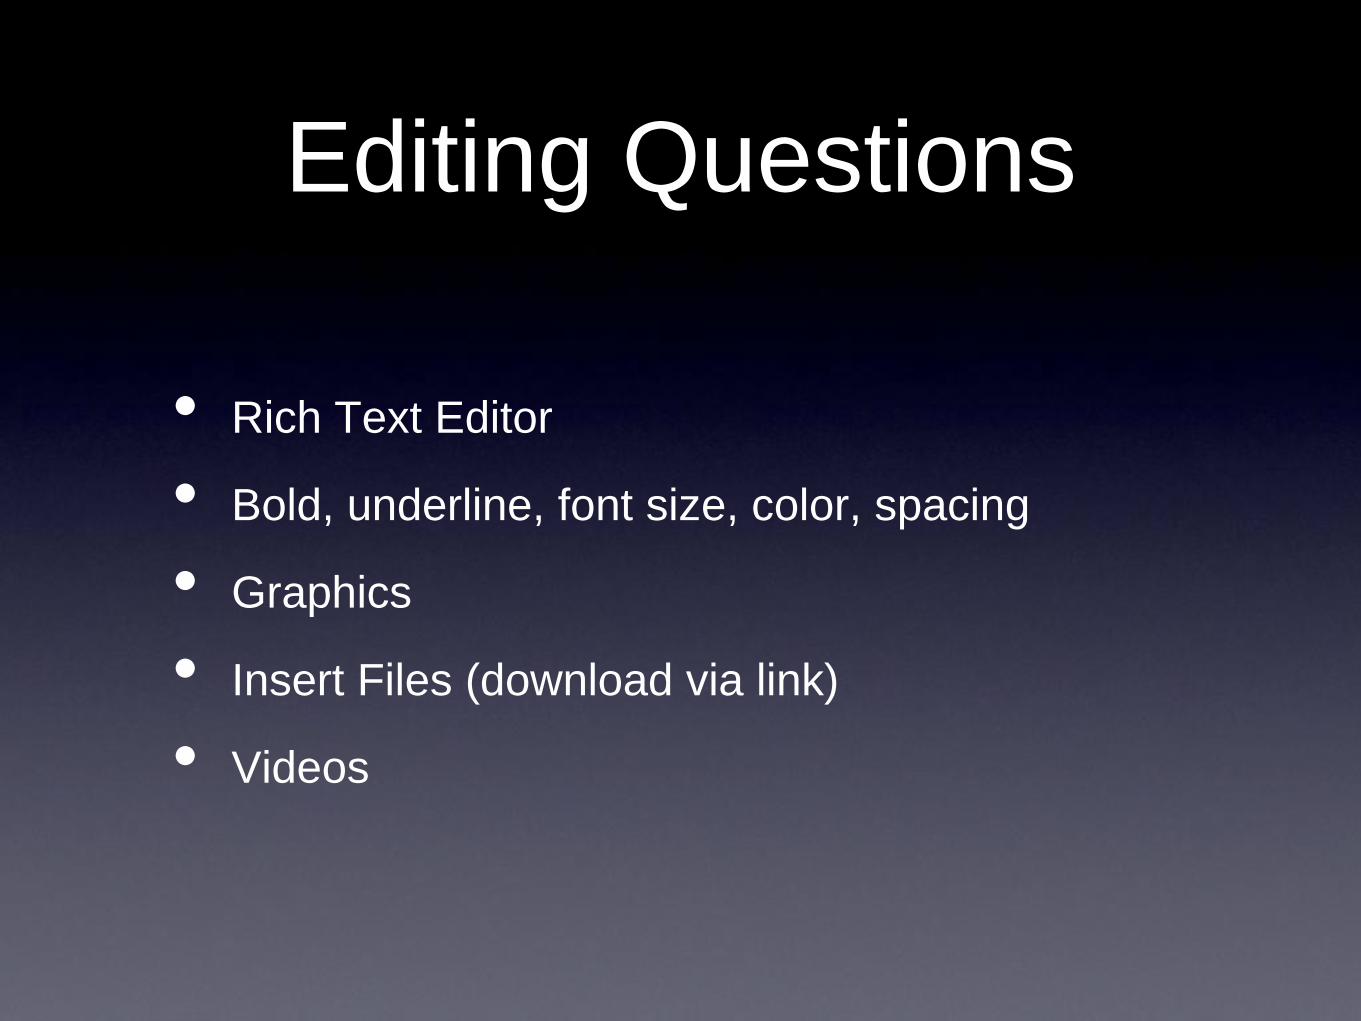
Editing Questions
• Rich Text Editor
• Bold, underline, font size, color, spacing
• Graphics
• Insert Files (download via link)
• Videos
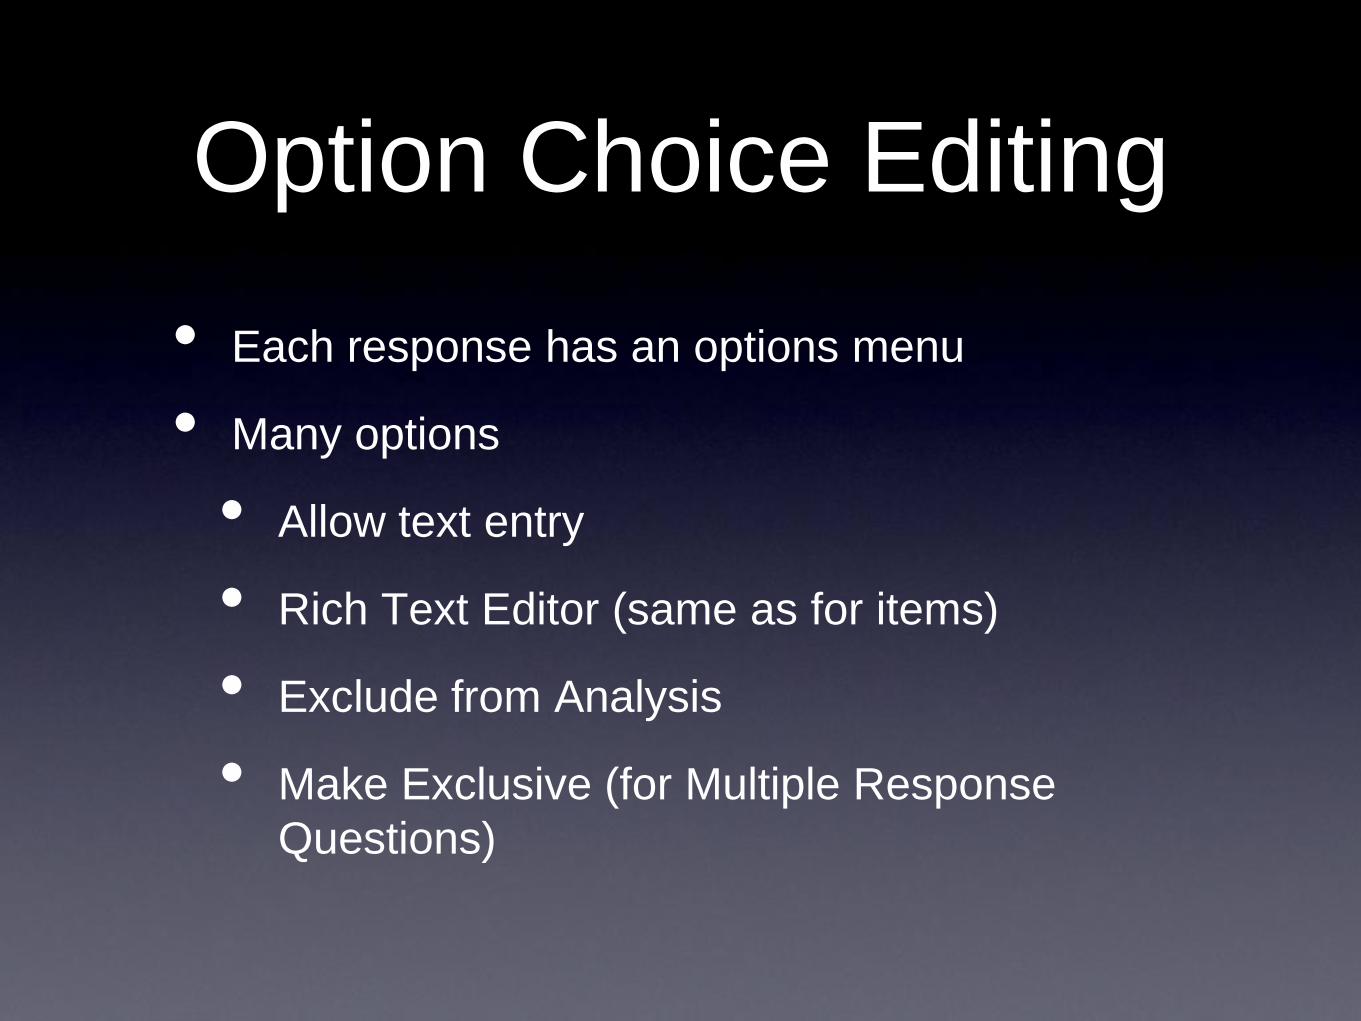
Option Choice Editing
• Each response has an options menu
• Many options
• Allow text entry
• Rich Text Editor (same as for items)
• Exclude from Analysis
• Make Exclusive (for Multiple Response
Questions)
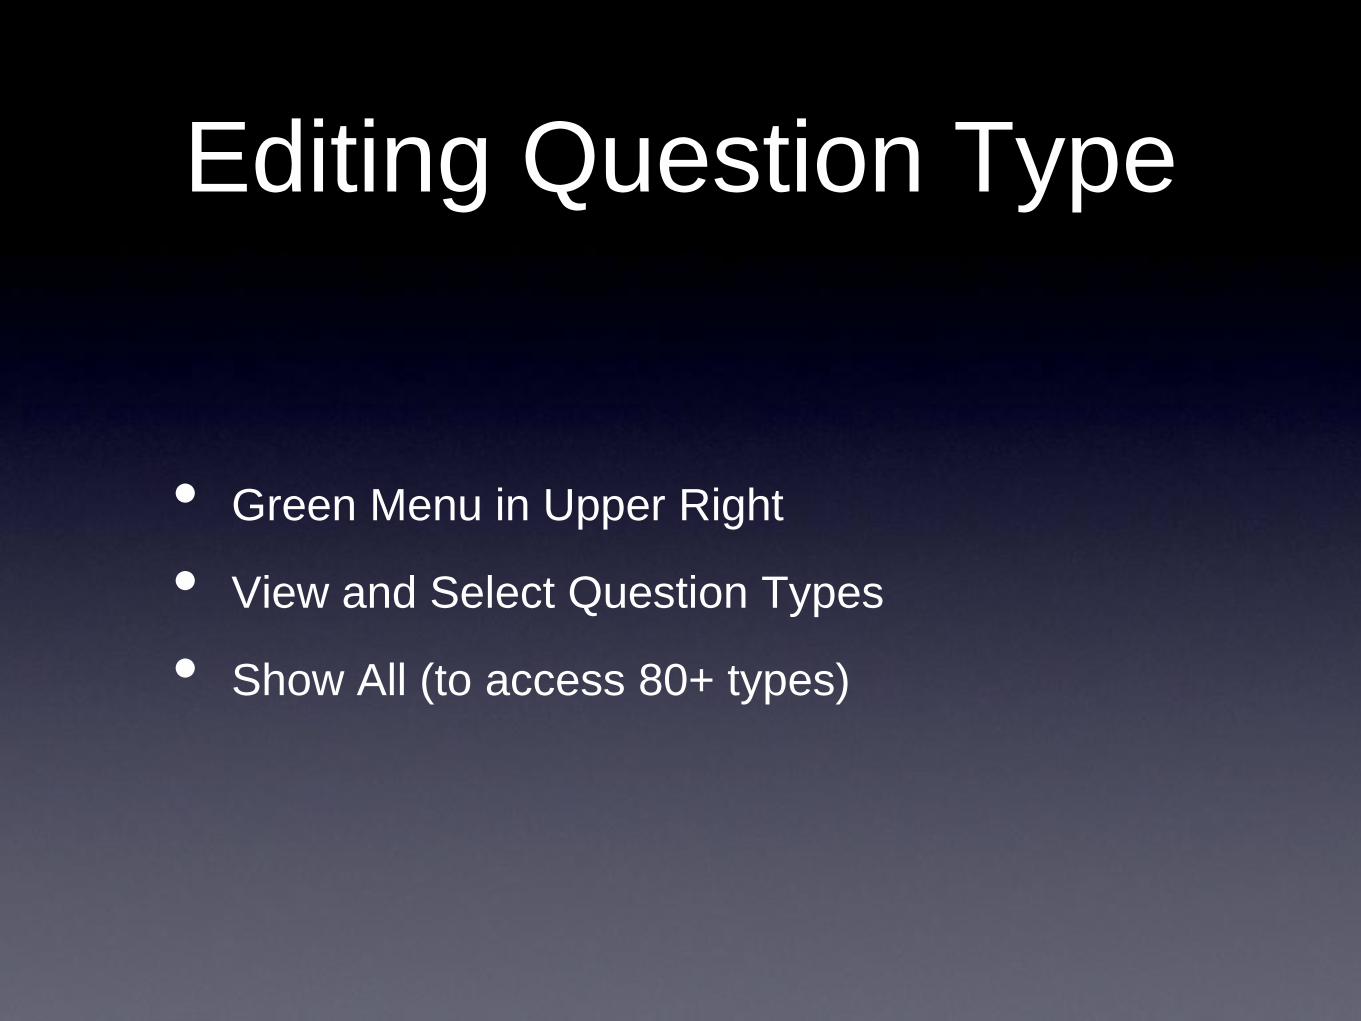
Editing Question Type
• Green Menu in Upper Right
• View and Select Question Types
• Show All (to access 80+ types)
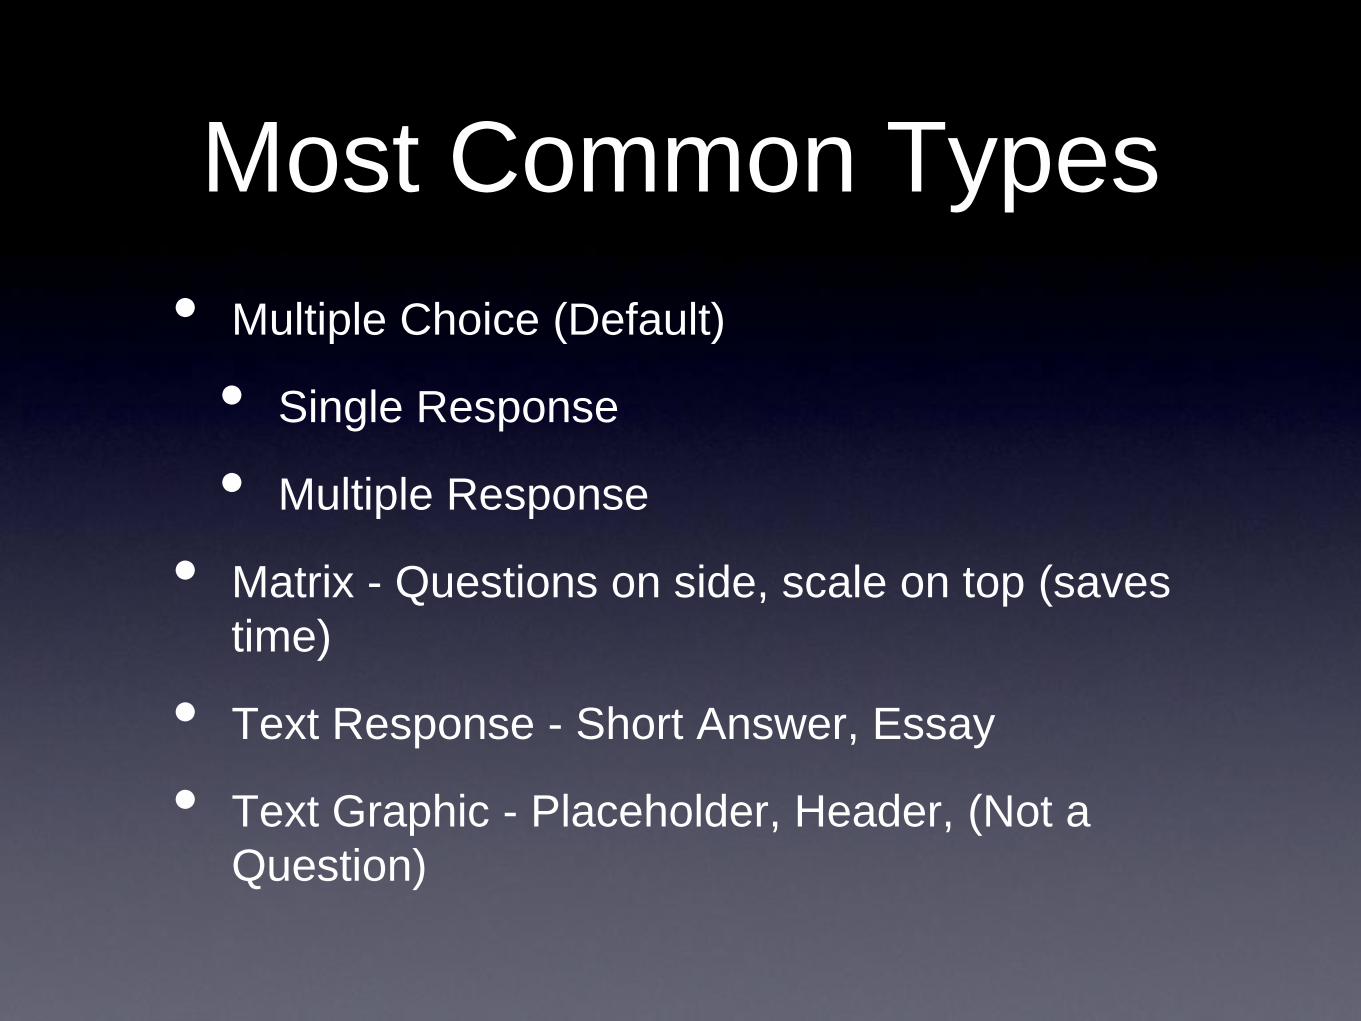
Most Common Types
• Multiple Choice (Default)
• Single Response
• Multiple Response
• Matrix - Questions on side, scale on top (saves
time)
• Text Response - Short Answer, Essay
• Text Graphic - Placeholder, Header, (Not a
Question)
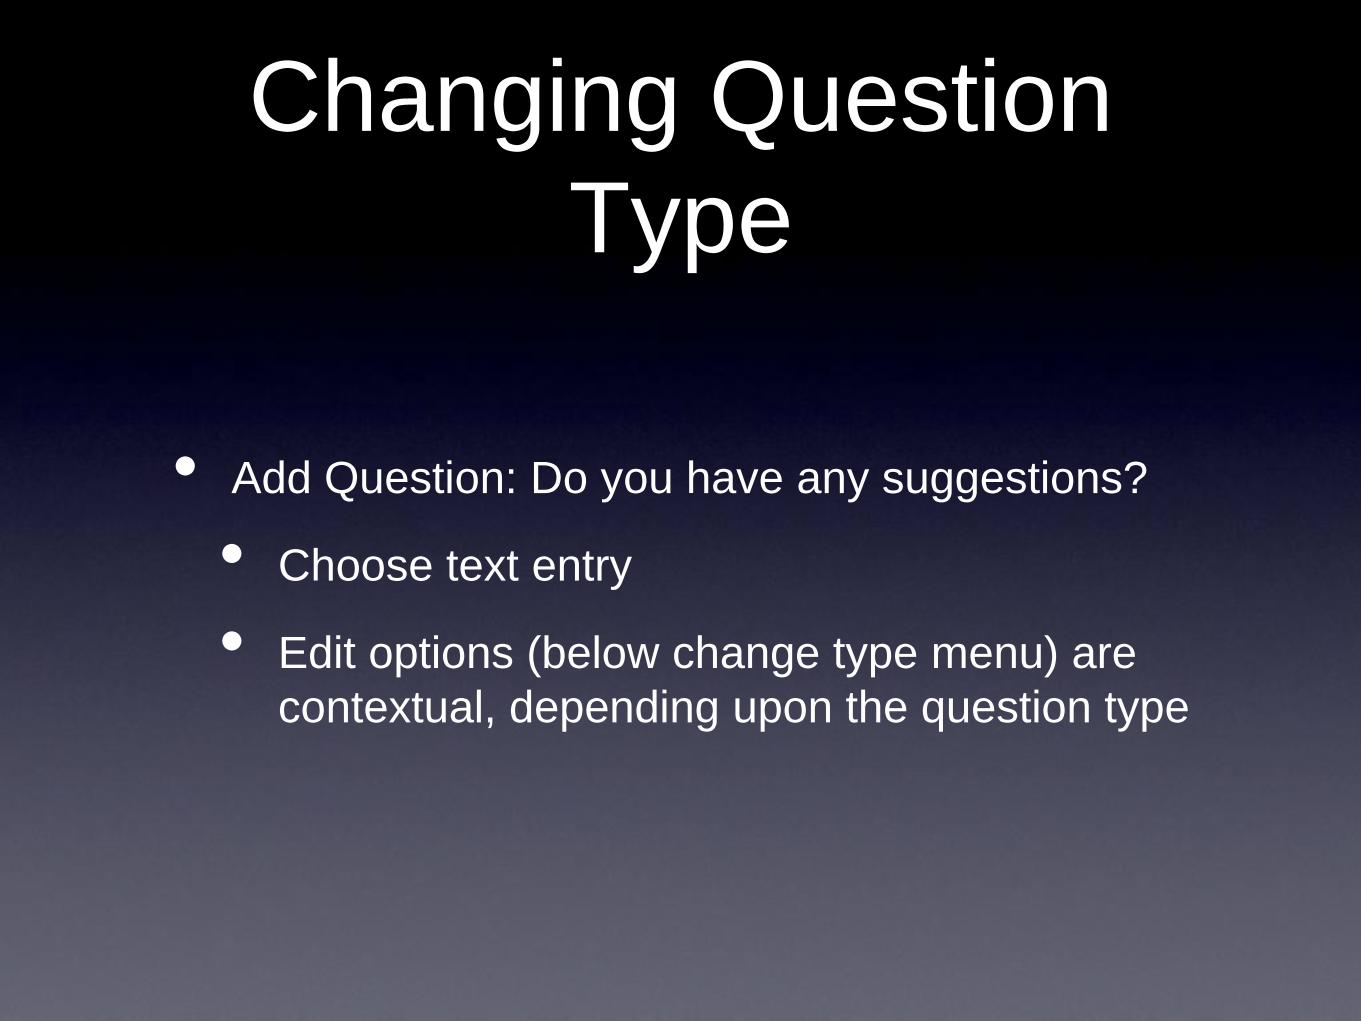
Changing Question
Type
• Add Question: Do you have any suggestions?
• Choose text entry
• Edit options (below change type menu) are
contextual, depending upon the question type
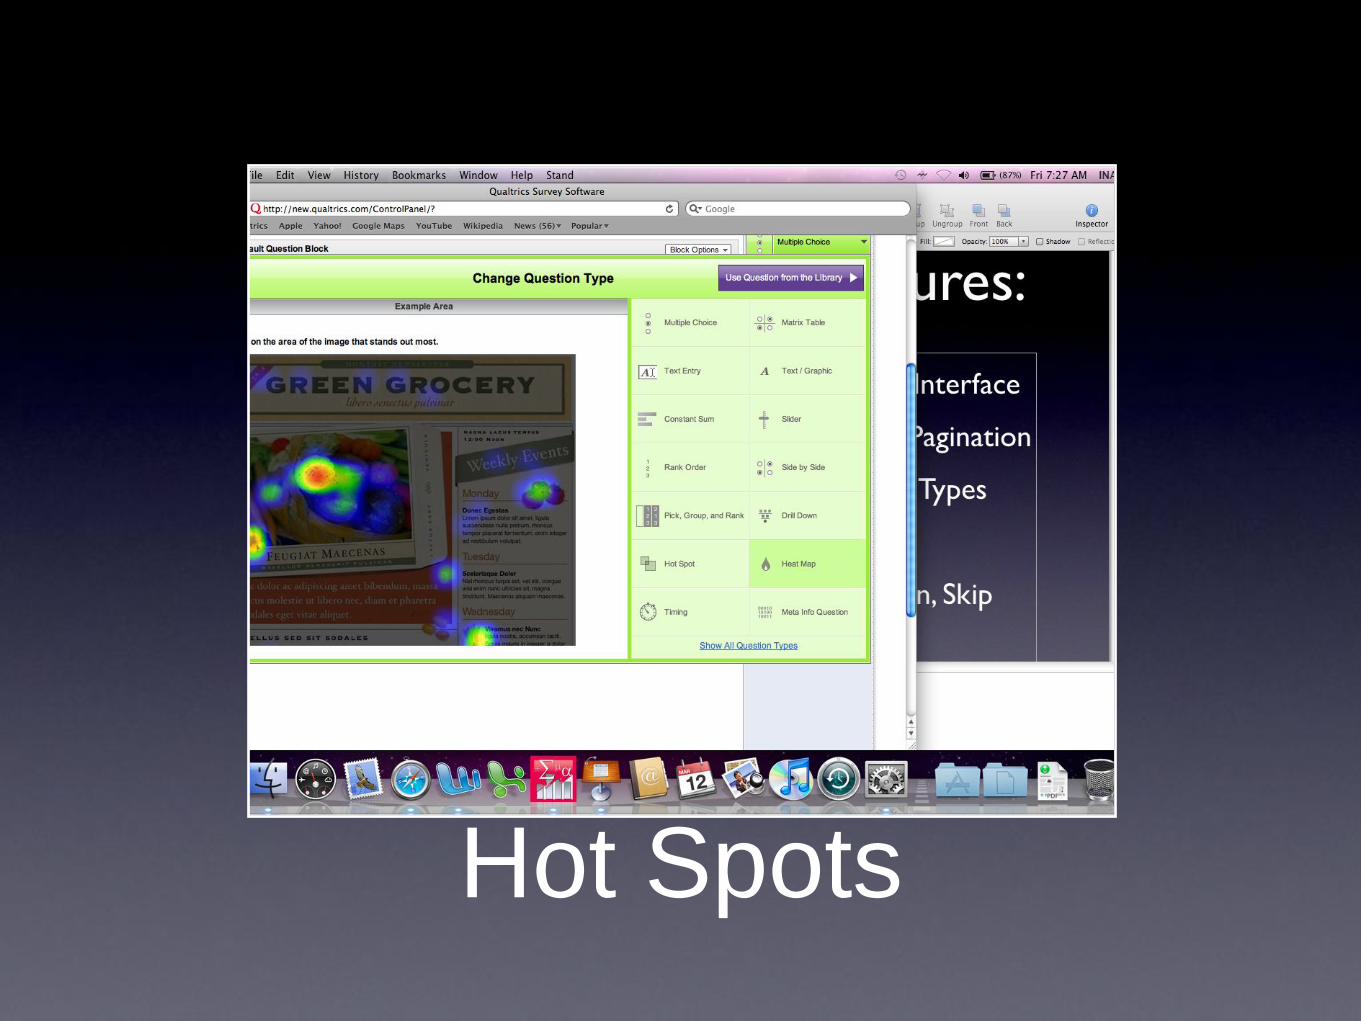
Hot Spots
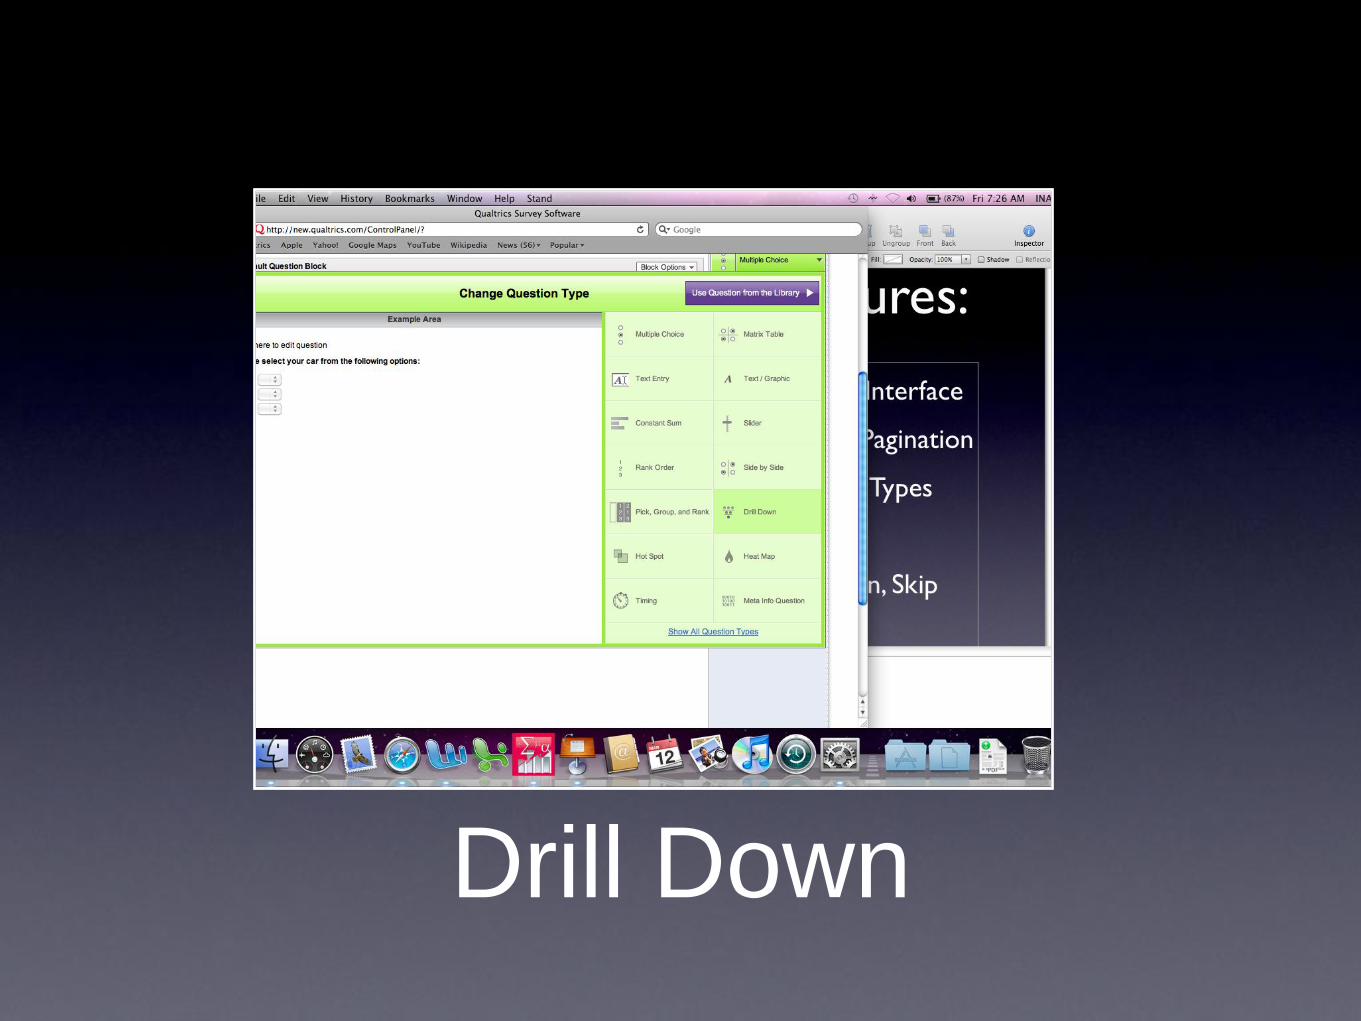
Drill Down
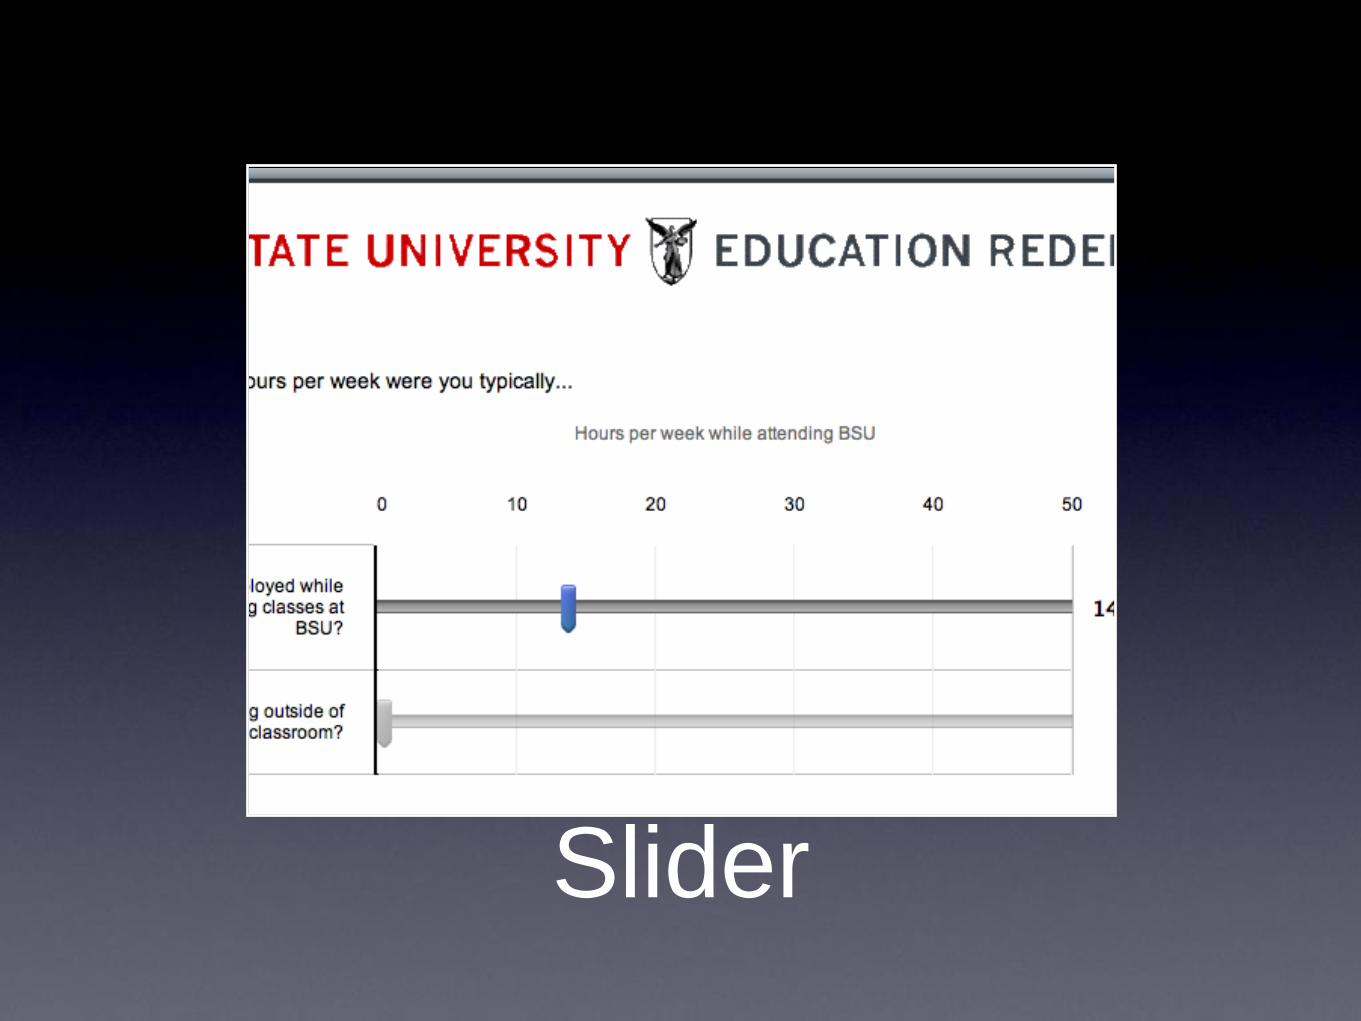
Slider
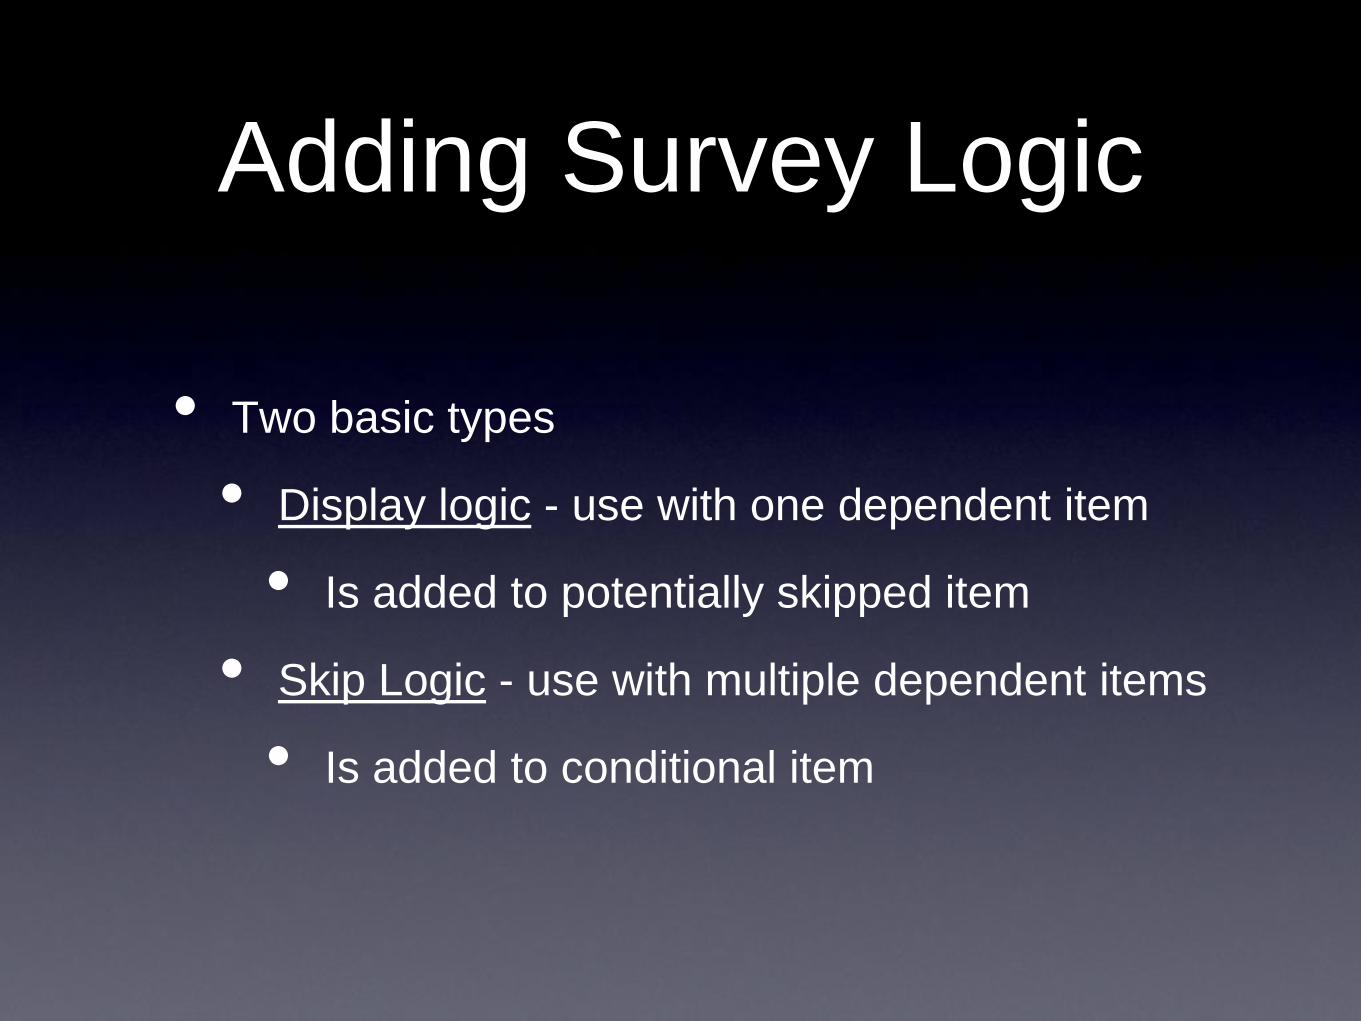
Adding Survey Logic
• Two basic types
• Display logic - use with one dependent item
• Is added to potentially skipped item
• Skip Logic - use with multiple dependent items
• Is added to conditional item
Setting Display Logic
• Click on item to be filtered/targeted/skipped
• Click Add Display Logic (on right or left)
• Set conditions
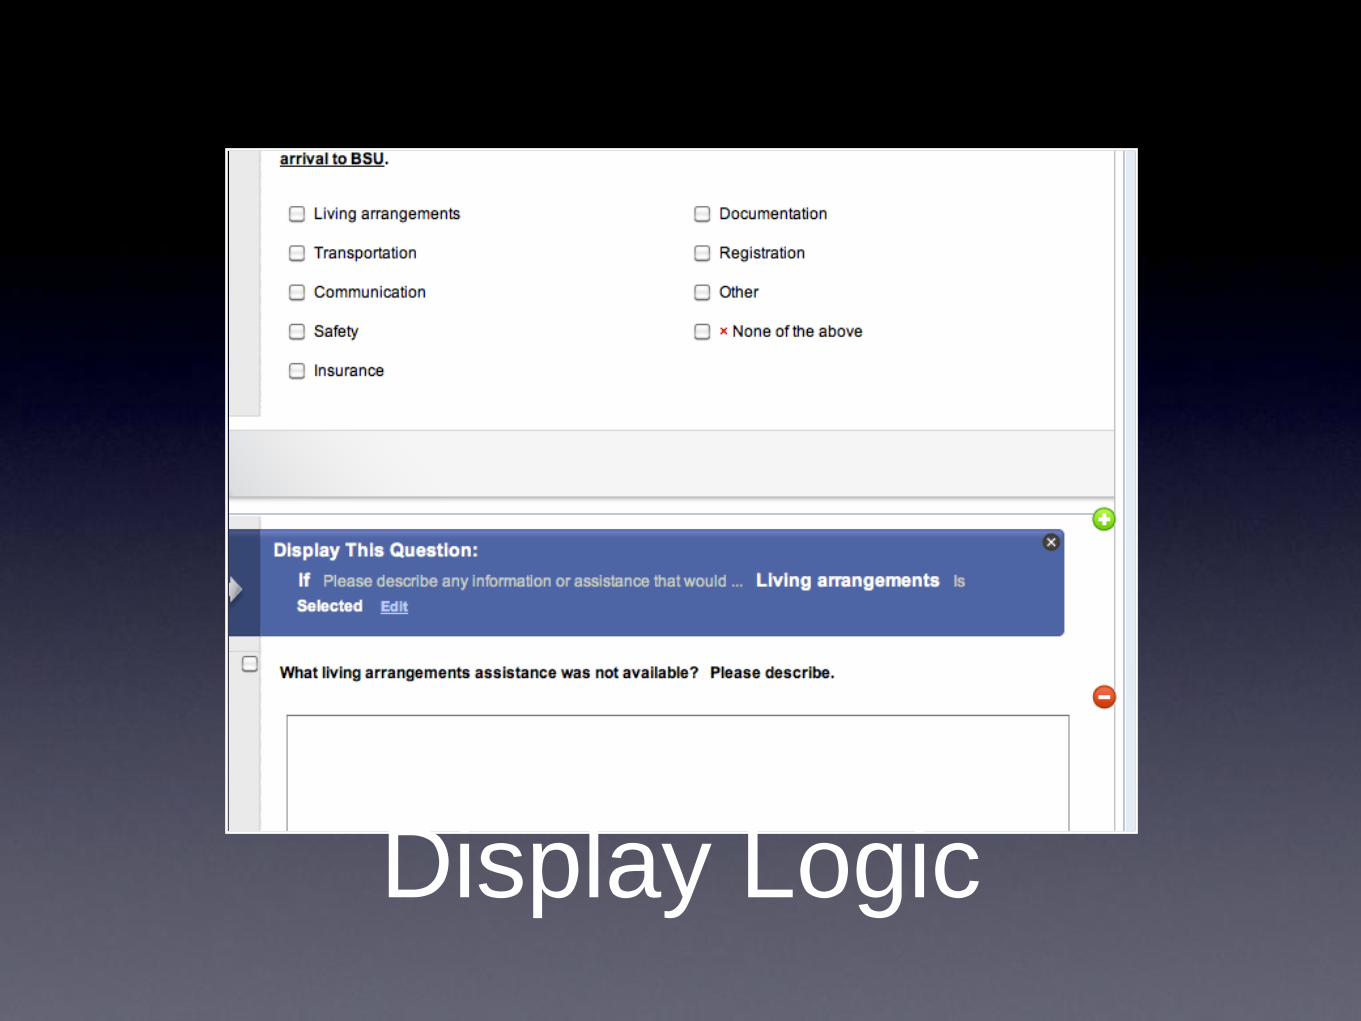
Display Logic
Adding Skip Logic
• Add ‘Who was your trainer?’ (two items to skip)
• Move ‘suggestions’ question to follow above item
• Add skip logic on conditional item
• Similar to display logic but setting where to
skip
• Skip to ‘what survey software do you use?”
• Also could skip to end of survey or end of block
• Shown graphically in editor (not to respondent)
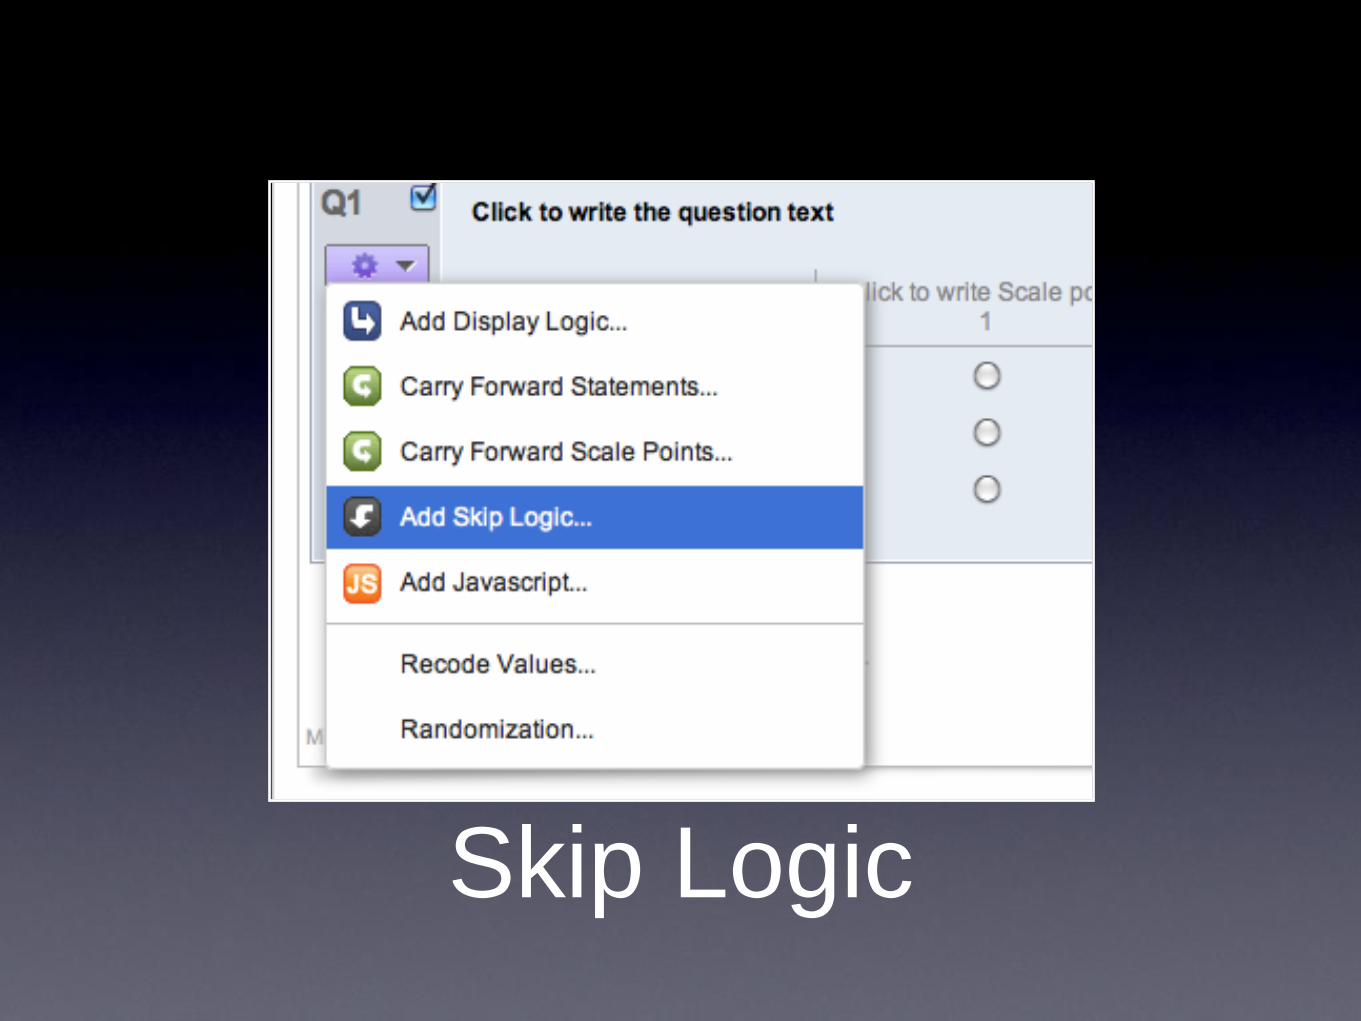
Skip Logic
The Look and Feel
• Personalizes the Aesthetics of the Survey
• Themes, aka ‘skins’ are accessed
• Fonts
• Colors
• Header Footer Graphics
• Straightforward
Survey Options
• Permissions for Respondents to Access the
Survey
• Progress bar, default pagination, header/footers
• Three important Options:
• Back Button
• Survey Expiration
• How Partial Responses are Treated
• Check before Sending Survey!
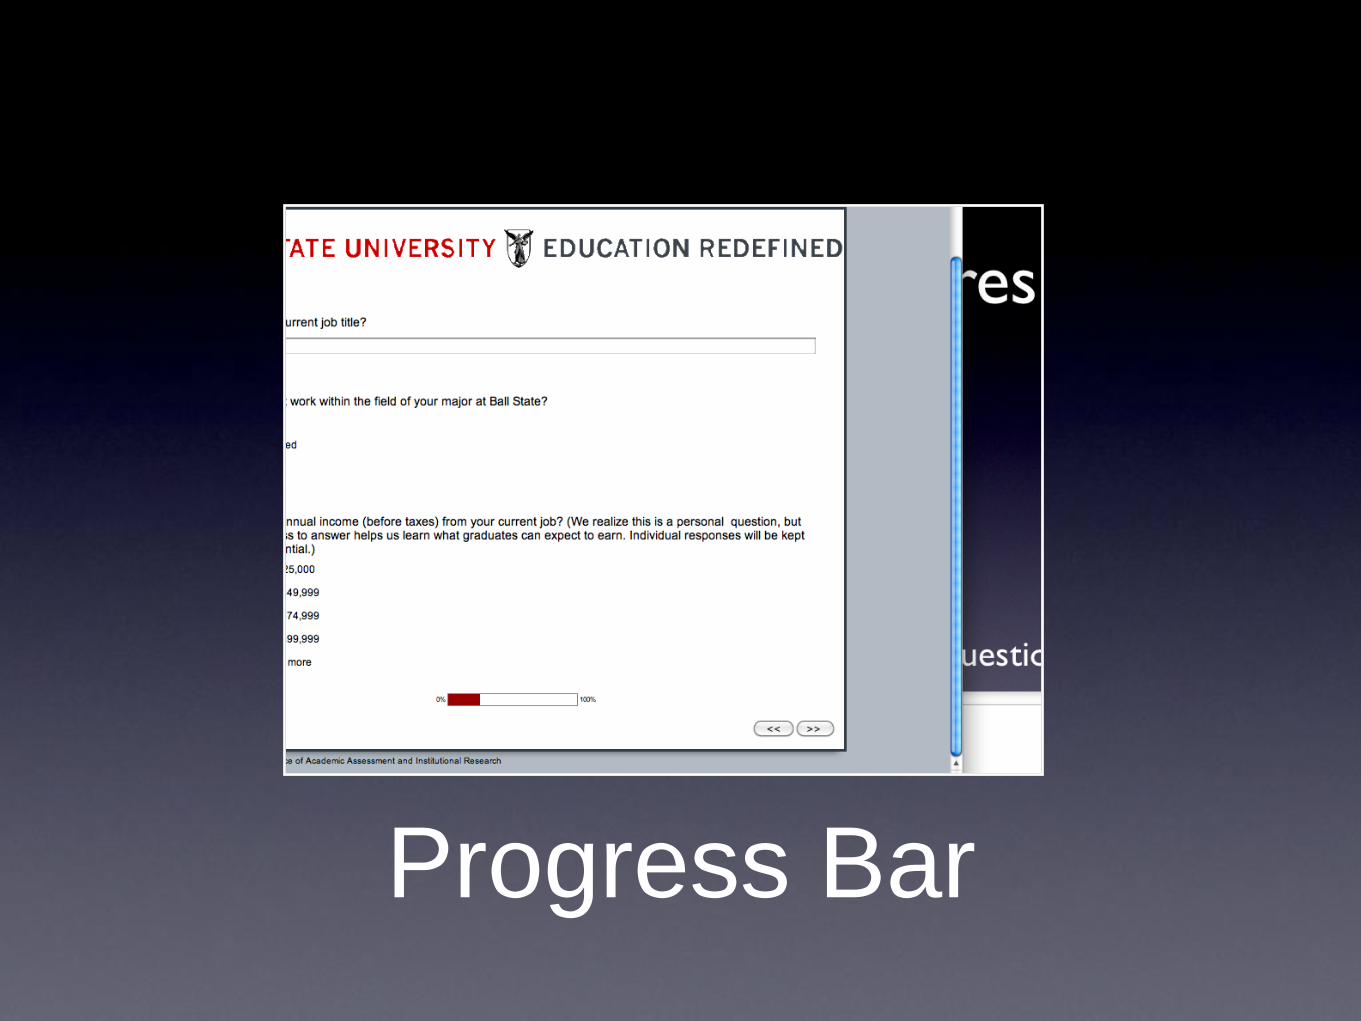
Progress Bar
Distribute Survey Tab • Activate the Survey
• Two Main Distribution Options:
• Anonymous Survey Link - Paste into any email
or Web page
• Email Distribution Option - More control
• Unique link for each respondent in Panel
• Allows specific message to be sent based
on response
Panels Tab
• First step in using email distribution is to create a
panel
• Give each panel a descriptive name
• Manual (for very small panels)
• From .CSV file (normal method)
• From Survey (advanced, use for follow-up)
Open a Panel
• Fieldnames are at the top
• First Name, Last Name, Primary Email,
Language
• Embedded Data - used to add data to
response, filter items, etc. (powerful)
• e.g. Major - any variables can be added to
analysis (MUST be added to survey flow)
Back to Distribute Tab
• To Field
• Set Options for distribution
• Schedule Mailing
• Do not remove link code!
• Save Message to Message Library (with name)
• Send Test Email (bottom left)
• Email History Summary for each survey project
View Results Tab
• Reports are created and hosted here
• Default Report shows all survey items
• View Response (to delete test cases, check a
case)
• Download Data (in .CSV, SPSS, XML formats)
• Run Crosstabulations
Editing Reports
• Defaults for each item:
• Frequency and Percentage Distribution
• Descriptive Statistics Table
• Organize and Navigate from Left Panel (outline
view)
• Table Options (sort, decimals, show/hide, Export)
• Delete Entire Tables by clicking ‘X’ in upper right
• Add Graph Type (Link to right of items)
Graph Options Menu
• Graph Example
• Similar to table options menu
• 2D and 3D options
• Creates an Image (Flash option has advantages
for dynamic reports)
Subgroups and Filters
• View Reports allows you to see subgroups
• Add subgroups and set conditions to show only
that subgroup
• Also works by clicking on any category in
report
Drill Down Reports
• Show Multiple Subgroups without crosstabulation
statistics or Ns.
• Similar to Split File option in SPSS
• Simple Multiple Response Breakdowns with
Appropriate Percentaging
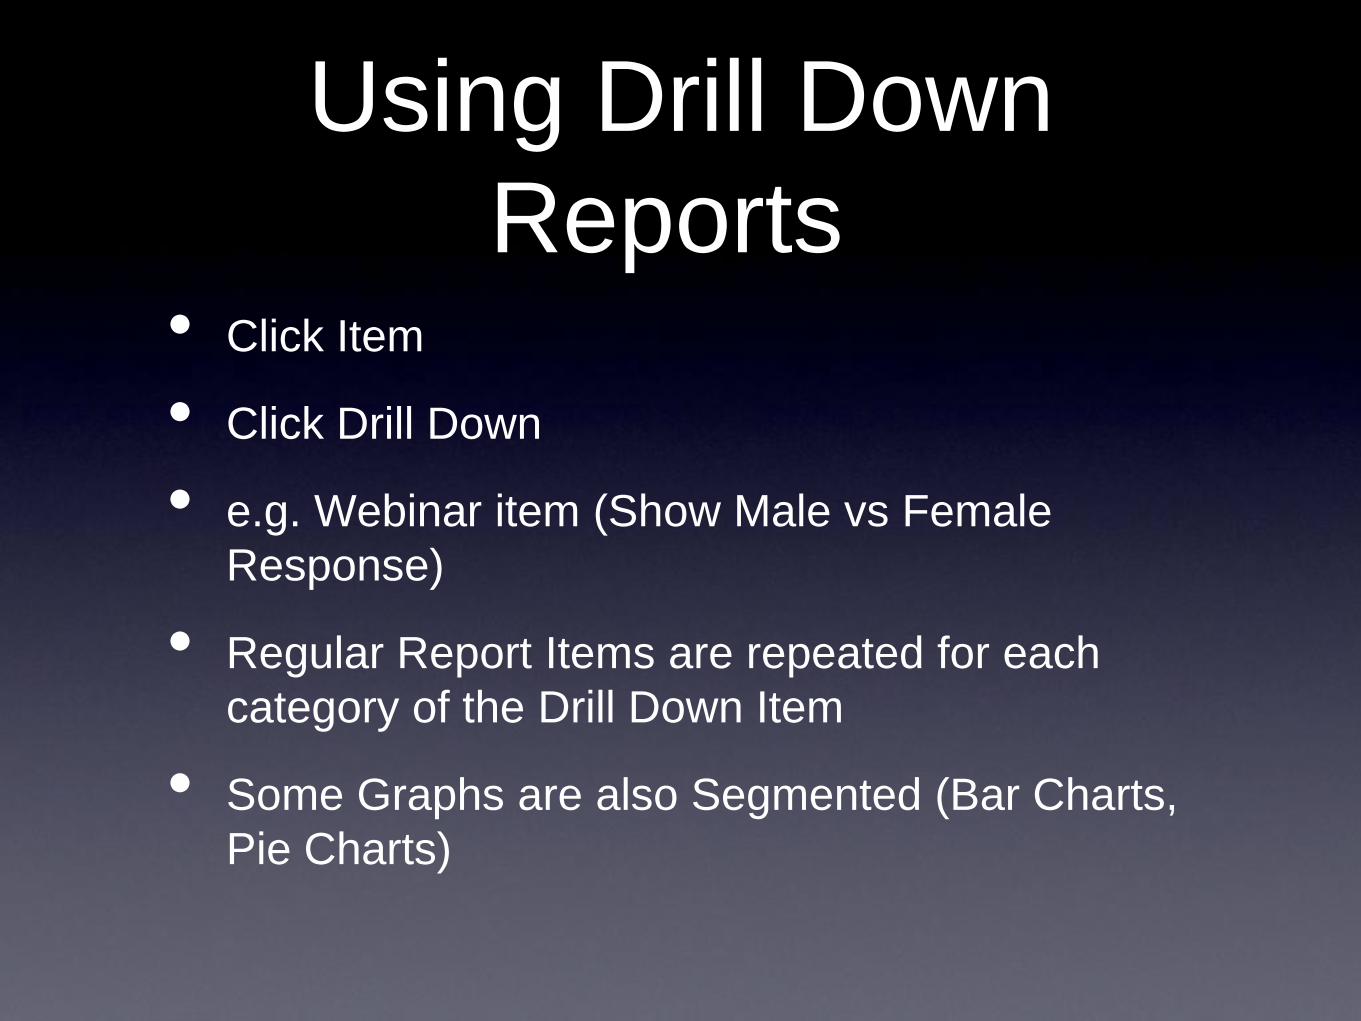
Using Drill Down
Reports • Click Item
• Click Drill Down
• e.g. Webinar item (Show Male vs Female
Response)
• Regular Report Items are repeated for each
category of the Drill Down Item
• Some Graphs are also Segmented (Bar Charts,
Pie Charts)
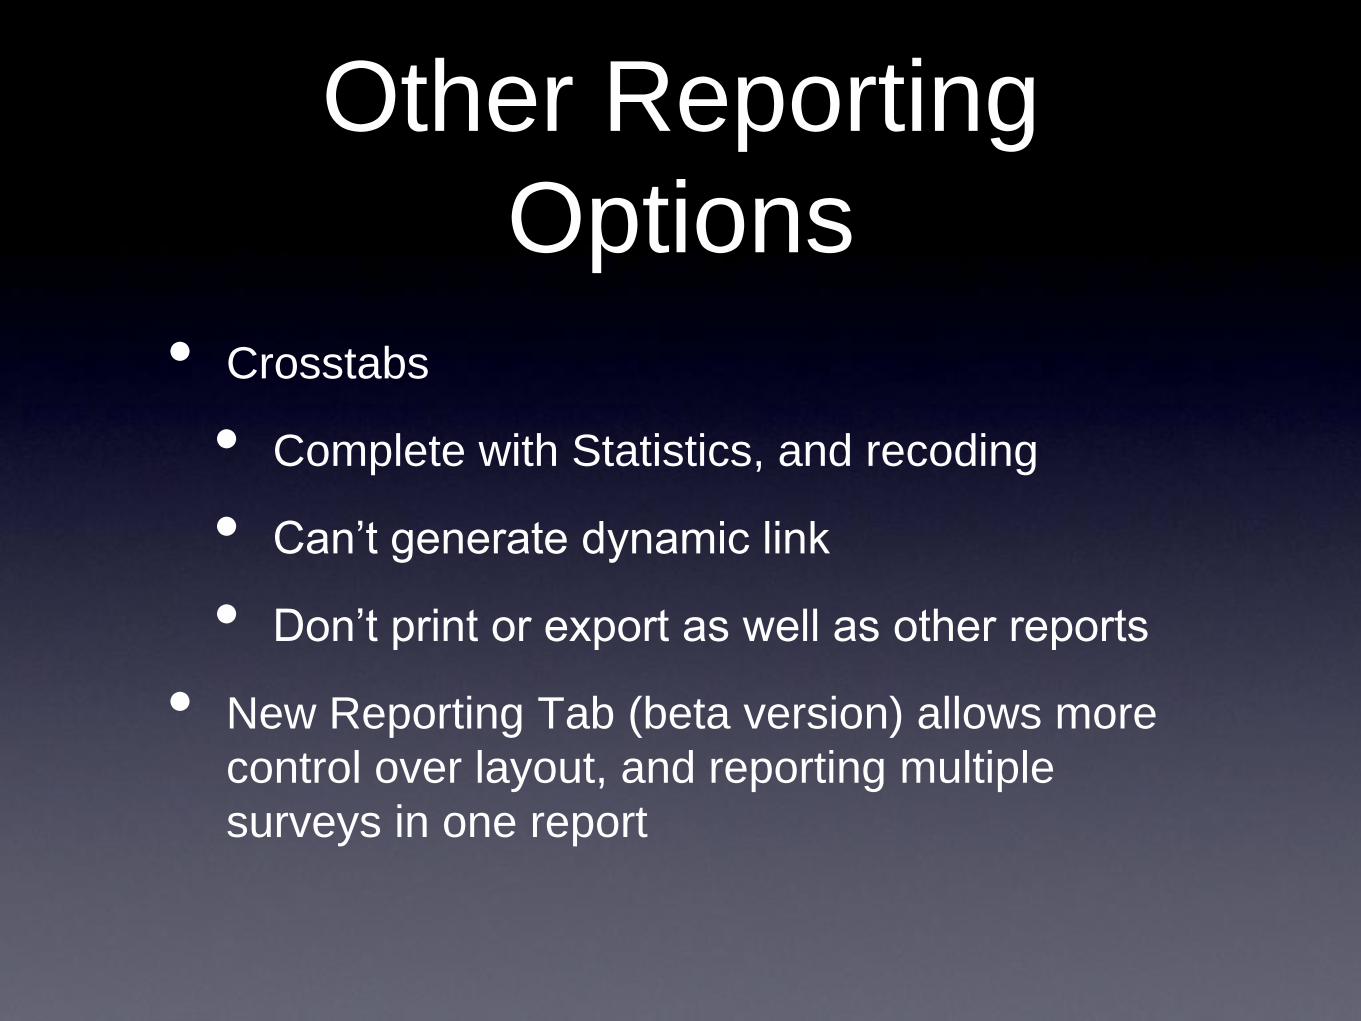
Other Reporting
Options
• Crosstabs
• Complete with Statistics, and recoding
• Can’t generate dynamic link
• Don’t print or export as well as other reports
• New Reporting Tab (beta version) allows more
control over layout, and reporting multiple
surveys in one report
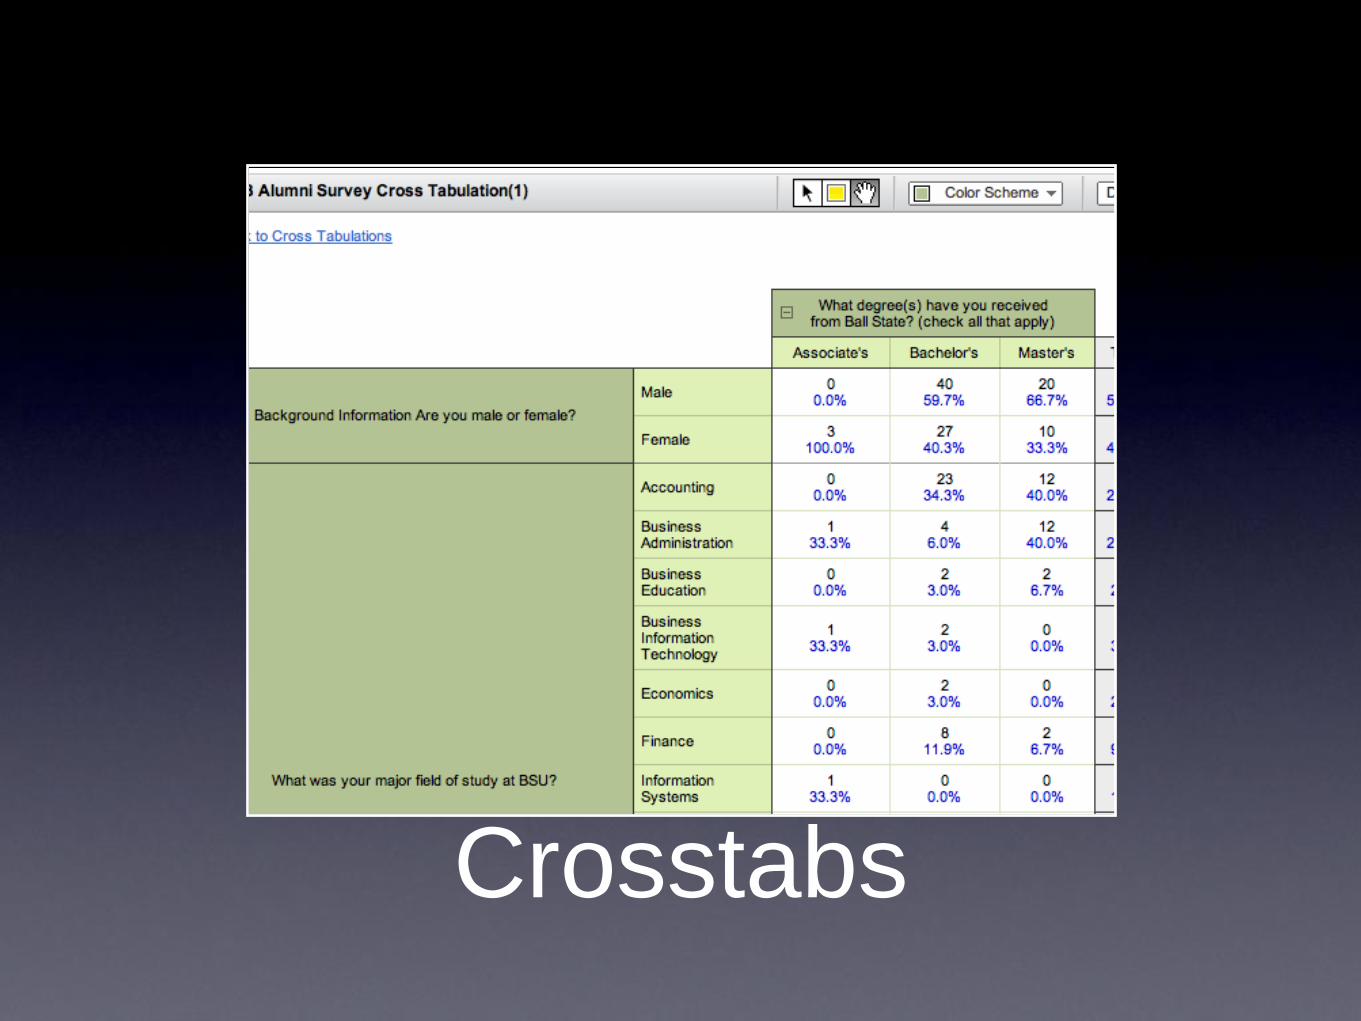
Crosstabs
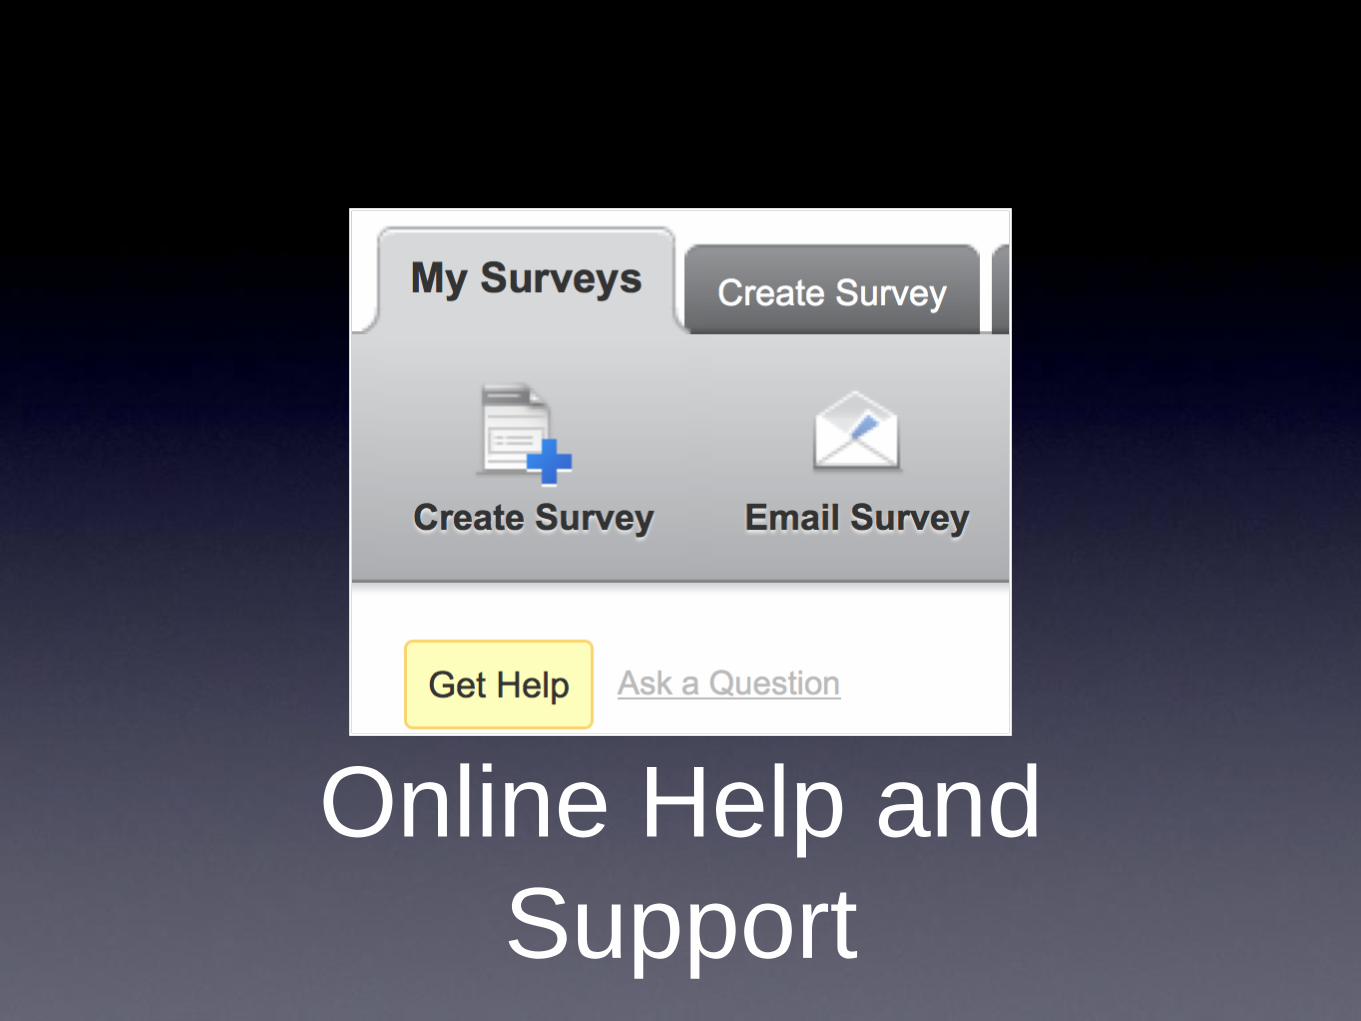
Online Help and
Support
Next Steps
• OIE will be providing basic and advanced training
later this semester
• Our office will consult and collaborate with survey
authors, will construct panel files, and will
continue to consult on survey projects
• See www.qualtrics.com/university for more
training, including a five step program with a test,
topic based videos and summaries, “Quick
Helps,” and more
Recommended