Portland State University Portland State University
PDXScholar PDXScholar
Dissertations and Theses Dissertations and Theses
1990
A comparison of the phonological skills of late A comparison of the phonological skills of late
talking and normal toddlers talking and normal toddlers
Patricia Joan Jennings Portland State University
Follow this and additional works at: https://pdxscholar.library.pdx.edu/open_access_etds
Part of the Communication Commons, and the Phonetics and Phonology Commons
Let us know how access to this document benefits you.
Recommended Citation Recommended Citation Jennings, Patricia Joan, "A comparison of the phonological skills of late talking and normal toddlers" (1990). Dissertations and Theses. Paper 4082. https://doi.org/10.15760/etd.5966
This Thesis is brought to you for free and open access. It has been accepted for inclusion in Dissertations and Theses by an authorized administrator of PDXScholar. Please contact us if we can make this document more accessible: [email protected].
AN ABSTRACT OF THE THESIS OF Patricia Joan Jennings for
the Master of Science in Speech Communication presented
April 4, 1990.
Title: A Comparison of the Phonological Skills of Late
Talking and Normal Toddlers.
APPROVED BY THE MEMBERS OF THE THESIS COMMITTEE:
Rhea Paul, Chair
Thomas Deiterich
In the present study, the speech of twenty-four
normally speaking toddlers and twenty-eight late talking
toddlers was analyzed with respect to the syllable
structures produced during a speech sample. The groups
were matched with regard to age, sex, and socio-economic
status, all passed a hearing screening, and all scored at
least 85 on the Bayley Scales of Infant Development.
Each child was videotaped interacting with his or
her mother during a ten-minute play session. The
subjects' utterances were broadly transcribed from these
videotapes, using IPA symbols. Fifty consecutive
different words or word-like utterances, or as many as
could be transcribed out of the ten minute session, were
coded from each subject. Each utterance was assigned to
Syllable Structure Level (SSL) I, II, or III, according
to criteria designated by Olswang et al. (1987), and a
mean SSL was calculated. Inventories of consonant types
were taken for each subject. In addition, each
utterance was determined to be either meaningful or
babbled. Meaningful utterances were glossed, and the
percentage of consonants correctly produced was
determined, for those subjects who produced at least ten
meaningful words.
The data were analyzed for significant differences
between the two groups in the mean SSL, number of
consonant types, and percent consonants correct.
Similarly, significant differences were sought between
the older and younger sub groups within each group. The
results indicated that children in this age group with
normally developing expressive language have more
advanced phonological development in terms of complexity
of syllable structures, percent consonants correct in
meaningful speech, and number of different consonant
2
3
types produced, than do children who are late talking.
The accuracy of phoneme production in children with
normal language development improve over time, while that
of LTs tends to remain relatively stable over the age
range studied. Children with normal expressive language
show less individual variation in phonological
development than their late talking peers, and the
individual variation decreases for the normal group as
they get older, particularly after 25 months.
These data indicate that at least some children with
expressive language disorders do have phonological
delays. Therefore, the "general encoding deficit"
described by Paul and Shriberg (1982) is supported here.
A COMPARISON OF THE PHONOLOGICAL SKILLS OF LATE
TALKING AND NORMAL TODDLERS
by
PATRICIA JOAN JENNINGS
A thesis submitted in partial fulfillment of the requirements for the degree of
MASTER OF SCIENCE in
SPEECH COMMUNICATION
Portland State University 1990
TO THE OFFICE OF GRADUATE STUDIES:
The members of the Committee approve the thesis of
Patricia Joan Jennings presented April 4, 1990.
Thomas Deiterich
APPROVED:
Theodore G. Grove, Chair, Department of Speech Communication
C. William Savery, I Studies and Research
rim Vice Provost for Graduate
ACKNOWLEDGEMENTS
Thanks are due to many people for their parts in
supporting me throughout the course of my involvement in
this thesis. Before thanking them, however, I must first
and above all thank God, because He has provided for all
of my needs by providing these people, and by loving me
unconditionally. He was my constant companion through
long nights at the computer, late evenings in the
library, repeated hearings of unintelligible videotapes,
and high-speed chases to the University to beat
deadlines.
Now, to the people who made this thesis possible.
Dr. Rhea Paul, my thesis advisor, pushed me each step of
the way and provided guidance and direction to the
thesis. In addition to providing the videotapes of the
subjects and their mothers, the shape, scope, and
perspective of this thesis are based on recommendations
she made. Randi Jartun, my reliability rater, spent many
hours learning the transcription rules, asked innumerable
enlightening questions, and did her best through some
difficult times and working conditions, which included
one grouchy trainer.
My parents, Lee and Gladys Jennings, provided for my
needs, such as housing and food, while placing very few
demands on me, and encouraged me. They also gave up a
major portion of their living room and, at times, their
whole house.
iv
My brothers and sisters and their spouses, Bruce and
Kelly Jennings, Sharon and Norm Bowler, Kent Jennings,
and Ted and Nancy Vanzwol, encouraged me, put up with my
moodiness and inaccessability, and provided moments of
laughter when I let them. I would especially like to
thank Bruce and Norm, who allowed me to use their
company's computer and printer for the final draft of the
thesis.
The staff and members of Columbia Presbyterian
Church allowed me to use their video equipment for
transcription of tapes, encouraged me, prayed for me, and
counselled me. The choir especially was supportive. I
think of them as my "cheerleaders"
I owe an enormous debt of gratitude to Richard and
Janet Geary, who very generously provided many different
kinds of support throughout my career in graduate
school. Without them, my dream of completing my Masters
degree would have been impossible. They are my "angels".
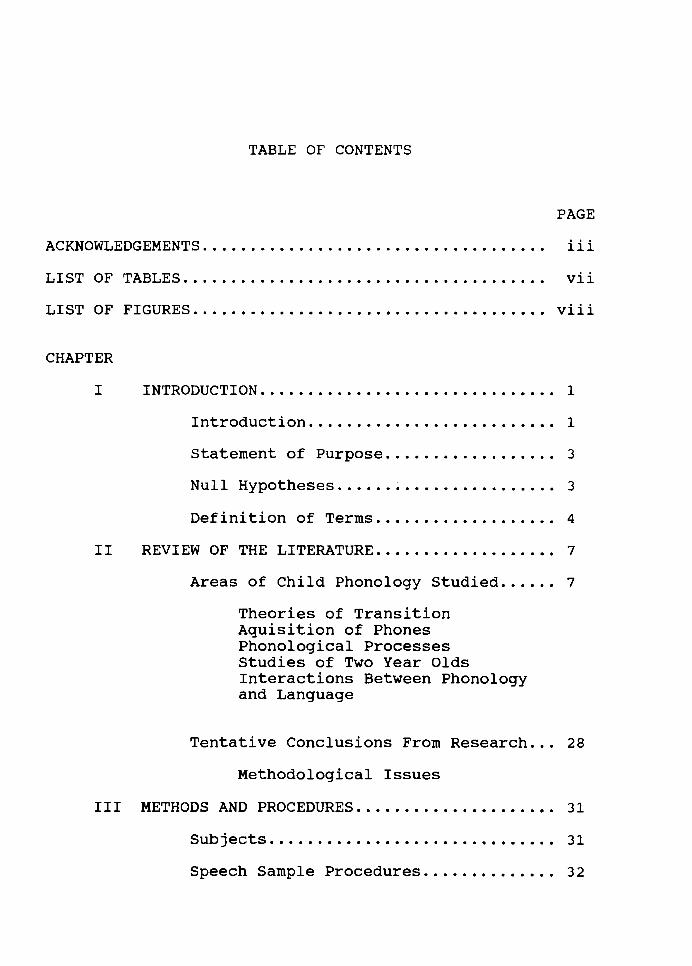
TABLE OF CONTENTS
PAGE
ACI<NO\VLE[)GEMENTS.................................... iii
LIST OF TABLES. . . . . . . . . . . . . . . . . . . . . . . . . . . . . . . . . . . . . . vii
LIST OF FIGURES. . . . . . . . . . . . . . . . . . . . . . . • . . . . . . . . . • . . . viii
CHAPTER
I INTRO[)UCTION. . . . . . • . . . . . . . . . . . . . . . . . . . . . . . . 1
Introduction .......................... 1
Statement of Purpose .................. 3
Null Hypotheses ....................... 3
[)efinition of Terms ................... 4
II REVIEW OF THE LITERATURE ....•.............. 7
Areas of Child Phonology Studied ...... 7
Theories of Transition Aquisition of Phones Phonological Processes Studies of Two Year Olds Interactions Between Phonology and Language
Tentative Conclusions From Research ... 28
Methodological Issues
III METHODS AN[) PROCEDURES ........•....•....... 31
Subjects. . . . . . . . . . . . . . . . . . . . . . . . . . . . . . 31
Speech Sample Procedures ..•........... 32
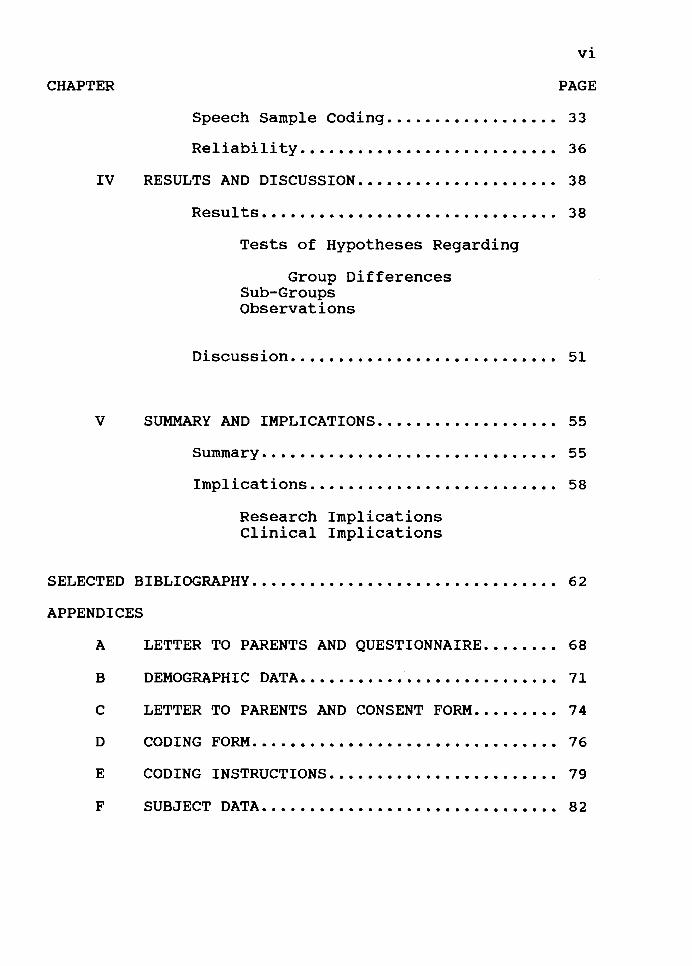
vi
CHAPTER PAGE
Speech Sample Coding .••..••.••.••••... 33
Reliability... . . . . . . . . . . . . . . . . . . . . . . . . 36
IV RESULTS AND DISCUSSION ......•...•.......•.. 38
Results. . . . . . . . . . . . . . . . . . . . . . . . . . . . . . . 38
Tests of Hypotheses Regarding
Group Differences Sub-Groups Observations
Discussion •.••••.••••••••••••••••••.•. 51
V SUMMARY AND IMPLICATIONS .....•............. 55
Summary. . . . . . . . . . . . . . . . . . . . . . . . . . . . . . . 55
Implications. . . . . . . . . . . . . . . . . . . . . . . . . . 58
Research Implications Clinical Implications
SELECTED BIBLIOGRAPHY. . . . . • . . . . . . . . . . . . . • . . . . . . . . . . . • 6 2
APPENDICES
A LETTER TO PARENTS AND QUESTIONNAIRE ...•.... 68
B DEMOGRAPHIC DATA ...•..••.•••.•......••..... 71
C LETTER TO PARENTS AND CONSENT FORM ..•.....• 74
D CODING FORM. • • • • • • • • • • • • • • . • • • • • • • • • • • • • • • • 7 6
E CODING INSTRUCTIONS •....................... 79
F SUBJECT DATA ...•••...•..•...•••.....••..•.• 82
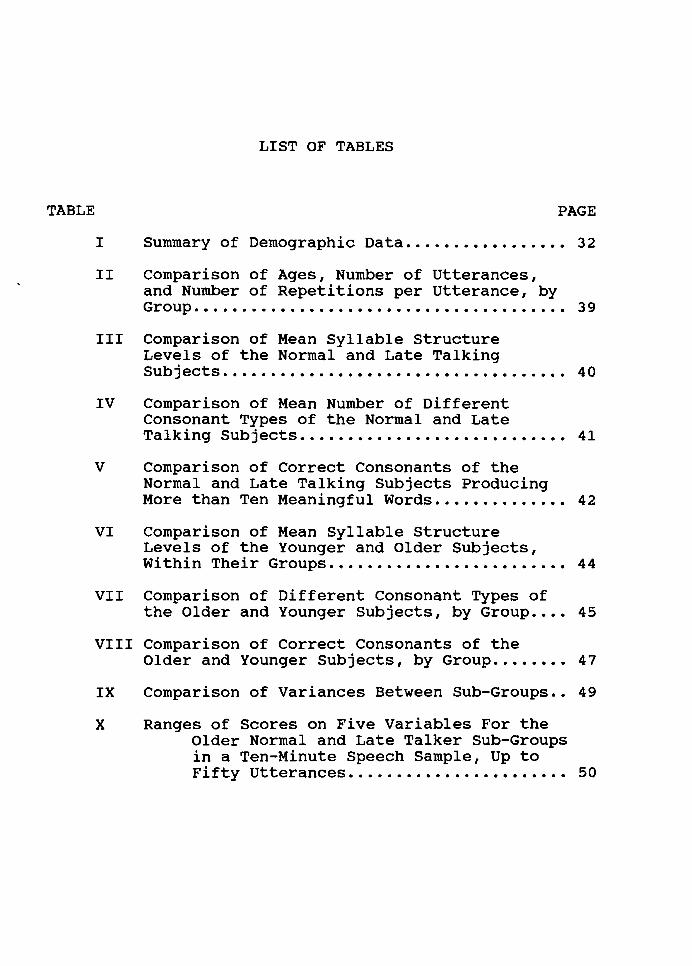
TABLE
LIST OF TABLES
PAGE
I Summary of Demographic Data ..•.•••••••••.••• 32
II Comparison of Ages, Number of Utterances, and Number of Repetitions per Utterance, by Group. . . . . . . . . . . . . . . . . . . . . . . . . . . . . . . . . . . . . . . 3 9
III Comparison of Mean Syllable structure Levels of the Normal and Late Talking Subjects. . . . . . . . . . . . . . . . . . . . . . . . . . . . . . . . . . . . 40
IV Comparison of Mean Number of Different Consonant Types of the Normal and Late Talking Subjects. . . . . . . . . . . . . . . . . . . . . . . . . . . . 41
v Comparison of Correct Consonants of the Normal and Late Talking Subjects Producing More than Ten Meaningful Words ..•....••.••.• 42
VI Comparison of Mean Syllable Structure Levels of the Younger and Older Subjects, Within Their Groups ••..••••..•..••••.•••.••• 44
VII Comparison of Different Consonant Types of the Older and Younger Subjects, by Group •••• 45
VIII Comparison of Correct Consonants of the Older and Younger Subjects, by Group •••••••• 47
IX Comparison of Variances Between Sub-Groups .• 49
X Ranges of Scores on Five Variables For the Older Normal and Late Talker Sub-Groups in a Ten-Minute Speech Sample, Up to Fifty Utterances ......•..••.••••••.•••• 50
FIGURE
1.
LIST OF FIGURES
curves showing progress of developments of consonantal sounds in each of five major categories according to place of
PAGE
articulation.... . . . . . . . . . . . . . . . . . . . . . . . . . . . . 12
2. curves showing relative proportions of consonant categories according to manner of articulation •.•••••••••••••.••.•••••••••.••• 13
3. Average age estimates and upper age limits of customary consonant production •••.•••••.•.•• 15
4. Comparison of SICD with Sander's analysis of customary consonant production ..•.•••••••... 16
5. Percentage of correct production of individual consonants based on total occurence of each phoneme. . . . . . . . . . . . . . . . . . . . . . . . . . . . . . . . . . . . . 1 7
6. Selection characteristics based on the syllabic structures of the adult words attempted •••.• 26
CHAPTER I
INTRODUCTION
Phonology is the study of the rules by which speech
sounds are selected and combined to produce the distinctive
phonemes and syllables of a specific language. Only a
fraction of the sounds which could possibly be produced by
the human speech mechanism are actually used in any one
language. The phonological system of the language
determines which sounds, or "phones", are used, and in what
distribution. The phones which are used distinctively in a
language are called the "phonemes" of that language. In
addition to phones and phonemes, the study of phonology
includes observation of syllable structures produced by the
speakers of a language. For example, in English, some of the
syllable structures used are the following: Consonant-Vowel
(CV), i.e., "bye"; CVCV, "baby"; VC, "an"; CVC, "dad"; CCVC,
"stop"; vcc, "and"; cvcc, "cups"; cvccc, "costs"; ccvcc,
"trips"; CCCVCC, "streets"; and cccvccc, "strengths".
While phonology is frequently used in comparing one
language to another, the present study addresses the early
childhood development of English phonology.
Children produce a variety of sounds in infancy, and
around the end of the first year of life these sounds begin
2
to be used meaningfully to refer to things in the child's
world. While most children make this transition relatively
smoothly and complete it by their second birthday, some do
not. Paul and Shriberg (1982) describe a "general encoding
deficit", which some of these late talking children might
have. The encoding deficit model states that, in children
whose speech is delayed, "children [with deficits] are
generally limited in their capacity to manage hierarchical
complexity during encoding. One result •.. is loss of
phonetic accuracy due to competing demands for processing
resources at higher linguistic levels." (p. 536).
Studies of phonological development in children have
taken a variety of forms, including diary studies, studies
of very small numbers of children, and studies of children
well past the age of transition from babbling to speech.
More recently, child phonological studies have focused on
normal children making the transition from babbling into
speech, as well as on the phonological characteristics of
preschoolers with poor speech development. Few studies,
though, have looked at phonological behavior in children
with delayed language skills who are in the earliest stages
of speech development. It has been shown (Paul and
Shriberg, 1982) that there is a close association between
speech and language development in preschoolers with
communication disorders. At the present time, however,
there are few data available to help in determining whether
a toddler who is not talking is impaired primarily in a
phonological or a semantic/syntactic dimension.
STATEMENT OF PURPOSE
3
The primary purpose of this study was to describe the
phonological characteristics of toddlers with slow
expressive language growth, and to contrast them to the
phonology of vocalizations of normally speaking toddlers.
This study addressed the following specific questions:
1.) Are there differences between the syllable
structures produced by toddlers with normal
language development and those produced by children
with slow expressive language development?
Specifically, do the children with normal language
produce more complicated syllable structures than those
with delayed language?
2.) Do the children with slow expressive language
development produce fewer different consonants and
fewer correct target consonants than children with
normal language growth?
3.) Is chronological age an explanatory factor in the
phonological pref ormance of the two groups?
NULL HYPOTHESES
A. The mean Syllable Structure Level (SSL) of the normal
group is not significantly higher than the SSL of the
4
delayed group.
B. The mean number of true consonants used by the normal
group is not significantly higher than the mean number
of true consonants used by the delayed group.
c. The mean percentage of consonants correctly produced by
the normal group is not significantly higher than the
mean percentage of consonants correctly produced by the
delayed group.
D. The SSLs of the older subjects are not significantly
higher than the SSLs of the younger subjects.
E. The number of true consonant types produced by the
older subjects is not significantly higher than the
number of true consonant types produced by younger
subjects.
F. The percent correctly produced consonants of older
subjects is not higher than that of younger subjects.
DEFINITION OF TERMS
The following operational definitions were used for the
purposes of the present study.
1. Babbled Utterance. Any speech-like utterance the
child produces which does not resemble any English word that
might be expected in the context, and which is not credited
with any specific meaning by the mother or the rater. This
excludes crys, coughs, and screams, but includes any vocal
ization containing "a voiced vocalic element or a voiced
5
syllabic consonant" (Olswang et al., 1987). Vocalizations
produced on an ingressive airstream are also excluded.
2. Syllable Structure Levels. A complexity level (I,
II, or III), is assigned to each babbled vocalization or
meaningful utterance in a speech sample, depending on the
distribution and type of consonants used within the
vocalization (Olswang et al., 1987). Seep. 35 for
definitions of the three Syllable Structure Levels.
3. Late Talkers (LTs). For the purposes of this
study, children who are late talkers have, by parental
report, an expressive vocabulary of fewer than 10
recognizable words at 18-23 months, or an expressive
vocabulary of 50 words or less, or no two word combinations
at 24-34 months.
4. Meaningful Utterance. Utterances which have
obvious referents or clear communicative intent, and are
phonemic approximations of the English words they are
assumed to represent. In order for an utterance to be
considered meaningful, the adult target word must be known.
5. Normal Language Development. In this study, this
is defined in the following way: children who have
expressive vocabularies of more than ten words at 18-23
months or expressive vocabularies of more than 50 words, and
the use of some two word combinations at 24-34 months, by
parent report.
6. Speech Sample. Speech samples in this study
consist of broad phonetic transcriptions of up to fifty
words or word-like utterances from the videotape of each
child. On those tapes which have more than 60 such
utterances, the first ten utterances were not coded.
6
8. Syllable Structure. This term refers to the
arrangement of vowels and consonants produced by a child in
either babbled utterances or meaningful speech.
9. True Consonant. A true consonant is any consonant
which is phonemic in adult American English speech.
CHAPTER II
REVIEW OF THE LITERATURE
AREAS OF CHILD PHONOLOGY STUDIED
The transition from babbling to speech is extremely
complex, and studies of the phenomenon have approached it
from several different perspectives. Areas which have
interested researchers include the phonological
characteristics of babbled productions, acquisition of adult
phonemes, phonological simplification processes in young
children's speech, interactions between phonology and
development of meaningful language, and, more recently,
comparison of the speech of normal and late talking
children. Methods employed in the study of babbling and
early speech are also varied. Diary studies, in which a
parent transcribes as many utterances as possible of his or
her own child during the child's speech development period,
have been used extensively. Some single-subject studies
have sampled the utterances of one child regularly over a
period of several months. Longitudinal studies of larger
numbers of children, also over a period of several months,
appear with some frequency. Cross-sectional studies, such
as the present investigation, are less common.
By far the most frequent focus of studies regarding
early childhood phonology has been the acquisition of
phones. However, some studies also describe other aspects
of phonology, particularly prosodic elements such as pitch
and intonation contours, phonological processes, and
syllable structure.
Theories of Transition
8
Much of the research in the area of early phonological
development has been in response to Jakobson's theory of
child phonology, which included a universal order of the
acquisition of speech sounds and a "silent period" between
babbling and speech (Jackobson, 1968). Jakobson's work,
originally published in 1941 in German, seems to have been
widely accepted by linguists and speech pathologists alike,
until the 1970's. Because of this, most of the research on
this topic has been conducted within the past twenty years.
Scientific investigation relatively quickly produced
extensive evidence refuting Jakobson's theory. Diary
studies of were the primary means of investigating
developmental phonology at that time. If one, otherwise
normal, child acquired phonemes differently than what was
assumed to be the norm, the theory of universal principles
was weakened considerably.
Diary studies, usually conducted by the parents of the
subjects, begin when the subject produces his or her first
recognizable word and end when the child's expressive
9
vocabulary is too large to count. Normal, often superior,
children, are nearly always the subjects of these studies.
These children did not, in fact, follow the "universal
order" of phoneme acquisition. (Smith, 1973; French, 1989).
Data collected in diary studies includes information
regarding syntactic, semantic, and other aspects of language
development, as well as phonological inventories. The data
from various diary studies has been published, so
researchers can analyze it according to other theories and
compare the subjects with other children. Transcriptions of
babbled utterances are not included, however, and thus the
data cannot be compared directly to data from the present
study. Edwards and Shriberg (1983) discuss four of these
studies, noting that the emphasis in the area of
articulation is on the acquisition of segments, or phones,
rather than on phonological processes or on syllable
structure.
In contrast to Jakobson's "nativist" theory, the
behaviorist theory of phonological acquisition was based on
the principle that sounds which children produce correctly
are reinforced by adults (Menn, 1985). It was expected that
those sounds which were used most frequently would be the
quickest to develop, as they would be reinforced most
often. As with Jakobson's theory, the behaviorist theory
did not hold up well under scientific scrutiny. Review of
diary studies and cross sectional studies indicates that the
10
most frequently used sounds are not necessarily the first to
be mastered. (Sanders, 1972; Irwin, 1947a, 1947b, for
example.) In fact, one of the most frequent sounds of the
English language, /s/, is one of the last sounds to be
mastered by many children. In addition, many children are
observed to regress in their phoneme acquisition, i.e., they
seem to have mastered a phoneme early in their speech
development, but go through a later period during which the
same phoneme is not used, or is used inconsistently. (Menn,
1985).
No one theory has yet fully explained the various
phenomena observed in phonological development, although
trends in the acquisition of phonemes are seen in the data
(Menyuk, Menn, and Silber, 1986.) Children seem to choose
structures for production which fit into their own
developing overall phonological systems (Ferguson and
Farwell, 1975), and early speech follows phonological
patterns established in the late babbling period (Vihman and
Greenlee, 1987). The task researchers face, then, is to
describe the phonological development of individuals and
groups of children, hoping analysis of the data can reveal
patterns which will increase understanding of this complex
process.
11
Acquisition of Phones
Several studies, which have involved large populations
of children, have been conducted in order to establish norms
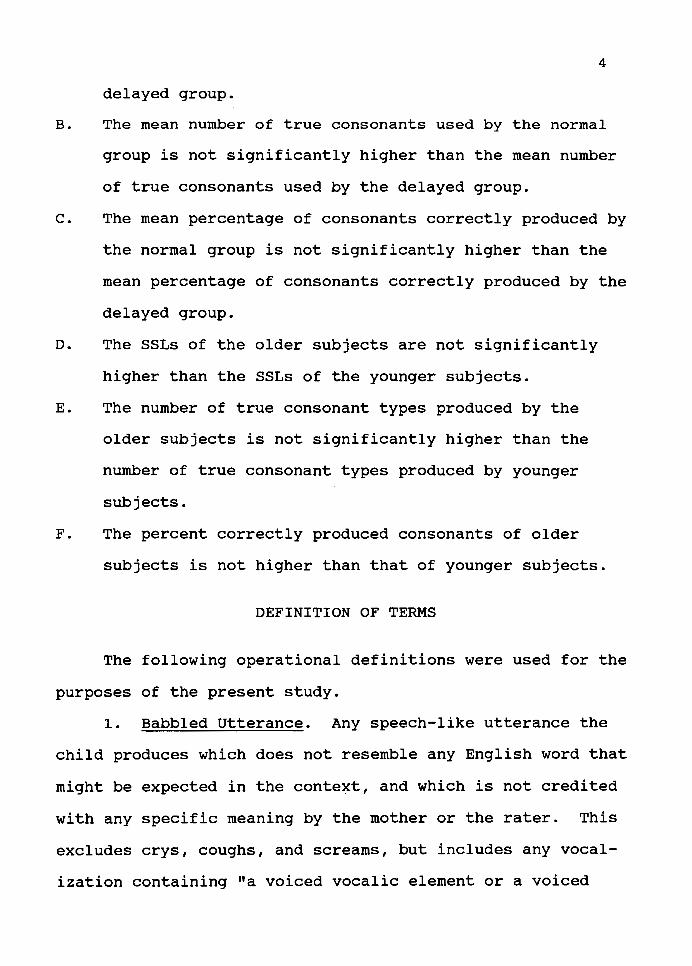
for the acquisition of phonemes. Irwin, (1947a, 1947b,
1948) conducted the earliest of these studies, in which the
development of phonemes from the age of o.o to 2.6 is
described. Irwin included more than 50 subjects at each two
month age level. Inventories of consonants and vowels were
taken from transcriptions of thirty exhalations in each
session. While the ages of the subjects were similar to
those of the present subjects, no differentiation was made
between normal and late talkers, and the utterances
transcribed were not glossed. Therefore, no analysis of the
number of correct phonemes was possible. Also, syllable
structures were not noted. For each age group, Irwin
determined the percentage of phonemes produced, according to
place and manner of articulation. Regarding place of
articulation, children younger than one year are described
as producing primarily glottal sounds, while velar, labial
and labio-dental, and "post-dental" all are produced at
rates of less than 30%. At about one year, the percentage
of glottal sounds decreases significantly, while the rate of
post-dental and labial and labio-dental sounds increases
significantly. These trends continue until approximately
two years, when the rates stabilize. The speech productions
12
of children at age 2.6 are described as having nearly the
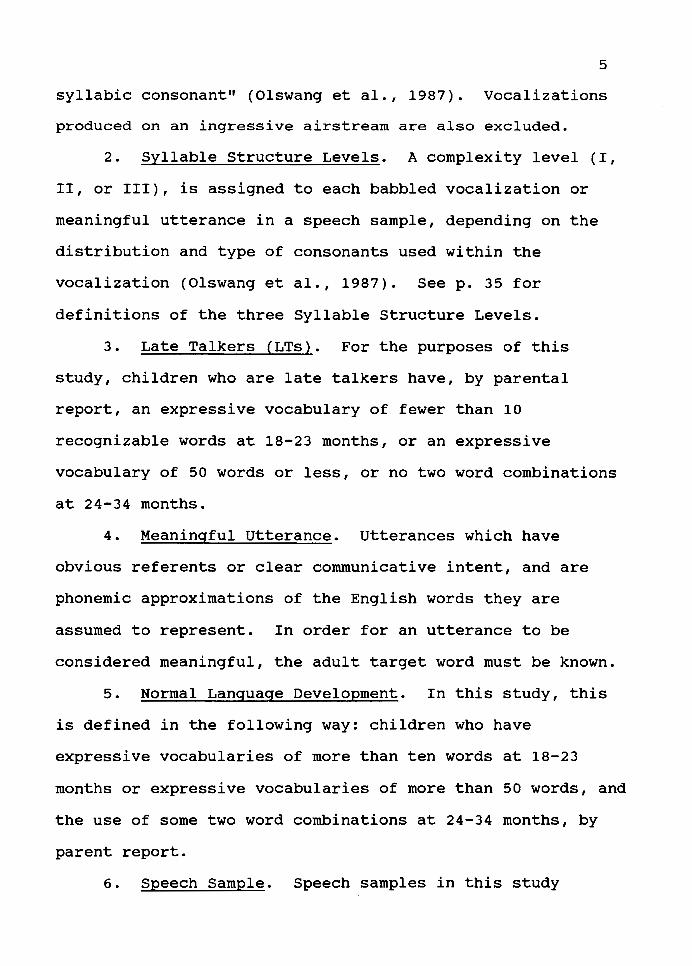
same distribution of phonemes as adult speech. Regarding
manner of articulation, plosives and fricatives are the most
common types produced, while nasals, glides and semi-vowels
are produced at much lower rates throughout the period
studied. The rate of plosives drops sharply between two
months and eight months, then increases sharply and
stabilizes at 45-50% from the age of 1.0 through the end of
the period. Fricatives generally decrease steadily from 6
months through 22 months, stabilizing at approximately 20%.
The results of these studies are summarized in Figures 1 and
2.
100 ,.-,.........-.,..-..,.....,.-"'T"""'T""-r-r-r-r--r--r~rrrrr,..., "t I ' I ' '
: ' : ! I! I i 111111111 : I
15• I I i
10•
65•
60 .. -··t= __ - ____ 1 £1'=3 . . ' . - - .- - . l
/:
• °"'JIO'IT•Gl'.•TAL z 55
"' v 50 . . . . .. l 1 + -a: ., . . . . . . -"' Q. 40 ;,/· ..... · l ·· ..
)5 ·...:/. , I .. )0• -I- .
. LA8111. +
:: . . r· /_ . . . ..... ... !llT .... ,5 •• . . • . . . . I ; ,, ... , '
" 'r/ WLAll •0 ~· .. ~{ • .;....... .... _.___ . . ·-..on.:
' '"-! ...... ~.•I•••••·• i • - _,,....-.....___ __ ~----·-__....llTal. O 0~..;.1......;t::...:::J;_•_~S__:::l......;7,,...:.::;.:l__:::l:...:;I0::...:::1;;.I -.;;:;_..;.11__:::";_1.,,_S-&ll U:VIL.I
't I. It 'IUlll
Figure 1. Curves showing progress of developments of consonantal sounds in each of five major categories
according to place of articulation. Reproduced from Irwin, 1947a, p. 399.
.. I/I'...
" \ ,, / ~ f..E
l.--,,...-
L,.. ., I
l ) • ... e IC
r
'\.. 55
I'\ I '-50
~ Z!I
FRI fAt• IE 20
w"- "L.-...._
I
~ / 10
~ /_,.,. ~.,"§- ....... / .....
5
~-v _.._ ._[.....:
" u"5l:u I 2 J • 5 ' 7 • • IO II II I) .. . 15
YUllS ' I ti I Ii
Figure 2. Curves showing relative proportions of consonant categories according to manner of articulation.
Reproduced from Irwin, 1947b, p. 404.
Sanders (1972) combined the results of two studies
(Templin, 1957, and Wellman, Case, Mengert, and Bradbury,
1931). From these, Sanders developed the chart reproduced
in Figure 3.
More recently, researchers have attempted to describe
acquisiton of phonemes among groups of children in certain
age ranges. These include Prather, Hedrick, and Kern
13
(1975), two to four year olds; Paschall (1983) 18 month
olds; Hare (1983), two year olds; Larkins (1983), three year
olds; Stoel-Gammon (1987), two year olds; and Dyson (1988),
two year olds. The subjects of all of these studies were
children whose speech and language were considered to be
developing normally.
Prather, et al. {1975) revised Sander's chart of
phoneme acquisition, as can be seen in Figure 4, by
including data obtained by testing additional children at
younger ages.
14
Paschall {1983), Hare {1983) and Larkins {1983) all
applied the same analysis procedures to samples of the
spontaneous speech of children. This analysis included
distribution of phonemes, percentage of correct production
of consonants, error type distributions, and various
analyses based on the Irwin-Wong distinctive features system
and the Chomsky-Halle distinctive features system. All
three authors state that their data indicate earlier
acquisition of phonemes than had been reported in previous
studies, based on percentage of correct production of
consonants. The eighteen month olds are reported to produce
50% of consonants correctly; the two year olds, 63%; and the
three year olds, 93%. Because this is analysed by phoneme,
it can be seen which phonemes are produced with the most
accuracy at each age. The distribution of phonemes analysis
results are shown in Figure 5.
In an effort to provide a more reliable account of the
phonological acquisition of children at the age of 24 months
than is given by Sanders or Prather et al., Stoel-Gammon
{1987) conducted a study of 33 normally developing children
at this age. Based on speech samples, rather than test
items, the data was analysed with regard to word-initial and

2 3
--~ ~ ~
AGE LEVEL
+ 5 6
15
7 8
Figure 3. Average age estimates and upper age limits of customary consonant production. The solid bar corresponding
to each sound starts at the mendian age of customary articulation; it stops at an age level at which 90% of all children are customarily producing the sound. Reproduced
from Sanders, 1972, p. 62.
< 24 24mo 28mo 32mo 36mo 40mo 44mo 4Bmo > 48 MnW I I J I I I I
• SICD ~ Sander
Figure 4. Comparison of SICD with Sander's (1972, p. 62) analysis of customary consonant production. When the percentage correct at 24 months exceeded 70%, the bar extends to the left < 24. When the 90% level was not
reached by 48 months, the bar extends to the right > 48. Reprinted from Prather, et al., 1975, p. 181.
16
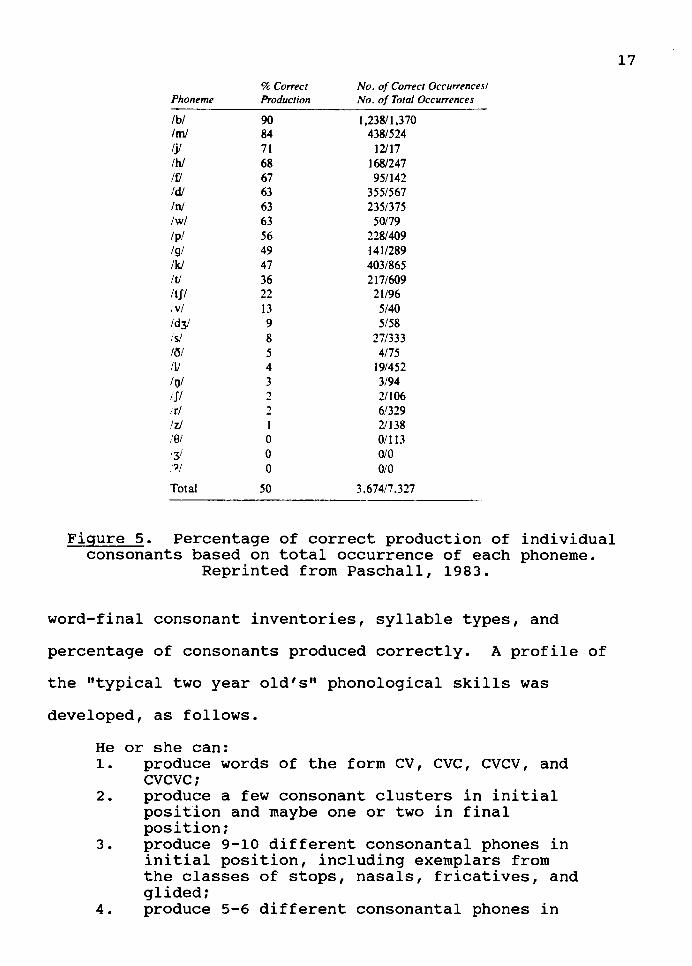
% Correct No. of Con-ect Occu"ences/ Phoneme Production No. of Total Occu"ences
/b/ 90 1,238/ 1,3 70 Im! 84 4381524 /j/ 71 12117 /hi 68 1681247 If/ 67 95/142 Id/ 63 355/567 In/ 63 235/375 lw/ 63 50179 /p/ 56 228/409 lg/ 49 1411289 /kl 47 403/865 It/ 36 217/609 ltf/ 22 21/96 !vi 13 5140 ld31 9 5/58 !sf 8 27/333 IOI 5 4175 II/ 4 19/452 /rj/ 3 3/94 If/ 2 2/106 ;r/ 2 6/329 /zj I 2/138 ,'0/ 0 0/113 1'31 0 010 ,?/ 0 010
Total 50 3 .67417 .327
Figure 5. Percentage of correct production of individual consonants based on total occurrence of each phoneme.
Reprinted from Paschall, 1983.
word-final consonant inventories, syllable types, and
percentage of consonants produced correctly. A profile of
the "typical two year old's" phonological skills was
developed, as follows.
He or she can: 1. produce words of the form CV, eve, cvcv, and
CVCVC; 2. produce a few consonant clusters in initial
position and maybe one or two in final position;
3. produce 9-10 different consonantal phones in initial position, including exemplars from the classes of stops, nasals, fricatives, and glided;
4. produce 5-6 different consonantal phones in
17
final postion, mostly stops but also a representative from the nasal fricative, and liquid sound classes;
5. match the consonant phonemes of the adult word at a level of 70% correct. (StoelGammon, 1987, p. 327-328.)
Dyson (1988) studied the word-initial and word-final
consonant production of two groups of ten children at 2.0,
2.5, 2.9, and 3.3 years. The results of this study were
consistent with other studies of the same phenomena in
younger and older children. Specifically, while previous
reports had listed word-initial inventories as including
"voiced anterior stops, nasals and glides," with velars and
18
voiceless fricatives emerging by 24 months, Dyson noted that
her somewhat older subjects also produced /p/, /1/, and /j/,
and other palatals, which had been missing from younger
subjects' consonant inventories (Stoel-Gammon, 1985). In
addition, in the final position, /m/, /n/ voiced stops, /s/,
/v/, /z/, and !fl are emerging. Voiceless affricates
appear, as do consonant clusters. The most common syllable
type reported in this study is eve, followed by CV in the
first three observations, and "combined other monosyllables"
in the fourth.
Phonological Processes
Acknowledgment of the role of phonological simpli-
f ication processes has had an effect on the way in which
phonology is investigated. Recent studies (Hodson and
Paden, 1981; Dyson and Paden, 1983; and Preisser, Hodson and
19
Paden 1988, for example) have focused not on the aquisition
of individual phones, but on the kinds of errors children
make, such as deletion of final consonants or reduplication
of syllables. Most studies in this area have been conducted
using very small samples, and many studies of developmental
phonology focus on children who are three years old or older
(i.e., Campbell, 1982; Hodson and Paden, 1981.) In these
studies, much individual variation is noted in all aspects
of phonological development.
A major work using diary studies to make conclusions
regarding syllable structure acquisition is Ingram (1976).
Ingram surveyed accounts of four children's first 50 words
and analyzed their phonology. In the sample, the childrens'
first syllables were Consonant-Vowel (CV), for example, /da/
for "dog"; or CVCV, reduplicated, (/baba/ for "bottle"). VC
syllables ("up") also occured, and there were some occur
ances of eve (/b"k/, "book"). Common syllable-related
phonological processes at this age, as reported by Ingram,
include final consonant deletion (usually lost between ages
1-6 and 3-0), which results in CV or V syllables, for
example "out" becomes /au/; reduplication; deletion of
unstressed syllables ("potato" becomes /teto/); and cluster
reduction ("stop" becomes /tap/). Additional data seem to
indicate that Ingram's observations regarding syllable
structure development were accurate (Stoel-Gammon and Dunn,
1985).
Hodson and Paden (1981) compared the phonology of
"essentially unintelligible" children, 3 to 8 years old,
with that of normal, intelligible, four year olds. The
researchers concluded that the phonological processes which
identified the unintelligible children were cluster
reduction, stridency deletion, and stopping, as well as
final consonant deletion, fronting of velars, backing,
syllable reduction, prevocalic voicing and glottal
replacement.
Studies of Two Year Olds
20
Recently, some researchers have begun investigating the
speech productions of two year olds, focusing on syllable
structure development and other aspects of phonology. The
first such study was conducted by Smith (1973). In this
diary study, the subject's utterances from the age of two
years, 60 days through 3 years, 355 days were thoroughly
analysed regarding all aspects of phonology. The results of
this study are extremely complex, and are primarily of
theoretical interest, rather than clinical. Smith describes
26 rules his son applied to English Standard Pronunciation
and how the application of the rules changed over time.
From this empirical data, he draws five theoretical
conclusions, the second and third of which are of interest
to the present researcher. The second conclusion is that
"the child's phonological development is rule-governed and
all changes in his output over time are the result of
changes in rules applying to phonologically (and
grammatically) defined classes." (p. 206). In the third
conclusion, Smith suggests four "hierarchically arranged
universal tendencies: 1) vowel and consonant harmonization,
2) cluster reduction leading to a cvcv ... canonical form. 3)
systematic simplification 4) grammatical simplification."
(p. 206).
21
Macken's (1979) single subject study of a child
learning Spanish was important because of Macken's
observation that "certain phenomena could best be accounted
for by assuming a central role for the 'word' as the basic
unit being acquired", rather than the phoneme or the
syllable. After the age of 26 months, however, traditional
phonological rules could be used to analyze the subject's
phonological system. The "phenomena" mentioned were the use
of idiosyncratic forms and the inconsistent use of
simplification processes.
Dyson and Paden, (1983) and Preisser, Hodson and Paden
(1988), discuss two year old phonology, with regard to the
reduction of the use of phonological processes over time.
In general, a substantial reduction in the use of
phonological processes was noted during the third year,
especially in velar fronting, stopping, and final consonant
deletion. The processes of gliding and cluster reduction
were also reduced, but remained in frequent use into the
22
fourth year. These latter two were also the most frequently
noted processes.
In a cross-sectional study, Vihman, Ferguson, and
Elbert (1986) found that phonological processes in three and
four year olds are rooted in the prelinguistic period.
Children's first words are produced with phonological
structures which are similar to their babbling phonology.
As language development progresses, phonological processes
imposed by the babbling structures are decreased, and
production gradually becomes more like adult speech. They
also note a wide range of individual variation in the
phonologies of their ten subjects.
In a different study, Vihman (1987) found that the
choice of sounds at age one, (some children choose more stop
consonants and others choose more fricatives, for example,)
does not predict mastery of those sounds at age three.
However, she also found that a high use of babble containing
true consonants at age one is predictive of greater
phonological advancement at age three.
Gill (1987) studied the phonological development of a
"language disordered" child from the age of 20 months
through 32 months. Comparing the productions of this child
with those reported in the literature, Gill recommends that
consonantal inventories in conjuction with phonological
process analysis be used as a diagnostic tool, and that
phonological process application ratios be used as a measure
of progress in phonological development. Gill also notes
the need for additional longitudinal data on normal and
language disordered populations, which should provide
norming data for phonological processes.
Stoel-Gammon (1989) reports, in a study of two late
talkers, that "atypical babbling may be associated with
delays in the acquisition of meaningful speech." (p. 207).
Interactions Between Phonology and Language
23
Three studies (Ferguson and Farwell, 1975; Shibamoto
and Olmsted, 1978; and Stoel-Gammon and Cooper, 1984) have
examined the relationship between lexical and phonological
development in children whose productive vocabularies
included about 50 words. These researchers were interested
in whether or not the children's phonologies influenced
their selection of lexical items, the amount of individual
variation in phonological output, and the order or pattern
of acquisiton of speech sounds. Each of the researchers
found distinct phonological patterns within the speech of
the individual subjects, such as the use of primarily open
sylables or the use of syllable reduplication, and some of
the children used the same patterns, for example, two of
Shibamoto and Olmsted's subjects used the process of
fronting velars. Regarding lexical selection, it was found
that several factors in addition to phonological ability are
influential, although the child's ability to approximate the
24
first phoneme of the adult word may be of some influence.
Ferguson and Stoel-Gammon both noted great individual
variation among their subjects. Stoel-Gammon states that
this is true especially after the transition has been made
from primarily babbled to primarily meaningful productions.
Probably because of the individual variation, none of these
researchers proposed a general order of phoneme acquisition,
nor did they propose universal rules for development of
phonological structures, although they all seem to indicate
that such universals might be discovered by thorough
analysis of additional data.
Studies of phonological development in language delayed
children have been largely confined to children over the age
of three, for example, Paul and Shriberg (1982). Paul and
Shriberg identified four patterns of association between
phonology and syntax, based on the utterances of
unintelligible children over the age of three. The question
addressed was whether the children's phonological disability
influenced their syntactic ability. Every subject was
determined to fall into one of the following patterns:
Pattern I: (30%) The subjects display both syntactic
and phonological deficits, with the phonology having a
detrimental effect on production of complex morphophonemes.
Pattern II: (20%) The subjects' syntactic skills are
normal, but their phonological skills influence the
production of complex morphophonemes, which they otherwise
might produce.
Pattern III: (36%) The subjects syntactic and phono
logical skills are both disordered, but the phonological
deficit has limited influence on complex morphophonemes.
Pattern IV: (14%) The subjects' syntactic skills are
normal, and their phonological skills have no influence on
production of complex morphophonemes.
25
Paul and Shriberg note that children who fall into
Patterns I and II (50%, in their study) provide evidence for
a "limited encoding capacity model", in which lack of
intelligibility is one symptom of a deficit in both
phonological and syntactic production. In contrast, the
remaining 50% of Paul and Shriberg's subjects' phonological
disorders had little or no bearing on their syntactic
output.
Studies contrasting the phonologies of language delayed
and normal children under the age of three are not found in
the literature. The subject of French's (1989) diary study
was considered a "late talker" by the researcher, however,
French noted that the subject's speech and language skills
were normal by age 2.7.
The effects of individual variation in language
development on phonological development has been
investigated by Schwartz, Leonard, Folger, and Wilcox,
(1980). The subjects of the study were three normally
developing children and three language disordered children,
26
matched on the basis of MLU, which meant that the language
disordered children were older than the normals. Based on
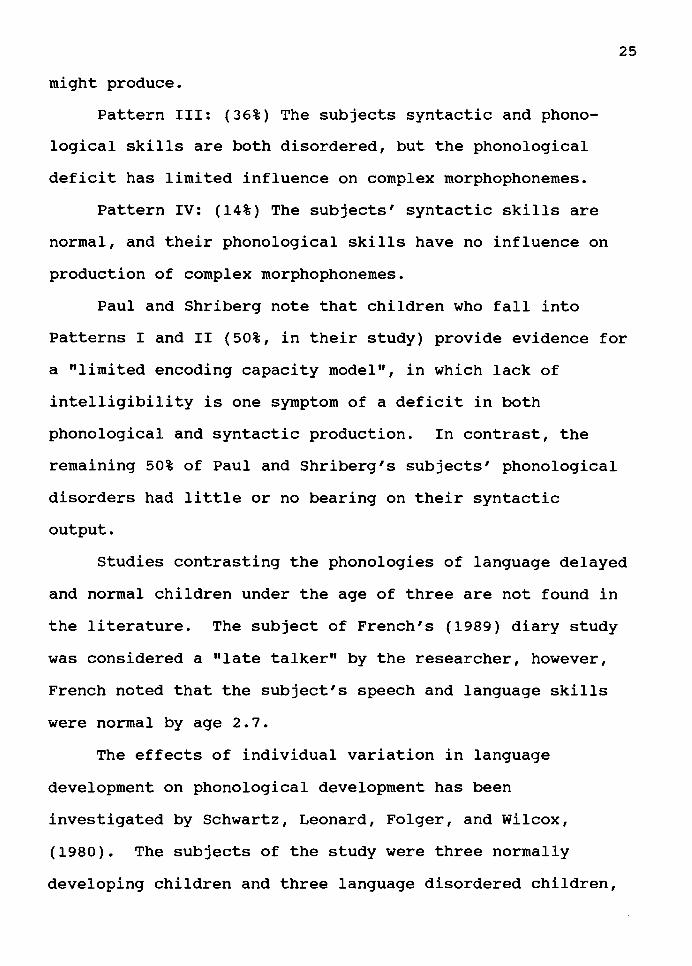
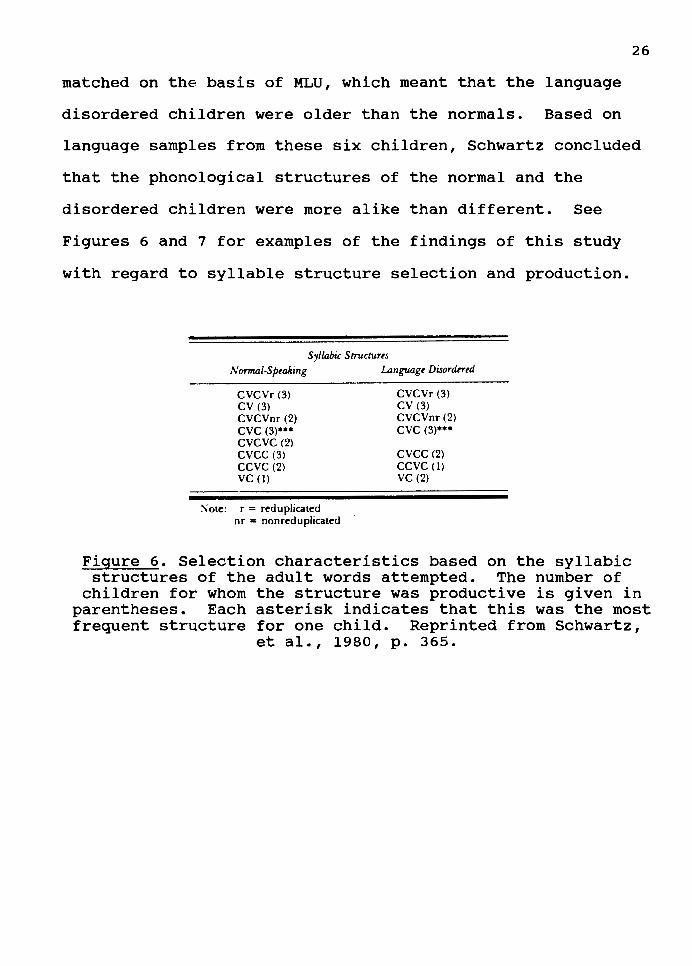
language samples from these six children, Schwartz concluded
that the phonological structures of the normal and the
disordered children were more alike than different. See
Figures 6 and 7 for examples of the findings of this study
with regard to syllable structure selection and production.
Syllabic Structures
Normal-Speaking Language Disordered
evevr (3) eV(3) eveVnr (2) eve (3)*** eveve (2) evee (3) eeve (2) ve (I)
:-.;ote: r = reduplicated nr = nonreduplicated
evevr (3) eV(3) evevnr(2) eve (3)***
evee (2) eeve(l) ve (2)
Figure 6. Selection characteristics based on the syllabic structures of the adult words attempted. The number of
children for whom the structure was productive is given in parentheses. Each asterisk indicates that this was the most frequent structure for one child. Reprinted from Schwartz,
et al., 1980, p. 365.
SJl!abir Structures Normal-Speaiang lariguag' Di1tJrdl'rrd
CV (3)** eve (3)* CVCVr (3) vc (I) v (3) CVV (I)
Sote: r = reduplicated nr = nonrcduplicatcd
CV (3)0
eve <3)* C\'C\'r (:~) \'C (2l \' (2) C\'\' (2)
27
Figure 7. Production characteristics based on the syllabic structures of the children's productions. The number of
children for whom the structure was productive is given in parentheses. Each asterisk indicates that this was the most frequent structure for a child. Reprinted from Schwartz,
et al., 1980, p. 367.
Matthei (1989), in a single subject study, analysed the
phonological processes involved in early multi-word
utterances, and found simplification processes similar to
those noted elsewhere in single-word utterances.
TENTATIVE CONCLUSIONS FROM RESEARCH
From the Nativist theory of Jacobson, child phonology
theory has evolved to the point at which no theory seems
adequate to explain the complex process of speech
acquisition. While certain patterns may be followed, each
child adopts his own style of learning speech and language.
In the end, a theory of phonological acquisition will be
required to account for both patterns and individual
variation, a feat which no theory has yet accomplished.
While charts of the development of speech sounds have
been developed, they should be considered guidelines, at
28
best. Because of the small numbers of subjects on which
they are based, especially at the two year old level, and
because of the high degree of variability in rate of speech
development, their reliability is inadequate to use them as
a diagnostic tool. However, based on the research, normal
two year olds should be expected to:
••• produce 9-10 different consonantal phones in initial position, including exemplars from the classes of stops, nasals, fricatives, and glided; produce 5-6 different consonantal phones in final postion, mostly stops but also a representative from the nasal fricative, and liquid sound classes; match the consonant phonemes of the adult word at a level of 70% correct." (Stoel-Gammon, 1987, p. 327-328).
Gill recommends consonant inventories, in conjunction
with phonological process analysis, be used as criteria for
two year old phonological productions, although specific
criteria levels are not given.
Studies of phonological simplification processes
indicate that unintelligible children over the age of three
use several processes which are also used by normally
developing children at the age of two. By the age of four,
the normally developing child may still use stridency
deletion, liquid simplification, and cluster reduction,
stopping, and assimilation, but most other phonological
processes should no longer be in use, and the child should
be intelligible most of the time.
29
Very few studies have been conducted with very young
children regarding the interaction between phonology and
language, and those which have been done have focused on the
issue of phonological influence on lexical selection. From
these studies, few definite conclusions can be drawn, but it
does appear that syntactic and phonological delays
frequently co-occur. (Paul and Shriberg, 1982).
Methodological Issues
The criteria used to identify the late talking and
normal subjects for the present study were based on the
Language Development Survey (LOS) {Rescorla,1989). The LOS
is a checklist of 300 of the most common words in early
vocabularies and has been shown to have excellent
reliability, validity, sensitivity, and specificity for
differentiating normal two year olds from those with
expressive language delays. In addition, Dale, Bates,
Reznick, and Morrissett, (1989) and Reznick and Goldsmith,
(1989) have shown that checklist formats are valid indices
of expressive vocabulary style.
30
Several procedures have been developed which can be
used to analyze children's phonological development. The
procedure chosen to be used for the present study is the
Language Production Scale (Olswang, Stoel-Gammon, Coggins,
and Carpenter, 1987), primarily because this is the only
tool available which can measure phonology of both babbled
and meaningful speech. In conjunction with the development
of this procedure Olswang et al. performed studies to
develop normative data. In these studies, they found that
babbled utterances increased in complexity between the ages
of nine and 18 months, and that fewer children were in the
babbling stage by 18 months than at 9 months. They also
note that, at 12 months, none of their 34 subjects was in
the meaningful speech stage, but at 24 months, all subjects
were using primarily meaningful speech. In addition, the
percent of consonants correct in meaningful speech increased
between the ages of 15 and 24 months.
CHAPTER III
METHODS AND PROCEDURES
SUBJECTS
This study is part of a larger study of characteristics
and outcomes of toddlers who are late talkers (LTs). The
subjects were recruited from Portland area pediatric clinics
and media advertisements. Criteria for inclusion in the LT
group were: 1) production of less than ten words at 16-23
months, or, 2) production of less than 50 words and no two
word combinations at 24-34 months, by parent report.
Expressive vocabulary size was determined by having parents
select the words their child produced from the Language
Development Survey (LDS) (Rescorla, 1989).
Children whose expressive vocabulary met the above
criteria were invited to participate in a larger
longitudinal study. Those whose expressive vocabularies
exceeded the above criteria on the LDS were invited to join
the normal group. The two groups were matched by age, sex
ratio, and SES. Twenty-four children from the normal group
and twenty-eight from the LT group served as subjects for
the present study. The mean age of the normal group was
25.33 + 4.90 months. The mean age of the late talker group
32
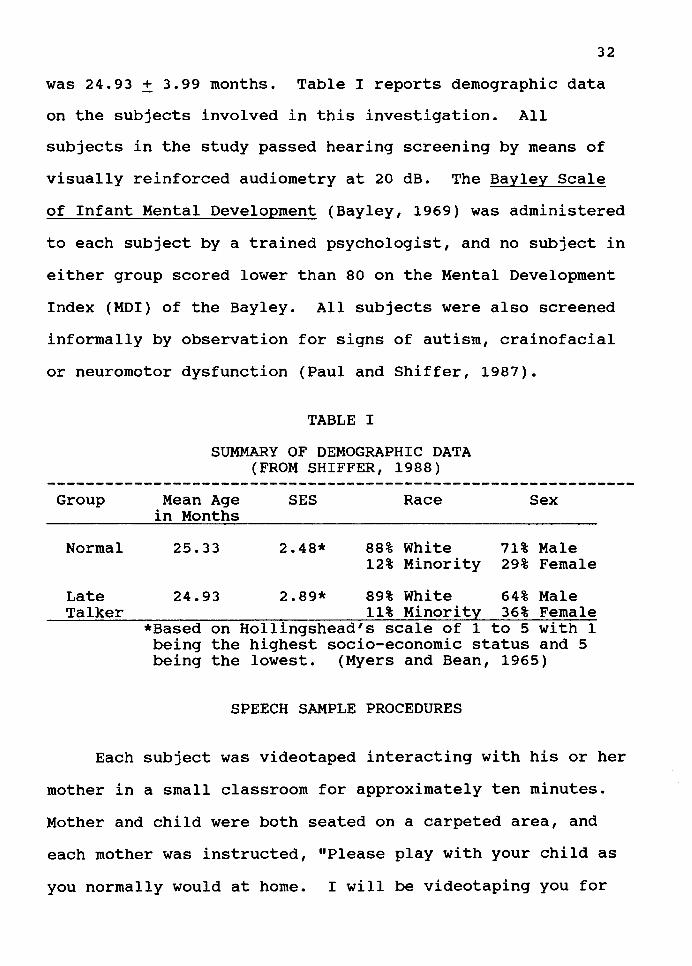
was 24.93 + 3.99 months. Table I reports demographic data
on the subjects involved in this investigation. All
subjects in the study passed hearing screening by means of
visually reinforced audiometry at 20 dB. The Bayley Scale
of Infant Mental Development (Bayley, 1969) was administered
to each subject by a trained psychologist, and no subject in
either group scored lower than 80 on the Mental Development
Index (MDI) of the Bayley. All subjects were also screened
informally by observation for signs of autism, crainofacial
or neuromotor dysfunction (Paul and Shiffer, 1987).
Group
Normal
TABLE I
SUMMARY OF DEMOGRAPHIC DATA (FROM SHIFFER, 1988)
Mean Age in Months
25.33
SES
2.48*
Race Sex
88% White 71% Male 12% Minority 29% Female
Late 24.93 2.89* 89% White 64% Male Talker 11% Minority 36% Female
*Based on Hollingshead's scale of 1 to 5 with 1 being the highest socio-economic status and 5 being the lowest. (Myers and Bean, 1965)
SPEECH SAMPLE PROCEDURES
Each subject was videotaped interacting with his or her
mother in a small classroom for approximately ten minutes.
Mother and child were both seated on a carpeted area, and
each mother was instructed, "Please play with your child as
you normally would at home. I will be videotaping you for
33
ten minutes." The same high-interest toys were used with
each child, so that a somewhat uniform vocabulary might be
elicited. Toys included Disney Peppin' pals, dolls, dishes,
a telephone, stacking rings, cars, a xylophone, blocks, and
a wratchet-shape toy.
The videotaping was done by two graduate students,
using a Panasonic Vicon WV-3150 video camera and an
Electrovoice professional dynamic microphone, in conjunction
with a Panasonic NV 8200 video cassette recorder.
SPEECH SAMPLE CODING
The researcher obtained the data for the present study
by tanscribing the utterances the children produced on the
videotapes. During the transcription process, the
researcher was blind to the subjects' diagnostic group
assignment. Speech samples were transcribed according to
procedures described in the Language Production Scale (LPS),
(Olswang et al, 1987). Speech samples of 50 consecutive
different words or word-like utterances from each subject
were broadly transcribed using International Phonetic
Alphabet (IPA) symbols, as is prescribed for the Language
Production Scale (LPS). Exact repetitions of each word or
word-like utterance were tallied, but only the original
utterance was counted in the analysis. For those subjects
who did not produce 50 utterances on videotape, as many
utterances as possible were used, with the smallest number
of utterances being three. The mean number of utterances
for the normal group was 41.38, and the mean number of
utterances transcribed for the LTs was 23.58.
34
The following rules, adapted from Olswang et al., were
strictly followed for each sample:
1. Transcription:
a. The sample consisted of up to fifty
consecutive different vocalizations, consisting
of a minimum of a voiced vocalic element or a
voiced syllabic consonant, produced with an
egressive airstream. Any vocalization which
could not be transcribed easily after four
hearings (because of poor sound transmission)
was eliminated. Also, any utterance which
occurred simultaneously with any other sound on
the tape, such as parental speech or the noise
of a toy, was not transcribed.
b. In addition, the utterance could not be a cry,
cough, or scream.
c. Babbled utterances were required to be bounded
by one second of silence on either side or by
the noises noted above, or by a breath or by
adult speech. Words and word-like utterances
were identified by their phoneme content
(words) or by their inflection (word-like
35
utterances). A full second of silence was not
required.
2. Coding:
Each utterance was coded as Syllable Structure
Level (SSL) I, II, or III. Rules for assigning SSL
are as follows (adapted from Olswang et al., 1987).
Level I: The utterance is composed of voiced vowel(s), voiced syllabic consonant(s), or CV syllable(s) in which the consonant is a glottal stop, a glide (i.e., /j/, /w/), or /h/ ••• Examples: /he/, /wa/, /m/, /?o/.
Level II: The utterance is composed of vc or eve syllable(s) with a single consonantal type and CV syllables which do not fit the criteria for Level I. Disregard voicing differences .•. Examples: /Ap/, /kek/, /no/, /mama/; /og/, /mim/.
Level III: The utterance is composed of syllables with 2 or more consonant types. Disregard voicing differences .•• (Olswang et al.). Examples: /lak/, /marn/, /b~nk1t/; /adas/, /bozdi/.
3. Scoring:
a. Mean SSL was then determined for each
subject by adding the scores (1, 2, or 3)
for each utterance and dividing by the
number of utterances coded.
b. Meaningful words were identified in each
sample, and percentages of meaningful words
were calculated.
c. For those children who produced at least ten
meaningful words, the meaningful words were
also analyzed for percentage of consonants
correctly produced, whenever the correct
target form could be determined.
d. True consonant types were tallied for each
subject.
36
The procedures described in Olswang et al. were not
followed in their entirety. Specifically, the sample of
vocalizations transcribed for the present study was less
than Olswang et al. recommended, and no distinction was
made, for scoring purposes, between babbled and meaningful
speech. Rather, the Babbling Level scoring system was
applied to both types of vocalization, and is referred to
here as the Syllable structure Level. During transcription,
meaningful words were identified, and all consonants were
listed.
RELIABILITY
In order to determine inter-judge reliability, a
reliability judge transcribed and coded ten percent of the
videotapes according to the procedures described above. The
reliability judge was a specially trained graduate student
in Speech/Language Pathology. The videotapes used for
reliability were selected by use of a random number table.
This judge and the researcher transcribed the videotapes
independently. A point-to-point reliability method was
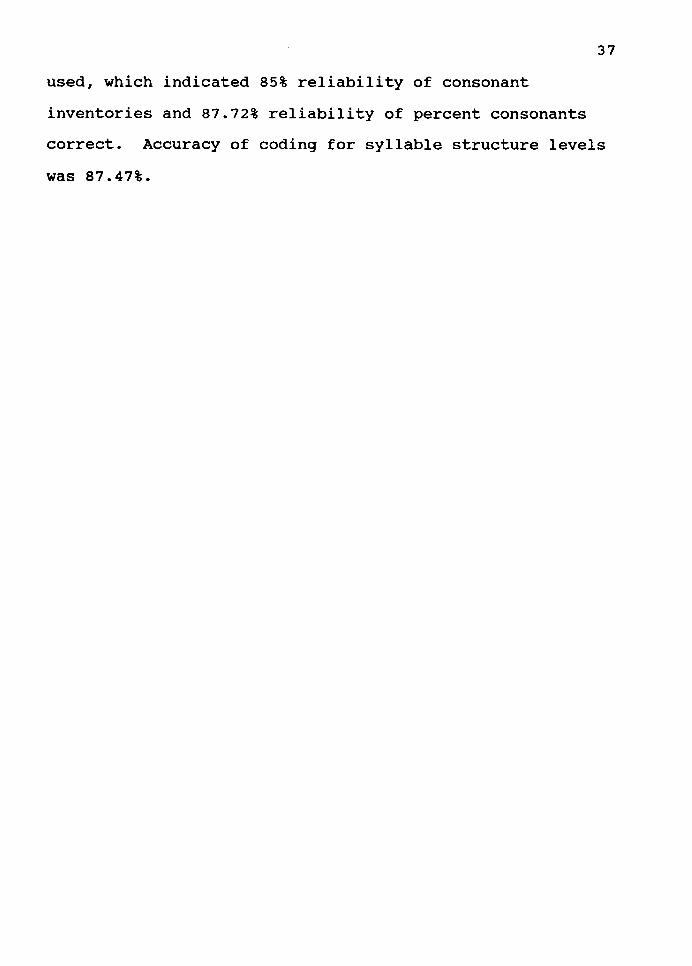
37
used, which indicated 85% reliability of consonant
inventories and 87.72% reliability of percent consonants
correct. Accuracy of coding for syllable structure levels
was 87.47%.
CHAPTER IV
RESULTS AND DISCUSSION
RESULTS
The data gathered from the two groups of subjects were
compared in terms of mean Syllable Structure Level (SSL),
percentage of consonants produced correctly, and number of
different consonant types produced. Sub-groups based on age
within both the Normal and Late Talker (LT) groups were
identified in response to the questions posed in Chapter I.
Prior to a statistical analysis of the parameters in
question, tests were conducted in order to determine whether
the groups were matched for age, number of utterances
transcribed, and mean number of repetitions per utterance.
A two-tailed student's t-test indicated that the Normal and
LT groups were not significantly different in terms of age.
A significantly higher number of utterances was produced by
the subjects in the Normal group than in the LT group, with
a ~<.005 level of significance. In addition, members of the
Normal group repeated their own utterances significantly
less frequently than did members of the LT group, at a
~<.025 level. Results of these tests are summarized in
Table II.
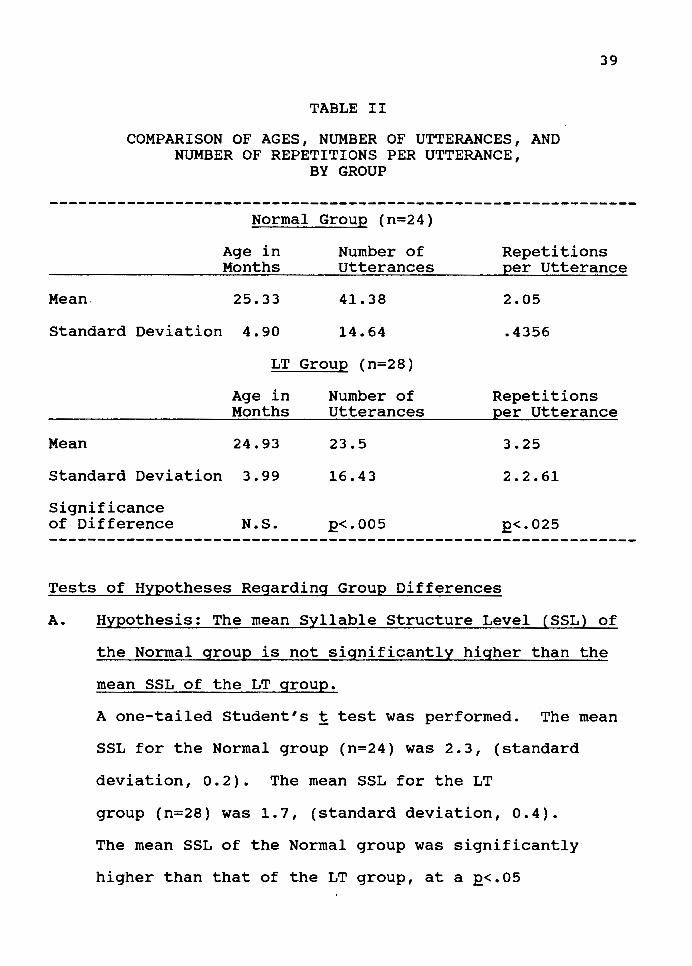
TABLE II
COMPARISON OF AGES, NUMBER OF UTTERANCES, AND NUMBER OF REPETITIONS PER UTTERANCE,
BY GROUP
Normal Group (n=24)
39
Age in Months
Number of Utterances
Repetitions p_er Utterance
Mean, 25.33 41.38
Standard Deviation 4.90 14.64
LT Group (n=28)
Age in Months
Mean 24.93
Standard Deviation 3.99
Significance of Difference N.S.
Number of Utterances
23.5
16.43
p_<.005
2.05
.4356
Repetitions p_er Utterance
3.25
2.2.61
p_<.025
Tests of Hypotheses Regarding Group Differences
A. Hypothesis: The mean Syllable Structure Level (SSL) of
the Normal group is not significantly higher than the
mean SSL of the LT group.
A one-tailed Student's t test was performed. The mean
SSL for the Normal group (n=24) was 2.3, (standard
deviation, 0.2). The mean SSL for the LT
group (n=28) was 1.7, (standard deviation, 0.4).
The mean SSL of the Normal group was significantly
higher than that of the LT group, at a p_<.05
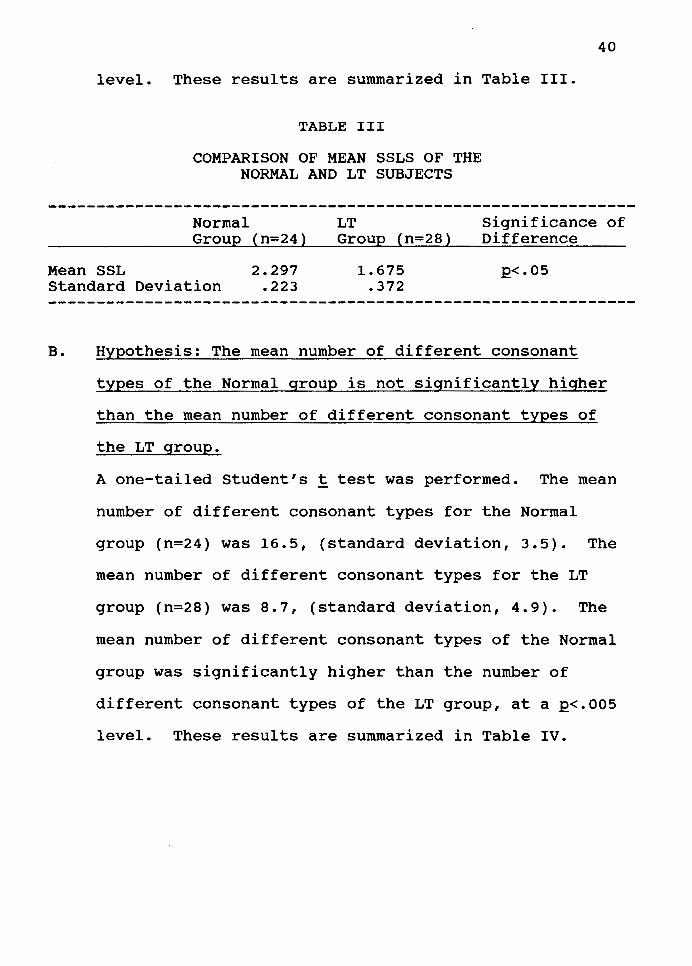
level. These results are summarized in Table III.
TABLE III
COMPARISON OF MEAN SSLS OF THE NORMAL AND LT SUBJECTS
40
Normal Group (n=24)
LT Group (n=28)
Significance of Difference
Mean SSL Standard Deviation
2.297 .223
1.675 .372
.P<.05
B. Hypothesis: The mean number of different consonant
types of the Normal group is not significantly higher
than the mean number of different consonant types of
the LT group.
A one-tailed student's t test was performed. The mean
number of different consonant types for the Normal
group (n=24) was 16.5, (standard deviation, 3.5). The
mean number of different consonant types for the LT
group (n=28) was 8.7, (standard deviation, 4.9). The
mean number of different consonant types of the Normal
group was significantly higher than the number of
different consonant types of the LT group, at a .P<.005
level. These results are summarized in Table IV.
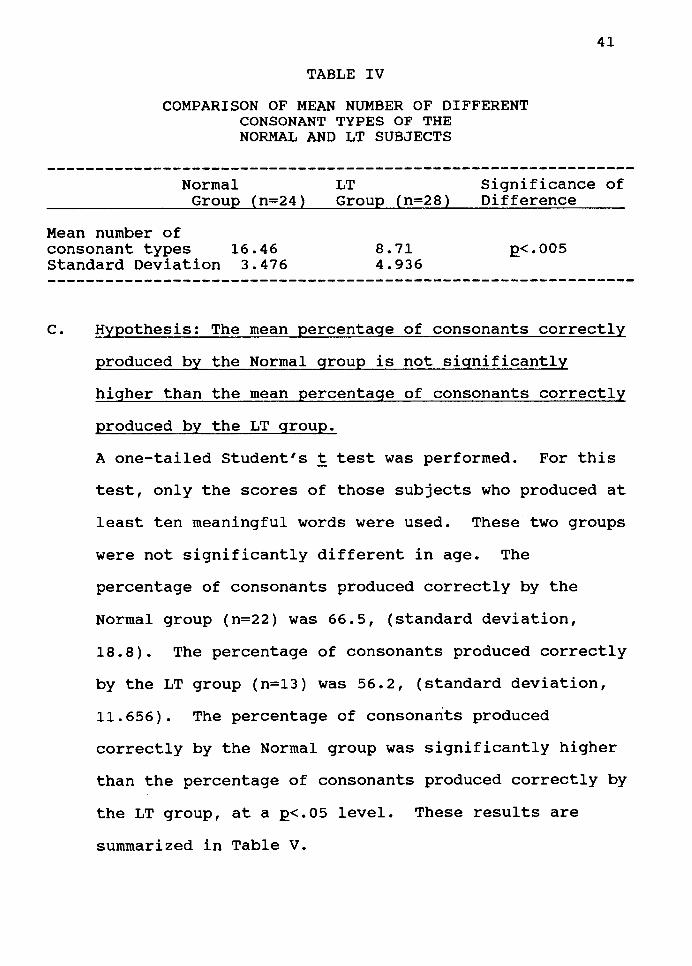
TABLE IV
COMPARISON OF MEAN NUMBER OF DIFFERENT CONSONANT TYPES OF THE NORMAL AND LT SUBJECTS
41
Normal Group (n=24)
LT Group (n=28)
Significance of Difference
Mean number of consonant types 16.46 Standard Deviation 3.476
8.71 4.936
J2<.005
c. Hypothesis: The mean percentage of consonants correctly
produced by the Normal group is not significantly
higher than the mean percentage of consonants correctly
produced by the LT group.
A one-tailed Student's t test was performed. For this
test, only the scores of those subjects who produced at
least ten meaningful words were used. These two groups
were not significantly different in age. The
percentage of consonants produced correctly by the
Normal group (n=22) was 66.5, (standard deviation,
18.8). The percentage of consonants produced correctly
by the LT group (n=13) was 56.2, (standard deviation,
11.656). The percentage of consonants produced
correctly by the Normal group was significantly higher
than the percentage of consonants produced correctly by
the LT group, at a J2<.05 level. These results are
summarized in Table V.
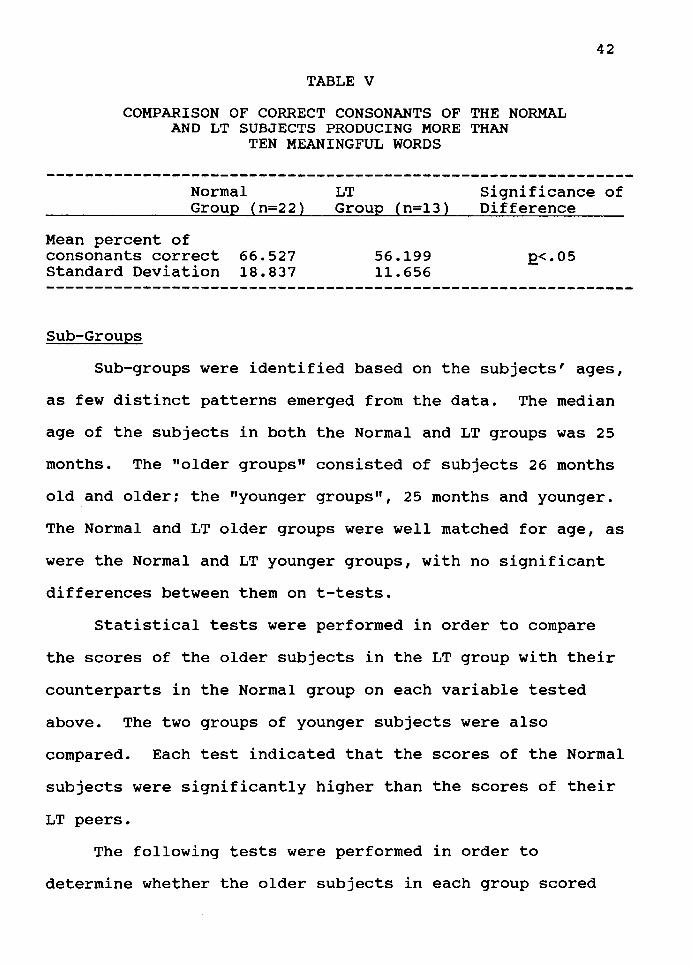
TABLE V
COMPARISON OF CORRECT CONSONANTS OF THE NORMAL AND LT SUBJECTS PRODUCING MORE THAN
TEN MEANINGFUL WORDS
42
Normal LT Significance of Group (n=22) Group (n=13) Difference
Mean percent of consonants correct 66.527 56.199 .P<.05 Standard Deviation 18.837 11.656
Sub-Groups
Sub-groups were identified based on the subjects' ages,
as few distinct patterns emerged from the data. The median
age of the subjects in both the Normal and LT groups was 25
months. The "older groups" consisted of subjects 26 months
old and older: the "younger groups", 25 months and younger.
The Normal and LT older groups were well matched for age, as
were the Normal and LT younger groups, with no significant
differences between them on t-tests.
Statistical tests were performed in order to compare
the scores of the older subjects in the LT group with their
counterparts in the Normal group on each variable tested
above. The two groups of younger subjects were also
compared. Each test indicated that the scores of the Normal
subjects were significantly higher than the scores of their
LT peers.
The following tests were performed in order to
determine whether the older subjects in each group scored
43
significantly higher on each variable than did the younger
subjects within the same group.
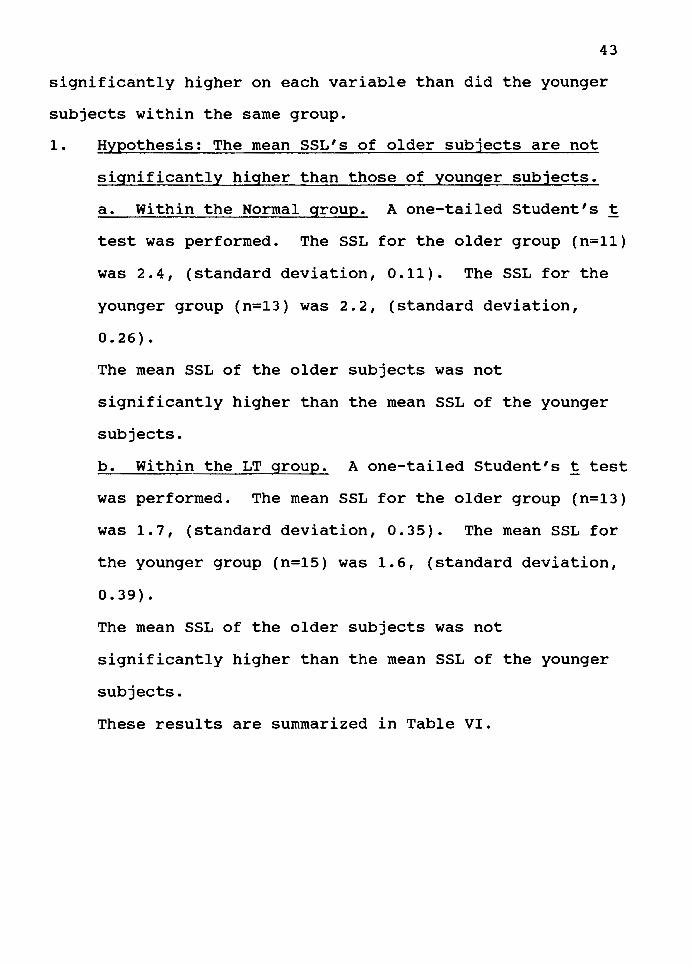
1. Hypothesis: The mean SSL's of older subjects are not
significantly higher than those of younger subjects.
a. Within the Normal group. A one-tailed Student's t
test was performed. The SSL for the older group (n=ll)
was 2.4, (standard deviation, 0.11). The SSL for the
younger group (n=13) was 2.2, (standard deviation,
0.26).
The mean SSL of the older subjects was not
significantly higher than the mean SSL of the younger
subjects.
b. Within the LT group. A one-tailed Student's t test
was performed. The mean SSL for the older group (n=13)
was 1.7, (standard deviation, 0.35). The mean SSL for
the younger group (n=15) was 1.6, (standard deviation,
0.39).
The mean SSL of the older subjects was not
significantly higher than the mean SSL of the younger
subjects.
These results are summarized in Table VI.
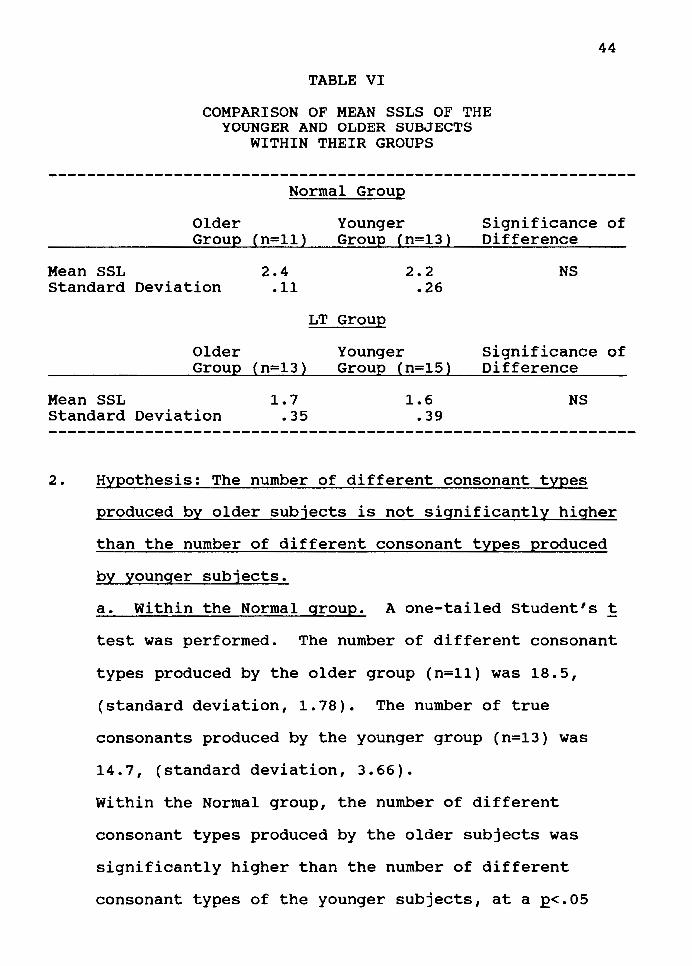
TABLE VI
COMPARISON OF MEAN SSLS OF THE YOUNGER AND OLDER SUBJECTS
WITHIN THEIR GROUPS
Normal Grou,E
44
Older Group (n=ll)
Younger Group (n=13)
Significance of Difference
Mean SSL 2.4 Standard Deviation .11
Older Group (n=l3)
Mean SSL 1.7 Standard Deviation .35
2.2 .26
LT Grou,E
Younger Group (n=15)
1.6 .39
NS
Significance of Difference
NS
2. Hypothesis: The number of different consonant types
produced by older subjects is not significantly higher
than the number of different consonant types produced
by younger subjects.
a. Within the Normal group. A one-tailed Student's t
test was performed. The number of different consonant
types produced by the older group (n=ll) was 18.5,
(standard deviation, 1.78). The number of true
consonants produced by the younger group (n=13) was
14.7, (standard deviation, 3.66).
Within the Normal group, the number of different
consonant types produced by the older subjects was
significantly higher than the number of different
consonant types of the younger subjects, at a p<.05
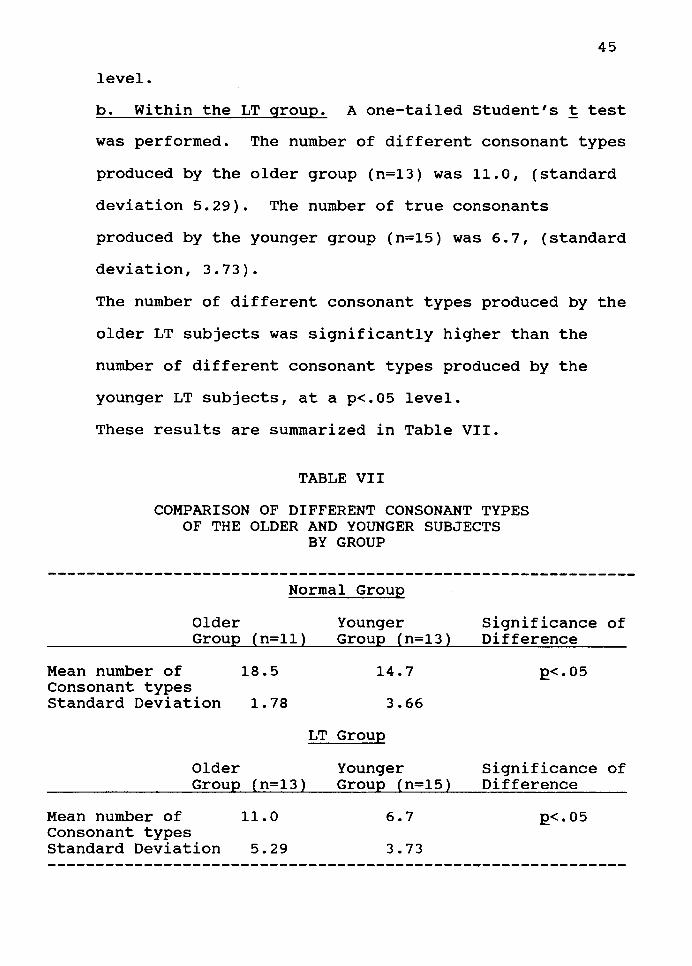
45
level.
b. Within the LT group. A one-tailed Student's t test
was performed. The number of different consonant types
produced by the older group (n=13) was 11.0, (standard
deviation 5.29). The number of true consonants
produced by the younger group (n=15) was 6.7, (standard
deviation, 3.73).
The number of different consonant types produced by the
older LT subjects was significantly higher than the
number of different consonant types produced by the
younger LT subjects, at a p<.05 level.
These results are summarized in Table VII.
TABLE VII
COMPARISON OF DIFFERENT CONSONANT TYPES OF THE OLDER AND YOUNGER SUBJECTS
BY GROUP
Normal Group
Older Younger Group (n=ll) Group (n=13)
Mean number of 18.5 14.7 Consonant types Standard Deviation 1.78 3.66
LT GrOUE
Older Younger Group (n=13) Group (n=15)
Mean number of 11.0 6.7 Consonant types Standard Deviation 5.29 3.73
Significance of Difference
E<.05
Significance of Difference
E<.05
46
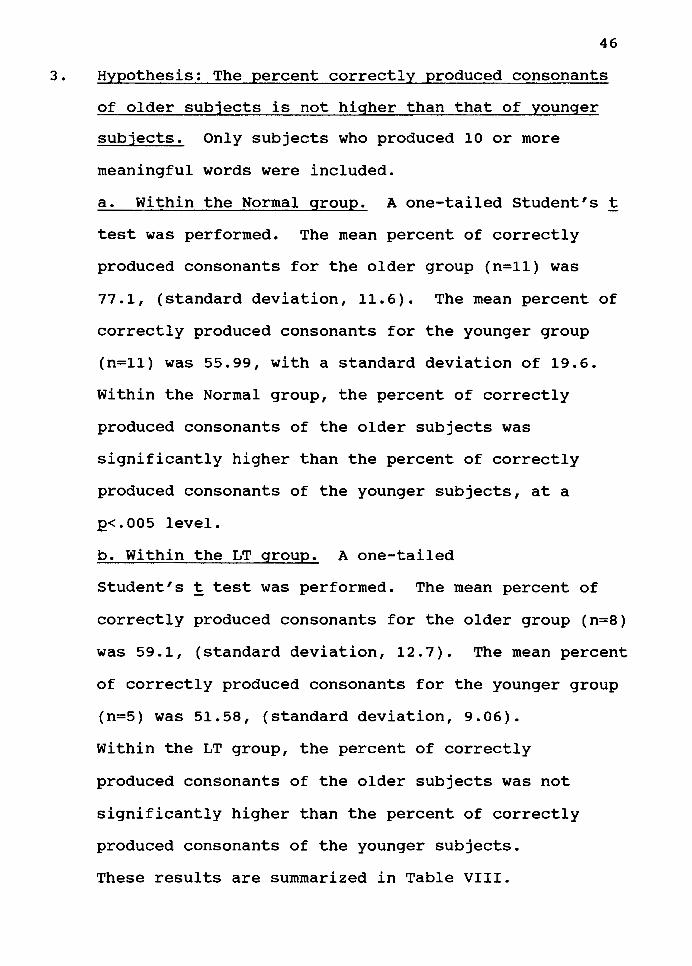
3. Hypothesis: The percent correctly produced consonants
of older subjects is not higher than that of younger
subjects. Only subjects who produced 10 or more
meaningful words were included.
a. Within the Normal group. A one-tailed Student's t
test was performed. The mean percent of correctly
produced consonants for the older group (n=ll) was
77.1, (standard deviation, 11.6). The mean percent of
correctly produced consonants for the younger group
(n=ll) was 55.99, with a standard deviation of 19.6.
Within the Normal group, the percent of correctly
produced consonants of the older subjects was
significantly higher than the percent of correctly
produced consonants of the younger subjects, at a
£<.005 level.
b. Within the LT group. A one-tailed
Student's t test was performed. The mean percent of
correctly produced consonants for the older group (n=B)
was 59.1, (standard deviation, 12.7). The mean percent
of correctly produced consonants for the younger group
(n=5) was 51.58, (standard deviation, 9.06).
Within the LT group, the percent of correctly
produced consonants of the older subjects was not
significantly higher than the percent of correctly
produced consonants of the younger subjects.
These results are summarized in Table VIII.
TABLE VIII
COMPARISON OF CORRECT CONSONANTS OF THE OLDER AND YOUNGER SUBJECTS
BY GROUP
Normal Group
47
Older Group (n=ll)
Younger Group (n=13)
Significance of Difference
Mean percent of 77.1 correct consonants Standard Deviation 11.6
Older Group (n=8)
Mean percent of 59.1 correct consonants Standard Deviation 12.7
Observations
55.99
19.6
LT Grou2
Younger Group (n=5)
51.58
9.06
2<.05
Significance of Difference
NS
In addition to those results which were obtained by
statistical testing of the data, the researcher wishes to
note the following observations.
The first observation concerns the group of Normal
subjects. From the data, the age of twenty-five months
appears to be a pivotal point in speech development. The
subjects under twenty-six months produced between 10 and 50
different utterances during the ten-minute recording
sessions, and the percentage of the utterances which were
considered meaningful ranged from 25% to 100%. Variability
in these factors was noted within each month of age, up to
26 months. Great variability was also noted in the other
48
variables, up to 26 months. However, beginning with the
twenty-six month olds, the Normal group is much more
homogeneous on all variables. For example, only one subject
in the older group, a 26 month old, produced less than 50
utterances in ten minutes, and that subject produced 49
utterances.
F Tests for the Comparison of Population Variances were
conducted, in order to determine whether there was
significantly higher variation in the scores of the younger
subgroups than the older subgroups, in each of the three
variables. The results of these tests are summarized in
Table IX.
The younger Normal groups had significantly higher
variability of mean SSL and number of different consonants
than did the older Normal group. The younger group also had
higher variance on percent consonants correct, although this
was not statistically significant at the p=.05 level.
Because of the relatively low variability of the scores
of the older Normal group, the ranges of these scores might
be used as a profile of scores to describe older Normal
toddler phonology. This profile is given in Table x. It
should be noted that, while the range of scores for each
variable in the LT group overlaps the range of the normal
group's scores, no member of the LT group obtained more than
three scores within the range of the normal group, while
every member of the older normal group had all five scores
within that range.
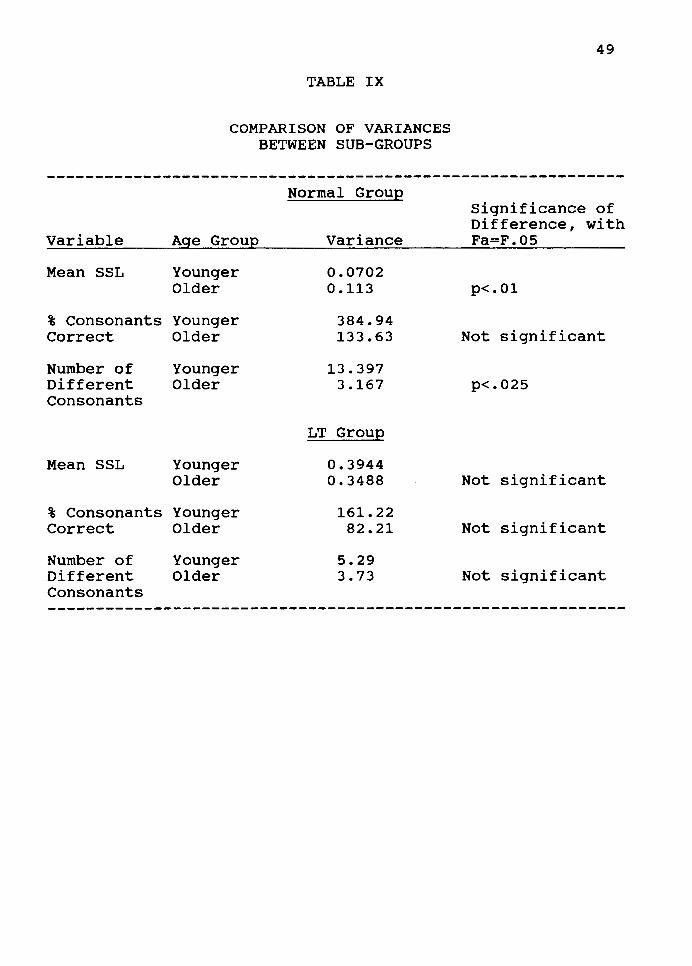
TABLE IX
COMPARISON OF VARIANCES BETWEEN SUB-GROUPS
Variable
Mean SSL
Age Group
Younger Older
% Consonants Younger Correct Older
Number of Different Consonants
Mean SSL
Younger Older
Younger Older
% Consonants Younger Correct Older
Number of Different Consonants
Younger Older
Normal Group
Variance
0.0702 0.113
384.94 133.63
13.397 3.167
LT Group
0.3944 0.3488
161.22 82.21
5.29 3.73
49
Significance of Difference, with Fa=F.05
p<.01
Not significant
p<.025
Not significant
Not significant
Not significant
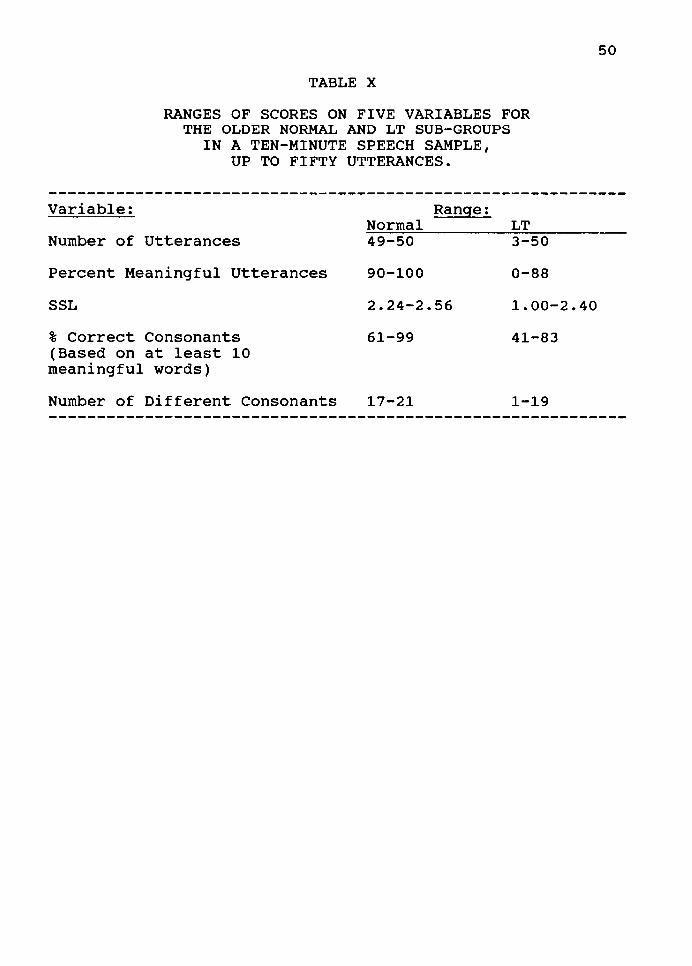
TABLE X
RANGES OF SCORES ON FIVE VARIABLES FOR THE OLDER NORMAL AND LT SUB-GROUPS
IN A TEN-MINUTE SPEECH SAMPLE, UP TO FIFTY UTTERANCES.
Variable:
Number of Utterances
Percent Meaningful Utterances
SSL
% Correct consonants (Based on at least 10 meaningful words)
Number of Different Consonants
Range: Normal 49-50
90-100
2.24-2.56
61-99
17-21
LT 3-50
0-88
1.00-2.40
41-83
1-19
50
51
DISCUSSION
The results of this study indicate that children in
this age group with normally developing expressive language
have more advanced phonological development in terms of
syllable structures, percent consonants correct in
meaningful speech, and number of different consonant types
produced, than do children whose language development is
slow. Furthermore, the results indicate that the accuracy
of consonant production of children with normal language
development tends to improve over time, while the accuracy
of LTs tends to remain relatively stable over the age range
studied. Children whose language development is normal show
less individual variation in phonological development than
their late talking peers, and the individual variation
decreases for the Normal group as the age of the group
increases, particularly after 25 months.
No patterns were found in the data which consistently
identified any group, although the older group of normal
subjects had somewhat more homogeneous scores.
In addition to answering the questions posed in Chapter
one, the results can be compared to the results of other
selected research, for example, Ingram's (1976) study of the
first fifty words of four normally developing children gave
an indication of what syllable types to expect in the
52
meaningful speech of young children. The syllable types
included primarily CV, CVCV reduplicated, and some
occurrences of vc and eve syllables. Production of these
syllable types in this distribution would cause a subject's
speech to be rated in the 1.00-2.00 Syllable Structure Level
range, if coded according to the guidelines for the present
study. In the present study, the data show that the mean
Syllable Structure Level of the LT group is 1.68, which
indicates that the utterances produced by these subjects
consist of syllable types similar to the normal children's
first words in the Ingram study. In contrast, the mean SSL
of the Normal group, 2.3, indicates a much higher use of eve
syllables, thus demonstrating growth in the production of
syllable structures.
It is not possible to compare the results of the
present study directly with the results of Olswang et al.
(1987), because of the difference in the ages of the
subjects in the two studies. However, it is possible to
report the findings of this study regarding the parameters
measured by Olswang et al. The first parameter to be
compared is phonological complexity of babbled, or in the
case of the present study, babbled and meaningful,
utterances. Both studies used the syllable structure as a
measure of phonological complexity. Olswang et al. found
that babbled utterances increased in complexity between the
ages of nine and 18 months. The present study, in which all
53
except one of the subjects were 18 months or older,
indicated that the SSLs of normal speakers 26 months through
37 months old are significantly higher than the SSLs of
normal speakers 16 through 25 months old. Because of the
relatively small sample size, further analysis by age was
not possible. However, these results indicate that
phonological complexity continues to increase, in normal
speakers, after the age of 18 months, at least into the
period of 26 through 37 months.
Olswang et al. also note that, at 12 months, none of
their 34 subjects was in the meaningful speech stage, but at
24 months, all subjects were using primarily meaningful
speech. The present study did not directly address the
proportion of meaningful speech, however, it can be noted
from the data that all except two of the normal subjects, 20
and 16 months old, used more than 50% meaningful speech.
In addition, the percent of consonants correct in
meaningful speech increased between the ages of 15 and 24
months, in the study by Olswang et al. The results of the
present study indicate that the percent of consonants
correct continues to increase, in normal speakers, into the
period of 26 through 37 months, while it does not increase
for LT speakers.
Comparison of the variances of the Normal group's
scores indicates that, while development of syllables is not
completely uniform, individual differences may not be as
54
prevalent as those found in studies of phoneme acquisition,
especially between the ages of 26 and 37 months. The
variances of the older LT group appear to be larger on all
variables than those of the older Normal group.
CHAPTER V
SUMMARY AND IMPLICATIONS
SUMMARY
Research regarding the phonological productions of very
young children has typically centered on the speech of
normal children, usually emphasizing the acquisition of
segments, or phonemes. Although much individual variation
has been observed within the normal population, norms
describing broad age ranges have been established for the
acquisition of segments. Because of the variability of
phoneme acquisition, these norms are of limited clinical use
with very young children. Several researchers have noted an
increase in the complexity of syllable structures with the
development of speech, although no norming data is available
for syllable structure development.
In the present study, the speech of twenty-four
normally speaking toddlers and twenty-eight late talking
toddlers was analyzed with respect to the syllable
structures produced during a speech sample. The groups were
matched with regard to age, sex, and socio-economic status,
all passed a hearing screening, and all scored at least 85
on the Bayley Scales of Infant Development.
56
Each child was videotaped interacting with his or her
mother during a ten-minute play session. The subjects'
utterances were broadly transcribed from these videotapes,
using IPA symbols. Fifty consecutive different words or
word-like utterances, or as many as could be transcribed out
of the ten minute session, were coded from each subject.
Each utterance was assigned to Syllable Structure Level
(SSL) I, II, or III, according to criteria designated by
Olswang et al. (1987), and a mean SSL was calculated.
Inventories of consonant types were taken for each subject.
In addition, each utterance was determined to be either
meaningful or babbled. Meaningful utterances were glossed,
and the percentage of consonants correctly produced was
determined, for those subjects who produced at least ten
meaningful words.
The data were analyzed for significant differences
between the two groups in the mean SSL, number of consonant
types, and percent consonants correct. Similarly,
significant differences were sought between the older and
younger sub groups within each group. The results indicated
that children in this age group with normally developing
expressive language have more advanced phonological
development in terms of complexity of syllable structures,
percent consonants correct in meaningful speech, and number
of different consonant types produced, than do children who
are late talking. The accuracy of phoneme production of
57
children with normal language development improves over
time, while that of LTs tends to remain relatively stable
over the age range studied. Children with normal expressive
language show less individual variation in phonological
development than their late talking peers, and the
individual variation decreases for the normal group as they
get older, particularly after 25 months.
These data indicate that at least some children with
expressive language disorders do have phonological delays.
Therefore, the "general encoding deficit" described by Paul
and Shriberg (1982) is supported here.
IMPLICATIONS
Research Implications
While the reliability of the present study is good, it
is thought that the inferior quality of sound transmission
on the videotapes may have negatively affected the accuracy
of the transcriptions. The use of lapel microphones might
have significantly increased the reliability of the study.
The study of toddler phonology is rife with
methodological difficulties. Both in the literature and in
this researcher's observation, problems are encountered with
recording, transcribing, and analysing the data.
The kinetic nature of children at play makes electronic
recording of their utterances difficult. A stationary
microphone may miss many important utterances, while a lapel
58
microphone may be used as a toy, or may be pulled off with
sudden movements. In the present study, in which the
subjects played on the floor of a clinic room with their
mothers, a remote microphone was placed on carpet near the
subject during videotaping. Because the children tended to
wander away from the area, and because some of the toys used
were very noisy, many utterances which were not easy to
discern on the videotapes were not transcribed. Another
problem encountered with the recording was the relatively
poor sound quality of the videotapes. The cause of this
problem is not known to this writer, however, detailed
analysis of certain data, such as phonological processes,
was not carried out because of the poor sound quality.
Problems encountered in transcription are many.
Children who are just beginning to use meaningful speech use
many different phonological forms. Some utterances are
obviously vocal play, or babbling. Others seem to be
meaningful, because the vocal inflection used is similar to
that of the adult language, although no referent is clear
from the context. In utterances which are obviously
meaningful, the child may use two or three surface forms
within a few minutes to produce the same word. For example,
the word "duck" might be produced as /d"k/, /?"k/, and
/g"k/, by the same child, in a ten minute span. Conversely,
a child might also produce two words which are phonemically
different in English with the same phonological pattern.
59
For example, "star" and "car" might both be produced as
/da:/. To further complicate matters, the child might
sometimes produce sounds which are not phonemic in the
English language, or which are distortions of adult sounds.
Idiosyncratic forms pose a similar problem. For example,
Si, Macken's (1979) Spanish speaking subject, produced an
unnecessary neutral syllable before 19-20 percent of her
words. Other children sometimes choose a favorite sound,
and spend a period of their language learning time using
this one sound as often as possible, without regard for any
phonological rules. It is hoped that the influence of all
of these processes which occur in individual children were
ameliorated by the transcription and analysis rules which
were used in the present study. In particular, the
measurement of Mean Syllable Structure appeared to be
relatively immune to the influence of variations in the
phoneme content of words.
Additional research comparing the syllable structures
produced by late talking and normal children is needed, in
order to develop a more clear understanding of phonological
development in both groups. Replication of this study could
provide information on the universality of the conclusions
drawn about the phonological productions of these toddlers.
such replications in varying populations would provide
additional information which might be a basis for the
development of a protocol for the early differential
60
diagnosis of phonological disorders.
The Syllable Structure Level scale could be expanded
for use with older toddlers by adding a fourth level, Level
IV, in which words containing later developing consonants
and multisyllabic words could be coded. This would be
especially helpful in studying the productions of three- and
four- year olds, and might provide a more sensitive
instrument for the measurement of syllable structure
development. Additional studies could investigate the use
of such an expansion by using it to compare the productions
of normal and late talking children at the ages of three and
four.
Follow-up studies should be conducted with the subjects
of this study, in order to evaluate the predictive value of
the results reported here. Of particular interest would be
studies at four years and six years of age and during the
fourth or fifth grade in school. The focus of such
investigations would be on the presence of phonological
disorders and, for the older children, the presence of
reading or other learning difficulties. Until this study
has been replicated, and follow-up studies have been
conducted, clinical application of the results must be used
with caution.
Clinical Implications
While it is hoped that the SSL scale will be further
refined by future researchers, the present study might
61
temporarily be of clinical use to individuals who are
concerned with assessment of speech production in children
between 26 and 36 months. Following the procedures
described in Chapter III, a child's productions during a ten
minute play period with a parent could be transcribed,
coded, and compared to the profile of the productions of
normally developing children given in Table x. If the
child's scores fall within the guidelines on every measure,
the child's productions are similar to those of the normal
children in the present study. If no score falls within the
guidelines, the child is probably a late talker. Any
further interpretation would not be supported by the present
data, although follow-up studies may provide information
which will lend predictive value to these guidelines.
An additional clinical use of the results would be in
observation of toddlers. The rate of verbal output, the
percent of meaningful speech, the number of different
syllable structure types and the number of different
consonant types may all be indicators of phonological
development, and very low incidence of any of these measures
should be viewed with concern by the clinician.
Syllable Structure Level appears to be a potentially
valuable measure of phonological development in toddlers,
and it is hoped that its clinical usefulness will be
expanded in the near future.
Regarding treatment of language disorders in toddlers,
62
the results of the study indicate that the vocabulary chosen
to be taught to a child should be within the child's
phonological ability. Specifically, the child's syllable
structure productions should be noted, and vocabulary words
with those structures should be the first taught. If the
child already has a fairly sizeable expressive vocabulary,
which he produces with a very limited number of syllable
types, using a limited number of phonemes, additional
syllable structures at the same level as his best
productions should be taught, before attempts are made to
expand his phonemic repertoire. For example, if the child
pronounces "pop", "fall", "ball", "paper" and "put", all as
/pa/, the first word to be taught would be "pop", because it
has a Level II syllable structure. Other eve and ve words
which contain this child's available phonemes would also be
taught at this time. Once the child is producing Level II
words with accuracy, Level III syllable structures can be
introduced, still using the child's own phonetic inventory.
SELECTED BIBLIOGRAPHY
Bayley, N. (1969). Bayley Scales of Infant Development. New York, NY: The Psychological Corporation.
Dale, D.S., Bates, E., Reznick, S.J., and Morisset, c. (1989). The validity of a parent report instrument of child language at twenty months. Journal of Child Language, 16, 239-250.
Dyson, A.T. (1988). Phonetic inventories of 2- and 3-year old children. Journal of Speech and Hearing Disorders, 53, 89-93
Dyson, A., and Paden, E. (1983). Some phonological acquisition strategies used by 2-year olds. Journal of Childhood Communication Disorders, z, 6-18.
Edwards, M.L. and Shriberg, L.D. (1983). Phonology: Applications in communication disorders. San Diego, CA: College-Hill Press.
Ferguson, c., and Farwell, c., (1975). Words and sounds in early language acquisition: English initial consonants in the first fifty words. Language, 15, 1-54.
French, A. (1989). The systematic acquisition of word forms by a child during the first-fifty-word stage. Journal of Child Language, 16, 69-90.
Gill, C.B. (1987). A longitudinal study of phonemic and phonological process development of a language disordered subject. Unpublished doctoral dissertation, cited in Dissertation Abstracts International, 47, 10, 3730-A.
Haelsig, P.C. and Madison, C.L. (1986). A study of phonological processes exhibited by 3-, 4-, and 5-year old children. Language, Speech, and Hearing Services in the Schools, 17, 107-114.
Hare, G. (1983). Development at 2 years. In J. Irwin ands. Wong (Ed.s), Phonological Development in Children 18 to 72 Months. Carbondale, Il: Southern Illinois University Press.
Hodson, B. and Paden, E. (1981). Phonological Processes which characterize unintelligible and intelligible speech in early childhood. Journal of Speech and Hearing Disorders, 46, 369-373.
64
Ingram o. (1976). Phonological disability in children. New York: Elsvier.
Irwin, o. (1947a). Infant speech: Consonantal sounds according to place of articulation. Journal of Speech and Hearing Disorders, 12, 397-401.
Irwin, o. (1947b). Infant speech: consonantal sounds according to manner of articulation. Journal of Speech and Hearing Disorders, 12, 402-404.
Irwin, o. (1948). Infant speech: Developmental vowel sounds. Journal of Speech and Hearing Disorders, 13, 31-34.
Larkins, P. (1983). Development at 3 years. In J. Irwin and s. Wong (Ed.s), Phonological Development in Children 18 to 72 Months. Carbondale, Il: Southern Illinois University Press.
Leonard, L.B., Newhoff, M., and Mesalam, L. (1980). Individual differences in early child phonology. Applied Psycholinguistics, !, 7-30.
Macken, M.A. (1979). Developmental reorganization of phonology: A heirarchy of basic units of acquisition. Lingua, 49, 11-49.
Matthei, E.H. (1989). Crossing boundaries: More evidence for phonological constraints on eauly multi-word utterances. Journal of Child Language, 16, 41-53.
Menn, L. (1980). Phonological theory and child phonology. In c. Ferguson, J. Kavanaugh, and G. Yeni-Komshian (Ed.s), Child Phonology, Volume 1: Production. New York: Academic Press.
Menn, L. (1985). Phonological development: Learning sounds and patterns. In J. Berke-Gleason (Ed.), The Development of Language. Columbus, OH: Charles E Merrill Publishing Company.
Menyuk, P., Menn, L., and Silber, R. (1986). Early strategies for the preception and production of words and sounds. In P. Fletcher and M. Garman (Ed.s), Language acquisition: Studies in first language development. New York:Cambridge University Press.
Meyers, J.K., and Bean, L.L., (1965). A decade later: A follow-up of social class and mental illness. New York, NY: Wyley and Sons.
65
Olswang, L.B., Stoel-Gammon, c., Coggins, T.E., and Carpenter, R.L. (1987). Assessing prelinguistic and early linguistic behaviors in developmentally young children. Seattle, WA: University of Washington Press.
Paschall (1983). Development at 18 months. In J. Irwin and s. Wong (Ed.s), Phonological Development in Children 18 to 72 Months. Carbondale, Il: Southern Illinois University Press.
Prather, E., Hedrick, D., and Kern, c. (1975). Articulation development in children aged two to four years. Journal of Speech and Hearing Disorders, 40, 179-191.
Preisser, D.A., Hodson, B.W., and Paden, E.P. (1988). Developmental phonology: 18-29 months. Journal of Speech and Hearing Disorders, 53, 125-130.
Paul, R. (1989). Profiles of toddlers with delayed expressive language development. Paper presented at ASHA, St. Louis, MO.
Paul, R. and Shiffer, M. {1987). An examination of communication intentions in speech delayed toddlers. Paper presented at the ASHA National Convention, New Orleans, LA.
Paul, R. and Shriberg, L. (1982). Associations between phonology and syntax in speech delayed children. Journal of Speech and Hearing Research, 25, 536-547.
Rescorla, L. (1989). The language development survey: A screening tool for delayed language in toddlers. Journal of Speech and Hearing Disorders, 54, 587-599.
Reznick, s.J. and Goldsmith, L. (1989). A multiple form word production checklist for assessing early language. Journal of Child Language, 16, 91-100.
Sander, E. (1972). When are sounds learned? Journal of Speech and Hearing Disorders, 37, 55-63.
Schwartz, R., Leonard, L., Folger, M., and Wilcox, M. (1980) Early phonological behavior in normal-speaking and language-disordered children. Evidence for a synergistic view of linguistic disorders. Journal of Speech and Hearing Disorders, 45, 357-377.
66
Shibamoto, J.S., and Olmsted, D.L. (1978). Lexical and syllabic patterns in phonological acquisition. Journal of Child Language, ~' 417-456.
Smith, N.V. (1973). The acquisition of phonology: A case study. New York: Cambridge University Press.
Stoel-Gammon, c. (1987). Phonological skills of 2-year-olds. Language, Speech, and Hearing Services in the Schools, 18, 323-329.
Stoel-Gammon, c. (1989). Prespeech and early speech development of two late talkers. First Language, 9, 207-224.
Stoel-Gammon, c. and Dunn C. (1985). Normal and disordered phonology in children. Baltimore: University Park Press.
Vihman, M.M., Ferguson, c., and Elbert, M. (1986). Phonological development from babbling to speech: Common tendencies and differences. Applied Psycholinguistics, Vol. 7.
Vihman, M.M. and Greenlee, M. (1987). Individual differences in phonological development: Ages one and three years. Journal of Speech and Hearing Research, 30, 503-521.
a~IVNNOiilisano GNV ~ailiilia~ iliNa~d
V XIGNaddV
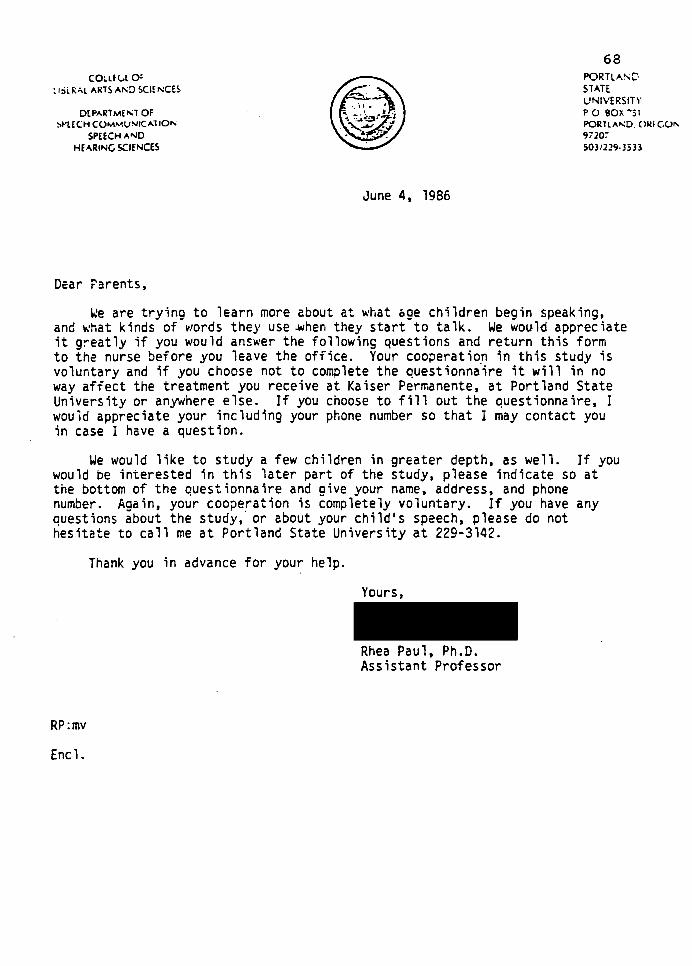
coatc...l o: : l:hR"-L ARTS A"'D SCIENCES
DEPAR1MEP..:T OF :->l'l[CH C0MMU~ICA110"'
SPEECHA""D Hf ARING SCIENCES
Dear f'arents,
June 4, 1986
68 PORTLA!'.:C' STATE UNIVERSITY P 0 BOX ~31 POR1LA"0. OIU GU1'. 97207
SOl 12.?9· 35 33
We are trying to learn more about at what oge children begin speaking, and what kinds of words they use .when they start to talk. We wou-ld appreciate it greatly if you would ans'll.·er the fo11owing questions and return this form to the nurse before you leave the office. Your cooperatio_n in this study is voluntary and if you choose not to complete the questionnaire it will in no way affect the treatment you receive at Kaiser Permanente, at Portland State University or anywhere else. If you choose to fill out the questionnaire, I would appreciate your including your phone number so that I may contact you in case I have a question.
We would like to study a few children in greater depth, as well. If you would be interested in this later part of the study, please indicate so at the bottom of the questionnaire and give your name, address, and phone number. Again, your coope!ation is completely voluntary. If you have any questions about the study, or about your child's speech, please do not hesitate to call me at Portland State University at 229-3142.
Thank you in advance for your help.
RP:mv
Encl.
Yours,
Rhea Paul, Ph.D. Assistant Professor
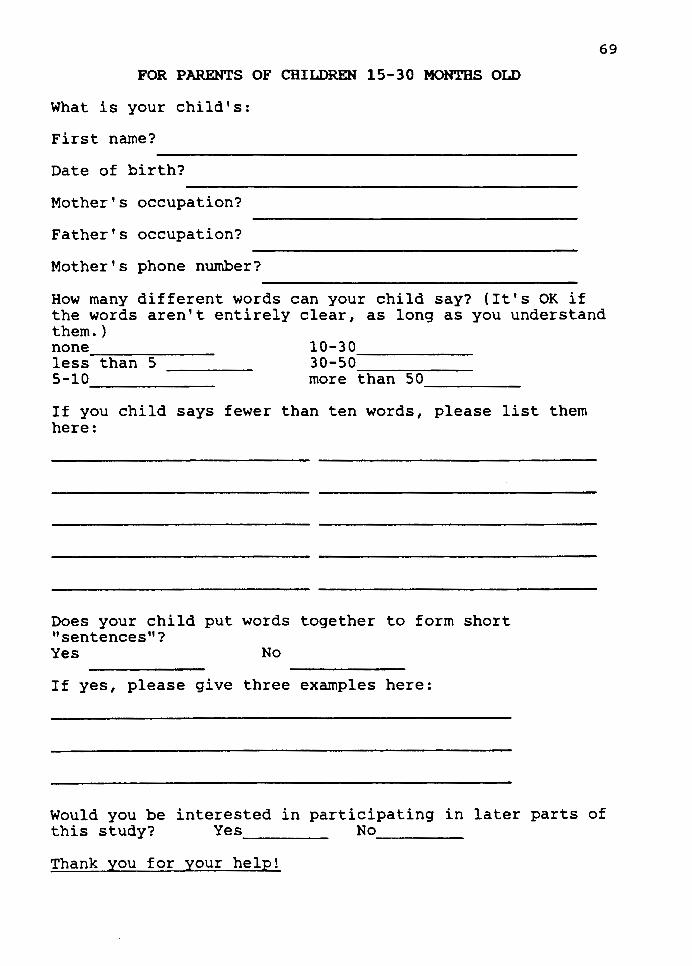
69
FOR PARENTS OF CHILDREN 15-30 MONTHS OLD
What is your child's:
First name?
Date of birth?
Mother's occupation?
Father's occupation?
Mother's phone number?
How many different words can your child say? (It's OK if the words aren't entirely clear, as long as you understand them.) none~.,..-~~~~le s s than 5 5-10~~~~~~-
10-30 30-50~-----
more than 50 -----If you child says fewer than ten words, please list them here:
Does your child put words together to form short "sentences"? Yes No
If yes, please give three examples here:
Would you be interested in participating in later parts of this study? Yes No~~~~-
Thank you for your help!
ViliVG J!Hd~Dowaa
g XIGNaddV
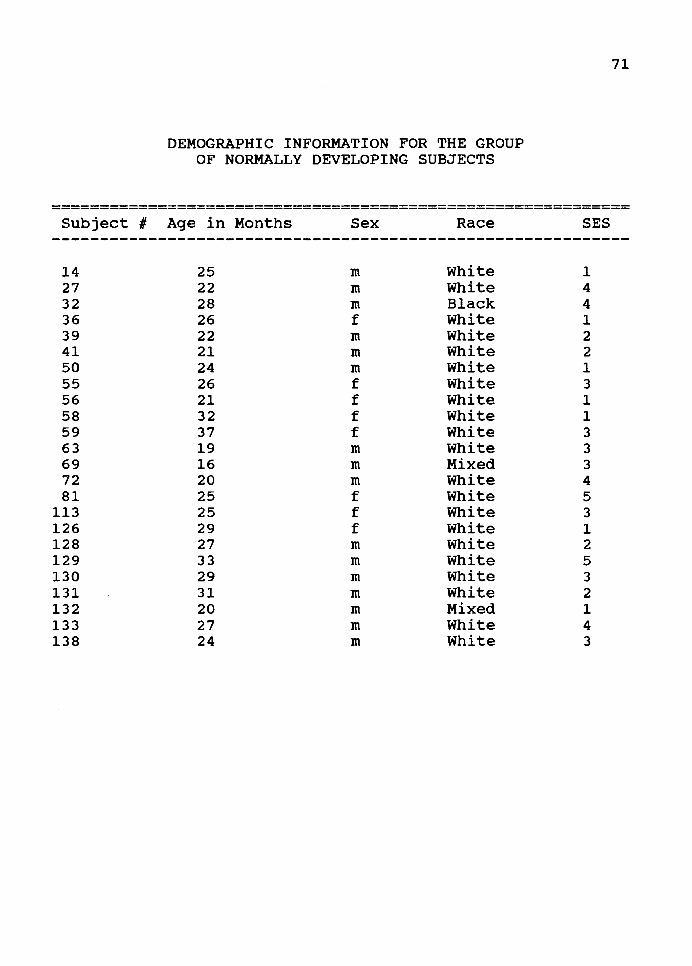
DEMOGRAPHIC INFORMATION FOR THE GROUP OF NORMALLY DEVELOPING SUBJECTS
71
============================================================ Subject # Age in Months Sex Race SES
------------------------------------------------------------14 25 m White 1 27 22 m White 4 32 28 m Black 4 36 26 f White 1 39 22 m White 2 41 21 m White 2 50 24 m White 1 55 26 f White 3 56 21 f White 1 58 32 f White 1 59 37 f White 3 63 19 m White 3 69 16 m Mixed 3 72 20 m White 4 81 25 f White 5
113 25 f White 3 126 29 f White 1 128 27 m White 2 129 33 m White 5 130 29 m White 3 131 31 m White 2 132 20 m Mixed 1 133 27 m White 4 138 24 m White 3
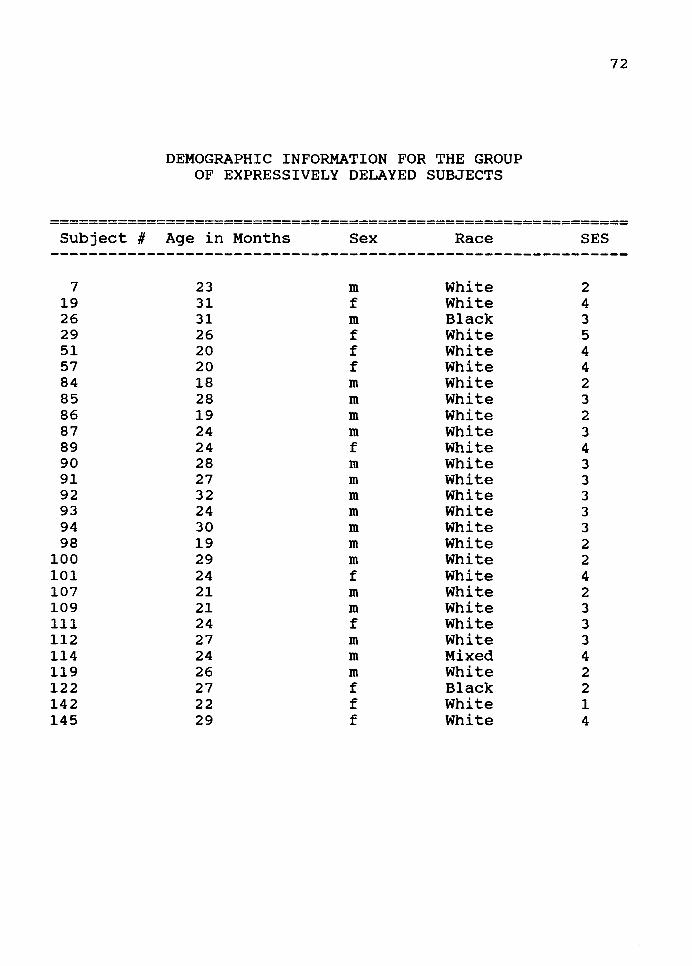
DEMOGRAPHIC INFORMATION FOR THE GROUP OF EXPRESSIVELY DELAYED SUBJECTS
72
============================================================ Subject # Age in Months Sex Race SES
------------------------------------------------------------7 23 m White 2
19 31 f White 4 26 31 m Black 3 29 26 f White 5 51 20 f White 4 57 20 f White 4 84 18 m White 2 85 28 m White 3 86 19 m White 2 87 24 m White 3 89 24 f White 4 90 28 m White 3 91 27 m White 3 92 32 m White 3 93 24 m White 3 94 30 m White 3 98 19 m White 2
100 29 m White 2 101 24 f White 4 107 21 m White 2 109 21 m White 3 111 24 f White 3 112 27 m White 3 114 24 m Mixed 4 119 26 m White 2 122 27 f Black 2 142 22 f White 1 145 29 f White 4
IDIOd ~N3SNO~ GNV S~N3Wid O~ H3~~3~
~ XIGN3ddV
74
COLLEGE OF PORTLAND LIBERAL ARTS ANO SCIENCES STATE
UNIVERSITY DEPARTMENT Of
SPEECH COMMUNICATION SPEECH AND
HEARING SCIENCES
P.O. BOX 751 PORTLAND. ORfGON '17207 5031229-JSJ I
Dear Parents,
We would like to 1nvite you and your child to participate in a study of language development in toddlers. We hope to learn more about the age range that is normal for the beginning of speech and how children communicate in other ways during the toddler period. If you agree to join the study, you will be asked to bring your child to PSU for testing sessions every 6-12 months. At each session the child will be videotaped playing with you and scme toys. We wil I ask the child to identify some pictures and act out some instructions with toys (such as "Push the car.") In addition we will ask you to answer some questions about the child's social and self-help skills. All parents participating will receive counseling and a list of suggestions for fostering language growth in children under three years of age. The potential benefits of the study are some help for you with stimulating language in your child. In addition, any child who reaches age three and appears to be having problems with language-learniQg can be referred for services in our clinic or elsewhere.
If you decide not to participate, of course the services you receive from your chi Id's pediatrician, PSU, or any other agency wi 11 not be affected. If you decide to join the study you may withdraw at any time.
All results of your child's evaluations wi 11 remain strictly confidential. However, if you would like them to be communicated to your pediatrician or anyone else, we will be glad to do so. There will be no charge for any work done with you or your child as part of this study.
If you have any questions, please do not hesitate to ask them, or to call me at 229-3533. Thank you for your help.
I (do) (do not) give permission for my child, to participate in the study described above.
Yours,
Rhea Paul, Ph.D., CCC-SPL Assistant Professor
Date Signature
I (do) (do not) give permission to show my child's videotapes for teaching or professional presentations only. I realize ful 1 names wil 1 not be used in any such presentations.
Signature
KtlO..!I DNIGO:::>
G XIGN3:dd'l
76
Subj. # Name~~~~~~~~~~~~- Age~~- % meaningful~~ SSL~~-
Utterances: Exact repetitions/utterance~~~- Cons. Correct I = %
Beginning time on tape:~~~~ Ending time on tape:~~~~~~
" .-.- -.. ·--- -----·- -- ----- - ---- -- - --- - -- --- --
01 I '
02
03
04
05
06
07
08 i 09
10
11
12 I
13
14
15
16
17 ' '
18 ' ' I
19 I i
20 ' '
21 I
22
23 !
I
24 J
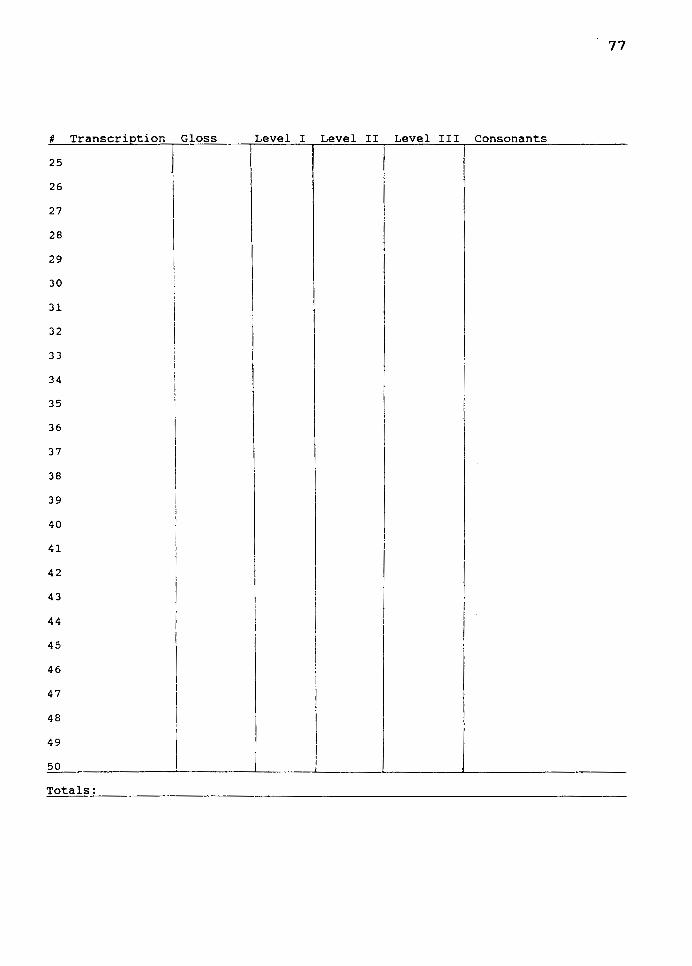
77
# -- -- - ~ -- Gl L 1 1 1 I
25
26
27
28 I 29 I 30 ~
31 I
32 I
33
34
35
36
37
38 i
39
40
41
42
43
44
45
46
47
48
49
50
Totals:

SNOI~~nM~SNI ~NIGO~
3: XIGN:!lddV
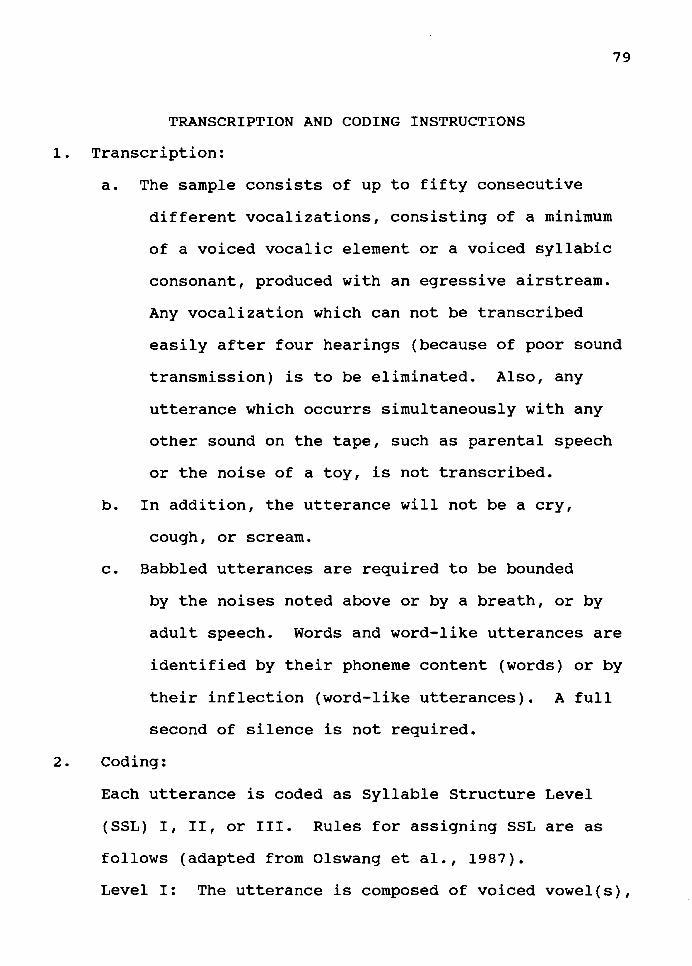
TRANSCRIPTION AND CODING INSTRUCTIONS
1. Transcription:
79
a. The sample consists of up to fifty consecutive
different vocalizations, consisting of a minimum
of a voiced vocalic element or a voiced syllabic
consonant, produced with an egressive airstream.
Any vocalization which can not be transcribed
easily after four hearings (because of poor sound
transmission) is to be eliminated. Also, any
utterance which occurrs simultaneously with any
other sound on the tape, such as parental speech
or the noise of a toy, is not transcribed.
b. In addition, the utterance will not be a cry,
cough, or scream.
c. Babbled utterances are required to be bounded
by the noises noted above or by a breath, or by
adult speech. Words and word-like utterances are
identified by their phoneme content (words) or by
their inflection (word-like utterances). A full
second of silence is not required.
2. Coding:
Each utterance is coded as Syllable Structure Level
(SSL) I, II, or III. Rules for assigning SSL are as
follows (adapted from Olswang et al., 1987).
Level I: The utterance is composed of voiced vowel(s),
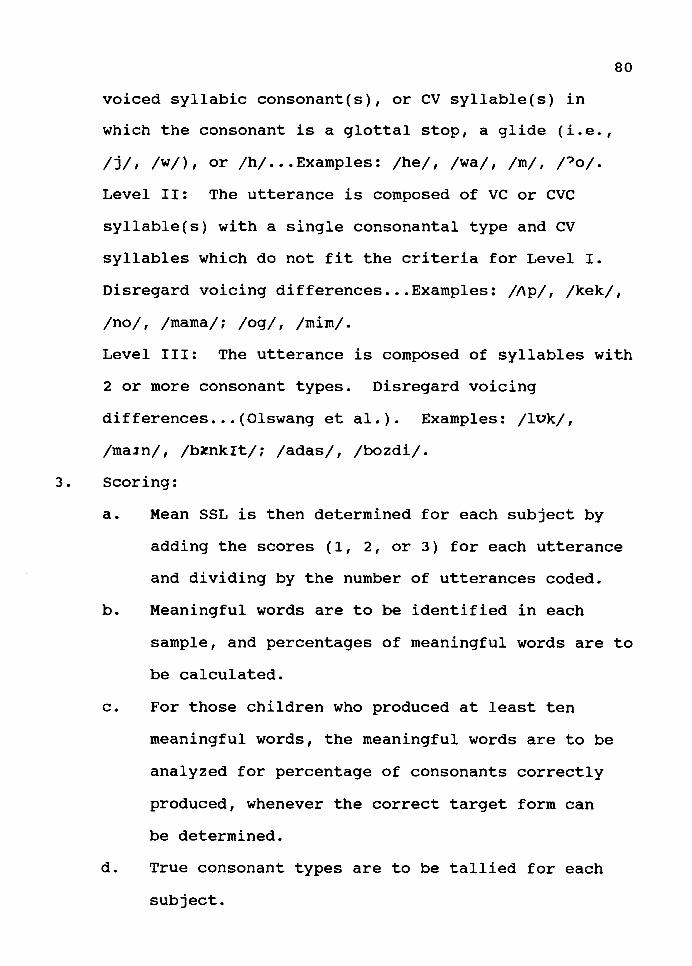
80
voiced syllabic consonant(s), or CV syllable(s) in
which the consonant is a glottal stop, a glide (i.e.,
/j/, /w/), or /h/ •.. Examples: /he/, /wa/, /m/, /?o/.
Level II: The utterance is composed of vc or eve
syllable(s) with a single consonantal type and CV
syllables which do not fit the criteria for Level I.
Disregard voicing differences ••. Examples: /Ap/, /kek/,
/no/, /mama/; /og/, /mim/.
Level III: The utterance is composed of syllables with
2 or more consonant types. Disregard voicing
differences ••. (Olswang et al.). Examples: /lUk/,
/ma1n/, /b~nkit/; /adas/, /bozdi/.
3. Scoring:
a. Mean SSL is then determined for each subject by
adding the scores (1, 2, or 3) for each utterance
and dividing by the number of utterances coded.
b. Meaningful words are to be identified in each
sample, and percentages of meaningful words are to
be calculated.
c. For those children who produced at least ten
meaningful words, the meaningful words are to be
analyzed for percentage of consonants correctly
produced, whenever the correct target form can
be determined.
d. True consonant types are to be tallied for each
subject.
v.tva .t:.::>:.~.rans
i.!l XION:3:dd'i
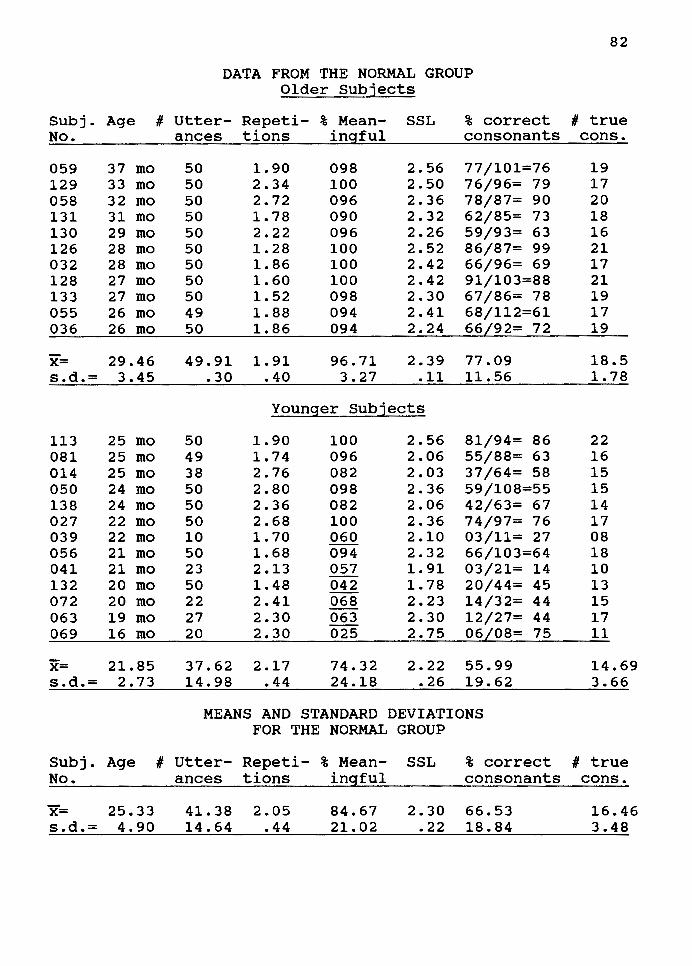
82
DATA FROM THE NORMAL GROUP Older Subjects
Subj. Age # Utter- Repeti- % Mean- SSL % correct # true No. ances tions ingful consonants cons.
059 37 mo 50 1.90 098 2.56 77/101=76 19 129 33 mo 50 2.34 100 2.50 76/96= 79 17 058 32 mo 50 2.72 096 2.36 78/87= 90 20 131 31 mo 50 1.78 090 2.32 62/85= 73 18 130 29 mo 50 2.22 096 2.26 59/93= 63 16 126 28 mo 50 1.28 100 2.52 86/87= 99 21 032 28 mo 50 1.86 100 2.42 66/96= 69 17 128 27 mo 50 1.60 100 2.42 91/103=88 21 133 27 mo 50 1.52 098 2.30 67/86= 78 19 055 26 mo 49 1.88 094 2.41 68/112=61 17 036 26 mo 50 1.86 094 2.24 66L92= 12 19
x= 29.46 49.91 1.91 96.71 2.39 77.09 18.5 s.d.= 3.45 .30 .40 3.27 .11 11.56 1.78
Younger Subjects
113 25 mo 50 1.90 100 2.56 81/94= 86 22 081 25 mo 49 1.74 096 2.06 55/88= 63 16 014 25 mo 38 2.76 082 2.03 37/64= 58 15 050 24 mo 50 2.80 098 2.36 59/108=55 15 138 24 mo 50 2.36 082 2.06 42/63= 67 14 027 22 mo 50 2.68 100 2.36 74/97= 76 17 039 22 mo 10 1.70 060 2.10 03/11= 27 08 056 21 mo 50 1.68 094 2.32 66/103=64 18 041 21 mo 23 2.13 057 1.91 03/21= 14 10 132 20 mo 50 1.48 042 1.78 20/44= 45 13 072 20 mo 22 2.41 068 2.23 14/32= 44 15 063 19 mo 27 2.30 063 2.30 12/27= 44 17 069 16 mo 20 2.30 025 2.75 06L08= 75 11
x= 21.85 37.62 2.17 74.32 2.22 55.99 14.69 s.d.= 2.73 14.98 .44 24.18 .26 19.62 3.66
MEANS AND STANDARD DEVIATIONS FOR THE NORMAL GROUP
Subj. Age # Utter- Repeti- % Mean- SSL % correct # true No. ances tions ing_ful consonants cons.
x= 25.33 41.38 2.05 84.67 2.30 66.53 16.46 s.d.= 4.90 14.64 .44 21.02 .22 18.84 3.48
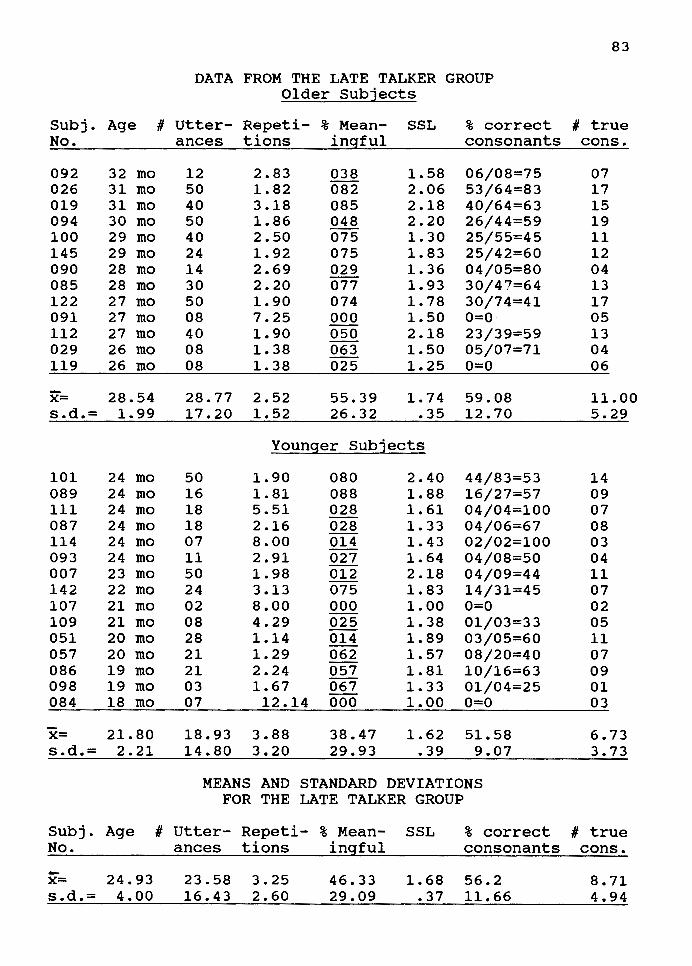
83
DATA FROM THE LATE TALKER GROUP Older Subjects
Subj. Age # Utter- Repeti- % Mean- SSL % correct # true No. ances tions ingful consonants cons.
092 32 mo 12 2.83 038 1.58 06/08=75 07 026 31 mo 50 1.82 082 2.06 53/64=83 17 019 31 mo 40 3.18 085 2.18 40/64=63 15 094 30 mo 50 1.86 048 2.20 26/44=59 19 100 29 mo 40 2.50 075 1.30 25/55=45 11 145 29 mo 24 1.92 075 1.83 25/42=60 12 090 28 mo 14 2.69 029 1.36 04/05=80 04 085 28 mo 30 2.20 077 1.93 30/47=64 13 122 27 mo 50 1.90 074 1. 78 30/74=41 17 091 27 mo 08 7.25 000 1.50 O=O 05 112 27 mo 40 1.90 050 2.18 23/39=59 13 029 26 mo 08 1.38 063 1.50 05/07=71 04 119 26 mo 08 1.38 025 1.25 O=O 06
X= 28.54 28.77 2.52 55.39 1.74 59.08 11.00 s.d.= 1.99 17.20 1.52 26.32 .35 12.70 5.29
Younger Subjects
101 24 mo 50 1.90 080 2.40 44/83=53 14 089 24 mo 16 1.81 088 1.88 16/27=57 09 111 24 mo 18 5.51 028 1.61 04/04=100 07 087 24 mo 18 2.16 028 1. 33 04/06=67 08 114 24 mo 07 8.00 014 1.43 02/02=100 03 093 24 mo 11 2.91 027 1.64 04/08=50 04 007 23 mo 50 1.98 012 2.18 04/09=44 11 142 22 mo 24 3.13 075 1.83 14/31=45 07 107 21 mo 02 8.00 000 1.00 O=O 02 109 21 mo 08 4.29 025 1.38 01/03=33 05 051 20 mo 28 1.14 014 1.89 03/05=60 11 057 20 mo 21 1.29 062 1. 57 08/20=40 07 086 19 mo 21 2.24 057 1.81 10/16=63 09 098 19 mo 03 1.67 067 1.33 01/04=25 01 084 18 mo 07 12.14 000 1.00 O=O 03
X= 21.80 18.93 3.88 38.47 1.62 51.58 6.73 s.d.= 2.21 14.80 3.20 29.93 .39 9.07 3.73
MEANS AND STANDARD DEVIATIONS FOR THE LATE TALKER GROUP
Subj. Age # Utter- Repeti- % Mean- SSL % correct # true No. ances tions ingful consonants cons.
-x= 24.93 23.58 3.25 46.33 1.68 56.2 8.71 s.d.= 4.00 16.43 2.60 29.09 .37 11.66 4.94
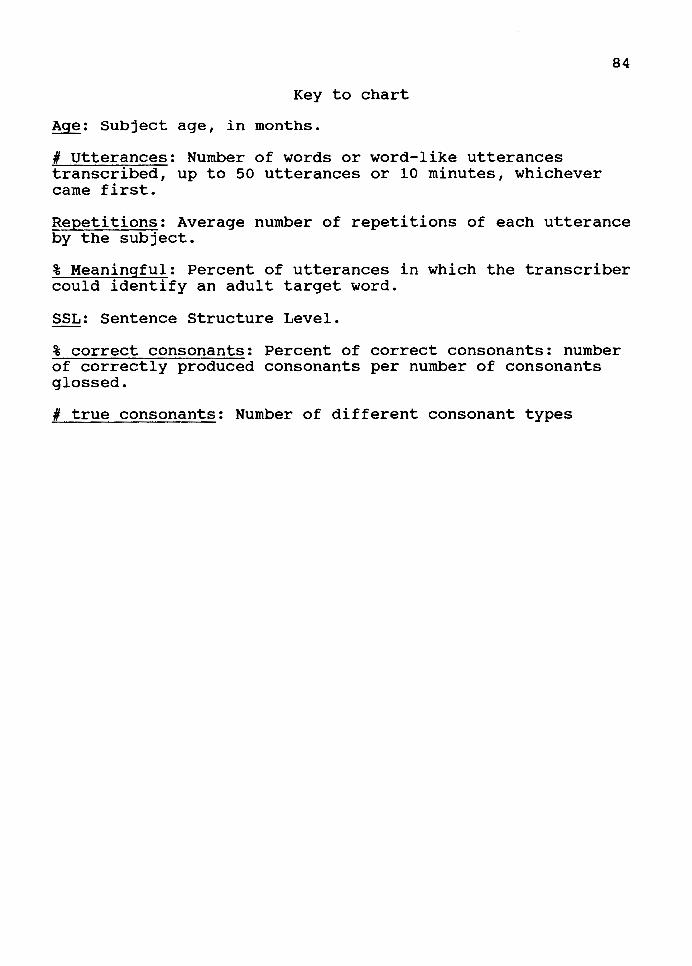
Key to chart
Age: Subject age, in months.
# Utterances: Number of words or word-like utterances transcribed, up to 50 utterances or 10 minutes, whichever came first.
84
Repetitions: Average number of repetitions of each utterance by the subject.
% Meaningful: Percent of utterances in which the transcriber could identify an adult target word.
SSL: Sentence Structure Level.
% correct consonants: Percent of correct consonants: number of correctly produced consonants per number of consonants glossed.
# true consonants: Number of different consonant types
Recommended