A BIOPHYSICALLY DETAILED
MATHEMATICAL MODEL OF A
SINGLE LATE PREGNANT RAT
MYOMETRIAL CELL
A thesis submitted to the University of Manchester
for the degree of Doctor of Philosophy
in the Faculty of Engineering and Physical Sciences
2010
By
Cecilia Choi
School of Physics and Astronomy
Contents
Abstract 11
Declaration 12
Copyright 13
Acknowledgements 14
1 Introduction 15
1.1 Structure of the uterus . . . . . . . . . . . . . . . . . . . . . . . . 16
1.2 Electrical activity and action potential . . . . . . . . . . . . . . . 18
1.3 Cell membrane properties and ionic currents . . . . . . . . . . . . 25
1.4 Ionic channels in myometrium . . . . . . . . . . . . . . . . . . . . 30
1.5 Ionic pumps and exchanger . . . . . . . . . . . . . . . . . . . . . 31
1.6 Calcium handling and uterine contractility . . . . . . . . . . . . . 31
1.7 Patch-clamp experiment . . . . . . . . . . . . . . . . . . . . . . . 37
2 Single uterine cell model development 41
2.1 Membrane current model in myometrium . . . . . . . . . . . . . . 44
2.1.1 Inward currents . . . . . . . . . . . . . . . . . . . . . . . . 48
2.1.1.1 Hyperpolarisation-activated current – Ih . . . . . 48
2.1.1.2 L-type calcium current – ICaL . . . . . . . . . . . 52
2.1.1.3 T-type calcium current – ICaT . . . . . . . . . . 56
2.1.1.4 Fast sodium current – INa . . . . . . . . . . . . . 57
2.1.1.5 Store-operated non-selective cation current – ISOC 60
2.1.2 Outward currents . . . . . . . . . . . . . . . . . . . . . . . 63
2.1.2.1 Delayed rectifying potassium current – IK1 . . . 63
2.1.2.2 Delayed rectifying potassium current – IK2 . . . 67
2
2.1.2.3 A-type transient potassium current – IKA . . . . 70
2.1.2.4 Calcium-activated K+ current – IKCa . . . . . . . 73
2.1.2.5 Background K+ leakage current – IKleak . . . . . 75
2.1.3 Other currents . . . . . . . . . . . . . . . . . . . . . . . . 76
2.1.3.1 Non-selective cation current – INSCC . . . . . . . 76
2.1.3.2 Calcium-activated chloride current – ICl . . . . . 78
2.1.4 Pumps and exchanger currents . . . . . . . . . . . . . . . . 81
2.1.4.1 Calcium pump current – ICapump . . . . . . . . . 81
2.1.4.2 Sodium/Potassium exchanger current – INaK . . 84
2.1.4.3 Sodium/Calcium exchanger current – INaCa . . . 85
2.1.4.4 Sodium-potassium-chloride co-transport current –
INaKCl . . . . . . . . . . . . . . . . . . . . . . . . 88
2.2 Intracellular dynamics and SR . . . . . . . . . . . . . . . . . . . . 89
2.2.1 SR currents, Iup , Itr and Irel . . . . . . . . . . . . . . . . . 89
2.2.2 Ionic balances . . . . . . . . . . . . . . . . . . . . . . . . . 92
2.3 Force production in myometrium . . . . . . . . . . . . . . . . . . 94
2.3.1 Kinetic cross-bridge cycling model in smooth muscles . . . 94
2.3.2 Mechanical production in smooth muscles . . . . . . . . . 99
2.3.2.1 Passive force . . . . . . . . . . . . . . . . . . . . 101
2.3.2.2 Cross-bridge elastic force . . . . . . . . . . . . . . 101
2.3.2.3 Active force . . . . . . . . . . . . . . . . . . . . . 101
2.3.2.4 Series viscoelastic force . . . . . . . . . . . . . . . 103
2.3.2.5 Total force produced by the cell . . . . . . . . . . 103
2.4 Solutions of the model equations . . . . . . . . . . . . . . . . . . . 104
3 Results I – Electrophysiological response 107
3.1 Whole cell membrane current and AP in control condition . . . . 107
3.1.1 [ Ca2+ ]i and ICa−tot responses on repetitive depolarisation . 108
3.2 Whole cell membrane current and AP under estradiol effect . . . . 112
3.3 Behaviour of all the membrane and SR currents during current-clamp114
3.3.1 Ca2+ -related currents . . . . . . . . . . . . . . . . . . . . 114
3.3.2 Na+ -related currents . . . . . . . . . . . . . . . . . . . . . 116
3.3.3 K+ -related currents . . . . . . . . . . . . . . . . . . . . . 116
3.3.4 Other currents . . . . . . . . . . . . . . . . . . . . . . . . 119
3.4 Investigation of AP and total membrane current while inhibiting
individual currents . . . . . . . . . . . . . . . . . . . . . . . . . . 119
3
3.4.1 Inhibiting the inward currents . . . . . . . . . . . . . . . . 119
3.4.2 Inhibiting the outward currents . . . . . . . . . . . . . . . 122
3.4.3 Inhibiting the other currents . . . . . . . . . . . . . . . . . 125
3.5 Different types of AP . . . . . . . . . . . . . . . . . . . . . . . . . 125
4 Results II – Mechanical production 129
4.1 Fractional stress production in myometrium . . . . . . . . . . . . 129
4.2 Single-, twin- and multiple-pulse simulation in myometrium . . . . 130
4.3 Other mechanical responses in a single uterine cell . . . . . . . . . 132
5 Drug actions on [ Ca2+ ]i and force 138
5.1 Properties of [ Ca2+ ]i transient in myometrial cells . . . . . . . . . 138
5.1.1 Depolarising pulse with varying magnitude . . . . . . . . . 139
5.1.2 Carboxyeosin, CE . . . . . . . . . . . . . . . . . . . . . . . 139
5.1.3 Nifedipine, NI . . . . . . . . . . . . . . . . . . . . . . . . . 141
5.1.4 Ryanodine, Ry . . . . . . . . . . . . . . . . . . . . . . . . 143
5.2 Properties of contractile force in myometrial cells . . . . . . . . . 145
5.2.1 Carbachol, CCh . . . . . . . . . . . . . . . . . . . . . . . . 147
5.2.2 Cyclopiazonic acid, CPA . . . . . . . . . . . . . . . . . . . 149
5.2.3 Nifedipine, NI . . . . . . . . . . . . . . . . . . . . . . . . . 151
5.2.4 Wortmannin, W . . . . . . . . . . . . . . . . . . . . . . . . 151
5.2.5 Calcium-free solution . . . . . . . . . . . . . . . . . . . . . 154
6 Sensitivity analysis 156
6.1 Cell area to volume ratio . . . . . . . . . . . . . . . . . . . . . . . 157
6.2 Length of the myometrial cell . . . . . . . . . . . . . . . . . . . . 158
6.3 Current density of ICa−tot . . . . . . . . . . . . . . . . . . . . . . 161
6.4 Current density of INa−tot . . . . . . . . . . . . . . . . . . . . . . 163
6.5 Current density of IK−tot . . . . . . . . . . . . . . . . . . . . . . . 165
6.6 Myosin light chain kinase . . . . . . . . . . . . . . . . . . . . . . . 169
7 1-D strand model in myometrium 171
7.1 Introduction . . . . . . . . . . . . . . . . . . . . . . . . . . . . . . 171
7.2 1-D strand model development . . . . . . . . . . . . . . . . . . . . 172
7.3 Results . . . . . . . . . . . . . . . . . . . . . . . . . . . . . . . . . 174
4
8 Discussion 178
8.1 Whole cell membrane, SR currents model . . . . . . . . . . . . . . 178
8.2 Electrophysiological responses . . . . . . . . . . . . . . . . . . . . 180
8.2.1 Cell dynamics in control condition . . . . . . . . . . . . . . 180
8.2.1.1 Repetitive depolarisation . . . . . . . . . . . . . . 181
8.2.2 Cell dynamics under estradiol condition . . . . . . . . . . . 181
8.2.3 Inhibiting individual current . . . . . . . . . . . . . . . . . 182
8.3 Cell mechanics and force generation . . . . . . . . . . . . . . . . . 183
8.4 Drug actions . . . . . . . . . . . . . . . . . . . . . . . . . . . . . . 184
8.5 Sensitivity Analysis . . . . . . . . . . . . . . . . . . . . . . . . . . 186
8.6 1-D strand . . . . . . . . . . . . . . . . . . . . . . . . . . . . . . . 188
8.7 Model limitations . . . . . . . . . . . . . . . . . . . . . . . . . . . 189
8.7.1 Mixing species and tissues data . . . . . . . . . . . . . . . 189
8.7.2 Stretch-induced effects on myometrium . . . . . . . . . . . 189
8.7.3 Spatial heterogeneity . . . . . . . . . . . . . . . . . . . . . 190
8.7.4 Addition force generation pathways . . . . . . . . . . . . . 190
8.7.5 1-D strand . . . . . . . . . . . . . . . . . . . . . . . . . . . 191
9 Future plan 192
9.1 Single cell level . . . . . . . . . . . . . . . . . . . . . . . . . . . . 192
9.2 Tissue level . . . . . . . . . . . . . . . . . . . . . . . . . . . . . . 193
Bibliography 194
A Single cell uterine model 220
A.1 Model Equations – Membrane currents and Sarcoplasmic reticulum
control . . . . . . . . . . . . . . . . . . . . . . . . . . . . . . . . . 220
A.2 Model Equations – Kinetic cross-bridge model and force generation 234
A.3 Parameter values for ionic currents . . . . . . . . . . . . . . . . . 236
A.4 Parameter values for force conctracion and 1-D strand model . . . 239
A.5 Other parameter values . . . . . . . . . . . . . . . . . . . . . . . . 241
A.6 Initial values . . . . . . . . . . . . . . . . . . . . . . . . . . . . . . 242
5
List of Tables
1.1 Dimensional changes of the human uterus during pregnancy. . . . 16
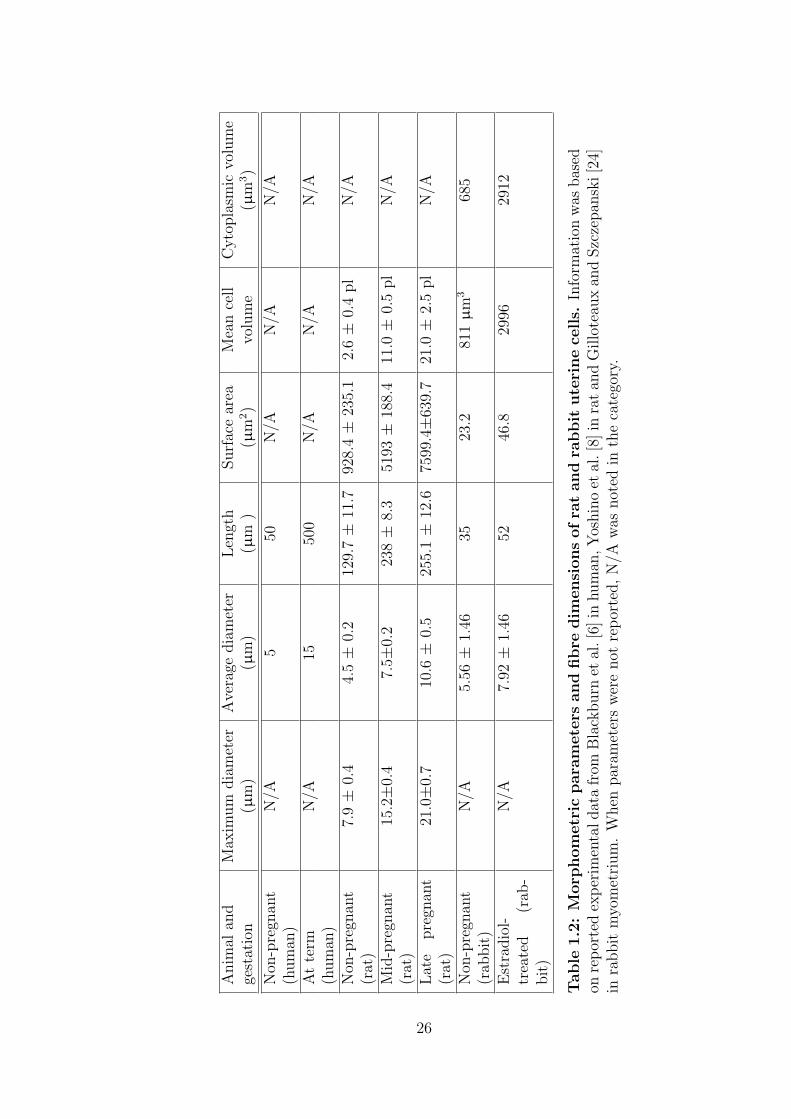
1.2 Morphometric parameters and fibre dimensions of rat and rabbit
uterine cells . . . . . . . . . . . . . . . . . . . . . . . . . . . . . . 26
1.3 Ionic concentration inside and outside myometrial cells . . . . . . 27
1.4 Selected ionic channels expressed in myometrium with their prop-
erties. . . . . . . . . . . . . . . . . . . . . . . . . . . . . . . . . . 32
1.5 [ Ca2+ ]i transient in pregnant human and rat myometrium . . . . 33
1.6 A structural and functional comparison of skeletal, cardiac and
smooth muscle in human. . . . . . . . . . . . . . . . . . . . . . . 39
2.1 Parameter values of Ih . . . . . . . . . . . . . . . . . . . . . . . . 51
2.2 Parameter values of ICaL . . . . . . . . . . . . . . . . . . . . . . . 54
2.3 Parameter values of ICaT . . . . . . . . . . . . . . . . . . . . . . . 57
2.4 The comparison of electrophysiological parameters between rat and
human myometrium for INa . . . . . . . . . . . . . . . . . . . . . . 59
2.5 Parameter values of INa . . . . . . . . . . . . . . . . . . . . . . . 60
2.6 Parameter values of ISOC . . . . . . . . . . . . . . . . . . . . . . 62
2.7 Parameter values of IK1 . . . . . . . . . . . . . . . . . . . . . . . 65
2.8 Parameter values of IK2 . . . . . . . . . . . . . . . . . . . . . . . 68
2.9 Parameter values of IKA . . . . . . . . . . . . . . . . . . . . . . . 71
2.10 Parameter values of IKCa . . . . . . . . . . . . . . . . . . . . . . . 74
2.11 Parameter values of IKleak . . . . . . . . . . . . . . . . . . . . . . 75
2.12 Parameter values of INSCC . . . . . . . . . . . . . . . . . . . . . . 78
2.13 Parameter values of ICl . . . . . . . . . . . . . . . . . . . . . . . 81
2.14 Characteristics of the major myometrial currents. . . . . . . . . . 83
2.15 Parameter values of ICapump . . . . . . . . . . . . . . . . . . . . . 84
2.16 Parameter values of INaK . . . . . . . . . . . . . . . . . . . . . . 85
2.17 Parameter values of INaCa . . . . . . . . . . . . . . . . . . . . . . 87
6
2.18 Parameter values of INaKCl . . . . . . . . . . . . . . . . . . . . . . 89
2.19 Parameter values of Iup , Itr , Irel . . . . . . . . . . . . . . . . . . 91
2.20 Parameter values of ryanodine receptor . . . . . . . . . . . . . . . 92
2.21 Parameter values of the ionic balances . . . . . . . . . . . . . . . 93
2.22 Parameter values of the kinetic cross-brodge cycling model . . . . 98
2.23 Parameter values of the mechanical model . . . . . . . . . . . . . 105
3.1 Changes made to stimulate estradiol effect. . . . . . . . . . . . . . 114
3.2 Parameters changed in producing various types of AP. . . . . . . 127
6.1 Values of peak [ Ca2+ ]i and total force, time to reach the peak of
[ Ca2+ ]i and total force and [ Ca2+ ]i and force in 3 s produced by
the model in control condition. . . . . . . . . . . . . . . . . . . . 157
6.2 Numerical changes of [ Ca2+ ]i transient and total force with chang-
ing cell area to volume ratio in the sensitivity analysis. . . . . . . 160
6.3 Numerical changes of total force with changing lengths of a my-
ometrial cell. . . . . . . . . . . . . . . . . . . . . . . . . . . . . . 161
6.4 Numerical changes of both [ Ca2+ ]i transient and total force with
changing values of IK−tot . . . . . . . . . . . . . . . . . . . . . . . 163
6.5 Numerical changes of both [ Ca2+ ]i transient and total force with
changing values of INa−tot . . . . . . . . . . . . . . . . . . . . . . . 165
6.6 Numerical changes of [ Ca2+ ]i transient and total force with various
values of INa−tot . . . . . . . . . . . . . . . . . . . . . . . . . . . . 167
6.7 Numerical changes of total force with changing level of MLCK in
the sensitivity analysis. . . . . . . . . . . . . . . . . . . . . . . . . 169
7.1 Parameter values of 1-D strand. . . . . . . . . . . . . . . . . . . . 174
7.2 Comparison of conduction velocities in rat and human from various
gestation. . . . . . . . . . . . . . . . . . . . . . . . . . . . . . . . 177
A.1 Parameter values on ionic currents . . . . . . . . . . . . . . . . . 238
A.2 Parameter values on force contraction and 1-D strand model. . . . 240
A.3 Other parameter used in the model . . . . . . . . . . . . . . . . . 241
A.4 Initial condition values . . . . . . . . . . . . . . . . . . . . . . . . 243
7
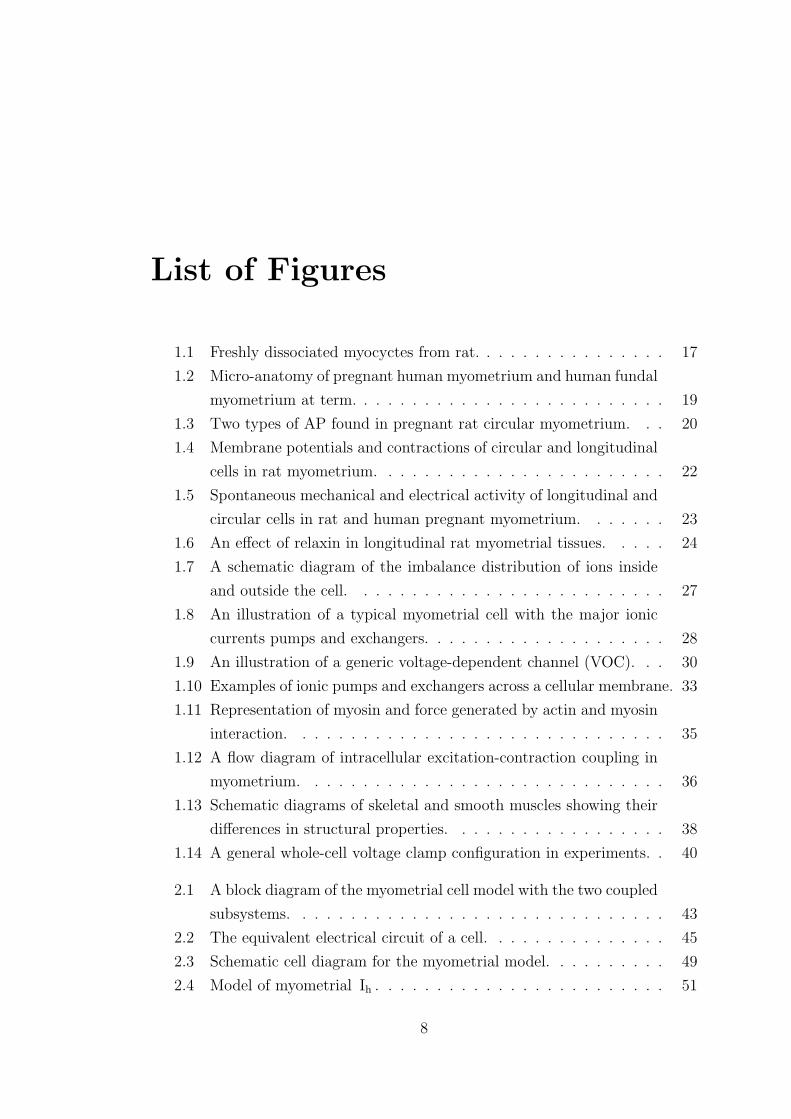
List of Figures
1.1 Freshly dissociated myocyctes from rat. . . . . . . . . . . . . . . . 17
1.2 Micro-anatomy of pregnant human myometrium and human fundal
myometrium at term. . . . . . . . . . . . . . . . . . . . . . . . . . 19
1.3 Two types of AP found in pregnant rat circular myometrium. . . 20
1.4 Membrane potentials and contractions of circular and longitudinal
cells in rat myometrium. . . . . . . . . . . . . . . . . . . . . . . . 22
1.5 Spontaneous mechanical and electrical activity of longitudinal and
circular cells in rat and human pregnant myometrium. . . . . . . 23
1.6 An effect of relaxin in longitudinal rat myometrial tissues. . . . . 24
1.7 A schematic diagram of the imbalance distribution of ions inside
and outside the cell. . . . . . . . . . . . . . . . . . . . . . . . . . 27
1.8 An illustration of a typical myometrial cell with the major ionic
currents pumps and exchangers. . . . . . . . . . . . . . . . . . . . 28
1.9 An illustration of a generic voltage-dependent channel (VOC). . . 30
1.10 Examples of ionic pumps and exchangers across a cellular membrane. 33
1.11 Representation of myosin and force generated by actin and myosin
interaction. . . . . . . . . . . . . . . . . . . . . . . . . . . . . . . 35
1.12 A flow diagram of intracellular excitation-contraction coupling in
myometrium. . . . . . . . . . . . . . . . . . . . . . . . . . . . . . 36
1.13 Schematic diagrams of skeletal and smooth muscles showing their
differences in structural properties. . . . . . . . . . . . . . . . . . 38
1.14 A general whole-cell voltage clamp configuration in experiments. . 40
2.1 A block diagram of the myometrial cell model with the two coupled
subsystems. . . . . . . . . . . . . . . . . . . . . . . . . . . . . . . 43
2.2 The equivalent electrical circuit of a cell. . . . . . . . . . . . . . . 45
2.3 Schematic cell diagram for the myometrial model. . . . . . . . . . 49
2.4 Model of myometrial Ih . . . . . . . . . . . . . . . . . . . . . . . . 51
8
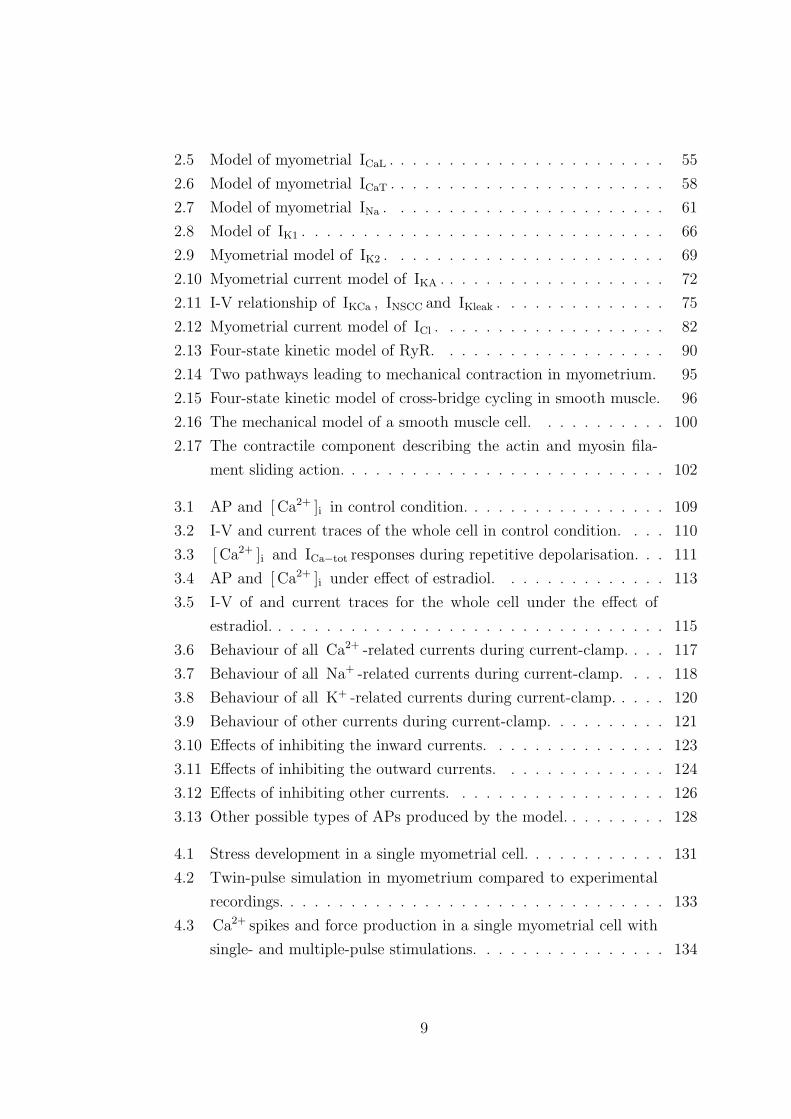
2.5 Model of myometrial ICaL . . . . . . . . . . . . . . . . . . . . . . . 55
2.6 Model of myometrial ICaT . . . . . . . . . . . . . . . . . . . . . . . 58
2.7 Model of myometrial INa . . . . . . . . . . . . . . . . . . . . . . . 61
2.8 Model of IK1 . . . . . . . . . . . . . . . . . . . . . . . . . . . . . . 66
2.9 Myometrial model of IK2 . . . . . . . . . . . . . . . . . . . . . . . 69
2.10 Myometrial current model of IKA . . . . . . . . . . . . . . . . . . . 72
2.11 I-V relationship of IKCa , INSCC and IKleak . . . . . . . . . . . . . . 75
2.12 Myometrial current model of ICl . . . . . . . . . . . . . . . . . . . 82
2.13 Four-state kinetic model of RyR. . . . . . . . . . . . . . . . . . . 90
2.14 Two pathways leading to mechanical contraction in myometrium. 95
2.15 Four-state kinetic model of cross-bridge cycling in smooth muscle. 96
2.16 The mechanical model of a smooth muscle cell. . . . . . . . . . . 100
2.17 The contractile component describing the actin and myosin fila-
ment sliding action. . . . . . . . . . . . . . . . . . . . . . . . . . . 102
3.1 AP and [ Ca2+ ]i in control condition. . . . . . . . . . . . . . . . . 109
3.2 I-V and current traces of the whole cell in control condition. . . . 110
3.3 [ Ca2+ ]i and ICa−tot responses during repetitive depolarisation. . . 111
3.4 AP and [ Ca2+ ]i under effect of estradiol. . . . . . . . . . . . . . 113
3.5 I-V of and current traces for the whole cell under the effect of
estradiol. . . . . . . . . . . . . . . . . . . . . . . . . . . . . . . . . 115
3.6 Behaviour of all Ca2+ -related currents during current-clamp. . . . 117
3.7 Behaviour of all Na+ -related currents during current-clamp. . . . 118
3.8 Behaviour of all K+ -related currents during current-clamp. . . . . 120
3.9 Behaviour of other currents during current-clamp. . . . . . . . . . 121
3.10 Effects of inhibiting the inward currents. . . . . . . . . . . . . . . 123
3.11 Effects of inhibiting the outward currents. . . . . . . . . . . . . . 124
3.12 Effects of inhibiting other currents. . . . . . . . . . . . . . . . . . 126
3.13 Other possible types of APs produced by the model. . . . . . . . . 128
4.1 Stress development in a single myometrial cell. . . . . . . . . . . . 131
4.2 Twin-pulse simulation in myometrium compared to experimental
recordings. . . . . . . . . . . . . . . . . . . . . . . . . . . . . . . . 133
4.3 Ca2+ spikes and force production in a single myometrial cell with
single- and multiple-pulse stimulations. . . . . . . . . . . . . . . . 134
9
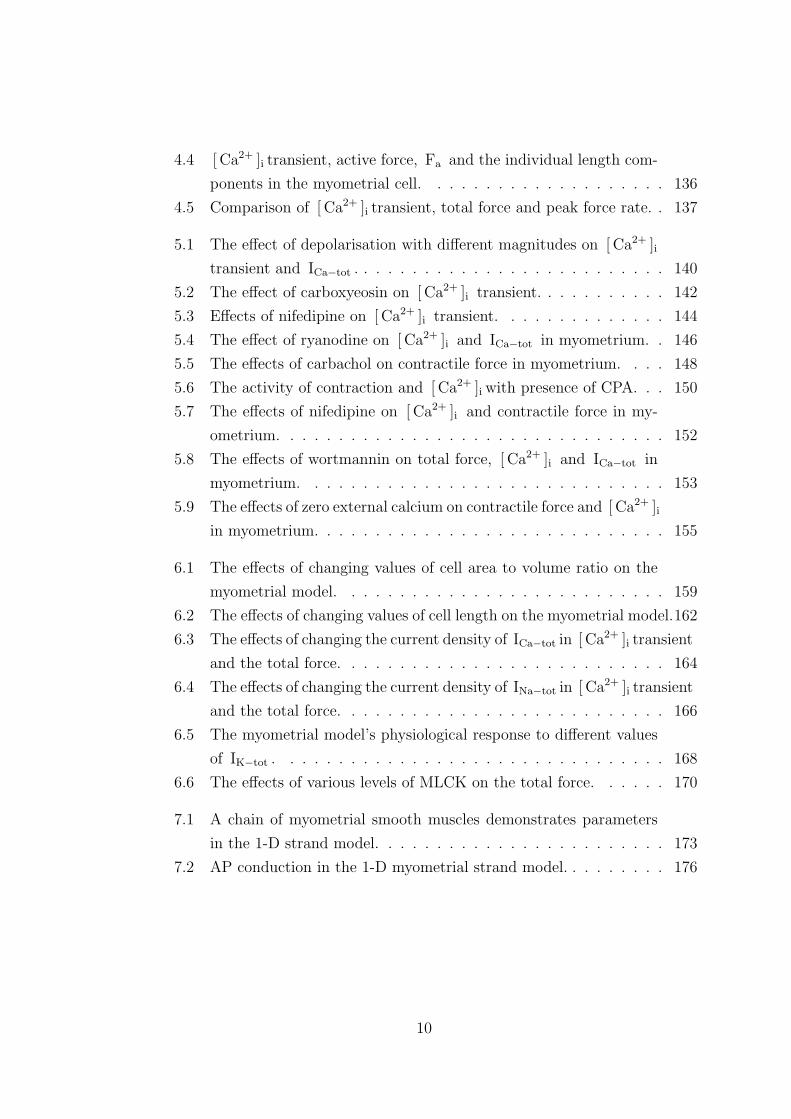
4.4 [ Ca2+ ]i transient, active force, Fa and the individual length com-
ponents in the myometrial cell. . . . . . . . . . . . . . . . . . . . 136
4.5 Comparison of [ Ca2+ ]i transient, total force and peak force rate. . 137
5.1 The effect of depolarisation with different magnitudes on [ Ca2+ ]i
transient and ICa−tot . . . . . . . . . . . . . . . . . . . . . . . . . . 140
5.2 The effect of carboxyeosin on [ Ca2+ ]i transient. . . . . . . . . . . 142
5.3 Effects of nifedipine on [ Ca2+ ]i transient. . . . . . . . . . . . . . 144
5.4 The effect of ryanodine on [ Ca2+ ]i and ICa−tot in myometrium. . 146
5.5 The effects of carbachol on contractile force in myometrium. . . . 148
5.6 The activity of contraction and [ Ca2+ ]i with presence of CPA. . . 150
5.7 The effects of nifedipine on [ Ca2+ ]i and contractile force in my-
ometrium. . . . . . . . . . . . . . . . . . . . . . . . . . . . . . . . 152
5.8 The effects of wortmannin on total force, [ Ca2+ ]i and ICa−tot in
myometrium. . . . . . . . . . . . . . . . . . . . . . . . . . . . . . 153
5.9 The effects of zero external calcium on contractile force and [ Ca2+ ]i
in myometrium. . . . . . . . . . . . . . . . . . . . . . . . . . . . . 155
6.1 The effects of changing values of cell area to volume ratio on the
myometrial model. . . . . . . . . . . . . . . . . . . . . . . . . . . 159
6.2 The effects of changing values of cell length on the myometrial model.162
6.3 The effects of changing the current density of ICa−tot in [ Ca2+ ]i transient
and the total force. . . . . . . . . . . . . . . . . . . . . . . . . . . 164
6.4 The effects of changing the current density of INa−tot in [ Ca2+ ]i transient
and the total force. . . . . . . . . . . . . . . . . . . . . . . . . . . 166
6.5 The myometrial model’s physiological response to different values
of IK−tot . . . . . . . . . . . . . . . . . . . . . . . . . . . . . . . . 168
6.6 The effects of various levels of MLCK on the total force. . . . . . 170
7.1 A chain of myometrial smooth muscles demonstrates parameters
in the 1-D strand model. . . . . . . . . . . . . . . . . . . . . . . . 173
7.2 AP conduction in the 1-D myometrial strand model. . . . . . . . . 176
10
Abstract
While premature birth is still one of the major clinical problems worldwide, the
exact physiological mechanisms underlying myometrium activity during preg-
nancy remain unclear. In this thesis, a novel biophysically detailed model was
constructed using available experimental data to simulate chemical, electrical and
mechanical activity in a late pregnant rat uterine myocycte. The developed model
has been used to elucidate the ionic mechanism underlying myometrium function-
ality, providing better insights in the function of the uterus during pregnancy. The
model consisted of 15 membrane currents, intracellular calcium handling process
coupled with a sliding actin-myosin filament mechanical model to describe uter-
ine behaviour and contractile activity at the single myocyte level. Each of the
ionic currents were modelled using Hodgkin-Huxley-type equations. The simu-
lated current traces and current-voltage curves were validated with experimental
recordings and the model was further validated by the ability to produce a burst-
ing action potential (AP) during an external stimulus. The model replicated the
effects of estradiol during pregnancy, modulating the amplitude and activation
properties of individual Ca2+ and K+ currents, therefore altering the AP config-
uration to a tonic-like plateau. The model also reproduced the actions of drugs
to inhibit certain channels to investigate their roles in myometrium. Sensitivity
analysis was performed to examine the model’s behaviour to changing parameters.
A simple 1-D study was conducted to investigate how electrical signals propagate
along strand of cells. Although the model successfully replicated results similar
to recordings seen in the experiments, limitations have to be addressed and more
studies have to be carried out to further improve the model.
11

Declaration
No portion of the work referred to in this thesis has been
submitted in support of an application for another degree
or qualification of this or any other university or other
institute of learning.
12
Copyright
i. The author of this thesis (including any appendices and/or schedules to this
thesis) owns any copyright in it (the “Copyright”) and s/he has given The
University of Manchester the right to use such Copyright for any adminis-
trative, promotional, educational and/or teaching purposes.
ii. Copies of this thesis, either in full or in extracts, may be made only in
accordance with the regulations of the John Rylands University Library of
Manchester. Details of these regulations may be obtained from the Librar-
ian. This page must form part of any such copies made.
iii. The ownership of any patents, designs, trade marks and any and all other
intellectual property rights except for the Copyright (the “Intellectual Prop-
erty Rights”) and any reproductions of copyright works, for example graphs
and tables (“Reproductions”), which may be described in this thesis, may
not be owned by the author and may be owned by third parties. Such Intel-
lectual Property Rights and Reproductions cannot and must not be made
available for use without the prior written permission of the owner(s) of the
relevant Intellectual Property Rights and/or Reproductions.
iv. Further information on the conditions under which disclosure, publication
and exploitation of this thesis, the Copyright and any Intellectual Property
Rights and/or Reproductions described in it may take place is available
from the Head of School of Physics and Astronomy (or the Vice-President).
13

Acknowledgements
I would like to thank my grandad who always inspired and encouraged me to
do great things and never stopped believing in me. I am forever indebted to my
grandma who raised me and supported me throughout everything.
I greatly appreciate and sincerely thank my supervisor Prof. Henggui Zhang
for giving me the opportunity to participate in this exciting project, and Dr.
Winnie Tong who helped and guided me during my study.
I am extremely grateful to my best friends Chris, Sarah, Penny and Judy who
have always been there when I needed them despite us living 6000 miles apart.
Finally I’d like to thank Philip Stewart who I met the first day of my Ph.D
and is now my husband. He helped me through my difficult times and put up
with my tantrums without ever complaining. This thesis would not have been
possible without his love and continuous support.
14
Chapter 1
Introduction
The control of myometrium excitability is vital during pregnancy. It is a highly
complex phenomenon which involves hormonal, structural, electrical and contrac-
tility changes throughout the gestation period. The activity of the myometrium
is relatively quiescent during early and mid pregnancy to accommodate develop-
ment and growth of the foetus. The contractions of the myometrium remains weak
and unsynchronised, however the contractions progressively increase in strength
towards the end of pregnancy. During labour, strong, powerful contractions occur
to dilate the cervix and expel the foetus and placenta [1]. Therefore, a successful
delivery almost entirely depends on the control of the myometrium towards the
latter stages of gestation. If these functions are not performed perfectly, it can
lead to important therapeutic implications since myometrial dysfunction is be-
lieved to be a cause of pre-term labour or dystocica [2], and premature labour is a
major cause of mortality, neonatal handicap and morbidity. It is a serious health
and financial burden to families and society. Despite extensive studies and ad-
vances in medical care developed in recent years, pre-term delivery has remained
constant at around 6-10 % of total live births in the UK [3, 4]. Myometrium
contraction failure occurs in 4-8 % of all labour and can lead to emergency cae-
sarean section which puts both the mother and the baby at risk [5]. It has
been estimated that neonatal intensive care for babies weighing less than 1500 g
costs the NHS between £42 and £72 million every year [2]. Understanding the
mechanisms and fundamental processes underlying myometrial function can help
to prevent or treat uterine dysfunction, therefore benefiting women, babies and
families worldwide.
15
1.1 Structure of the uterus
Mammalian uteri undergo enormous changes during and also after pregnancy.
The weight and the capacity of the organ can increase more than 10 and 500
fold, respectively at term [6]. Uterine cells hypertrophies during pregnancy to
adapt to the growth of the foetus and reduce back to their original size after
parturition. The details of the uterine changes occurring before the pregnancy
and at term in human are listed in table 1.1. The volume of a pregnant human
uterus at term is about 4000 to 4500 cm3. It is an elongated ellipsoid shape with
vertical and horizontal diameters of approximately 38 cm and 14 cm, respectively.
The surface area of the whole organ is about 11788 cm2 at term. However, when
the infant has descended only 2 cm, the surface area of the uterus decreases to
9330 cm2 (80 % of term value). The surface area of the organ massively decreases
to only 8000 cm2 (68 % of term value) immediately following delivery [7].
Gestation Weight Dimensions∗ Capacity Total intrauterine(g) (cm) (mL) volume (cm3)
Non-pregnant 50-70 7.5×5×2.5 10 <300 in earlypregnancy
At term 80-1200 20×25×22.5 5000 4500
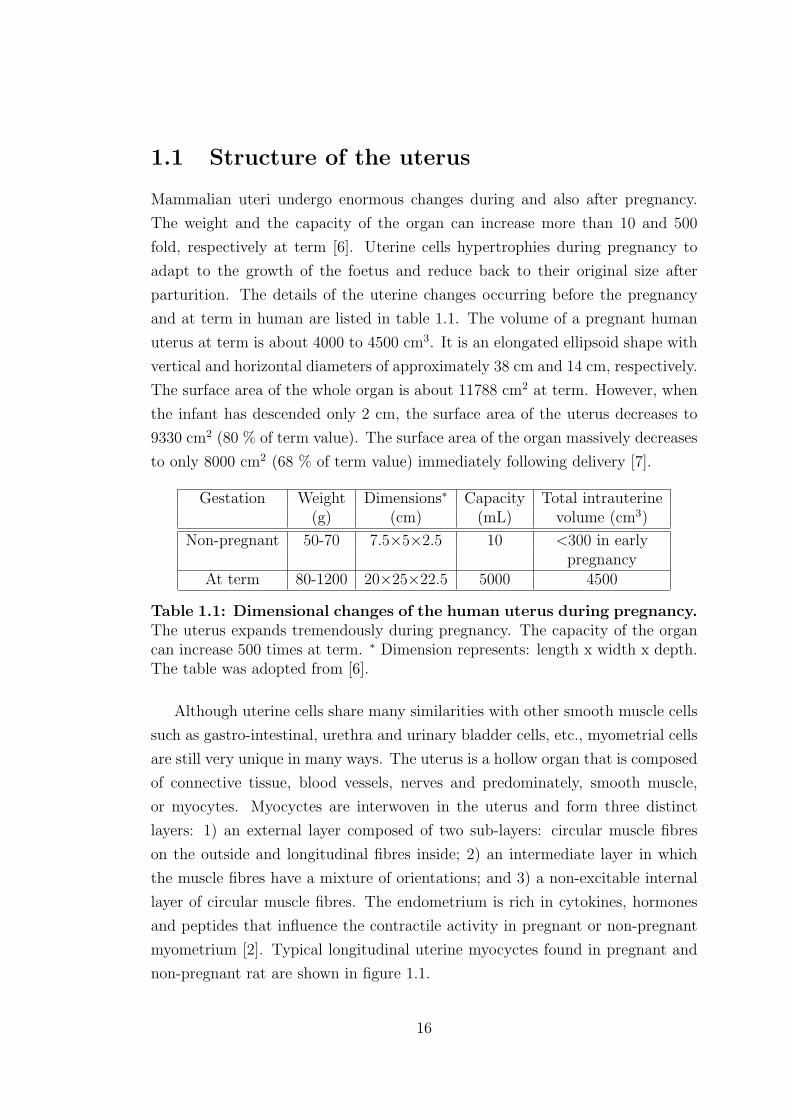
Table 1.1: Dimensional changes of the human uterus during pregnancy.The uterus expands tremendously during pregnancy. The capacity of the organcan increase 500 times at term. ∗ Dimension represents: length x width x depth.The table was adopted from [6].
Although uterine cells share many similarities with other smooth muscle cells
such as gastro-intestinal, urethra and urinary bladder cells, etc., myometrial cells
are still very unique in many ways. The uterus is a hollow organ that is composed
of connective tissue, blood vessels, nerves and predominately, smooth muscle,
or myocytes. Myocyctes are interwoven in the uterus and form three distinct
layers: 1) an external layer composed of two sub-layers: circular muscle fibres
on the outside and longitudinal fibres inside; 2) an intermediate layer in which
the muscle fibres have a mixture of orientations; and 3) a non-excitable internal
layer of circular muscle fibres. The endometrium is rich in cytokines, hormones
and peptides that influence the contractile activity in pregnant or non-pregnant
myometrium [2]. Typical longitudinal uterine myocyctes found in pregnant and
non-pregnant rat are shown in figure 1.1.
16
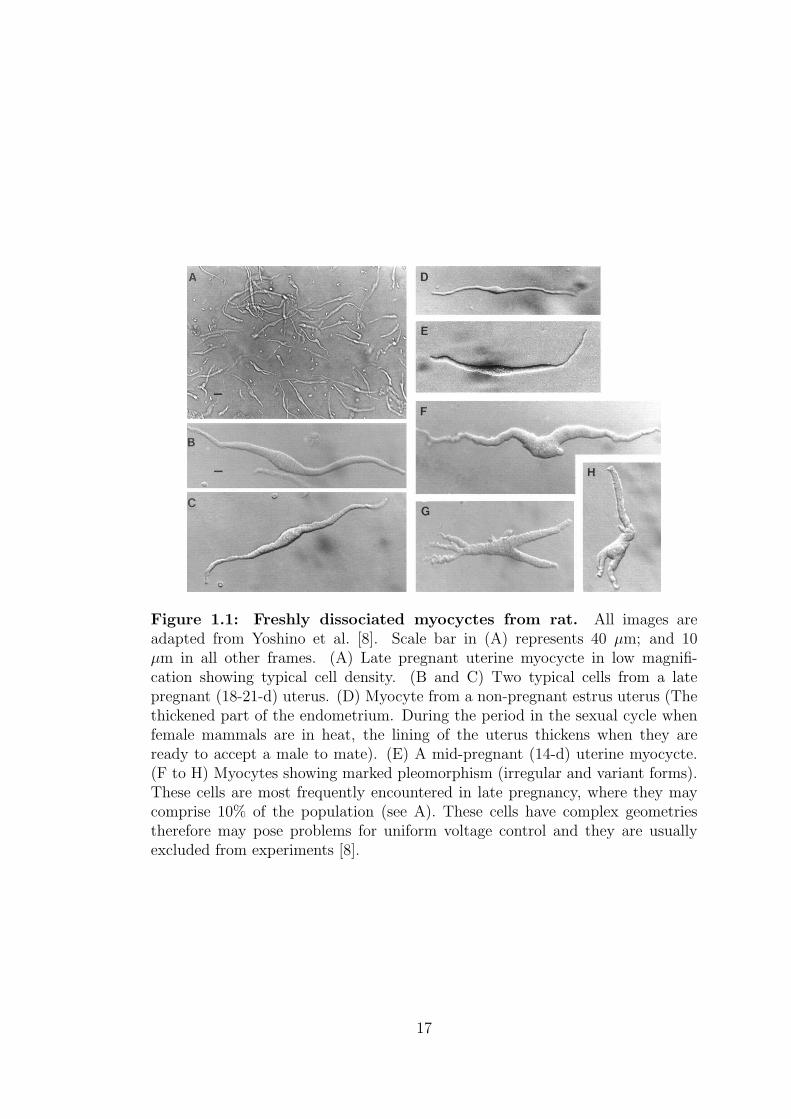
Figure 1.1: Freshly dissociated myocyctes from rat. All images areadapted from Yoshino et al. [8]. Scale bar in (A) represents 40 µm; and 10µm in all other frames. (A) Late pregnant uterine myocycte in low magnifi-cation showing typical cell density. (B and C) Two typical cells from a latepregnant (18-21-d) uterus. (D) Myocyte from a non-pregnant estrus uterus (Thethickened part of the endometrium. During the period in the sexual cycle whenfemale mammals are in heat, the lining of the uterus thickens when they areready to accept a male to mate). (E) A mid-pregnant (14-d) uterine myocycte.(F to H) Myocytes showing marked pleomorphism (irregular and variant forms).These cells are most frequently encountered in late pregnancy, where they maycomprise 10% of the population (see A). These cells have complex geometriestherefore may pose problems for uniform voltage control and they are usuallyexcluded from experiments [8].
17
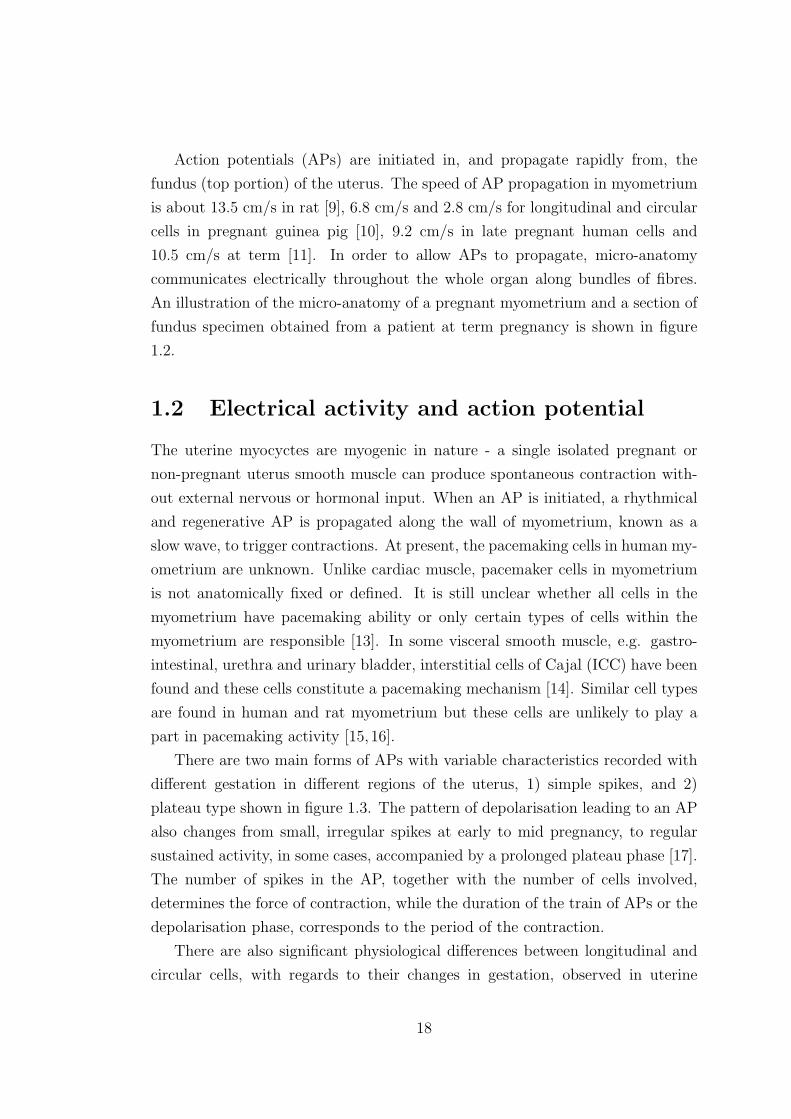
Action potentials (APs) are initiated in, and propagate rapidly from, the
fundus (top portion) of the uterus. The speed of AP propagation in myometrium
is about 13.5 cm/s in rat [9], 6.8 cm/s and 2.8 cm/s for longitudinal and circular
cells in pregnant guinea pig [10], 9.2 cm/s in late pregnant human cells and
10.5 cm/s at term [11]. In order to allow APs to propagate, micro-anatomy
communicates electrically throughout the whole organ along bundles of fibres.
An illustration of the micro-anatomy of a pregnant myometrium and a section of
fundus specimen obtained from a patient at term pregnancy is shown in figure
1.2.
1.2 Electrical activity and action potential
The uterine myocyctes are myogenic in nature - a single isolated pregnant or
non-pregnant uterus smooth muscle can produce spontaneous contraction with-
out external nervous or hormonal input. When an AP is initiated, a rhythmical
and regenerative AP is propagated along the wall of myometrium, known as a
slow wave, to trigger contractions. At present, the pacemaking cells in human my-
ometrium are unknown. Unlike cardiac muscle, pacemaker cells in myometrium
is not anatomically fixed or defined. It is still unclear whether all cells in the
myometrium have pacemaking ability or only certain types of cells within the
myometrium are responsible [13]. In some visceral smooth muscle, e.g. gastro-
intestinal, urethra and urinary bladder, interstitial cells of Cajal (ICC) have been
found and these cells constitute a pacemaking mechanism [14]. Similar cell types
are found in human and rat myometrium but these cells are unlikely to play a
part in pacemaking activity [15,16].
There are two main forms of APs with variable characteristics recorded with
different gestation in different regions of the uterus, 1) simple spikes, and 2)
plateau type shown in figure 1.3. The pattern of depolarisation leading to an AP
also changes from small, irregular spikes at early to mid pregnancy, to regular
sustained activity, in some cases, accompanied by a prolonged plateau phase [17].
The number of spikes in the AP, together with the number of cells involved,
determines the force of contraction, while the duration of the train of APs or the
depolarisation phase, corresponds to the period of the contraction.
There are also significant physiological differences between longitudinal and
circular cells, with regards to their changes in gestation, observed in uterine
18
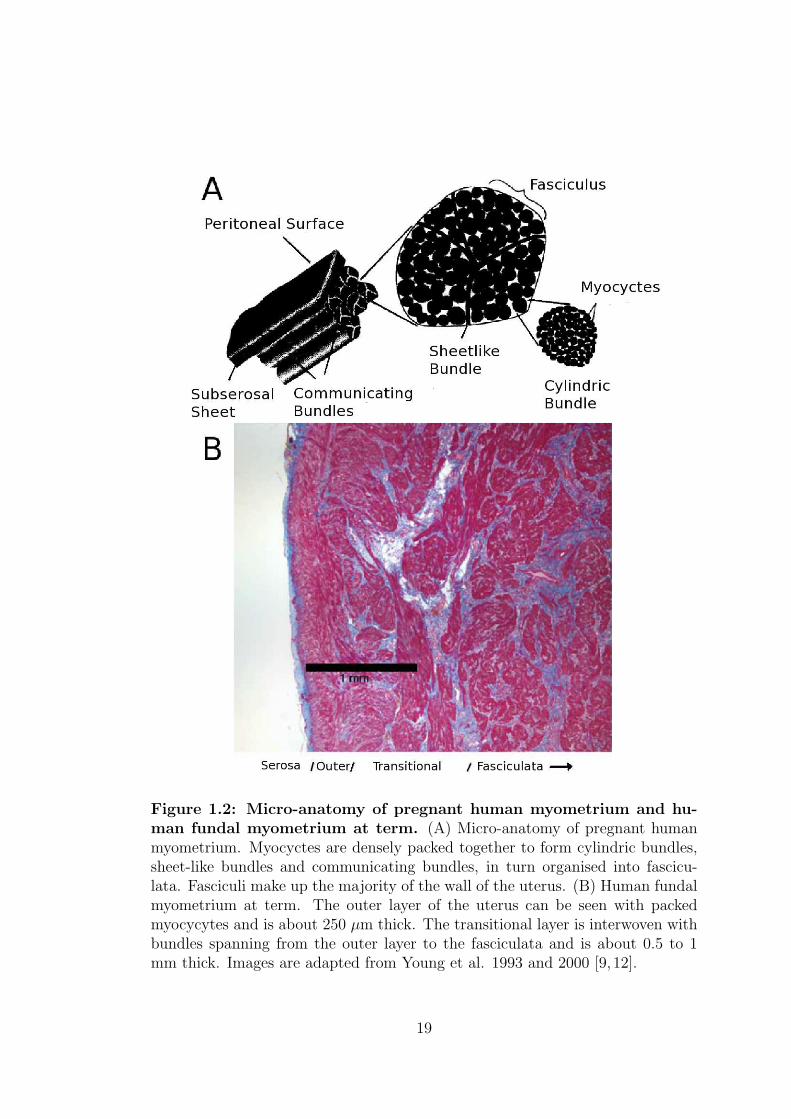
Figure 1.2: Micro-anatomy of pregnant human myometrium and hu-man fundal myometrium at term. (A) Micro-anatomy of pregnant humanmyometrium. Myocyctes are densely packed together to form cylindric bundles,sheet-like bundles and communicating bundles, in turn organised into fascicu-lata. Fasciculi make up the majority of the wall of the uterus. (B) Human fundalmyometrium at term. The outer layer of the uterus can be seen with packedmyocycytes and is about 250 µm thick. The transitional layer is interwoven withbundles spanning from the outer layer to the fasciculata and is about 0.5 to 1mm thick. Images are adapted from Young et al. 1993 and 2000 [9, 12].
19
Figure 1.3: Two types of AP found in pregnant rat circular my-ometrium. During early to mid-pregnancy, circular myometrium display a singleplateau-type AP. The shape of the AP then changes to a repetitive, spike-like APat late pregnancy to term. Image adapted from Wilde and Marshall [18].
20
myocytes. In a study conducted by Bengsston et al. [19] using pregnant rat
myometrial cells, it was reported that in rat circular myocytes, single plateau-
type APs triggered small irregular contractions in 16-day pregnant cells (figure
1.4). Contractions become stronger and more regular with a longer duration and
repetitive spike trains at term. However in longitudinal myocytes, only repetitive
spike trains and strong contractions were recorded in 16-day gestation and at
term. It is clearly evident that the magnitudes of the contractions change in both
myocytes throughout the pregnancy [17].
The spontaneous electrical activity recordings show similar patterns of AP
in the same cell types (circular and longitudinal) even from different species.
Figure 1.5 shows the spontaneous AP and force production of both circular and
longitudinal in rat and human pregnant myometrial cells. It is clearly evident
that longitudinal cells in rat and human exhibit spike-like APs, while circular
cells exhibits a plateau-like AP in both species [11]. In the spike-like AP, each
spike triggers a small rise in tension which does not immediately decline to its
resting level, instead the tension accumulates and form a tetanus-like profile if the
spike intervals are small. Although the morphology and characteristics of both
human and rat spontaneous AP are very similar, the time courses are markedly
different with APs lasting about 60s in human but only 10s in rat.
A study carried out by Chamley and Parkington [20] compared the effect of
relaxin on the resting membrane potential, electrical and mechanical properties
of the longitudinal and circular in pregnant rat tissue shown in figure 1.6. Re-
laxin causes the release of noradrenaline, which is responsible for relaxations of
contraction in myometrium [21, 22]. In control condition, the resting membrane
potential was 62 ± 1 and 53 ± 1 mV in 15-17 day pregnant longitudinal and
circular rat tissues respectively. When relaxin was applied, little or no effect was
recorded on the resting membrane potential. However, the number of spikes in
a burst decreased dramatically but the amplitude of the AP remained the same
in longitudinal tissues. The results were changed when samples from 18-day to
term tissues was used. The number of spikes still decreased but after about 6-10
mins, the activity resumed despite the presence of the fresh relaxin.
In human myometrium, the separations between different types of electrical
patterns from different cells are more complex and often difficult to observe.
The action potentials found in human tend to have simple spikes followed by a
sustained depolarising plateau. This type of AP is found in human myometrium
21
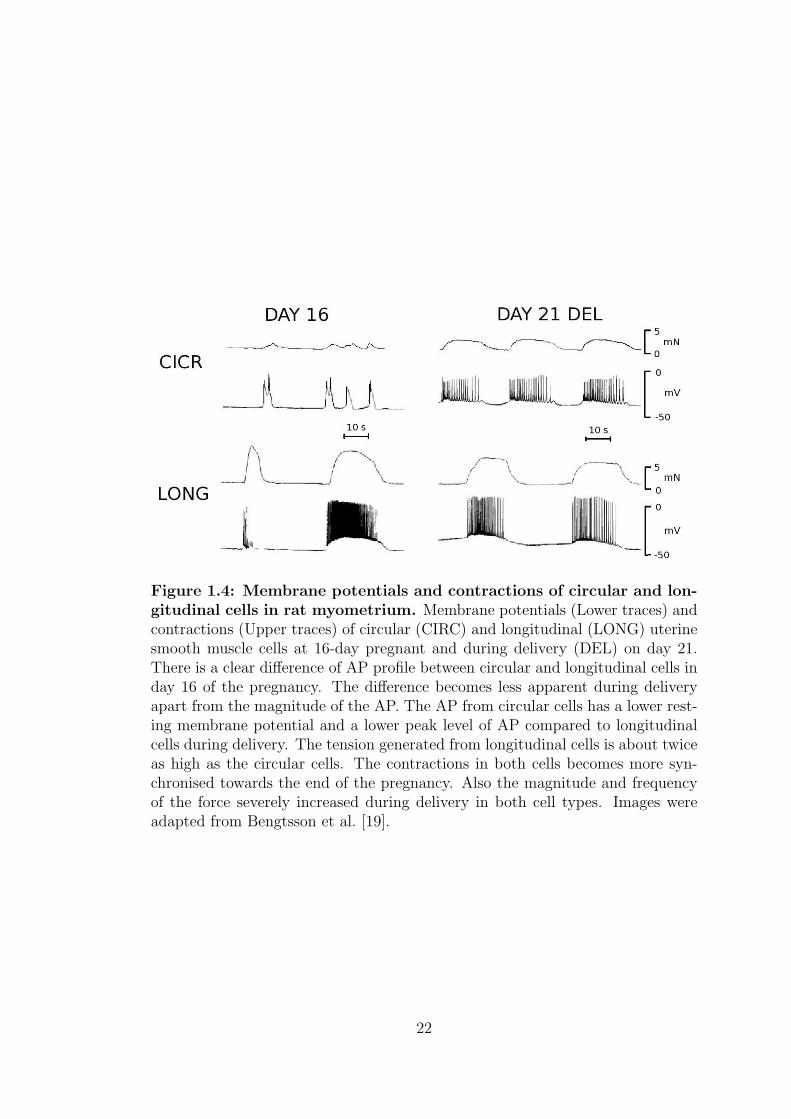
Figure 1.4: Membrane potentials and contractions of circular and lon-gitudinal cells in rat myometrium. Membrane potentials (Lower traces) andcontractions (Upper traces) of circular (CIRC) and longitudinal (LONG) uterinesmooth muscle cells at 16-day pregnant and during delivery (DEL) on day 21.There is a clear difference of AP profile between circular and longitudinal cells inday 16 of the pregnancy. The difference becomes less apparent during deliveryapart from the magnitude of the AP. The AP from circular cells has a lower rest-ing membrane potential and a lower peak level of AP compared to longitudinalcells during delivery. The tension generated from longitudinal cells is about twiceas high as the circular cells. The contractions in both cells becomes more syn-chronised towards the end of the pregnancy. Also the magnitude and frequencyof the force severely increased during delivery in both cell types. Images wereadapted from Bengtsson et al. [19].
22
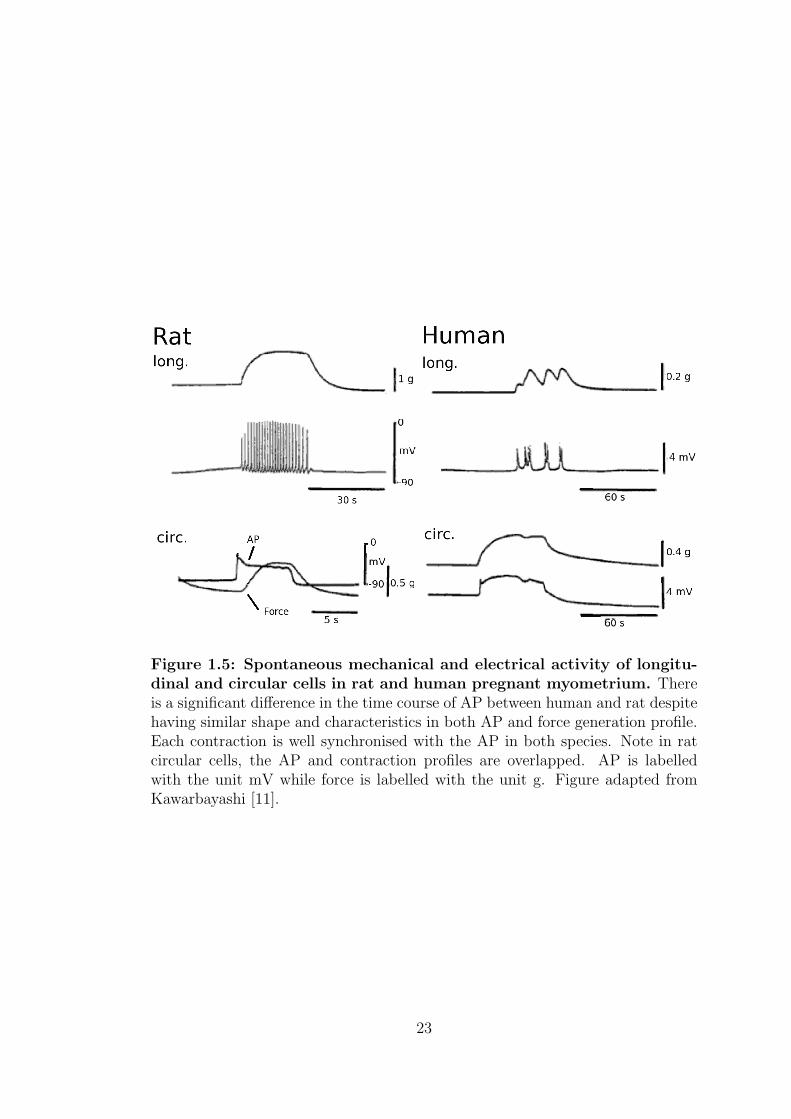
Figure 1.5: Spontaneous mechanical and electrical activity of longitu-dinal and circular cells in rat and human pregnant myometrium. Thereis a significant difference in the time course of AP between human and rat despitehaving similar shape and characteristics in both AP and force generation profile.Each contraction is well synchronised with the AP in both species. Note in ratcircular cells, the AP and contraction profiles are overlapped. AP is labelledwith the unit mV while force is labelled with the unit g. Figure adapted fromKawarbayashi [11].
23
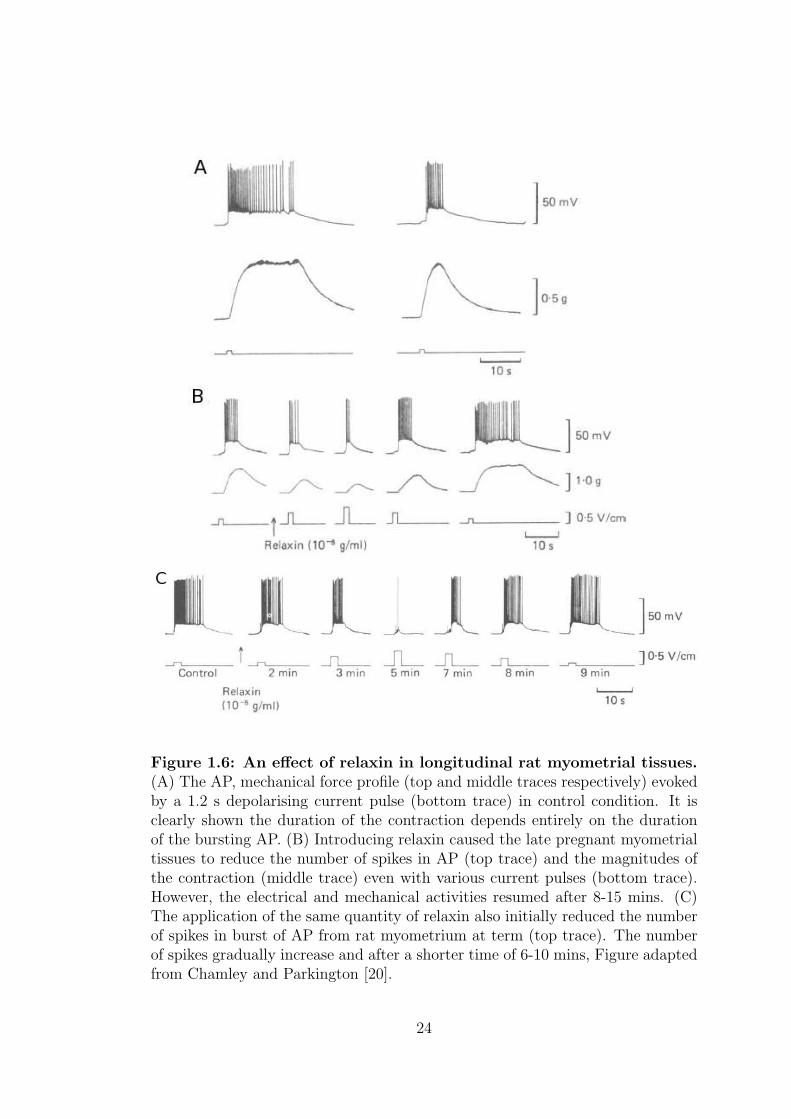
Figure 1.6: An effect of relaxin in longitudinal rat myometrial tissues.(A) The AP, mechanical force profile (top and middle traces respectively) evokedby a 1.2 s depolarising current pulse (bottom trace) in control condition. It isclearly shown the duration of the contraction depends entirely on the durationof the bursting AP. (B) Introducing relaxin caused the late pregnant myometrialtissues to reduce the number of spikes in AP (top trace) and the magnitudes ofthe contraction (middle trace) even with various current pulses (bottom trace).However, the electrical and mechanical activities resumed after 8-15 mins. (C)The application of the same quantity of relaxin also initially reduced the numberof spikes in burst of AP from rat myometrium at term (top trace). The numberof spikes gradually increase and after a shorter time of 6-10 mins, Figure adaptedfrom Chamley and Parkington [20].
24
at term. Surprisingly, this does not occur in tissue from every woman. It also
does not seem to have any correlation with a particular region of the uterus where
the tissue samples were taken from, nor the gestation of the pregnancy [23]. The
morphometric parameters of the human, rat and rabbit in non-pregnant, pregnant
and estrodiol-treated myometrial cells are listed in table 1.2.
1.3 Cell membrane properties and ionic currents
The cell membrane is semi-permeable and selectively controls various ions move-
ment across the cell. The permeability of the cell depends on the ionic concentra-
tion gradients inside versus outside the cell as illustrated in figure 1.7. There are
unequal distribution of ions which leaves a net negative charge inside the cell. A
negative intracellular environment relative to the cell exterior creates a potential
difference across the cell membrane. Ions travel across the cell membrane through
ionic channels that have different regulated properties and selectivities. The di-
rection of the flux for a given ion is determined by the ionic equilibrium potential,
which is set by the concentration gradient for the particular ion and membrane
potential difference. If the membrane potential is more positive than the equilib-
rium potential, there will be an efflux of that ion from the cell and vice versa [23].
An estimated ionic concentration inside and outside a myometrial cell is listed in
table 1.3. In human, the resting membrane potential is around -40 to -70 mV in
pregnant myometrium. It becomes more negative, around -60 mV, during mid-
pregnancy and increases to a more positive potential of -45 mV near term. The
precise mechanisms causing these changes are not clearly understood. The resting
membrane potential is predominantly determined by the relative concentrations
of Na+ , K+ and Cl− , suggesting these ionic channels must have altered in some
way as pregnancy progresses. A simplified schematic cell diagram with selected
the ionic currents with directions of current flux is shown in figure 1.8.
When an AP is initiated in a mammalian myometrium, the cell membrane
depolarises and activates the L-type calcium channel current, ICaL at around -40
mV. This creates an influx of Ca2+ towards the inside of the cell and ultimately
leads to contraction. T-type calcium channel current, ICaT , on the other hand
activates at a more negative potentials (around -60 mV). This channel, which has
been shown to be present in human but not in rat myometrium, is associated with
AP transmission and pacemaker activity [1]. Hyperpolarising current, Ih is also
25
Anim
alan
dM
axim
um
dia
met
erA
vera
gedia
met
erLen
gth
Surf
ace
area
Mea
nce
llC
yto
pla
smic
volu
me
gest
atio
n(µ
m)
(µm
)(µ
m)
(µm
2)
volu
me
(µm
3)
Non
-pre
gnan
t(h
um
an)
N/A
550
N/A
N/A
N/A
At
term
N/A
1550
0N
/AN
/AN
/A(h
um
an)
Non
-pre
gnan
t(r
at)
7.9±
0.4
4.5±
0.2
129.
7±
11.7
928.
4±
235.
12.
6±
0.4
pl
N/A
Mid
-pre
gnan
t(r
at)
15.2±0
.47.
5±0.
223
8±
8.3
5193±
188.
411
.0±
0.5
pl
N/A
Lat
epre
gnan
t(r
at)
21.0±0
.710
.6±
0.5
255.
1±
12.6
7599
.4±6
39.7
21.0±
2.5
pl
N/A
Non
-pre
gnan
t(r
abbit
)N
/A5.
56±
1.46
3523
.281
1µm
368
5
Est
radio
l-tr
eate
d(r
ab-
bit
)
N/A
7.92±
1.46
5246
.829
9629
12
Table
1.2
:M
orp
hom
etr
icpara
mete
rsand
fibre
dim
ensi
onsofra
tand
rabbit
ute
rine
cells.
Info
rmat
ion
was
bas
edon
repor
ted
exper
imen
taldat
afr
omB
lack
burn
etal
.[6
]in
hum
an,Y
oshin
oet
al.[8
]in
ratan
dG
illo
teau
xan
dSzc
zepan
ski[2
4]in
rabbit
myo
met
rium
.W
hen
par
amet
ers
wer
enot
repor
ted,N
/Aw
asnot
edin
the
cate
gory
.
26
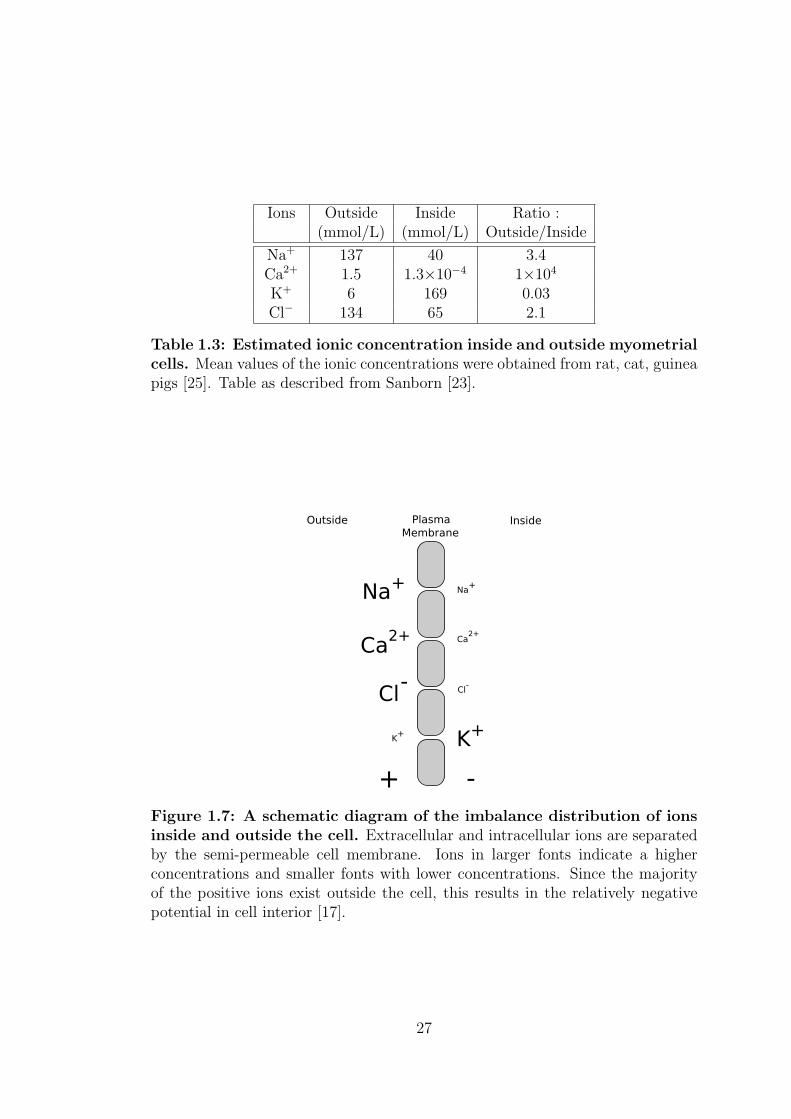
Ions Outside Inside Ratio :(mmol/L) (mmol/L) Outside/Inside
Na+ 137 40 3.4Ca2+ 1.5 1.3×10⁻⁴ 1×10⁴
K+ 6 169 0.03Cl− 134 65 2.1
Table 1.3: Estimated ionic concentration inside and outside myometrialcells. Mean values of the ionic concentrations were obtained from rat, cat, guineapigs [25]. Table as described from Sanborn [23].
Figure 1.7: A schematic diagram of the imbalance distribution of ionsinside and outside the cell. Extracellular and intracellular ions are separatedby the semi-permeable cell membrane. Ions in larger fonts indicate a higherconcentrations and smaller fonts with lower concentrations. Since the majorityof the positive ions exist outside the cell, this results in the relatively negativepotential in cell interior [17].
27
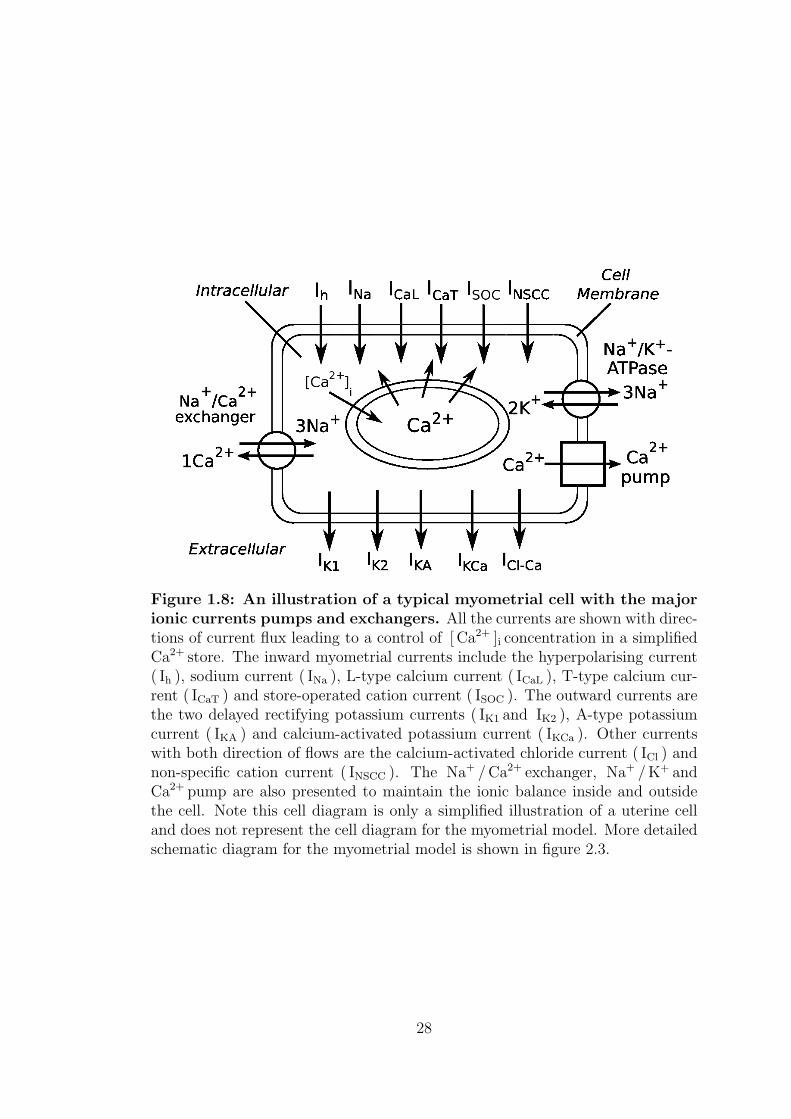
Figure 1.8: An illustration of a typical myometrial cell with the majorionic currents pumps and exchangers. All the currents are shown with direc-tions of current flux leading to a control of [ Ca2+ ]i concentration in a simplifiedCa2+ store. The inward myometrial currents include the hyperpolarising current( Ih ), sodium current ( INa ), L-type calcium current ( ICaL ), T-type calcium cur-rent ( ICaT ) and store-operated cation current ( ISOC ). The outward currents arethe two delayed rectifying potassium currents ( IK1 and IK2 ), A-type potassiumcurrent ( IKA ) and calcium-activated potassium current ( IKCa ). Other currentswith both direction of flows are the calcium-activated chloride current ( ICl ) andnon-specific cation current ( INSCC ). The Na+ /Ca2+ exchanger, Na+ /K+ andCa2+ pump are also presented to maintain the ionic balance inside and outsidethe cell. Note this cell diagram is only a simplified illustration of a uterine celland does not represent the cell diagram for the myometrial model. More detailedschematic diagram for the myometrial model is shown in figure 2.3.
28
suggested to contribute to spontaneous pacemaking activity since this channel is
activated by hyperpolarisation at resting membrane potential [26]. It is also found
in cardiac cells, although the density of this current is much lower than pregnant
rat uterine cell. Another inward current identified in pregnant rat myometrium is
TTX-sensitive sodium current, INa [27]. This fast sodium channel current, INa is
not normally found in smooth muscle cells (but present in cardiac cells), but it
has been identified in the rat pregnant uterus. The role of this current includes
spreading the excitation and increasing spike frequency in myometrium. The
store-operated non-selective cation, ISOC is also identified in myometrium and it
is permeable to different types of ions [28], however no quantitative measurement
was recorded in experiments.
There are various types of outward potassium channel expressed in myometrium
with diverse properties and characteristics. Published data often uses various
names and formalisms for a particular ion channel according to different authors.
Therefore the definitions of different types of potassium channels are often very
poorly differentiated. In this model, definitions of different channels are classi-
fied according to the work by Khan and Knock et al. [2, 29, 30], which distin-
guish these channels by their inactivation dynamics and activators. This current
is sub-categorised into two delayed rectifying potassium currents, IK1 and IK2 ,
A-type potassium current, IKA and finally calcium-activated potassium current,
IKCa . Their main roles are relaxing the excitation cycle and restoring the resting
membrane potential following an AP. The calcium-activated potassium channel
exhibits a loss of sensitivity towards late pregnancy to increase excitation in
preparation of labour [29,31].
Other important currents identified in myometrium include the calcium-activated
chloride current, ICl [32] and the non-specific cation current, INSCC [33]. Acti-
vation of chloride channel leads to depolarisation and is therefore important in
governing excitability. The non-specific cation channel is permeable to a variety
of mono and divalent ions such as K+ , Cs+ , Na+ and Li+ and it is believed
that this channel is responsible for the pace-making activity and regulating the
myometrium contractility. Detailed descriptions of each ion channels, exchangers
and pump are given in section 2.
29
1.4 Ionic channels in myometrium
Ion channels are complex proteins which act as a barrier to control particular
ions entering or leaving the cell. Different ionic channels can be modulated by
different activators, hormonal state and gestation in pregnancy. Ionic movement
across the cell can also be controlled by blocking and opening the channels by
special activating and inhibiting agents. These agents change the conformation
of the ionic channel gating mechanisms and the gating factors are classified into
three main species (these groups are not mutually exclusive):
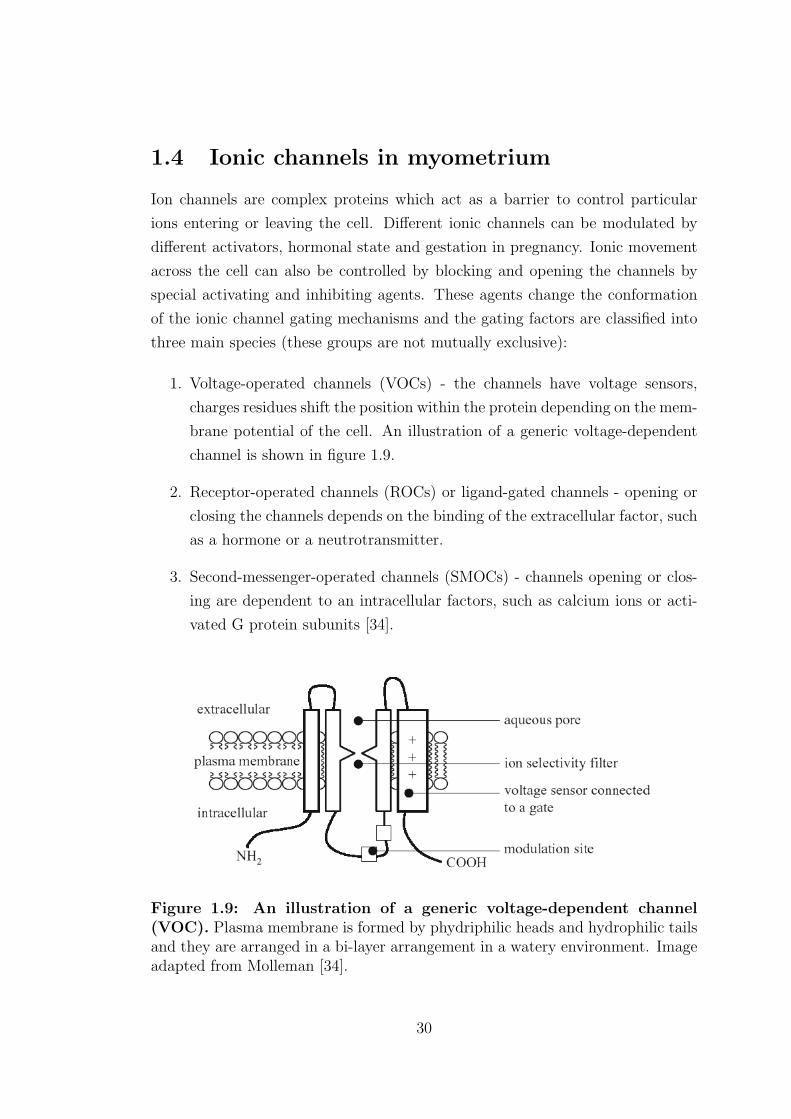
1. Voltage-operated channels (VOCs) - the channels have voltage sensors,
charges residues shift the position within the protein depending on the mem-
brane potential of the cell. An illustration of a generic voltage-dependent
channel is shown in figure 1.9.
2. Receptor-operated channels (ROCs) or ligand-gated channels - opening or
closing the channels depends on the binding of the extracellular factor, such
as a hormone or a neutrotransmitter.
3. Second-messenger-operated channels (SMOCs) - channels opening or clos-
ing are dependent to an intracellular factors, such as calcium ions or acti-
vated G protein subunits [34].
Figure 1.9: An illustration of a generic voltage-dependent channel(VOC). Plasma membrane is formed by phydriphilic heads and hydrophilic tailsand they are arranged in a bi-layer arrangement in a watery environment. Imageadapted from Molleman [34].
30
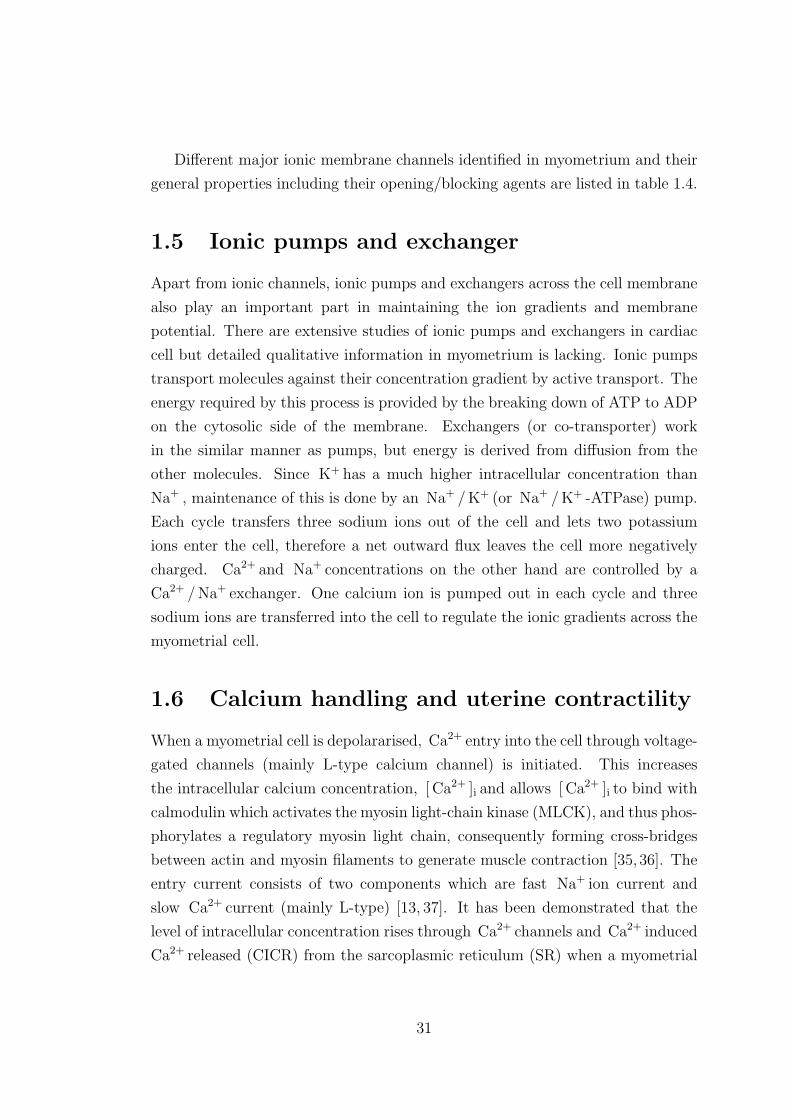
Different major ionic membrane channels identified in myometrium and their
general properties including their opening/blocking agents are listed in table 1.4.
1.5 Ionic pumps and exchanger
Apart from ionic channels, ionic pumps and exchangers across the cell membrane
also play an important part in maintaining the ion gradients and membrane
potential. There are extensive studies of ionic pumps and exchangers in cardiac
cell but detailed qualitative information in myometrium is lacking. Ionic pumps
transport molecules against their concentration gradient by active transport. The
energy required by this process is provided by the breaking down of ATP to ADP
on the cytosolic side of the membrane. Exchangers (or co-transporter) work
in the similar manner as pumps, but energy is derived from diffusion from the
other molecules. Since K+ has a much higher intracellular concentration than
Na+ , maintenance of this is done by an Na+ /K+ (or Na+ /K+ -ATPase) pump.
Each cycle transfers three sodium ions out of the cell and lets two potassium
ions enter the cell, therefore a net outward flux leaves the cell more negatively
charged. Ca2+ and Na+ concentrations on the other hand are controlled by a
Ca2+ /Na+ exchanger. One calcium ion is pumped out in each cycle and three
sodium ions are transferred into the cell to regulate the ionic gradients across the
myometrial cell.
1.6 Calcium handling and uterine contractility
When a myometrial cell is depolararised, Ca2+ entry into the cell through voltage-
gated channels (mainly L-type calcium channel) is initiated. This increases
the intracellular calcium concentration, [ Ca2+ ]i and allows [ Ca2+ ]i to bind with
calmodulin which activates the myosin light-chain kinase (MLCK), and thus phos-
phorylates a regulatory myosin light chain, consequently forming cross-bridges
between actin and myosin filaments to generate muscle contraction [35, 36]. The
entry current consists of two components which are fast Na+ ion current and
slow Ca2+ current (mainly L-type) [13, 37]. It has been demonstrated that the
level of intracellular concentration rises through Ca2+ channels and Ca2+ induced
Ca2+ released (CICR) from the sarcoplasmic reticulum (SR) when a myometrial
31
Ion
Chan
nel
Act
ivat
ors
Inhib
itor
sC
han
ges
inpre
gnan
cy
I hV
olta
geC
s+
I Na
Vol
tage
Sax
itox
in,te
trodot
oxin
(TT
X)
Incr
ease
snea
rte
rm
I CaL
Vol
tage
Dih
ydro
pyri
din
es(n
ifed
ipin
e),C
a2+
inac
tiva
tion
,M
n2+,M
g2+,
volt
age
inac
tiva
tion
Incr
ease
sin
mid
-pre
gnan
cy
I CaT
Vol
tage
Vol
tage
,m
iber
frad
ilI K
1V
olta
geT
EA
>50
mm
ol/L
I K2
Vol
tage
TE
A>
50m
mol
/L,4A
PI K
AV
olta
ge4-
amin
opyri
din
e(4
AP
)I K
Ca
Cal
cium
,ag
onis
t,re
laxin
Vol
tage
,D
ehydro
-yas
apon
inI,
Nifl
um
icac
id
TE
A,4-
AP,bar
ium
Los
sof
sensi
tivity
wit
hla
bou
r
I Cl
Vol
tage
Nifl
um
icac
idan
dan
thra
cene-
9-ca
rbox
ylic
acid
(9-A
C)
I NSC
CA
TP,H
yper
pol
aris
atio
nLa3
+,G
d3+
Dim
inis
hed
nea
rte
rmw
ith
anin
crea
sing
leve
lof
oes
trog
en
Table
1.4
:Sele
cted
ionic
channels
expre
ssed
inm
yom
etr
ium
wit
hth
eir
pro
pert
ies.
The
acti
vato
r/in
hib
itor
and
the
chan
ges
duri
ng
pre
gnan
cyof
the
chan
nel
sw
ere
also
incl
uded
.In
form
atio
nas
des
crib
edfr
omSan
bor
nan
dm
odifi
edfo
rad
dit
ional
chan
nel
s[1
7].
32
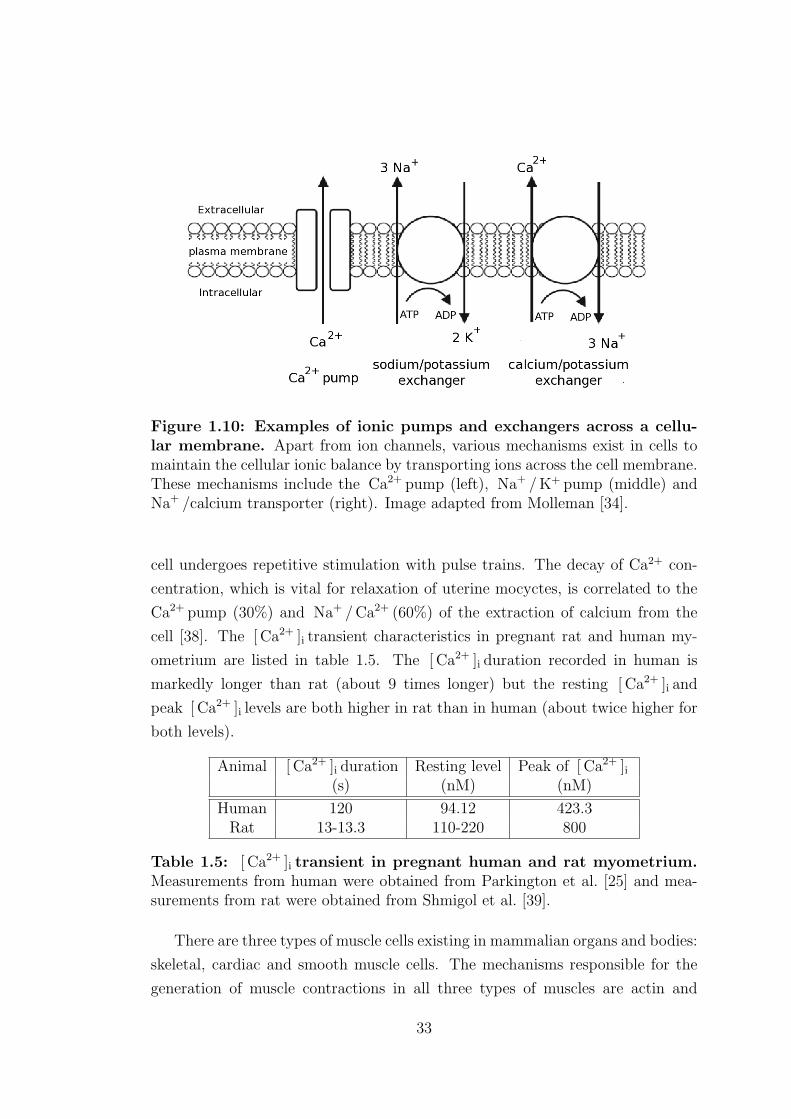
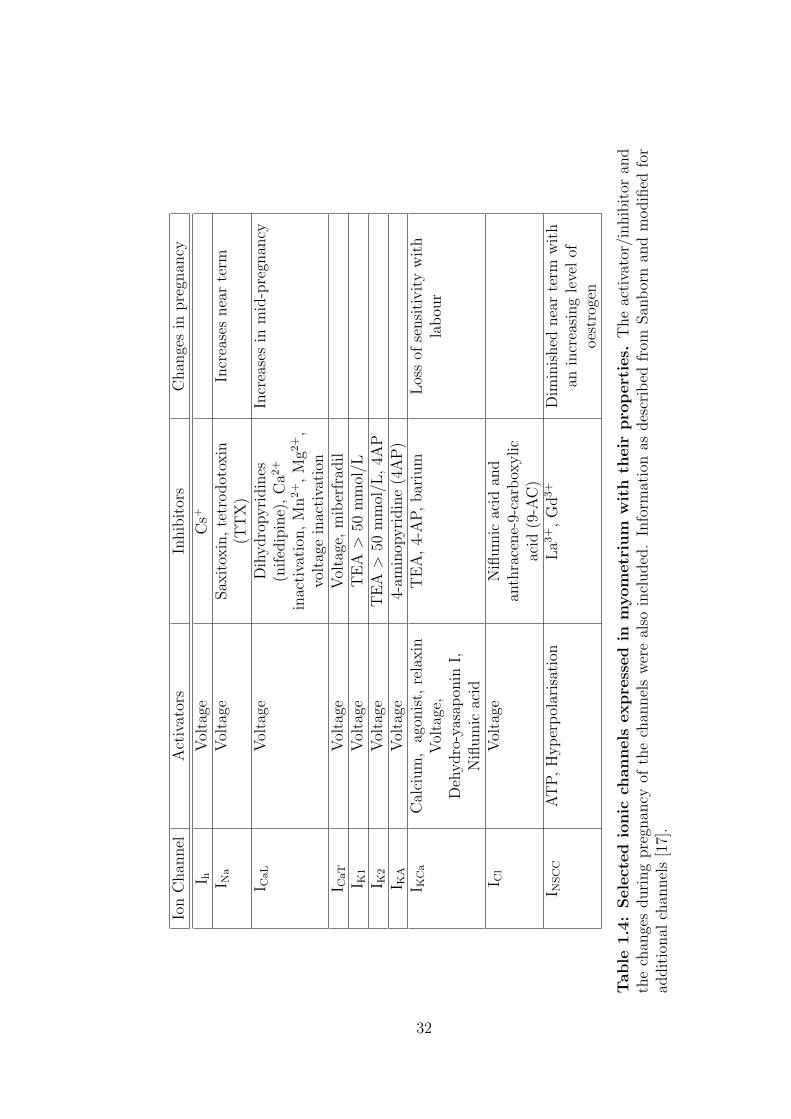
Figure 1.10: Examples of ionic pumps and exchangers across a cellu-lar membrane. Apart from ion channels, various mechanisms exist in cells tomaintain the cellular ionic balance by transporting ions across the cell membrane.These mechanisms include the Ca2+ pump (left), Na+ /K+ pump (middle) andNa+ /calcium transporter (right). Image adapted from Molleman [34].
cell undergoes repetitive stimulation with pulse trains. The decay of Ca2+ con-
centration, which is vital for relaxation of uterine mocyctes, is correlated to the
Ca2+ pump (30%) and Na+ /Ca2+ (60%) of the extraction of calcium from the
cell [38]. The [ Ca2+ ]i transient characteristics in pregnant rat and human my-
ometrium are listed in table 1.5. The [ Ca2+ ]i duration recorded in human is
markedly longer than rat (about 9 times longer) but the resting [ Ca2+ ]i and
peak [ Ca2+ ]i levels are both higher in rat than in human (about twice higher for
both levels).
Animal [ Ca2+ ]i duration Resting level Peak of [ Ca2+ ]i(s) (nM) (nM)
Human 120 94.12 423.3Rat 13-13.3 110-220 800
Table 1.5: [ Ca2+ ]i transient in pregnant human and rat myometrium.Measurements from human were obtained from Parkington et al. [25] and mea-surements from rat were obtained from Shmigol et al. [39].
There are three types of muscle cells existing in mammalian organs and bodies:
skeletal, cardiac and smooth muscle cells. The mechanisms responsible for the
generation of muscle contractions in all three types of muscles are actin and
33
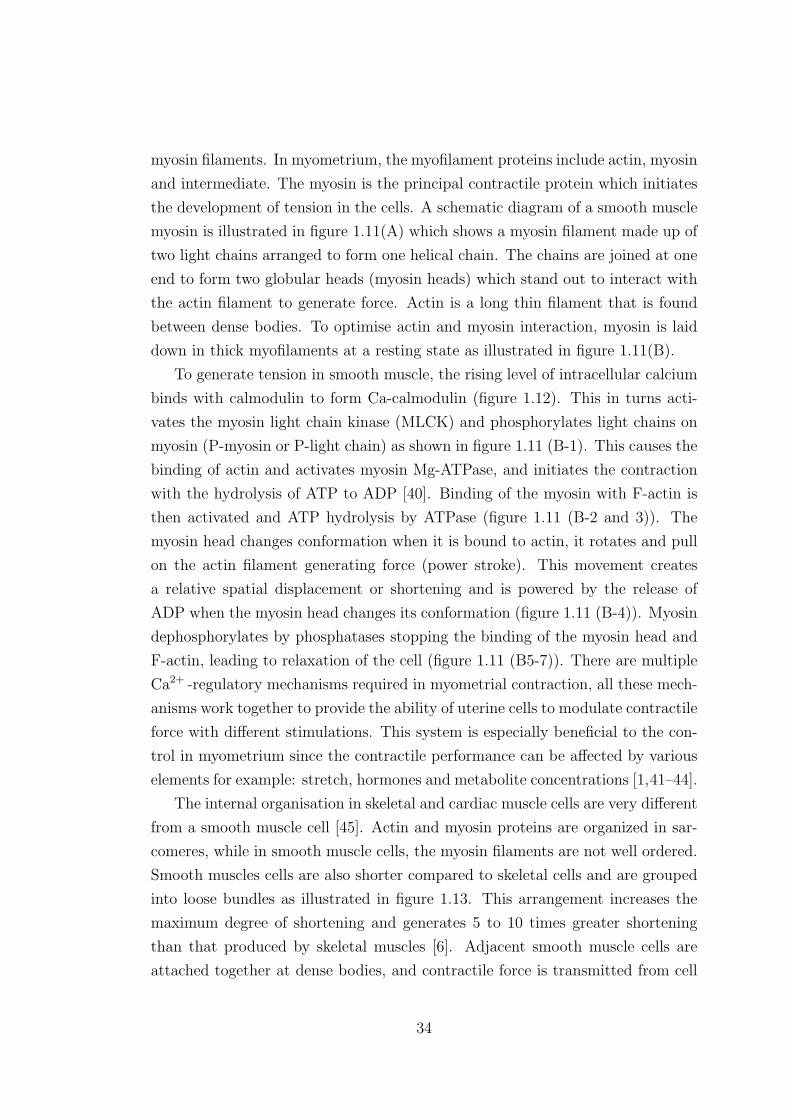
myosin filaments. In myometrium, the myofilament proteins include actin, myosin
and intermediate. The myosin is the principal contractile protein which initiates
the development of tension in the cells. A schematic diagram of a smooth muscle
myosin is illustrated in figure 1.11(A) which shows a myosin filament made up of
two light chains arranged to form one helical chain. The chains are joined at one
end to form two globular heads (myosin heads) which stand out to interact with
the actin filament to generate force. Actin is a long thin filament that is found
between dense bodies. To optimise actin and myosin interaction, myosin is laid
down in thick myofilaments at a resting state as illustrated in figure 1.11(B).
To generate tension in smooth muscle, the rising level of intracellular calcium
binds with calmodulin to form Ca-calmodulin (figure 1.12). This in turns acti-
vates the myosin light chain kinase (MLCK) and phosphorylates light chains on
myosin (P-myosin or P-light chain) as shown in figure 1.11 (B-1). This causes the
binding of actin and activates myosin Mg-ATPase, and initiates the contraction
with the hydrolysis of ATP to ADP [40]. Binding of the myosin with F-actin is
then activated and ATP hydrolysis by ATPase (figure 1.11 (B-2 and 3)). The
myosin head changes conformation when it is bound to actin, it rotates and pull
on the actin filament generating force (power stroke). This movement creates
a relative spatial displacement or shortening and is powered by the release of
ADP when the myosin head changes its conformation (figure 1.11 (B-4)). Myosin
dephosphorylates by phosphatases stopping the binding of the myosin head and
F-actin, leading to relaxation of the cell (figure 1.11 (B5-7)). There are multiple
Ca2+ -regulatory mechanisms required in myometrial contraction, all these mech-
anisms work together to provide the ability of uterine cells to modulate contractile
force with different stimulations. This system is especially beneficial to the con-
trol in myometrium since the contractile performance can be affected by various
elements for example: stretch, hormones and metabolite concentrations [1,41–44].
The internal organisation in skeletal and cardiac muscle cells are very different
from a smooth muscle cell [45]. Actin and myosin proteins are organized in sar-
comeres, while in smooth muscle cells, the myosin filaments are not well ordered.
Smooth muscles cells are also shorter compared to skeletal cells and are grouped
into loose bundles as illustrated in figure 1.13. This arrangement increases the
maximum degree of shortening and generates 5 to 10 times greater shortening
than that produced by skeletal muscles [6]. Adjacent smooth muscle cells are
attached together at dense bodies, and contractile force is transmitted from cell
34
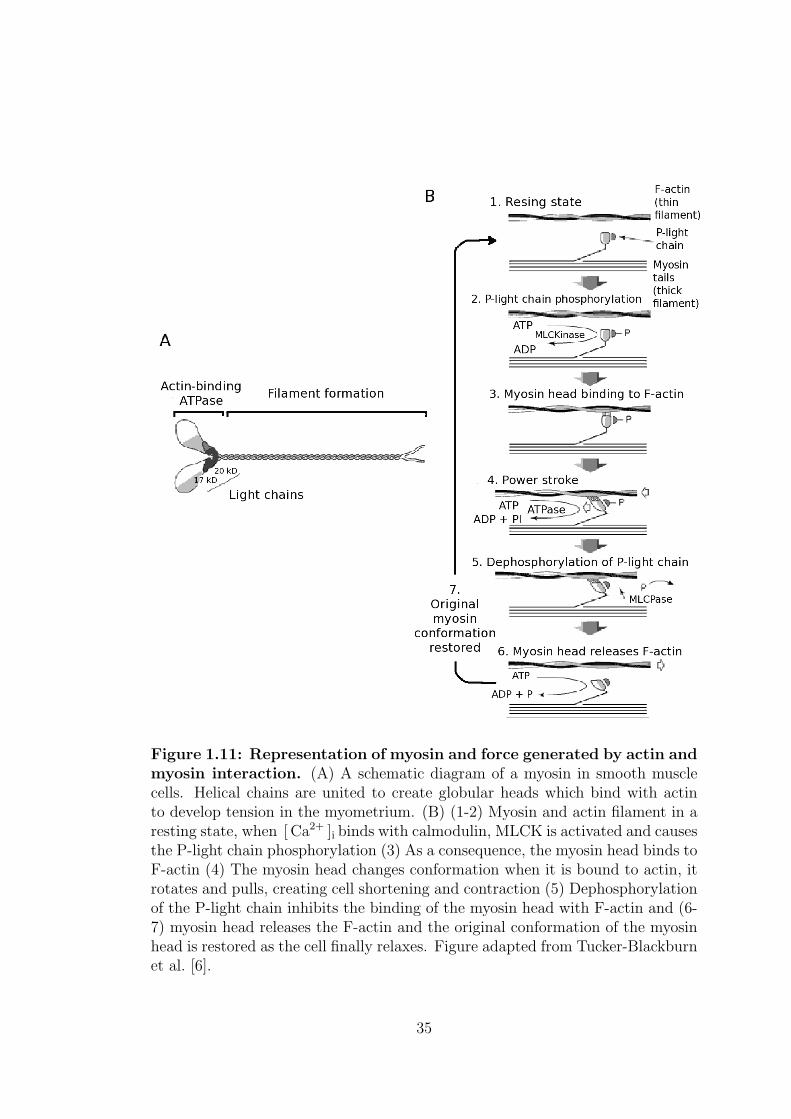
Figure 1.11: Representation of myosin and force generated by actin andmyosin interaction. (A) A schematic diagram of a myosin in smooth musclecells. Helical chains are united to create globular heads which bind with actinto develop tension in the myometrium. (B) (1-2) Myosin and actin filament in aresting state, when [ Ca2+ ]i binds with calmodulin, MLCK is activated and causesthe P-light chain phosphorylation (3) As a consequence, the myosin head binds toF-actin (4) The myosin head changes conformation when it is bound to actin, itrotates and pulls, creating cell shortening and contraction (5) Dephosphorylationof the P-light chain inhibits the binding of the myosin head with F-actin and (6-7) myosin head releases the F-actin and the original conformation of the myosinhead is restored as the cell finally relaxes. Figure adapted from Tucker-Blackburnet al. [6].
35
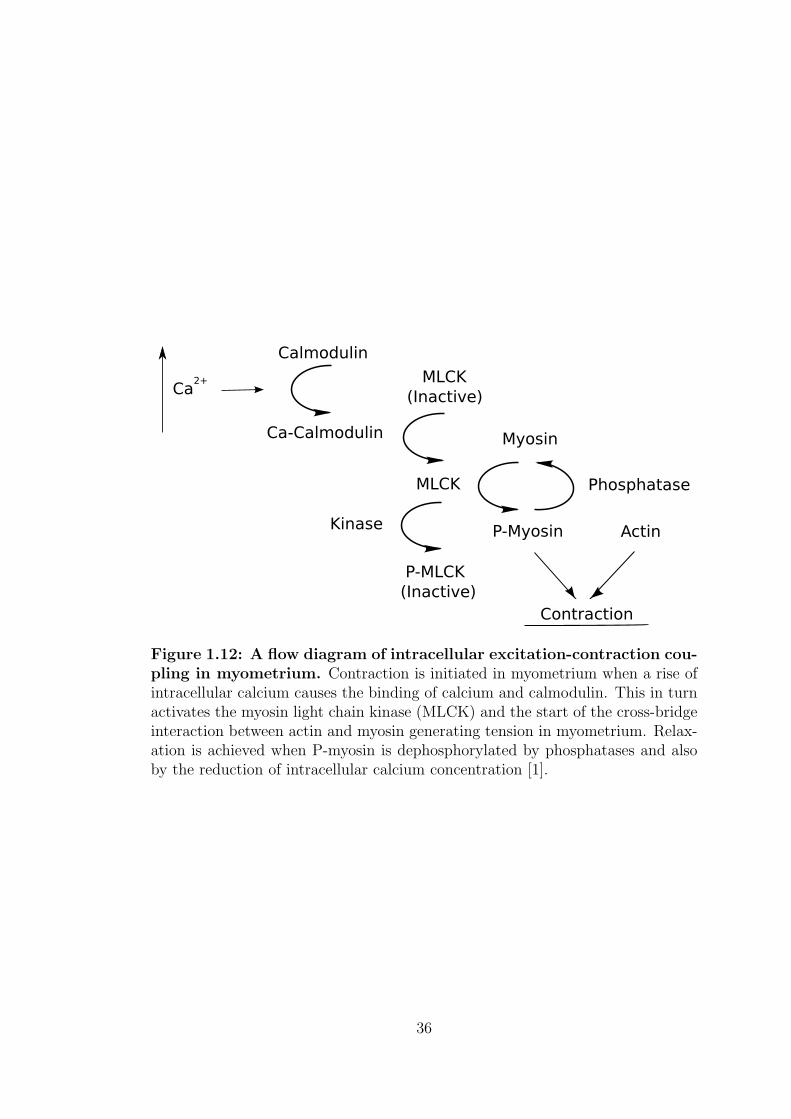
Figure 1.12: A flow diagram of intracellular excitation-contraction cou-pling in myometrium. Contraction is initiated in myometrium when a rise ofintracellular calcium causes the binding of calcium and calmodulin. This in turnactivates the myosin light chain kinase (MLCK) and the start of the cross-bridgeinteraction between actin and myosin generating tension in myometrium. Relax-ation is achieved when P-myosin is dephosphorylated by phosphatases and alsoby the reduction of intracellular calcium concentration [1].
36
to cell through out the tissue. The dense bodies in smooth muscles have the same
function as Z-disks in skeletal muscles [46] and comparisons of all three types of
human muscles are listed in table 1.6 [47].
1.7 Patch-clamp experiment
In order to construct a myometrial model which can be manipulated in a computa-
tional environment, data which describes the electrical and mechanical activities
must be obtained through experiments. One of the methods of studying the elec-
trophysiological properties of a cell is through the voltage-clamp experiment. It
is performed on individual cells in a biological laboratory. Since ions leaving and
entering the cell affect the membrane potential of a whole cell, measuring the ac-
tivity of the ion channels gives a good indicator of physiological significance of the
cell. To start with, the cell membrane of a single cell is held at a known potential
called the holding potential (voltage-clamp). A glass suction electrode that forms
a tight seal on an individual cell (patch-clamp) [23] is applied to measure the elec-
trical activity changes in the cell as shown in figure 1.14. The cell potential is
then stepped to a voltage protocol, the amount and the properties of the ionic
current resulting from flow of ions through channels can be calculated. In the
whole cell mode, the pipette with content solution can perforate the cell and have
direct access to the inside of the cell. The whole cell current measured represents
the sum contributions of the channels in the total membrane under conditions se-
lected. To achieve steady-state, the cell is clamped to a certain voltage for a long
period of time to ensure the cell is in equilibrium. Results from voltage-clamp
experiments are particularly useful when developing models for individual ionic
currents. Simulated results (activation and inactivation dynamics) of myometrial
currents were often compared to the recordings from the experiments to verify
whether good fits were achieved.
If the voltage is not clamped but instead, a fixed amount of external stimulus
current is injected, this is called current-clamp. Current-clamp technique are of-
ten used to study APs of a single cell. In computer simulations, the ‘virtual cell
is put in a voltage- or current-clamp under the same physiological conditions and
circumstances as described in experiments. Different voltage and current proto-
cols are then applied according to experimental conditions to see if the correct
results can be reproduced and predicted using purely computer simulations.
37
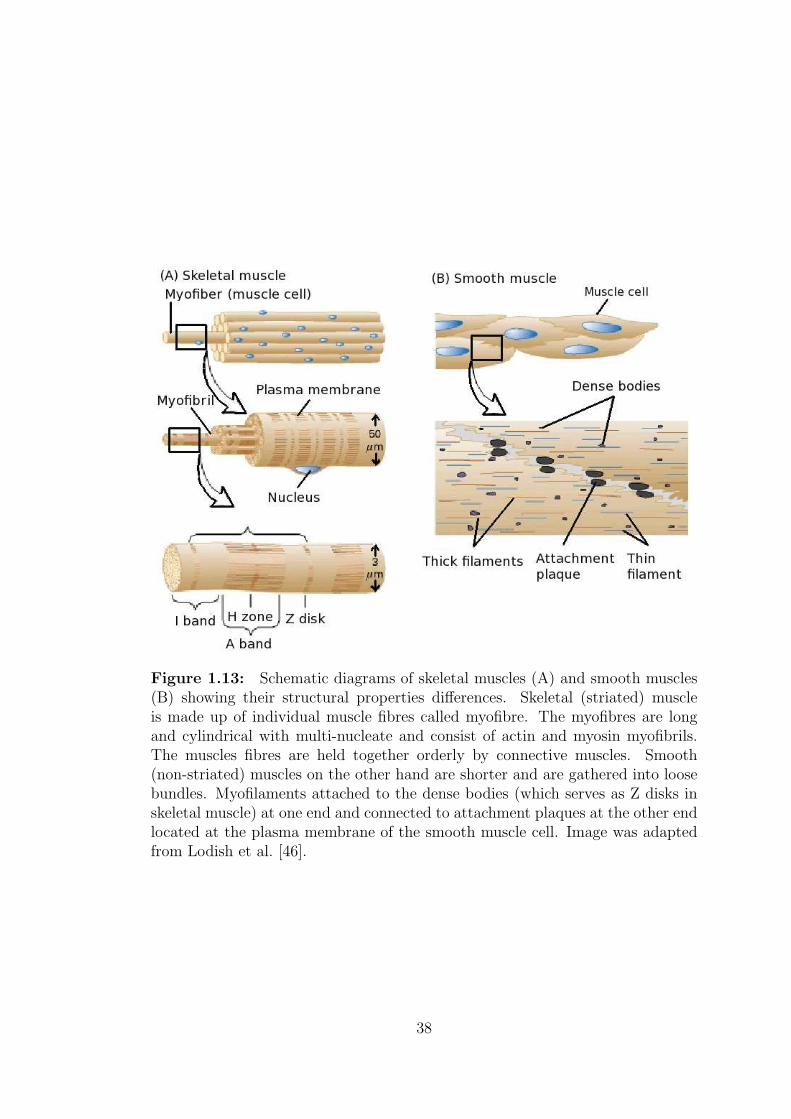
Figure 1.13: Schematic diagrams of skeletal muscles (A) and smooth muscles(B) showing their structural properties differences. Skeletal (striated) muscleis made up of individual muscle fibres called myofibre. The myofibres are longand cylindrical with multi-nucleate and consist of actin and myosin myofibrils.The muscles fibres are held together orderly by connective muscles. Smooth(non-striated) muscles on the other hand are shorter and are gathered into loosebundles. Myofilaments attached to the dense bodies (which serves as Z disks inskeletal muscle) at one end and connected to attachment plaques at the other endlocated at the plasma membrane of the smooth muscle cell. Image was adaptedfrom Lodish et al. [46].
38
Pro
per
tySke
leta
lm
usc
les
Car
dia
cm
usc
les
Sm
oot
hm
usc
les
Fib
redim
ensi
ons
100
mm
xup
to30
cm10
-20
mm
x50
-100
mm
5-10
mm
x30
-200
mm
*(d
iam
eter
xle
ngt
h)
Nucl
eiM
ult
iple
,nea
rsa
rcol
emm
aG
ener
ally
singl
e,ce
ntr
ally
Sin
gle,
centr
ally
loca
ted
loca
ted
Filam
ent
orga
nis
atio
nIn
sarc
omer
esal
ong
myo
fibri
lsIn
sacr
omer
esal
ong
myo
fibri
lsSca
tter
edth
rough
out
sarc
opla
smSR
Ter
min
alci
sten
aein
tria
ds
atzo
nes
ofov
erla
pSR
tubule
sco
nta
ctT
tubule
sat
Zlines
Dis
per
sed
thro
ugh
out
sarc
opla
sm,no
T-t
ubule
sC
ontr
olm
echan
ism
sN
eutr
al,
atsi
ngl
eneu
rom
us-
cula
rju
nct
ion
Auto
mat
icity
(pac
emak
ing
cells)
neu
ral
orhor
mon
alco
ntr
ol
Auto
mat
icity
(pac
emak
ing
cells)
Cal
cium
sourc
eR
elea
sefr
omSR
Extr
acel
lula
rfluid
and
rele
ase
from
SR
Extr
acel
lula
rfluid
Con
trac
tion
Rap
idon
set;
may
be
teta
nis
ed;
rapid
fati
gue
Slo
wer
onse
t;ca
nnot
be
teta
nis
ed;re
sist
ant
tofa
tigu
eSlo
won
set;
may
be
teta
nis
ed;
resi
stan
tto
fati
gue
Ener
gyso
urc
eA
erob
icm
etab
olis
mat
moder
-at
ele
vels
ofac
tivity;
glyco
ly-
sis
(anae
robic
)duri
ng
pea
k
Aer
obic
met
abol
ism
,usu
ally
lipid
orca
rboh
ydra
tesu
b-
stra
tes
Pri
mar
yae
robic
met
abol
ism
acti
vity
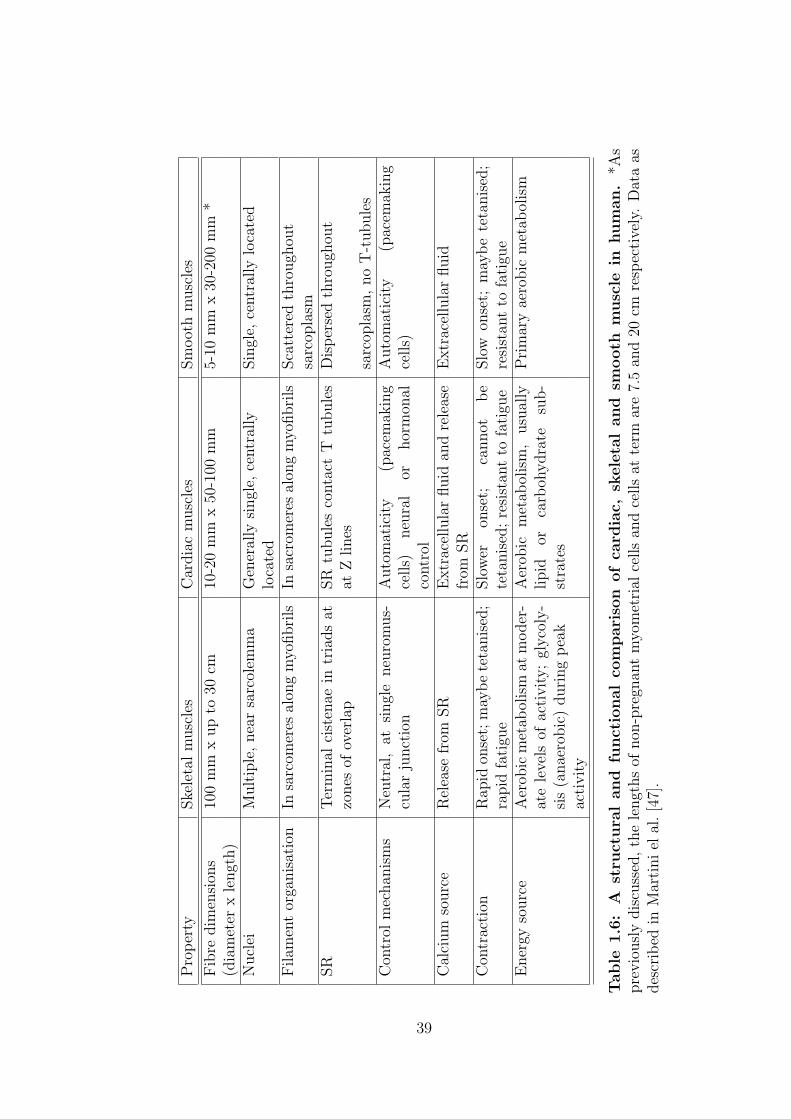
Table
1.6
:A
stru
ctura
land
funct
ional
com
pari
son
of
card
iac,
skele
tal
and
smooth
musc
lein
hum
an.
*As
pre
vio
usl
ydis
cuss
ed,th
ele
ngt
hs
ofnon
-pre
gnan
tm
yom
etri
alce
lls
and
cells
atte
rmar
e7.
5an
d20
cmre
spec
tive
ly.
Dat
aas
des
crib
edin
Mar
tiniel
al.[4
7].
39
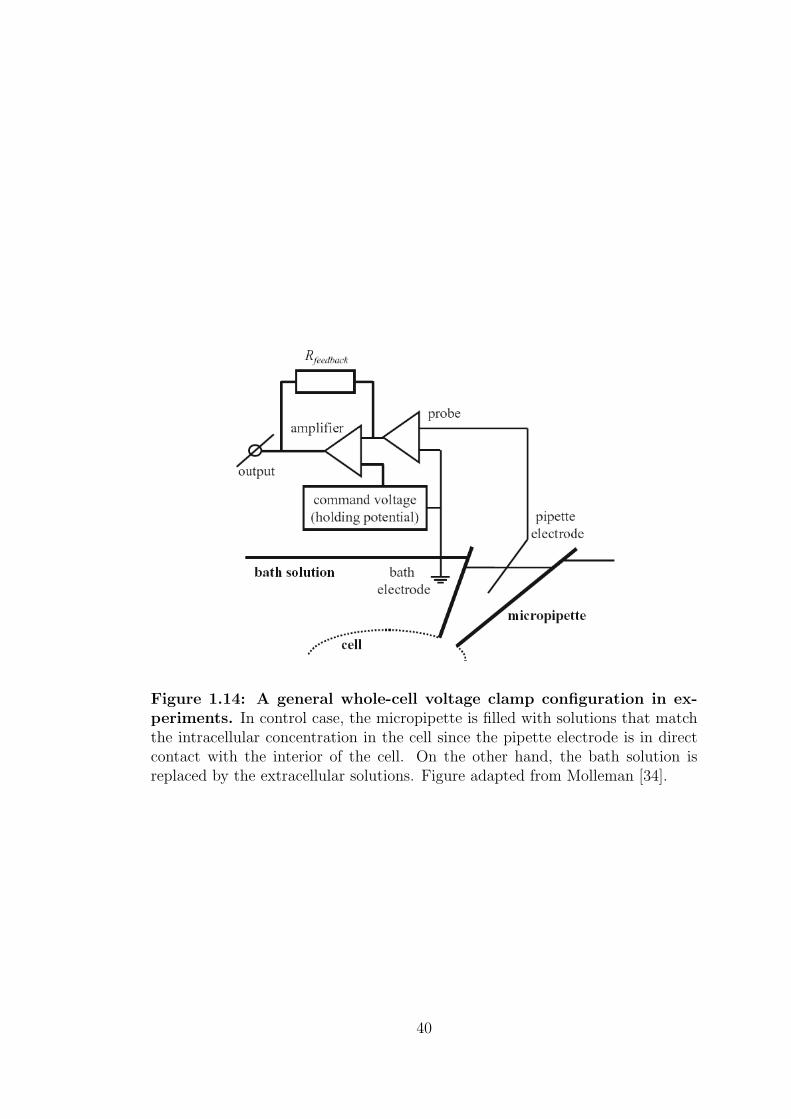
Figure 1.14: A general whole-cell voltage clamp configuration in ex-periments. In control case, the micropipette is filled with solutions that matchthe intracellular concentration in the cell since the pipette electrode is in directcontact with the interior of the cell. On the other hand, the bath solution isreplaced by the extracellular solutions. Figure adapted from Molleman [34].
40
Chapter 2
Single uterine cell model
development
Although there are a few electrophysiological and force generation models for
single smooth muscle cells, at present, there is no mathematical single cell uterus
model that can predict the membrane potential, current and mechanical force
together. Gestrelius and Borgstrom [48] proposed a dynamical model of smooth
muscle contraction based on the sliding filament theory for the rat portal vein. In
2003, Yang et al. [49] developed a detailed model describing the myogenic response
of an isolated rat cerebrovascular arterial cell. Their model consisted of an elec-
trochemical and a chemomechanical subsystem. The electrochemical subsystem
includes ionic channels, an exchanger, pump and calcium-induced calcium release
mechanisms in the sacroplasmic reticulum. Calcium buffering and the balance
of intracellular Na+ and K+ were also taken into account. In chemomechanical
subsystem, myosin phosphorylation was explained using Hai and Murphy’s cross-
bridge model [50,51]. Active, passive and series viscoelastic force generation were
described using a modified Hill model [52]. The model was tested under iso-
metric and isotonic conditions and length-force and force-velocity relationships
were measured. Youm et al. (2006) [53] developed a mathematical model de-
scribing the pacemaking activity in small rat intestinal Cajal cells. Their model
included ionic channels, an exchanger, pumps, inositol 1,4,5-triphosphate (IP3)
production and IP3-mediated Ca2+ release activities. In the same year, Rihana
et al. [54] proposed an electrophysiological model for a single uterine cell using
general Hodgkin-Huxley type equations to describe the major currents. A sim-
ple intracellular calcium process was also incorporated. A bifurcation analysis
41
between the uterus membrane potential and current stimulation was carried out
and a repetitive firing behaviour in AP was shown using their model. Rihana
et al. further developed their model by including more ionic channels. Differ-
ent shapes of uterine electrical activities, action potential and the corresponding
[ Ca2+ ]i were investigated. Bursztyn et al. (2007) [38] proposed an excitation-
contraction model for a single uterine smooth muscle cell. This model accounts
for the voltage-gated calcium channels, pumps and the Na+ /Ca2+ exchanger.
Using the Hai and Murphy [50,51] cross-bridge model, stress was produced when
the calcium concentration was coupled with the rate constant of myosin phos-
phorylation. The Bursztyn model does not included other ionic channels (e.g
Na+ and K+ etc.). The ionic concentration of Na+ was set to a fixed value and
does not get updated during simulations.
In this thesis, a detailed novel mathematical model of a late pregnant (17-
19 days) rat longitudinal myometrial single cell was developed to aid designing
experiments in a laboratory research and provide better understanding of the
function of the uterus during pregnancy. The myometrial model reconstructed the
chemical, electrical and mechanical phenomena generated by the cell. Insufficient
data on human ionic currents was available, however data on the late pregnant
rat was more readily available, and therefore experimental data on pregnant rat
myometrial cells in both room and body temperature were used to construct the
model. When quantitative data for rat was not available, human data in similar
condition was substituted.
The model was constructed with two main parts. The first one is the electro-
chemical subsystem which consisted of all the inward and outward membrane
currents, electrogenic exchangers and pumps. The ionic currents were modelled
using Hodgkin-Huxley-type equations with a modified fluid compartment and
SR model developed by Kapela et al. for rat mesenteric smooth muscle [55] and
Bursztyn et al. for human myometrium [38]. The second part of the model, the
chemo-mechanical subsystem which was developed by Yang [49] described the
generation of the contractile force through the myosin phosphorylation (4-state
cross-bridge model), based on earlier development by Hai and Murphy [56, 57].
Figure 2.1 shows a functional block diagram of the myometrial cell model with
the two coupled subsystem.
The aim of the model was to reproduce the electrical and contractile activ-
ities, resting membrane, peak potential and spike frequency of a late pregnant
42
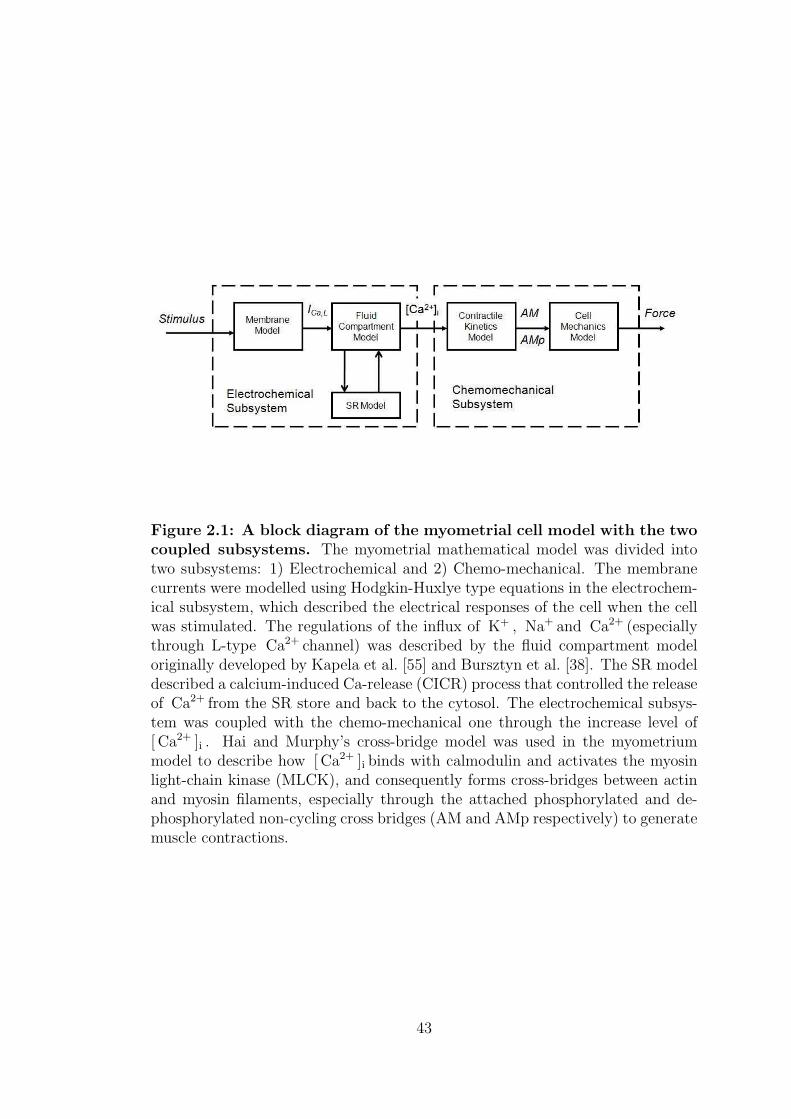
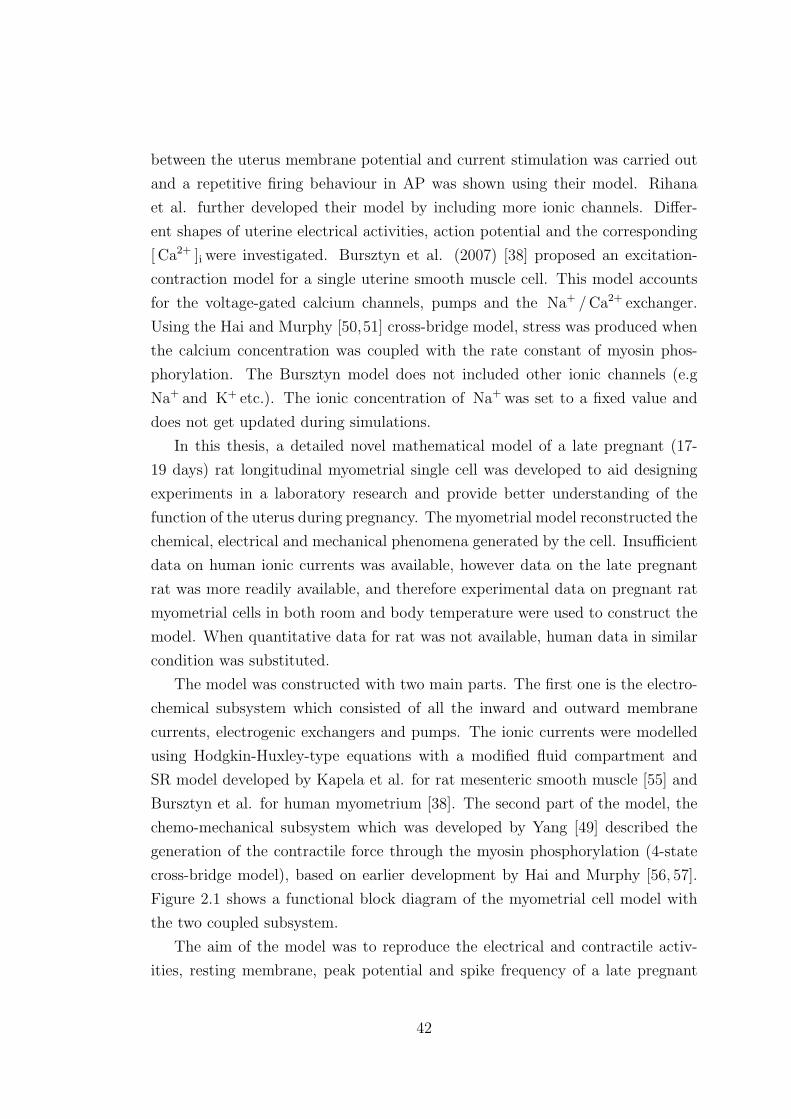
Figure 2.1: A block diagram of the myometrial cell model with the twocoupled subsystems. The myometrial mathematical model was divided intotwo subsystems: 1) Electrochemical and 2) Chemo-mechanical. The membranecurrents were modelled using Hodgkin-Huxlye type equations in the electrochem-ical subsystem, which described the electrical responses of the cell when the cellwas stimulated. The regulations of the influx of K+ , Na+ and Ca2+ (especiallythrough L-type Ca2+ channel) was described by the fluid compartment modeloriginally developed by Kapela et al. [55] and Bursztyn et al. [38]. The SR modeldescribed a calcium-induced Ca-release (CICR) process that controlled the releaseof Ca2+ from the SR store and back to the cytosol. The electrochemical subsys-tem was coupled with the chemo-mechanical one through the increase level of[ Ca2+ ]i . Hai and Murphy’s cross-bridge model was used in the myometriummodel to describe how [ Ca2+ ]i binds with calmodulin and activates the myosinlight-chain kinase (MLCK), and consequently forms cross-bridges between actinand myosin filaments, especially through the attached phosphorylated and de-phosphorylated non-cycling cross bridges (AM and AMp respectively) to generatemuscle contractions.
43
uterine cell. The model was validated by its ability to produce an action poten-
tial (AP) with bursts similar to those observed experimentally and intracellular
[ Ca2+ ]i transients in physiological ranges.
2.1 Membrane current model in myometrium
Cellular electrical activity can be explained in terms of electrical circuits. Since
the charges inside and outside a cell are imbalanced, which creates a potential
difference across the cell membrane. The phospholipid bilayer cell membranes
acts as a capacitor and accumulates charge as electrical potential across the cell
changes. Also, different ionic permeabilities of the membrane (ion channels) act
as resistors and the electrochemical driving forces in the cell act as batteries in the
electrical circuits. These ionic and capacitive currents are arranged in a parallel
circuit as shown in figure 2.2.
According to Ohms law, current, I is directly proportional to voltage, V and
conductance g. Since g is inversely proportional to resistance, R, I can be ex-
pressed as:
I = gV =V
R(2.1)
To understand and study the dynamics of the cell, equation 2.1 can be re-
arranged in a more useful way to investigate the time course and how various
currents flow in and out of the cell. Assuming the reversal potential, E stays
constant during the process, the current equation can be written as:
I = g(V − E) (2.2)
where V is the membrane potential, i.e. the potential difference between the
inside and the outside of the cell and (V - E) represents the driving force across
the membrane provided by the batteries. Since there are a number of ionic
currents in a cell, the sum of the total current, Itot can be presented as:
Itot =∑
IX =∑
gX (V − EX ) =
= gNa (V − ENa ) + gK (V − EK )− ... (2.3)
where gX and EX are the conductance and reversal potential of a particular ion,
44
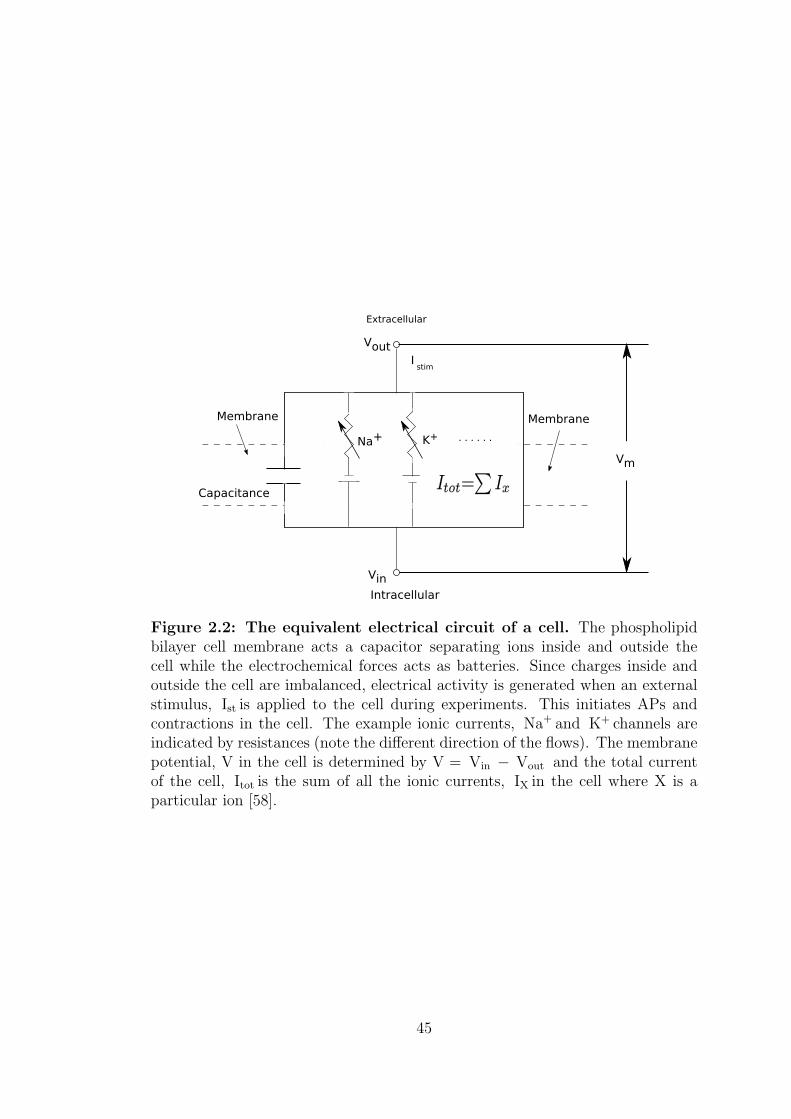
Figure 2.2: The equivalent electrical circuit of a cell. The phospholipidbilayer cell membrane acts a capacitor separating ions inside and outside thecell while the electrochemical forces acts as batteries. Since charges inside andoutside the cell are imbalanced, electrical activity is generated when an externalstimulus, Ist is applied to the cell during experiments. This initiates APs andcontractions in the cell. The example ionic currents, Na+ and K+ channels areindicated by resistances (note the different direction of the flows). The membranepotential, V in the cell is determined by V = Vin − Vout and the total currentof the cell, Itot is the sum of all the ionic currents, IX in the cell where X is aparticular ion [58].
45
X, for example: sodium (Na+ ) and potassium (K+ ) etc. Since each circuit
element on the circuit diagram are in parallel, and assuming the cell membrane
acts as a capacitor, the capacitive current, Icap can be translated into an ordinary
differential equation (ODE):
Icap = CdV
dt(2.4)
where C is the capacitance of the cell. Also Kirchoffs current law states that
the sum of the currents flowing towards a certain point is equal to the sum of
currents flowing away from that point. Therefore the capacitive current must be
equal to the sum of the ionic currents and any currents that might be applied
during experimental manipulation, Ist . This can be expressed as:
Icap = −( Itot + Ist ) (2.5)
where the leading negative sign is necessary because of how current direction is
defined by convention. Combining equation 2.3 and equation 2.4, the expression
becomes:
CdV
dt= −
∑gX (V − EX )− Ist (2.6)
Since the conductances are generally not linearly dependent on the voltage (some-
times time), solving the differential equation for membrane voltage is not straight
forward. The relationships between conductances, voltage and time must be
found in order to study the activity of the cell. The ionic currents through ionic
channels of the cell may be computed from the transmembrane voltage according
to a Hodgkin-Huxley-type model [59] developed in 1952. In their model, ionic
currents are modelled as “gates”. Activation gates correspond to activation of
the ion channel and ions get transported across the cell membrane. Inactivation
gates on the other hand correspond to an inactivation of the channel (by confor-
mation changes in the channel protein) and stop ions getting transferred across.
The ionic conductance can be expressed as:
gX = gX ·ma · hb (2.7)
where gX is the maximal conductance, m and h are the activation and inactivation
46
gating variables respectively, a and b are integers chosen to fit the experimen-
tal data, and therefore an ionic current, IX can be described by the following
equation:
IX = gX ·ma · hb(V − EX ) (2.8)
The reversal potential of a particular ion is determined by the Nernst equation
and is given by:
EX =RT
zFln
([X]o
[X]i
)(2.9)
where F is the Faraday constant, R is the ideal gas constant, T is the absolute
temperature, and [X]o , [X]i are the extracellular and intracellular concentration
of the ion X. The gating variables for the ion channels were postulated to satisfy
linear differential equations where the variables “relax” to voltage-dependent val-
ues, or steady-state values m∞ and n∞. These values vary from one to zero with
voltage-dependent time constant τm or τh and are related as follows:
dm
dt=
m∞ −m
τm
(2.10)
dh
dt=
h∞ − h
τh
(2.11)
A total of 15 membrane currents in the myometrial model were developed as il-
lustrated in figure 2.3. The membrane currents are separated into 3 categories: 1)
Inward currents, currents which flow into the cell, i.e. hyperpolarisation-activated
current ( Ih ), L-type calcium current ( ICaL ), T-type calcium current ( ICaT ),
fast sodium current ( INa ) and store-operated non-selective current ( ISOC ). 2)
Outward currents, currents which flow out of the cell, i.e. two delayed rec-
tifying K+ currents ( IK1 and IK2 ), A-type transient K+ current ( IKA ), Ca2+ -
activated K+ current ( IKCa ) and a K+ background leakage current ( IKleak ). Fi-
nally 3) Other currents where the net flow of the current can be in both di-
rections, depending on the ionic concentration and the voltage of the cell, i.e.
Ca2+ -activated Cl− current ( ICl ) and non-specific cation current ( INSCC ). The
model also includes a calcium pump ( ICapump ), a Na+ -K+ pump ( INaK ), a
Na+ - Ca2+ exchanger ( INaCa ) and a sodium-potassium-chloride co-transporter
47
( INaKCl ).
The current model was constructed based on published experimental data
using information such as steady-state activation and inactivation, activation
and inactivation time constants, current-voltage (I-V) relationships and current
traces. Experimentally obtained figures were digitized into the computer us-
ing ScanIt or Engauge digitizer programs. Using graphing packages such as
SigmaPlot or gnuplot, an appropriate function was fitted to the data and the
variables of the function returned. The functions were chosen by inspection prior
to fitting. These were then be used to reconstruct an equation for the whole ion
channel. The simulated results were compared and validated to the experimen-
tally observed data when available. The following ionic current equations were
normalised in units of pA/pF while membrane voltages are in mV and conduc-
tances in nS/pF. The parameter values, initial values of the gating variables and
all the symbols used in the model including their definitions are all listed in the
appendix.
2.1.1 Inward currents
The single myometrial cell model consists of four inward membrane currents:
hyperpolarisation-activated current, Ih , L- and T-type calcium current, ICaL and
ICaT , fast sodium current, INa and store-operated non-selective cation current,
ISOC . ICaL and Ih were the only experiments conducted at body temperature
or which could be converted using the value of Q10 provided. When Q10 was
not provided for temperature correction, the dynamics of the currents were left
unchanged, assuming the currents behave similarly in both room and body tem-
perature. Also, there are no existing steady-state data on myometrial T-type
calcium channel, so data from rat genes α1G/Cav3.1 were substituted and mod-
ified to match the current density in human myometrium data.
2.1.1.1 Hyperpolarisation-activated current – Ih
Hyperpolarisation-activated current ( Ih ) has been identified in rat circular and
longitudinal myometrium [26, 60]. This current is also called If (funny current)
in cardiac cells and is found commonly in other types of myogenic cells. Ih is
activated by hyperpolarisaion of the membrane potential below -60 mV with a
48
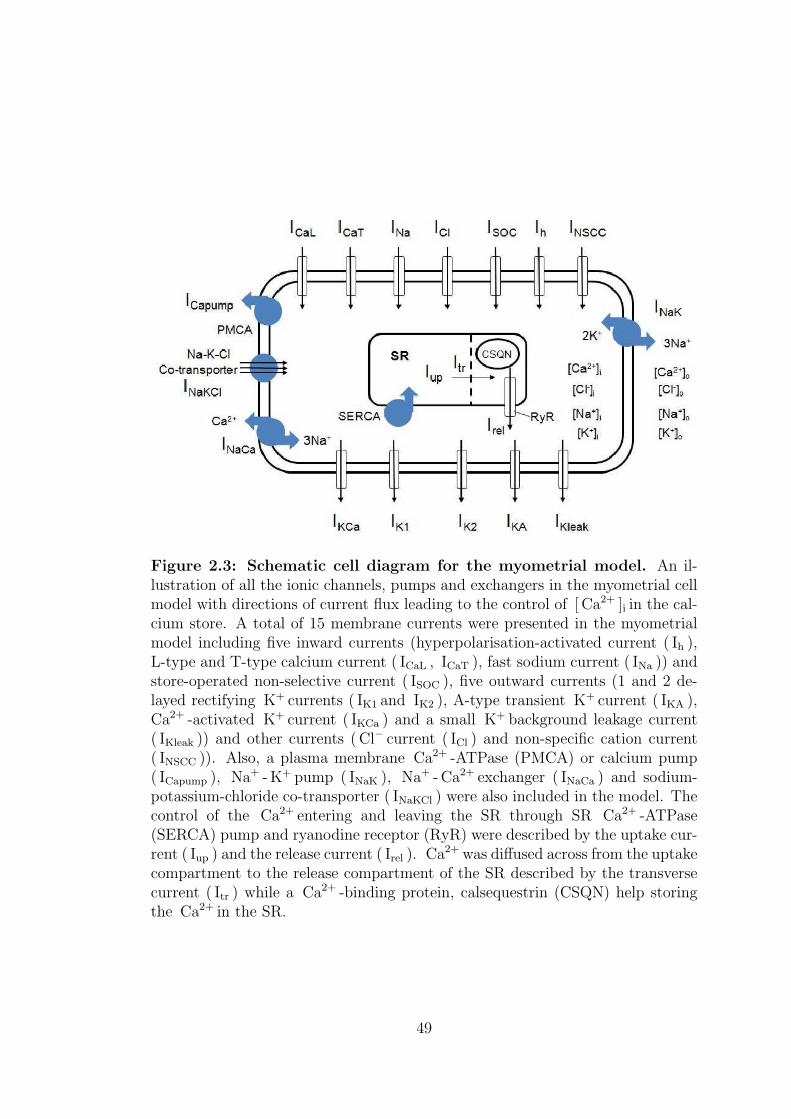
Figure 2.3: Schematic cell diagram for the myometrial model. An il-lustration of all the ionic channels, pumps and exchangers in the myometrial cellmodel with directions of current flux leading to the control of [ Ca2+ ]i in the cal-cium store. A total of 15 membrane currents were presented in the myometrialmodel including five inward currents (hyperpolarisation-activated current ( Ih ),L-type and T-type calcium current ( ICaL , ICaT ), fast sodium current ( INa )) andstore-operated non-selective current ( ISOC ), five outward currents (1 and 2 de-layed rectifying K+ currents ( IK1 and IK2 ), A-type transient K+ current ( IKA ),Ca2+ -activated K+ current ( IKCa ) and a small K+ background leakage current( IKleak )) and other currents (Cl− current ( ICl ) and non-specific cation current( INSCC )). Also, a plasma membrane Ca2+ -ATPase (PMCA) or calcium pump( ICapump ), Na+ -K+ pump ( INaK ), Na+ - Ca2+ exchanger ( INaCa ) and sodium-potassium-chloride co-transporter ( INaKCl ) were also included in the model. Thecontrol of the Ca2+ entering and leaving the SR through SR Ca2+ -ATPase(SERCA) pump and ryanodine receptor (RyR) were described by the uptake cur-rent ( Iup ) and the release current ( Irel ). Ca2+ was diffused across from the uptakecompartment to the release compartment of the SR described by the transversecurrent ( Itr ) while a Ca2+ -binding protein, calsequestrin (CSQN) help storingthe Ca2+ in the SR.
49
half maximal activation around -85 mV and does not inactivate. The activa-
tion time of Ih is slow, taking around 1 s to fully activate. Ih is permeable to
K+ and Na+ with a permeability ratio of PNa /PK = 0.35 [61]. The reversal
potential of Ih , Eh is around -20 mV and is dependent on the extracellular con-
centration of K+ and Na+ , with excess K+ increasing the current amplitude and
low Na+ reducing the amplitude. Application of Cs+ inhibits and limits the fre-
quency of Ih . Since Ih is activated at the resting membrane potential, this current
is responsible in maintaining the resting potential and spontaneous activities in
myometrium.
There are two separate experimental studies to date which have reported
on Ih in pregnant myometrium. Okabe et al. [26] conducted their research with
17-19-day pregnant rat circular uterine cells at both 30◦C and 24◦C whereas
Satoh [60] performed an experiment on 18-day pregnant rat longitudinal cells at
room temperature, 22◦C. In order to construct the whole cell myometrial model
in body temperature, the activation time constant of Ih was corrected with a Q10
value of 3.5 [26]. Also, the single cell model was developed for a longitudinal cell,
the half-activation obtained in circular cells was modified and left-shifted by 15
mV to match the experimental I-V data in longitudinal cells [26]. The current
density of Ih in longitudinal myometrial cells is -1.03 pA/pF at -120 mV from a
holding potential of -50 mV at room temperature [60]. Steady-state activation
and time constant, I-V curve and current tracings of Ih are all shown in figure
2.4.
Hyperpolarisation-activated current – Ih
Ih = gh y(V − Eh ) (2.12)
Eh =RT
Fln
([ K+ ]o + ( PNa / PK ) [ Na+ ]o
[ K+ ]i + ( PNa / PK ) [ Na+ ]i
)(2.13)
y∞ =1
1 + exp
(V + 105.39
8.66
) (2.14)
τy =1
3.5x10⁻⁶ exp (−0.0497V) + 0.04 exp (0.0521V)(2.15)
dy
dt=
y∞ − y
τy
(2.16)
50
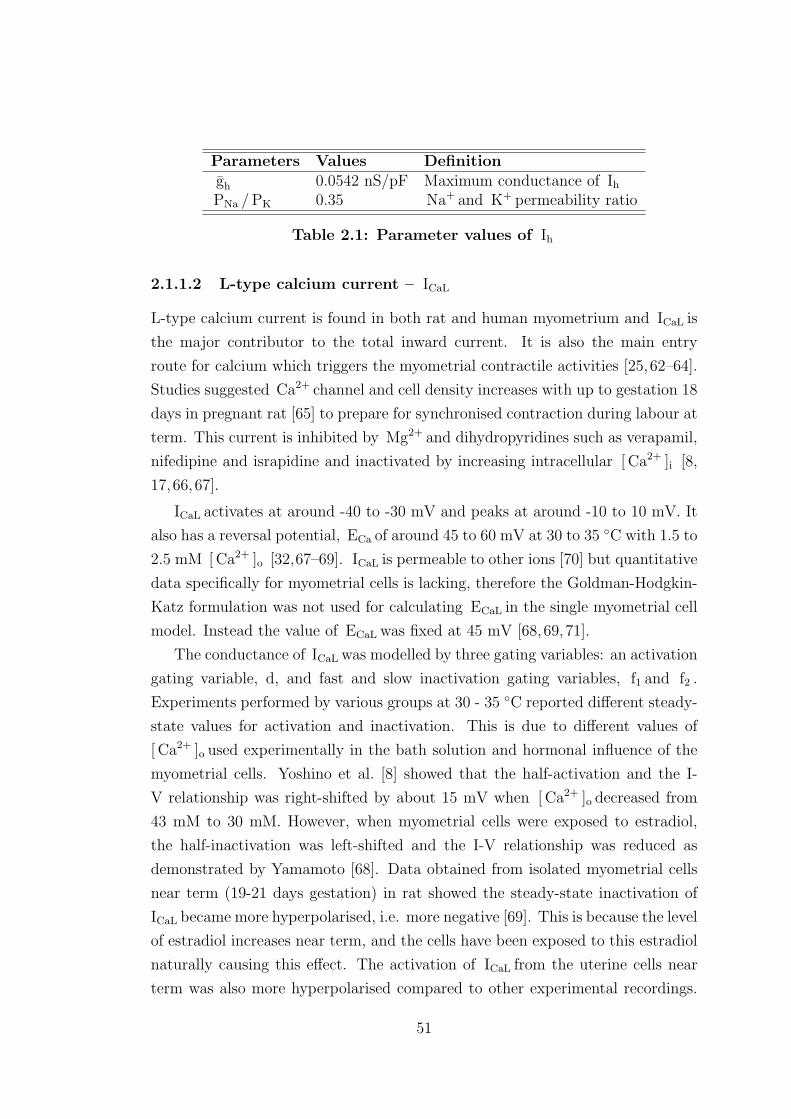
Parameters Values Definitiongh 0.0542 nS/pF Maximum conductance of IhPNa /PK 0.35 Na+ and K+ permeability ratio
Table 2.1: Parameter values of Ih
2.1.1.2 L-type calcium current – ICaL
L-type calcium current is found in both rat and human myometrium and ICaL is
the major contributor to the total inward current. It is also the main entry
route for calcium which triggers the myometrial contractile activities [25,62–64].
Studies suggested Ca2+ channel and cell density increases with up to gestation 18
days in pregnant rat [65] to prepare for synchronised contraction during labour at
term. This current is inhibited by Mg2+ and dihydropyridines such as verapamil,
nifedipine and israpidine and inactivated by increasing intracellular [ Ca2+ ]i [8,
17,66,67].
ICaL activates at around -40 to -30 mV and peaks at around -10 to 10 mV. It
also has a reversal potential, ECa of around 45 to 60 mV at 30 to 35 ◦C with 1.5 to
2.5 mM [ Ca2+ ]o [32,67–69]. ICaL is permeable to other ions [70] but quantitative
data specifically for myometrial cells is lacking, therefore the Goldman-Hodgkin-
Katz formulation was not used for calculating ECaL in the single myometrial cell
model. Instead the value of ECaL was fixed at 45 mV [68,69,71].
The conductance of ICaL was modelled by three gating variables: an activation
gating variable, d, and fast and slow inactivation gating variables, f1 and f2 .
Experiments performed by various groups at 30 - 35 ◦C reported different steady-
state values for activation and inactivation. This is due to different values of
[ Ca2+ ]o used experimentally in the bath solution and hormonal influence of the
myometrial cells. Yoshino et al. [8] showed that the half-activation and the I-
V relationship was right-shifted by about 15 mV when [ Ca2+ ]o decreased from
43 mM to 30 mM. However, when myometrial cells were exposed to estradiol,
the half-inactivation was left-shifted and the I-V relationship was reduced as
demonstrated by Yamamoto [68]. Data obtained from isolated myometrial cells
near term (19-21 days gestation) in rat showed the steady-state inactivation of
ICaL became more hyperpolarised, i.e. more negative [69]. This is because the level
of estradiol increases near term, and the cells have been exposed to this estradiol
naturally causing this effect. The activation of ICaL from the uterine cells near
term was also more hyperpolarised compared to other experimental recordings.
51
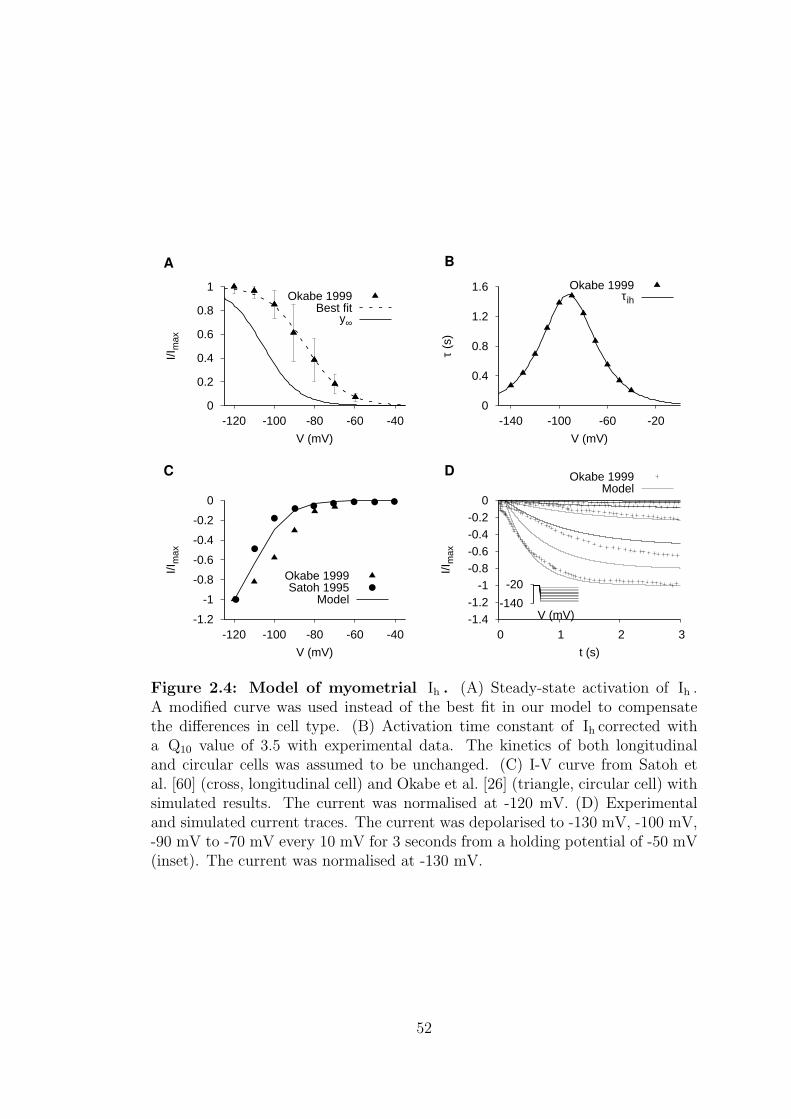
0
0.2
0.4
0.6
0.8
1
-120 -100 -80 -60 -40
I/Im
ax
V (mV)
A
Okabe 1999Best fit
y∞
0
0.4
0.8
1.2
1.6
-140 -100 -60 -20
τ (s
)V (mV)
B
Okabe 1999τih
-1.2
-1
-0.8
-0.6
-0.4
-0.2
0
-120 -100 -80 -60 -40
I/Im
ax
V (mV)
C
Okabe 1999Satoh 1995
Model
-1.4-1.2
-1-0.8-0.6-0.4-0.2
0
0 1 2 3
I/Im
ax
t (s)
D Okabe 1999Model
-140
-20
V (mV)
Figure 2.4: Model of myometrial Ih . (A) Steady-state activation of Ih .A modified curve was used instead of the best fit in our model to compensatethe differences in cell type. (B) Activation time constant of Ih corrected witha Q10 value of 3.5 with experimental data. The kinetics of both longitudinaland circular cells was assumed to be unchanged. (C) I-V curve from Satoh etal. [60] (cross, longitudinal cell) and Okabe et al. [26] (triangle, circular cell) withsimulated results. The current was normalised at -120 mV. (D) Experimentaland simulated current traces. The current was depolarised to -130 mV, -100 mV,-90 mV to -70 mV every 10 mV for 3 seconds from a holding potential of -50 mV(inset). The current was normalised at -130 mV.
52
The steady-state activation and inactivation of the model was obtained by fitting
to the experimental data obtained from Yamamoto in control condition at body
temperature [68] (figure 2.5 (A) and (B)). Other experimental data from both cell
and tissue at body temperature were also presented in the figure for comparison.
The activation time constant, τd of the model was obtained by fitting the
initial few seconds of time tracings obtained from available experimental data
prior to ICaL reaching its peak [32] (figure 2.5 (C)). The fast and slow inactivation
time constants, τ f1 and τ f2 were obtained from Amedee et al. [67] illustrated in
figure 2.5 (D). The calcium-dependent inactivation of ICaL , fCa was described by
a Hill equation with the half saturation concentration of ICaL , Km,CaL = 0.6 µM
and a Hill coefficient of 1. The simulated I-V relationship and current traces of
ICaL were compared to experimental data shown in figure 2.5 (E) and (F). The
current traces produced by the model shows ICaL reached its peak in about 12
ms before the current inactivated. The simulated I-V relationship shows that
ICaL first appears at a V of around -40 to -30 mV and peaks at mV, similar to
experimental reported data [32,67–69].
53
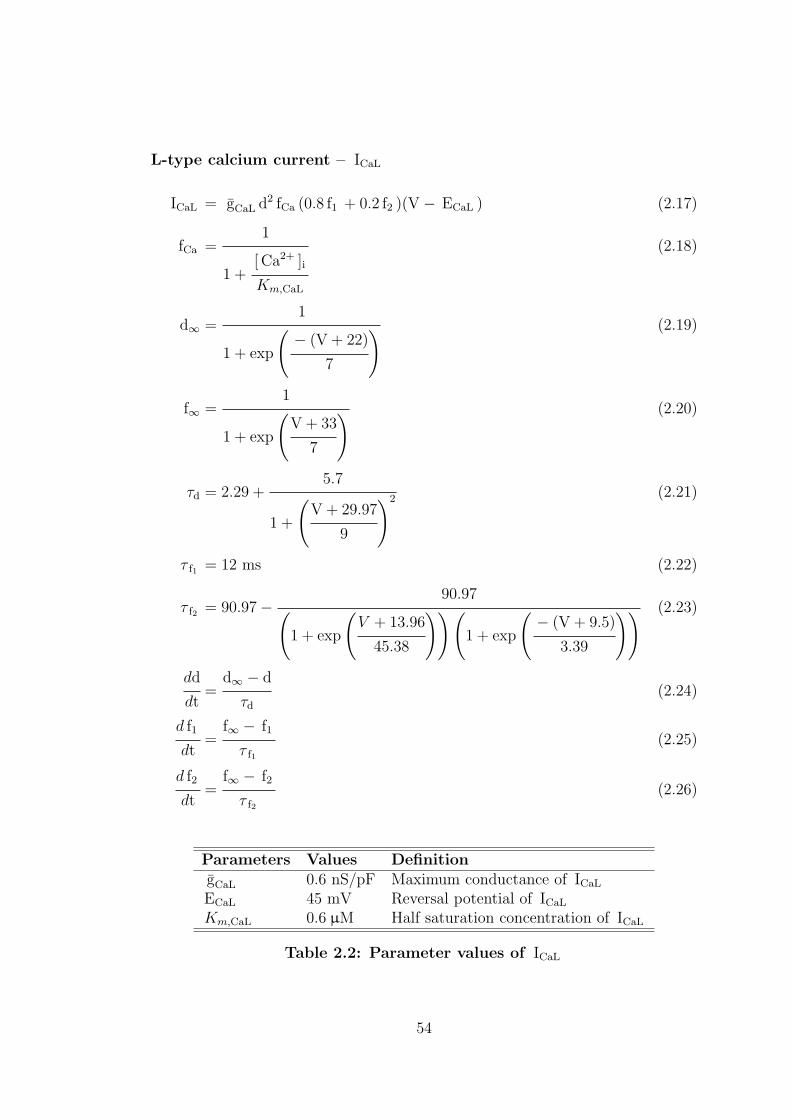
L-type calcium current – ICaL
ICaL = gCaL d2 fCa (0.8 f1 + 0.2 f2 )(V − ECaL ) (2.17)
fCa =1
1 +[ Ca2+ ]i
Km,CaL
(2.18)
d∞ =1
1 + exp
(− (V + 22)
7
) (2.19)
f∞ =1
1 + exp
(V + 33
7
) (2.20)
τd = 2.29 +5.7
1 +
(V + 29.97
9
)2 (2.21)
τ f1 = 12 ms (2.22)
τ f2 = 90.97− 90.97(
1 + exp
(V + 13.96
45.38
))(1 + exp
(− (V + 9.5)
3.39
)) (2.23)
dd
dt=
d∞ − d
τd
(2.24)
d f1
dt=
f∞ − f1
τ f1
(2.25)
d f2
dt=
f∞ − f2
τ f2
(2.26)
Parameters Values DefinitiongCaL 0.6 nS/pF Maximum conductance of ICaL
ECaL 45 mV Reversal potential of ICaL
Km,CaL 0.6 µM Half saturation concentration of ICaL
Table 2.2: Parameter values of ICaL
54
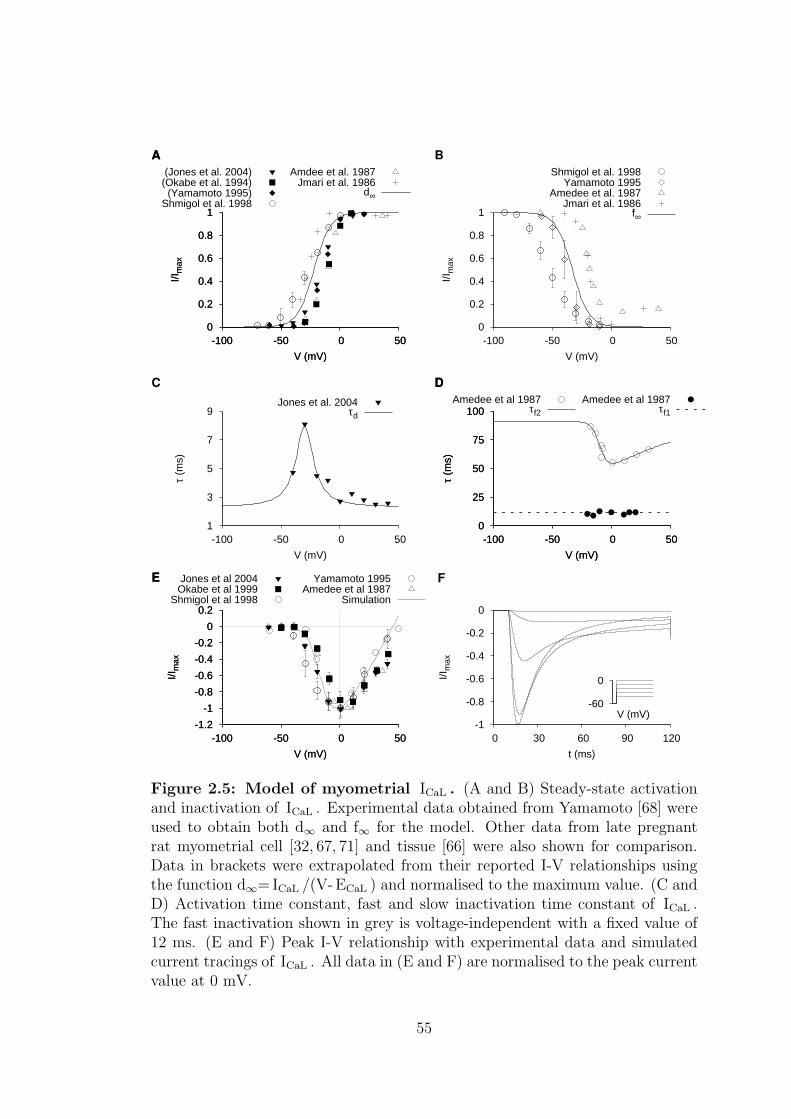
0
0.2
0.4
0.6
0.8
1
-100 -50 0 50
I/Im
ax
V (mV)
A
(Jones et al. 2004)(Okabe et al. 1994)
(Yamamoto 1995)Shmigol et al. 1998
0
0.2
0.4
0.6
0.8
1
-100 -50 0 50
I/Im
ax
V (mV)
A
Amdee et al. 1987Jmari et al. 1986
d∞
0
0.2
0.4
0.6
0.8
1
-100 -50 0 50
I/Im
ax
V (mV)
B
Shmigol et al. 1998Yamamoto 1995
Amedee et al. 1987Jmari et al. 1986
f∞
1
3
5
7
9
-100 -50 0 50
τ (m
s)
V (mV)
C
Jones et al. 2004τd
0
25
50
75
100
-100 -50 0 50
τ (m
s)
V (mV)
D
Amedee et al 1987τf2
0
25
50
75
100
-100 -50 0 50
τ (m
s)
V (mV)
D
Amedee et al 1987τf1
-1.2
-1
-0.8
-0.6
-0.4
-0.2
0
0.2
-100 -50 0 50
I/Im
ax
V (mV)
E Jones et al 2004Okabe et al 1999
Shmigol et al 1998
-1.2
-1
-0.8
-0.6
-0.4
-0.2
0
0.2
-100 -50 0 50
I/Im
ax
V (mV)
E Yamamoto 1995Amedee et al 1987
Simulation
-1
-0.8
-0.6
-0.4
-0.2
0
0 30 60 90 120
I/Im
ax
t (ms)
F
-60
0
V (mV)
Figure 2.5: Model of myometrial ICaL . (A and B) Steady-state activationand inactivation of ICaL . Experimental data obtained from Yamamoto [68] wereused to obtain both d∞ and f∞ for the model. Other data from late pregnantrat myometrial cell [32, 67, 71] and tissue [66] were also shown for comparison.Data in brackets were extrapolated from their reported I-V relationships usingthe function d∞=ICaL /(V-ECaL ) and normalised to the maximum value. (C andD) Activation time constant, fast and slow inactivation time constant of ICaL .The fast inactivation shown in grey is voltage-independent with a fixed value of12 ms. (E and F) Peak I-V relationship with experimental data and simulatedcurrent tracings of ICaL . All data in (E and F) are normalised to the peak currentvalue at 0 mV.
55
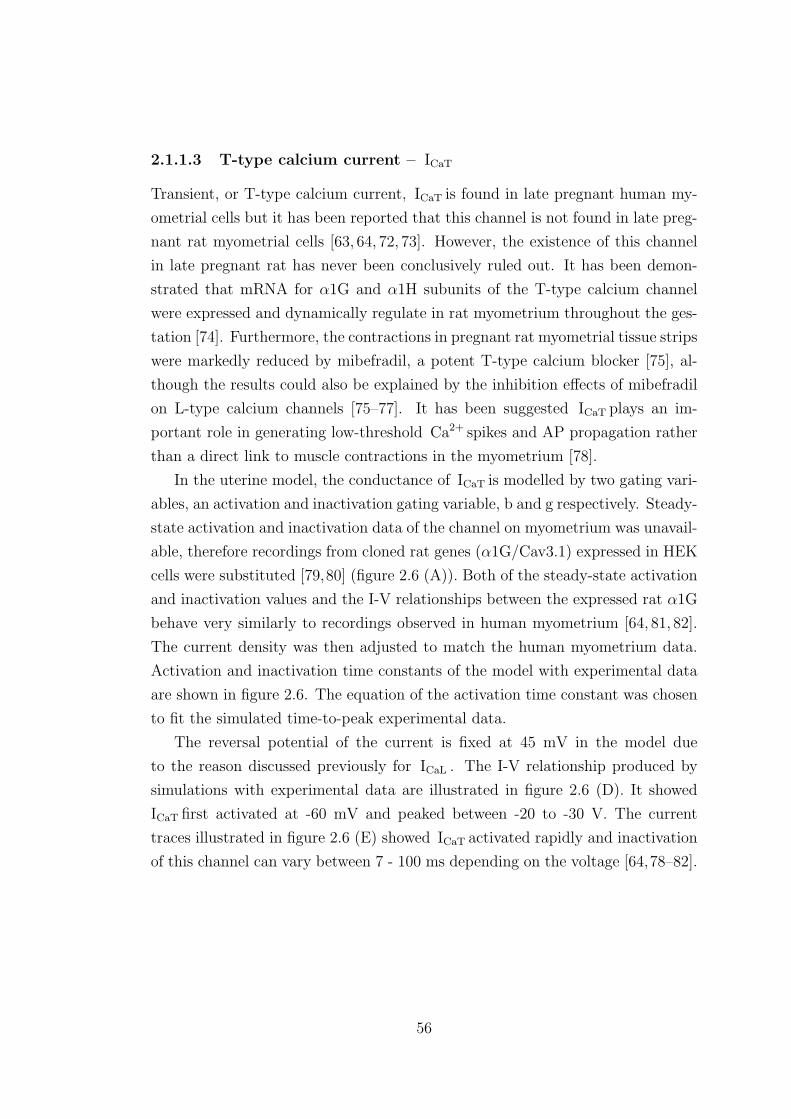
2.1.1.3 T-type calcium current – ICaT
Transient, or T-type calcium current, ICaT is found in late pregnant human my-
ometrial cells but it has been reported that this channel is not found in late preg-
nant rat myometrial cells [63, 64, 72, 73]. However, the existence of this channel
in late pregnant rat has never been conclusively ruled out. It has been demon-
strated that mRNA for α1G and α1H subunits of the T-type calcium channel
were expressed and dynamically regulate in rat myometrium throughout the ges-
tation [74]. Furthermore, the contractions in pregnant rat myometrial tissue strips
were markedly reduced by mibefradil, a potent T-type calcium blocker [75], al-
though the results could also be explained by the inhibition effects of mibefradil
on L-type calcium channels [75–77]. It has been suggested ICaT plays an im-
portant role in generating low-threshold Ca2+ spikes and AP propagation rather
than a direct link to muscle contractions in the myometrium [78].
In the uterine model, the conductance of ICaT is modelled by two gating vari-
ables, an activation and inactivation gating variable, b and g respectively. Steady-
state activation and inactivation data of the channel on myometrium was unavail-
able, therefore recordings from cloned rat genes (α1G/Cav3.1) expressed in HEK
cells were substituted [79,80] (figure 2.6 (A)). Both of the steady-state activation
and inactivation values and the I-V relationships between the expressed rat α1G
behave very similarly to recordings observed in human myometrium [64, 81, 82].
The current density was then adjusted to match the human myometrium data.
Activation and inactivation time constants of the model with experimental data
are shown in figure 2.6. The equation of the activation time constant was chosen
to fit the simulated time-to-peak experimental data.
The reversal potential of the current is fixed at 45 mV in the model due
to the reason discussed previously for ICaL . The I-V relationship produced by
simulations with experimental data are illustrated in figure 2.6 (D). It showed
ICaT first activated at -60 mV and peaked between -20 to -30 V. The current
traces illustrated in figure 2.6 (E) showed ICaT activated rapidly and inactivation
of this channel can vary between 7 - 100 ms depending on the voltage [64,78–82].
56
T-type calcium current – ICaT
ICaT = gCaT b2g(V − ECaT ) (2.27)
b∞ =1
1 + exp
(− (V + 54.23)
9.88
) (2.28)
g∞ = 0.02 +0.98
1 + exp
(V + 72.98
4.64
) (2.29)
τb = 0.45 +3.9
1 +
(V + 66
26
)2 (2.30)
τg = 150− 150(
1 + exp
(V − 417.43
203.18
))(1 + exp
(− (V + 61.11)
8.07
)) (2.31)
db
dt=
b∞ − b
τb
(2.32)
dg
dt=
g∞ − g
τg
(2.33)
Parameters Values DefinitiongCaT 0.0174 nS/pF Maximum conductance of ICaT
ECaT 42 mV Reversal potential of ICaT
Table 2.3: Parameter values of ICaT
2.1.1.4 Fast sodium current – INa
Voltage activated inward fast sodium channel is found in pregnant human myome-
trial cells and tissues. It was first identified by Amedee et al. in myometrium [83]
and it was found that INa is expressed in some but not all late pregnant rat my-
ometrial cells [8,27,62]. This channel is tetrotodoxin- and sagitoxin- sensitive. In
rat INa activates at around -50 to -40 mV and its I-V relationship shows this cur-
rent peaks at -10 to 10 mV, with a magnitude of 0.86 to 3.67 pA/pF [8,27,72,84].
57
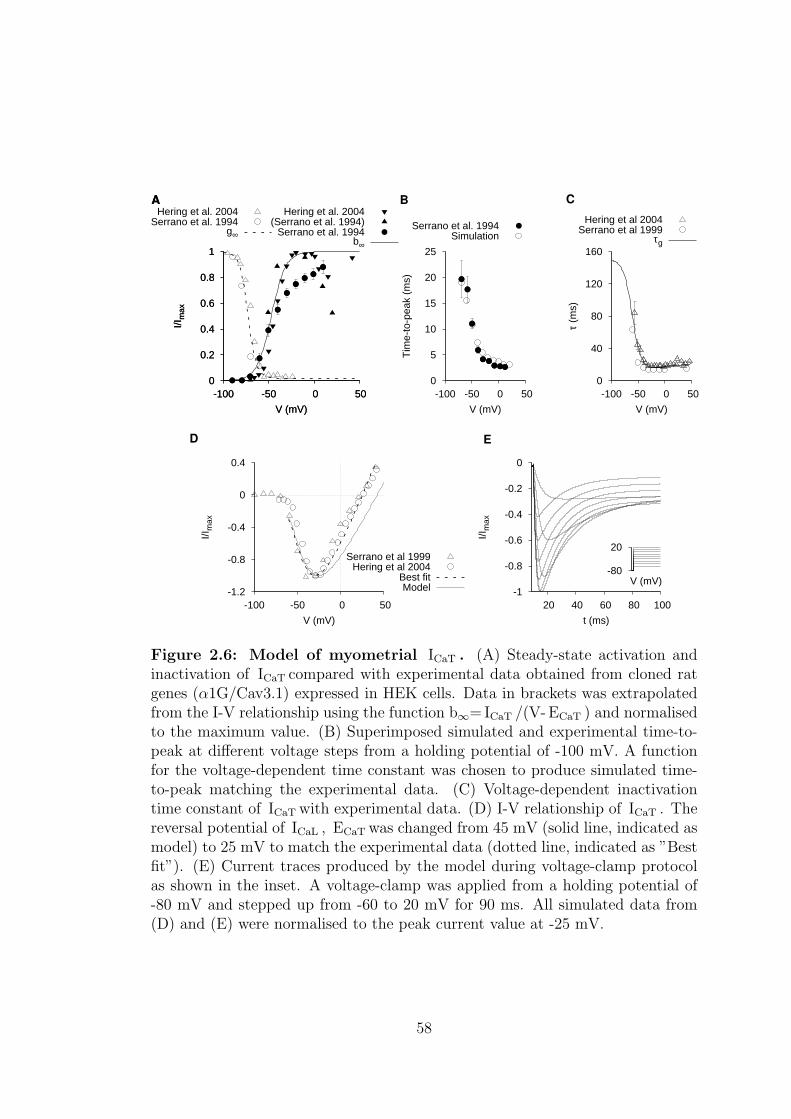
0
0.2
0.4
0.6
0.8
1
-100 -50 0 50
I/Im
ax
V (mV)
AHering et al. 2004
(Serrano et al. 1994)Serrano et al. 1994
b∞
0
0.2
0.4
0.6
0.8
1
-100 -50 0 50
I/Im
ax
V (mV)
AHering et al. 2004
Serrano et al. 1994g∞
0
5
10
15
20
25
-100 -50 0 50T
ime-
to-p
eak
(ms)
V (mV)
B
Serrano et al. 1994Simulation
0
40
80
120
160
-100 -50 0 50
τ (m
s)
V (mV)
C
Hering et al 2004Serrano et al 1999
τg
-1.2
-0.8
-0.4
0
0.4
-100 -50 0 50
I/Im
ax
V (mV)
D
Serrano et al 1999Hering et al 2004
Best fitModel -1
-0.8
-0.6
-0.4
-0.2
0
20 40 60 80 100
I/Im
ax
t (ms)
E
-80
20
V (mV)
Figure 2.6: Model of myometrial ICaT . (A) Steady-state activation andinactivation of ICaT compared with experimental data obtained from cloned ratgenes (α1G/Cav3.1) expressed in HEK cells. Data in brackets was extrapolatedfrom the I-V relationship using the function b∞=ICaT /(V-ECaT ) and normalisedto the maximum value. (B) Superimposed simulated and experimental time-to-peak at different voltage steps from a holding potential of -100 mV. A functionfor the voltage-dependent time constant was chosen to produce simulated time-to-peak matching the experimental data. (C) Voltage-dependent inactivationtime constant of ICaT with experimental data. (D) I-V relationship of ICaT . Thereversal potential of ICaL , ECaT was changed from 45 mV (solid line, indicated asmodel) to 25 mV to match the experimental data (dotted line, indicated as ”Bestfit”). (E) Current traces produced by the model during voltage-clamp protocolas shown in the inset. A voltage-clamp was applied from a holding potential of-80 mV and stepped up from -60 to 20 mV for 90 ms. All simulated data from(D) and (E) were normalised to the peak current value at -25 mV.
58
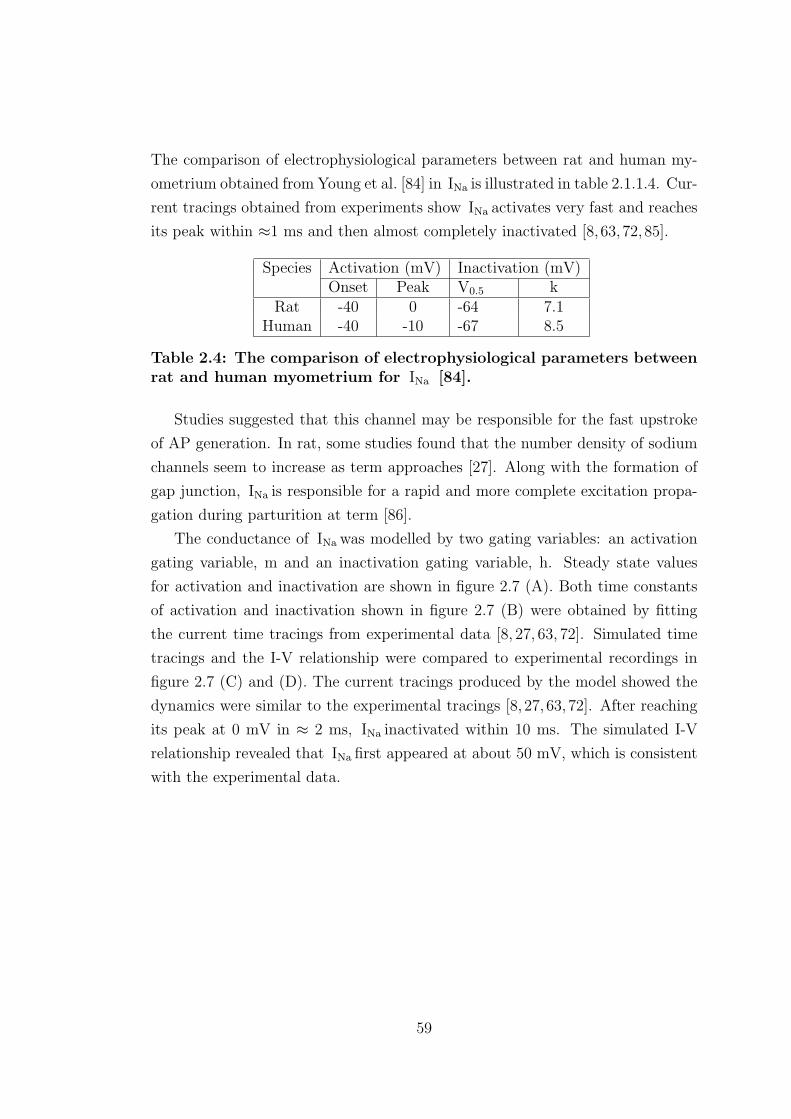
The comparison of electrophysiological parameters between rat and human my-
ometrium obtained from Young et al. [84] in INa is illustrated in table 2.1.1.4. Cur-
rent tracings obtained from experiments show INa activates very fast and reaches
its peak within ≈1 ms and then almost completely inactivated [8, 63,72,85].
Species Activation (mV) Inactivation (mV)Onset Peak V0.5 k
Rat -40 0 -64 7.1Human -40 -10 -67 8.5
Table 2.4: The comparison of electrophysiological parameters betweenrat and human myometrium for INa [84].
Studies suggested that this channel may be responsible for the fast upstroke
of AP generation. In rat, some studies found that the number density of sodium
channels seem to increase as term approaches [27]. Along with the formation of
gap junction, INa is responsible for a rapid and more complete excitation propa-
gation during parturition at term [86].
The conductance of INa was modelled by two gating variables: an activation
gating variable, m and an inactivation gating variable, h. Steady state values
for activation and inactivation are shown in figure 2.7 (A). Both time constants
of activation and inactivation shown in figure 2.7 (B) were obtained by fitting
the current time tracings from experimental data [8, 27, 63, 72]. Simulated time
tracings and the I-V relationship were compared to experimental recordings in
figure 2.7 (C) and (D). The current tracings produced by the model showed the
dynamics were similar to the experimental tracings [8, 27, 63, 72]. After reaching
its peak at 0 mV in ≈ 2 ms, INa inactivated within 10 ms. The simulated I-V
relationship revealed that INa first appeared at about 50 mV, which is consistent
with the experimental data.
59
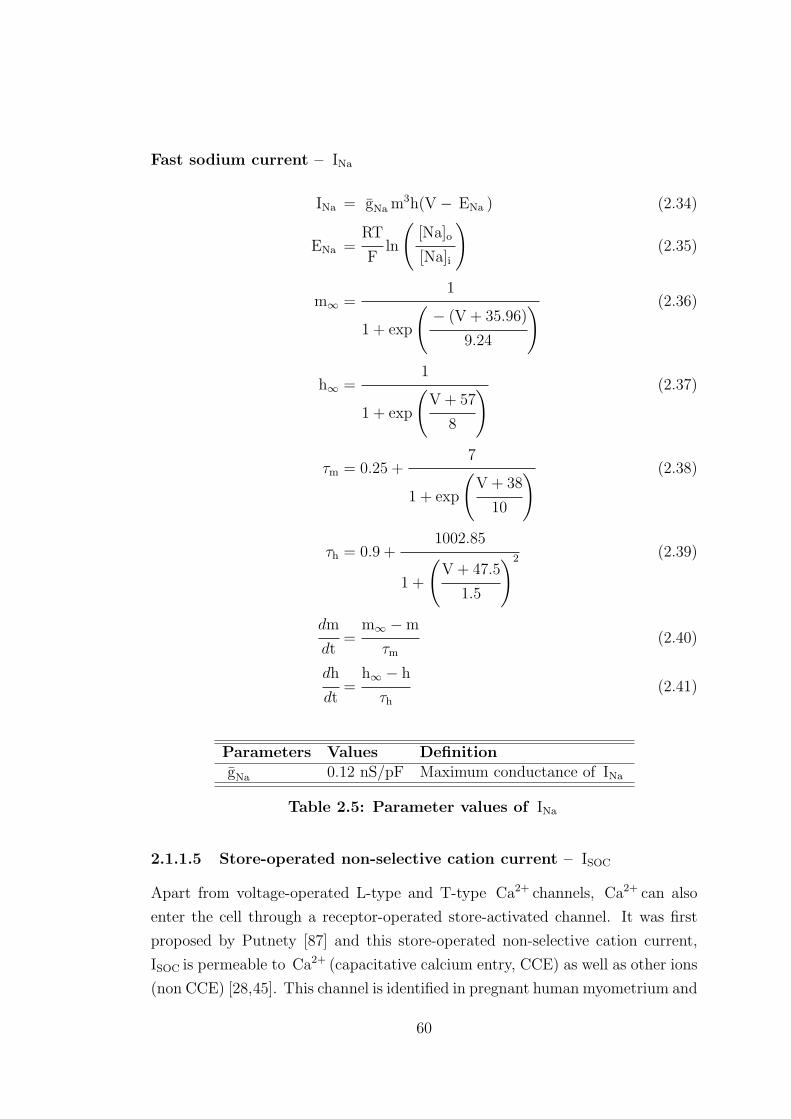
Fast sodium current – INa
INa = gNa m3h(V − ENa ) (2.34)
ENa =RT
Fln
([Na]o
[Na]i
)(2.35)
m∞ =1
1 + exp
(− (V + 35.96)
9.24
) (2.36)
h∞ =1
1 + exp
(V + 57
8
) (2.37)
τm = 0.25 +7
1 + exp
(V + 38
10
) (2.38)
τh = 0.9 +1002.85
1 +
(V + 47.5
1.5
)2 (2.39)
dm
dt=
m∞ −m
τm
(2.40)
dh
dt=
h∞ − h
τh
(2.41)
Parameters Values DefinitiongNa 0.12 nS/pF Maximum conductance of INa
Table 2.5: Parameter values of INa
2.1.1.5 Store-operated non-selective cation current – ISOC
Apart from voltage-operated L-type and T-type Ca2+ channels, Ca2+ can also
enter the cell through a receptor-operated store-activated channel. It was first
proposed by Putnety [87] and this store-operated non-selective cation current,
ISOC is permeable to Ca2+ (capacitative calcium entry, CCE) as well as other ions
(non CCE) [28,45]. This channel is identified in pregnant human myometrium and
60
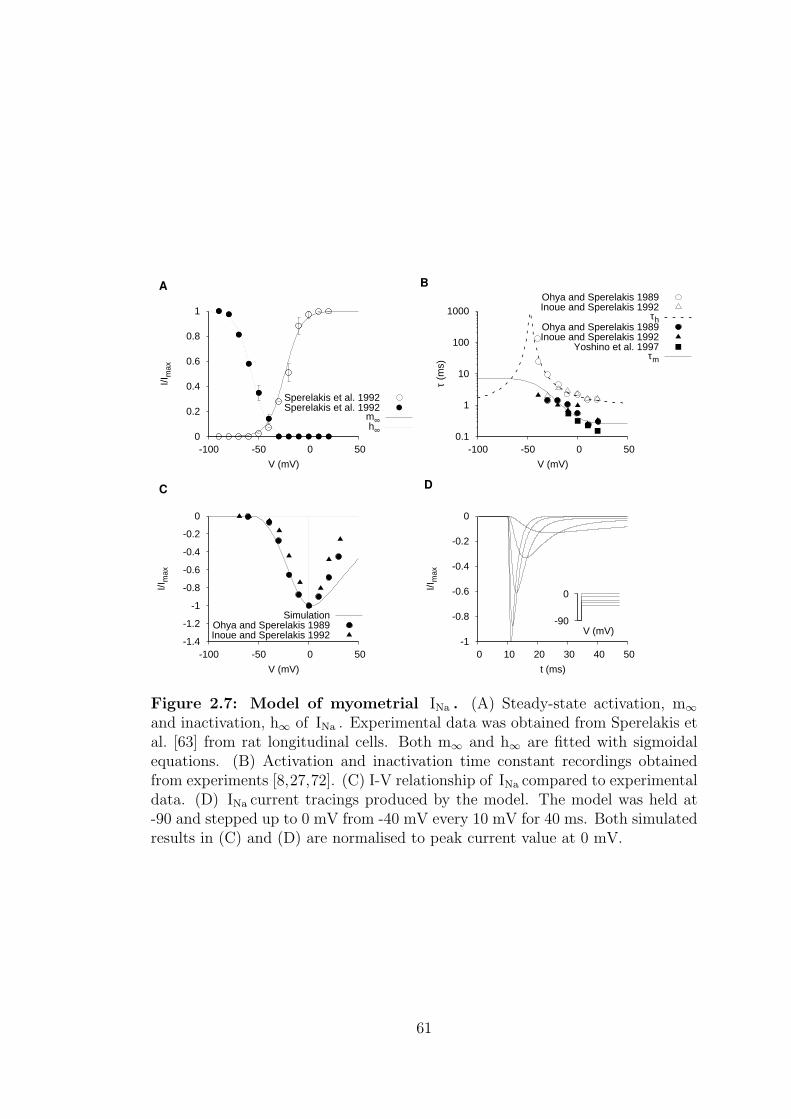
0
0.2
0.4
0.6
0.8
1
-100 -50 0 50
I/Im
ax
V (mV)
A
Sperelakis et al. 1992Sperelakis et al. 1992
m∞h∞
0.1
1
10
100
1000
-100 -50 0 50τ
(ms)
V (mV)
B
Ohya and Sperelakis 1989Inoue and Sperelakis 1992
τhOhya and Sperelakis 1989Inoue and Sperelakis 1992
Yoshino et al. 1997τm
-1.4
-1.2
-1
-0.8
-0.6
-0.4
-0.2
0
-100 -50 0 50
I/Im
ax
V (mV)
C
SimulationOhya and Sperelakis 1989Inoue and Sperelakis 1992
-1
-0.8
-0.6
-0.4
-0.2
0
0 10 20 30 40 50
I/Im
ax
t (ms)
D
-90
0
V (mV)
Figure 2.7: Model of myometrial INa . (A) Steady-state activation, m∞and inactivation, h∞ of INa . Experimental data was obtained from Sperelakis etal. [63] from rat longitudinal cells. Both m∞ and h∞ are fitted with sigmoidalequations. (B) Activation and inactivation time constant recordings obtainedfrom experiments [8,27,72]. (C) I-V relationship of INa compared to experimentaldata. (D) INa current tracings produced by the model. The model was held at-90 and stepped up to 0 mV from -40 mV every 10 mV for 40 ms. Both simulatedresults in (C) and (D) are normalised to peak current value at 0 mV.
61
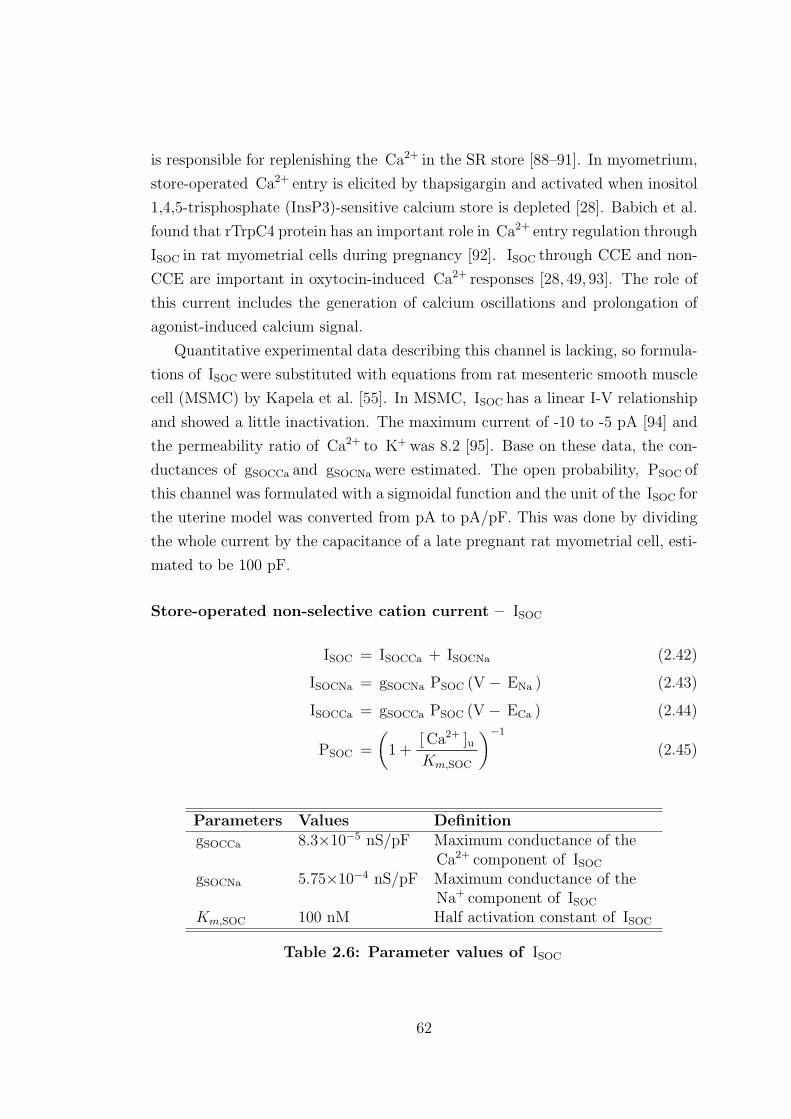
is responsible for replenishing the Ca2+ in the SR store [88–91]. In myometrium,
store-operated Ca2+ entry is elicited by thapsigargin and activated when inositol
1,4,5-trisphosphate (InsP3)-sensitive calcium store is depleted [28]. Babich et al.
found that rTrpC4 protein has an important role in Ca2+ entry regulation through
ISOC in rat myometrial cells during pregnancy [92]. ISOC through CCE and non-
CCE are important in oxytocin-induced Ca2+ responses [28, 49, 93]. The role of
this current includes the generation of calcium oscillations and prolongation of
agonist-induced calcium signal.
Quantitative experimental data describing this channel is lacking, so formula-
tions of ISOC were substituted with equations from rat mesenteric smooth muscle
cell (MSMC) by Kapela et al. [55]. In MSMC, ISOC has a linear I-V relationship
and showed a little inactivation. The maximum current of -10 to -5 pA [94] and
the permeability ratio of Ca2+ to K+ was 8.2 [95]. Base on these data, the con-
ductances of gSOCCa and gSOCNa were estimated. The open probability, PSOC of
this channel was formulated with a sigmoidal function and the unit of the ISOC for
the uterine model was converted from pA to pA/pF. This was done by dividing
the whole current by the capacitance of a late pregnant rat myometrial cell, esti-
mated to be 100 pF.
Store-operated non-selective cation current – ISOC
ISOC = ISOCCa + ISOCNa (2.42)
ISOCNa = gSOCNa PSOC (V − ENa ) (2.43)
ISOCCa = gSOCCa PSOC (V − ECa ) (2.44)
PSOC =
(1 +
[ Ca2+ ]uKm,SOC
)−1
(2.45)
Parameters Values DefinitiongSOCCa 8.3×10⁻⁵ nS/pF Maximum conductance of the
Ca2+ component of ISOC
gSOCNa 5.75×10⁻⁴ nS/pF Maximum conductance of theNa+ component of ISOC
Km,SOC 100 nM Half activation constant of ISOC
Table 2.6: Parameter values of ISOC
62
2.1.2 Outward currents
There are various types of outward potassium channel expressed in late preg-
nant rat myometrium, with diverse properties and characteristics. They include
the fast inactivation transient current, delayed rectifiers and calcium activation
potassium currents. Experimental recordings showed that there are two delayed
rectifiers [81] and two calcium activation potassium currents [96] but no inward
rectifying potassium current was found [31]. Interpretation of the various sub-
types of potassium currents are difficult, the classification of the currents are
categorised differently in published literatures depending on the research groups.
This is because there are no specific blockers to selectively block individual types
of voltage-dependent potassium currents in myometrial cells.
In this model, outward potassium currents are categorised into four different
potassium sub-currents and a small background leakage current. They are: de-
layed rectifying potassium current one and two, IK1 and IK2 , A-type transient
potassium current, IKA , calcium-activated K+ current, IKCa and background leak-
age K+ current, IKleak . Definitions of different channels are classified according
to the work by Khan et al. [2, 97] and Knock et al. [29, 30], which distinguish
potassium channels by their inactivation dynamics and activators. Khan et al.
focused their experiments on potassium uterine single channels while Knock et al
performed all their experiments on pregnant human single cells in myometrium.
The main function of the K+ current is to dampen cellular excitability by main-
taining the cell membrane potential close to the reversal potential of the K+ ion.
This produces repolarisation that brings the cell membrane potential to its resting
potential, and also renders the AP generation and reduces or stops contraction
eventually. The K+ current is particularly important to keep the myometrium
quiescent during the early and middle stage of the pregnancy. Interestingly,
the majority of human myometrial cells consisted of either IK1 (24/42 cells) or
IK2 (18/42 cells) as the dominant potassium current [81], and only a very small
number of human myometrial cells were reported to consist of both types of de-
layed rectifying K+ channels [30]. It is reported that the voltage-gated potassium
current accounted for almost 90% of total potassium current in late pregnant rat
myometrial cells [31].
63
2.1.2.1 Delayed rectifying potassium current – IK1
Voltage-gated potassium currents, IK1 is a 4-aminopyridine (4-AP)-insensitive
current with half inactivation around -63 mV and activation threshold around
-60 to -40 mV. This current is sensitive to tetraethylammonium and clofilium de-
pending on the concentrations of the chemical. IK1 activates fast, but inactivates
very slowly and it does not fully inactivate. The non-inactivation component
contributes around 30-43% of the total current. The conductance of current was
modelled by three gating variables: an activation gating variable, q and fast and
slow inactivation gating variables, r1 and r2 . The activation and inactivation
steady state values were obtained from rat myometrial cells [31] as shown in
figure 2.8 (A). The activation and inactivation time constants were obtained by
fitting published [29] and additional unpublished human myometrial current time
tracings provided by Knock, G and Aaronson, P through personal communica-
tion (figure 2.8 (B) and (C)). The simulated I-V curves from different holding
potentials shown in figure 2.8 revealed that 50% of the IK1 was activated at 20
mV similar to experimental recordings from Knock et al. [29]. Current tracings
produced by the model illustrated in figure 2.8 (E) show that this current reached
its peak value in about 50 ms and took about 10 s to inactivate.
64
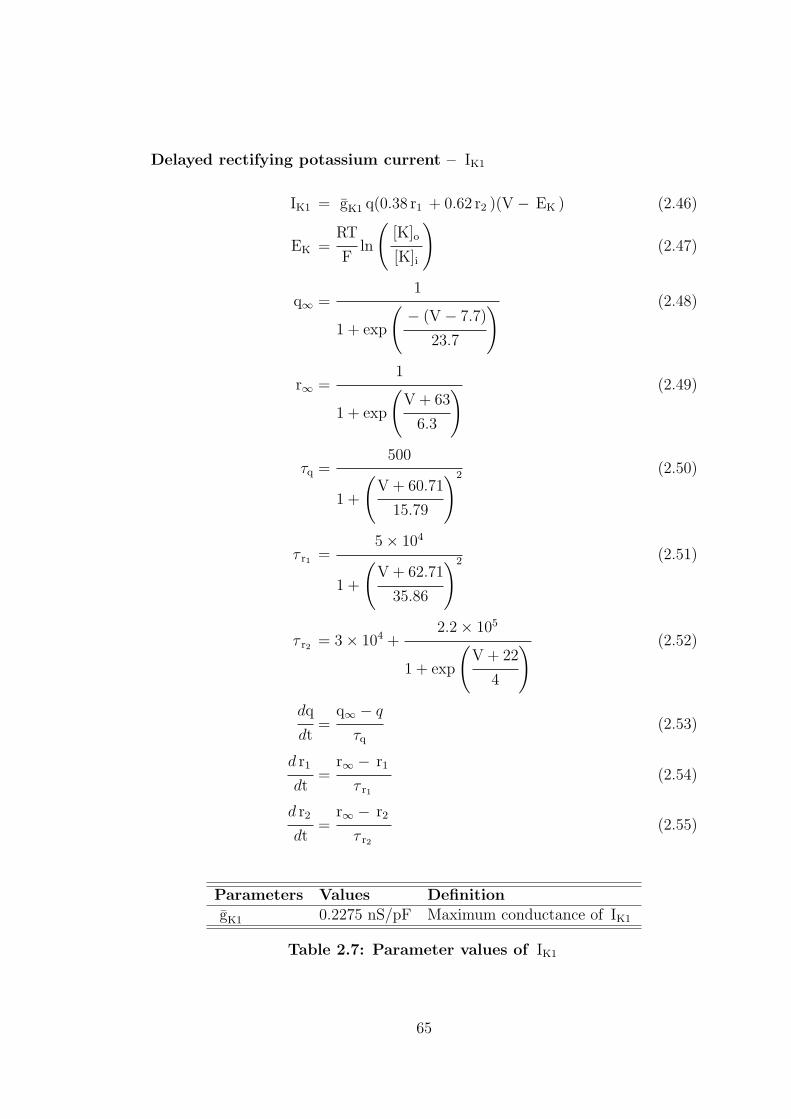
Delayed rectifying potassium current – IK1
IK1 = gK1 q(0.38 r1 + 0.62 r2 )(V − EK ) (2.46)
EK =RT
Fln
([K]o
[K]i
)(2.47)
q∞ =1
1 + exp
(− (V − 7.7)
23.7
) (2.48)
r∞ =1
1 + exp
(V + 63
6.3
) (2.49)
τq =500
1 +
(V + 60.71
15.79
)2 (2.50)
τ r1 =5× 10⁴
1 +
(V + 62.71
35.86
)2 (2.51)
τ r2 = 3× 10⁴ +2.2× 10⁵
1 + exp
(V + 22
4
) (2.52)
dq
dt=
q∞ − q
τq
(2.53)
d r1
dt=
r∞ − r1
τ r1
(2.54)
d r2
dt=
r∞ − r2
τ r2
(2.55)
Parameters Values DefinitiongK1 0.2275 nS/pF Maximum conductance of IK1
Table 2.7: Parameter values of IK1
65
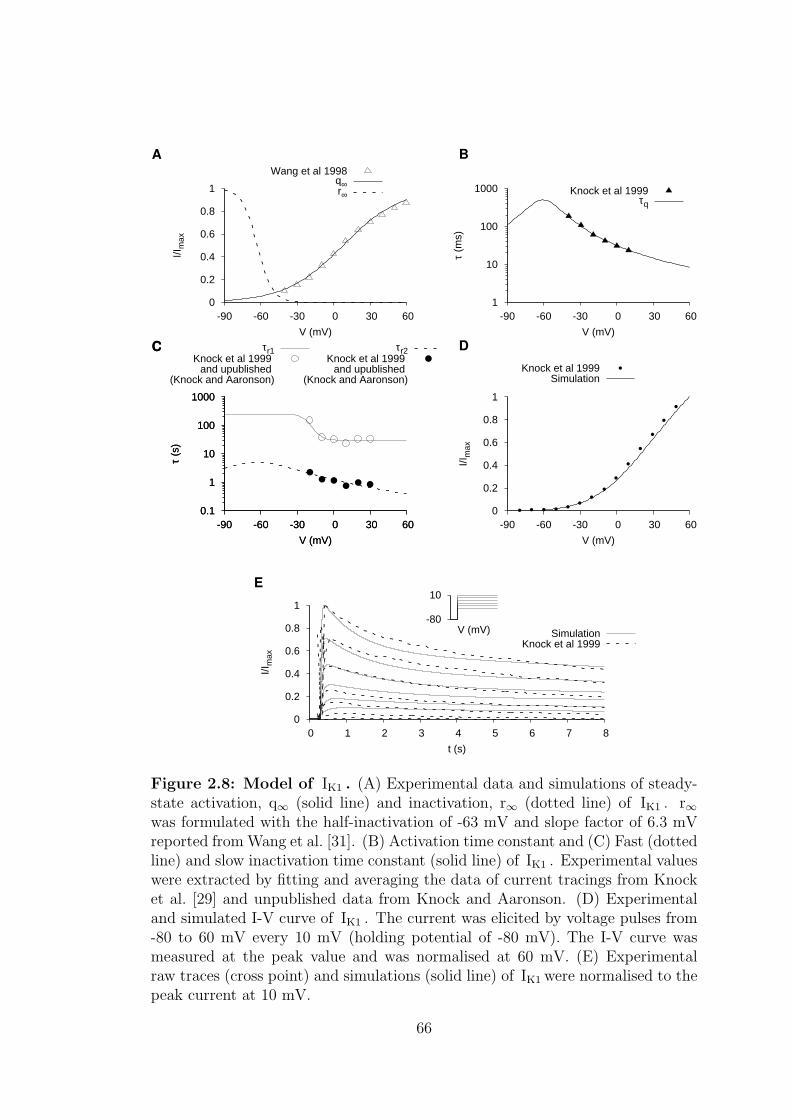
0
0.2
0.4
0.6
0.8
1
-90 -60 -30 0 30 60
I/Im
ax
V (mV)
A
Wang et al 1998q∞r∞
1
10
100
1000
-90 -60 -30 0 30 60
τ (m
s)
V (mV)
B
Knock et al 1999τq
0.1
1
10
100
1000
-90 -60 -30 0 30 60
τ (s
)
V (mV)
C τr1Knock et al 1999 and upublished
(Knock and Aaronson)
0.1
1
10
100
1000
-90 -60 -30 0 30 60
τ (s
)
V (mV)
C τr2Knock et al 1999 and upublished
(Knock and Aaronson)
0
0.2
0.4
0.6
0.8
1
-90 -60 -30 0 30 60
I/Im
ax
V (mV)
D
Knock et al 1999Simulation
0
0.2
0.4
0.6
0.8
1
0 1 2 3 4 5 6 7 8
I/Im
ax
t (s)
E
SimulationKnock et al 1999
-80
10
V (mV)
Figure 2.8: Model of IK1 . (A) Experimental data and simulations of steady-state activation, q∞ (solid line) and inactivation, r∞ (dotted line) of IK1 . r∞was formulated with the half-inactivation of -63 mV and slope factor of 6.3 mVreported from Wang et al. [31]. (B) Activation time constant and (C) Fast (dottedline) and slow inactivation time constant (solid line) of IK1 . Experimental valueswere extracted by fitting and averaging the data of current tracings from Knocket al. [29] and unpublished data from Knock and Aaronson. (D) Experimentaland simulated I-V curve of IK1 . The current was elicited by voltage pulses from-80 to 60 mV every 10 mV (holding potential of -80 mV). The I-V curve wasmeasured at the peak value and was normalised at 60 mV. (E) Experimentalraw traces (cross point) and simulations (solid line) of IK1 were normalised to thepeak current at 10 mV.
66
2.1.2.2 Delayed rectifying potassium current – IK2
IK2 is a 4-AP-sensitve current that has a lot of similar characteristics as IK1 despite
having faster kinetics. This current has a more positive half-inactivation of -30
mV and activation threshold between -40 to -30 mV shown in figure 2.9 (A).
IK2 also does not fully inactivate and this component accounted for about 8-14%
of the total current. Both IK1 and IK2 are unevenly distributed between human
myometrial cells. The conductance of IK2 was modelled similarly to IK1 by an ac-
tivation gating variable, p and fast and slow inactivation gating variables, k1 and
k2 . In the same method as IK1 , the activation and inactivation time constants
were fitted to human myometrial data from Knock et al. [81] and unpublished
data provided by Knock, G and Aaronson, P (figure 2.9 (B) and (C)). Simulated
I-V relationship and current tracings illustrated in figure 2.9 (D) and (E) show
that IK2 took about 50 ms to reach the peak and inactivated at a faster rate than
IK1 .
67
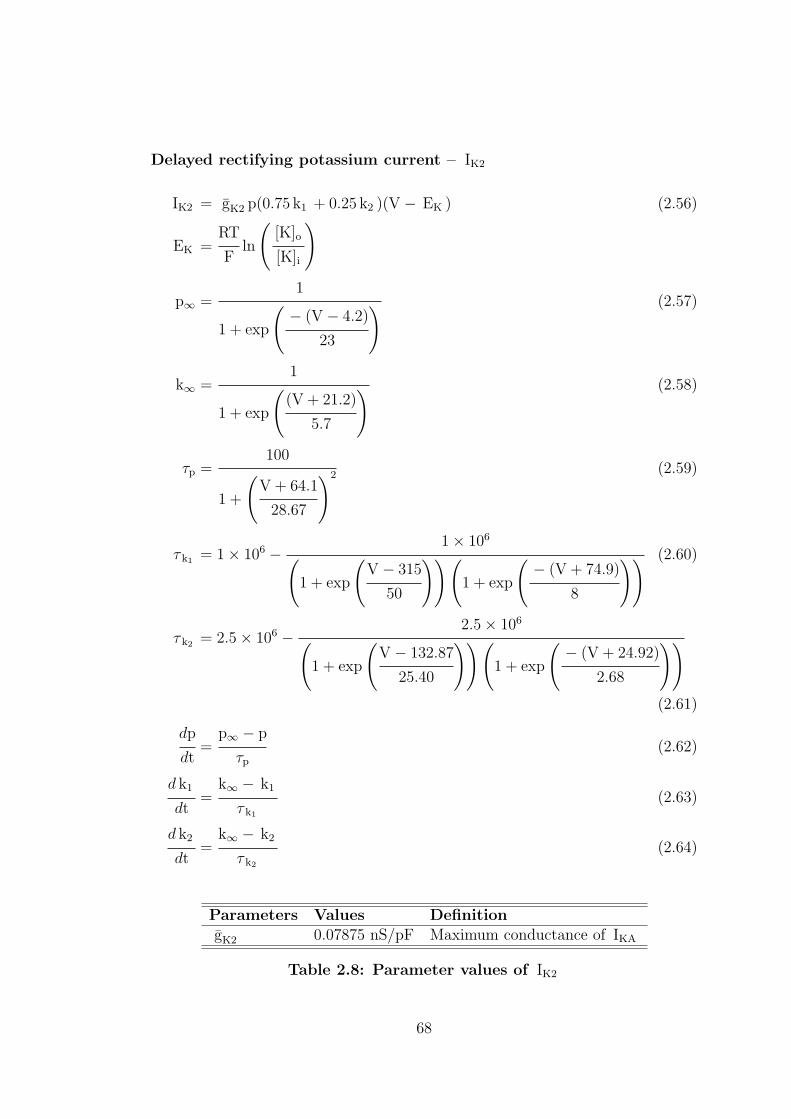
Delayed rectifying potassium current – IK2
IK2 = gK2 p(0.75 k1 + 0.25 k2 )(V − EK ) (2.56)
EK =RT
Fln
([K]o
[K]i
)
p∞ =1
1 + exp
(− (V − 4.2)
23
) (2.57)
k∞ =1
1 + exp
((V + 21.2)
5.7
) (2.58)
τp =100
1 +
(V + 64.1
28.67
)2 (2.59)
τ k1 = 1× 10⁶ − 1× 10⁶
(1 + exp
(V − 315
50
))(1 + exp
(− (V + 74.9)
8
)) (2.60)
τ k2 = 2.5× 10⁶ − 2.5× 10⁶
(1 + exp
(V − 132.87
25.40
))(1 + exp
(− (V + 24.92)
2.68
))
(2.61)
dp
dt=
p∞ − p
τp
(2.62)
d k1
dt=
k∞ − k1
τ k1
(2.63)
d k2
dt=
k∞ − k2
τ k2
(2.64)
Parameters Values DefinitiongK2 0.07875 nS/pF Maximum conductance of IKA
Table 2.8: Parameter values of IK2
68
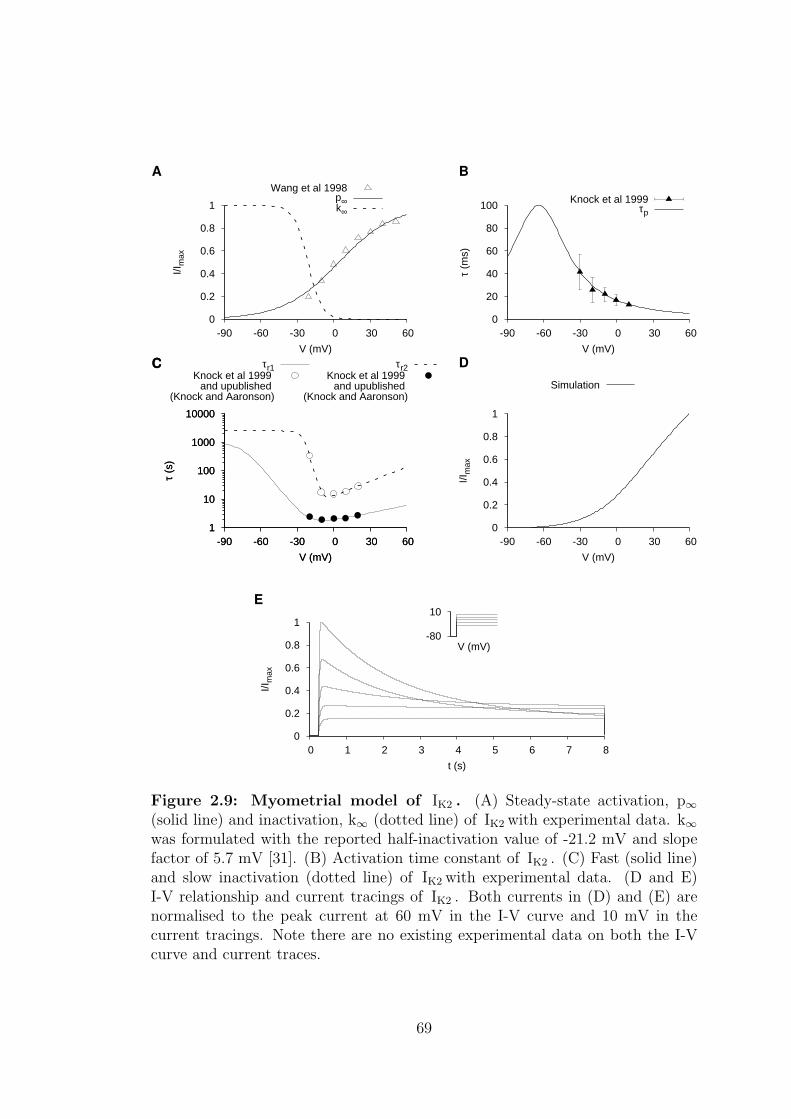
0
0.2
0.4
0.6
0.8
1
-90 -60 -30 0 30 60
I/Im
ax
V (mV)
A
Wang et al 1998p∞k∞
0
20
40
60
80
100
-90 -60 -30 0 30 60
τ (m
s)
V (mV)
B
Knock et al 1999τp
1
10
100
1000
10000
-90 -60 -30 0 30 60
τ (s
)
V (mV)
C τr1Knock et al 1999 and upublished
(Knock and Aaronson)
1
10
100
1000
10000
-90 -60 -30 0 30 60
τ (s
)
V (mV)
C τr2Knock et al 1999 and upublished
(Knock and Aaronson)
0
0.2
0.4
0.6
0.8
1
-90 -60 -30 0 30 60
I/Im
ax
V (mV)
D
Simulation
0
0.2
0.4
0.6
0.8
1
0 1 2 3 4 5 6 7 8
I/Im
ax
t (s)
E
-80
10
V (mV)
Figure 2.9: Myometrial model of IK2 . (A) Steady-state activation, p∞(solid line) and inactivation, k∞ (dotted line) of IK2 with experimental data. k∞was formulated with the reported half-inactivation value of -21.2 mV and slopefactor of 5.7 mV [31]. (B) Activation time constant of IK2 . (C) Fast (solid line)and slow inactivation (dotted line) of IK2 with experimental data. (D and E)I-V relationship and current tracings of IK2 . Both currents in (D) and (E) arenormalised to the peak current at 60 mV in the I-V curve and 10 mV in thecurrent tracings. Note there are no existing experimental data on both the I-Vcurve and current traces.
69
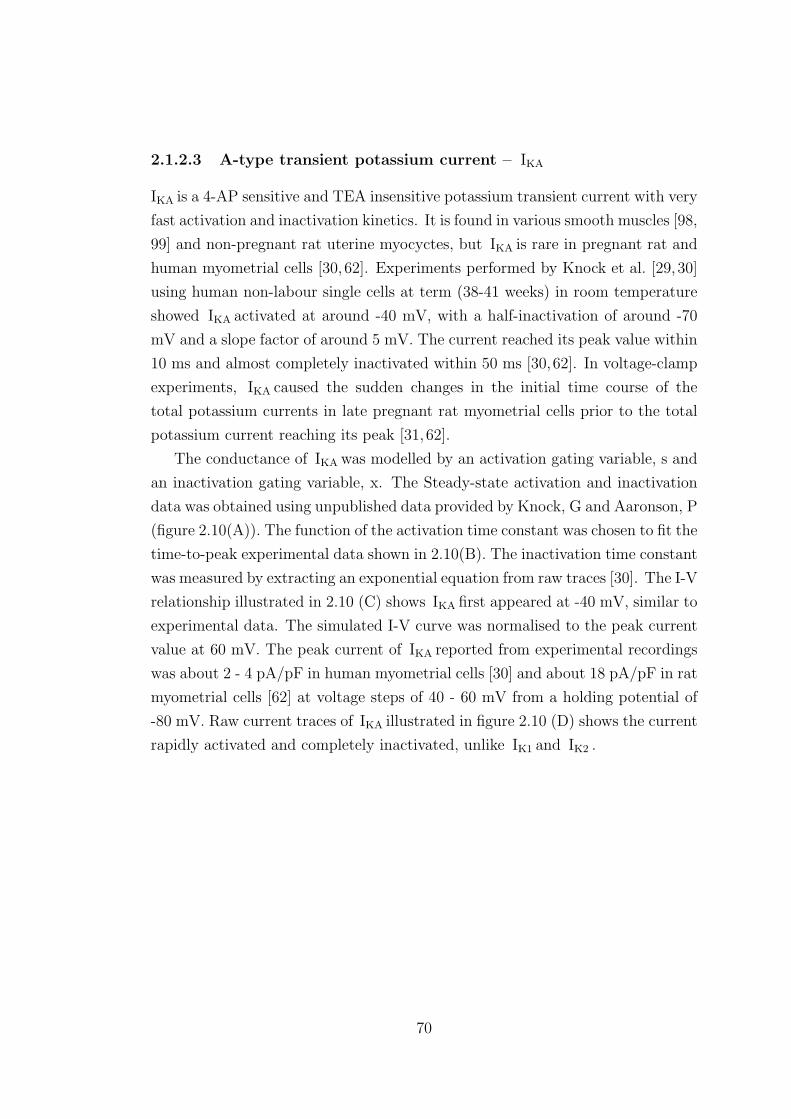
2.1.2.3 A-type transient potassium current – IKA
IKA is a 4-AP sensitive and TEA insensitive potassium transient current with very
fast activation and inactivation kinetics. It is found in various smooth muscles [98,
99] and non-pregnant rat uterine myocyctes, but IKA is rare in pregnant rat and
human myometrial cells [30, 62]. Experiments performed by Knock et al. [29, 30]
using human non-labour single cells at term (38-41 weeks) in room temperature
showed IKA activated at around -40 mV, with a half-inactivation of around -70
mV and a slope factor of around 5 mV. The current reached its peak value within
10 ms and almost completely inactivated within 50 ms [30,62]. In voltage-clamp
experiments, IKA caused the sudden changes in the initial time course of the
total potassium currents in late pregnant rat myometrial cells prior to the total
potassium current reaching its peak [31,62].
The conductance of IKA was modelled by an activation gating variable, s and
an inactivation gating variable, x. The Steady-state activation and inactivation
data was obtained using unpublished data provided by Knock, G and Aaronson, P
(figure 2.10(A)). The function of the activation time constant was chosen to fit the
time-to-peak experimental data shown in 2.10(B). The inactivation time constant
was measured by extracting an exponential equation from raw traces [30]. The I-V
relationship illustrated in 2.10 (C) shows IKA first appeared at -40 mV, similar to
experimental data. The simulated I-V curve was normalised to the peak current
value at 60 mV. The peak current of IKA reported from experimental recordings
was about 2 - 4 pA/pF in human myometrial cells [30] and about 18 pA/pF in rat
myometrial cells [62] at voltage steps of 40 - 60 mV from a holding potential of
-80 mV. Raw current traces of IKA illustrated in figure 2.10 (D) shows the current
rapidly activated and completely inactivated, unlike IK1 and IK2 .
70
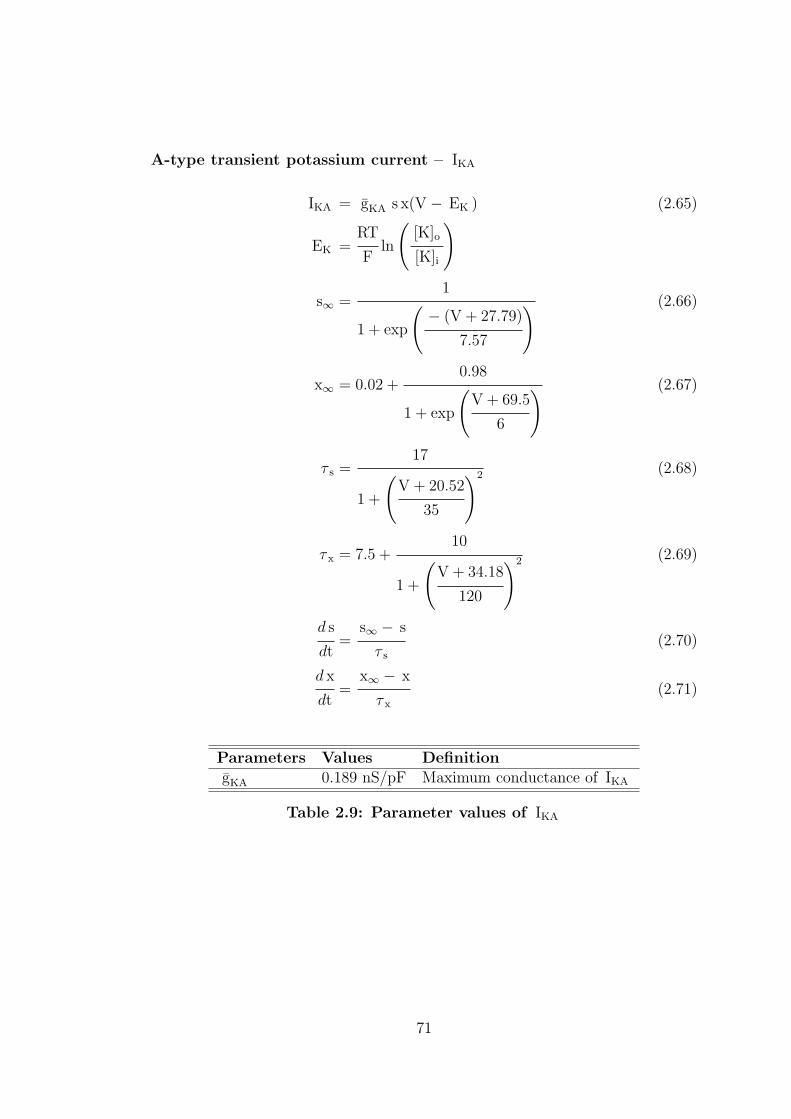
A-type transient potassium current – IKA
IKA = gKA s x(V − EK ) (2.65)
EK =RT
Fln
([K]o
[K]i
)
s∞ =1
1 + exp
(− (V + 27.79)
7.57
) (2.66)
x∞ = 0.02 +0.98
1 + exp
(V + 69.5
6
) (2.67)
τ s =17
1 +
(V + 20.52
35
)2 (2.68)
τ x = 7.5 +10
1 +
(V + 34.18
120
)2 (2.69)
d s
dt=
s∞ − s
τ s
(2.70)
d x
dt=
x∞ − x
τ x
(2.71)
Parameters Values DefinitiongKA 0.189 nS/pF Maximum conductance of IKA
Table 2.9: Parameter values of IKA
71
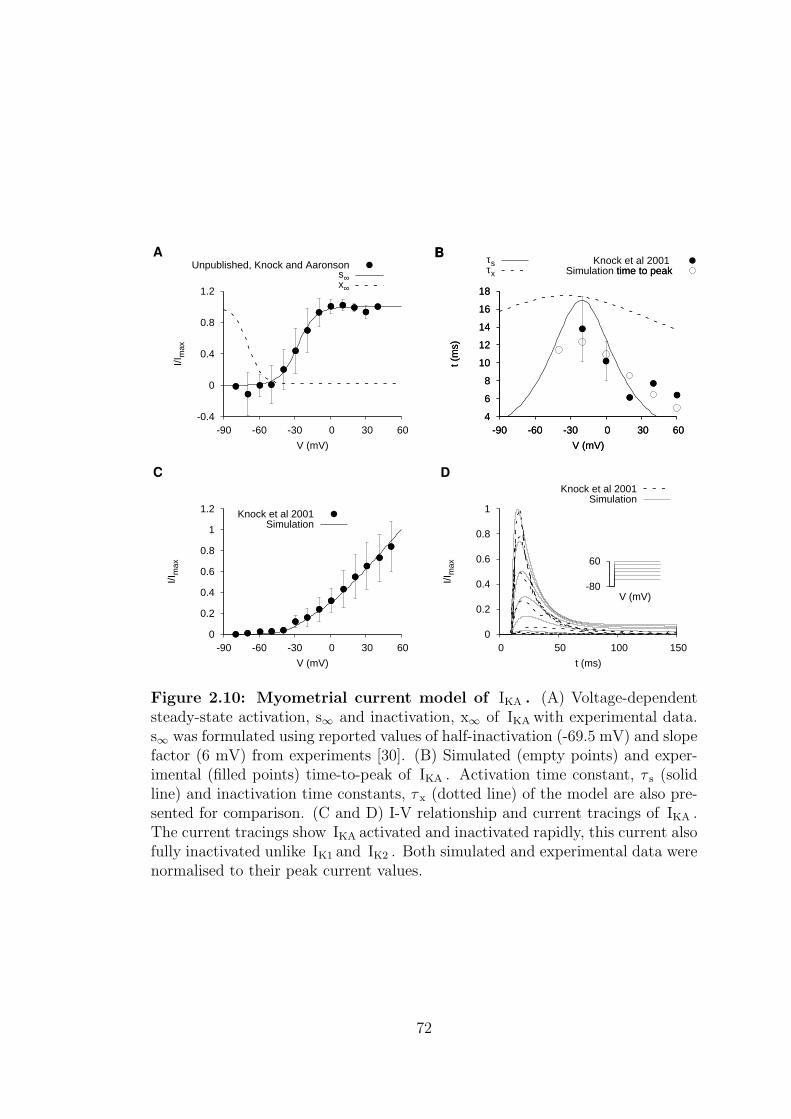
-0.4
0
0.4
0.8
1.2
-90 -60 -30 0 30 60
I/Im
ax
V (mV)
AUnpublished, Knock and Aaronson
s∞x∞
4
6
8
10
12
14
16
18
-90 -60 -30 0 30 60
t (m
s)V (mV)
BKnock et al 2001
time to peakSimulation time to peak
4
6
8
10
12
14
16
18
-90 -60 -30 0 30 60
t (m
s)V (mV)
B τsτx
0
0.2
0.4
0.6
0.8
1
1.2
-90 -60 -30 0 30 60
I/Im
ax
V (mV)
C
Knock et al 2001Simulation
0
0.2
0.4
0.6
0.8
1
0 50 100 150
I/Im
ax
t (ms)
D
Knock et al 2001Simulation
-80
60
V (mV)
Figure 2.10: Myometrial current model of IKA . (A) Voltage-dependentsteady-state activation, s∞ and inactivation, x∞ of IKA with experimental data.s∞ was formulated using reported values of half-inactivation (-69.5 mV) and slopefactor (6 mV) from experiments [30]. (B) Simulated (empty points) and exper-imental (filled points) time-to-peak of IKA . Activation time constant, τ s (solidline) and inactivation time constants, τ x (dotted line) of the model are also pre-sented for comparison. (C and D) I-V relationship and current tracings of IKA .The current tracings show IKA activated and inactivated rapidly, this current alsofully inactivated unlike IK1 and IK2 . Both simulated and experimental data werenormalised to their peak current values.
72
2.1.2.4 Calcium-activated K+ current – IKCa
Calcium-activated K+ current, IKCa is a voltage- and calcium dependent current
with a large conductance of around 200 pS. It is inhibited by tetraethylammo-
nium (TEA), 4-AP, barium, scorpion toxic, paxiline, charybdotoxin and iberi-
toxin. Studies suggested that this channel is associated with setting the resting
membrane potential and regulating both the shape and duration of AP. It also
suppresses the excitability and contraction in myometrial cells throughout the
gestation [100, 101]. This channel is a predominate K+ channel in non-pregnant
rat [96] and human [102, 103] myometrial cells. IKCa was also found in mid-
pregnant (14 to 16 days) rat myometrial cells [100]. Although IKCa was also
found in late pregnant myometrial cells [104], the current density of IKCa was
found to be markedly reduced prior to labour [29, 31]. This is because the ex-
pression of IKCa is down-regulated to reduce the importance of this channel and
therefore increase the excitability at parturition. Experimental study reported
that the delayed rectifying potassium currents accounted for almost 90% of the
total K+ current in late pregnant rat myometrial cells and the remaining 10%
were sustained currents consisted of mostly IKCa with an activation threshold of
greater than 0 mV [31].
Quantitative data on this channel is lacking and the majority of the experi-
ments only concentrated on the behaviour in the level of single channels [2, 97].
The formulations of this current were substituted by equations developed for rat
mesenteric smooth muscle [55]. The [ Ca2+ ]i -dependency of this current was
modelled based on an empirical relationship. Studies in myometrium show the
content of cGMP increases with increasing level of estrogen [105], and cGMP
kinase contributes to uterine quiescence in pregnancy [101]. Despite the relax-
ant effects of nitric-oxide (NO) and cGMP on pregnant rat uterine longitudinal
smooth muscle [106], a cGMP-dependent pathway in IKCa was not included in the
model. This is because the descriptions of cGMP formation in experiments were
not sufficient to establish mathematical equations. For clarity, the NO-terms in
the equations describing IKA were removed (NO concentration in the equations
was set as zero and subsequently the NO-related terms in the equations have
no effect on the current). In vascular smooth muscles cells, cGMP is activated
by NO to promote relaxation in cells. The activation time constant and open
probability of IKCa was modelled based on small mesenteric artery from guinea
73
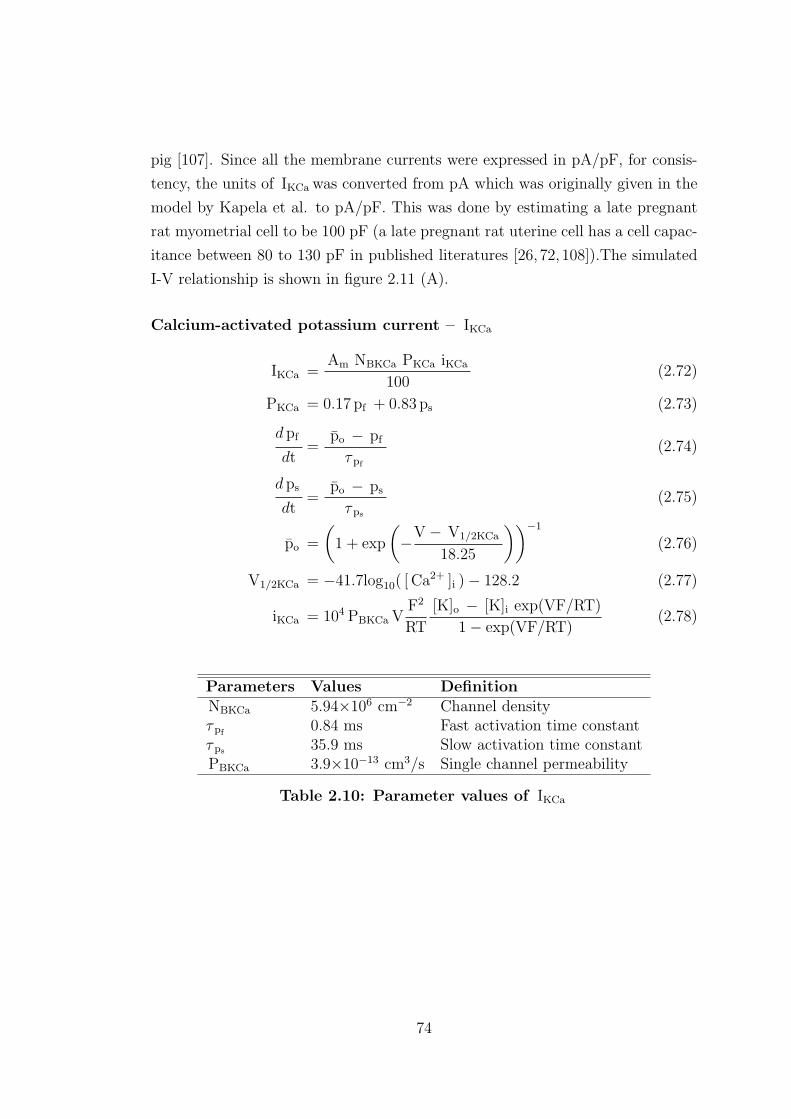
pig [107]. Since all the membrane currents were expressed in pA/pF, for consis-
tency, the units of IKCa was converted from pA which was originally given in the
model by Kapela et al. to pA/pF. This was done by estimating a late pregnant
rat myometrial cell to be 100 pF (a late pregnant rat uterine cell has a cell capac-
itance between 80 to 130 pF in published literatures [26, 72, 108]).The simulated
I-V relationship is shown in figure 2.11 (A).
Calcium-activated potassium current – IKCa
IKCa =Am NBKCa PKCa iKCa
100(2.72)
PKCa = 0.17 pf + 0.83 ps (2.73)
d pf
dt=
po − pf
τpf
(2.74)
d ps
dt=
po − ps
τ ps
(2.75)
po =
(1 + exp
(−V − V1/2KCa
18.25
))−1
(2.76)
V1/2KCa = −41.7log10( [ Ca2+ ]i )− 128.2 (2.77)
iKCa = 104 PBKCa VF2
RT
[K]o − [K]i exp(VF/RT)
1− exp(VF/RT)(2.78)
Parameters Values DefinitionNBKCa 5.94×106 cm−2 Channel densityτpf
0.84 ms Fast activation time constantτps 35.9 ms Slow activation time constantPBKCa 3.9×10⁻¹³ cm3/s Single channel permeability
Table 2.10: Parameter values of IKCa
74
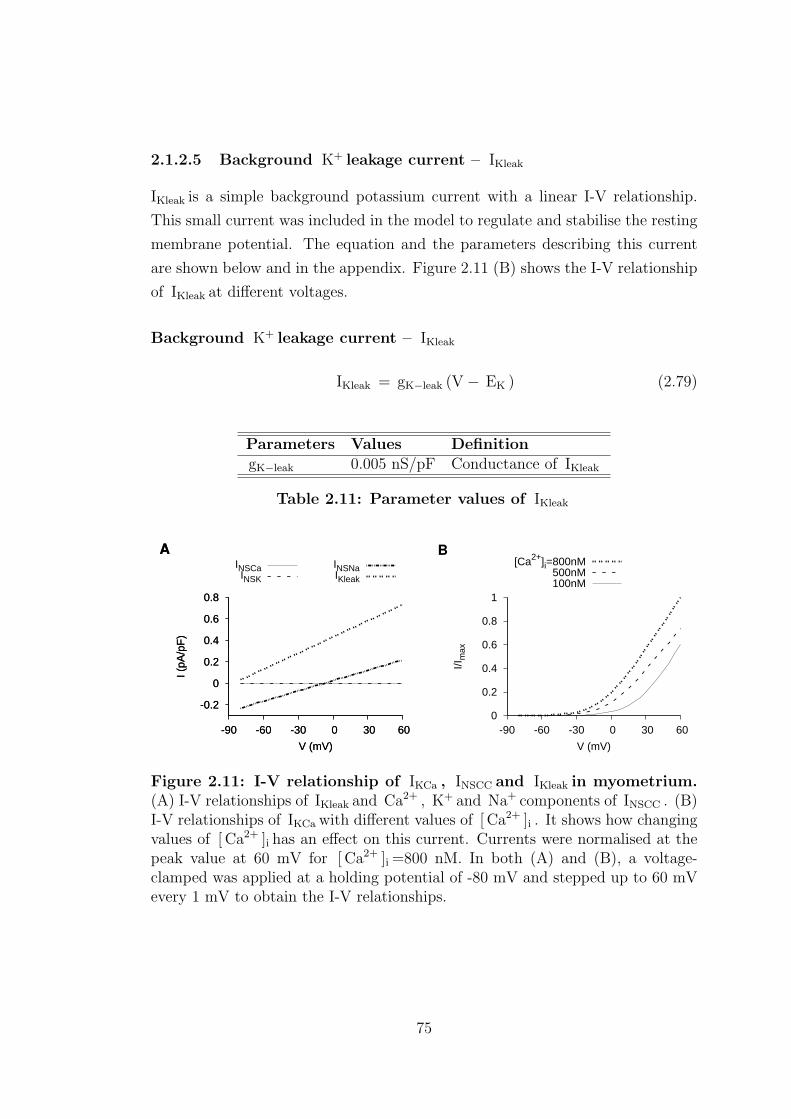
2.1.2.5 Background K+ leakage current – IKleak
IKleak is a simple background potassium current with a linear I-V relationship.
This small current was included in the model to regulate and stabilise the resting
membrane potential. The equation and the parameters describing this current
are shown below and in the appendix. Figure 2.11 (B) shows the I-V relationship
of IKleak at different voltages.
Background K+ leakage current – IKleak
IKleak = gK−leak (V − EK ) (2.79)
Parameters Values DefinitiongK−leak 0.005 nS/pF Conductance of IKleak
Table 2.11: Parameter values of IKleak
-0.2
0
0.2
0.4
0.6
0.8
-90 -60 -30 0 30 60
I (pA
/pF
)
V (mV)
A
INSCaINSK
-0.2
0
0.2
0.4
0.6
0.8
-90 -60 -30 0 30 60
I (pA
/pF
)
V (mV)
A
INSNaIKleak
0
0.2
0.4
0.6
0.8
1
-90 -60 -30 0 30 60
I/Im
ax
V (mV)
B[Ca2+]i=800nM
500nM100nM
Figure 2.11: I-V relationship of IKCa , INSCC and IKleak in myometrium.(A) I-V relationships of IKleak and Ca2+ , K+ and Na+ components of INSCC . (B)I-V relationships of IKCa with different values of [ Ca2+ ]i . It shows how changingvalues of [ Ca2+ ]i has an effect on this current. Currents were normalised at thepeak value at 60 mV for [ Ca2+ ]i =800 nM. In both (A) and (B), a voltage-clamped was applied at a holding potential of -80 mV and stepped up to 60 mVevery 1 mV to obtain the I-V relationships.
75
2.1.3 Other currents
In the myometrial cell model, other currents are defined as the currents that
can be flown in both directions, depending on the ionic concentration and the
voltage of the cell. They are the non-specific cation current ( INSCC ) and the
Ca2+ -activated Cl− current ( ICl ). INSCC plays a role in the reconstruction of
pace-making activity while ICl has a functional role in the plateau state of the
AP . These two currents are small but significant to the myometrial cells.
2.1.3.1 Non-selective cation current – INSCC
Non-selective cation current, INSCC is a background linear current identified in late
pregnant rat myometrial cells [33]. INSCC plays an important role in reconstruct-
ing the pace-maker activity, regulating the contractility and is also considered to
be the alternative mechanism for automaticity bedsides Ih in the myometrium.
INSCC is time independent and has a linear I-V relationship. Experiments show ex-
tracellular Mg2+ (treatment for preterm labour) inhibited INSCC and suppressed
contraction. INSCC was inhibited by La3+ and Gd3+ and reduction of extra-
cellular Na+ decreases the amplitude of this current. It was also found that
INSCC diminished near term with an increasing level of estrogen in rat myometrium
[109]. The channel is permeable to a variety of ions such as K+ , Cs+ , Na+ and
Li+, and its relative permeability for K+ : Cs+ : Na+ :Li+ is 1.3:1:0.9:0.8. INSCC also
has a small but detectable permeability for Ca2+ .
Experiments performed by Miyoshi et al. [33] using 18-20 day pregnant rat
single longitudinal cells at room temperature reported the reversal potential was
around -5 mV. The current density under control physiological conditions (with
0.1 mM [ Mg2+ ]o) was 0.6± 0.46 pA/pF at a voltage step of -50 mV. Since INSCC is
sensitive to more than one type of ion (Ca2+ , Na+ and K+ ), the reversal poten-
tial, ENSCC of this current, was therefore dependent on all these ions. ENSCC in
the myometrium model was modified using the Goldman-Hodgkin-Katz (GHK)
equation [61], assuming the ions interact with each other and diffuse through the
channel.
In the myometrium model, the conductance of INSCC depends on the ex-
tracellular concentrations of permeable cations. Experiments recordings from
the voltage ramp I-V relationships presented a ratio of Ca2+ : Na+ : K+ : Cs+ =
0.5:1:1.19:1.6 [33]. Similar to INSCC found in guinea-pig endocardial endothelial
cells [110], the conductance of myometrial INSCC reduced with decreasing [ Na+ ]o .
76
This relationship was described by a Hill equation with a half-saturating concen-
tration of 150 mM and a Hill coefficient of 2. The Hill equation was normalised
with the Na+ conductance at [ Na+ ]o = 125 mM. For Ca2+ ions, the Hill equa-
tion was normalised to the Ca2+ conductance at [ Ca2+ ]o = 20 mM. Inhibition
by [ Mg2+ ]o was described by a Hill equation with a half-saturating concentration
of 0.28 mM and a Hill coefficient of 1.3 [33]. Blockage by La3+ and Gd3+ were
excluded in the current model. Since INSCC was also permeable to other cations, a
small leak component, gleak was needed to compensate and match the experimen-
tal voltage clamp data. Under physiological conditions with 0.1 mM [ Mg2+ ]o ,
the simulated INSCC consisted of mostly Na+ and leak components. Contribution
from K+ and Ca2+ were very small as illustrated in figure 2.11.
Non-selective cation current – INSCC
INSCC = INSCa + INSNa + INSK + INSleak (2.80)
INSCa = 0.15 fMg g( [ Ca2+ ]o ) gNS (V − ENS ) (2.81)
INSNa = fMg g( [ Na+ ]o ) gNS (V − ENS ) (2.82)
INSK = 1.19 fMg g( [ K+ ]o ) gNS (V − ENS ) (2.83)
INSleak = fMg gleak (V − ENS ) (2.84)
g( [X]o ) =1
g s
0.03
1 +
(150
[X]o + 10−8
)2 , g s =
0.000525 for Ca2+
0.0123 otherwise(2.85)
fMg = 0.1 +0.9
1 +
([Mg2+]o
Kd,Mg
)1.3 (2.86)
ENS =RT
F· ln
PNa
PCs
[ Na+ ]o +PK
PCs
[ K+ ]o + PCa′4 PCa
PCs
[ Ca2+ ]o
PNa
PCs
[ Na+ ]i +PK
PCs
[ K+ ]i + PCa′4 PCa
PCs
[ Ca2+ ]i
(2.87)
PCa′ =
PCa
1 + exp
(VF
RT
) (2.88)
77
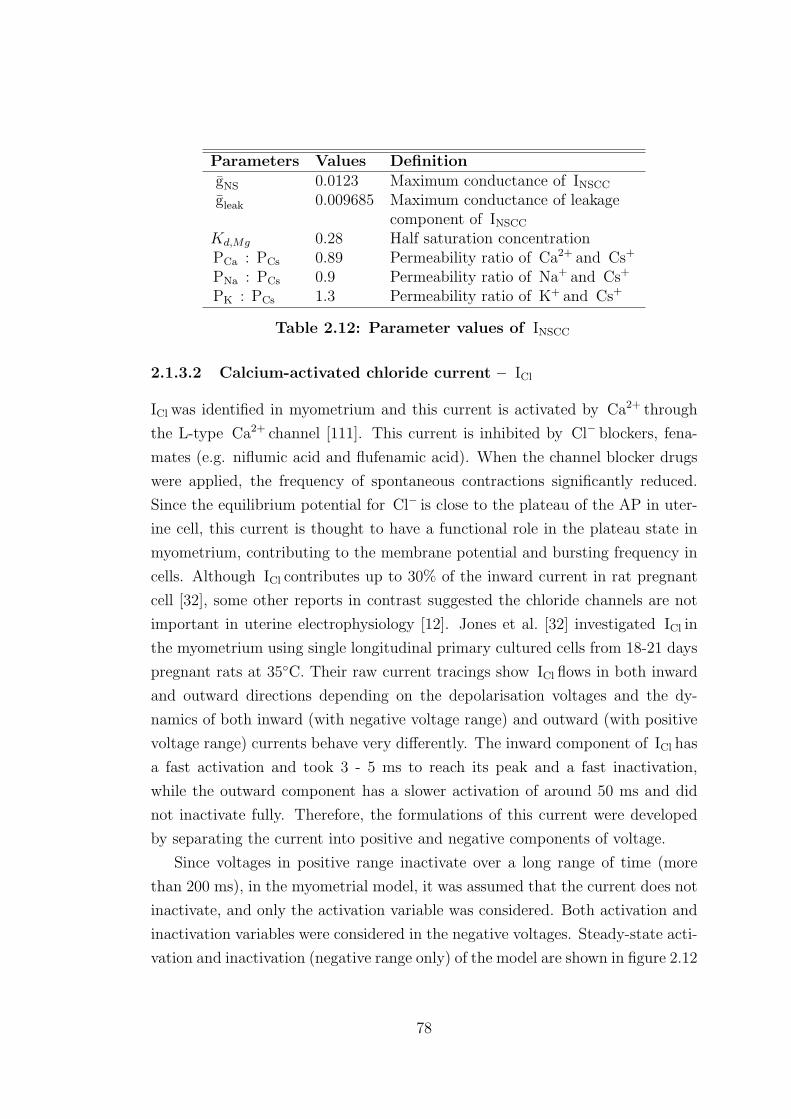
Parameters Values DefinitiongNS 0.0123 Maximum conductance of INSCC
gleak 0.009685 Maximum conductance of leakagecomponent of INSCC
Kd,Mg 0.28 Half saturation concentrationPCa : PCs 0.89 Permeability ratio of Ca2+ and Cs+
PNa : PCs 0.9 Permeability ratio of Na+ and Cs+
PK : PCs 1.3 Permeability ratio of K+ and Cs+
Table 2.12: Parameter values of INSCC
2.1.3.2 Calcium-activated chloride current – ICl
ICl was identified in myometrium and this current is activated by Ca2+ through
the L-type Ca2+ channel [111]. This current is inhibited by Cl− blockers, fena-
mates (e.g. niflumic acid and flufenamic acid). When the channel blocker drugs
were applied, the frequency of spontaneous contractions significantly reduced.
Since the equilibrium potential for Cl− is close to the plateau of the AP in uter-
ine cell, this current is thought to have a functional role in the plateau state in
myometrium, contributing to the membrane potential and bursting frequency in
cells. Although ICl contributes up to 30% of the inward current in rat pregnant
cell [32], some other reports in contrast suggested the chloride channels are not
important in uterine electrophysiology [12]. Jones et al. [32] investigated ICl in
the myometrium using single longitudinal primary cultured cells from 18-21 days
pregnant rats at 35◦C. Their raw current tracings show ICl flows in both inward
and outward directions depending on the depolarisation voltages and the dy-
namics of both inward (with negative voltage range) and outward (with positive
voltage range) currents behave very differently. The inward component of ICl has
a fast activation and took 3 - 5 ms to reach its peak and a fast inactivation,
while the outward component has a slower activation of around 50 ms and did
not inactivate fully. Therefore, the formulations of this current were developed
by separating the current into positive and negative components of voltage.
Since voltages in positive range inactivate over a long range of time (more
than 200 ms), in the myometrial model, it was assumed that the current does not
inactivate, and only the activation variable was considered. Both activation and
inactivation variables were considered in the negative voltages. Steady-state acti-
vation and inactivation (negative range only) of the model are shown in figure 2.12
78
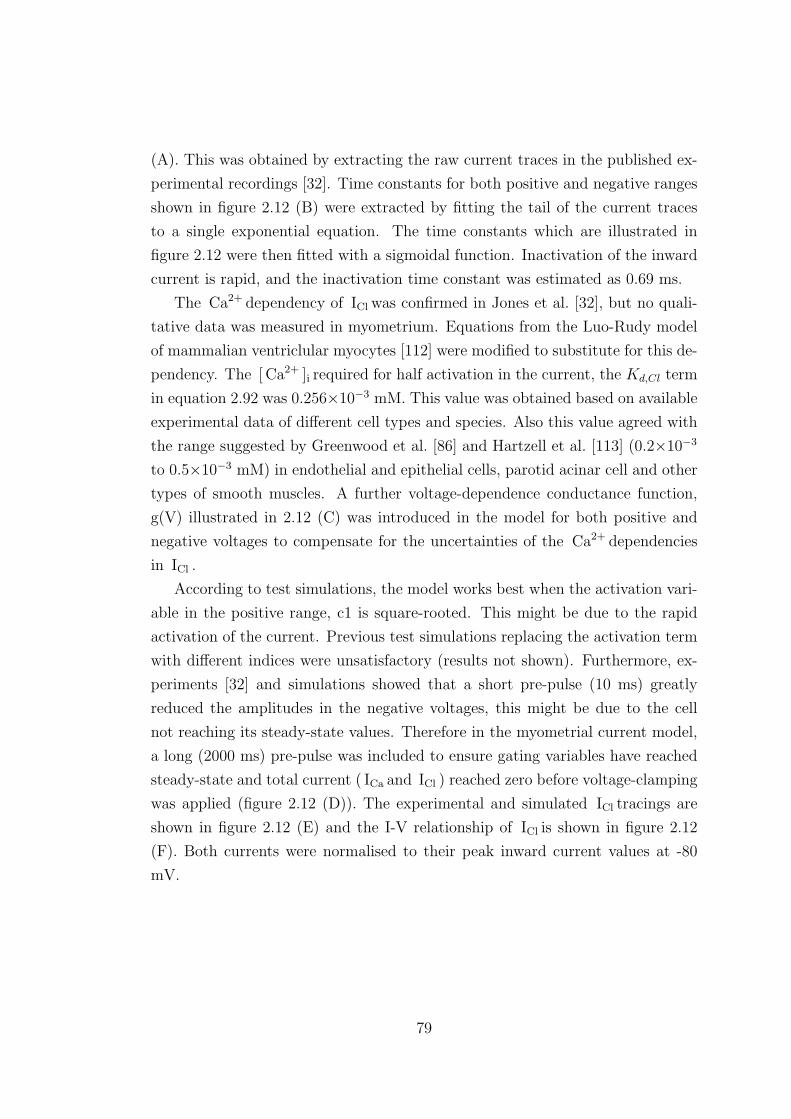
(A). This was obtained by extracting the raw current traces in the published ex-
perimental recordings [32]. Time constants for both positive and negative ranges
shown in figure 2.12 (B) were extracted by fitting the tail of the current traces
to a single exponential equation. The time constants which are illustrated in
figure 2.12 were then fitted with a sigmoidal function. Inactivation of the inward
current is rapid, and the inactivation time constant was estimated as 0.69 ms.
The Ca2+ dependency of ICl was confirmed in Jones et al. [32], but no quali-
tative data was measured in myometrium. Equations from the Luo-Rudy model
of mammalian ventriclular myocytes [112] were modified to substitute for this de-
pendency. The [ Ca2+ ]i required for half activation in the current, the Kd,Cl term
in equation 2.92 was 0.256×10⁻³ mM. This value was obtained based on available
experimental data of different cell types and species. Also this value agreed with
the range suggested by Greenwood et al. [86] and Hartzell et al. [113] (0.2×10⁻³
to 0.5×10⁻³ mM) in endothelial and epithelial cells, parotid acinar cell and other
types of smooth muscles. A further voltage-dependence conductance function,
g(V) illustrated in 2.12 (C) was introduced in the model for both positive and
negative voltages to compensate for the uncertainties of the Ca2+ dependencies
in ICl .
According to test simulations, the model works best when the activation vari-
able in the positive range, c1 is square-rooted. This might be due to the rapid
activation of the current. Previous test simulations replacing the activation term
with different indices were unsatisfactory (results not shown). Furthermore, ex-
periments [32] and simulations showed that a short pre-pulse (10 ms) greatly
reduced the amplitudes in the negative voltages, this might be due to the cell
not reaching its steady-state values. Therefore in the myometrial current model,
a long (2000 ms) pre-pulse was included to ensure gating variables have reached
steady-state and total current ( ICa and ICl ) reached zero before voltage-clamping
was applied (figure 2.12 (D)). The experimental and simulated ICl tracings are
shown in figure 2.12 (E) and the I-V relationship of ICl is shown in figure 2.12
(F). Both currents were normalised to their peak inward current values at -80
mV.
79
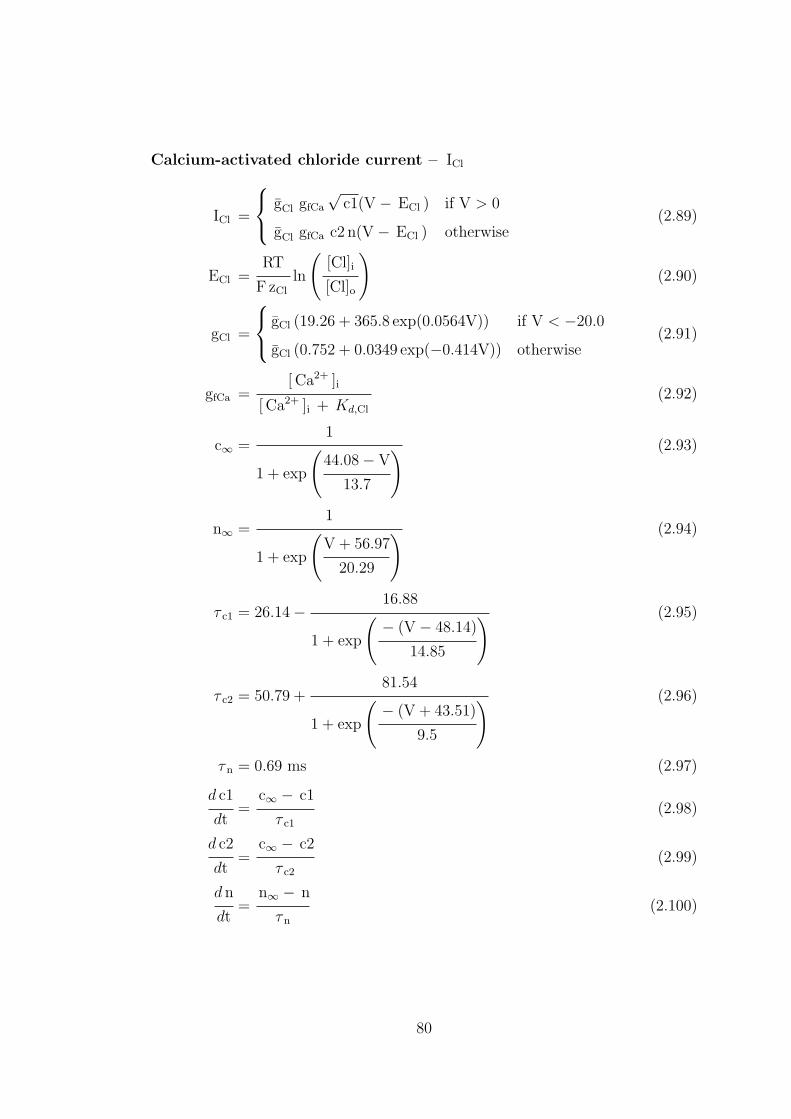
Calcium-activated chloride current – ICl
ICl =
gCl gfCa
√c1(V − ECl ) if V > 0
gCl gfCa c2 n(V − ECl ) otherwise(2.89)
ECl =RT
F zCl
ln
([Cl]i
[Cl]o
)(2.90)
gCl =
gCl (19.26 + 365.8 exp(0.0564V)) if V < −20.0
gCl (0.752 + 0.0349 exp(−0.414V)) otherwise(2.91)
gfCa =[ Ca2+ ]i
[ Ca2+ ]i + Kd,Cl
(2.92)
c∞ =1
1 + exp
(44.08− V
13.7
) (2.93)
n∞ =1
1 + exp
(V + 56.97
20.29
) (2.94)
τ c1 = 26.14− 16.88
1 + exp
(− (V − 48.14)
14.85
) (2.95)
τ c2 = 50.79 +81.54
1 + exp
(− (V + 43.51)
9.5
) (2.96)
τn = 0.69 ms (2.97)
d c1
dt=
c∞ − c1
τ c1
(2.98)
d c2
dt=
c∞ − c2
τ c2
(2.99)
d n
dt=
n∞ − n
τn
(2.100)
80
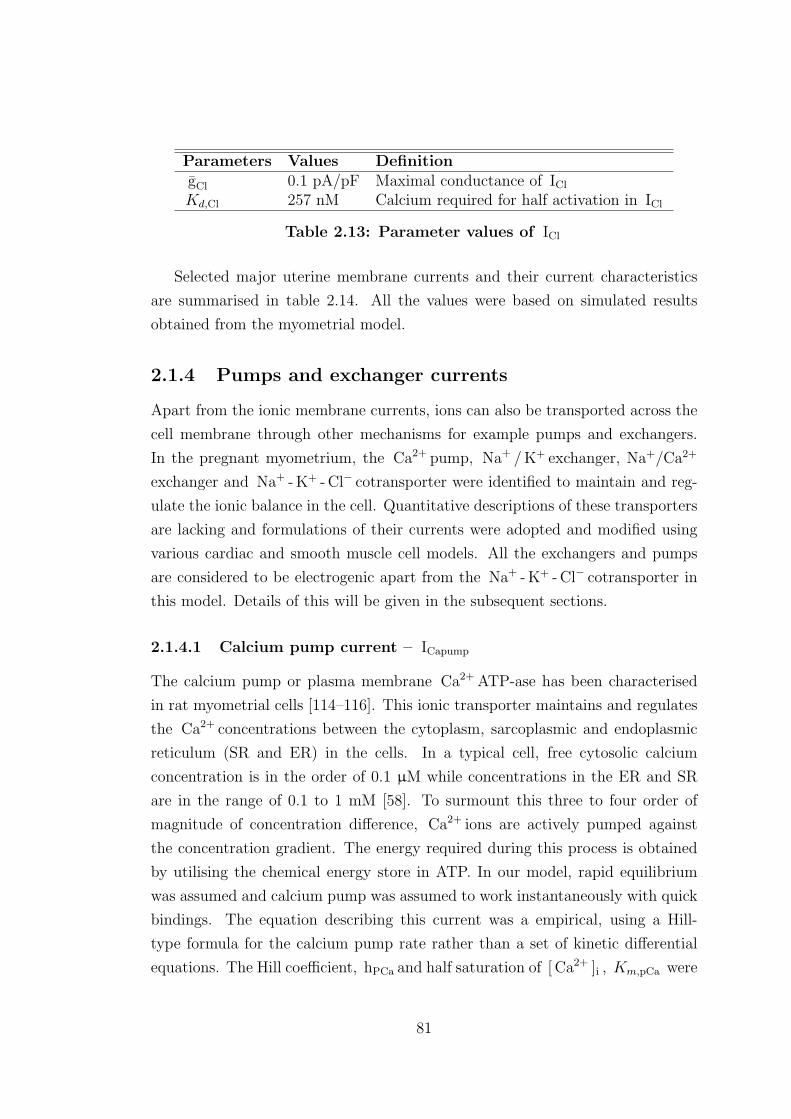
Parameters Values DefinitiongCl 0.1 pA/pF Maximal conductance of ICl
Kd,Cl 257 nM Calcium required for half activation in ICl
Table 2.13: Parameter values of ICl
Selected major uterine membrane currents and their current characteristics
are summarised in table 2.14. All the values were based on simulated results
obtained from the myometrial model.
2.1.4 Pumps and exchanger currents
Apart from the ionic membrane currents, ions can also be transported across the
cell membrane through other mechanisms for example pumps and exchangers.
In the pregnant myometrium, the Ca2+ pump, Na+ /K+ exchanger, Na+/Ca2+
exchanger and Na+ -K+ - Cl− cotransporter were identified to maintain and reg-
ulate the ionic balance in the cell. Quantitative descriptions of these transporters
are lacking and formulations of their currents were adopted and modified using
various cardiac and smooth muscle cell models. All the exchangers and pumps
are considered to be electrogenic apart from the Na+ -K+ - Cl− cotransporter in
this model. Details of this will be given in the subsequent sections.
2.1.4.1 Calcium pump current – ICapump
The calcium pump or plasma membrane Ca2+ ATP-ase has been characterised
in rat myometrial cells [114–116]. This ionic transporter maintains and regulates
the Ca2+ concentrations between the cytoplasm, sarcoplasmic and endoplasmic
reticulum (SR and ER) in the cells. In a typical cell, free cytosolic calcium
concentration is in the order of 0.1 µM while concentrations in the ER and SR
are in the range of 0.1 to 1 mM [58]. To surmount this three to four order of
magnitude of concentration difference, Ca2+ ions are actively pumped against
the concentration gradient. The energy required during this process is obtained
by utilising the chemical energy store in ATP. In our model, rapid equilibrium
was assumed and calcium pump was assumed to work instantaneously with quick
bindings. The equation describing this current was a empirical, using a Hill-
type formula for the calcium pump rate rather than a set of kinetic differential
equations. The Hill coefficient, hPCa and half saturation of [ Ca2+ ]i , Km,pCa were
81
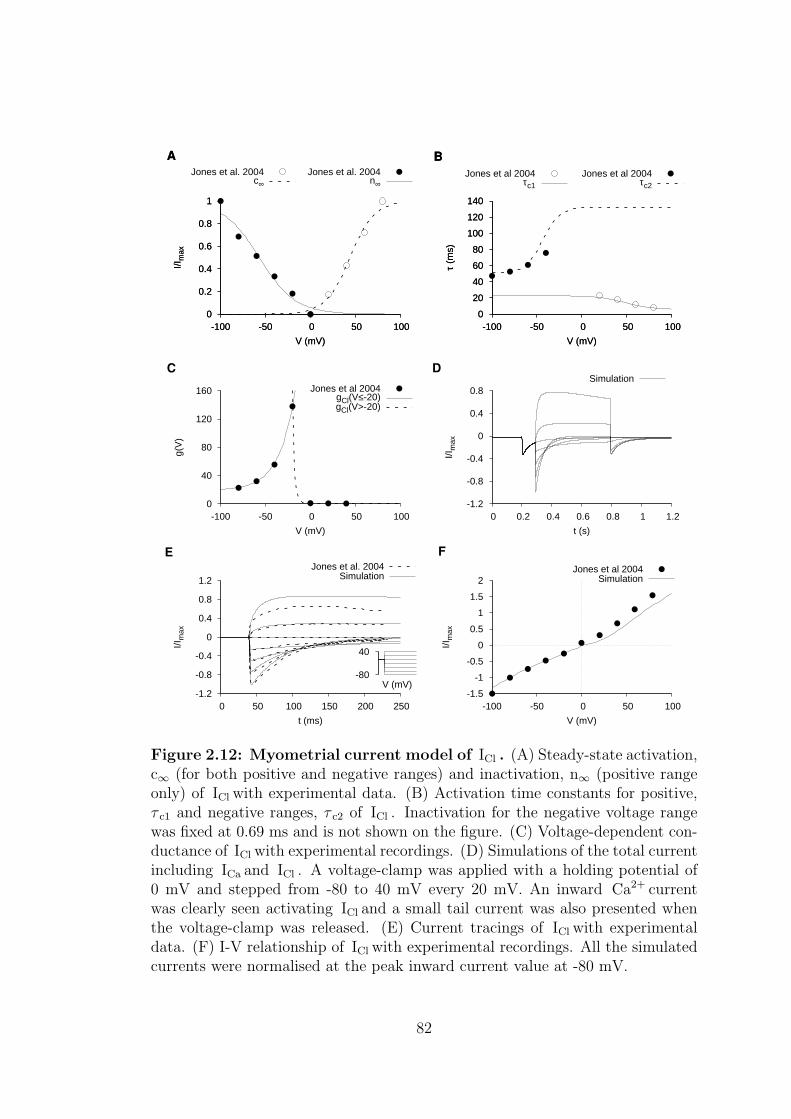
0
0.2
0.4
0.6
0.8
1
-100 -50 0 50 100
I/Im
ax
V (mV)
A
Jones et al. 2004c∞
0
0.2
0.4
0.6
0.8
1
-100 -50 0 50 100
I/Im
ax
V (mV)
A
Jones et al. 2004n∞
0
20
40
60
80
100
120
140
-100 -50 0 50 100
τ (m
s)
V (mV)
B
Jones et al 2004τc1
0
20
40
60
80
100
120
140
-100 -50 0 50 100
τ (m
s)
V (mV)
B
Jones et al 2004τc2
0
40
80
120
160
-100 -50 0 50 100
g(V
)
V (mV)
C
Jones et al 2004gCl(V≤-20)gCl(V>-20)
-1.2
-0.8
-0.4
0
0.4
0.8
0 0.2 0.4 0.6 0.8 1 1.2
I/Im
ax
t (s)
DSimulation
-1.2
-0.8
-0.4
0
0.4
0.8
1.2
0 50 100 150 200 250
I/Im
ax
t (ms)
E
Jones et al. 2004Simulation
-1.5
-1
-0.5
0
0.5
1
1.5
2
-100 -50 0 50 100
I/Im
ax
V (mV)
F
Jones et al 2004Simulation
-80
40
V (mV)
Figure 2.12: Myometrial current model of ICl . (A) Steady-state activation,c∞ (for both positive and negative ranges) and inactivation, n∞ (positive rangeonly) of ICl with experimental data. (B) Activation time constants for positive,τ c1 and negative ranges, τ c2 of ICl . Inactivation for the negative voltage rangewas fixed at 0.69 ms and is not shown on the figure. (C) Voltage-dependent con-ductance of ICl with experimental recordings. (D) Simulations of the total currentincluding ICa and ICl . A voltage-clamp was applied with a holding potential of0 mV and stepped from -80 to 40 mV every 20 mV. An inward Ca2+ currentwas clearly seen activating ICl and a small tail current was also presented whenthe voltage-clamp was released. (E) Current tracings of ICl with experimentaldata. (F) I-V relationship of ICl with experimental recordings. All the simulatedcurrents were normalised at the peak inward current value at -80 mV.
82
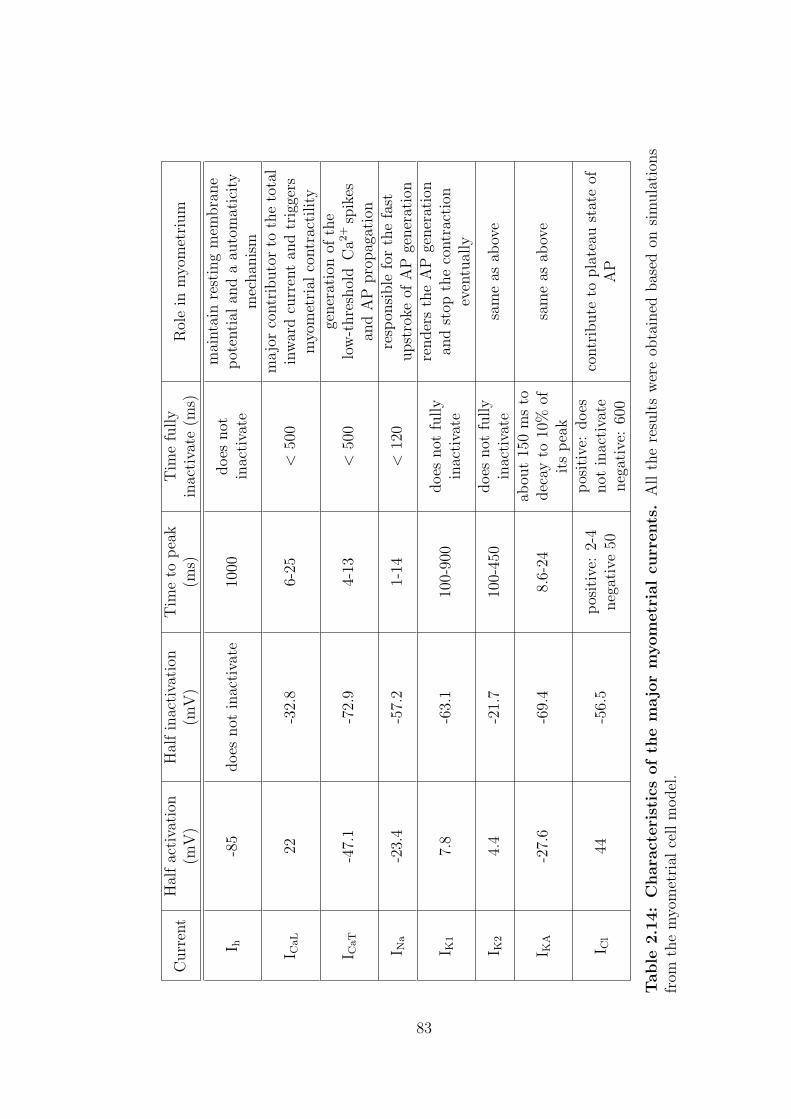
Curr
ent
Hal
fac
tiva
tion
(mV
)H
alfin
acti
vati
on(m
V)
Tim
eto
pea
k(m
s)T
ime
fully
inac
tiva
te(m
s)R
ole
inm
yom
etri
um
I h-8
5does
not
inac
tiva
te10
00does
not
inac
tiva
te
mai
nta
inre
stin
gm
embra
ne
pot
enti
alan
da
auto
mat
icity
mec
han
ism
I CaL
22-3
2.8
6-25
<50
0m
ajo
rco
ntr
ibuto
rto
the
tota
lin
war
dcu
rren
tan
dtr
igge
rsm
yom
etri
alco
ntr
acti
lity
I CaT
-47.
1-7
2.9
4-13
<50
0ge
ner
atio
nof
the
low
-thre
shol
dC
a2+
spik
esan
dA
Ppro
pag
atio
n
I Na
-23.
4-5
7.2
1-14
<12
0re
spon
sible
for
the
fast
upst
roke
ofA
Pge
ner
atio
n
I K1
7.8
-63.
110
0-90
0does
not
fully
inac
tiva
te
render
sth
eA
Pge
ner
atio
nan
dst
opth
eco
ntr
acti
onev
entu
ally
I K2
4.4
-21.
710
0-45
0does
not
fully
inac
tiva
tesa
me
asab
ove
I KA
-27.
6-6
9.4
8.6-
24ab
out
150
ms
todec
ayto
10%
ofit
spea
ksa
me
asab
ove
I Cl
44-5
6.5
pos
itiv
e:2-
4neg
ativ
e50
pos
itiv
e:does
not
inac
tiva
teneg
ativ
e:60
0
contr
ibute
topla
teau
stat
eof
AP
Table
2.1
4:
Chara
cteri
stic
sof
the
majo
rm
yom
etr
ialcu
rrents
.A
llth
ere
sult
sw
ere
obta
ined
bas
edon
sim
ula
tion
sfr
omth
em
yom
etri
alce
llm
odel
.
83
determined and modified based on experimentally obtained values by Grover et
al. [115].
Plasma membrane Ca2+ -ATPase current– ICapump
ICapump =zCa F Vc
Cm BCa Ac
· JpCa
1 +
(Km,pCa
[ Ca2+ ]i
) hPCa(2.101)
Parameters Values DefinitionJpCa 7×10⁻⁷ mM/ms Maximum flux of ICapump
Km,pCa 0.5 µN Half saturation of [ Ca2+ ]ihPCa 2 Hill coefficient
Table 2.15: Parameter values of ICapump
2.1.4.2 Sodium/Potassium exchanger current – INaK
The Na+ /K+ exchanger and its current, INaK is vital in regulating the Na+ and
K+ concentration extra- and intracellularly. It is identified in myometrial cells of
late pregnant rats [117–119] and human [25]. In each forward cycle, the Na+/K+
exchanger expels three Na+ ions and uptakes two K+ ions for each hydrolysed
ATP, creating a net outward flux which leaves the cell more negatively charged.
Reports showed INaK in the rat myometrium increased during pregnancy and
peaked at 17 days gestation [119].
Despite evidence of an electrogenic INaK in myometrial cells, there is little in-
formation about its current properties in myometrium. The myometrium model
adopted and modified the equations from the Luo-Rudy mammalian ventricu-
lar model [112] (based on guinea pig ventricular myocyctes data on Nakao and
Gadsby [120]). This current is [ Na+ ]o , [ Na+ ]i , [ K+ ]o and voltage dependent.
The simulated results were then used to validate experimental data from guinea
pig mesenteric resistance arteries cells [121] since smooth muscle cells are much
more similar to the myometrial cell than ventricular cells. The current model
for INaK was developed at 36◦C, a Q10 value of 1.87 for every 10◦C change (be-
tween 26 to 36◦C) was reported for vascular smooth muscle cells by Nakamura et
al. [121]. Simulations of the whole cell model showed this current was necessary to
84
produce a bursting AP since the inhibition of the exchanger dynamically changes
[ Na+ ]i and in turn affects the activities of K+ and K+ -dependent currents (e.g.
INSCC ).
Na+ / K+ exchanger current – INaK
INaK = gNaK fNaK kNaK nNaK (2.102)
fNaK =1
1 + 0.125 exp
(− 0.1VF
RT
)+
0.00219 exp
([ Na+ ]o
49.71
)exp
(− 1.9VF
RT
)
(2.103)
kNaK =1
1 +
(Kd,K
[ K+ ]o
)nK(2.104)
nNaK =1
1 +
(Kd,Na
[ Na+ ]i
)nNa(2.105)
Parameters Values DefinitiongNaK 1.7 nS/pF Maximum conductance of INaK
Kd,K 2 mM Half saturation of K+ in INaK
nK 1.5 Hill coefficient of K+ in INaK
Kd,Na 22 mM Half saturation of Na+ in INaK
nNa 2 Hill coefficient of Na+ in INaK
Table 2.16: Parameter values of INaK
2.1.4.3 Sodium/Calcium exchanger current – INaCa
Na+ /Ca2+ exchanger current, INaCa works in a similar way as INaK . It controls
reversibly and regulates the Na+ and Ca2+ concentration inside and outside the
cell. In each cycle, one Ca2+ ion is pumped out of the cell while three Na+ ions
are transferred in. Research has shown Na+ /Ca2+ exchangers are involved in
calcium translocation in pregnant rat myometrial cells [39, 69, 122, 123]. Studies
85
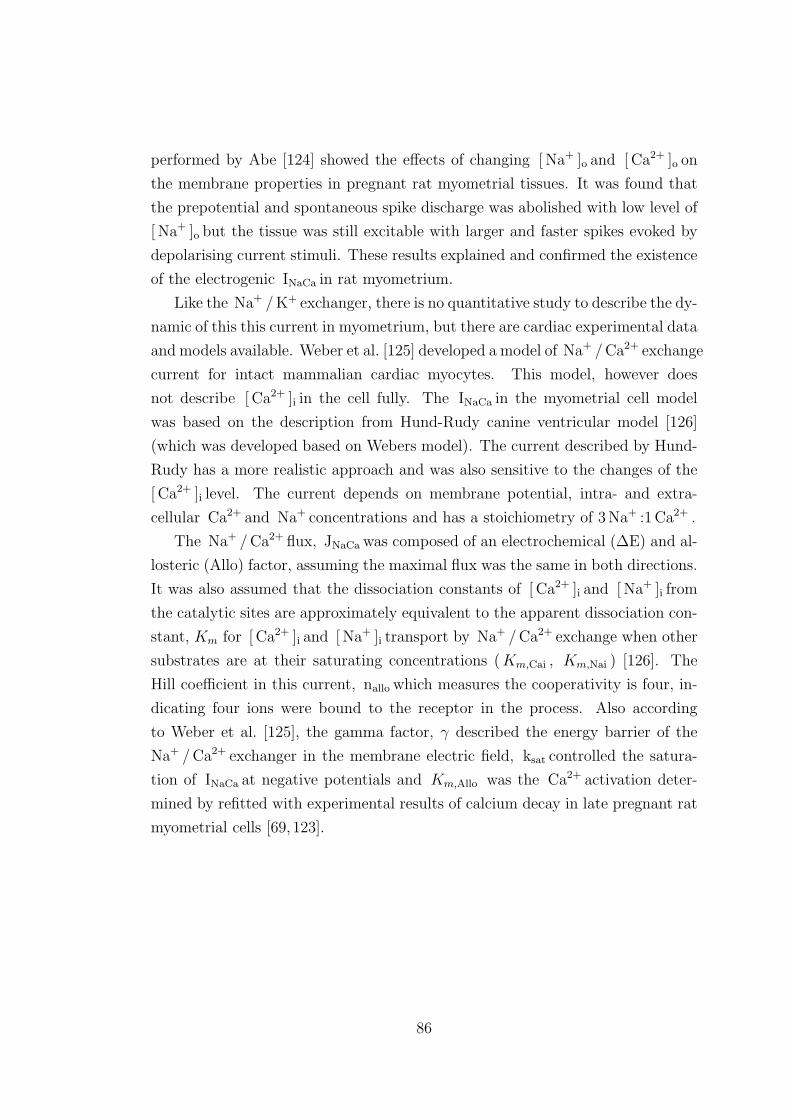
performed by Abe [124] showed the effects of changing [ Na+ ]o and [ Ca2+ ]o on
the membrane properties in pregnant rat myometrial tissues. It was found that
the prepotential and spontaneous spike discharge was abolished with low level of
[ Na+ ]o but the tissue was still excitable with larger and faster spikes evoked by
depolarising current stimuli. These results explained and confirmed the existence
of the electrogenic INaCa in rat myometrium.
Like the Na+ /K+ exchanger, there is no quantitative study to describe the dy-
namic of this this current in myometrium, but there are cardiac experimental data
and models available. Weber et al. [125] developed a model of Na+ /Ca2+ exchange
current for intact mammalian cardiac myocytes. This model, however does
not describe [ Ca2+ ]i in the cell fully. The INaCa in the myometrial cell model
was based on the description from Hund-Rudy canine ventricular model [126]
(which was developed based on Webers model). The current described by Hund-
Rudy has a more realistic approach and was also sensitive to the changes of the
[ Ca2+ ]i level. The current depends on membrane potential, intra- and extra-
cellular Ca2+ and Na+ concentrations and has a stoichiometry of 3 Na+ :1Ca2+ .
The Na+ /Ca2+ flux, JNaCa was composed of an electrochemical (∆E) and al-
losteric (Allo) factor, assuming the maximal flux was the same in both directions.
It was also assumed that the dissociation constants of [ Ca2+ ]i and [ Na+ ]i from
the catalytic sites are approximately equivalent to the apparent dissociation con-
stant, Km for [ Ca2+ ]i and [ Na+ ]i transport by Na+ /Ca2+ exchange when other
substrates are at their saturating concentrations ( Km,Cai , Km,Nai ) [126]. The
Hill coefficient in this current, nallo which measures the cooperativity is four, in-
dicating four ions were bound to the receptor in the process. Also according
to Weber et al. [125], the gamma factor, γ described the energy barrier of the
Na+ /Ca2+ exchanger in the membrane electric field, ksat controlled the satura-
tion of INaCa at negative potentials and Km,Allo was the Ca2+ activation deter-
mined by refitted with experimental results of calcium decay in late pregnant rat
myometrial cells [69, 123].
86
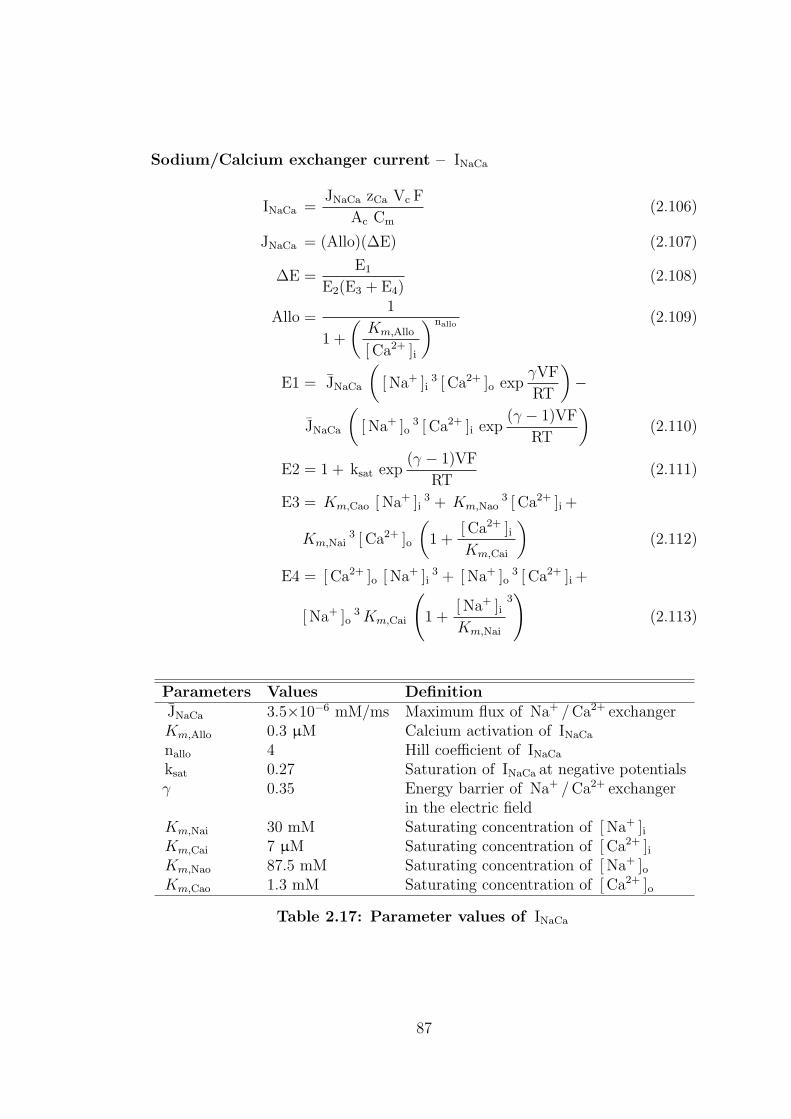
Sodium/Calcium exchanger current – INaCa
INaCa =JNaCa zCa Vc F
Ac Cm
(2.106)
JNaCa = (Allo)(∆E) (2.107)
∆E =E1
E2(E3 + E4)(2.108)
Allo =1
1 +
(Km,Allo
[ Ca2+ ]i
) nallo(2.109)
E1 = JNaCa
([ Na+ ]i
3 [ Ca2+ ]o expγVF
RT
)−
JNaCa
([ Na+ ]o
3 [ Ca2+ ]i exp(γ − 1)VF
RT
)(2.110)
E2 = 1 + ksat exp(γ − 1)VF
RT(2.111)
E3 = Km,Cao [ Na+ ]i3 + Km,Nao
3 [ Ca2+ ]i +
Km,Nai3 [ Ca2+ ]o
(1 +
[ Ca2+ ]iKm,Cai
)(2.112)
E4 = [ Ca2+ ]o [ Na+ ]i3 + [ Na+ ]o
3 [ Ca2+ ]i +
[ Na+ ]o3 Km,Cai
(1 +
[ Na+ ]iKm,Nai
3)
(2.113)
Parameters Values DefinitionJNaCa 3.5×10⁻⁶ mM/ms Maximum flux of Na+ /Ca2+ exchangerKm,Allo 0.3 µM Calcium activation of INaCa
nallo 4 Hill coefficient of INaCa
ksat 0.27 Saturation of INaCa at negative potentialsγ 0.35 Energy barrier of Na+ /Ca2+ exchanger
in the electric fieldKm,Nai 30 mM Saturating concentration of [ Na+ ]iKm,Cai 7 µM Saturating concentration of [ Ca2+ ]iKm,Nao 87.5 mM Saturating concentration of [ Na+ ]oKm,Cao 1.3 mM Saturating concentration of [ Ca2+ ]o
Table 2.17: Parameter values of INaCa
87
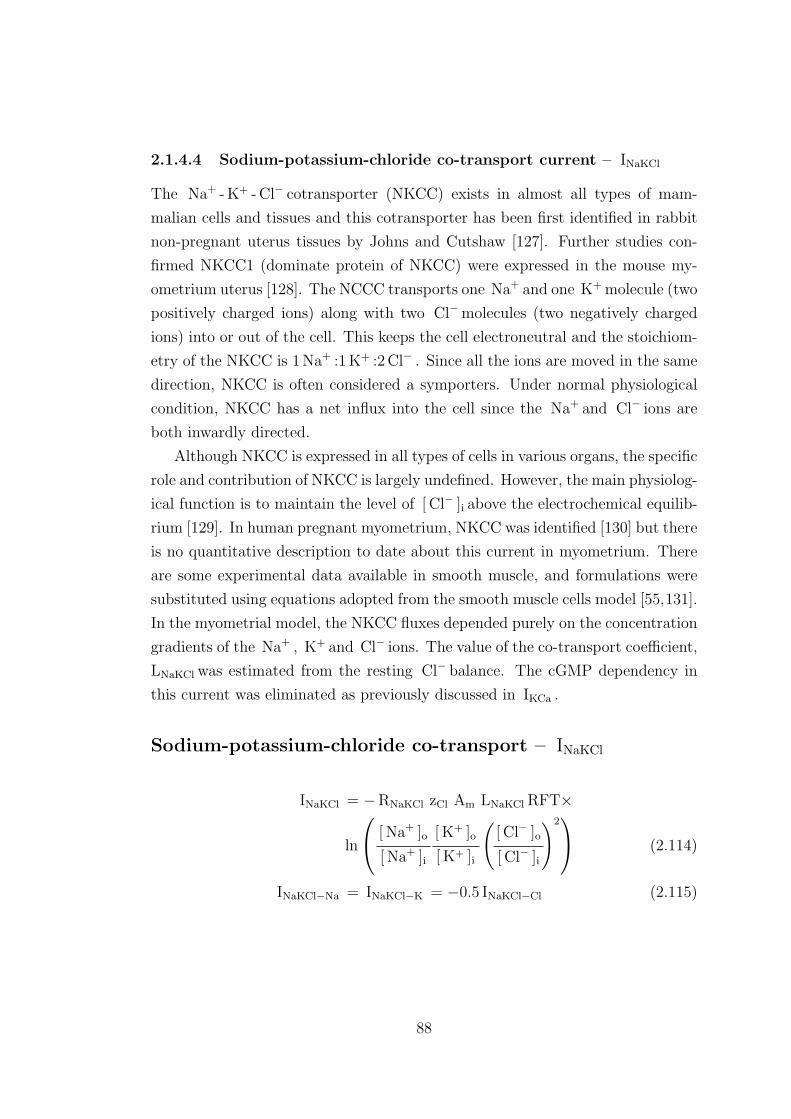
2.1.4.4 Sodium-potassium-chloride co-transport current – INaKCl
The Na+ - K+ - Cl− cotransporter (NKCC) exists in almost all types of mam-
malian cells and tissues and this cotransporter has been first identified in rabbit
non-pregnant uterus tissues by Johns and Cutshaw [127]. Further studies con-
firmed NKCC1 (dominate protein of NKCC) were expressed in the mouse my-
ometrium uterus [128]. The NCCC transports one Na+ and one K+ molecule (two
positively charged ions) along with two Cl−molecules (two negatively charged
ions) into or out of the cell. This keeps the cell electroneutral and the stoichiom-
etry of the NKCC is 1Na+ :1K+ :2Cl− . Since all the ions are moved in the same
direction, NKCC is often considered a symporters. Under normal physiological
condition, NKCC has a net influx into the cell since the Na+ and Cl− ions are
both inwardly directed.
Although NKCC is expressed in all types of cells in various organs, the specific
role and contribution of NKCC is largely undefined. However, the main physiolog-
ical function is to maintain the level of [ Cl− ]i above the electrochemical equilib-
rium [129]. In human pregnant myometrium, NKCC was identified [130] but there
is no quantitative description to date about this current in myometrium. There
are some experimental data available in smooth muscle, and formulations were
substituted using equations adopted from the smooth muscle cells model [55,131].
In the myometrial model, the NKCC fluxes depended purely on the concentration
gradients of the Na+ , K+ and Cl− ions. The value of the co-transport coefficient,
LNaKCl was estimated from the resting Cl− balance. The cGMP dependency in
this current was eliminated as previously discussed in IKCa .
Sodium-potassium-chloride co-transport – INaKCl
INaKCl = −RNaKCl zCl Am LNaKCl RFT×
ln
[ Na+ ]o
[ Na+ ]i
[ K+ ]o
[ K+ ]i
([ Cl− ]o
[ Cl− ]i
)2 (2.114)
INaKCl−Na = INaKCl−K = −0.5 INaKCl−Cl (2.115)
88
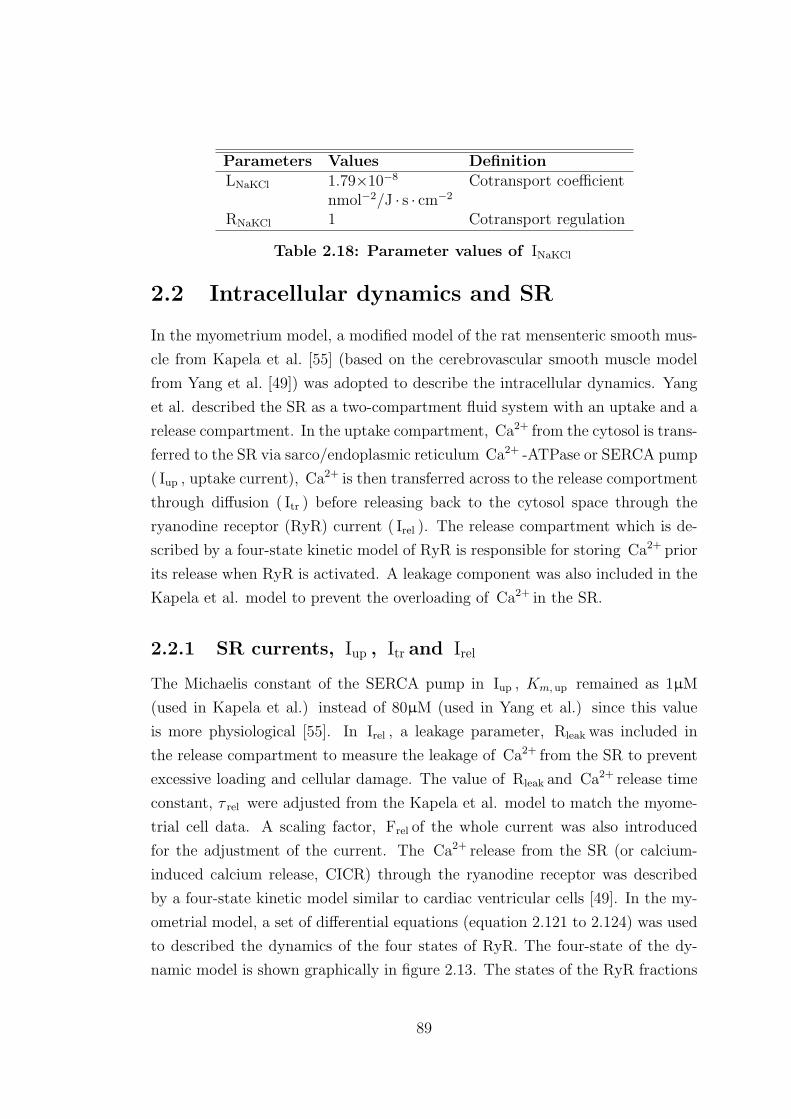
Parameters Values DefinitionLNaKCl 1.79×10⁻⁸ Cotransport coefficient
nmol−2/J · s · cm−2
RNaKCl 1 Cotransport regulation
Table 2.18: Parameter values of INaKCl
2.2 Intracellular dynamics and SR
In the myometrium model, a modified model of the rat mensenteric smooth mus-
cle from Kapela et al. [55] (based on the cerebrovascular smooth muscle model
from Yang et al. [49]) was adopted to describe the intracellular dynamics. Yang
et al. described the SR as a two-compartment fluid system with an uptake and a
release compartment. In the uptake compartment, Ca2+ from the cytosol is trans-
ferred to the SR via sarco/endoplasmic reticulum Ca2+ -ATPase or SERCA pump
( Iup , uptake current), Ca2+ is then transferred across to the release comportment
through diffusion ( Itr ) before releasing back to the cytosol space through the
ryanodine receptor (RyR) current ( Irel ). The release compartment which is de-
scribed by a four-state kinetic model of RyR is responsible for storing Ca2+ prior
its release when RyR is activated. A leakage component was also included in the
Kapela et al. model to prevent the overloading of Ca2+ in the SR.
2.2.1 SR currents, Iup , Itr and Irel
The Michaelis constant of the SERCA pump in Iup , Km, up remained as 1µM
(used in Kapela et al.) instead of 80µM (used in Yang et al.) since this value
is more physiological [55]. In Irel , a leakage parameter, Rleak was included in
the release compartment to measure the leakage of Ca2+ from the SR to prevent
excessive loading and cellular damage. The value of Rleak and Ca2+ release time
constant, τ rel were adjusted from the Kapela et al. model to match the myome-
trial cell data. A scaling factor, Frel of the whole current was also introduced
for the adjustment of the current. The Ca2+ release from the SR (or calcium-
induced calcium release, CICR) through the ryanodine receptor was described
by a four-state kinetic model similar to cardiac ventricular cells [49]. In the my-
ometrial model, a set of differential equations (equation 2.121 to 2.124) was used
to described the dynamics of the four states of RyR. The four-state of the dy-
namic model is shown graphically in figure 2.13. The states of the RyR fractions
89
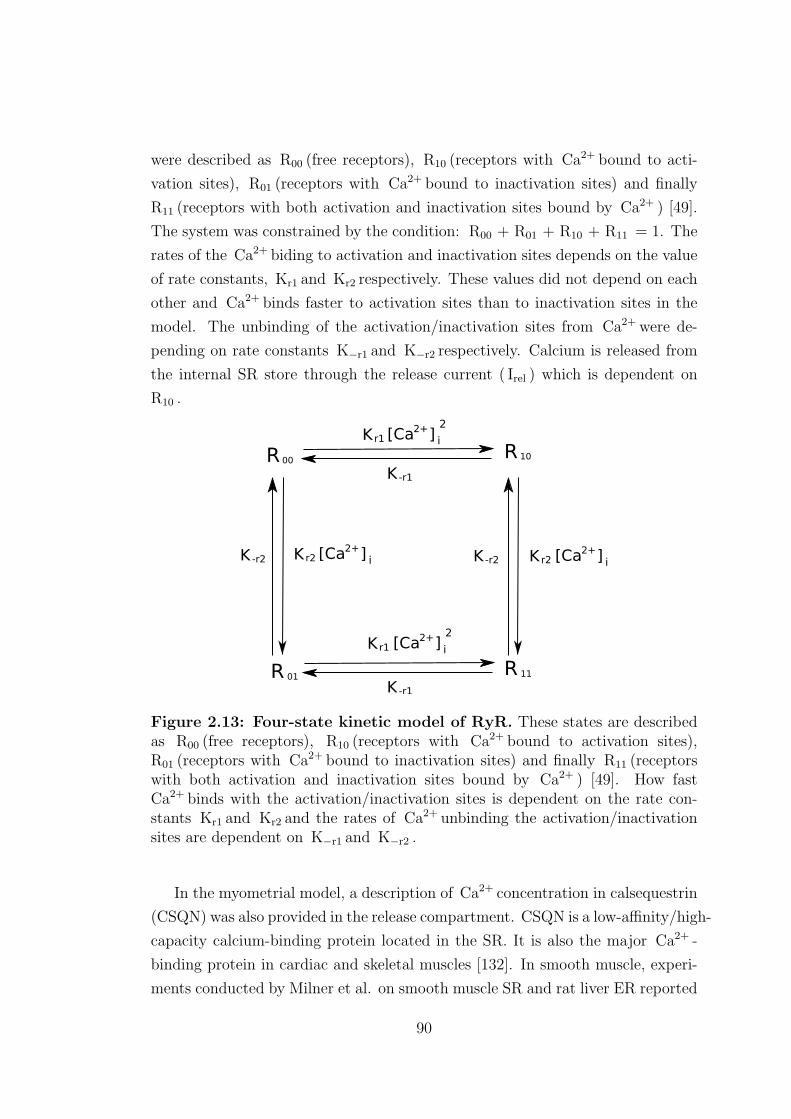
were described as R00 (free receptors), R10 (receptors with Ca2+ bound to acti-
vation sites), R01 (receptors with Ca2+ bound to inactivation sites) and finally
R11 (receptors with both activation and inactivation sites bound by Ca2+ ) [49].
The system was constrained by the condition: R00 + R01 + R10 + R11 = 1. The
rates of the Ca2+ biding to activation and inactivation sites depends on the value
of rate constants, Kr1 and Kr2 respectively. These values did not depend on each
other and Ca2+ binds faster to activation sites than to inactivation sites in the
model. The unbinding of the activation/inactivation sites from Ca2+ were de-
pending on rate constants K−r1 and K−r2 respectively. Calcium is released from
the internal SR store through the release current ( Irel ) which is dependent on
R10 .
R R
R R
00 10
01 11
K -r2 K -r2K r2 K r2
K r1
K r1
K -r1
K -r1
[Ca ]2+
i
2
[Ca ]2+
i
2
[Ca ]2+
i [Ca ]2+
i
Figure 2.13: Four-state kinetic model of RyR. These states are describedas R00 (free receptors), R10 (receptors with Ca2+ bound to activation sites),R01 (receptors with Ca2+ bound to inactivation sites) and finally R11 (receptorswith both activation and inactivation sites bound by Ca2+ ) [49]. How fastCa2+ binds with the activation/inactivation sites is dependent on the rate con-stants Kr1 and Kr2 and the rates of Ca2+ unbinding the activation/inactivationsites are dependent on K−r1 and K−r2 .
In the myometrial model, a description of Ca2+ concentration in calsequestrin
(CSQN) was also provided in the release compartment. CSQN is a low-affinity/high-
capacity calcium-binding protein located in the SR. It is also the major Ca2+ -
binding protein in cardiac and skeletal muscles [132]. In smooth muscle, experi-
ments conducted by Milner et al. on smooth muscle SR and rat liver ER reported
90
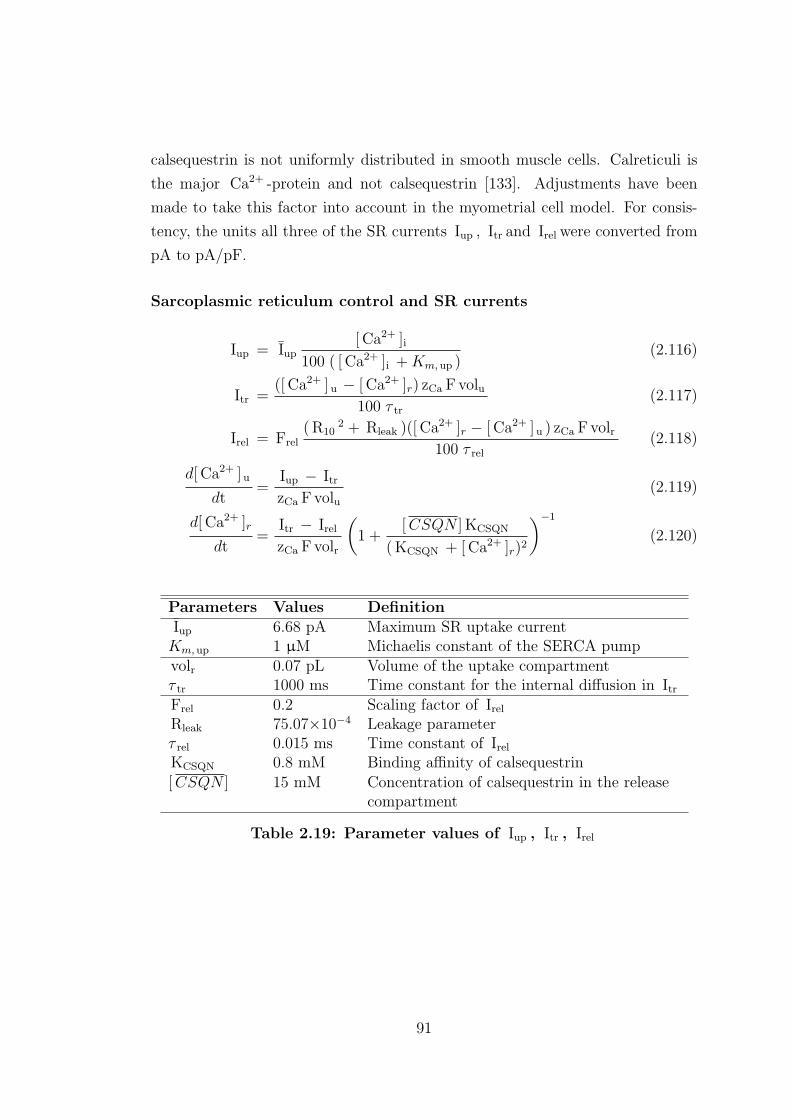
calsequestrin is not uniformly distributed in smooth muscle cells. Calreticuli is
the major Ca2+ -protein and not calsequestrin [133]. Adjustments have been
made to take this factor into account in the myometrial cell model. For consis-
tency, the units all three of the SR currents Iup , Itr and Irel were converted from
pA to pA/pF.
Sarcoplasmic reticulum control and SR currents
Iup = Iup[ Ca2+ ]i
100 ( [ Ca2+ ]i + Km, up )(2.116)
Itr =([ Ca2+ ]u − [ Ca2+ ]r) zCa F volu
100 τ tr
(2.117)
Irel = Frel( R10
2 + Rleak )([ Ca2+ ]r − [ Ca2+ ]u ) zCa F volr100 τ rel
(2.118)
d[ Ca2+ ] u
dt=
Iup − ItrzCa F volu
(2.119)
d[ Ca2+ ]r
dt=
Itr − IrelzCa F volr
(1 +
[ CSQN ] KCSQN
( KCSQN + [ Ca2+ ]r)2
)−1
(2.120)
Parameters Values DefinitionIup 6.68 pA Maximum SR uptake currentKm, up 1 µM Michaelis constant of the SERCA pumpvolr 0.07 pL Volume of the uptake compartmentτ tr 1000 ms Time constant for the internal diffusion in ItrFrel 0.2 Scaling factor of IrelRleak 75.07×10⁻⁴ Leakage parameterτ rel 0.015 ms Time constant of IrelKCSQN 0.8 mM Binding affinity of calsequestrin[CSQN ] 15 mM Concentration of calsequestrin in the release
compartment
Table 2.19: Parameter values of Iup , Itr , Irel
91
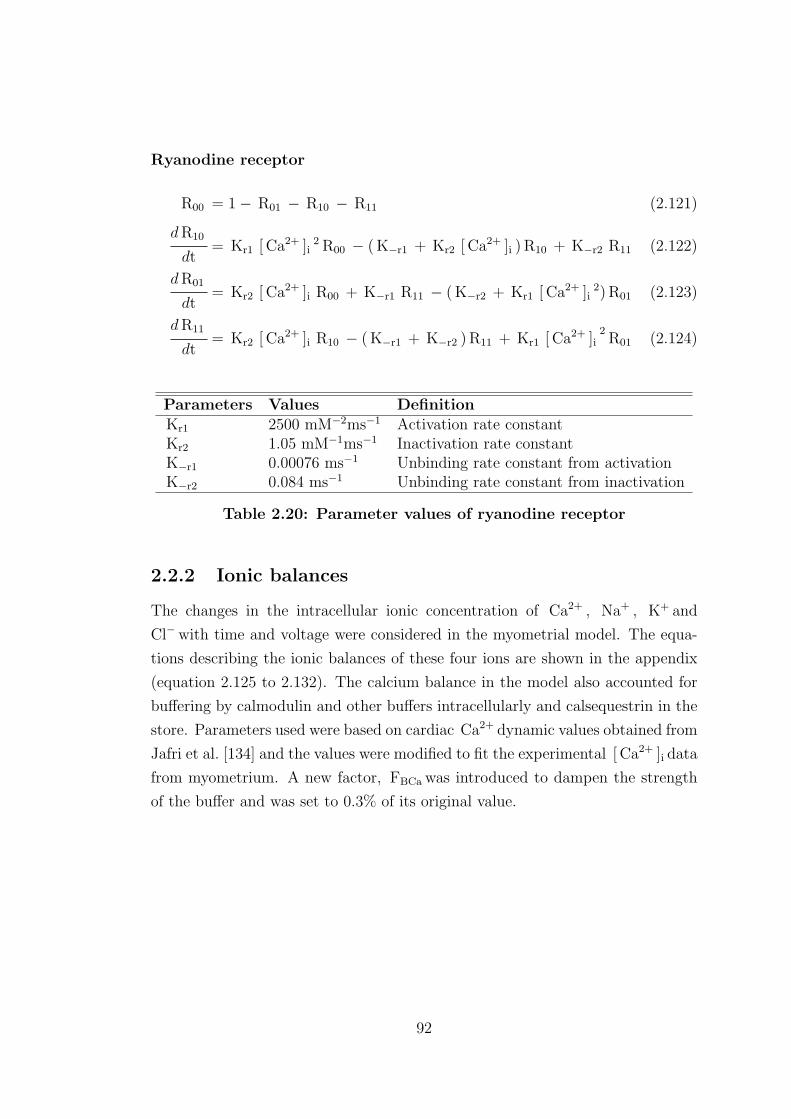
Ryanodine receptor
R00 = 1− R01 − R10 − R11 (2.121)
d R10
dt= Kr1 [ Ca2+ ]i
2 R00 − ( K−r1 + Kr2 [ Ca2+ ]i ) R10 + K−r2 R11 (2.122)
d R01
dt= Kr2 [ Ca2+ ]i R00 + K−r1 R11 − ( K−r2 + Kr1 [ Ca2+ ]i
2) R01 (2.123)
d R11
dt= Kr2 [ Ca2+ ]i R10 − ( K−r1 + K−r2 ) R11 + Kr1 [ Ca2+ ]i
2R01 (2.124)
Parameters Values DefinitionKr1 2500 mM−2ms−1 Activation rate constantKr2 1.05 mM−1ms−1 Inactivation rate constantK−r1 0.00076 ms−1 Unbinding rate constant from activationK−r2 0.084 ms−1 Unbinding rate constant from inactivation
Table 2.20: Parameter values of ryanodine receptor
2.2.2 Ionic balances
The changes in the intracellular ionic concentration of Ca2+ , Na+ , K+ and
Cl−with time and voltage were considered in the myometrial model. The equa-
tions describing the ionic balances of these four ions are shown in the appendix
(equation 2.125 to 2.132). The calcium balance in the model also accounted for
buffering by calmodulin and other buffers intracellularly and calsequestrin in the
store. Parameters used were based on cardiac Ca2+ dynamic values obtained from
Jafri et al. [134] and the values were modified to fit the experimental [ Ca2+ ]i data
from myometrium. A new factor, FBCa was introduced to dampen the strength
of the buffer and was set to 0.3% of its original value.
92
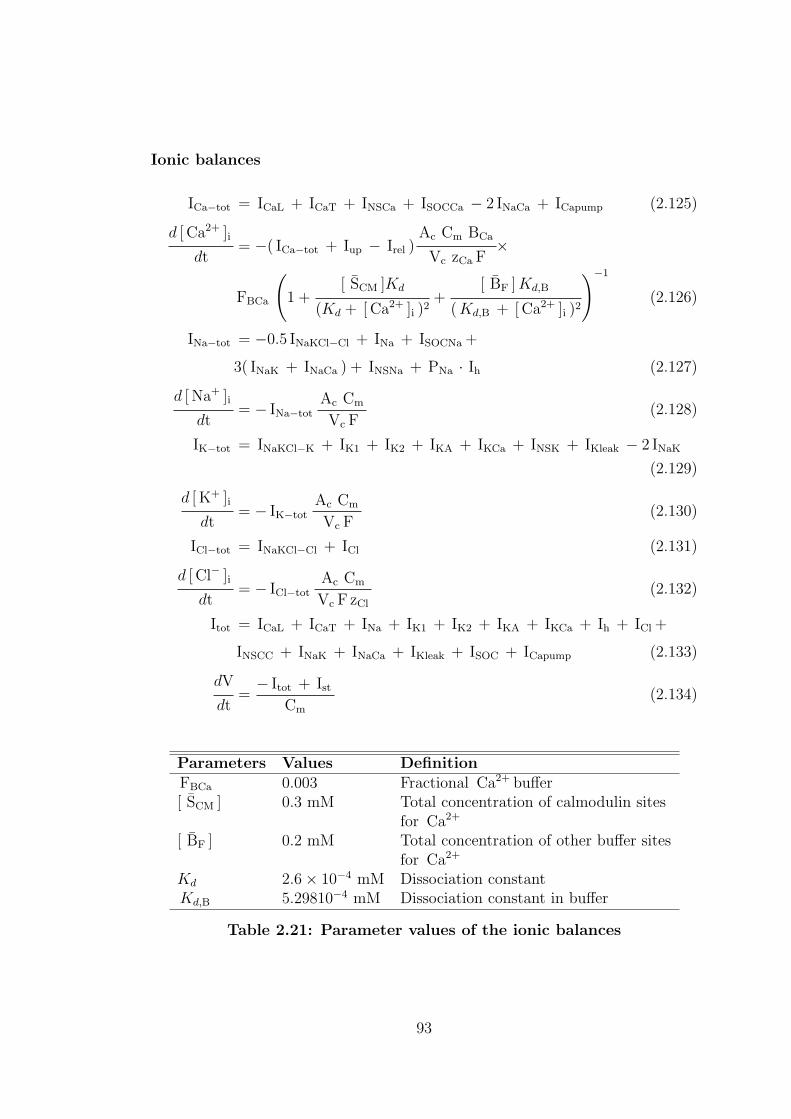
Ionic balances
ICa−tot = ICaL + ICaT + INSCa + ISOCCa − 2 INaCa + ICapump (2.125)
d [ Ca2+ ]i
dt= −( ICa−tot + Iup − Irel )
Ac Cm BCa
Vc zCa F×
FBCa
(1 +
[ SCM ]Kd
(Kd + [ Ca2+ ]i )2+
[ BF ] Kd,B
( Kd,B + [ Ca2+ ]i )2
)−1
(2.126)
INa−tot = −0.5 INaKCl−Cl + INa + ISOCNa +
3( INaK + INaCa ) + INSNa + PNa · Ih (2.127)
d [ Na+ ]i
dt= − INa−tot
Ac Cm
Vc F(2.128)
IK−tot = INaKCl−K + IK1 + IK2 + IKA + IKCa + INSK + IKleak − 2 INaK
(2.129)
d [ K+ ]i
dt= − IK−tot
Ac Cm
Vc F(2.130)
ICl−tot = INaKCl−Cl + ICl (2.131)
d [ Cl− ]i
dt= − ICl−tot
Ac Cm
Vc F zCl
(2.132)
Itot = ICaL + ICaT + INa + IK1 + IK2 + IKA + IKCa + Ih + ICl +
INSCC + INaK + INaCa + IKleak + ISOC + ICapump (2.133)
dV
dt=− Itot + Ist
Cm
(2.134)
Parameters Values DefinitionFBCa 0.003 Fractional Ca2+ buffer[ SCM ] 0.3 mM Total concentration of calmodulin sites
for Ca2+
[ BF ] 0.2 mM Total concentration of other buffer sitesfor Ca2+
Kd 2.6× 10⁻⁴ mM Dissociation constantKd,B 5.29810−4 mM Dissociation constant in buffer
Table 2.21: Parameter values of the ionic balances
93
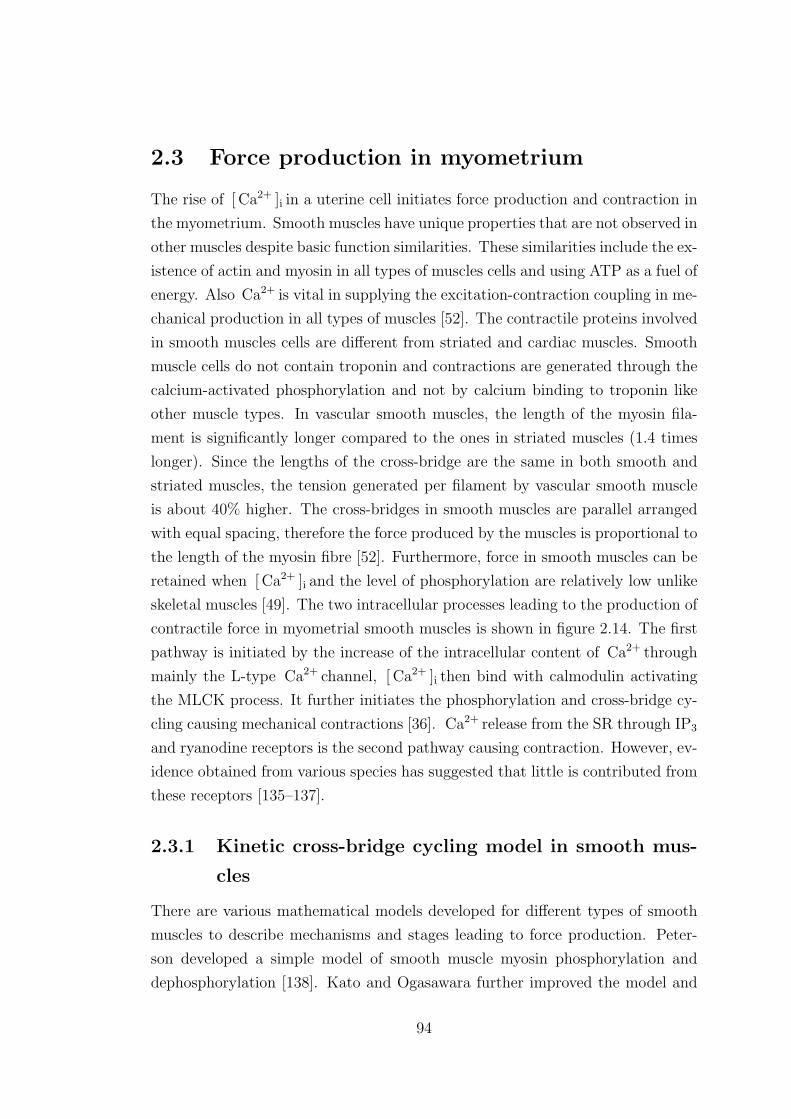
2.3 Force production in myometrium
The rise of [ Ca2+ ]i in a uterine cell initiates force production and contraction in
the myometrium. Smooth muscles have unique properties that are not observed in
other muscles despite basic function similarities. These similarities include the ex-
istence of actin and myosin in all types of muscles cells and using ATP as a fuel of
energy. Also Ca2+ is vital in supplying the excitation-contraction coupling in me-
chanical production in all types of muscles [52]. The contractile proteins involved
in smooth muscles cells are different from striated and cardiac muscles. Smooth
muscle cells do not contain troponin and contractions are generated through the
calcium-activated phosphorylation and not by calcium binding to troponin like
other muscle types. In vascular smooth muscles, the length of the myosin fila-
ment is significantly longer compared to the ones in striated muscles (1.4 times
longer). Since the lengths of the cross-bridge are the same in both smooth and
striated muscles, the tension generated per filament by vascular smooth muscle
is about 40% higher. The cross-bridges in smooth muscles are parallel arranged
with equal spacing, therefore the force produced by the muscles is proportional to
the length of the myosin fibre [52]. Furthermore, force in smooth muscles can be
retained when [ Ca2+ ]i and the level of phosphorylation are relatively low unlike
skeletal muscles [49]. The two intracellular processes leading to the production of
contractile force in myometrial smooth muscles is shown in figure 2.14. The first
pathway is initiated by the increase of the intracellular content of Ca2+ through
mainly the L-type Ca2+ channel, [ Ca2+ ]i then bind with calmodulin activating
the MLCK process. It further initiates the phosphorylation and cross-bridge cy-
cling causing mechanical contractions [36]. Ca2+ release from the SR through IP3
and ryanodine receptors is the second pathway causing contraction. However, ev-
idence obtained from various species has suggested that little is contributed from
these receptors [135–137].
2.3.1 Kinetic cross-bridge cycling model in smooth mus-
cles
There are various mathematical models developed for different types of smooth
muscles to describe mechanisms and stages leading to force production. Peter-
son developed a simple model of smooth muscle myosin phosphorylation and
dephosphorylation [138]. Kato and Ogasawara further improved the model and
94
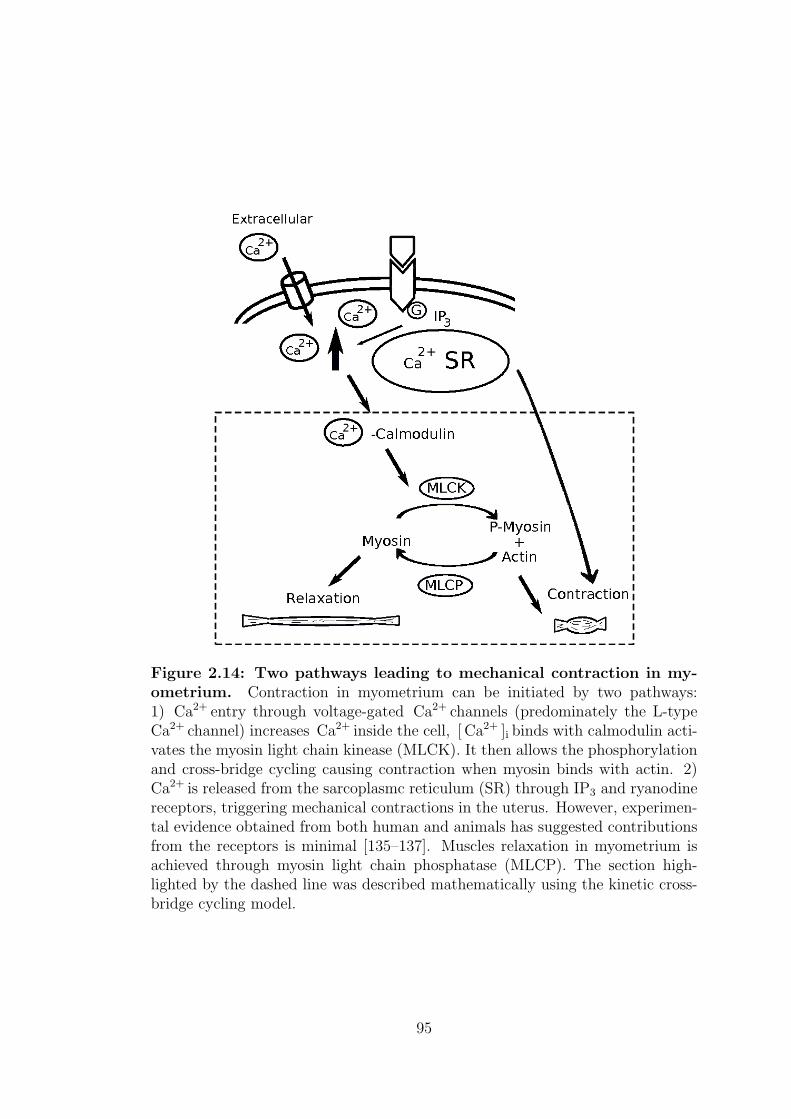
Figure 2.14: Two pathways leading to mechanical contraction in my-ometrium. Contraction in myometrium can be initiated by two pathways:1) Ca2+ entry through voltage-gated Ca2+ channels (predominately the L-typeCa2+ channel) increases Ca2+ inside the cell, [ Ca2+ ]i binds with calmodulin acti-vates the myosin light chain kinease (MLCK). It then allows the phosphorylationand cross-bridge cycling causing contraction when myosin binds with actin. 2)Ca2+ is released from the sarcoplasmc reticulum (SR) through IP3 and ryanodinereceptors, triggering mechanical contractions in the uterus. However, experimen-tal evidence obtained from both human and animals has suggested contributionsfrom the receptors is minimal [135–137]. Muscles relaxation in myometrium isachieved through myosin light chain phosphatase (MLCP). The section high-lighted by the dashed line was described mathematically using the kinetic cross-bridge cycling model.
95

construed a kinetic model for isometric contraction in general smooth muscle on
the basis of the myosin phosphorylation hypothesis [139]. Hai et al. proposed
a four-state latch-bridge hypothesis (commonly known as the Hai and Murphy
model) [140] and the formation of the myosin phosphorylation and latch-bridge is
illustrated in figure 2.15. This is the equivalent of the highlighted section shown
in figure 2.14.
Figure 2.15: Four-state kinetic model of cross-bridge cycling in smoothmuscle. The rise of Ca2+ inside the cell binds with calmodulin which activatesMLCK and in turn initiate the cross-bridge cycling process. The four statesare M: free cross-bridges, Mp: phosphorylated cross-bridges, AMp: attachedphosphorylated non-cycling cross-bridges and AM: attached dephosphorylatednon-cycling cross-bridges (as latch bridges), which only exist in smooth muscles[49, 141]. Each of the states are described by their rate constants, K1 whichequals to K6 are [ Ca2+ ]i dependent and describe the MLCK process, while K2
has the same value of K5 and represents the process of MLCP. K7 is the slowdetachment rate constant, this process does not change force generation capacitiesand therefore leads to relaxation.
The four-states describing the formation consists of free cross-bridges (M),
phosphorylated cross-bridges (Mp), attached phosphorylated non-cycling cross-
bridges (AMp) and attached dephosphorylated non-cycling cross-bridges (as latch
bridges (AM)), which only exist in smooth muscles [49]. Actin is bound to Mp
96
state and only this phosphorylated cross-bridges can bind to actin. Dephospho-
rylation is due to the action of MLCP, myosin light chain phosphatase. Both
cross-bridge cycle and phosphorylation/dephosphorylation are powered by the
hydrolysis of ATP. The transitions of each of the states are described by rate
constants; K1 has the same rate as K6 which represents the [ Ca2+ ]i -dependent
MLCK process, and K2 has the same rate as K5 which describes the process
of MLCP [142]. The rate constant K7 is known as slow detachment rate - this
process does not change the capacities of the force generation. The four kinetic
states are subjected to constraint: M + Mp + AMp+ AM = 1. The fraction of
phosphorylated myosin is described by the sum of Mp + AMp while the attached
cross-bridges or fraction stress are described by the sum of AMp + AM.
The Hai and Murphy model has been improved over the years by the same
research group and transformed as a multiple-state model [142–144]. But the
original Hai and Murphy model is still commonly used because of its simplic-
ity and it has also formed the basis of a few mathematical models in various
smooth muscles. This includes the cerebrovascular smooth muscle cell model de-
veloped by Yang et al. [49], the contraction model in the arterial wall by Bennet
et al. [145] and the 12-state MLCK/phosphatase control in the airway smooth
muscle model by Fajmut and Brumen [146]. Bursztyn et al. also constructed a
simple excitation-contraction myometrial cell model describing the intracellular
Ca2+ and ionic flux control leading to tension development.
In the presented myometrial cell model, formulations from Yang et al. were
used and modified to fit the myometrial data from experimental recordings. The
value of the rate constants and the equation describing the rate constant of the
phosphorylation process changing from M to Mp, K1 was obtained from the
Bursztyn et al. model [38] (based on the minimal model of the arterial wall by
Parthmios et al. [147]). K1 has the same value of rate constant changing from
AM to M, K6 as discussed. The unit of the rate constants were provided in s
and was converted to ms in the myometrial model. It was assumed that Ca2+ -
calmudolin-MLCK dependent is the only source of force activation mechanism
in the cell (other mechanisms include protein kinase C (PKC) also contribute
to force activation without changing the intracellular content of Ca2+ and were
therefore not included).
97
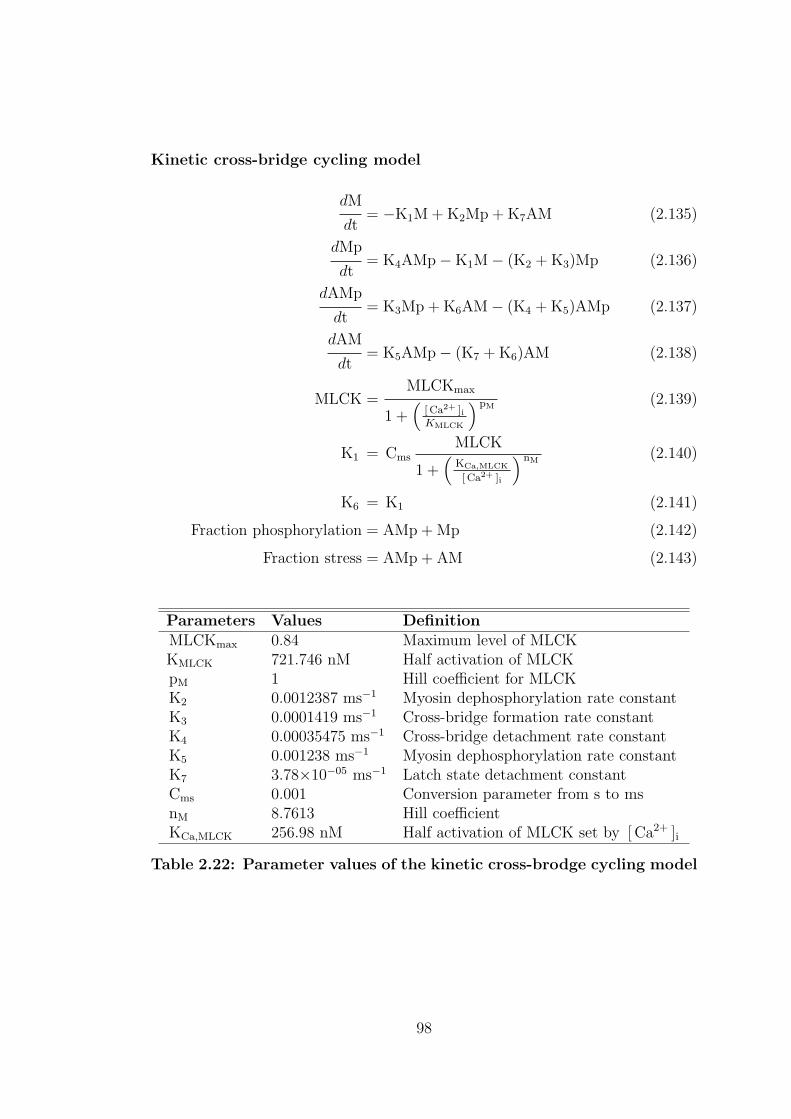
Kinetic cross-bridge cycling model
dM
dt= −K1M + K2Mp + K7AM (2.135)
dMp
dt= K4AMp−K1M− (K2 + K3)Mp (2.136)
dAMp
dt= K3Mp + K6AM− (K4 + K5)AMp (2.137)
dAM
dt= K5AMp− (K7 + K6)AM (2.138)
MLCK =MLCKmax
1 +(
[ Ca2+ ]iKMLCK
) pM(2.139)
K1 = CmsMLCK
1 +(
KCa,MLCK
[ Ca2+ ]i
) nM(2.140)
K6 = K1 (2.141)
Fraction phosphorylation = AMp + Mp (2.142)
Fraction stress = AMp + AM (2.143)
Parameters Values DefinitionMLCKmax 0.84 Maximum level of MLCKKMLCK 721.746 nM Half activation of MLCKpM 1 Hill coefficient for MLCKK2 0.0012387 ms−1 Myosin dephosphorylation rate constantK3 0.0001419 ms−1 Cross-bridge formation rate constantK4 0.00035475 ms−1 Cross-bridge detachment rate constantK5 0.001238 ms−1 Myosin dephosphorylation rate constantK7 3.78×10−05 ms−1 Latch state detachment constantCms 0.001 Conversion parameter from s to msnM 8.7613 Hill coefficientKCa,MLCK 256.98 nM Half activation of MLCK set by [ Ca2+ ]i
Table 2.22: Parameter values of the kinetic cross-brodge cycling model
98
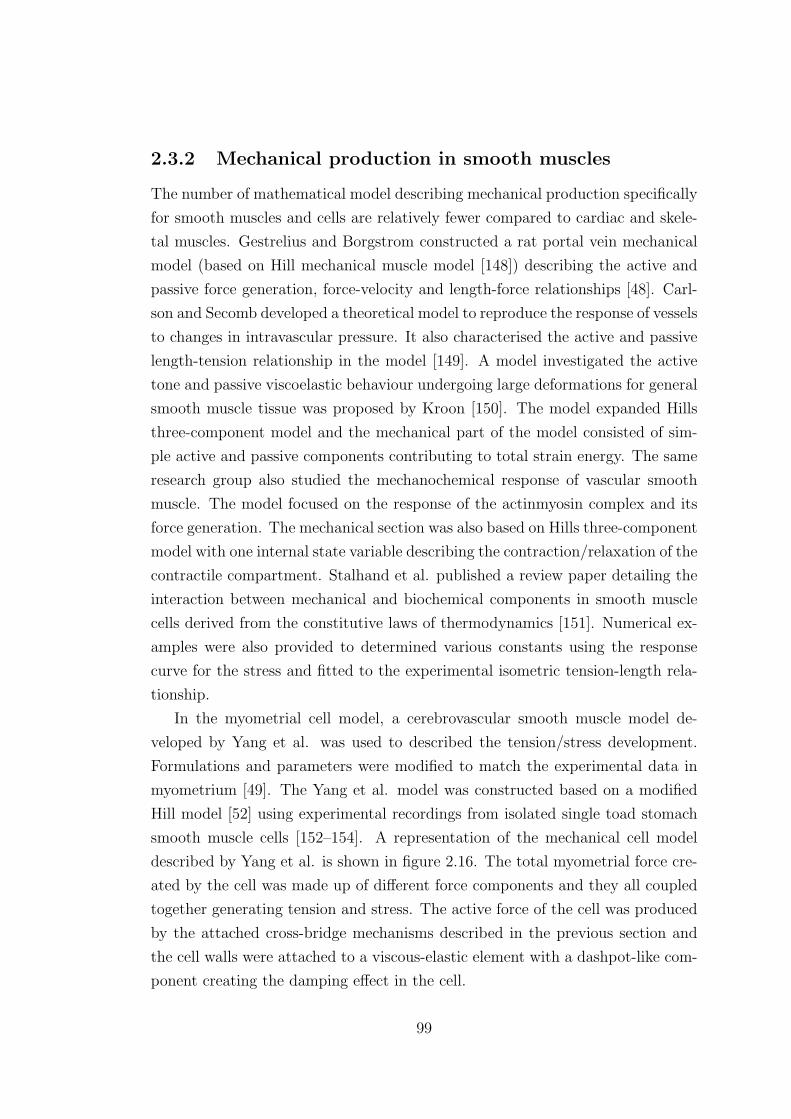
2.3.2 Mechanical production in smooth muscles
The number of mathematical model describing mechanical production specifically
for smooth muscles and cells are relatively fewer compared to cardiac and skele-
tal muscles. Gestrelius and Borgstrom constructed a rat portal vein mechanical
model (based on Hill mechanical muscle model [148]) describing the active and
passive force generation, force-velocity and length-force relationships [48]. Carl-
son and Secomb developed a theoretical model to reproduce the response of vessels
to changes in intravascular pressure. It also characterised the active and passive
length-tension relationship in the model [149]. A model investigated the active
tone and passive viscoelastic behaviour undergoing large deformations for general
smooth muscle tissue was proposed by Kroon [150]. The model expanded Hills
three-component model and the mechanical part of the model consisted of sim-
ple active and passive components contributing to total strain energy. The same
research group also studied the mechanochemical response of vascular smooth
muscle. The model focused on the response of the actinmyosin complex and its
force generation. The mechanical section was also based on Hills three-component
model with one internal state variable describing the contraction/relaxation of the
contractile compartment. Stalhand et al. published a review paper detailing the
interaction between mechanical and biochemical components in smooth muscle
cells derived from the constitutive laws of thermodynamics [151]. Numerical ex-
amples were also provided to determined various constants using the response
curve for the stress and fitted to the experimental isometric tension-length rela-
tionship.
In the myometrial cell model, a cerebrovascular smooth muscle model de-
veloped by Yang et al. was used to described the tension/stress development.
Formulations and parameters were modified to match the experimental data in
myometrium [49]. The Yang et al. model was constructed based on a modified
Hill model [52] using experimental recordings from isolated single toad stomach
smooth muscle cells [152–154]. A representation of the mechanical cell model
described by Yang et al. is shown in figure 2.16. The total myometrial force cre-
ated by the cell was made up of different force components and they all coupled
together generating tension and stress. The active force of the cell was produced
by the attached cross-bridge mechanisms described in the previous section and
the cell walls were attached to a viscous-elastic element with a dashpot-like com-
ponent creating the damping effect in the cell.
99
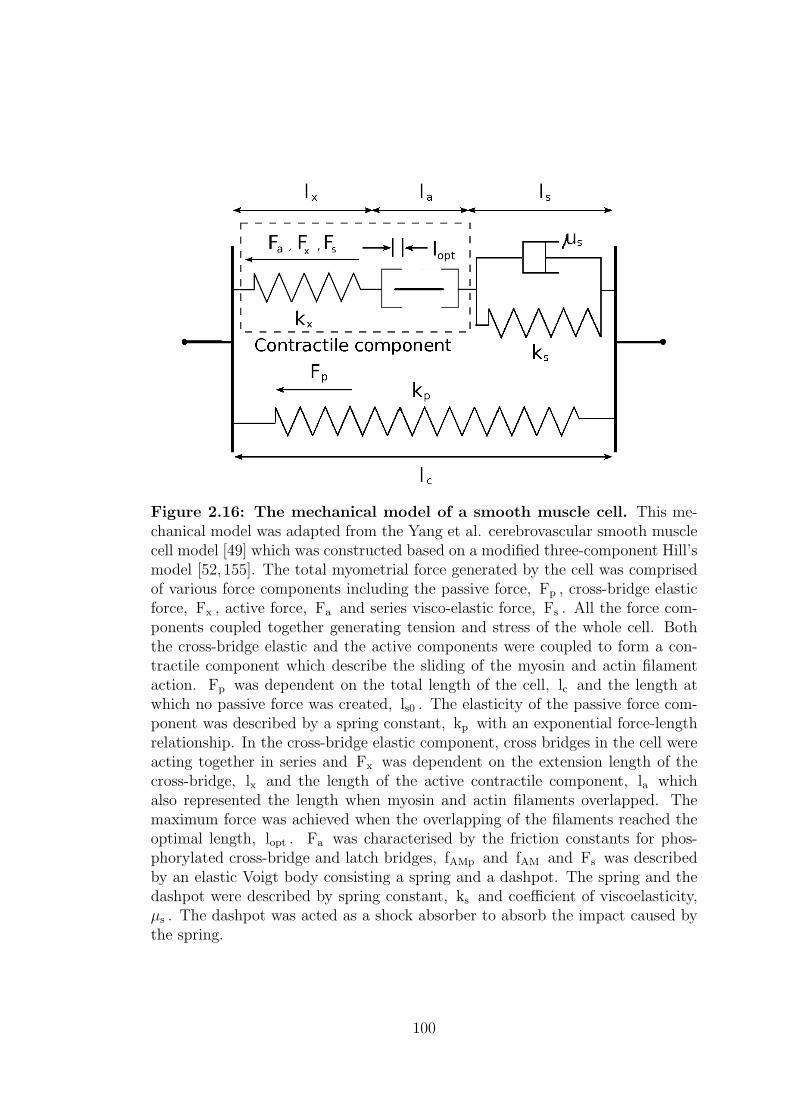
Figure 2.16: The mechanical model of a smooth muscle cell. This me-chanical model was adapted from the Yang et al. cerebrovascular smooth musclecell model [49] which was constructed based on a modified three-component Hill’smodel [52, 155]. The total myometrial force generated by the cell was comprisedof various force components including the passive force, Fp , cross-bridge elasticforce, Fx , active force, Fa and series visco-elastic force, Fs . All the force com-ponents coupled together generating tension and stress of the whole cell. Boththe cross-bridge elastic and the active components were coupled to form a con-tractile component which describe the sliding of the myosin and actin filamentaction. Fp was dependent on the total length of the cell, lc and the length atwhich no passive force was created, ls0 . The elasticity of the passive force com-ponent was described by a spring constant, kp with an exponential force-lengthrelationship. In the cross-bridge elastic component, cross bridges in the cell wereacting together in series and Fx was dependent on the extension length of thecross-bridge, lx and the length of the active contractile component, la whichalso represented the length when myosin and actin filaments overlapped. Themaximum force was achieved when the overlapping of the filaments reached theoptimal length, lopt . Fa was characterised by the friction constants for phos-phorylated cross-bridge and latch bridges, fAMp and fAM and Fs was describedby an elastic Voigt body consisting a spring and a dashpot. The spring and thedashpot were described by spring constant, ks and coefficient of viscoelasticity,µs . The dashpot was acted as a shock absorber to absorb the impact caused bythe spring.
100
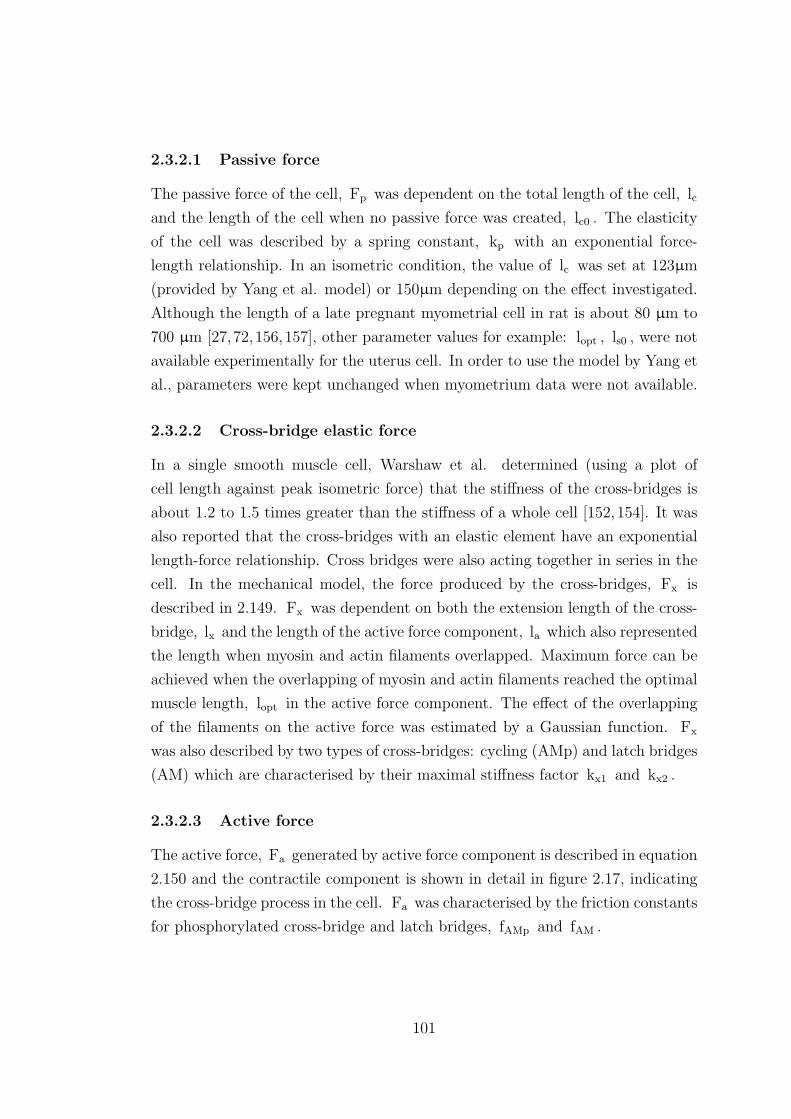
2.3.2.1 Passive force
The passive force of the cell, Fp was dependent on the total length of the cell, lc
and the length of the cell when no passive force was created, lc0 . The elasticity
of the cell was described by a spring constant, kp with an exponential force-
length relationship. In an isometric condition, the value of lc was set at 123µm
(provided by Yang et al. model) or 150µm depending on the effect investigated.
Although the length of a late pregnant myometrial cell in rat is about 80 µm to
700 µm [27,72,156,157], other parameter values for example: lopt , ls0 , were not
available experimentally for the uterus cell. In order to use the model by Yang et
al., parameters were kept unchanged when myometrium data were not available.
2.3.2.2 Cross-bridge elastic force
In a single smooth muscle cell, Warshaw et al. determined (using a plot of
cell length against peak isometric force) that the stiffness of the cross-bridges is
about 1.2 to 1.5 times greater than the stiffness of a whole cell [152,154]. It was
also reported that the cross-bridges with an elastic element have an exponential
length-force relationship. Cross bridges were also acting together in series in the
cell. In the mechanical model, the force produced by the cross-bridges, Fx is
described in 2.149. Fx was dependent on both the extension length of the cross-
bridge, lx and the length of the active force component, la which also represented
the length when myosin and actin filaments overlapped. Maximum force can be
achieved when the overlapping of myosin and actin filaments reached the optimal
muscle length, lopt in the active force component. The effect of the overlapping
of the filaments on the active force was estimated by a Gaussian function. Fx
was also described by two types of cross-bridges: cycling (AMp) and latch bridges
(AM) which are characterised by their maximal stiffness factor kx1 and kx2 .
2.3.2.3 Active force
The active force, Fa generated by active force component is described in equation
2.150 and the contractile component is shown in detail in figure 2.17, indicating
the cross-bridge process in the cell. Fa was characterised by the friction constants
for phosphorylated cross-bridge and latch bridges, fAMp and fAM .
101
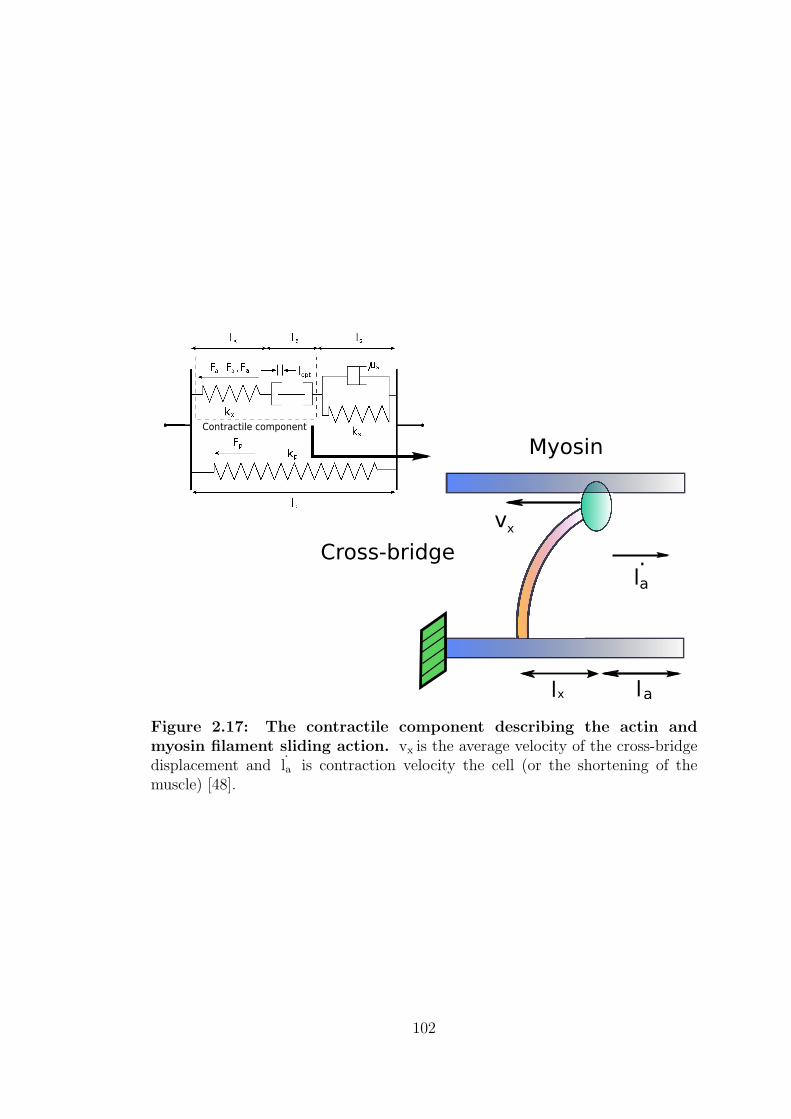
Contractile component
Cross-bridge
Myosin
l lx a
l
vx
.a
Figure 2.17: The contractile component describing the actin andmyosin filament sliding action. vx is the average velocity of the cross-bridgedisplacement and la is contraction velocity the cell (or the shortening of themuscle) [48].
102
2.3.2.4 Series viscoelastic force
The series viscoelastic force, Fs in the cell model was described by an elastic
Voigt body [52] which contained an elastic element with a spring connected in
parallel to a dashpot. The spring and the dashpot were characterised by spring
constant, ks and coefficient of viscoelasticity, µs . A linear spring in the body
could create deformation proportional to the load while the dashpot acted as a
shock absorber to compensate the effect. Both the spring and the dashpot have
the same displacement in the body and the total force produced by this body was
the sum of both the elastic and viscous force. The spring was expressed with an
exponential length-force relationship obtained from Warshaw et al. [154].
2.3.2.5 Total force produced by the cell
At any instant, the cross-bridge, active, and series viscoelastic force components
were all equal to each other (top section of the mechanical model in figure 2.16),
i.e. Fx = Fa = Fs . Therefore the total force, Ft produced by the whole cell
was Ft = Fa + Fp .
103
Mechanical production model
d ls
dt=
1
µs
( Fs − ks (exp( αs ( ls − ls0 )/ ls0 )− 1)) (2.144)
d la
dt=
Fa exp(β(( la − lopt )/ lopt )2)− ( fAMp AMp vx )
fAM AM + fAMp AMp(2.145)
d lx
dt=
( kx1 AMp + kx2 AM)( lc − la − ls )− ( fAMp AMp vx )
fAM AM + fAMp AMp(2.146)
lx = lc − la − ls (2.147)
Fp = kp (exp( αp ( lc − lc0 )/ lc0 )− 1 (2.148)
Fx = ( kx1 AMp + kx2 AM) lx exp(−β(( la − lopt )/ lopt )2) (2.149)
Fa = ( fAMp AM + fAMp AMp)d la
dt+ ( fAMp AMp vx ))×
exp(−β(( la − lopt )/ lopt )2) (2.150)
Fa = µs
d ls
dt+ ks (exp( αs ( ls − ls0 )/ ls0 )− 1) (2.151)
Fa = Fs = Fx (2.152)
Ft = Fa + Fp (2.153)
2.4 Solutions of the model equations
The model equations are numerically solved in C using Euler’s forward integration
scheme to solve the differential equations. All the simulations in the model were
produced with the time step of 0.01 ms. Voltage-clamp and current-clamp are
applied about 10 ms to 10 s after simulations begin to allow numerical values
of the equations to settle and reach steady-state (the pre-clamped time depends
on the effects investigated). The model also followed experimental conditions
such as ionic concentration and voltage protocol as closely as possible in order to
reproduce the experimental results.
The aim of the model was to provide better understanding of the function
of the uterus in the late pregnant cells. The single cell model reconstructed
the chemical, electrical and mechanical phenomena generated by the cells seen in
experiments. This will also provide an important foundation in further developing
104
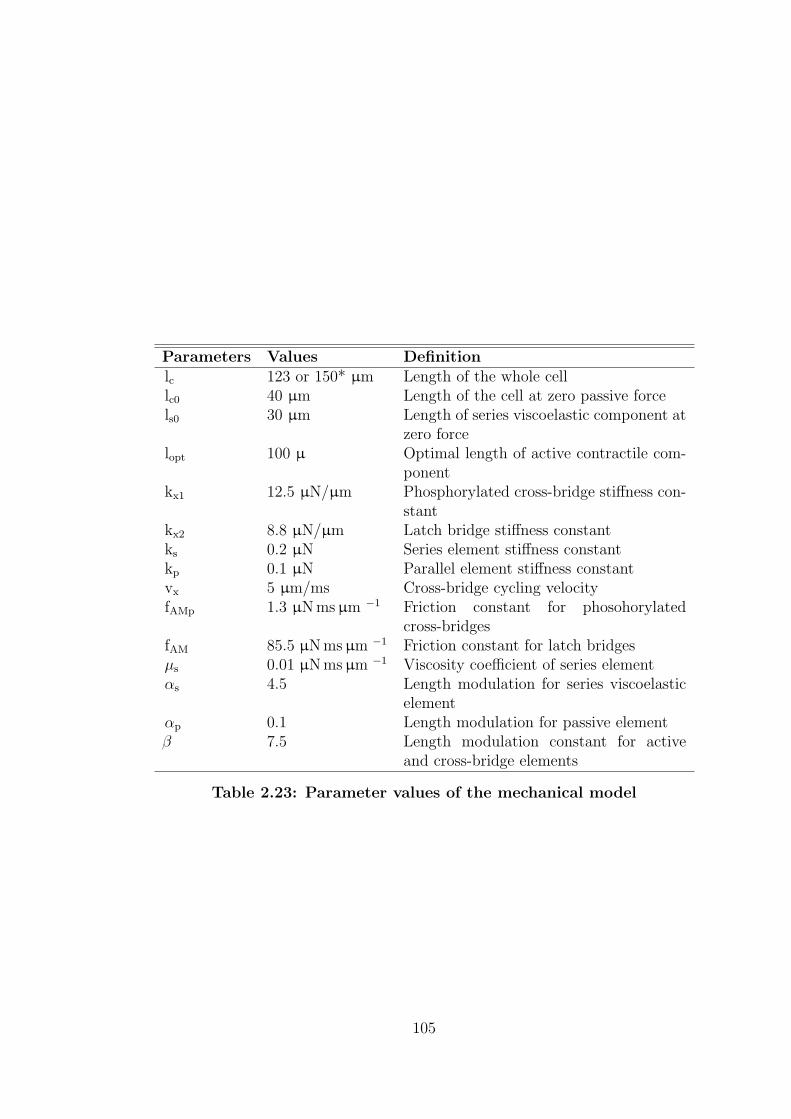
Parameters Values Definitionlc 123 or 150* µm Length of the whole celllc0 40 µm Length of the cell at zero passive forcels0 30 µm Length of series viscoelastic component at
zero forcelopt 100 µ Optimal length of active contractile com-
ponentkx1 12.5 µN/µm Phosphorylated cross-bridge stiffness con-
stantkx2 8.8 µN/µm Latch bridge stiffness constantks 0.2 µN Series element stiffness constantkp 0.1 µN Parallel element stiffness constantvx 5 µm/ms Cross-bridge cycling velocityfAMp 1.3 µN ms µm −1 Friction constant for phosohorylated
cross-bridgesfAM 85.5 µN ms µm −1 Friction constant for latch bridgesµs 0.01 µN ms µm −1 Viscosity coefficient of series elementαs 4.5 Length modulation for series viscoelastic
elementαp 0.1 Length modulation for passive elementβ 7.5 Length modulation constant for active
and cross-bridge elements
Table 2.23: Parameter values of the mechanical model
105

a realistic multi-dimensional uterus model for the human.
106
Chapter 3
Results I – Electrophysiological
response
The single cell model was validated by comparing simulated APs and I-V curves
with existing experimental data under control conditions. The model was also
tested by pacing rapidly to investigate the response of both [Ca2+] i and ICa− tot
against the experimentally available data. The model was further validated by
simulating the behaviour of estradiol effect during voltage or current clamp. The
behaviour of all the currents (both membrane and SR) during a 2-s current pulse
was examined. In order to have a deeper understanding on how individual cur-
rents behave and affect a single cell in terms of AP and whole cell membrane
current, application of the well-validated model was used to study the effect of
blocking the individual current during both current and voltage clamp. Fur-
thermore, the model’s ability to reproduce different shapes of AP seen in other
smooth muscle cell was investigated. This shows the model is versatile and can
potentially be adapted for different gestation of myometrial cells or even types of
smooth muscle cells.
3.1 Whole cell membrane current and AP in
control condition
Under control physiological conditions described in Okabe et al. [71], a current-
clamp of 2 s was applied to examine the AP (figure 3.1). The AP showed bursting
107
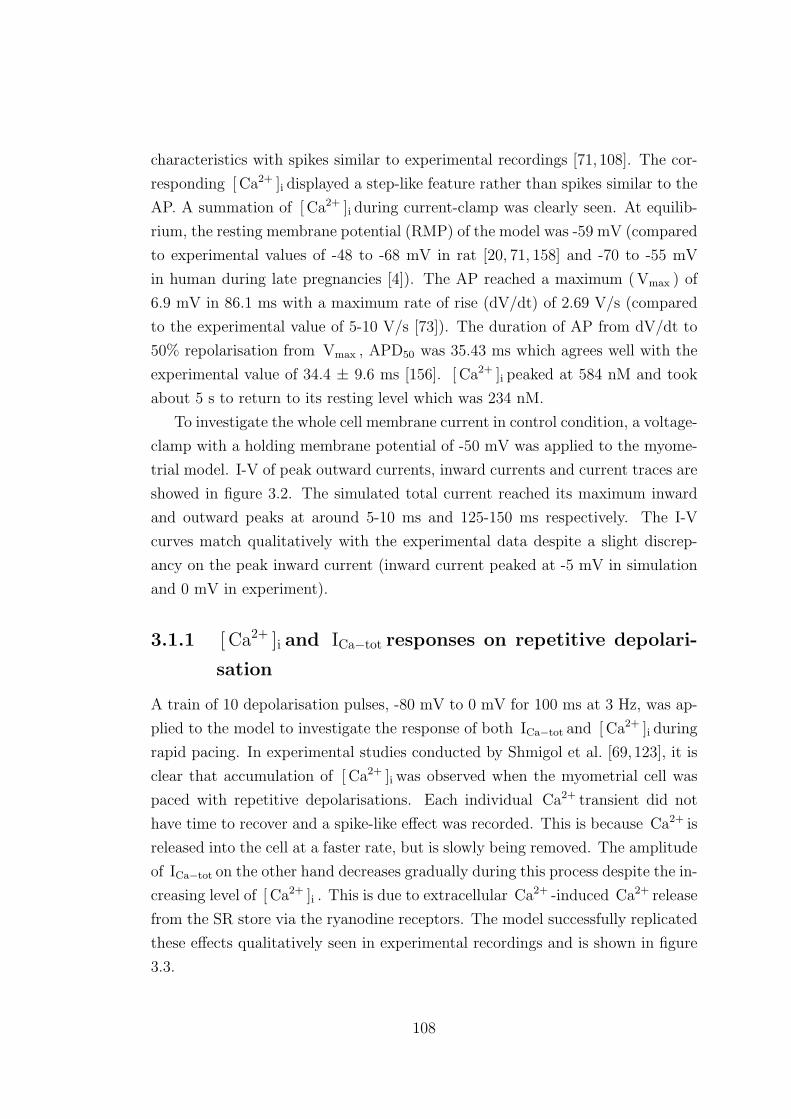
characteristics with spikes similar to experimental recordings [71, 108]. The cor-
responding [ Ca2+ ]i displayed a step-like feature rather than spikes similar to the
AP. A summation of [ Ca2+ ]i during current-clamp was clearly seen. At equilib-
rium, the resting membrane potential (RMP) of the model was -59 mV (compared
to experimental values of -48 to -68 mV in rat [20, 71, 158] and -70 to -55 mV
in human during late pregnancies [4]). The AP reached a maximum ( Vmax ) of
6.9 mV in 86.1 ms with a maximum rate of rise (dV/dt) of 2.69 V/s (compared
to the experimental value of 5-10 V/s [73]). The duration of AP from dV/dt to
50% repolarisation from Vmax , APD50 was 35.43 ms which agrees well with the
experimental value of 34.4 ± 9.6 ms [156]. [ Ca2+ ]i peaked at 584 nM and took
about 5 s to return to its resting level which was 234 nM.
To investigate the whole cell membrane current in control condition, a voltage-
clamp with a holding membrane potential of -50 mV was applied to the myome-
trial model. I-V of peak outward currents, inward currents and current traces are
showed in figure 3.2. The simulated total current reached its maximum inward
and outward peaks at around 5-10 ms and 125-150 ms respectively. The I-V
curves match qualitatively with the experimental data despite a slight discrep-
ancy on the peak inward current (inward current peaked at -5 mV in simulation
and 0 mV in experiment).
3.1.1 [ Ca2+ ]i and ICa−tot responses on repetitive depolari-
sation
A train of 10 depolarisation pulses, -80 mV to 0 mV for 100 ms at 3 Hz, was ap-
plied to the model to investigate the response of both ICa−tot and [ Ca2+ ]i during
rapid pacing. In experimental studies conducted by Shmigol et al. [69, 123], it is
clear that accumulation of [ Ca2+ ]i was observed when the myometrial cell was
paced with repetitive depolarisations. Each individual Ca2+ transient did not
have time to recover and a spike-like effect was recorded. This is because Ca2+ is
released into the cell at a faster rate, but is slowly being removed. The amplitude
of ICa−tot on the other hand decreases gradually during this process despite the in-
creasing level of [ Ca2+ ]i . This is due to extracellular Ca2+ -induced Ca2+ release
from the SR store via the ryanodine receptors. The model successfully replicated
these effects qualitatively seen in experimental recordings and is shown in figure
3.3.
108
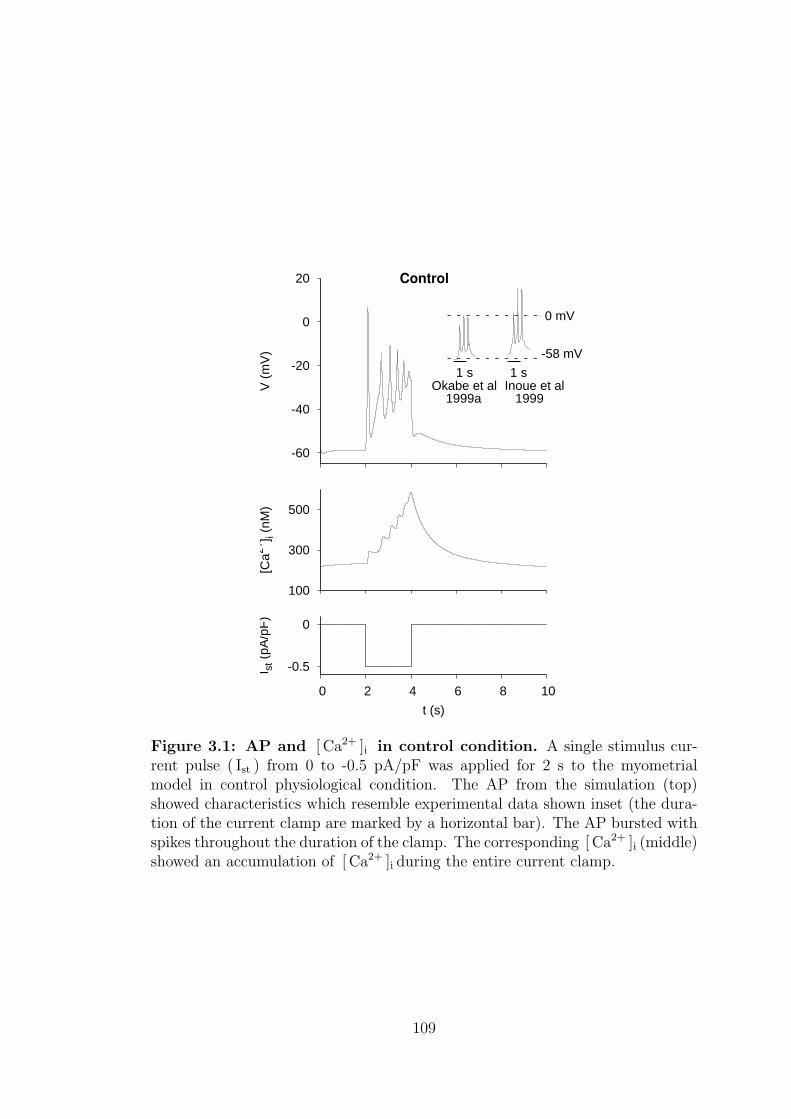
-0.5
0
0 2 4 6 8 10
I st (
pA/p
F)
t (s)
100
300
500
[Ca2+
] i (n
M)
-60
-40
-20
0
20V
(m
V)
Control
1 s 1 sOkabe et al 1999a
Inoue et al 1999
0 mV
-58 mV
Figure 3.1: AP and [ Ca2+ ]i in control condition. A single stimulus cur-rent pulse ( Ist ) from 0 to -0.5 pA/pF was applied for 2 s to the myometrialmodel in control physiological condition. The AP from the simulation (top)showed characteristics which resemble experimental data shown inset (the dura-tion of the current clamp are marked by a horizontal bar). The AP bursted withspikes throughout the duration of the clamp. The corresponding [ Ca2+ ]i (middle)showed an accumulation of [ Ca2+ ]i during the entire current clamp.
109
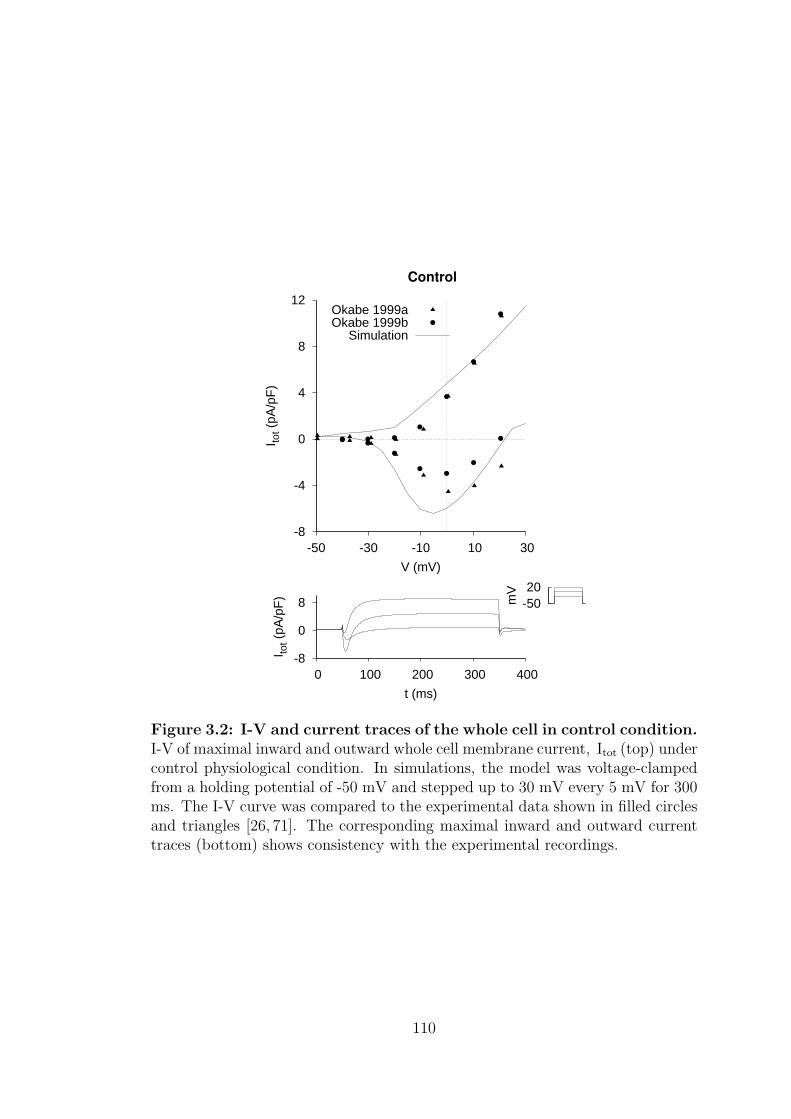
-8
-4
0
4
8
12
-50 -30 -10 10 30
I tot (
pA/p
F)
V (mV)
Control
Okabe 1999aOkabe 1999b
Simulation
-8
0
8
0 100 200 300 400
I tot (
pA/p
F)
t (ms)
-50 20
mV
Figure 3.2: I-V and current traces of the whole cell in control condition.I-V of maximal inward and outward whole cell membrane current, Itot (top) undercontrol physiological condition. In simulations, the model was voltage-clampedfrom a holding potential of -50 mV and stepped up to 30 mV every 5 mV for 300ms. The I-V curve was compared to the experimental data shown in filled circlesand triangles [26, 71]. The corresponding maximal inward and outward currenttraces (bottom) shows consistency with the experimental recordings.
110
100
300
500
700
[Ca2+
] i (n
M)
A
500 nM
0 nM
10 s
Shmigol 1998a
Shmigol 1998b
-12
-8
-4
0
I Ca-
tot (
pA/p
F)
-80 20
0 2 4 6 8 10 12 14
V (
mV
)
t (s)
0.3
0.4
0.5
0.6
0.7
0.8
0.9
1
0 2 4 6 8 10
Nor
mal
ised
I Ca-
tot
Pulse number
B
Exp ICaSim ICa
Figure 3.3: [ Ca2+ ]i and ICa−tot responses during repetitive depolarisa-tion. (A) Intracellular Ca2+ (top) and ICa−tot (middle) responses during 10 de-polarisation pulses from a holding potential of -80 mV to 0 mV for 100 ms a timebetween the successive pulse of 330 ms (bottom). [ Ca2+ ]i peaked at around 600nM and has shown the same accumulation of [ Ca2+ ]i during rapid pacing as seenin experimental results (insets). Note the difference in the [ Ca2+ ]i magnitude,although both sets of the data were obtained under the same experimental con-dition. The amplitude of ICa−tot gradually declined as [ Ca2+ ]i built up due toCICR from extracellular space. (B) Normalised ICa−tot against number of pulse,both experimental and simulation results show a general trend of gradual declinewith increasing pulse number ( ICa−tot was normalised to the value of the firstpulse).
111
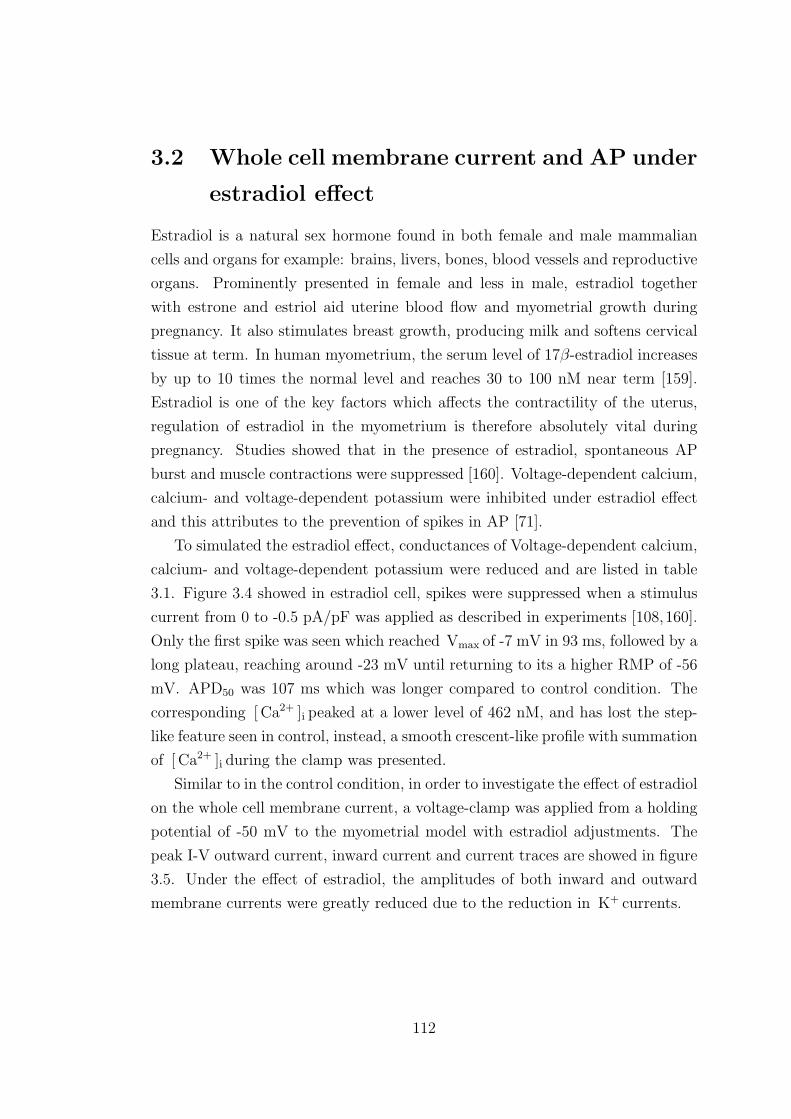
3.2 Whole cell membrane current and AP under
estradiol effect
Estradiol is a natural sex hormone found in both female and male mammalian
cells and organs for example: brains, livers, bones, blood vessels and reproductive
organs. Prominently presented in female and less in male, estradiol together
with estrone and estriol aid uterine blood flow and myometrial growth during
pregnancy. It also stimulates breast growth, producing milk and softens cervical
tissue at term. In human myometrium, the serum level of 17β-estradiol increases
by up to 10 times the normal level and reaches 30 to 100 nM near term [159].
Estradiol is one of the key factors which affects the contractility of the uterus,
regulation of estradiol in the myometrium is therefore absolutely vital during
pregnancy. Studies showed that in the presence of estradiol, spontaneous AP
burst and muscle contractions were suppressed [160]. Voltage-dependent calcium,
calcium- and voltage-dependent potassium were inhibited under estradiol effect
and this attributes to the prevention of spikes in AP [71].
To simulated the estradiol effect, conductances of Voltage-dependent calcium,
calcium- and voltage-dependent potassium were reduced and are listed in table
3.1. Figure 3.4 showed in estradiol cell, spikes were suppressed when a stimulus
current from 0 to -0.5 pA/pF was applied as described in experiments [108,160].
Only the first spike was seen which reached Vmax of -7 mV in 93 ms, followed by a
long plateau, reaching around -23 mV until returning to its a higher RMP of -56
mV. APD50 was 107 ms which was longer compared to control condition. The
corresponding [ Ca2+ ]i peaked at a lower level of 462 nM, and has lost the step-
like feature seen in control, instead, a smooth crescent-like profile with summation
of [ Ca2+ ]i during the clamp was presented.
Similar to in the control condition, in order to investigate the effect of estradiol
on the whole cell membrane current, a voltage-clamp was applied from a holding
potential of -50 mV to the myometrial model with estradiol adjustments. The
peak I-V outward current, inward current and current traces are showed in figure
3.5. Under the effect of estradiol, the amplitudes of both inward and outward
membrane currents were greatly reduced due to the reduction in K+ currents.
112
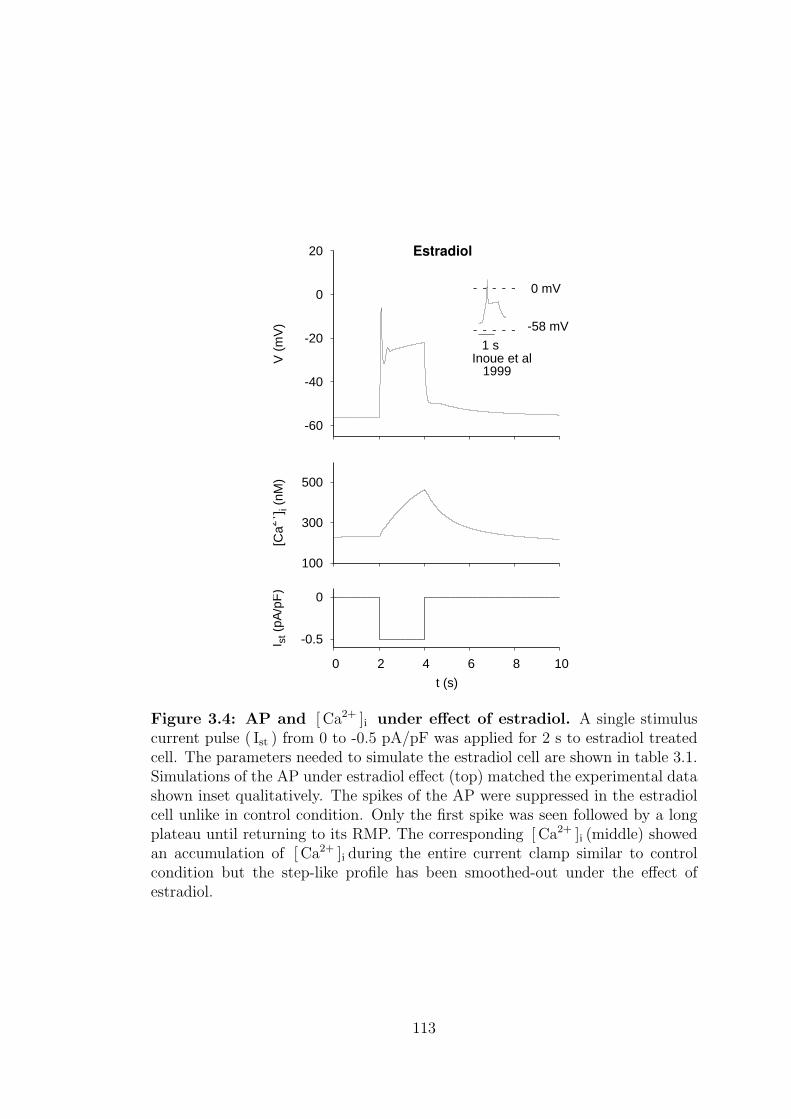
-0.5
0
0 2 4 6 8 10
I st (
pA/p
F)
t (s)
100
300
500
[Ca2+
] i (n
M)
-60
-40
-20
0
20
V (
mV
)
Estradiol
1 sInoue et al 1999
0 mV
-58 mV
Figure 3.4: AP and [ Ca2+ ]i under effect of estradiol. A single stimuluscurrent pulse ( Ist ) from 0 to -0.5 pA/pF was applied for 2 s to estradiol treatedcell. The parameters needed to simulate the estradiol cell are shown in table 3.1.Simulations of the AP under estradiol effect (top) matched the experimental datashown inset qualitatively. The spikes of the AP were suppressed in the estradiolcell unlike in control condition. Only the first spike was seen followed by a longplateau until returning to its RMP. The corresponding [ Ca2+ ]i (middle) showedan accumulation of [ Ca2+ ]i during the entire current clamp similar to controlcondition but the step-like profile has been smoothed-out under the effect ofestradiol.
113
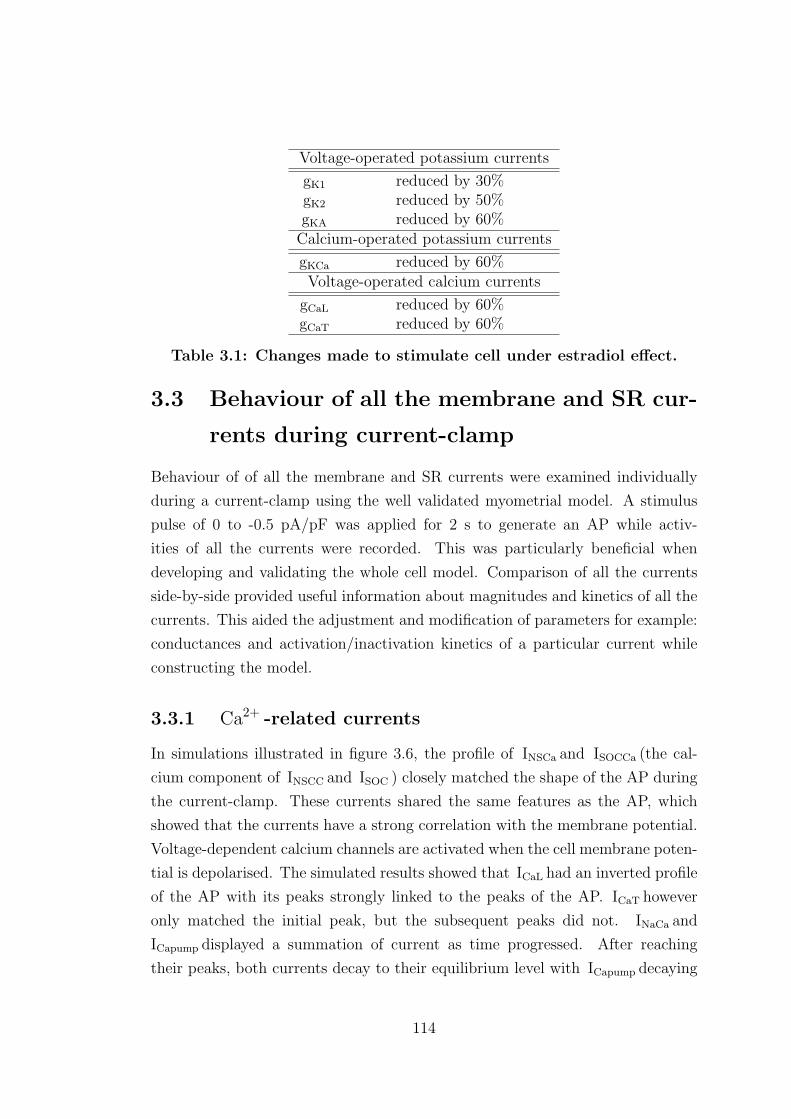
Voltage-operated potassium currents
gK1 reduced by 30%gK2 reduced by 50%gKA reduced by 60%Calcium-operated potassium currents
gKCa reduced by 60%Voltage-operated calcium currents
gCaL reduced by 60%gCaT reduced by 60%
Table 3.1: Changes made to stimulate cell under estradiol effect.
3.3 Behaviour of all the membrane and SR cur-
rents during current-clamp
Behaviour of of all the membrane and SR currents were examined individually
during a current-clamp using the well validated myometrial model. A stimulus
pulse of 0 to -0.5 pA/pF was applied for 2 s to generate an AP while activ-
ities of all the currents were recorded. This was particularly beneficial when
developing and validating the whole cell model. Comparison of all the currents
side-by-side provided useful information about magnitudes and kinetics of all the
currents. This aided the adjustment and modification of parameters for example:
conductances and activation/inactivation kinetics of a particular current while
constructing the model.
3.3.1 Ca2+ -related currents
In simulations illustrated in figure 3.6, the profile of INSCa and ISOCCa (the cal-
cium component of INSCC and ISOC ) closely matched the shape of the AP during
the current-clamp. These currents shared the same features as the AP, which
showed that the currents have a strong correlation with the membrane potential.
Voltage-dependent calcium channels are activated when the cell membrane poten-
tial is depolarised. The simulated results showed that ICaL had an inverted profile
of the AP with its peaks strongly linked to the peaks of the AP. ICaT however
only matched the initial peak, but the subsequent peaks did not. INaCa and
ICapump displayed a summation of current as time progressed. After reaching
their peaks, both currents decay to their equilibrium level with ICapump decaying
114
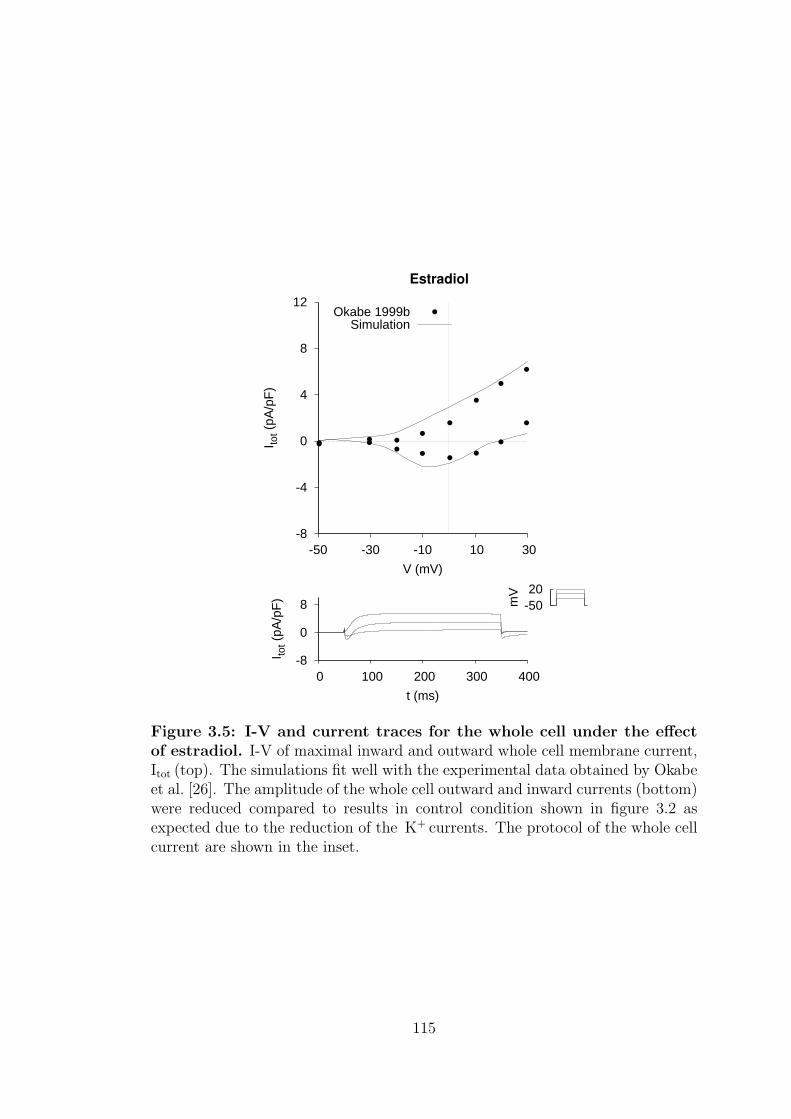
-8
-4
0
4
8
12
-50 -30 -10 10 30
I tot (
pA/p
F)
V (mV)
Estradiol
Okabe 1999bSimulation
-8
0
8
0 100 200 300 400
I tot (
pA/p
F)
t (ms)
-50 20
mV
Figure 3.5: I-V and current traces for the whole cell under the effectof estradiol. I-V of maximal inward and outward whole cell membrane current,Itot (top). The simulations fit well with the experimental data obtained by Okabeet al. [26]. The amplitude of the whole cell outward and inward currents (bottom)were reduced compared to results in control condition shown in figure 3.2 asexpected due to the reduction of the K+ currents. The protocol of the whole cellcurrent are shown in the inset.
115
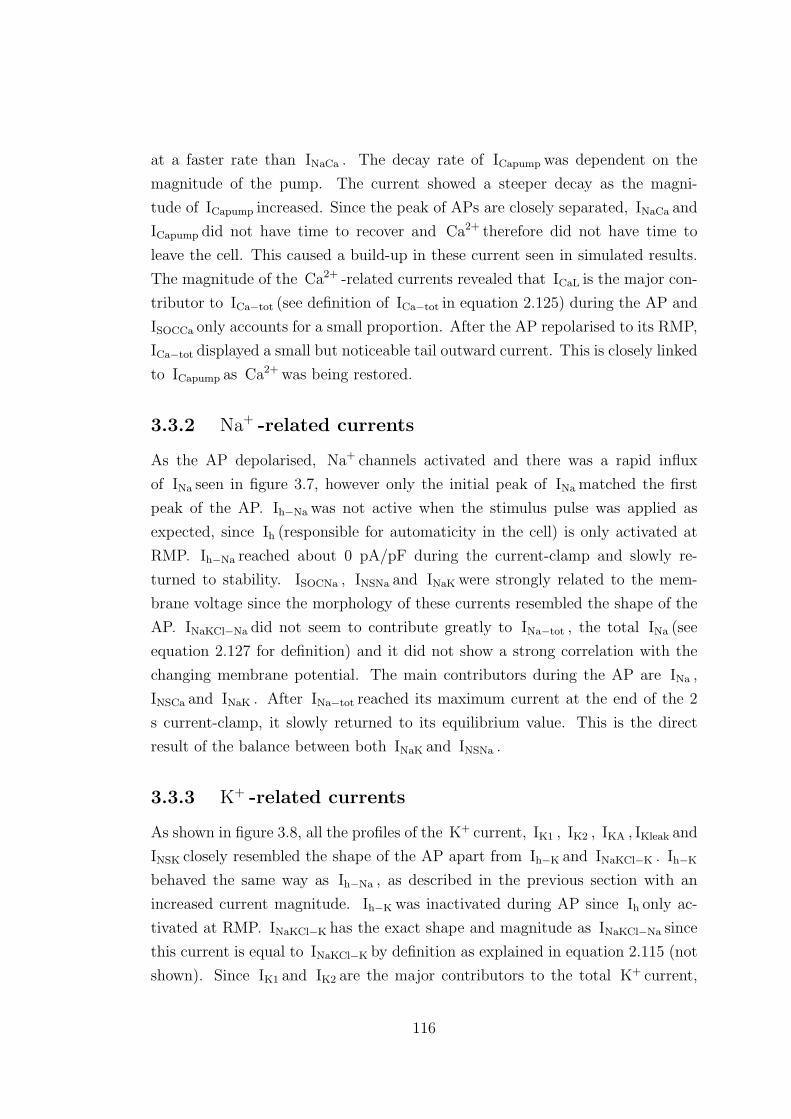
at a faster rate than INaCa . The decay rate of ICapump was dependent on the
magnitude of the pump. The current showed a steeper decay as the magni-
tude of ICapump increased. Since the peak of APs are closely separated, INaCa and
ICapump did not have time to recover and Ca2+ therefore did not have time to
leave the cell. This caused a build-up in these current seen in simulated results.
The magnitude of the Ca2+ -related currents revealed that ICaL is the major con-
tributor to ICa−tot (see definition of ICa−tot in equation 2.125) during the AP and
ISOCCa only accounts for a small proportion. After the AP repolarised to its RMP,
ICa−tot displayed a small but noticeable tail outward current. This is closely linked
to ICapump as Ca2+ was being restored.
3.3.2 Na+ -related currents
As the AP depolarised, Na+ channels activated and there was a rapid influx
of INa seen in figure 3.7, however only the initial peak of INa matched the first
peak of the AP. Ih−Na was not active when the stimulus pulse was applied as
expected, since Ih (responsible for automaticity in the cell) is only activated at
RMP. Ih−Na reached about 0 pA/pF during the current-clamp and slowly re-
turned to stability. ISOCNa , INSNa and INaK were strongly related to the mem-
brane voltage since the morphology of these currents resembled the shape of the
AP. INaKCl−Na did not seem to contribute greatly to INa−tot , the total INa (see
equation 2.127 for definition) and it did not show a strong correlation with the
changing membrane potential. The main contributors during the AP are INa ,
INSCa and INaK . After INa−tot reached its maximum current at the end of the 2
s current-clamp, it slowly returned to its equilibrium value. This is the direct
result of the balance between both INaK and INSNa .
3.3.3 K+ -related currents
As shown in figure 3.8, all the profiles of the K+ current, IK1 , IK2 , IKA , IKleak and
INSK closely resembled the shape of the AP apart from Ih−K and INaKCl−K . Ih−K
behaved the same way as Ih−Na , as described in the previous section with an
increased current magnitude. Ih−K was inactivated during AP since Ih only ac-
tivated at RMP. INaKCl−K has the exact shape and magnitude as INaKCl−Na since
this current is equal to INaKCl−K by definition as explained in equation 2.115 (not
shown). Since IK1 and IK2 are the major contributors to the total K+ current,
116
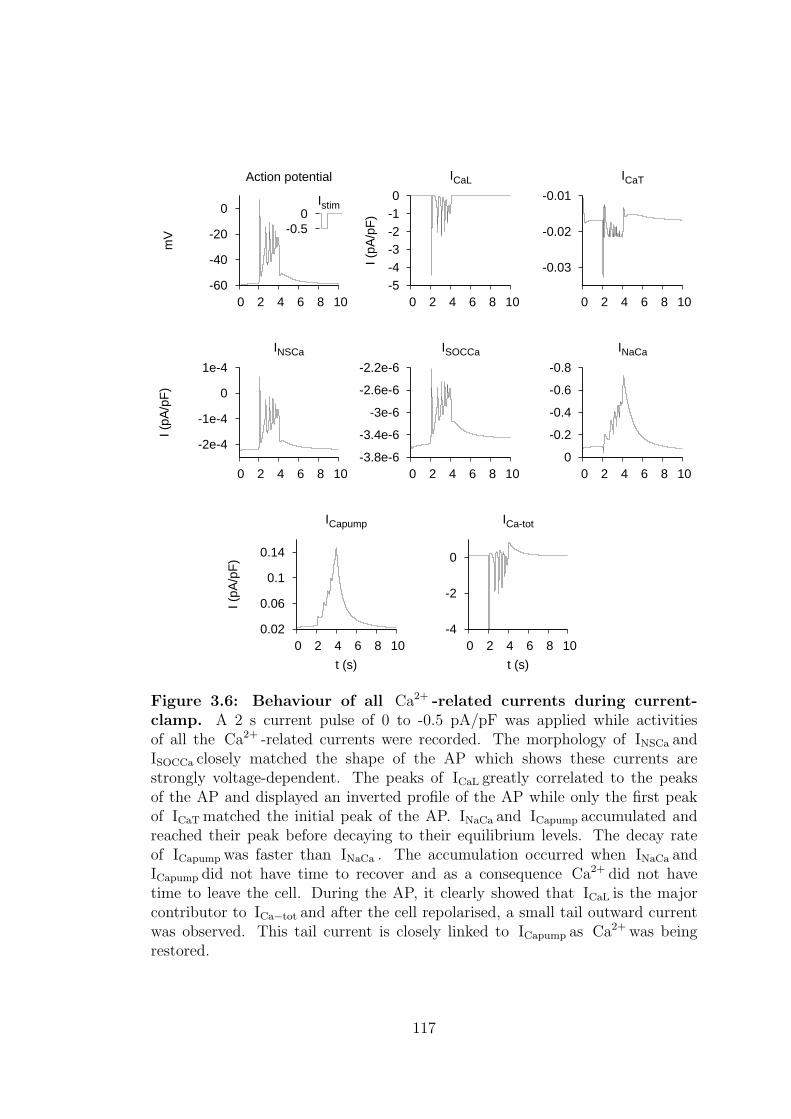
0.02
0.06
0.1
0.14
0 2 4 6 8 10
I (pA
/pF
)
t (s)
ICapump
-4
-2
0
0 2 4 6 8 10
t (s)
ICa-tot
-2e-4
-1e-4
0
1e-4
0 2 4 6 8 10
I (pA
/pF
)
INSCa
-3.8e-6
-3.4e-6
-3e-6
-2.6e-6
-2.2e-6
0 2 4 6 8 10
ISOCCa
-0.8
-0.6
-0.4
-0.2
0 0 2 4 6 8 10
INaCa
-5-4-3-2-1 0
0 2 4 6 8 10
I (pA
/pF
)
ICaL
-0.03
-0.02
-0.01
0 2 4 6 8 10
ICaT
-60
-40
-20
0
0 2 4 6 8 10
mV
Action potential
-0.5 0
Istim
Figure 3.6: Behaviour of all Ca2+ -related currents during current-clamp. A 2 s current pulse of 0 to -0.5 pA/pF was applied while activitiesof all the Ca2+ -related currents were recorded. The morphology of INSCa andISOCCa closely matched the shape of the AP which shows these currents arestrongly voltage-dependent. The peaks of ICaL greatly correlated to the peaksof the AP and displayed an inverted profile of the AP while only the first peakof ICaT matched the initial peak of the AP. INaCa and ICapump accumulated andreached their peak before decaying to their equilibrium levels. The decay rateof ICapump was faster than INaCa . The accumulation occurred when INaCa andICapump did not have time to recover and as a consequence Ca2+ did not havetime to leave the cell. During the AP, it clearly showed that ICaL is the majorcontributor to ICa−tot and after the cell repolarised, a small tail outward currentwas observed. This tail current is closely linked to ICapump as Ca2+ was beingrestored.
117
0.03
0.05
0.07
0.09
0.11
0 2 4 6 8 10
I (pA
/pF
)
t (s)
INaK
-1.2
-0.8
-0.4
0
0 2 4 6 8 10
t (s)
INa-tot
-7.5e-5
-6.5e-5
-5.5e-5
-4.5e-5
-3.5e-5
0 2 4 6 8 10
I (pA
/pF
)
ISOCNa
-0.25
-0.15
-0.05
0.05
0 2 4 6 8 10
INSNa
-1.19e-3
-1.17e-3
-1.15e-3
-1.13e-3
-1.11e-3
0 2 4 6 8 10
INaKCl-Na
-0.8
-0.6
-0.4
-0.2
0
0 2 4 6 8 10
I (pA
/pF
)
INa
-3.0e-3
-1.5e-3
0
1.5e-3
0 2 4 6 8 10
Ih-Na
-60
-40
-20
0
0 2 4 6 8 10
mV
Action potential
-0.5 0
Istim
Figure 3.7: Behaviour of all Na+ -related currents during current-clamp. Na+ channels are activated when cells depolarise. A rapid influx ofINa was observed when a stimulus pulse was first applied in simulation results.Ih−Na was not active when the stimulus pulse was applied since Ih is only activatedat RMP. ISOCNa , INSNa and INaK are strongly voltage-dependent as the profileof these currents resembled the shape and characteristic of the AP. ISOCNa andINaKCl−Na did not seem to contribute greatly to INa−tot as the magnitude of thesecurrents were relatively low. It did not show a strong correlation with the chang-ing membrane potential. The major contributing currents to INa−tot are INa ,INSCa and INaK . INa−tot returned to its equilibrium value after reaching its peakhas a direct link between the balance of both INaK and INSNa .
118
with the largest magnitudes, the morphology of IK−tot also closely resembled the
shape of the AP.
3.3.4 Other currents
The activities of ICl , ISOC , Ih and INSCC were examined and illustrated in figure
3.9. ICl , ISOC , Ih were all voltage-correlated but the profile of ICl was inverted.
As described in the previous section, Ih was only activated at RMP and was not
active during the current-clamp as expected.
3.4 Investigation of AP and total membrane cur-
rent while inhibiting individual currents
To investigate the AP and whole cell membrane current further, each individ-
ual membrane current was completely blocked in turn under both voltage- and
current-clamp. The results were then compared qualitatively to the simulated
control data under the same clamping condition. This gives a clear indication of
how the ionic current gives rise to certain phenomena observed in the myometrial
cell.
3.4.1 Inhibiting the inward currents
During a 2 s current clamp, elimination of the inward membrane currents, which is
shown in figure 3.10, indicated that the RMP were not affected. Blocking ICaL and
INa have a similar effect on AP, which include significantly reduced Vmax and gen-
eration of a plateau type AP with no spikes. Blocking ICaT reduced the number of
spikes but did not change Vmax , while blocking Ih has no visible effect. Blockage
of the inward currents has an insignificant effect on the total membrane current
apart from ICaL . The maximum inward peak displayed in control has completely
disappeared and only the maximum outward peak was presented.
The results show both ICaL and INa play an important role in cell excitability,
although ICaL is a major contributor to the total inward current. Studies sug-
gested that Na+ is responsible for repetitive firing of spikes with fast upstroke
generation and the propagation of the AP [8, 27, 63, 72, 85]. Inhibition of this
channel not only stopped the spike generation, it also rendered the propagation
119
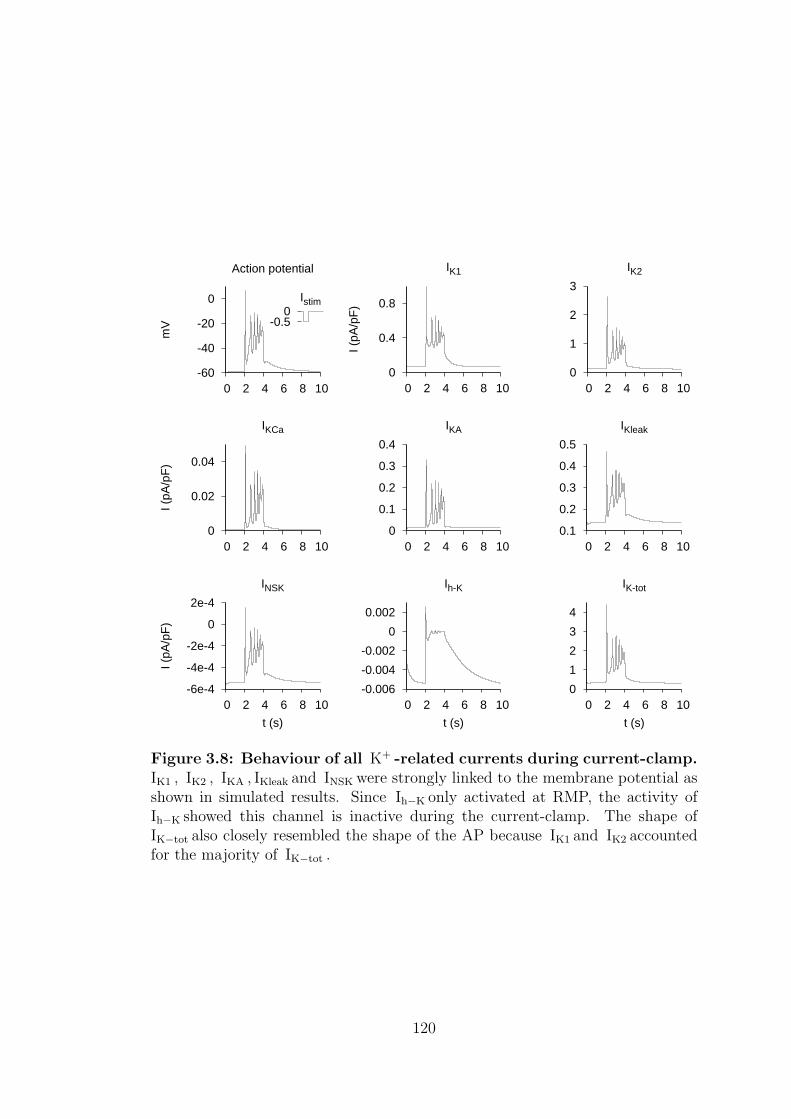
-6e-4
-4e-4
-2e-4
0
2e-4
0 2 4 6 8 10
I (pA
/pF
)
t (s)
INSK
-0.006
-0.004
-0.002
0
0.002
0 2 4 6 8 10
t (s)
Ih-K
0
1
2
3
4
0 2 4 6 8 10
t (s)
IK-tot
0
0.02
0.04
0 2 4 6 8 10
I (pA
/pF
)
IKCa
0
0.1
0.2
0.3
0.4
0 2 4 6 8 10
IKA
0.1
0.2
0.3
0.4
0.5
0 2 4 6 8 10
IKleak
0
0.4
0.8
0 2 4 6 8 10
I (pA
/pF
)
IK1
0
1
2
3
0 2 4 6 8 10
IK2
-60
-40
-20
0
0 2 4 6 8 10
mV
Action potential
-0.5 0
Istim
Figure 3.8: Behaviour of all K+ -related currents during current-clamp.IK1 , IK2 , IKA , IKleak and INSK were strongly linked to the membrane potential asshown in simulated results. Since Ih−K only activated at RMP, the activity ofIh−K showed this channel is inactive during the current-clamp. The shape ofIK−tot also closely resembled the shape of the AP because IK1 and IK2 accountedfor the majority of IK−tot .
120
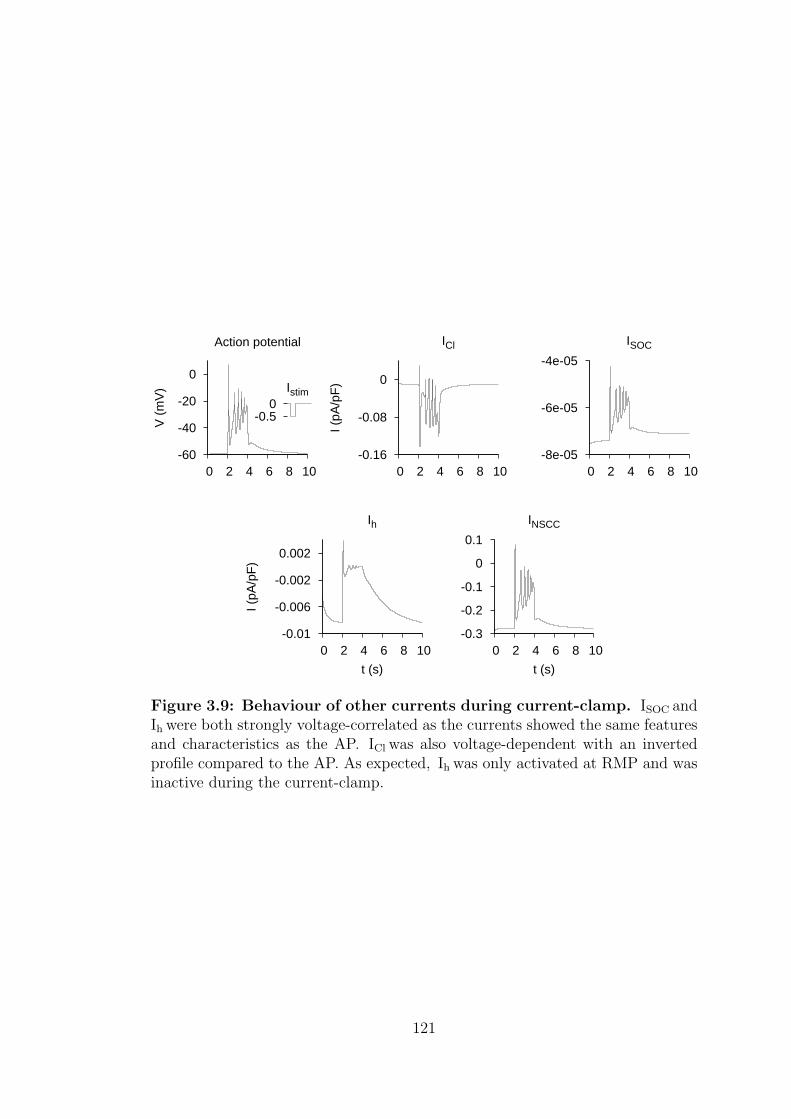
-0.01
-0.006
-0.002
0.002
0 2 4 6 8 10
I (pA
/pF
)
t (s)
Ih
-0.3
-0.2
-0.1
0
0.1
0 2 4 6 8 10
t (s)
INSCC
-0.16
-0.08
0
0 2 4 6 8 10
I (pA
/pF
)ICl
-8e-05
-6e-05
-4e-05
0 2 4 6 8 10
ISOC
-60
-40
-20
0
0 2 4 6 8 10
V (
mV
)
Action potential
-0.5 0
Istim
Figure 3.9: Behaviour of other currents during current-clamp. ISOC andIh were both strongly voltage-correlated as the currents showed the same featuresand characteristics as the AP. ICl was also voltage-dependent with an invertedprofile compared to the AP. As expected, Ih was only activated at RMP and wasinactive during the current-clamp.
121
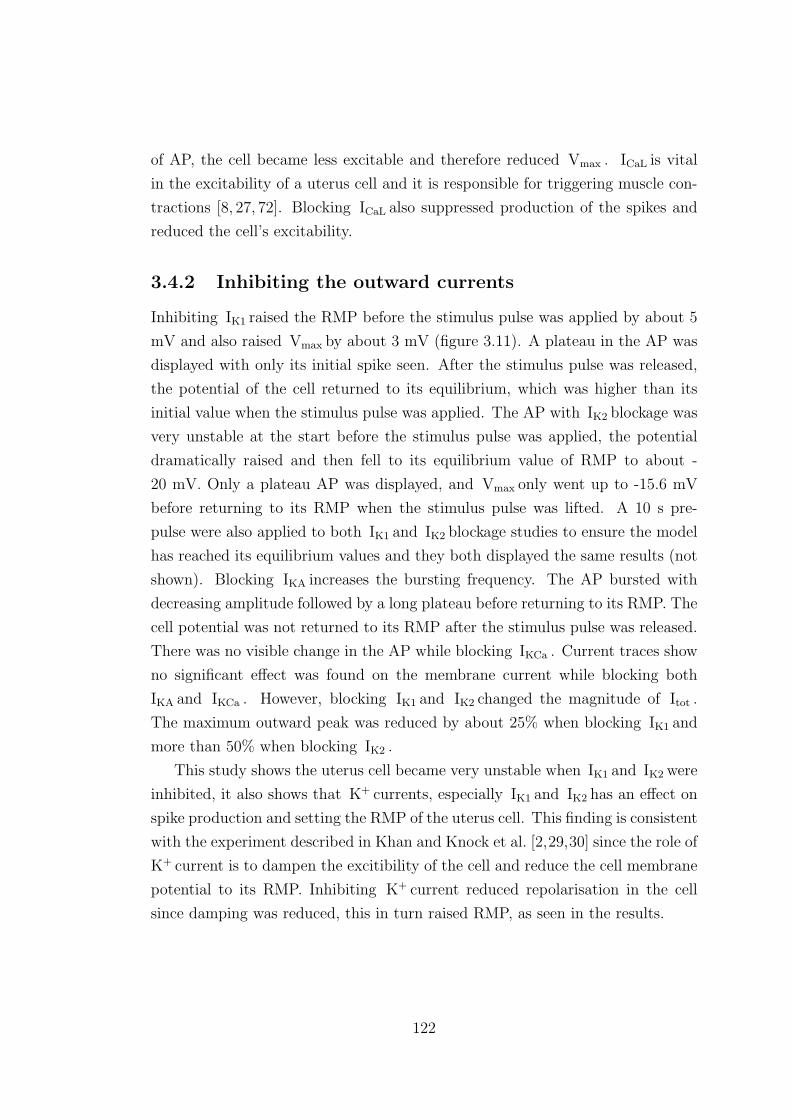
of AP, the cell became less excitable and therefore reduced Vmax . ICaL is vital
in the excitability of a uterus cell and it is responsible for triggering muscle con-
tractions [8, 27, 72]. Blocking ICaL also suppressed production of the spikes and
reduced the cell’s excitability.
3.4.2 Inhibiting the outward currents
Inhibiting IK1 raised the RMP before the stimulus pulse was applied by about 5
mV and also raised Vmax by about 3 mV (figure 3.11). A plateau in the AP was
displayed with only its initial spike seen. After the stimulus pulse was released,
the potential of the cell returned to its equilibrium, which was higher than its
initial value when the stimulus pulse was applied. The AP with IK2 blockage was
very unstable at the start before the stimulus pulse was applied, the potential
dramatically raised and then fell to its equilibrium value of RMP to about -
20 mV. Only a plateau AP was displayed, and Vmax only went up to -15.6 mV
before returning to its RMP when the stimulus pulse was lifted. A 10 s pre-
pulse were also applied to both IK1 and IK2 blockage studies to ensure the model
has reached its equilibrium values and they both displayed the same results (not
shown). Blocking IKA increases the bursting frequency. The AP bursted with
decreasing amplitude followed by a long plateau before returning to its RMP. The
cell potential was not returned to its RMP after the stimulus pulse was released.
There was no visible change in the AP while blocking IKCa . Current traces show
no significant effect was found on the membrane current while blocking both
IKA and IKCa . However, blocking IK1 and IK2 changed the magnitude of Itot .
The maximum outward peak was reduced by about 25% when blocking IK1 and
more than 50% when blocking IK2 .
This study shows the uterus cell became very unstable when IK1 and IK2 were
inhibited, it also shows that K+ currents, especially IK1 and IK2 has an effect on
spike production and setting the RMP of the uterus cell. This finding is consistent
with the experiment described in Khan and Knock et al. [2,29,30] since the role of
K+ current is to dampen the excitibility of the cell and reduce the cell membrane
potential to its RMP. Inhibiting K+ current reduced repolarisation in the cell
since damping was reduced, this in turn raised RMP, as seen in the results.
122
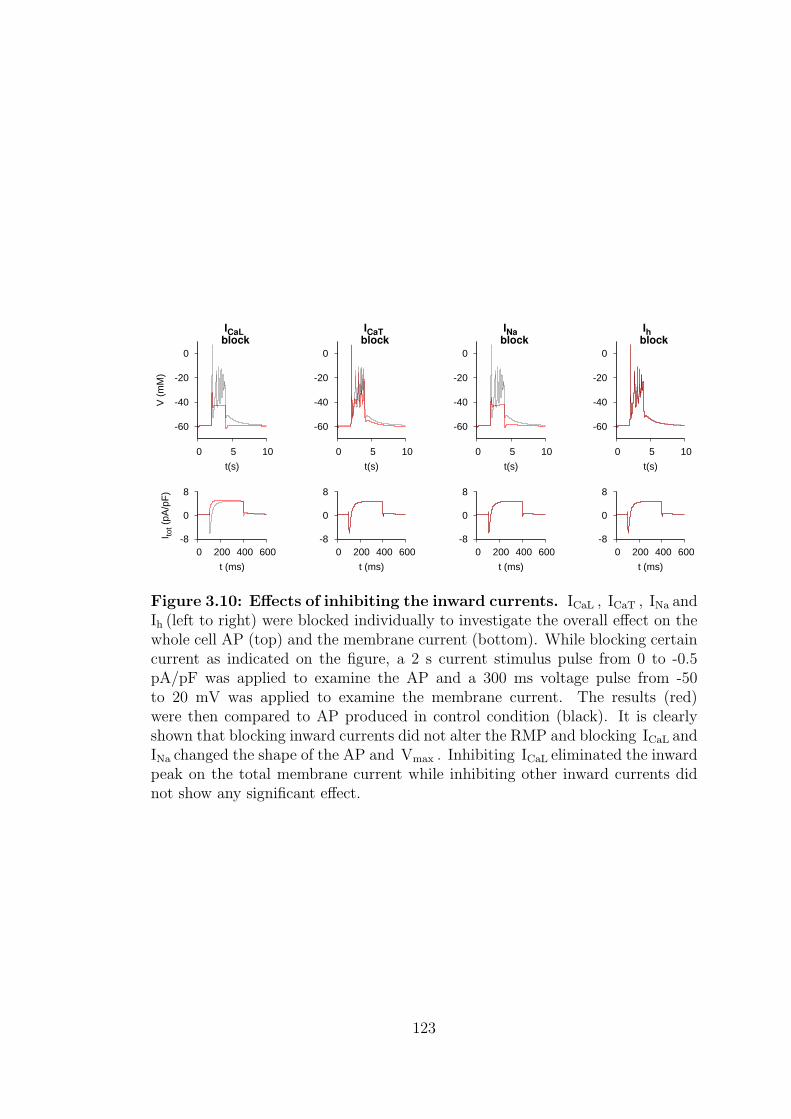
-60
-40
-20
0
0 5 10
V (
mM
)
t(s)
ICaL
block
-60
-40
-20
0
0 5 10
t(s)
ICaT
block
-60
-40
-20
0
0 5 10
t(s)
INa
block
-60
-40
-20
0
0 5 10
t(s)
Ih
block
-8
0
8
0 200 400 600
I tot (
pA/p
F)
t (ms)
-8
0
8
0 200 400 600
t (ms)
-8
0
8
0 200 400 600
t (ms)
-8
0
8
0 200 400 600
t (ms)
Figure 3.10: Effects of inhibiting the inward currents. ICaL , ICaT , INa andIh (left to right) were blocked individually to investigate the overall effect on thewhole cell AP (top) and the membrane current (bottom). While blocking certaincurrent as indicated on the figure, a 2 s current stimulus pulse from 0 to -0.5pA/pF was applied to examine the AP and a 300 ms voltage pulse from -50to 20 mV was applied to examine the membrane current. The results (red)were then compared to AP produced in control condition (black). It is clearlyshown that blocking inward currents did not alter the RMP and blocking ICaL andINa changed the shape of the AP and Vmax . Inhibiting ICaL eliminated the inwardpeak on the total membrane current while inhibiting other inward currents didnot show any significant effect.
123
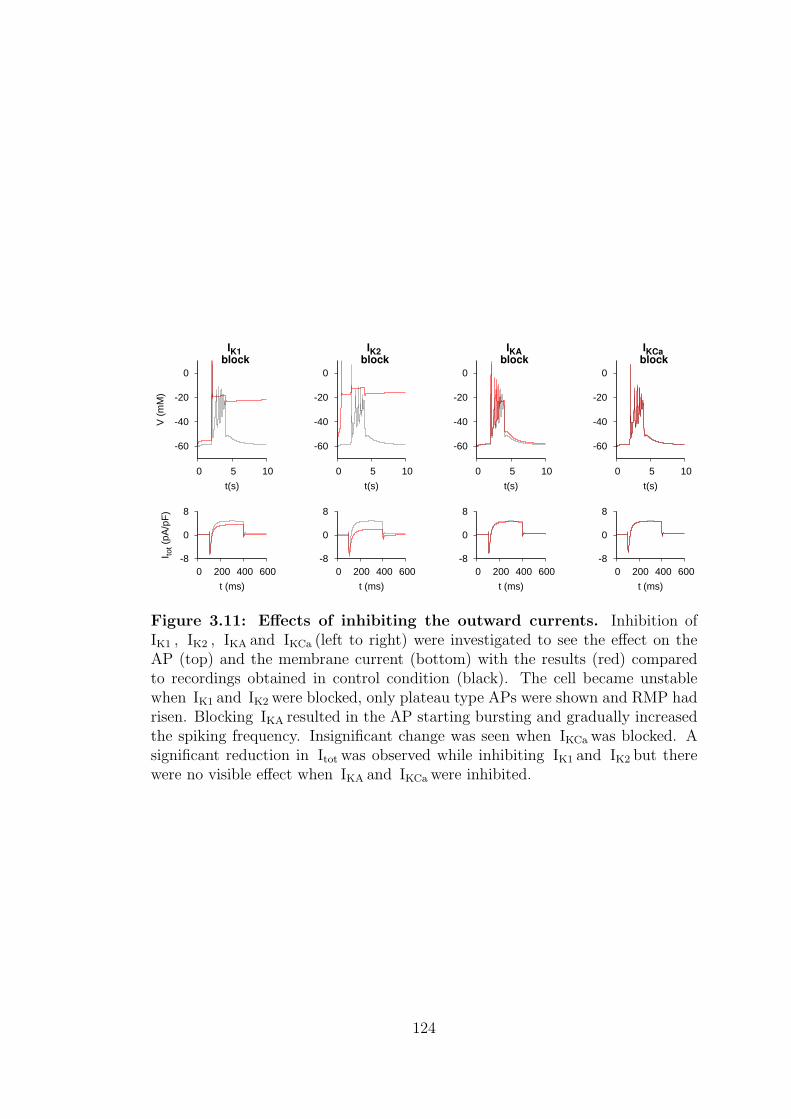
-60
-40
-20
0
0 5 10
V (
mM
)
t(s)
IK1
block
-60
-40
-20
0
0 5 10
t(s)
IK2
block
-60
-40
-20
0
0 5 10
t(s)
IKA
block
-60
-40
-20
0
0 5 10
t(s)
IKCa
block
-8
0
8
0 200 400 600
I tot (
pA/p
F)
t (ms)
-8
0
8
0 200 400 600
t (ms)
-8
0
8
0 200 400 600
t (ms)
-8
0
8
0 200 400 600
t (ms)
Figure 3.11: Effects of inhibiting the outward currents. Inhibition ofIK1 , IK2 , IKA and IKCa (left to right) were investigated to see the effect on theAP (top) and the membrane current (bottom) with the results (red) comparedto recordings obtained in control condition (black). The cell became unstablewhen IK1 and IK2 were blocked, only plateau type APs were shown and RMP hadrisen. Blocking IKA resulted in the AP starting bursting and gradually increasedthe spiking frequency. Insignificant change was seen when IKCa was blocked. Asignificant reduction in Itot was observed while inhibiting IK1 and IK2 but therewere no visible effect when IKA and IKCa were inhibited.
124
3.4.3 Inhibiting the other currents
Results illustrated in figure 3.12 showed that a complete blockage of ICl still
produced bursting type APs with reduced spiking frequency despite the second
spike being suppressed. The RMP remained the same, but the magnitude at the
foot of the AP was reduced. Inhibiting INSCC drastically reduced the RMP to
around -75 mV, while Vmax stayed unchanged. The shape of the AP was also
changed, with only the first spike seen. The cell depolarised and repolarised and
the cell potential was slowly building up with time, creating a slow-rising curve
rather than a flat plateau. The AP with INaK block displayed a slight increase
with the spiking frequency and a slight rise in the magnitude at the foot of the
AP. Blocking INSCC slightly reduced the RMP and Vmax . The cell was heavily
damped and spikes gradually died down to form a plateau around -40 mV. In
terms of total membrane current, only blockage of ICl has a little effect on the
total current (increase slightly after the stimulus pulse was applied), inhibiting
other currents, INSCC , INaK and INaCa has no visible change.
Experimental studies conducted by Jones et al. [32] showed that when ICl
channel blocker drugs was applied to the myometrial cell, the frequency of spon-
taneous contractions significantly reduced. Simulation results showed that only
a slight reduction of spike frequency was observed. Miyoshi et al. [33] suggested
that INSCC has an important function in reconstructing the pace-making activity
and regulating the contractility in myometrium. It is clearly shown in simula-
tions, that inhibiting this current completely changed the shape and contractility
of the cell.
3.5 Different types of AP
Depending on the gestation and physiological conditions, different shapes of AP
are also seen experimentally in mammalian myometrial cells. These different
shapes of AP can be classified into six groups: 1) Bursting type where each spike
is fully repolarised and returned to its RMP, 2) Plateau type with orderly bursting
spikes, 3) Disorderly bursting-plateau type, 4) Disorderly plateau-bursting type,
5) Plateau type and 6) Long ADP plateau type.
The model was used to imitate these different shapes of AP by changing
selected parameters in the model (e.g. Increasing or decreasing the size of the
certain currents). The results are shown in figure 3.13 and the precise change of
125
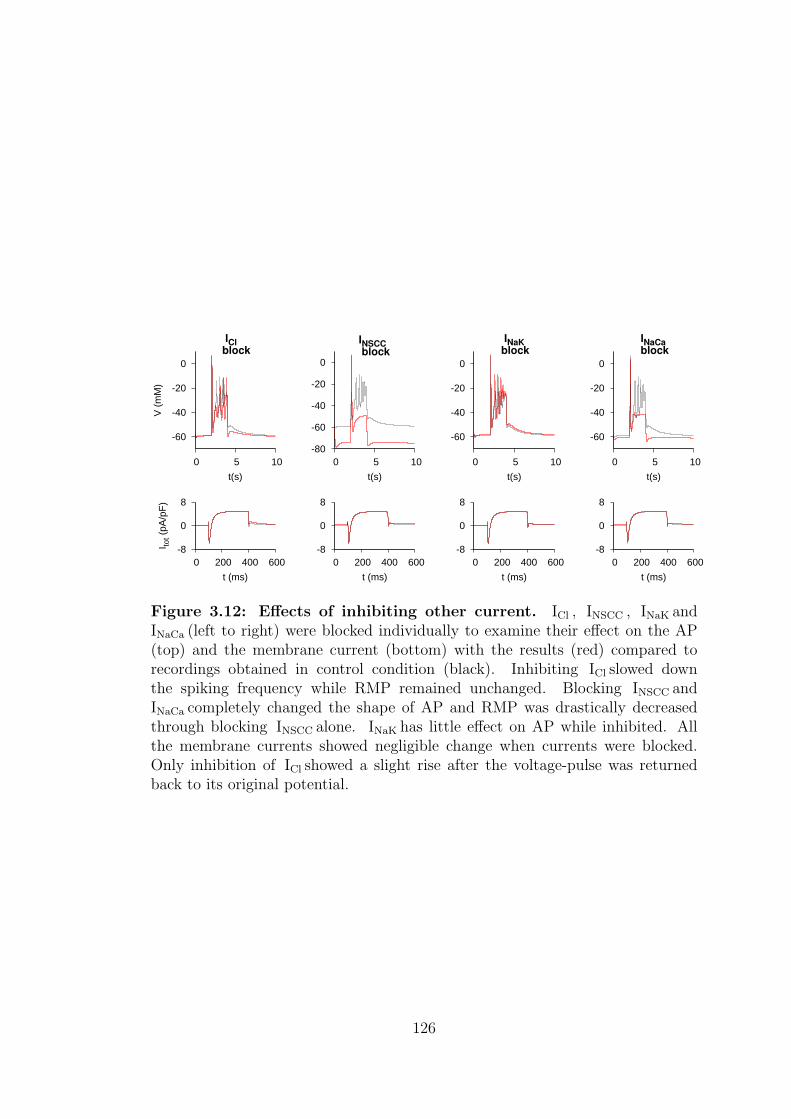
-60
-40
-20
0
0 5 10
V (
mM
)
t(s)
ICl
block
-80
-60
-40
-20
0
0 5 10
t(s)
INSCC
block
-60
-40
-20
0
0 5 10
t(s)
INaK
block
-60
-40
-20
0
0 5 10
t(s)
INaCa
block
-8
0
8
0 200 400 600
I tot (
pA/p
F)
t (ms)
-8
0
8
0 200 400 600
t (ms)
-8
0
8
0 200 400 600
t (ms)
-8
0
8
0 200 400 600
t (ms)
Figure 3.12: Effects of inhibiting other current. ICl , INSCC , INaK andINaCa (left to right) were blocked individually to examine their effect on the AP(top) and the membrane current (bottom) with the results (red) compared torecordings obtained in control condition (black). Inhibiting ICl slowed downthe spiking frequency while RMP remained unchanged. Blocking INSCC andINaCa completely changed the shape of AP and RMP was drastically decreasedthrough blocking INSCC alone. INaK has little effect on AP while inhibited. Allthe membrane currents showed negligible change when currents were blocked.Only inhibition of ICl showed a slight rise after the voltage-pulse was returnedback to its original potential.
126
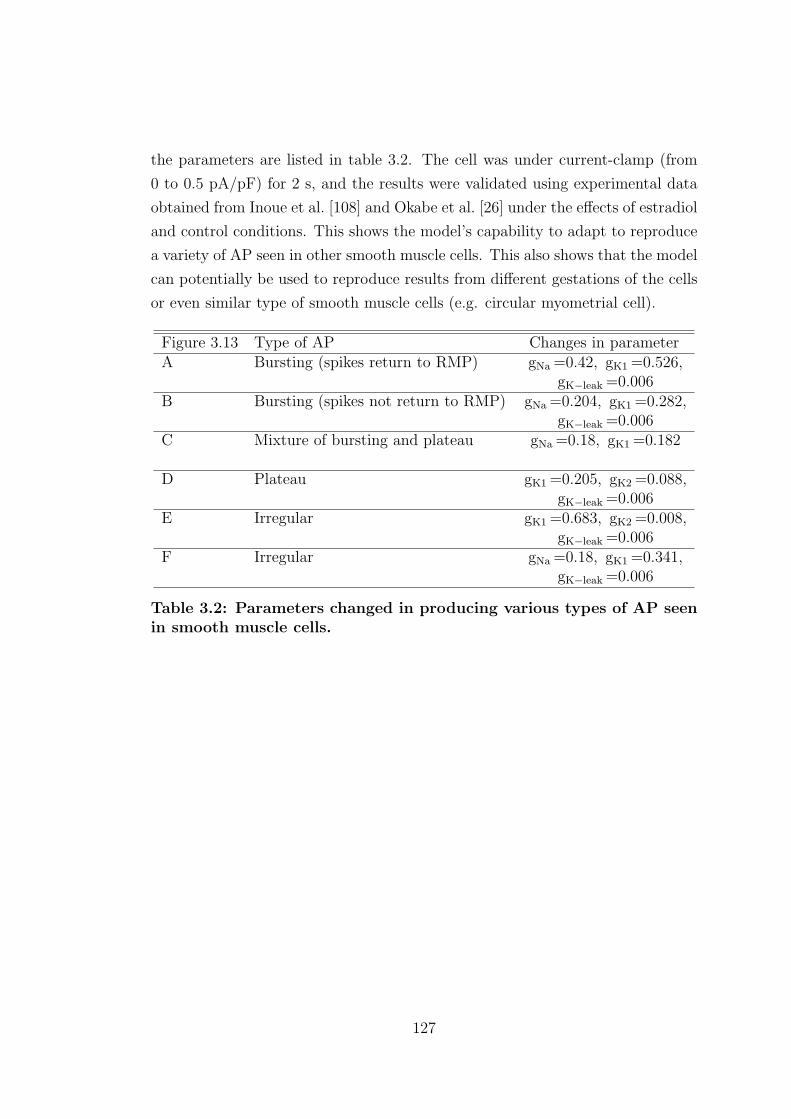
the parameters are listed in table 3.2. The cell was under current-clamp (from
0 to 0.5 pA/pF) for 2 s, and the results were validated using experimental data
obtained from Inoue et al. [108] and Okabe et al. [26] under the effects of estradiol
and control conditions. This shows the model’s capability to adapt to reproduce
a variety of AP seen in other smooth muscle cells. This also shows that the model
can potentially be used to reproduce results from different gestations of the cells
or even similar type of smooth muscle cells (e.g. circular myometrial cell).
Figure 3.13 Type of AP Changes in parameterA Bursting (spikes return to RMP) gNa =0.42, gK1 =0.526,
gK−leak =0.006B Bursting (spikes not return to RMP) gNa =0.204, gK1 =0.282,
gK−leak =0.006C Mixture of bursting and plateau gNa =0.18, gK1 =0.182
D Plateau gK1 =0.205, gK2 =0.088,gK−leak =0.006
E Irregular gK1 =0.683, gK2 =0.008,gK−leak =0.006
F Irregular gNa =0.18, gK1 =0.341,gK−leak =0.006
Table 3.2: Parameters changed in producing various types of AP seenin smooth muscle cells.
127
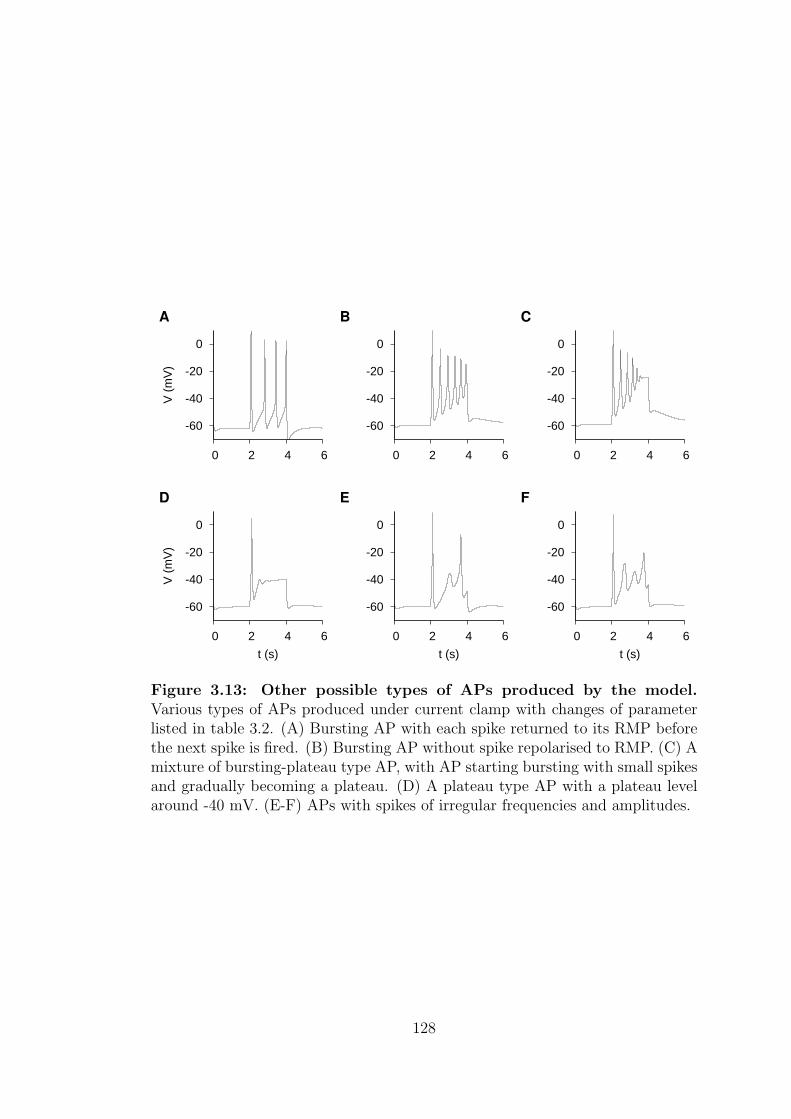
-60
-40
-20
0
0 2 4 6
V (
mV
)
A
-60
-40
-20
0
0 2 4 6
B
-60
-40
-20
0
0 2 4 6
C
-60
-40
-20
0
0 2 4 6
V (
mV
)
t (s)
D
-60
-40
-20
0
0 2 4 6
t (s)
E
-60
-40
-20
0
0 2 4 6
t (s)
F
Figure 3.13: Other possible types of APs produced by the model.Various types of APs produced under current clamp with changes of parameterlisted in table 3.2. (A) Bursting AP with each spike returned to its RMP beforethe next spike is fired. (B) Bursting AP without spike repolarised to RMP. (C) Amixture of bursting-plateau type AP, with AP starting bursting with small spikesand gradually becoming a plateau. (D) A plateau type AP with a plateau levelaround -40 mV. (E-F) APs with spikes of irregular frequencies and amplitudes.
128
Chapter 4
Results II – Mechanical
production
The myometrial model was tested to investigate the excitation-contraction cou-
pling and the mechanical behaviour of a single uterine smooth muscle cell. Pre-
dictions made by the model were compared to the experimental data from my-
ometrium when available. Different testing voltage or current protocols applied
to the model followed the information provided in literature as closely as possible.
However, the magnitude of force provided by the model was considerably smaller
compared to experimental recordings as expected. This is due to incorporation of
the cerebrovascular mechanical model by Yang et al., with the majority of the pa-
rameters provided by the mechanical model left unmodified. As explained in the
previous chapter, most of the parameters were not available for the myometrium,
and using parameters from another type of smooth muscle gave a good indication
of how a uterine cell produced mechanical force. Even though the magnitude of
the force was significantly less, this did not compromise on the outcome of the
results and the major characteristics qualitatively, and similarities to the exper-
iments were still observed. All the simulations were carried out in an isometric
condition (constant cell length) with lc = 150µm unless otherwise stated.
4.1 Fractional stress production in myometrium
Fractional stress produced by a single myometrial cell was investigated using a
modified Hai and Murphy, four-state cross-bridge cycling model [56, 57] (figure
4.1). Two different protocols (a single pulse or 10 repetitive pulses) were applied
129
to the myometrial model. The peak of stress produced by the model with a single
pulse stimulation was 58.63% and it took 4.98 s to reached this peak. Repetitive
voltage pulses generated a maximal stress of 77.50% and the time taken to reached
the peak was 5.67 s. The rise of the stress level was due to [ Ca2+ ]i accumulation
when the model was repetitively stimulated. The model also showed stress pro-
duced by the repetitive pulses was more prolonged and generated a more efficient
production of stress than a single pulse firing as described in experiments [73].
It took about the same time (around 45 to 50 s) for both cases to relax back to
their equilibrium stress level.
In both cases, the distribution of the four states of the cross-bridges were also
investigated. The levels of the states increased when the external voltage pulses
were applied in all the states apart from the free myosin state (M). The profile
of the M state is inversely related to the fractional stress because less myosin
was available when stress was generated in the cell. The level of state M slowly
recovered back to its equilibrium level when the original stress of the cell was
restored. The sudden increased level of the phosphorylated cross-bridge state
(Mp) when voltage stimuli was applied caused the state of the latch bridge (AM)
to decline before reaching its peak.
4.2 Single-, twin- and multiple-pulse simulation
in myometrium
A twin-pulse stimulation was applied to the myometrium and the results from
simulations were compared to experimental data. Burdyga et al. [161] examined
the simultaneous activity of an isolated 21-day pregnant myometrial cell in rat.
The cells were placed under a current-clamp and spontaneous activity of Ca2+ -
spikes was recorded (figure 4.2(A)). It was found [ Ca2+ ]i rose with fast upstroke
and decayed exponentially and slowly. It took 155.8± 4.5 to reach its peak and
the duration at 50% was 998±60 ms. The actual stimulation used in experiments
were unknown. In simulations, the first stimulus was applied from 0 to -3 pA/pF
for 800 ms and the same stimulus was applied again 1000 ms later. The fast
upstroke and slow decay characteristics were also observed. The time taken to
reach the peak of [ Ca2+ ]i was 828.2 ms and the duration at 50% was 2.40 s. Both
of these values were greater compared to the recordings obtained from Burdyga
et al. [161].
130
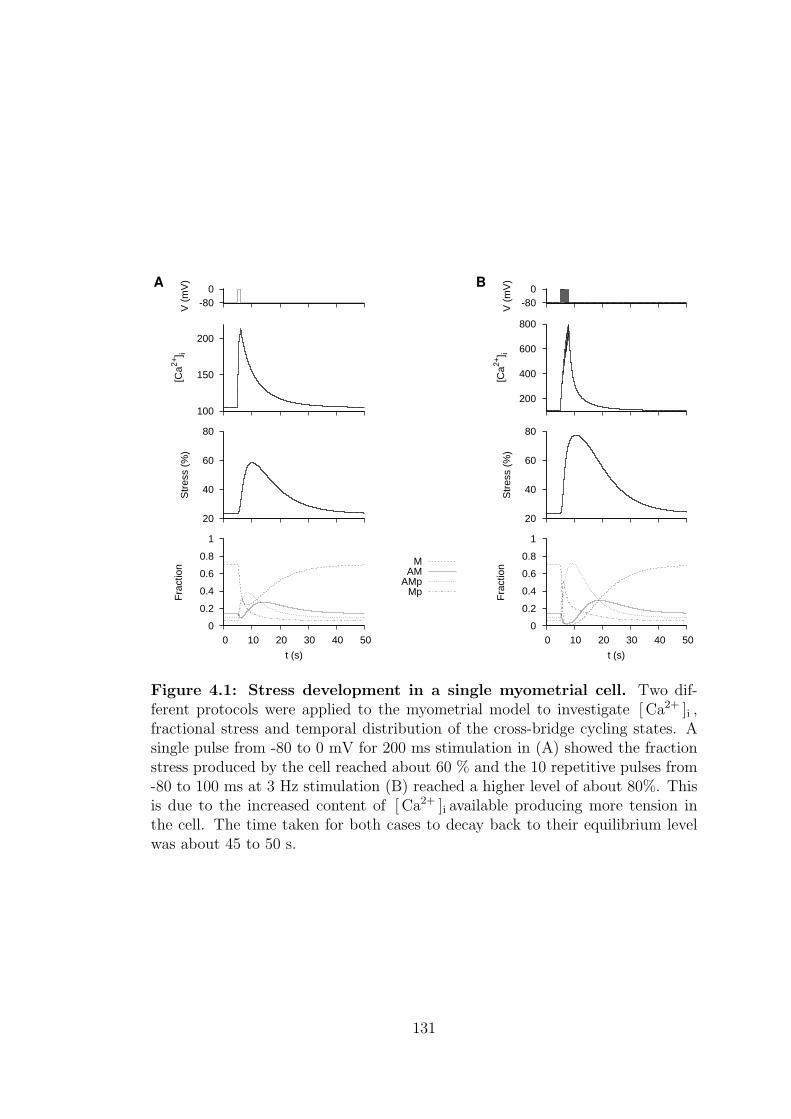
-80 0
V (
mV
)A
-80 0
V (
mV
)B
100
150
200
[Ca2+
] i
200
400
600
800
[Ca2+
] i
20
40
60
80
Str
ess
(%)
20
40
60
80
Str
ess
(%)
0
0.2
0.4
0.6
0.8
1
0 10 20 30 40 50
Fra
ctio
n
t (s)
MAM
AMpMp
0
0.2
0.4
0.6
0.8
1
0 10 20 30 40 50
Fra
ctio
n
t (s)
Figure 4.1: Stress development in a single myometrial cell. Two dif-ferent protocols were applied to the myometrial model to investigate [ Ca2+ ]i ,fractional stress and temporal distribution of the cross-bridge cycling states. Asingle pulse from -80 to 0 mV for 200 ms stimulation in (A) showed the fractionstress produced by the cell reached about 60 % and the 10 repetitive pulses from-80 to 100 ms at 3 Hz stimulation (B) reached a higher level of about 80%. Thisis due to the increased content of [ Ca2+ ]i available producing more tension inthe cell. The time taken for both cases to decay back to their equilibrium levelwas about 45 to 50 s.
131
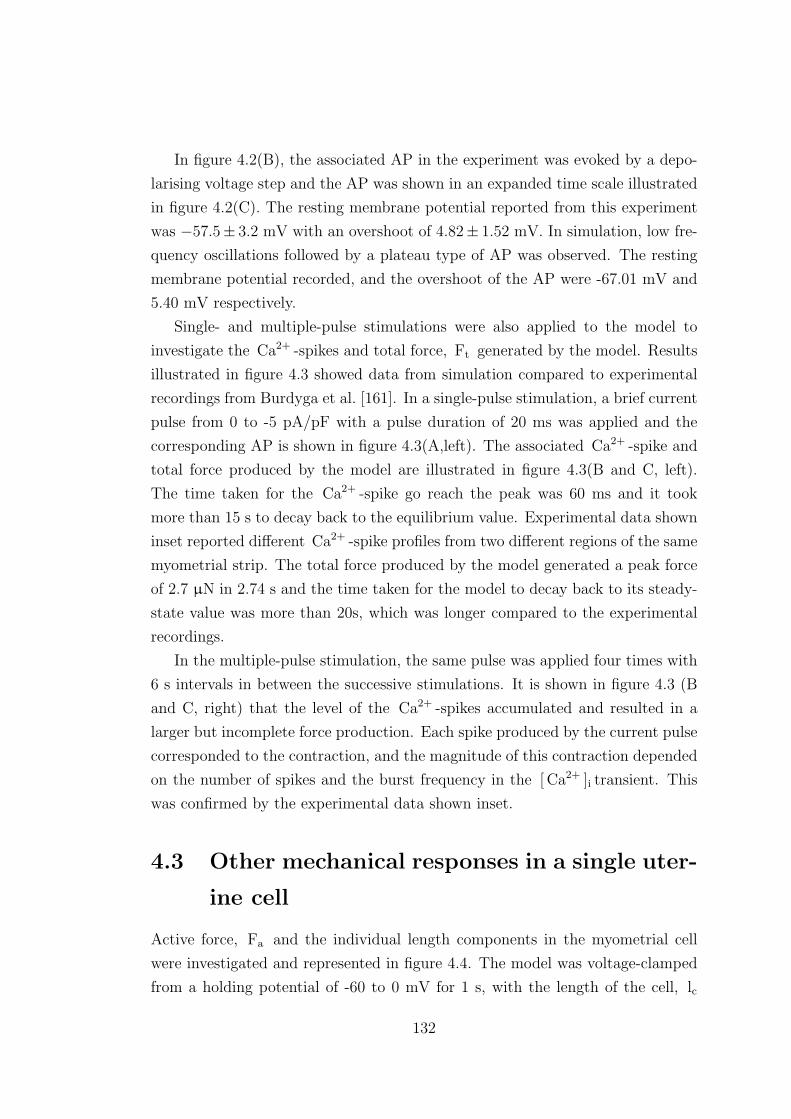
In figure 4.2(B), the associated AP in the experiment was evoked by a depo-
larising voltage step and the AP was shown in an expanded time scale illustrated
in figure 4.2(C). The resting membrane potential reported from this experiment
was −57.5± 3.2 mV with an overshoot of 4.82± 1.52 mV. In simulation, low fre-
quency oscillations followed by a plateau type of AP was observed. The resting
membrane potential recorded, and the overshoot of the AP were -67.01 mV and
5.40 mV respectively.
Single- and multiple-pulse stimulations were also applied to the model to
investigate the Ca2+ -spikes and total force, Ft generated by the model. Results
illustrated in figure 4.3 showed data from simulation compared to experimental
recordings from Burdyga et al. [161]. In a single-pulse stimulation, a brief current
pulse from 0 to -5 pA/pF with a pulse duration of 20 ms was applied and the
corresponding AP is shown in figure 4.3(A,left). The associated Ca2+ -spike and
total force produced by the model are illustrated in figure 4.3(B and C, left).
The time taken for the Ca2+ -spike go reach the peak was 60 ms and it took
more than 15 s to decay back to the equilibrium value. Experimental data shown
inset reported different Ca2+ -spike profiles from two different regions of the same
myometrial strip. The total force produced by the model generated a peak force
of 2.7 µN in 2.74 s and the time taken for the model to decay back to its steady-
state value was more than 20s, which was longer compared to the experimental
recordings.
In the multiple-pulse stimulation, the same pulse was applied four times with
6 s intervals in between the successive stimulations. It is shown in figure 4.3 (B
and C, right) that the level of the Ca2+ -spikes accumulated and resulted in a
larger but incomplete force production. Each spike produced by the current pulse
corresponded to the contraction, and the magnitude of this contraction depended
on the number of spikes and the burst frequency in the [ Ca2+ ]i transient. This
was confirmed by the experimental data shown inset.
4.3 Other mechanical responses in a single uter-
ine cell
Active force, Fa and the individual length components in the myometrial cell
were investigated and represented in figure 4.4. The model was voltage-clamped
from a holding potential of -60 to 0 mV for 1 s, with the length of the cell, lc
132
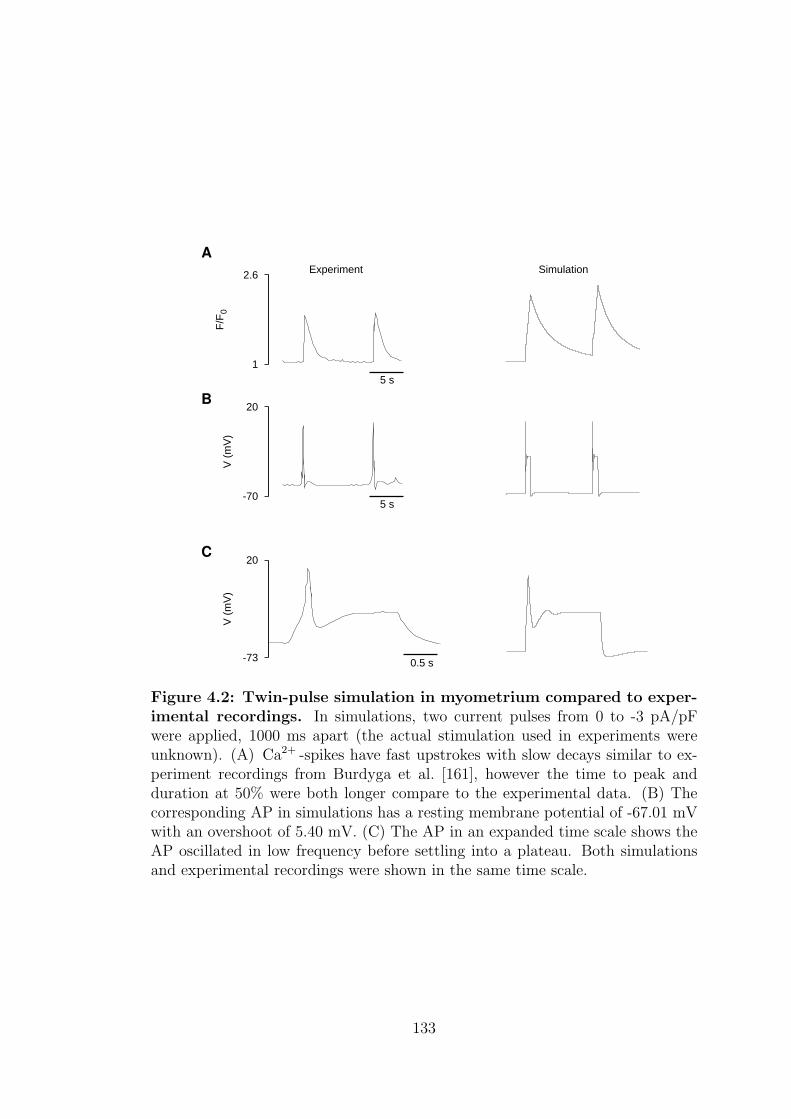
1
2.6
F/F
0
A
Experiment Simulation
5 s
-70
20
V (
mV
)
B
5 s
-73
20
V (
mV
)
C
0.5 s
Figure 4.2: Twin-pulse simulation in myometrium compared to exper-imental recordings. In simulations, two current pulses from 0 to -3 pA/pFwere applied, 1000 ms apart (the actual stimulation used in experiments wereunknown). (A) Ca2+ -spikes have fast upstrokes with slow decays similar to ex-periment recordings from Burdyga et al. [161], however the time to peak andduration at 50% were both longer compare to the experimental data. (B) Thecorresponding AP in simulations has a resting membrane potential of -67.01 mVwith an overshoot of 5.40 mV. (C) The AP in an expanded time scale shows theAP oscillated in low frequency before settling into a plateau. Both simulationsand experimental recordings were shown in the same time scale.
133
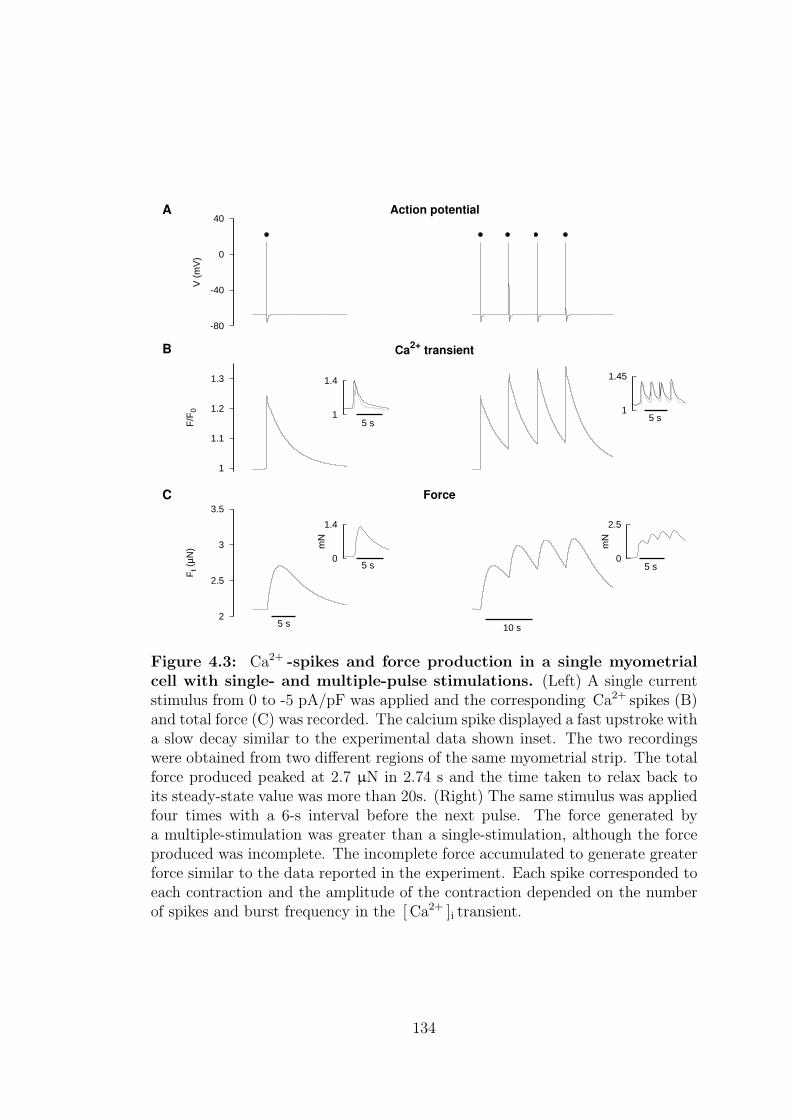
-80
-40
0
40
V (
mV
)
A Action potential
1
1.1
1.2
1.3
F/F
0
B Ca2+
transient
2
2.5
3
3.5
Ft (
µN)
C Force
5 s 10 s
1
1.4
5 s
0
1.4
mN
5 s
1
1.45
5 s
0
2.5
mN
5 s
Figure 4.3: Ca2+ -spikes and force production in a single myometrialcell with single- and multiple-pulse stimulations. (Left) A single currentstimulus from 0 to -5 pA/pF was applied and the corresponding Ca2+ spikes (B)and total force (C) was recorded. The calcium spike displayed a fast upstroke witha slow decay similar to the experimental data shown inset. The two recordingswere obtained from two different regions of the same myometrial strip. The totalforce produced peaked at 2.7 µN in 2.74 s and the time taken to relax back toits steady-state value was more than 20s. (Right) The same stimulus was appliedfour times with a 6-s interval before the next pulse. The force generated bya multiple-stimulation was greater than a single-stimulation, although the forceproduced was incomplete. The incomplete force accumulated to generate greaterforce similar to the data reported in the experiment. Each spike corresponded toeach contraction and the amplitude of the contraction depended on the numberof spikes and burst frequency in the [ Ca2+ ]i transient.
134
= 123 µm. The time taken to reach the peak [ Ca2+ ]i transient, and the peak
active force generated, were 6.57 and 7.71 s respectively which showed a clear
delay in muscle contractions. During the contraction, the length of the active
component, la decreased or shortened and consequently the lengths of the series
and cross-bridge components, ls and lx increased, compensating the augmented
level of force.
The myometrial model also examined the [ Ca2+ ]i transient, total force, Ft
and the peak force rate, dF/dt with increasing value of membrane voltages. In
an isometric condition, with lc = 123 µm, the model was clamped with a single
voltage holding from -40 to 60 mV every 5 mV for 1 s. The simulation illustrated
in figure 4.5 reported that the peak of [ Ca2+ ]i corresponded directly to the total
force and the peak force rate. The peaks of [ Ca2+ ]i , total force and force rate
reached their maximum values at -20 mV.
135
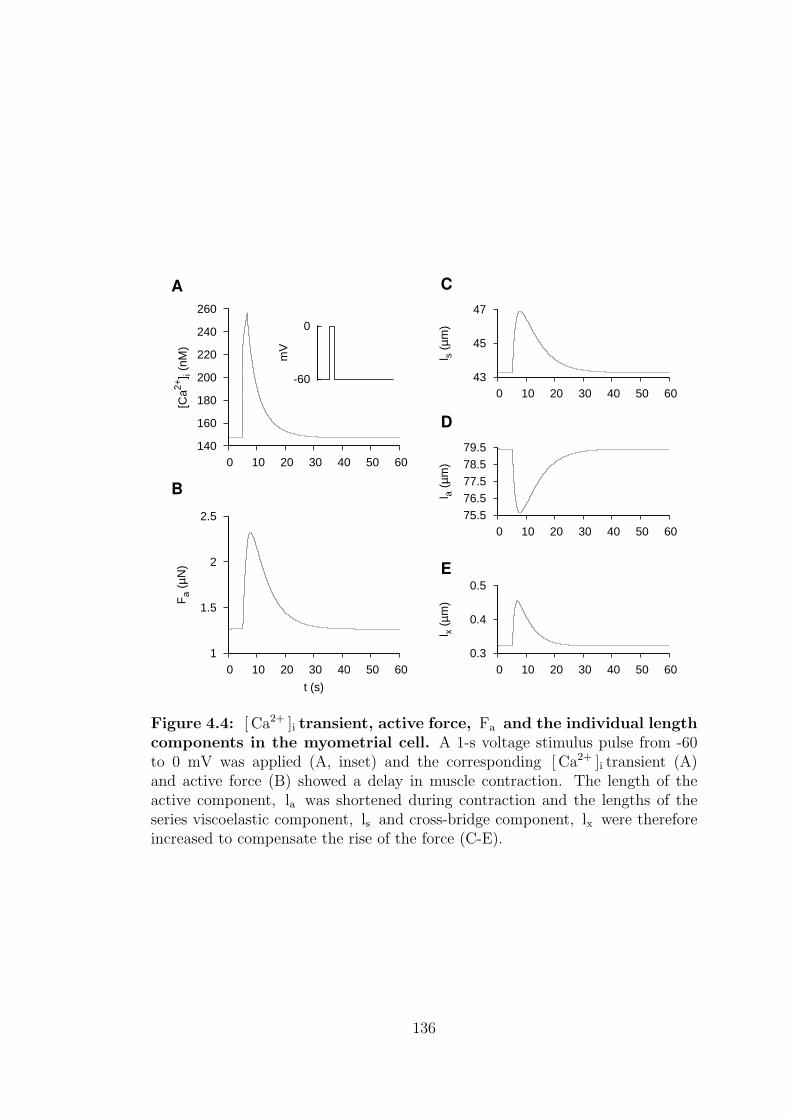
140
160
180
200
220
240
260
0 10 20 30 40 50 60
[Ca2+
] i (n
M)
A
1
1.5
2
2.5
0 10 20 30 40 50 60
Fa
(µN
)
t (s)
B
43
45
47
0 10 20 30 40 50 60
l s (
µm)
C
75.5
76.5
77.5 78.5
79.5
0 10 20 30 40 50 60
l a (
µm)
D
0.3
0.4
0.5
0 10 20 30 40 50 60
l x (
µm)
E
-60
0
mV
Figure 4.4: [ Ca2+ ]i transient, active force, Fa and the individual lengthcomponents in the myometrial cell. A 1-s voltage stimulus pulse from -60to 0 mV was applied (A, inset) and the corresponding [ Ca2+ ]i transient (A)and active force (B) showed a delay in muscle contraction. The length of theactive component, la was shortened during contraction and the lengths of theseries viscoelastic component, ls and cross-bridge component, lx were thereforeincreased to compensate the rise of the force (C-E).
136
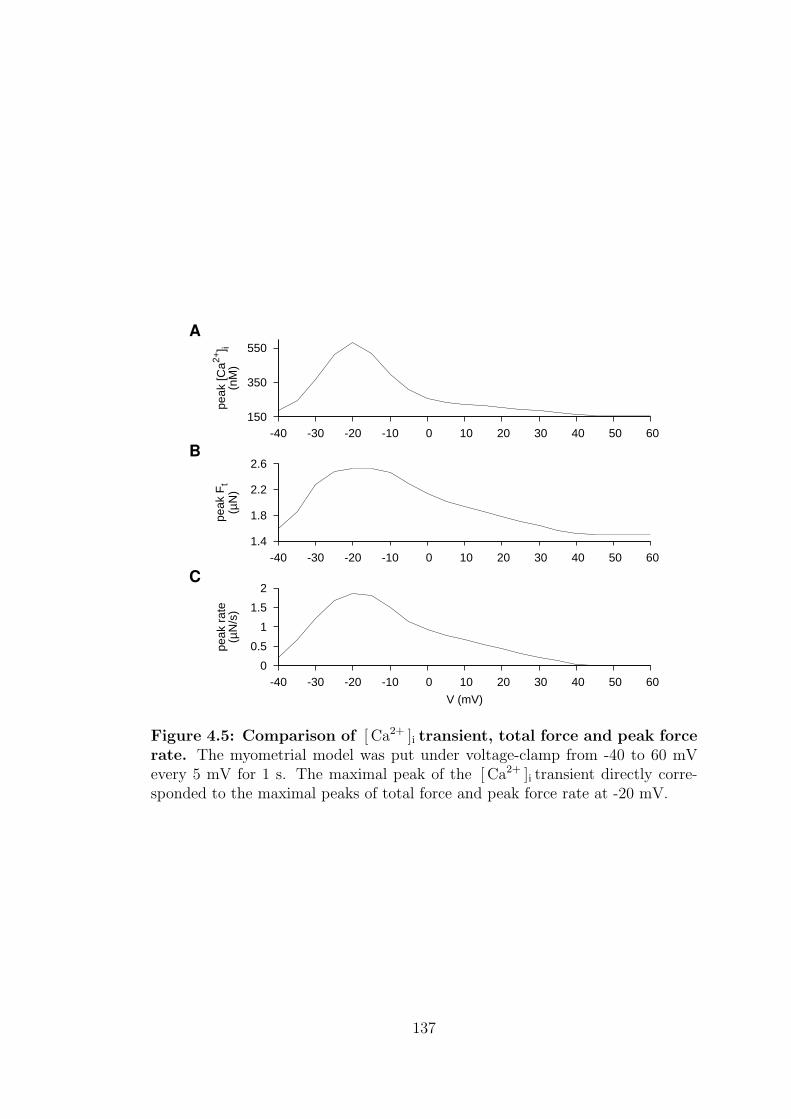
150
350
550
-40 -30 -20 -10 0 10 20 30 40 50 60
peak
[Ca2+
] i(n
M)
A
1.4
1.8
2.2
2.6
-40 -30 -20 -10 0 10 20 30 40 50 60
peak
Ft
(µN
)
B
0
0.5
1
1.5
2
-40 -30 -20 -10 0 10 20 30 40 50 60
peak
rat
e(µ
N/s
)
V (mV)
C
Figure 4.5: Comparison of [ Ca2+ ]i transient, total force and peak forcerate. The myometrial model was put under voltage-clamp from -40 to 60 mVevery 5 mV for 1 s. The maximal peak of the [ Ca2+ ]i transient directly corre-sponded to the maximal peaks of total force and peak force rate at -20 mV.
137
Chapter 5
Drug actions – Investigation of
the properties of [ Ca2+ ]i transient
and contractile force
To understand the functionality of a cell, and give an insight into certain roles
of a specific current or transporter in a sub-cellular level, drugs were applied
experimentally to inhibit the current and see how the cell behaved without it.
In simulations, drug actions seen in experiments can be mimicked by inhibiting
certain currents to see if the same effects could be replicated. In particular, how
[ Ca2+ ]i transient and contractile force are operated in a single myometrial cell
were focused on. Since [ Ca2+ ]i is directly linked to the generation of arrhythmic
contractility in the uterus towards the end of the pregnancy, regulation of this
contractile force is absolutely vital. Simulations of drug actions focussing on these
two categories will not only help in the understanding of mechanisms underlying
[ Ca2+ ]i transient and contractility in myometrium, it also puts the model to the
test, and provides useful information for future model improvement.
5.1 Properties of [ Ca2+ ]i transient in myometrial
cells
To investigate the properties of the [ Ca2+ ]i transient in myometrium, voltage-
dependence of the Ca2+ transient were looked at by applying depolarising pulses
with various magnitudes to the model and compared with the experimental data.
138
Carboxeyosin was used to inhibit the sarcolemmal Ca2+ pump to study the con-
tribution of ICapump as a calcium extraction mechanism, and examine how the
decay rate changed when the drug was used. Nifedipine, an L-type Ca2+ blocker
was used to investigate the contribution of Ca2+ and ICaL to the inward current.
Finally, the role of CICR and its contribution to the [ Ca2+ ]i transient was also
testing with a CICR inhibitor, ryanodine.
5.1.1 Depolarising pulse with varying magnitude
The effects of varying depolarising pulses on [ Ca2+ ]i transient and ICa−tot in
late pregnant rat myometrium were investigated by Shmigol et al. [69]. Cells
were held at a holding potential of -50 mV briefly (10 ms) before stepping from
-40 to 20 mV every 10 mV, then 20 to 40 mV every 20 mV for 200 ms. Each cell
was allowed to relax to its steady state and was not held at a particular voltage
before the next voltage-clamp was applied (figure 5.1 (A, top)). If this separation
of the pulses was not introduced, Ca2+ might not have finished decaying and
therefore have an affect on the amplitude of the subsequent peak. The same
investigation was repeated in simulations. In experiment, it was reported that in
cells under normal physiological condition, the magnitudes of both [ Ca2+ ]i and
ICa−tot increased as the magnitudes of the depolarising pulses increased. After
both [ Ca2+ ]i and ICa−tot reached their peaks around -10 to 0 mV, the amplitudes
of [ Ca2+ ]i and ICa−tot began to decline. In simulations, the strongest peaks with
similar amplitudes of [ Ca2+ ]i were found when depolarising pulses were -20 and
-10 mV, while the maximum peak of ICa−tot agreed well with the experimental
data. Both ∆ [ Ca2+ ]i and ICa−tot showed a bell-shape dependency on the voltage
in experiments and simulations as illustrated in 5.1(C). It also showed results in
experiments with 6 cells revealed that [ Ca2+ ]i actually peaked when depolarising
pulses were -10 and 0 mV.
5.1.2 Carboxyeosin, CE
Carboxyeosin (CE) is a sarcolemmal Ca2+ pump inhibitor used extensively in
cardiac smooth muscle to study the rate at which, and how the Ca2+ extrusion
process occurs [162–164]. It was reported that carboxyeosin raised the resting
[ Ca2+ ]i level and the magnitude of the [ Ca2+ ]i transient in rat ventricular my-
ocyctes [162]. It also showed that the rate of its relaxation was increased by
139
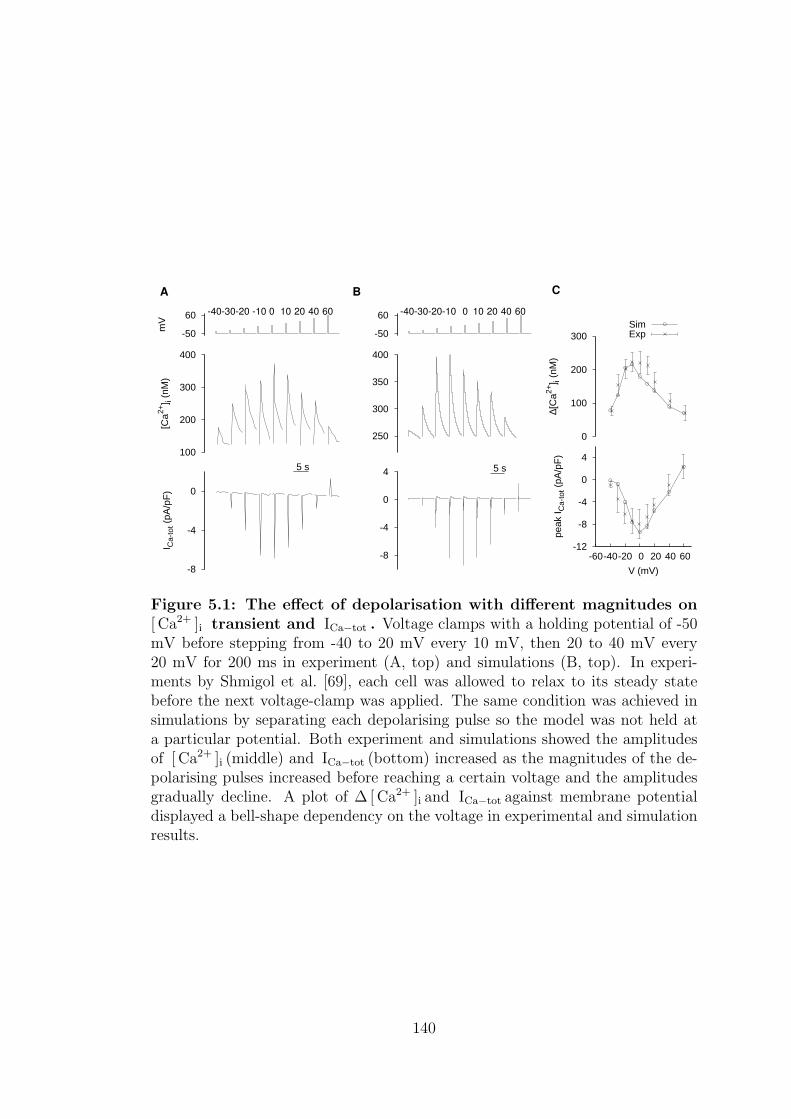
-50
60
mV
A
-40-30-20 -10 0 10 20 40 60
100
200
300
400
[Ca2+
] i (n
M)
-8
-4
0
I Ca-
tot (
pA/p
F)
5 s
-50
60
B
-40-30-20-10 0 10 20 40 60
250
300
350
400
-8
-4
0
4 5 s
0
100
200
300
∆[C
a2+] i
(nM
)
C
SimExp
-12
-8
-4
0
4
-60-40-20 0 20 40 60pe
ak I C
a-to
t (pA
/pF
)V (mV)
Figure 5.1: The effect of depolarisation with different magnitudes on[ Ca2+ ]i transient and ICa−tot . Voltage clamps with a holding potential of -50mV before stepping from -40 to 20 mV every 10 mV, then 20 to 40 mV every20 mV for 200 ms in experiment (A, top) and simulations (B, top). In experi-ments by Shmigol et al. [69], each cell was allowed to relax to its steady statebefore the next voltage-clamp was applied. The same condition was achieved insimulations by separating each depolarising pulse so the model was not held ata particular potential. Both experiment and simulations showed the amplitudesof [ Ca2+ ]i (middle) and ICa−tot (bottom) increased as the magnitudes of the de-polarising pulses increased before reaching a certain voltage and the amplitudesgradually decline. A plot of ∆ [ Ca2+ ]i and ICa−tot against membrane potentialdisplayed a bell-shape dependency on the voltage in experimental and simulationresults.
140
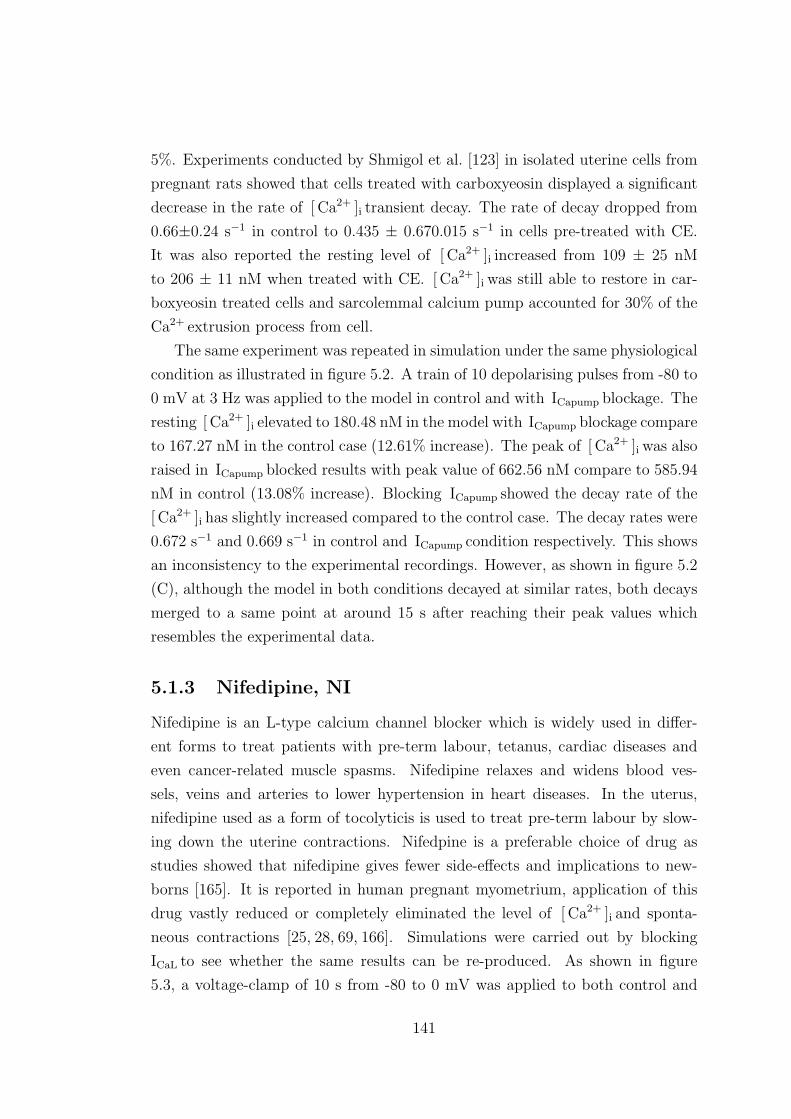
5%. Experiments conducted by Shmigol et al. [123] in isolated uterine cells from
pregnant rats showed that cells treated with carboxyeosin displayed a significant
decrease in the rate of [ Ca2+ ]i transient decay. The rate of decay dropped from
0.66±0.24 s−1 in control to 0.435 ± 0.670.015 s−1 in cells pre-treated with CE.
It was also reported the resting level of [ Ca2+ ]i increased from 109 ± 25 nM
to 206 ± 11 nM when treated with CE. [ Ca2+ ]i was still able to restore in car-
boxyeosin treated cells and sarcolemmal calcium pump accounted for 30% of the
Ca2+ extrusion process from cell.
The same experiment was repeated in simulation under the same physiological
condition as illustrated in figure 5.2. A train of 10 depolarising pulses from -80 to
0 mV at 3 Hz was applied to the model in control and with ICapump blockage. The
resting [ Ca2+ ]i elevated to 180.48 nM in the model with ICapump blockage compare
to 167.27 nM in the control case (12.61% increase). The peak of [ Ca2+ ]i was also
raised in ICapump blocked results with peak value of 662.56 nM compare to 585.94
nM in control (13.08% increase). Blocking ICapump showed the decay rate of the
[ Ca2+ ]i has slightly increased compared to the control case. The decay rates were
0.672 s−1 and 0.669 s−1 in control and ICapump condition respectively. This shows
an inconsistency to the experimental recordings. However, as shown in figure 5.2
(C), although the model in both conditions decayed at similar rates, both decays
merged to a same point at around 15 s after reaching their peak values which
resembles the experimental data.
5.1.3 Nifedipine, NI
Nifedipine is an L-type calcium channel blocker which is widely used in differ-
ent forms to treat patients with pre-term labour, tetanus, cardiac diseases and
even cancer-related muscle spasms. Nifedipine relaxes and widens blood ves-
sels, veins and arteries to lower hypertension in heart diseases. In the uterus,
nifedipine used as a form of tocolyticis is used to treat pre-term labour by slow-
ing down the uterine contractions. Nifedpine is a preferable choice of drug as
studies showed that nifedipine gives fewer side-effects and implications to new-
borns [165]. It is reported in human pregnant myometrium, application of this
drug vastly reduced or completely eliminated the level of [ Ca2+ ]i and sponta-
neous contractions [25, 28, 69, 166]. Simulations were carried out by blocking
ICaL to see whether the same results can be re-produced. As shown in figure
5.3, a voltage-clamp of 10 s from -80 to 0 mV was applied to both control and
141
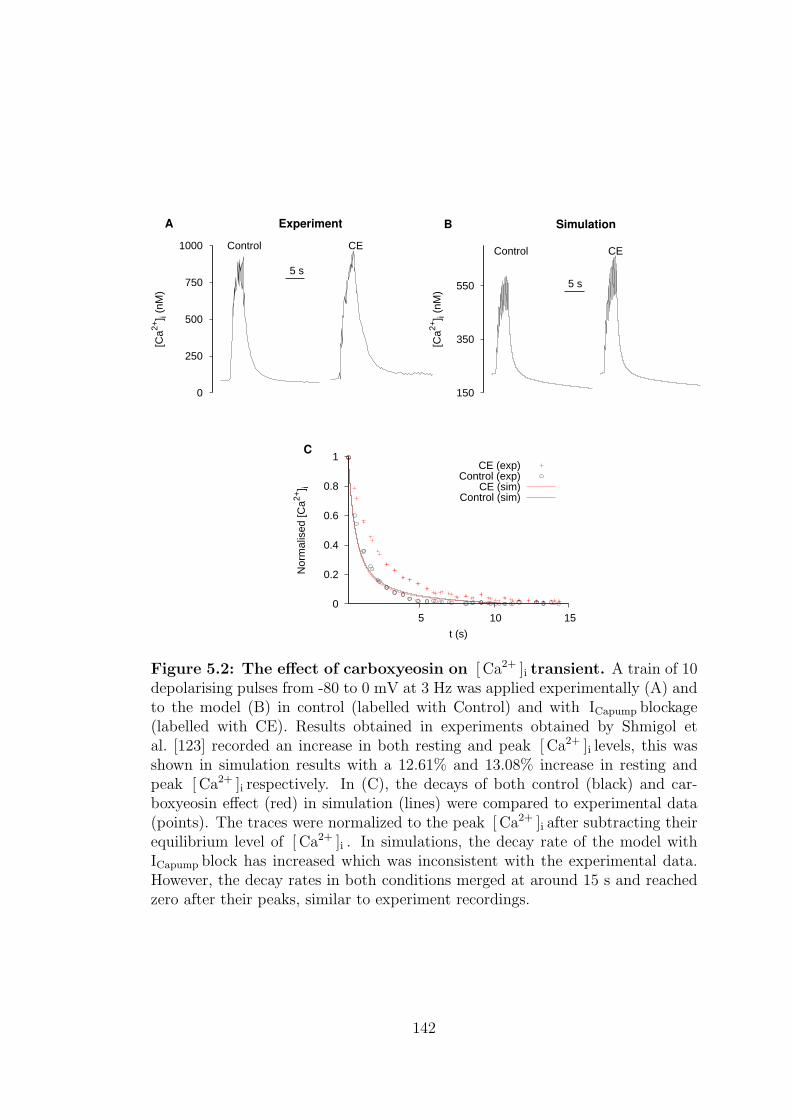
0
250
500
750
1000
[Ca2+
] i (n
M)
ExperimentA
5 s
Control CE
150
350
550
[Ca2+
] i (n
M)
SimulationB
5 s
Control CE
0
0.2
0.4
0.6
0.8
1
5 10 15
Nor
mal
ised
[Ca2+
] i
t (s)
C
CE (exp)Control (exp)
CE (sim)Control (sim)
Figure 5.2: The effect of carboxyeosin on [ Ca2+ ]i transient. A train of 10depolarising pulses from -80 to 0 mV at 3 Hz was applied experimentally (A) andto the model (B) in control (labelled with Control) and with ICapump blockage(labelled with CE). Results obtained in experiments obtained by Shmigol etal. [123] recorded an increase in both resting and peak [ Ca2+ ]i levels, this wasshown in simulation results with a 12.61% and 13.08% increase in resting andpeak [ Ca2+ ]i respectively. In (C), the decays of both control (black) and car-boxyeosin effect (red) in simulation (lines) were compared to experimental data(points). The traces were normalized to the peak [ Ca2+ ]i after subtracting theirequilibrium level of [ Ca2+ ]i . In simulations, the decay rate of the model withICapump block has increased which was inconsistent with the experimental data.However, the decay rates in both conditions merged at around 15 s and reachedzero after their peaks, similar to experiment recordings.
142
ICaL blocked model and levels of [ Ca2+ ]i and ICa−tot were recorded. The results
were then compared to the experimental recordings obtained by Wray et al. [13].
It is clearly seen that the amplitude of [ Ca2+ ]i and ICa−tot were greatly dimin-
ished but not completely abolished when ICaL was inhibited. This confirms that
Ca2+ entry is mostly through L-type calcium channels and the current responsible
for the remaining of the [ Ca2+ ]i entry is ICaT .
5.1.4 Ryanodine, Ry
Ryanodine (Ry) is an alkaloid derived from a plant called Ryania. There are no
known medications created from ryanodine to date. It is produced synthetically
and used commonly in experiments to examine how calcium channels are operated
and how the influx/efflux of Ca2+ are controlled in cardiac, skeleton and uterine
smooth muscle cells [69,167–169]. Ryanodine inhibits CICR and blocks the phasic
release of Ca2+ . In myometrium, it is observed that ryanodine-sensitive stores
are responsible for the high frequency calcium oscillation which lead muscles to
contract massively in pregnant cultured [170] and non-cultured human uterine
cell [136, 171]. It is also reported that ryanodine enhanced contractility in tissue
by 60% from pregnant rat myometrium at term but not non-pregnant [135]. This
may be explained by the increased number of calcium channels and changing
sensitivity in ryanodine receptors (RyR) towards the end of the pregnancy.
To investigate the role of CICR in contributing to the [ Ca2+ ]i transient,
Shmigol et al. [69] conducted a study on single isolated pregnant rat myome-
trial cells using a low dose (5 µM) of ryanodine to inhibit the CICR process. A
twin voltage-pulse from a holding potential of -50 to 0 mV was applied with a
500 ms interval between the two pulses, to both control and ryanodine treated
cells. It was reported in control cells, the second increment in [ Ca2+ ]i (elicited
by the second pulse) was the same or larger than the first increment (elicited by
the first pulse). The peak of ICa−tot however showed the opposite, displaying a
negative staircase effect. In simulations, the experiment was replicated and illus-
trated in figure 5.4. It showed a small but significant rise in [ Ca2+ ]i elicited by
the second voltage-pulse (6.07% increase was recorded). The peaks of ICa−tot on
the other hand decreased from -8.64 pA/pF evoked by the first pulse to -7.94
pA/pF by the second pulse with 8.1% decreased recorded. When ryanodine was
added to the cell experimentally, the second [ Ca2+ ]i increment was smaller than
the first one, while the amplitude of ICa−tot was also reduced. The same results
143
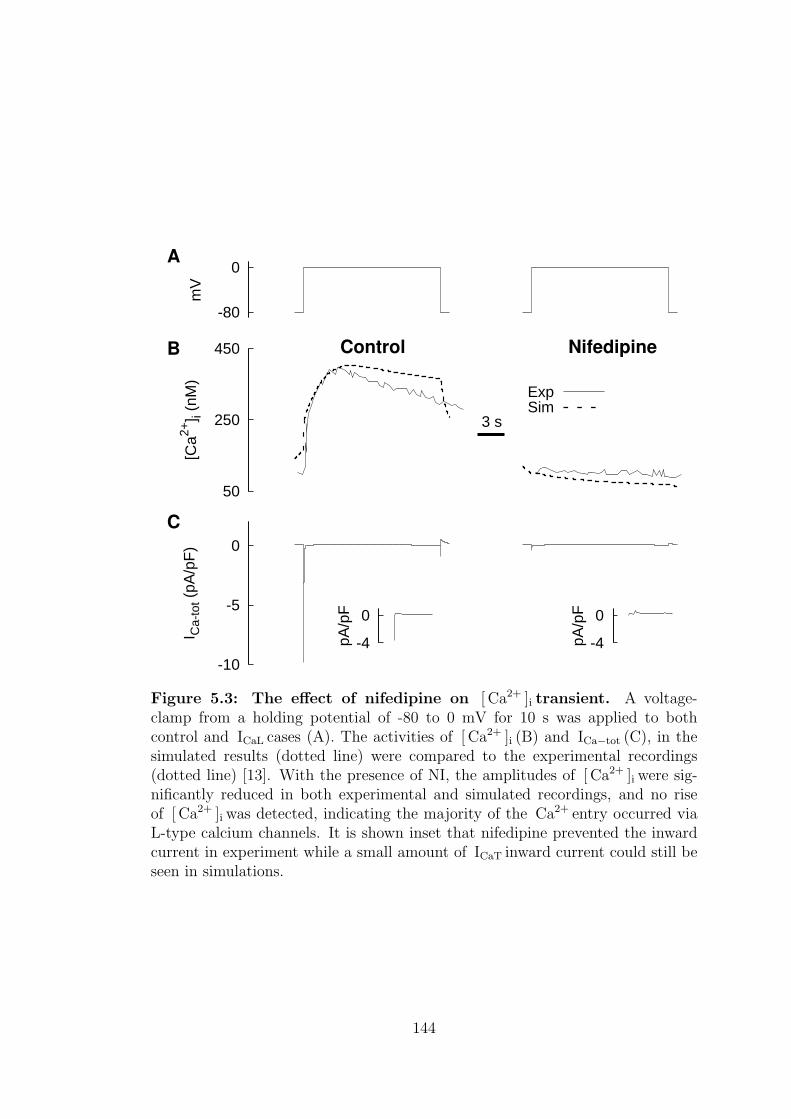
-80
0
mV
A
50
250
450
[Ca2+
] i (n
M)
B Control Nifedipine
3 s
ExpSim
-10
-5
0
I Ca-
tot (
pA/p
F)
C
-4
0
pA/p
F
-4
0
pA/p
F
Figure 5.3: The effect of nifedipine on [ Ca2+ ]i transient. A voltage-clamp from a holding potential of -80 to 0 mV for 10 s was applied to bothcontrol and ICaL cases (A). The activities of [ Ca2+ ]i (B) and ICa−tot (C), in thesimulated results (dotted line) were compared to the experimental recordings(dotted line) [13]. With the presence of NI, the amplitudes of [ Ca2+ ]i were sig-nificantly reduced in both experimental and simulated recordings, and no riseof [ Ca2+ ]i was detected, indicating the majority of the Ca2+ entry occurred viaL-type calcium channels. It is shown inset that nifedipine prevented the inwardcurrent in experiment while a small amount of ICaT inward current could still beseen in simulations.
144
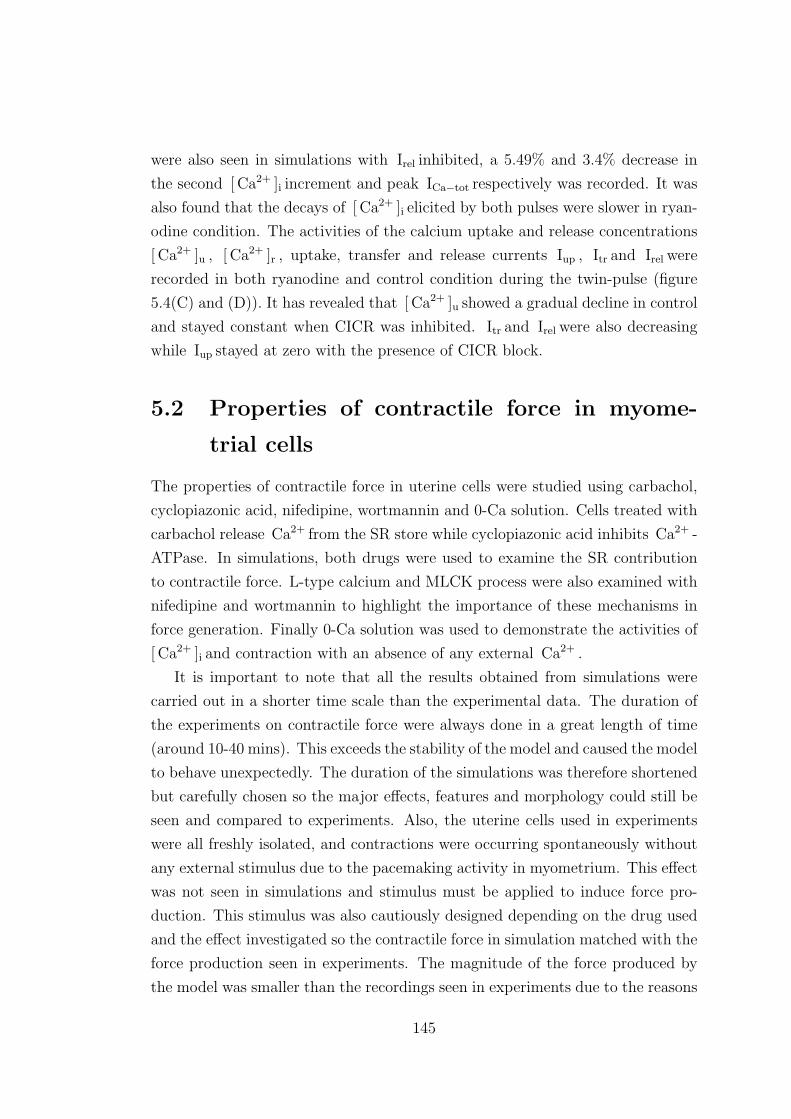
were also seen in simulations with Irel inhibited, a 5.49% and 3.4% decrease in
the second [ Ca2+ ]i increment and peak ICa−tot respectively was recorded. It was
also found that the decays of [ Ca2+ ]i elicited by both pulses were slower in ryan-
odine condition. The activities of the calcium uptake and release concentrations
[ Ca2+ ]u , [ Ca2+ ]r , uptake, transfer and release currents Iup , Itr and Irel were
recorded in both ryanodine and control condition during the twin-pulse (figure
5.4(C) and (D)). It has revealed that [ Ca2+ ]u showed a gradual decline in control
and stayed constant when CICR was inhibited. Itr and Irel were also decreasing
while Iup stayed at zero with the presence of CICR block.
5.2 Properties of contractile force in myome-
trial cells
The properties of contractile force in uterine cells were studied using carbachol,
cyclopiazonic acid, nifedipine, wortmannin and 0-Ca solution. Cells treated with
carbachol release Ca2+ from the SR store while cyclopiazonic acid inhibits Ca2+ -
ATPase. In simulations, both drugs were used to examine the SR contribution
to contractile force. L-type calcium and MLCK process were also examined with
nifedipine and wortmannin to highlight the importance of these mechanisms in
force generation. Finally 0-Ca solution was used to demonstrate the activities of
[ Ca2+ ]i and contraction with an absence of any external Ca2+ .
It is important to note that all the results obtained from simulations were
carried out in a shorter time scale than the experimental data. The duration of
the experiments on contractile force were always done in a great length of time
(around 10-40 mins). This exceeds the stability of the model and caused the model
to behave unexpectedly. The duration of the simulations was therefore shortened
but carefully chosen so the major effects, features and morphology could still be
seen and compared to experiments. Also, the uterine cells used in experiments
were all freshly isolated, and contractions were occurring spontaneously without
any external stimulus due to the pacemaking activity in myometrium. This effect
was not seen in simulations and stimulus must be applied to induce force pro-
duction. This stimulus was also cautiously designed depending on the drug used
and the effect investigated so the contractile force in simulation matched with the
force production seen in experiments. The magnitude of the force produced by
the model was smaller than the recordings seen in experiments due to the reasons
145
100
200
300
400
[Ca2+
] i (n
M)
A
1 s
Exp Control
1 s
Exp RyR
200
250
300
350
400
[Ca2+
] i (n
M)
B
1 s
Sim Control
1 s
SimRyR
-6
-4
-2
0
2
I Ca-
tot (
pA/p
F)
-8
-6
-4
-2
0
2
I Ca-
tot (
pA/p
F)
0.07
0.09
0.11
0.13
0 1 2 3 4 5
[Ca2+
] i (n
M)
t (s)
C
[Ca]u
[Ca]r
0
0.04
0.08
0.12
0.16
0 1 2 3 4 5
I (pA
/pF
)
t (s)
D
Irel
IupItr
ControlRyR
-50
0
mV
-50
0
mV
Figure 5.4: The effect of ryanodine on [ Ca2+ ]i and ICa−tot in my-ometrium. A twin voltage-pulse from a holding potential of -50 to 0 mV wasapplied with a 500 ms interval between the two pulses to both control and ryan-odine treated cells in experiment by Shmigol et al. [69] (A) and simulations (B). Incontrol, both experiment recordings and simulations showed that the second incre-ment in [ Ca2+ ]i was the same, or larger than the first increment (6.07% increasewas recorded in simulations) while the second peak in ICa−tot was smaller thanthe first (8.1% decreased recorded in simulations) displaying a negative staircaseeffect. When ryanodine was introduced to the cell, the second [ Ca2+ ]i incrementwas seen smaller than the first one, while the amplitude of ICa−tot was also re-duced. A 5.49% and 3.4% decrease in the second [ Ca2+ ]i increment and peakICa−tot respectively was recorded in simulations. The behaviour of the calciumuptake and release concentrations [ Ca2+ ]u , [ Ca2+ ]r (C), uptake, transfer andrelease currents Iup , Itr and Irel (D) were recorded in both ryanodine (dottedline) and control (solid line) condition. [ Ca2+ ]u declines gradually in controland stayed at a constant level when CICR was inhibited. Itr and Irel were alsodecreasing gradually while Iup stayed at zero with the presence of CICR block.
146
descried in the previous chapter. Again, this did not affect the model’s ability
to produce the mechanical characteristics seen in a single uterine cell and results
from the model was compared qualitatively to the experimental data. In terms of
the [ Ca2+ ]i transient, only the general shapes and features were compared qual-
itatively to the experimental data. This is because [ Ca2+ ]i is always measured
in the units of fura-2, indo-1 and fluo-3 ratios in experiments, using a fluorescent
indicator excited by UV or visible light. The absolute value of [ Ca2+ ]i cannot
be calibrated and determined without extra experimental procedures [172] as the
function of most indicators modified the intracellular environment.
5.2.1 Carbachol, CCh
Carbachol (CCh) is a drug that mimics the action of acetylcholine. It stimulates
the muscarinic receptors, and enhances contractions by releasing Ca2+ from the
SR store in many organs. It is commonly used as a medication to treat different
ophthalmic problems, and also to increase the strength of muscle contractions in
bladders. In research, carbachol is used extensively in various types of smooth
muscles from different organs including intestine [173], uterus [161,174–177] and
cervix [178]. This drug is not well absorbed in the gastro-intestinal tract and
although the use of carbachol for dilatation of the cervix have been demonstrated
in cows [178], there is no known medication existed for the human pregnant
uterus.
Experiments demonstrated by Burdyga et al. [161] showed that 21-day preg-
nant rat myometrial cells treated with carbachol have a 30-40% increase in max-
imal force. When carbachol was removed, the frequency and amplitude of the
Ca2+ spikes decreased until it reached equilibrium. The effect of carbachol was
replicated in simulations by increasing the probability of Ca2+ release from the
SR store to one. A train of stimulus current pulse was applied to the model (from
0 to -5 pA/pF) at t = 12 s to t = 58 s, the effect of carbachol was introduced at
t = 12 s and removed at t = 50 s. The cell was held at 0 pA/pF for a further
55 s before the end of the simulation. It is observed that carbachol increased
the magnitude of the force as shown in figure 5.5, and the amplitude dropped
when the effect of carbachol was withdrawn, as expected. The amplitude was
decreased by 2.4% in Ca2+ spikes and 0.5% in contractile force when carbachol
was removed.
147
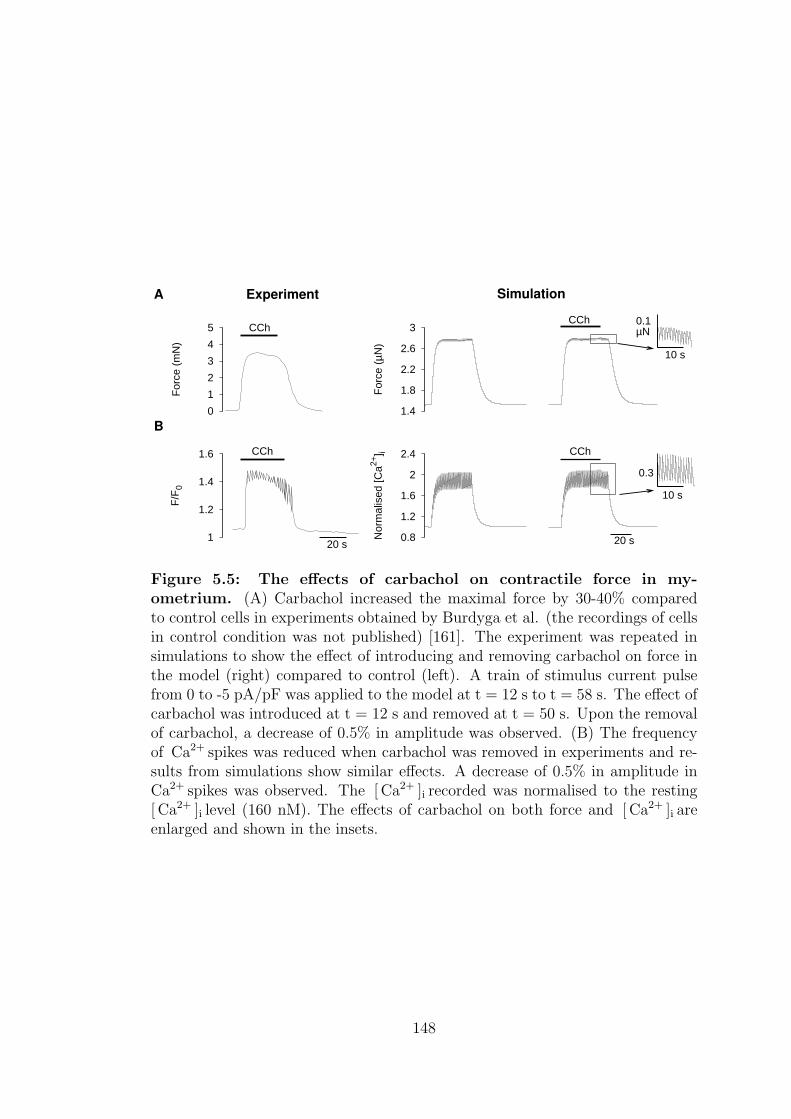
0
1
2
3
4
5
For
ce (
mN
)
A
CCh
Experiment
1.4
1.8
2.2
2.6
3
For
ce (
µN)
CCh
Simulation
1
1.2
1.4
1.6
F/F
0
B
20 s
CCh
0.8
1.2
1.6
2
2.4
Nor
mal
ised
[Ca2+
] i
20 s
CCh
0.1µN
10 s
0.3
10 s
Figure 5.5: The effects of carbachol on contractile force in my-ometrium. (A) Carbachol increased the maximal force by 30-40% comparedto control cells in experiments obtained by Burdyga et al. (the recordings of cellsin control condition was not published) [161]. The experiment was repeated insimulations to show the effect of introducing and removing carbachol on force inthe model (right) compared to control (left). A train of stimulus current pulsefrom 0 to -5 pA/pF was applied to the model at t = 12 s to t = 58 s. The effect ofcarbachol was introduced at t = 12 s and removed at t = 50 s. Upon the removalof carbachol, a decrease of 0.5% in amplitude was observed. (B) The frequencyof Ca2+ spikes was reduced when carbachol was removed in experiments and re-sults from simulations show similar effects. A decrease of 0.5% in amplitude inCa2+ spikes was observed. The [ Ca2+ ]i recorded was normalised to the resting[ Ca2+ ]i level (160 nM). The effects of carbachol on both force and [ Ca2+ ]i areenlarged and shown in the insets.
148
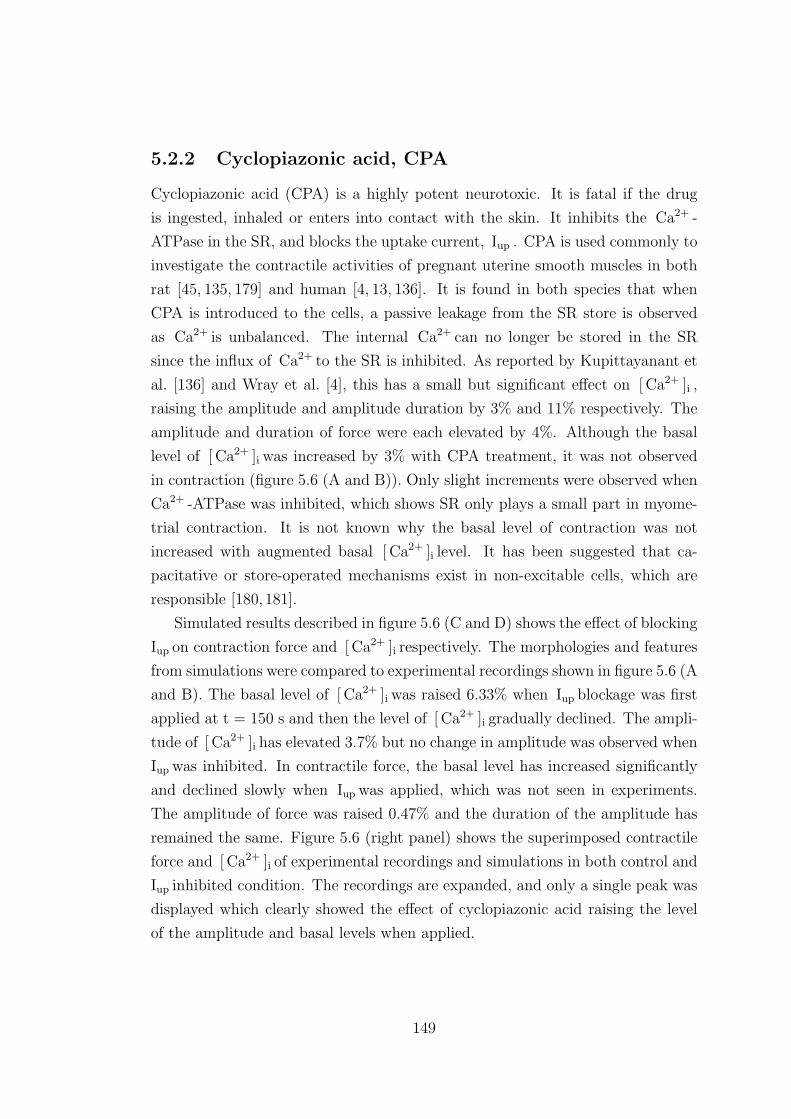
5.2.2 Cyclopiazonic acid, CPA
Cyclopiazonic acid (CPA) is a highly potent neurotoxic. It is fatal if the drug
is ingested, inhaled or enters into contact with the skin. It inhibits the Ca2+ -
ATPase in the SR, and blocks the uptake current, Iup . CPA is used commonly to
investigate the contractile activities of pregnant uterine smooth muscles in both
rat [45, 135, 179] and human [4, 13, 136]. It is found in both species that when
CPA is introduced to the cells, a passive leakage from the SR store is observed
as Ca2+ is unbalanced. The internal Ca2+ can no longer be stored in the SR
since the influx of Ca2+ to the SR is inhibited. As reported by Kupittayanant et
al. [136] and Wray et al. [4], this has a small but significant effect on [ Ca2+ ]i ,
raising the amplitude and amplitude duration by 3% and 11% respectively. The
amplitude and duration of force were each elevated by 4%. Although the basal
level of [ Ca2+ ]i was increased by 3% with CPA treatment, it was not observed
in contraction (figure 5.6 (A and B)). Only slight increments were observed when
Ca2+ -ATPase was inhibited, which shows SR only plays a small part in myome-
trial contraction. It is not known why the basal level of contraction was not
increased with augmented basal [ Ca2+ ]i level. It has been suggested that ca-
pacitative or store-operated mechanisms exist in non-excitable cells, which are
responsible [180,181].
Simulated results described in figure 5.6 (C and D) shows the effect of blocking
Iup on contraction force and [ Ca2+ ]i respectively. The morphologies and features
from simulations were compared to experimental recordings shown in figure 5.6 (A
and B). The basal level of [ Ca2+ ]i was raised 6.33% when Iup blockage was first
applied at t = 150 s and then the level of [ Ca2+ ]i gradually declined. The ampli-
tude of [ Ca2+ ]i has elevated 3.7% but no change in amplitude was observed when
Iup was inhibited. In contractile force, the basal level has increased significantly
and declined slowly when Iup was applied, which was not seen in experiments.
The amplitude of force was raised 0.47% and the duration of the amplitude has
remained the same. Figure 5.6 (right panel) shows the superimposed contractile
force and [ Ca2+ ]i of experimental recordings and simulations in both control and
Iup inhibited condition. The recordings are expanded, and only a single peak was
displayed which clearly showed the effect of cyclopiazonic acid raising the level
of the amplitude and basal levels when applied.
149
0
10
20
30
For
ce (
mN
)
A CPA
0.4
0.6
0.8
1
1.2
Indo
-1R
atio
B
5 mins
CPA
CPA
1 min
2
2.4
2.8
3.2
For
ce (
µN)
C CPA
155
175
195
215
[Ca2+
] i (n
M)
D
1 min
CPA
10 s
CPA
Figure 5.6: The activity of contraction and [ Ca2+ ]i with presenceof CPA. The effect of cyclopiazonic acid (CPA) on both contraction and[ Ca2+ ]i were examined. Experimental recordings (A and B) showed raised[ Ca2+ ]i basal level but not in contractile force when CPA was applied. Theamplitude and its duration were both increased with the presence of CPA. Insimulations, the model was stimulated by a train of current-pulses from 0 to -5pA/pF with pulse duration of 20 ms and basic cycle length of 30 s. Iup was in-hibited at t = 150 s until the end of the simulation at 300 s. The basal level andamplitude of both [ Ca2+ ]i transient and contractile force were increased, whereasthe amplitude durations were unchanged when Iup was blocked. Superimposedforce and cai (right panel) in control (black), and in the presence of cyclopiazonicacid (red), demonstrated the effect of inhibiting Iup when CPA was applied.
150
5.2.3 Nifedipine, NI
As discussed in the previous section, nifedipine (NI) is an L-type Ca2+ channel
blocker. When nifedipine was applied to myometrial cells, no rise in [ Ca2+ ]i was
observed and the peak of ICa−tot was abolished [13]. Contractile force was also
abolished with cells pre-treated with nifedipine [45, 161]. Results in human
myometrium at term obtained from Parkington et al. [25] showed that both
[ Ca2+ ]i and tension development were abolished even with the presence of prostaglandins
E2 (PGE, a naturally occurring drug which causes contraction and labour in my-
ometrium [182, 183]). Simulations were carried out to investigate the effect of
inhibiting ICaL on contractile force (figure 5.7). Both contractile force and nor-
malised force were greatly diminished (by 72.24% and 99.36% respectively) com-
pare to control cases, although a small rise of force was still seen, while the peaks
in experimental recordings were completely abolished. This small rise is thought
to be the ICaT contribution to the contractile force in the model. The results in
simulations confirm Ca2+ entry through L-type Ca2+ channel plays an important
role in generating contractile force.
5.2.4 Wortmannin, W
Wortmannin is a toxin which inhibits MLCK. It is standalone or combined with
therapy to treat various type cancerous cells as wortmannin inhibits DNA repair-
ing and cell proliferating. However there is no known medication which exists for
treatments in pregnant myometrium. Experimental recordings showed that wort-
mannin gradually abolished spontaneous contractions in oxytocin-induced and
non-induced rat myometrial cells [13, 184]. It was reported that while current
tracings of ICa−tot revealed that ICa−tot showed no signs of differentiation when
cells were treated with wortmannin, contractile force in wortmannin treated cells
was decreased by 12 ± 1% in rat and 37 ± 8% in human [184]. Results simulated
by the model with a shorter simulation time, illustrated in figure 5.8, showed
that contractile force was completely abolished almost instantaneously and no
further contractions were seen when the Ca2+ -calmodulin-MLCK process was
inhibited. However, the level of [ Ca2+ ]i was not affected. There were no signs
of change observed either in ICa−tot indicating MLCK is an essential process in
force generation, consistent with the experiment data.
151
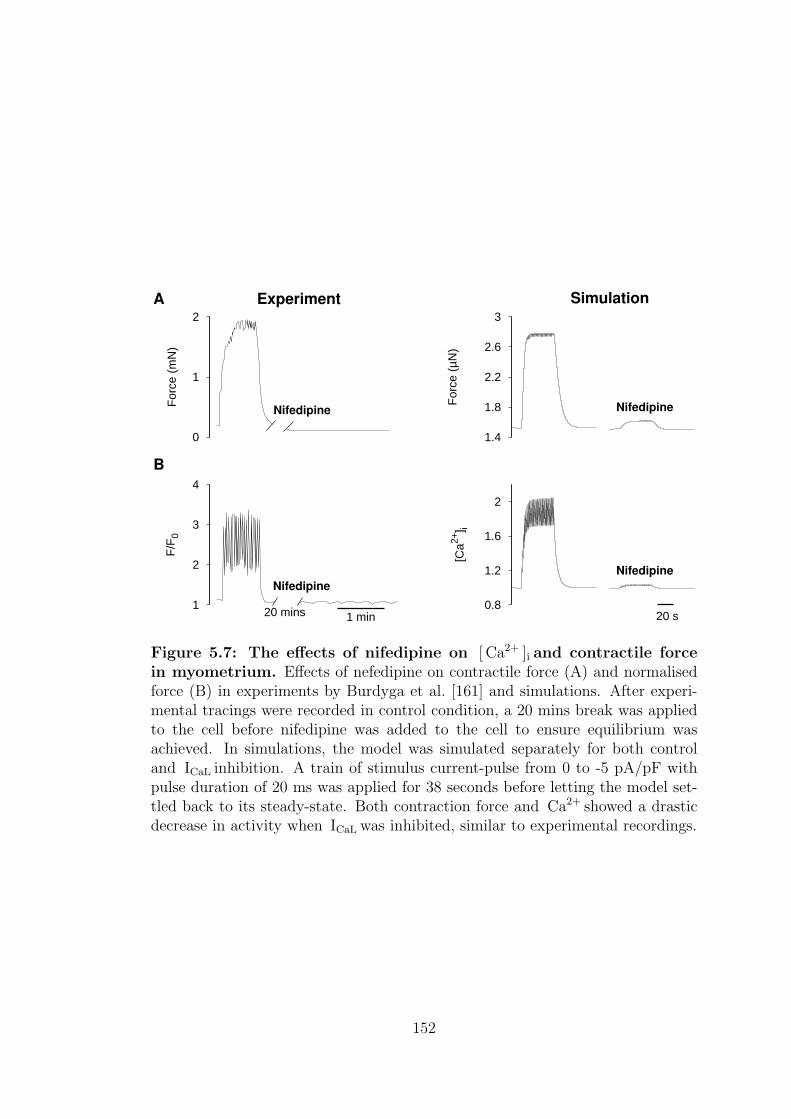
0
1
2
For
ce (
mN
)
A Experiment
Nifedipine
1.4
1.8
2.2
2.6
3
For
ce (
µN)
Nifedipine
Simulation
1
2
3
4
F/F
0
B
1 min20 mins
Nifedipine
0.8
1.2
1.6
2
[Ca2+
] i
20 s
Nifedipine
Figure 5.7: The effects of nifedipine on [ Ca2+ ]i and contractile forcein myometrium. Effects of nefedipine on contractile force (A) and normalisedforce (B) in experiments by Burdyga et al. [161] and simulations. After experi-mental tracings were recorded in control condition, a 20 mins break was appliedto the cell before nifedipine was added to the cell to ensure equilibrium wasachieved. In simulations, the model was simulated separately for both controland ICaL inhibition. A train of stimulus current-pulse from 0 to -5 pA/pF withpulse duration of 20 ms was applied for 38 seconds before letting the model set-tled back to its steady-state. Both contraction force and Ca2+ showed a drasticdecrease in activity when ICaL was inhibited, similar to experimental recordings.
152
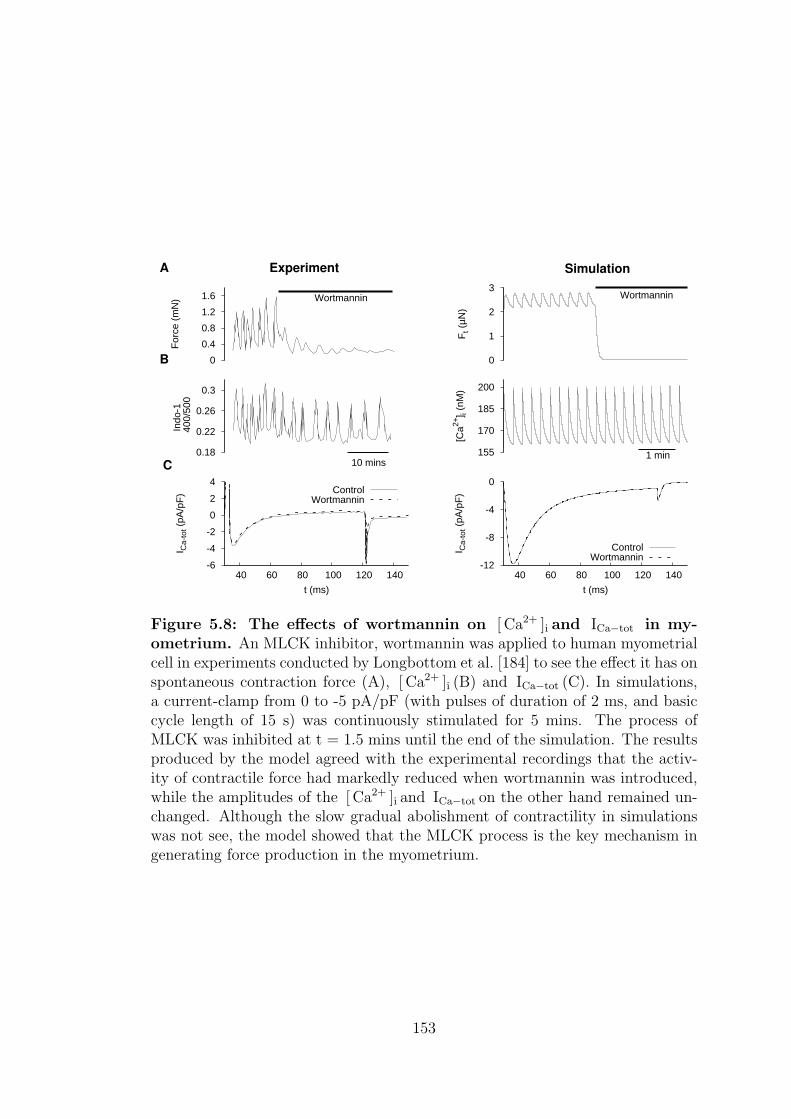
0
0.4
0.8
1.2
1.6
For
ce (
mN
)
A
Wortmannin
Experiment
0
1
2
3
Ft (
µN)
Wortmannin
Simulation
0.18
0.22
0.26
0.3
Indo
-1
400
/500
B
10 mins 155
170
185
200
[Ca2+
] i (n
M)
1 min
-6
-4
-2
0
2
4
40 60 80 100 120 140
I Ca-
tot (
pA/p
F)
t (ms)
C
ControlWortmannin
-12
-8
-4
0
40 60 80 100 120 140
I Ca-
tot (
pA/p
F)
t (ms)
ControlWortmannin
Figure 5.8: The effects of wortmannin on [ Ca2+ ]i and ICa−tot in my-ometrium. An MLCK inhibitor, wortmannin was applied to human myometrialcell in experiments conducted by Longbottom et al. [184] to see the effect it has onspontaneous contraction force (A), [ Ca2+ ]i (B) and ICa−tot (C). In simulations,a current-clamp from 0 to -5 pA/pF (with pulses of duration of 2 ms, and basiccycle length of 15 s) was continuously stimulated for 5 mins. The process ofMLCK was inhibited at t = 1.5 mins until the end of the simulation. The resultsproduced by the model agreed with the experimental recordings that the activ-ity of contractile force had markedly reduced when wortmannin was introduced,while the amplitudes of the [ Ca2+ ]i and ICa−tot on the other hand remained un-changed. Although the slow gradual abolishment of contractility in simulationswas not see, the model showed that the MLCK process is the key mechanism ingenerating force production in the myometrium.
153
5.2.5 Calcium-free solution
The effects of 0-Ca solution on contractile force and intracellular calcium in
myometrium have been demonstrated extensively in experiments with or with-
out other application of drugs [4, 13, 45, 135, 136, 179]. In simulations, this was
achieved by changing the level of extracellular calcium, [ Ca2+ ]o to a very small
value (1 × 10⁻¹⁰ nM) instead of zero to avoid mathematical errors in equations.
For example when calculating the reversal potentials of ionic currents, setting
[ Ca2+ ]o equals to zero is mathematically impossible. Simulated results described
in figure 5.9, show that the total contractile force declined to zero when 0-Ca
condition was applied and raised back to its original level when the 0-Ca con-
dition was lifted. In experiments, contractile force was instantaneously abol-
ished when 0-Ca solution was applied. The level of [ Ca2+ ]i slowly decreased in
both experiments and simulations as the balanced Ca2+ of the cell was restored
naturally. This confirms the importance of external Ca2+ in contractions. No
[ Ca2+ ]i transient and therefore no force was produced as there was no Ca2+ influx
from extracellular space via voltage-dependent calcium channels.
154
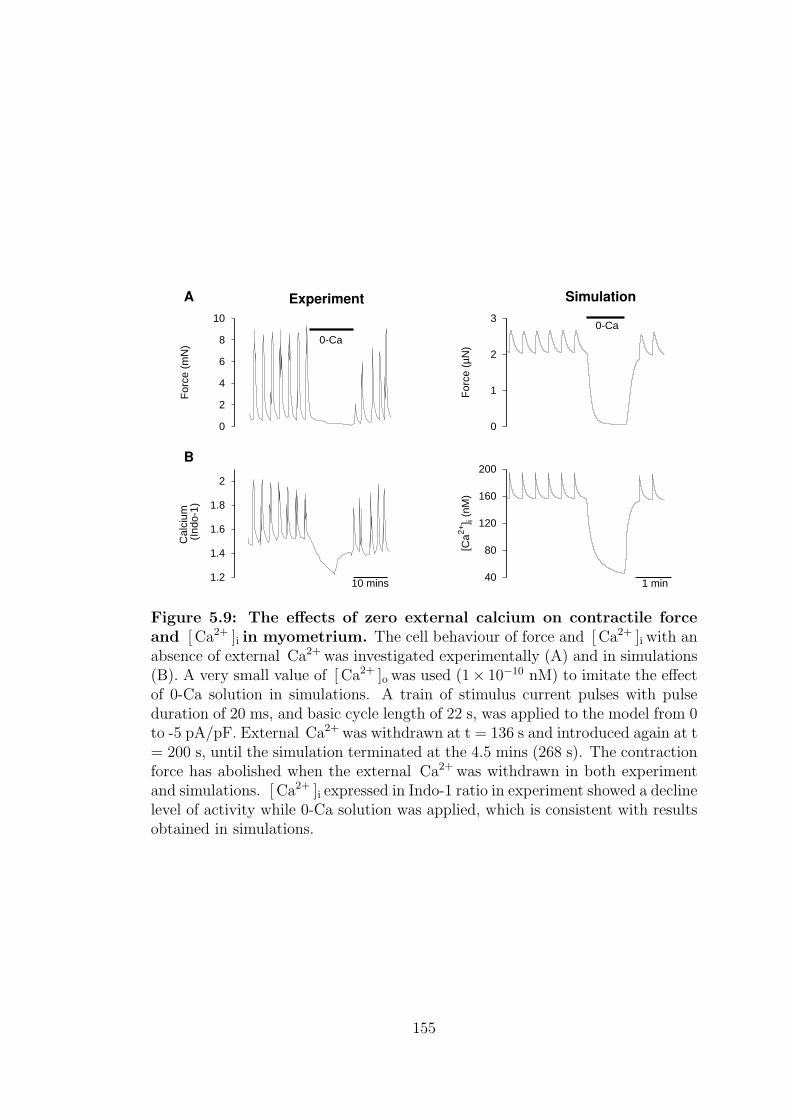
0
2
4
6
8
10
For
ce (
mN
)
A
0-Ca
Experiment
0
1
2
3
For
ce (
µN)
0-Ca
Simulation
1.2
1.4
1.6
1.8
2
Cal
cium
(
Indo
-1)
B
10 mins 40
80
120
160
200[C
a2+] i
(nM
)
1 min
Figure 5.9: The effects of zero external calcium on contractile forceand [ Ca2+ ]i in myometrium. The cell behaviour of force and [ Ca2+ ]i with anabsence of external Ca2+ was investigated experimentally (A) and in simulations(B). A very small value of [ Ca2+ ]o was used (1× 10⁻¹⁰ nM) to imitate the effectof 0-Ca solution in simulations. A train of stimulus current pulses with pulseduration of 20 ms, and basic cycle length of 22 s, was applied to the model from 0to -5 pA/pF. External Ca2+ was withdrawn at t = 136 s and introduced again at t= 200 s, until the simulation terminated at the 4.5 mins (268 s). The contractionforce has abolished when the external Ca2+ was withdrawn in both experimentand simulations. [ Ca2+ ]i expressed in Indo-1 ratio in experiment showed a declinelevel of activity while 0-Ca solution was applied, which is consistent with resultsobtained in simulations.
155
Chapter 6
Sensitivity analysis
During pregnancy, the length, weight, depth, volume and the capacity of the
uterus change to accommodate the growth of the foetus. This growth also in-
volves cell hypotrophy and hyperplasia. Throughout the pregnancy, remodelling
of some ionic channels occurs to increase the contractility in the uterus as pre-
viously discussed in chapter 1. It is found that the number of L-type calcium
channels and sodium channels increase during mid- and late-pregnancy respec-
tively [27], while the number of calcium-activated potassium channels, IKCa loses
sensitivity with labour [17]. The number of non-specific cation channels also seem
to have decreased towards the end of the pregnancy. Levels of progesterone de-
clined markedly and levels of estradiol start increasing towards the late pregnancy
and markedly rise on the day of parturition [185, 186]. The number of oxytocin
receptors also increase [17, 187] towards parturition. The resting membrane po-
tential of the cell increased from -52 to -46 mV during delivery [188] and there
are also a slight different in the ionic content of the cell due to the changes in sex
hormone levels during pregnancy [189].
In a tissue level, the number of gap junctions increases [190], while the to-
tal tissue and the gap junction resistances decreases towards delivery. Histologic
analysis of myometrial tissue strips showed an elevated level of the cellular frac-
tion, but areas of the nuclei decreases in pregnant myometrium [191]. This im-
proves the transmission of the electrical signal through out the whole organ. The
physiological balance of the uterus is particularly vital towards the late pregnancy
to ensure a synchronised contraction during delivery.
Since the uterus undergoes enormous physiological and structural changes
before, during, and even after pregnancies, a sensitivity analysis was carried out
156
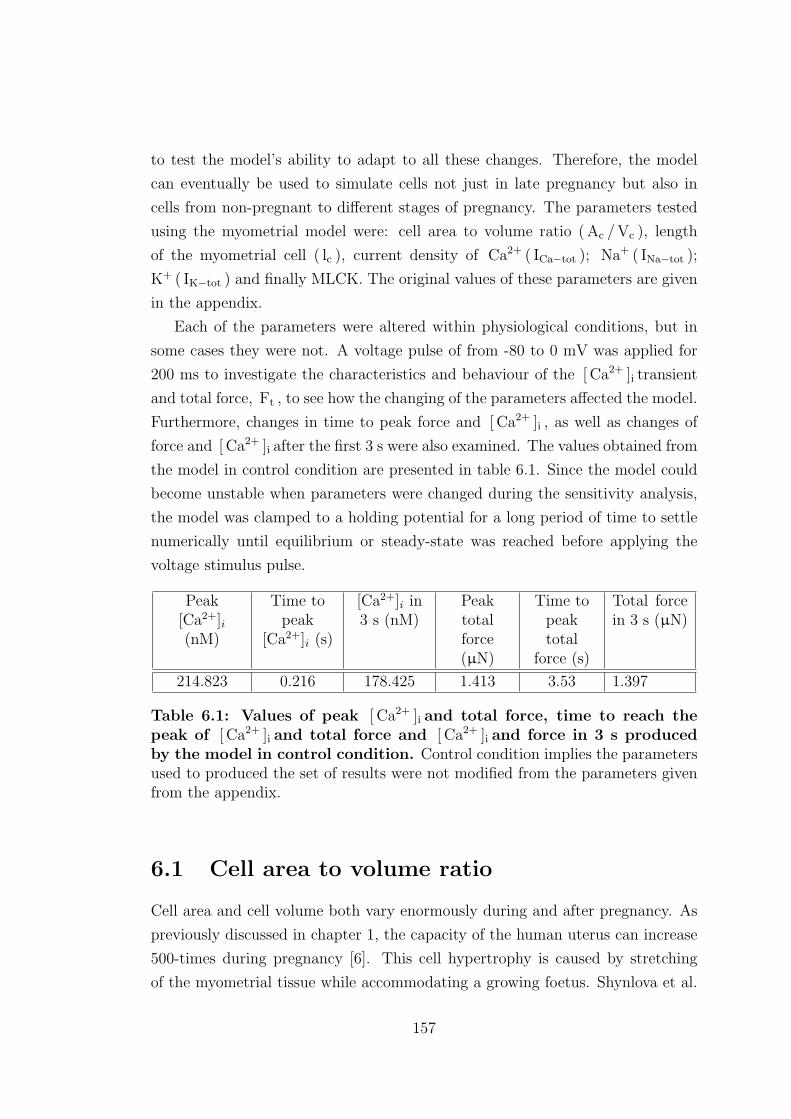
to test the model’s ability to adapt to all these changes. Therefore, the model
can eventually be used to simulate cells not just in late pregnancy but also in
cells from non-pregnant to different stages of pregnancy. The parameters tested
using the myometrial model were: cell area to volume ratio (Ac /Vc ), length
of the myometrial cell ( lc ), current density of Ca2+ ( ICa−tot ); Na+ ( INa−tot );
K+ ( IK−tot ) and finally MLCK. The original values of these parameters are given
in the appendix.
Each of the parameters were altered within physiological conditions, but in
some cases they were not. A voltage pulse of from -80 to 0 mV was applied for
200 ms to investigate the characteristics and behaviour of the [ Ca2+ ]i transient
and total force, Ft , to see how the changing of the parameters affected the model.
Furthermore, changes in time to peak force and [ Ca2+ ]i , as well as changes of
force and [ Ca2+ ]i after the first 3 s were also examined. The values obtained from
the model in control condition are presented in table 6.1. Since the model could
become unstable when parameters were changed during the sensitivity analysis,
the model was clamped to a holding potential for a long period of time to settle
numerically until equilibrium or steady-state was reached before applying the
voltage stimulus pulse.
Peak[Ca2+]i(nM)
Time topeak
[Ca2+]i (s)
[Ca2+]i in3 s (nM)
Peaktotalforce(µN)
Time topeaktotal
force (s)
Total forcein 3 s (µN)
214.823 0.216 178.425 1.413 3.53 1.397
Table 6.1: Values of peak [ Ca2+ ]i and total force, time to reach thepeak of [ Ca2+ ]i and total force and [ Ca2+ ]i and force in 3 s producedby the model in control condition. Control condition implies the parametersused to produced the set of results were not modified from the parameters givenfrom the appendix.
6.1 Cell area to volume ratio
Cell area and cell volume both vary enormously during and after pregnancy. As
previously discussed in chapter 1, the capacity of the human uterus can increase
500-times during pregnancy [6]. This cell hypertrophy is caused by stretching
of the myometrial tissue while accommodating a growing foetus. Shynlova et al.
157
conducted a stereological analysis on cell volume changes throughout different
gestations in rats [192]. From non-pregnant to early days of pregnancy (day 8),
it was reported that the size and the volume of a uterine cell showed very little
differences and the cell volumes were 264±112µm3 and 245±90µm3 respectively.
The cell volume began to increase towards the middle of the pregnancy and on
day 14, the cell volume was 448 ± 225µm3. The volume of the cell continued
to grow in late pregnancy and reached 771 ± 402µm3 and 716 ± 364µm3 in day
19 and day 22. However, there was no change in size from the last state of the
pregnancy till term to stabilise the uterus and the foetus. Four days after the
delivery, it was found that the myometrial cell volume was 296± 101µm3. It was
reported by Yoshino et al. that the surface area of a rat myometrial cell increased
from 928.4±235.1 and 5193±188.4 to 7599.4±639.7 µm2 in non-pregnant, mid-
pregnant and late pregnant cells.
In a modelling environment, a sensitivity analysis was carried out to provide
a prediction on physiological responses with various values cell area to volume
ratio. This gives an insight into whether the model potentially be adapted to
simulate cells from different gestation of the pregnancy or even post-parturition.
The model’s response to the changing value of Ac /Vc is shown in figure 6.1.
It is clearly seen that when Ac /Vc was increased 150%, the peak and the resting
level of [ Ca2+ ]i transient increased significantly (about 125%) compared to values
from control condition. It took a longer time for [ Ca2+ ]i to reach its peak with de-
creasing Ac / Vc , although the results were not apparent. The [ Ca2+ ]i transient
also decayed at a slower rate when Ac /Vc decreased.
The time taken for the contraction to reach its peak was noticeably faster
(about 40%) and stronger force was generated (about 90%) when Ac /Vc was aug-
mented by 50% its original values. However, when the magnitude of Ac /Vc was
dropped to 75% of its original value, the strength of the contraction fell dras-
tically and only a slight rise in force was observed when the voltage pulse was
applied. The actual changes recorded are presented in table 6.2.
6.2 Length of the myometrial cell
The changes of the length of a myometrial cell results from hypertrophy and
stretch during pregnancy. Mollard et al. found that the length of a freshly
dissociated late-pregnant longitudinal myometrial cell in rat was 80 to 300 µm,
158
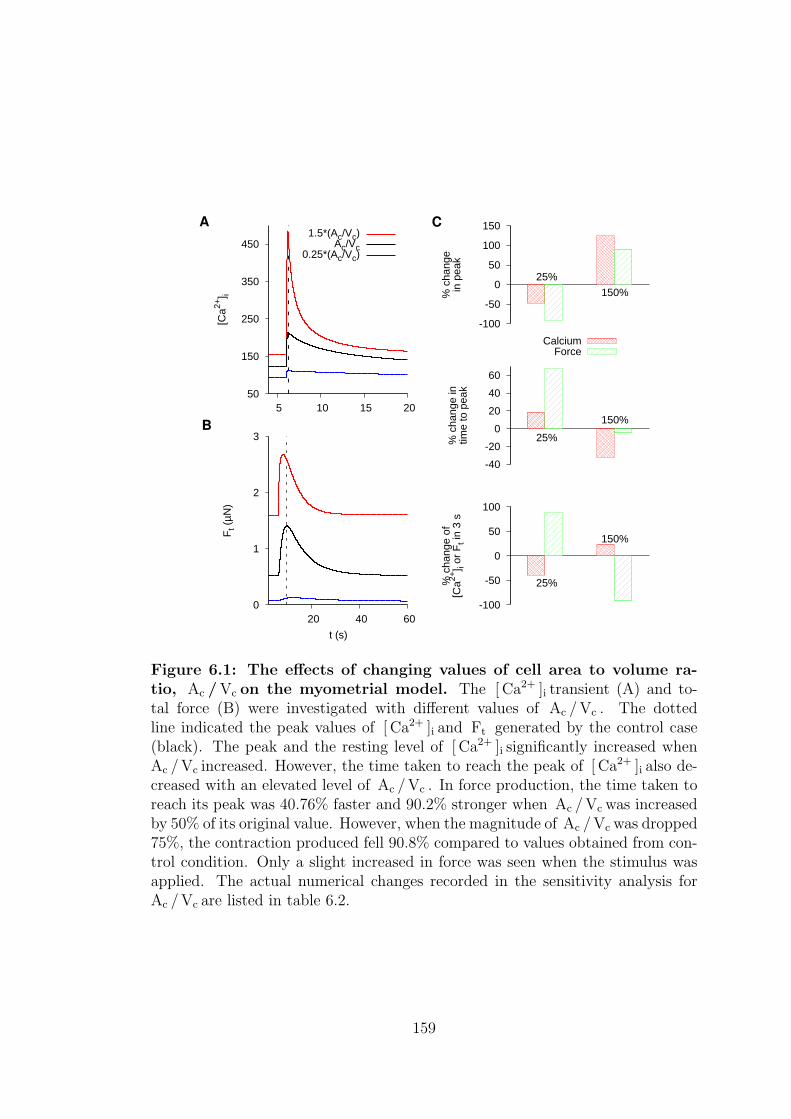
50
150
250
350
450
5 10 15 20
[Ca2+
] iA
1.5*(Ac/Vc)Ac/Vc
0.25*(Ac/Vc)
0
1
2
3
20 40 60
Ft (
µN)
t (s)
B
-100
-50
0
50
100
150
% c
hang
ein
pea
k
25%
150%
C
CalciumForce
-40
-20
0
20
40
60
% c
hang
e in
time
to p
eak
25%
150%
-100
-50
0
50
100
% c
hang
e of
[Ca2+
] i or
Ft i
n 3
s
25%
150%
Figure 6.1: The effects of changing values of cell area to volume ra-tio, Ac / Vc on the myometrial model. The [ Ca2+ ]i transient (A) and to-tal force (B) were investigated with different values of Ac /Vc . The dottedline indicated the peak values of [ Ca2+ ]i and Ft generated by the control case(black). The peak and the resting level of [ Ca2+ ]i significantly increased whenAc /Vc increased. However, the time taken to reach the peak of [ Ca2+ ]i also de-creased with an elevated level of Ac /Vc . In force production, the time taken toreach its peak was 40.76% faster and 90.2% stronger when Ac /Vc was increasedby 50% of its original value. However, when the magnitude of Ac /Vc was dropped75%, the contraction produced fell 90.8% compared to values obtained from con-trol condition. Only a slight increased in force was seen when the stimulus wasapplied. The actual numerical changes recorded in the sensitivity analysis forAc /Vc are listed in table 6.2.
159
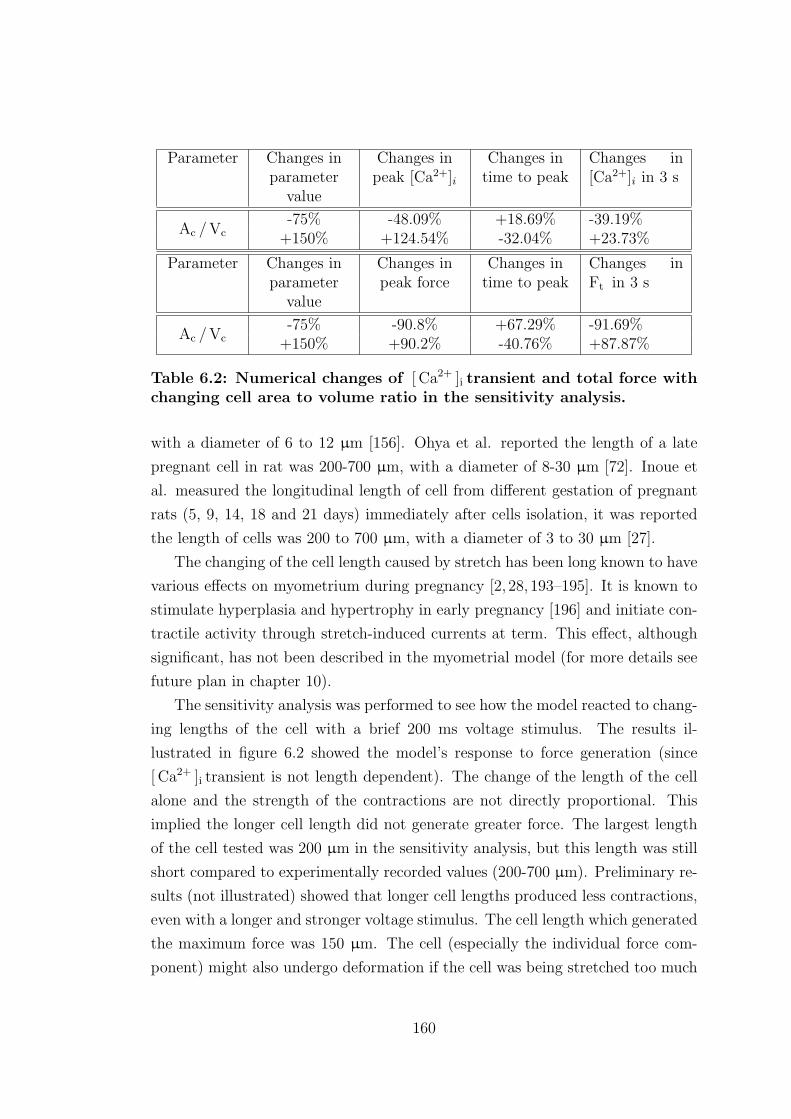
Parameter Changes inparameter
value
Changes inpeak [Ca2+]i
Changes intime to peak
Changes in[Ca2+]i in 3 s
Ac /Vc-75% -48.09% +18.69% -39.19%
+150% +124.54% -32.04% +23.73%
Parameter Changes inparameter
value
Changes inpeak force
Changes intime to peak
Changes inFt in 3 s
Ac /Vc-75% -90.8% +67.29% -91.69%
+150% +90.2% -40.76% +87.87%
Table 6.2: Numerical changes of [ Ca2+ ]i transient and total force withchanging cell area to volume ratio in the sensitivity analysis.
with a diameter of 6 to 12 µm [156]. Ohya et al. reported the length of a late
pregnant cell in rat was 200-700 µm, with a diameter of 8-30 µm [72]. Inoue et
al. measured the longitudinal length of cell from different gestation of pregnant
rats (5, 9, 14, 18 and 21 days) immediately after cells isolation, it was reported
the length of cells was 200 to 700 µm, with a diameter of 3 to 30 µm [27].
The changing of the cell length caused by stretch has been long known to have
various effects on myometrium during pregnancy [2, 28, 193–195]. It is known to
stimulate hyperplasia and hypertrophy in early pregnancy [196] and initiate con-
tractile activity through stretch-induced currents at term. This effect, although
significant, has not been described in the myometrial model (for more details see
future plan in chapter 10).
The sensitivity analysis was performed to see how the model reacted to chang-
ing lengths of the cell with a brief 200 ms voltage stimulus. The results il-
lustrated in figure 6.2 showed the model’s response to force generation (since
[ Ca2+ ]i transient is not length dependent). The change of the length of the cell
alone and the strength of the contractions are not directly proportional. This
implied the longer cell length did not generate greater force. The largest length
of the cell tested was 200 µm in the sensitivity analysis, but this length was still
short compared to experimentally recorded values (200-700 µm). Preliminary re-
sults (not illustrated) showed that longer cell lengths produced less contractions,
even with a longer and stronger voltage stimulus. The cell length which generated
the maximum force was 150 µm. The cell (especially the individual force com-
ponent) might also undergo deformation if the cell was being stretched too much
160
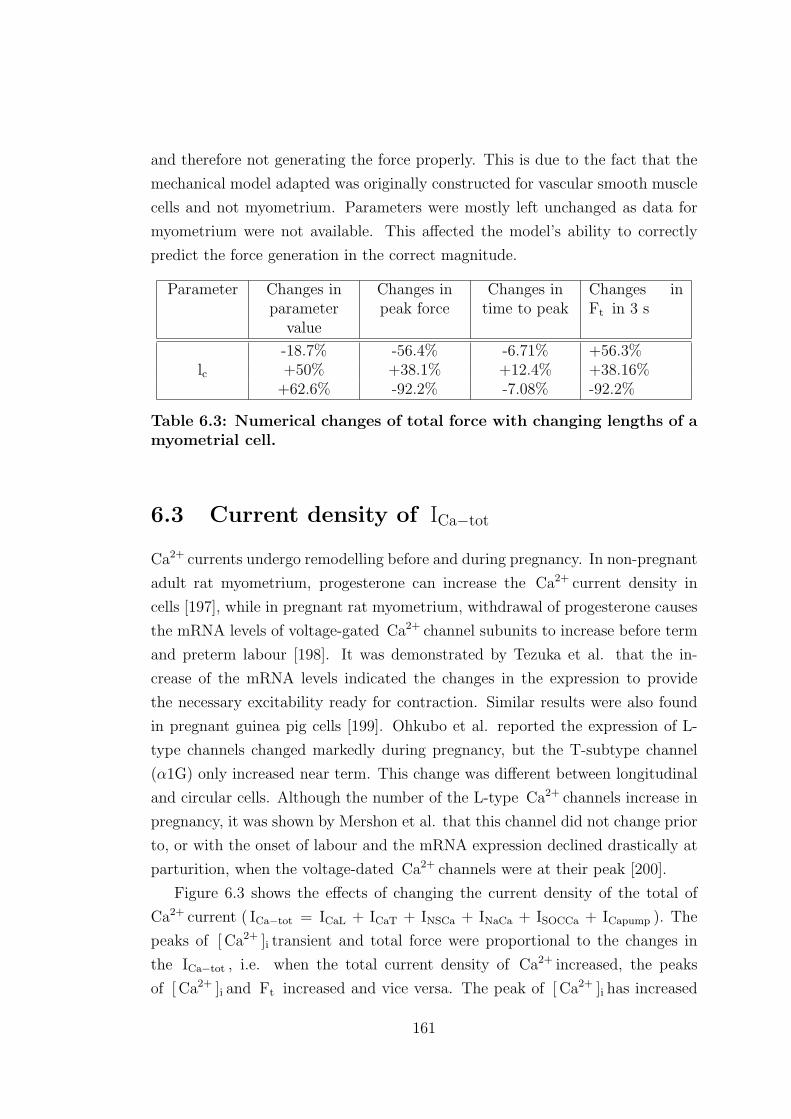
and therefore not generating the force properly. This is due to the fact that the
mechanical model adapted was originally constructed for vascular smooth muscle
cells and not myometrium. Parameters were mostly left unchanged as data for
myometrium were not available. This affected the model’s ability to correctly
predict the force generation in the correct magnitude.
Parameter Changes inparameter
value
Changes inpeak force
Changes intime to peak
Changes inFt in 3 s
lc
-18.7% -56.4% -6.71% +56.3%+50% +38.1% +12.4% +38.16%
+62.6% -92.2% -7.08% -92.2%
Table 6.3: Numerical changes of total force with changing lengths of amyometrial cell.
6.3 Current density of ICa−tot
Ca2+ currents undergo remodelling before and during pregnancy. In non-pregnant
adult rat myometrium, progesterone can increase the Ca2+ current density in
cells [197], while in pregnant rat myometrium, withdrawal of progesterone causes
the mRNA levels of voltage-gated Ca2+ channel subunits to increase before term
and preterm labour [198]. It was demonstrated by Tezuka et al. that the in-
crease of the mRNA levels indicated the changes in the expression to provide
the necessary excitability ready for contraction. Similar results were also found
in pregnant guinea pig cells [199]. Ohkubo et al. reported the expression of L-
type channels changed markedly during pregnancy, but the T-subtype channel
(α1G) only increased near term. This change was different between longitudinal
and circular cells. Although the number of the L-type Ca2+ channels increase in
pregnancy, it was shown by Mershon et al. that this channel did not change prior
to, or with the onset of labour and the mRNA expression declined drastically at
parturition, when the voltage-dated Ca2+ channels were at their peak [200].
Figure 6.3 shows the effects of changing the current density of the total of
Ca2+ current ( ICa−tot = ICaL + ICaT + INSCa + INaCa + ISOCCa + ICapump ). The
peaks of [ Ca2+ ]i transient and total force were proportional to the changes in
the ICa−tot , i.e. when the total current density of Ca2+ increased, the peaks
of [ Ca2+ ]i and Ft increased and vice versa. The peak of [ Ca2+ ]i has increased
161
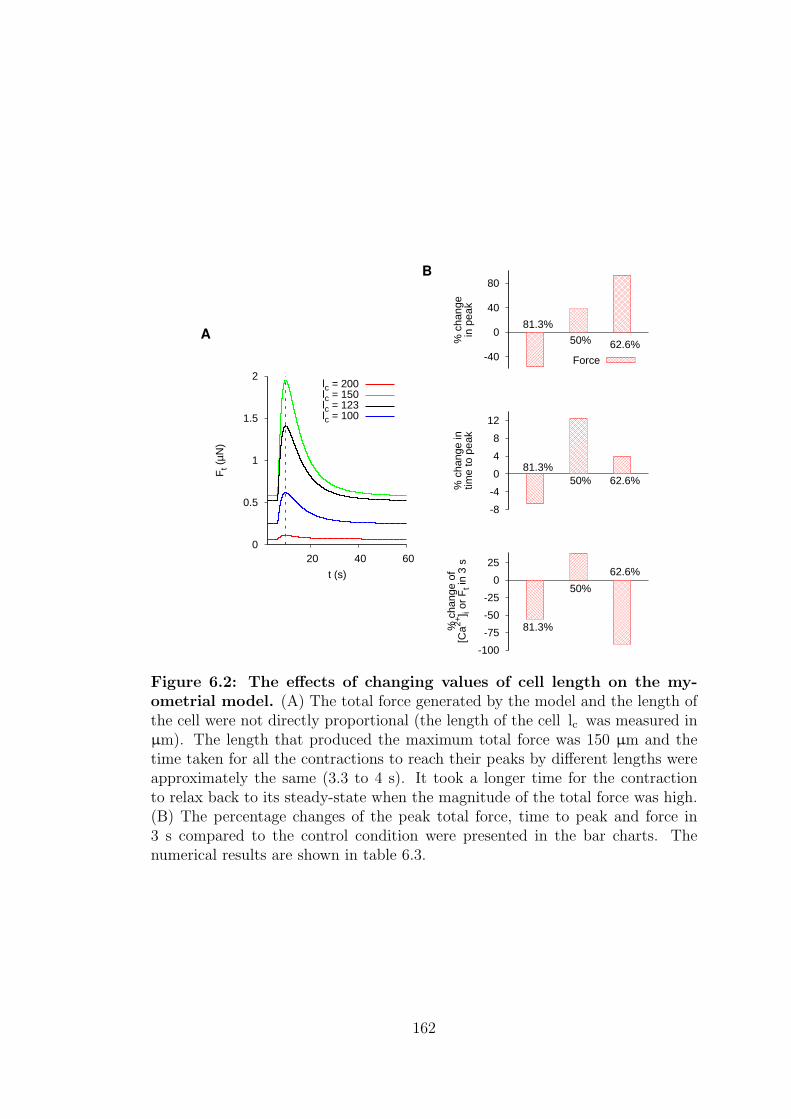
0
0.5
1
1.5
2
20 40 60
Ft (
µN)
t (s)
A
lc = 200lc = 150lc = 123lc = 100
-40
0
40
80
% c
hang
ein
pea
k
81.3%
50% 62.6%
B
Force
-8
-4
0
4
8
12
% c
hang
e in
time
to p
eak
81.3%50% 62.6%
-100
-75
-50
-25
0
25
% c
hang
e of
[Ca2+
] i or
Ft i
n 3
s
81.3%
50%
62.6%
Figure 6.2: The effects of changing values of cell length on the my-ometrial model. (A) The total force generated by the model and the length ofthe cell were not directly proportional (the length of the cell lc was measured inµm). The length that produced the maximum total force was 150 µm and thetime taken for all the contractions to reach their peaks by different lengths wereapproximately the same (3.3 to 4 s). It took a longer time for the contractionto relax back to its steady-state when the magnitude of the total force was high.(B) The percentage changes of the peak total force, time to peak and force in3 s compared to the control condition were presented in the bar charts. Thenumerical results are shown in table 6.3.
162
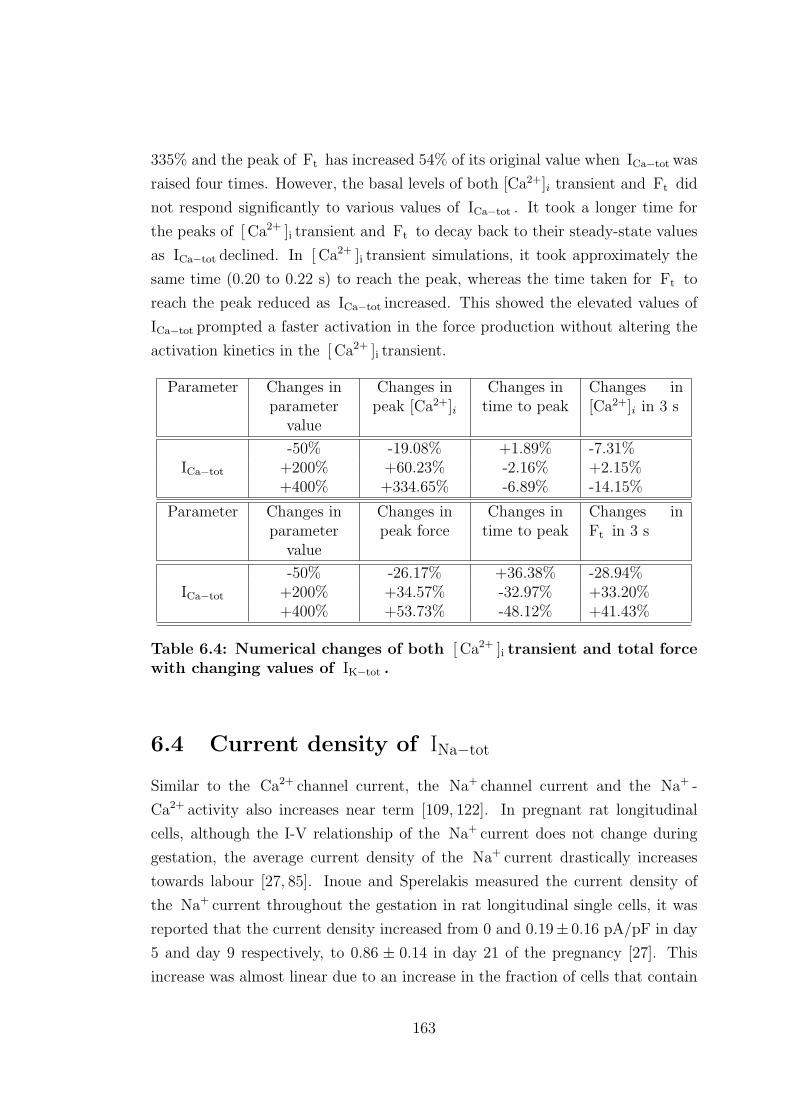
335% and the peak of Ft has increased 54% of its original value when ICa−tot was
raised four times. However, the basal levels of both [Ca2+]i transient and Ft did
not respond significantly to various values of ICa−tot . It took a longer time for
the peaks of [ Ca2+ ]i transient and Ft to decay back to their steady-state values
as ICa−tot declined. In [ Ca2+ ]i transient simulations, it took approximately the
same time (0.20 to 0.22 s) to reach the peak, whereas the time taken for Ft to
reach the peak reduced as ICa−tot increased. This showed the elevated values of
ICa−tot prompted a faster activation in the force production without altering the
activation kinetics in the [ Ca2+ ]i transient.
Parameter Changes inparameter
value
Changes inpeak [Ca2+]i
Changes intime to peak
Changes in[Ca2+]i in 3 s
ICa−tot
-50% -19.08% +1.89% -7.31%+200% +60.23% -2.16% +2.15%+400% +334.65% -6.89% -14.15%
Parameter Changes inparameter
value
Changes inpeak force
Changes intime to peak
Changes inFt in 3 s
ICa−tot
-50% -26.17% +36.38% -28.94%+200% +34.57% -32.97% +33.20%+400% +53.73% -48.12% +41.43%
Table 6.4: Numerical changes of both [ Ca2+ ]i transient and total forcewith changing values of IK−tot .
6.4 Current density of INa−tot
Similar to the Ca2+ channel current, the Na+ channel current and the Na+ -
Ca2+ activity also increases near term [109, 122]. In pregnant rat longitudinal
cells, although the I-V relationship of the Na+ current does not change during
gestation, the average current density of the Na+ current drastically increases
towards labour [27, 85]. Inoue and Sperelakis measured the current density of
the Na+ current throughout the gestation in rat longitudinal single cells, it was
reported that the current density increased from 0 and 0.19± 0.16 pA/pF in day
5 and day 9 respectively, to 0.86 ± 0.14 in day 21 of the pregnancy [27]. This
increase was almost linear due to an increase in the fraction of cells that contain
163
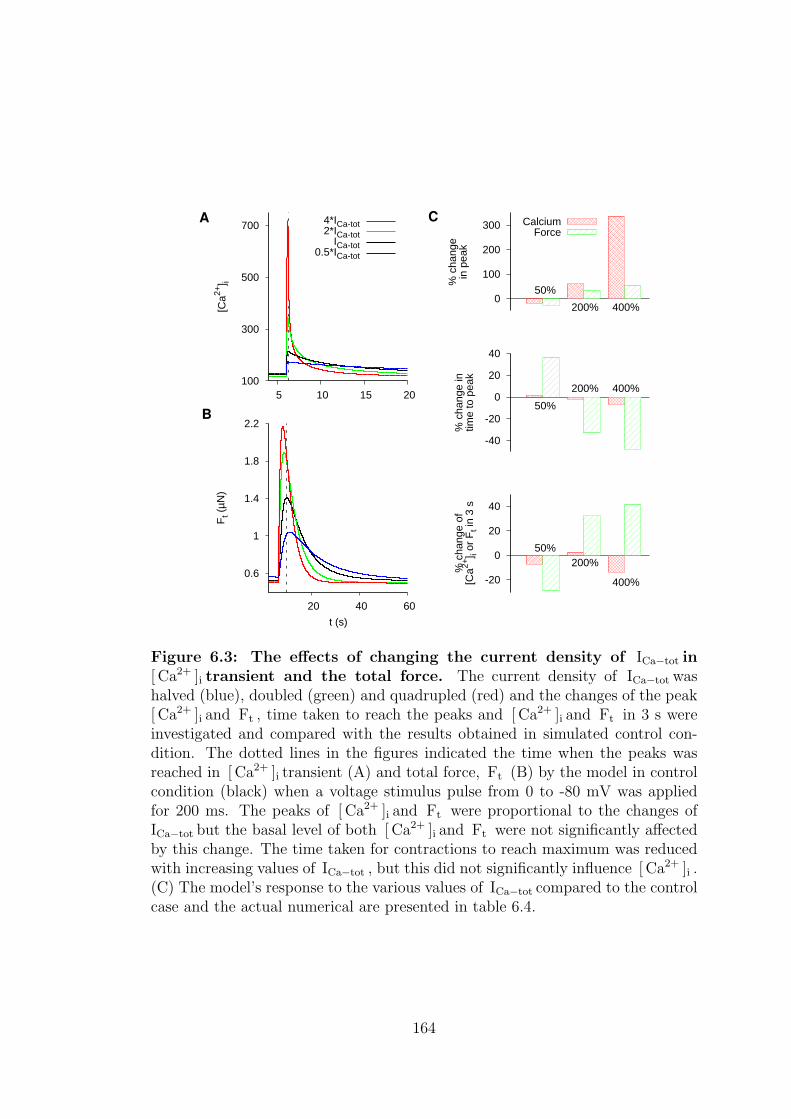
100
300
500
700
5 10 15 20
[Ca2+
] iA 4*ICa-tot
2*ICa-totICa-tot
0.5*ICa-tot
0.6
1
1.4
1.8
2.2
20 40 60
Ft (
µN)
t (s)
B
0
100
200
300
% c
hang
ein
pea
k
50%
200% 400%
C CalciumForce
-40
-20
0
20
40
% c
hang
e in
time
to p
eak
50%
200% 400%
-20
0
20
40
% c
hang
e of
[Ca2+
] i or
Ft i
n 3
s
50%200%
400%
Figure 6.3: The effects of changing the current density of ICa−tot in[ Ca2+ ]i transient and the total force. The current density of ICa−tot washalved (blue), doubled (green) and quadrupled (red) and the changes of the peak[ Ca2+ ]i and Ft , time taken to reach the peaks and [ Ca2+ ]i and Ft in 3 s wereinvestigated and compared with the results obtained in simulated control con-dition. The dotted lines in the figures indicated the time when the peaks wasreached in [ Ca2+ ]i transient (A) and total force, Ft (B) by the model in controlcondition (black) when a voltage stimulus pulse from 0 to -80 mV was appliedfor 200 ms. The peaks of [ Ca2+ ]i and Ft were proportional to the changes ofICa−tot but the basal level of both [ Ca2+ ]i and Ft were not significantly affectedby this change. The time taken for contractions to reach maximum was reducedwith increasing values of ICa−tot , but this did not significantly influence [ Ca2+ ]i .(C) The model’s response to the various values of ICa−tot compared to the controlcase and the actual numerical are presented in table 6.4.
164
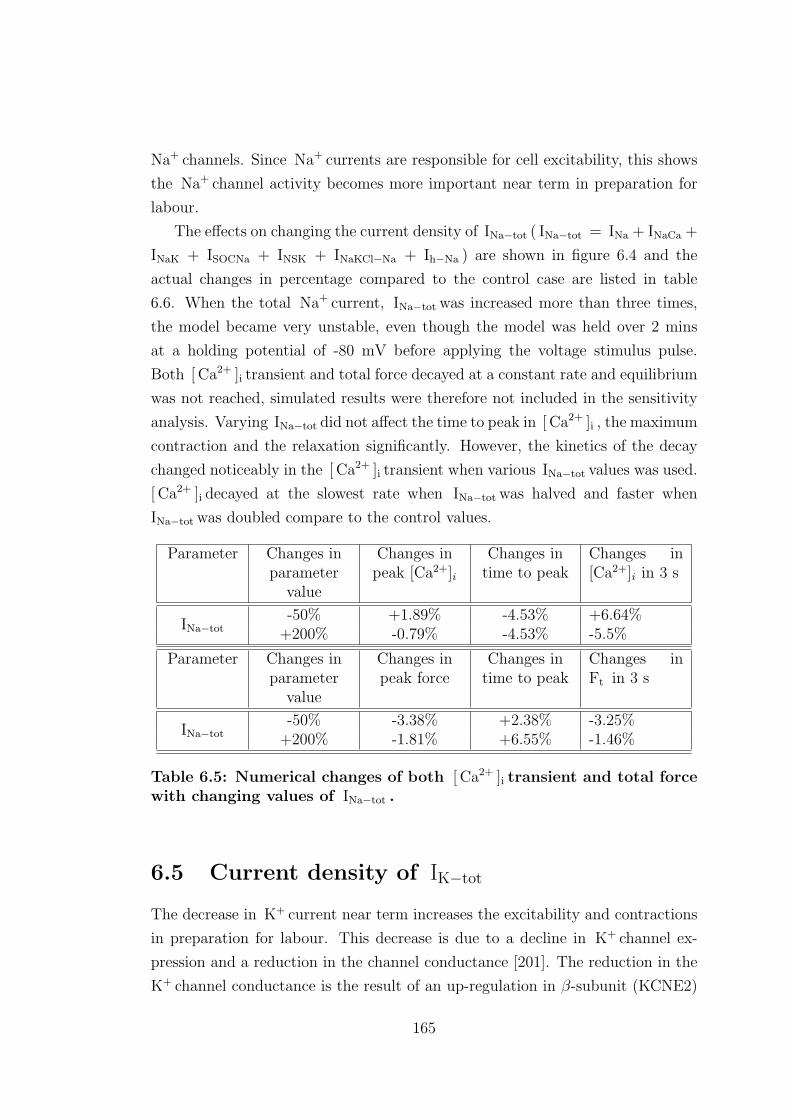
Na+ channels. Since Na+ currents are responsible for cell excitability, this shows
the Na+ channel activity becomes more important near term in preparation for
labour.
The effects on changing the current density of INa−tot ( INa−tot = INa + INaCa +
INaK + ISOCNa + INSK + INaKCl−Na + Ih−Na ) are shown in figure 6.4 and the
actual changes in percentage compared to the control case are listed in table
6.6. When the total Na+ current, INa−tot was increased more than three times,
the model became very unstable, even though the model was held over 2 mins
at a holding potential of -80 mV before applying the voltage stimulus pulse.
Both [ Ca2+ ]i transient and total force decayed at a constant rate and equilibrium
was not reached, simulated results were therefore not included in the sensitivity
analysis. Varying INa−tot did not affect the time to peak in [ Ca2+ ]i , the maximum
contraction and the relaxation significantly. However, the kinetics of the decay
changed noticeably in the [ Ca2+ ]i transient when various INa−tot values was used.
[ Ca2+ ]i decayed at the slowest rate when INa−tot was halved and faster when
INa−tot was doubled compare to the control values.
Parameter Changes inparameter
value
Changes inpeak [Ca2+]i
Changes intime to peak
Changes in[Ca2+]i in 3 s
INa−tot-50% +1.89% -4.53% +6.64%
+200% -0.79% -4.53% -5.5%
Parameter Changes inparameter
value
Changes inpeak force
Changes intime to peak
Changes inFt in 3 s
INa−tot-50% -3.38% +2.38% -3.25%
+200% -1.81% +6.55% -1.46%
Table 6.5: Numerical changes of both [ Ca2+ ]i transient and total forcewith changing values of INa−tot .
6.5 Current density of IK−tot
The decrease in K+ current near term increases the excitability and contractions
in preparation for labour. This decrease is due to a decline in K+ channel ex-
pression and a reduction in the channel conductance [201]. The reduction in the
K+ channel conductance is the result of an up-regulation in β-subunit (KCNE2)
165
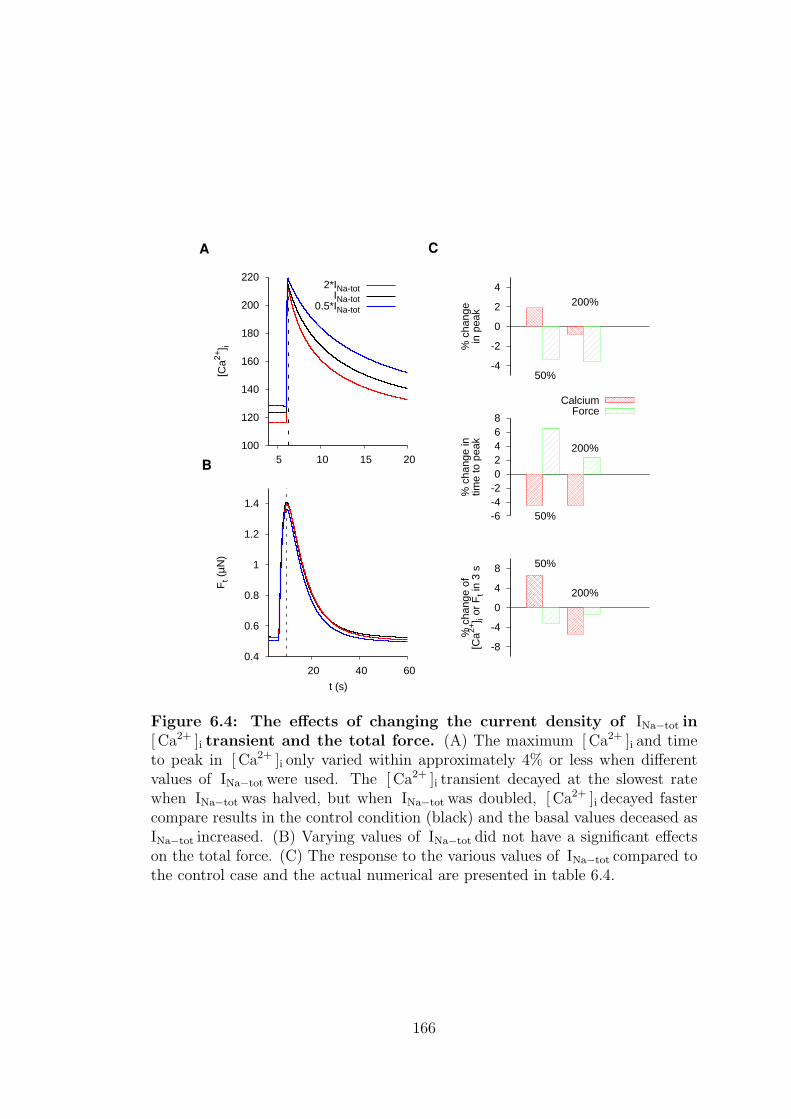
100
120
140
160
180
200
220
5 10 15 20
[Ca2+
] i
A
2*INa-totINa-tot
0.5*INa-tot
0.4
0.6
0.8
1
1.2
1.4
20 40 60
Ft (
µN)
t (s)
B
-4
-2
0
2
4
% c
hang
ein
pea
k
50%
200%
C
CalciumForce
-6-4-2 0 2 4 6 8
% c
hang
e in
time
to p
eak
50%
200%
-8
-4
0
4
8
% c
hang
e of
[Ca2+
] i or
Ft i
n 3
s 50%
200%
Figure 6.4: The effects of changing the current density of INa−tot in[ Ca2+ ]i transient and the total force. (A) The maximum [ Ca2+ ]i and timeto peak in [ Ca2+ ]i only varied within approximately 4% or less when differentvalues of INa−tot were used. The [ Ca2+ ]i transient decayed at the slowest ratewhen INa−tot was halved, but when INa−tot was doubled, [ Ca2+ ]i decayed fastercompare results in the control condition (black) and the basal values deceased asINa−tot increased. (B) Varying values of INa−tot did not have a significant effectson the total force. (C) The response to the various values of INa−tot compared tothe control case and the actual numerical are presented in table 6.4.
166
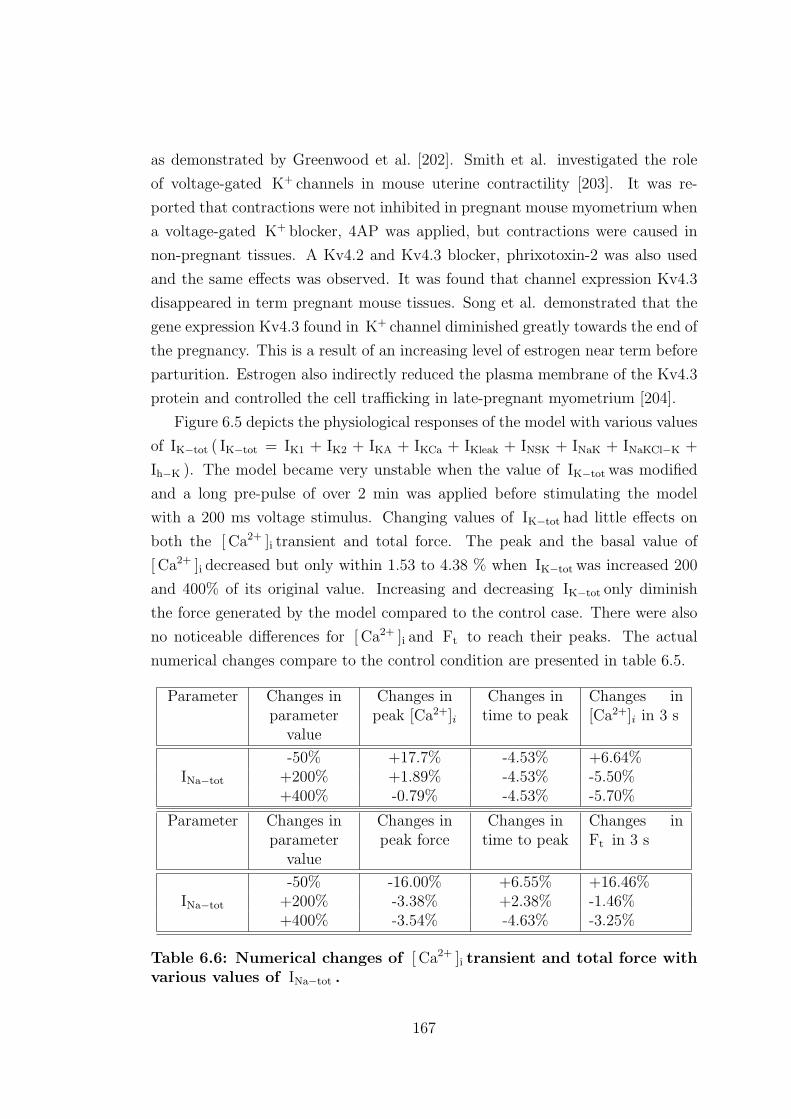
as demonstrated by Greenwood et al. [202]. Smith et al. investigated the role
of voltage-gated K+ channels in mouse uterine contractility [203]. It was re-
ported that contractions were not inhibited in pregnant mouse myometrium when
a voltage-gated K+ blocker, 4AP was applied, but contractions were caused in
non-pregnant tissues. A Kv4.2 and Kv4.3 blocker, phrixotoxin-2 was also used
and the same effects was observed. It was found that channel expression Kv4.3
disappeared in term pregnant mouse tissues. Song et al. demonstrated that the
gene expression Kv4.3 found in K+ channel diminished greatly towards the end of
the pregnancy. This is a result of an increasing level of estrogen near term before
parturition. Estrogen also indirectly reduced the plasma membrane of the Kv4.3
protein and controlled the cell trafficking in late-pregnant myometrium [204].
Figure 6.5 depicts the physiological responses of the model with various values
of IK−tot ( IK−tot = IK1 + IK2 + IKA + IKCa + IKleak + INSK + INaK + INaKCl−K +
Ih−K ). The model became very unstable when the value of IK−tot was modified
and a long pre-pulse of over 2 min was applied before stimulating the model
with a 200 ms voltage stimulus. Changing values of IK−tot had little effects on
both the [ Ca2+ ]i transient and total force. The peak and the basal value of
[ Ca2+ ]i decreased but only within 1.53 to 4.38 % when IK−tot was increased 200
and 400% of its original value. Increasing and decreasing IK−tot only diminish
the force generated by the model compared to the control case. There were also
no noticeable differences for [ Ca2+ ]i and Ft to reach their peaks. The actual
numerical changes compare to the control condition are presented in table 6.5.
Parameter Changes inparameter
value
Changes inpeak [Ca2+]i
Changes intime to peak
Changes in[Ca2+]i in 3 s
INa−tot
-50% +17.7% -4.53% +6.64%+200% +1.89% -4.53% -5.50%+400% -0.79% -4.53% -5.70%
Parameter Changes inparameter
value
Changes inpeak force
Changes intime to peak
Changes inFt in 3 s
INa−tot
-50% -16.00% +6.55% +16.46%+200% -3.38% +2.38% -1.46%+400% -3.54% -4.63% -3.25%
Table 6.6: Numerical changes of [ Ca2+ ]i transient and total force withvarious values of INa−tot .
167
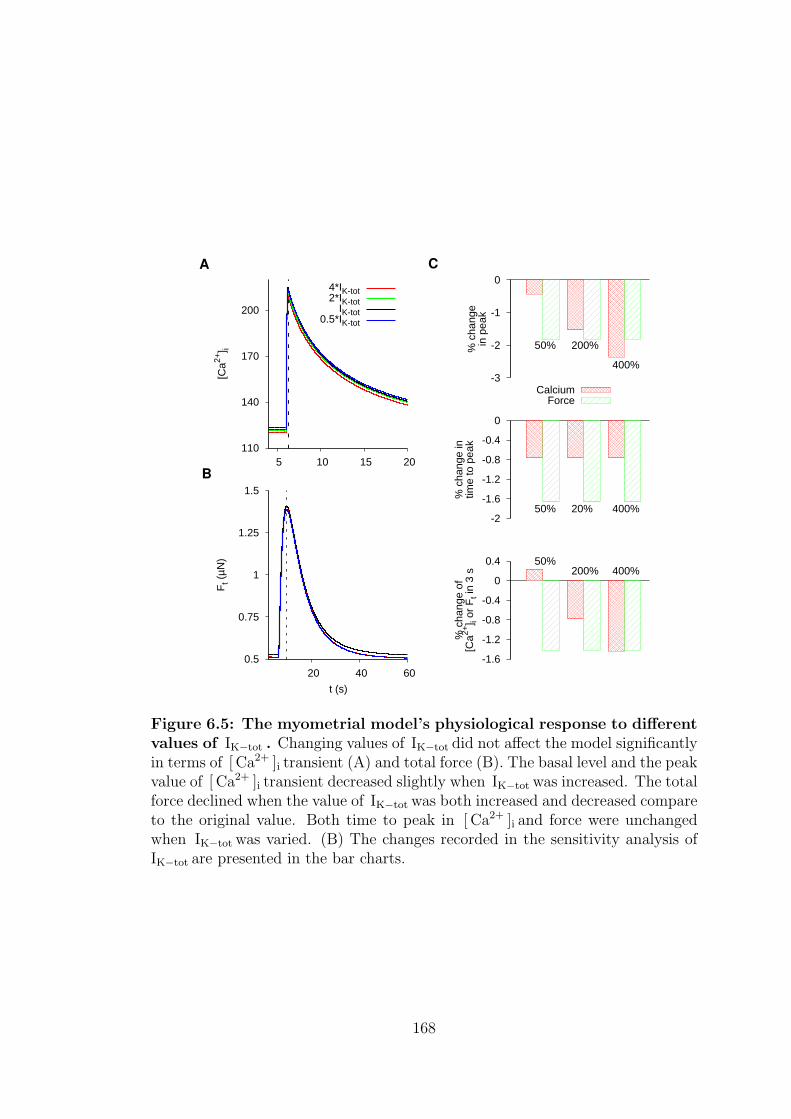
110
140
170
200
5 10 15 20
[Ca2+
] i
A
4*IK-tot2*IK-tot
IK-tot0.5*IK-tot
0.5
0.75
1
1.25
1.5
20 40 60
Ft (
µN)
t (s)
B
-3
-2
-1
0
% c
hang
ein
pea
k
50% 200%
400%
C
CalciumForce
-2
-1.6
-1.2
-0.8
-0.4
0
% c
hang
e in
time
to p
eak
50% 20% 400%
-1.6
-1.2
-0.8
-0.4
0
0.4
% c
hang
e of
[Ca2+
] i or
Ft i
n 3
s
50%200% 400%
Figure 6.5: The myometrial model’s physiological response to differentvalues of IK−tot . Changing values of IK−tot did not affect the model significantlyin terms of [ Ca2+ ]i transient (A) and total force (B). The basal level and the peakvalue of [ Ca2+ ]i transient decreased slightly when IK−tot was increased. The totalforce declined when the value of IK−tot was both increased and decreased compareto the original value. Both time to peak in [ Ca2+ ]i and force were unchangedwhen IK−tot was varied. (B) The changes recorded in the sensitivity analysis ofIK−tot are presented in the bar charts.
168
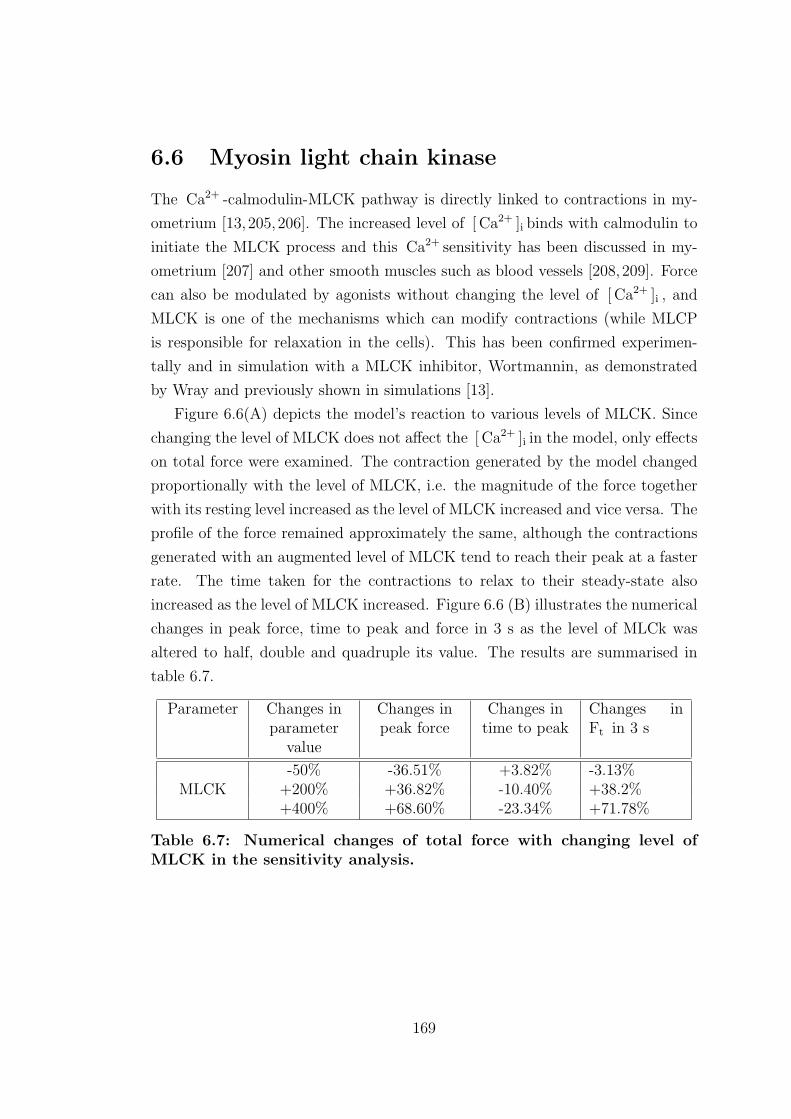
6.6 Myosin light chain kinase
The Ca2+ -calmodulin-MLCK pathway is directly linked to contractions in my-
ometrium [13,205,206]. The increased level of [ Ca2+ ]i binds with calmodulin to
initiate the MLCK process and this Ca2+ sensitivity has been discussed in my-
ometrium [207] and other smooth muscles such as blood vessels [208,209]. Force
can also be modulated by agonists without changing the level of [ Ca2+ ]i , and
MLCK is one of the mechanisms which can modify contractions (while MLCP
is responsible for relaxation in the cells). This has been confirmed experimen-
tally and in simulation with a MLCK inhibitor, Wortmannin, as demonstrated
by Wray and previously shown in simulations [13].
Figure 6.6(A) depicts the model’s reaction to various levels of MLCK. Since
changing the level of MLCK does not affect the [ Ca2+ ]i in the model, only effects
on total force were examined. The contraction generated by the model changed
proportionally with the level of MLCK, i.e. the magnitude of the force together
with its resting level increased as the level of MLCK increased and vice versa. The
profile of the force remained approximately the same, although the contractions
generated with an augmented level of MLCK tend to reach their peak at a faster
rate. The time taken for the contractions to relax to their steady-state also
increased as the level of MLCK increased. Figure 6.6 (B) illustrates the numerical
changes in peak force, time to peak and force in 3 s as the level of MLCk was
altered to half, double and quadruple its value. The results are summarised in
table 6.7.
Parameter Changes inparameter
value
Changes inpeak force
Changes intime to peak
Changes inFt in 3 s
MLCK-50% -36.51% +3.82% -3.13%
+200% +36.82% -10.40% +38.2%+400% +68.60% -23.34% +71.78%
Table 6.7: Numerical changes of total force with changing level ofMLCK in the sensitivity analysis.
169
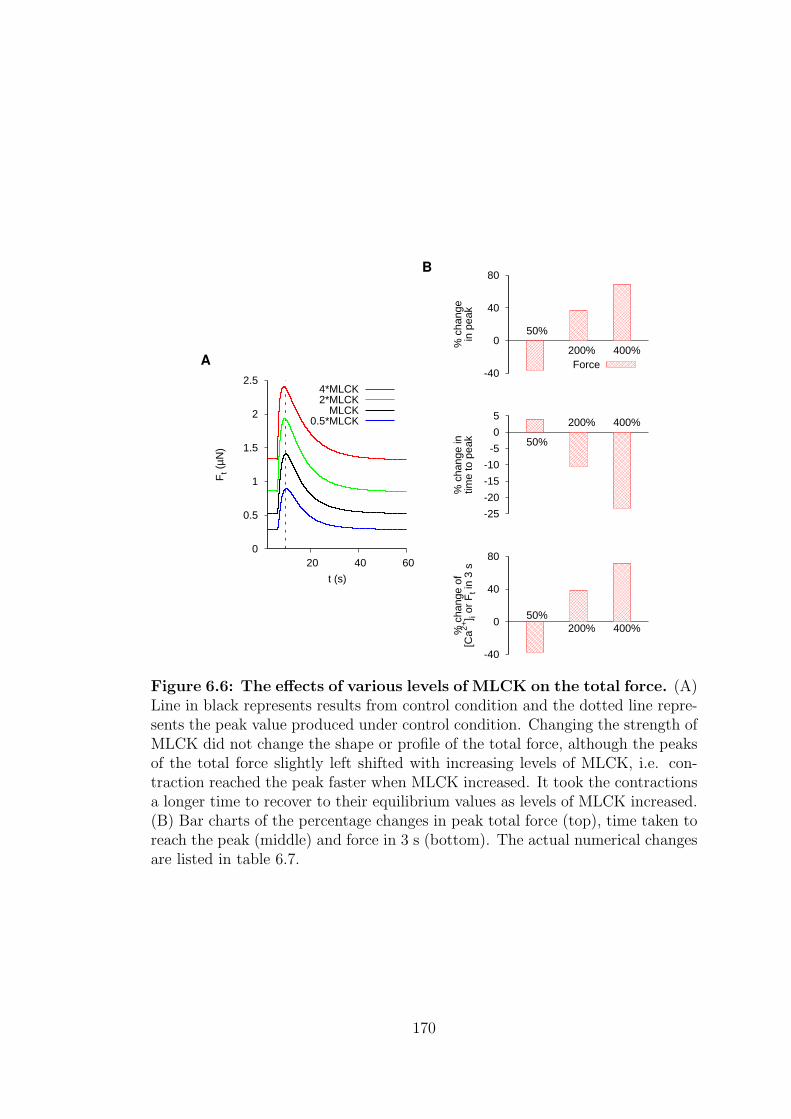
0
0.5
1
1.5
2
2.5
20 40 60
Ft (
µN)
t (s)
A
4*MLCK2*MLCK
MLCK0.5*MLCK
-40
0
40
80
% c
hang
ein
pea
k
50%
200% 400%
B
Force
-25
-20
-15
-10
-5
0
5
% c
hang
e in
time
to p
eak 50%
200% 400%
-40
0
40
80
% c
hang
e of
[Ca2+
] i or
Ft i
n 3
s
50%200% 400%
Figure 6.6: The effects of various levels of MLCK on the total force. (A)Line in black represents results from control condition and the dotted line repre-sents the peak value produced under control condition. Changing the strength ofMLCK did not change the shape or profile of the total force, although the peaksof the total force slightly left shifted with increasing levels of MLCK, i.e. con-traction reached the peak faster when MLCK increased. It took the contractionsa longer time to recover to their equilibrium values as levels of MLCK increased.(B) Bar charts of the percentage changes in peak total force (top), time taken toreach the peak (middle) and force in 3 s (bottom). The actual numerical changesare listed in table 6.7.
170
Chapter 7
1-D strand model in myometrium
7.1 Introduction
A single myometrial cell model was integrated into a 1-D fibre model to investigate
the conduction velocity and how the action potential propagates along a strand
of a late pregnant rat longitudinal tissue. Action potentials and electrical signals
change their shapes and activities when they travel along a strand of fibre. This
is because neighbouring cells dampen the electrical signals after they have been
initiated. Towards the end of the pregnancies, uterine contractions are found to be
more synchronised with increased amplitudes [4]. It is reported that this increase
in coordinated synchronisation and strength in contraction is directly related to
an increased number of gap junctions towards parturition [210–212]. Sims et
al. observed that the internal and junctional resistances dropped significantly at
delivery in longitudinal rat myometrial tissues, but both resistances increased 1.5
to 2 days after delivery [188]. All these changes occurring towards parturition
improve the electrical coupling and cell-to-cell communications in the uterine
smooth muscle. It also allows an extensive spread of the action potential between
cells and fibres to facilitate co-ordinated contractions in the uterus to ensure a
successful delivery [212–214].
To date, the vast majority of one- and multi-dimensional mathematical mod-
els were developed for cardiac tissues and there are very little models which
describe other types of tissues, including uterine muscles. Benson et al. devel-
oped a 2-D uterine tissue model using a modified FitzHugh-Nagumo excitable
neuron model [215–217]. Weakly and strongly coupled cell-to-cell coupling dur-
ing early and late pregnancies can be modelled by varying mean value of current
171
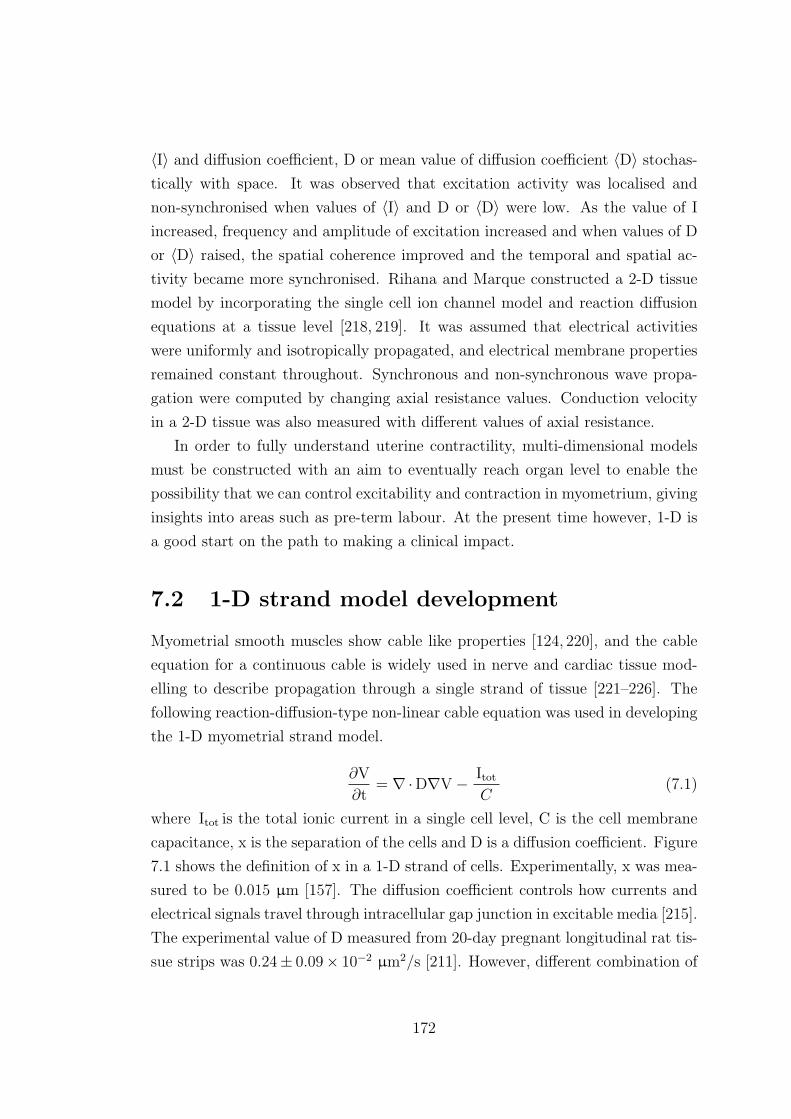
〈I〉 and diffusion coefficient, D or mean value of diffusion coefficient 〈D〉 stochas-
tically with space. It was observed that excitation activity was localised and
non-synchronised when values of 〈I〉 and D or 〈D〉 were low. As the value of I
increased, frequency and amplitude of excitation increased and when values of D
or 〈D〉 raised, the spatial coherence improved and the temporal and spatial ac-
tivity became more synchronised. Rihana and Marque constructed a 2-D tissue
model by incorporating the single cell ion channel model and reaction diffusion
equations at a tissue level [218, 219]. It was assumed that electrical activities
were uniformly and isotropically propagated, and electrical membrane properties
remained constant throughout. Synchronous and non-synchronous wave propa-
gation were computed by changing axial resistance values. Conduction velocity
in a 2-D tissue was also measured with different values of axial resistance.
In order to fully understand uterine contractility, multi-dimensional models
must be constructed with an aim to eventually reach organ level to enable the
possibility that we can control excitability and contraction in myometrium, giving
insights into areas such as pre-term labour. At the present time however, 1-D is
a good start on the path to making a clinical impact.
7.2 1-D strand model development
Myometrial smooth muscles show cable like properties [124, 220], and the cable
equation for a continuous cable is widely used in nerve and cardiac tissue mod-
elling to describe propagation through a single strand of tissue [221–226]. The
following reaction-diffusion-type non-linear cable equation was used in developing
the 1-D myometrial strand model.
∂V
∂t= ∇·D∇V − Itot
C(7.1)
where Itot is the total ionic current in a single cell level, C is the cell membrane
capacitance, x is the separation of the cells and D is a diffusion coefficient. Figure
7.1 shows the definition of x in a 1-D strand of cells. Experimentally, x was mea-
sured to be 0.015 µm [157]. The diffusion coefficient controls how currents and
electrical signals travel through intracellular gap junction in excitable media [215].
The experimental value of D measured from 20-day pregnant longitudinal rat tis-
sue strips was 0.24± 0.09× 10⁻² µm2/s [211]. However, different combination of
172
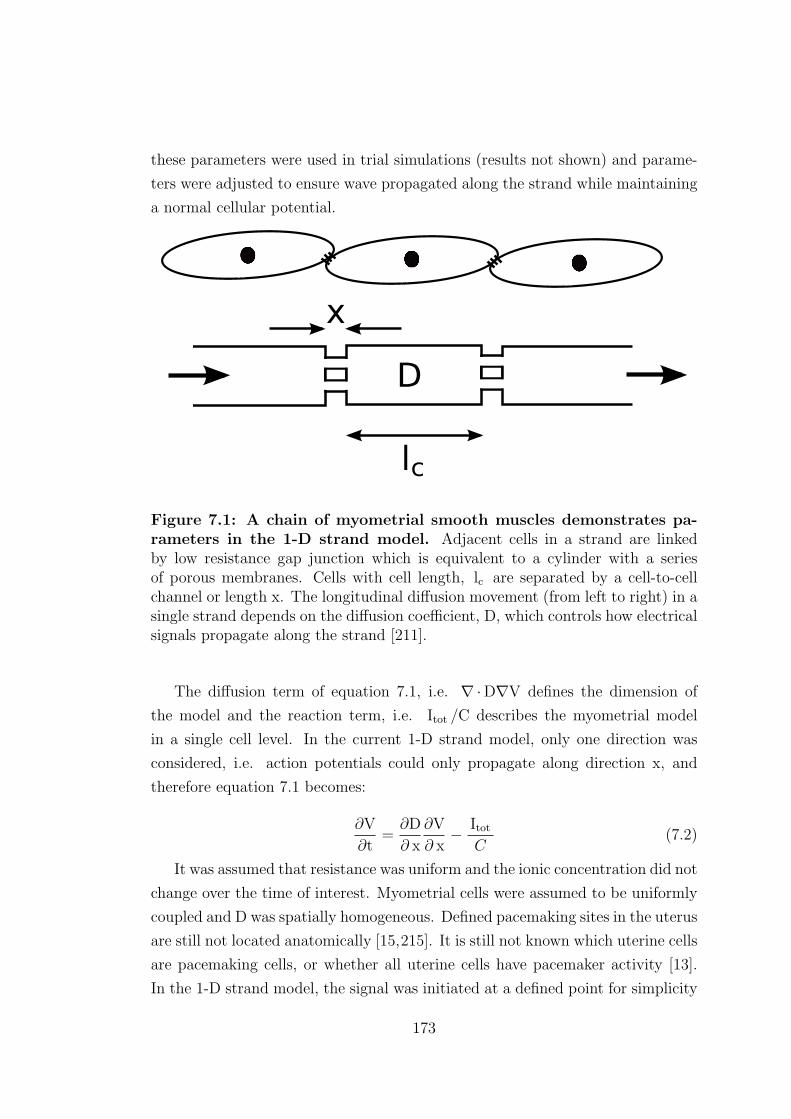
these parameters were used in trial simulations (results not shown) and parame-
ters were adjusted to ensure wave propagated along the strand while maintaining
a normal cellular potential.
x
lc
D
Figure 7.1: A chain of myometrial smooth muscles demonstrates pa-rameters in the 1-D strand model. Adjacent cells in a strand are linkedby low resistance gap junction which is equivalent to a cylinder with a seriesof porous membranes. Cells with cell length, lc are separated by a cell-to-cellchannel or length x. The longitudinal diffusion movement (from left to right) in asingle strand depends on the diffusion coefficient, D, which controls how electricalsignals propagate along the strand [211].
The diffusion term of equation 7.1, i.e. ∇·D∇V defines the dimension of
the model and the reaction term, i.e. Itot /C describes the myometrial model
in a single cell level. In the current 1-D strand model, only one direction was
considered, i.e. action potentials could only propagate along direction x, and
therefore equation 7.1 becomes:
∂V
∂t=
∂D
∂ x
∂V
∂ x− Itot
C(7.2)
It was assumed that resistance was uniform and the ionic concentration did not
change over the time of interest. Myometrial cells were assumed to be uniformly
coupled and D was spatially homogeneous. Defined pacemaking sites in the uterus
are still not located anatomically [15,215]. It is still not known which uterine cells
are pacemaking cells, or whether all uterine cells have pacemaker activity [13].
In the 1-D strand model, the signal was initiated at a defined point for simplicity
173
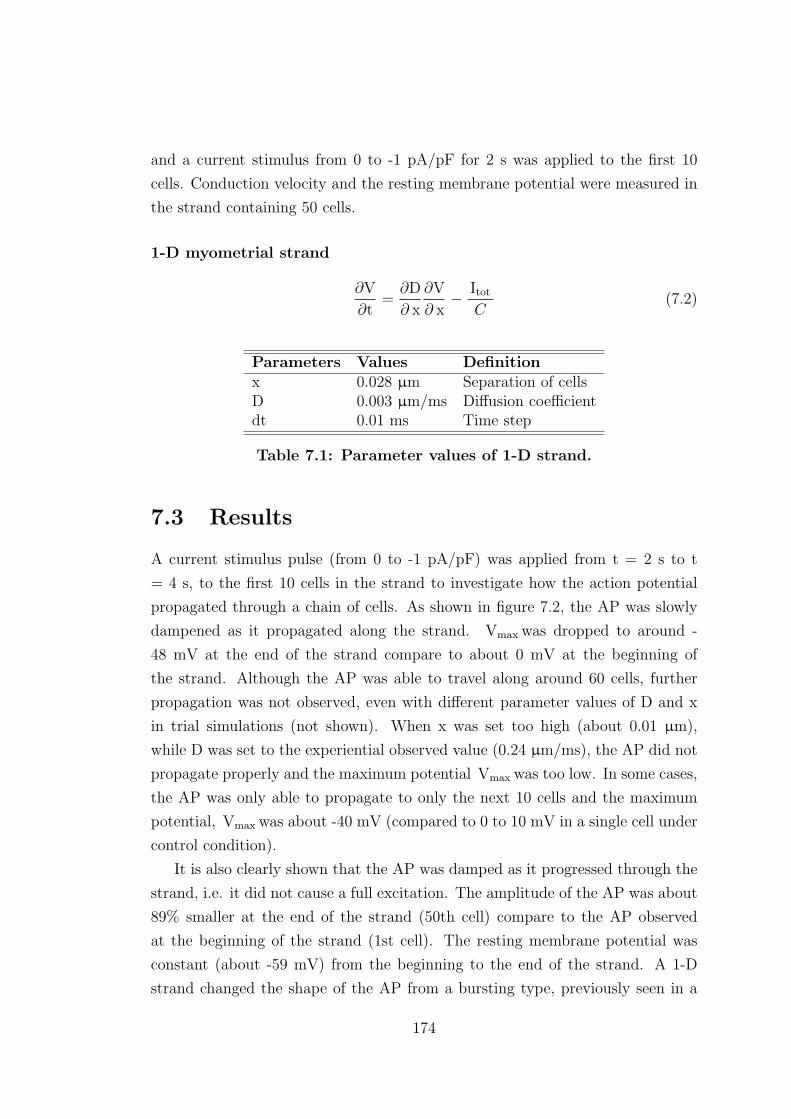
and a current stimulus from 0 to -1 pA/pF for 2 s was applied to the first 10
cells. Conduction velocity and the resting membrane potential were measured in
the strand containing 50 cells.
1-D myometrial strand
∂V
∂t=
∂D
∂ x
∂V
∂ x− Itot
C(7.2)
Parameters Values Definitionx 0.028 µm Separation of cellsD 0.003 µm/ms Diffusion coefficientdt 0.01 ms Time step
Table 7.1: Parameter values of 1-D strand.
7.3 Results
A current stimulus pulse (from 0 to -1 pA/pF) was applied from t = 2 s to t
= 4 s, to the first 10 cells in the strand to investigate how the action potential
propagated through a chain of cells. As shown in figure 7.2, the AP was slowly
dampened as it propagated along the strand. Vmax was dropped to around -
48 mV at the end of the strand compare to about 0 mV at the beginning of
the strand. Although the AP was able to travel along around 60 cells, further
propagation was not observed, even with different parameter values of D and x
in trial simulations (not shown). When x was set too high (about 0.01 µm),
while D was set to the experiential observed value (0.24 µm/ms), the AP did not
propagate properly and the maximum potential Vmax was too low. In some cases,
the AP was only able to propagate to only the next 10 cells and the maximum
potential, Vmax was about -40 mV (compared to 0 to 10 mV in a single cell under
control condition).
It is also clearly shown that the AP was damped as it progressed through the
strand, i.e. it did not cause a full excitation. The amplitude of the AP was about
89% smaller at the end of the strand (50th cell) compare to the AP observed
at the beginning of the strand (1st cell). The resting membrane potential was
constant (about -59 mV) from the beginning to the end of the strand. A 1-D
strand changed the shape of the AP from a bursting type, previously seen in a
174
single cell, to a plateau type AP. This was due to the electrical loading of the
neighbouring cells. The electrical load affected the potential of the strand and
dampened any bursting seen in a single cell.
A comparison of conduction velocities from different gestation of the uterus
in human and rat are listed in table 7.2. In general, studies have found that the
conduction velocity increased towards delivery in pregnant rat tissues. However
no difference in conduction velocity was observed between delivery and before
term tissues from research conducted by Sims et al. [188]. Human uterine tissues
extracted during labour has a lower propagation velocity than tissues extracted
from rats. The conduction velocity obtained from simulations was 1.32 cm/s,
which is slightly slow for rat myometrium but still agrees with the experimental
values.
175
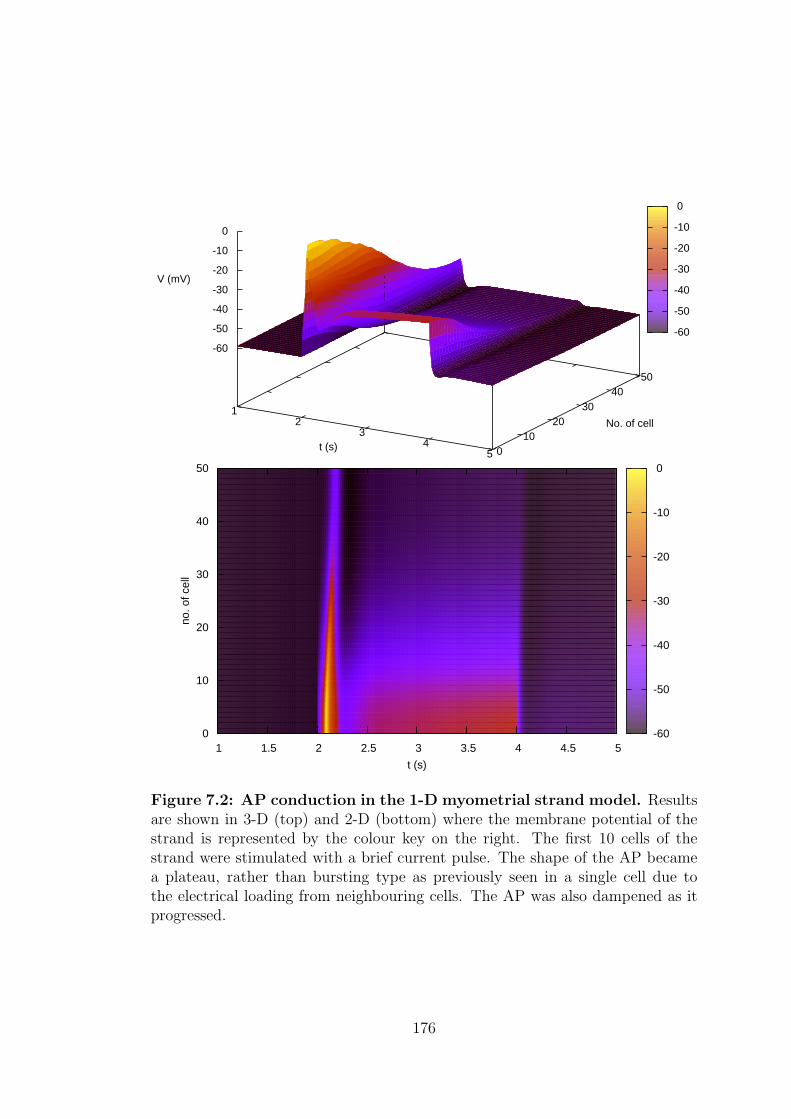
1 2
3 4
5t (s) 0
10 20
30 40
50
No. of cell
-60
-50
-40
-30
-20
-10
0
V (mV)
-60
-50
-40
-30
-20
-10
0
1 1.5 2 2.5 3 3.5 4 4.5 5
t (s)
0
10
20
30
40
50
no. o
f cel
l
-60
-50
-40
-30
-20
-10
0
Figure 7.2: AP conduction in the 1-D myometrial strand model. Resultsare shown in 3-D (top) and 2-D (bottom) where the membrane potential of thestrand is represented by the colour key on the right. The first 10 cells of thestrand were stimulated with a brief current pulse. The shape of the AP becamea plateau, rather than bursting type as previously seen in a single cell due tothe electrical loading from neighbouring cells. The AP was also dampened as itprogressed.
176
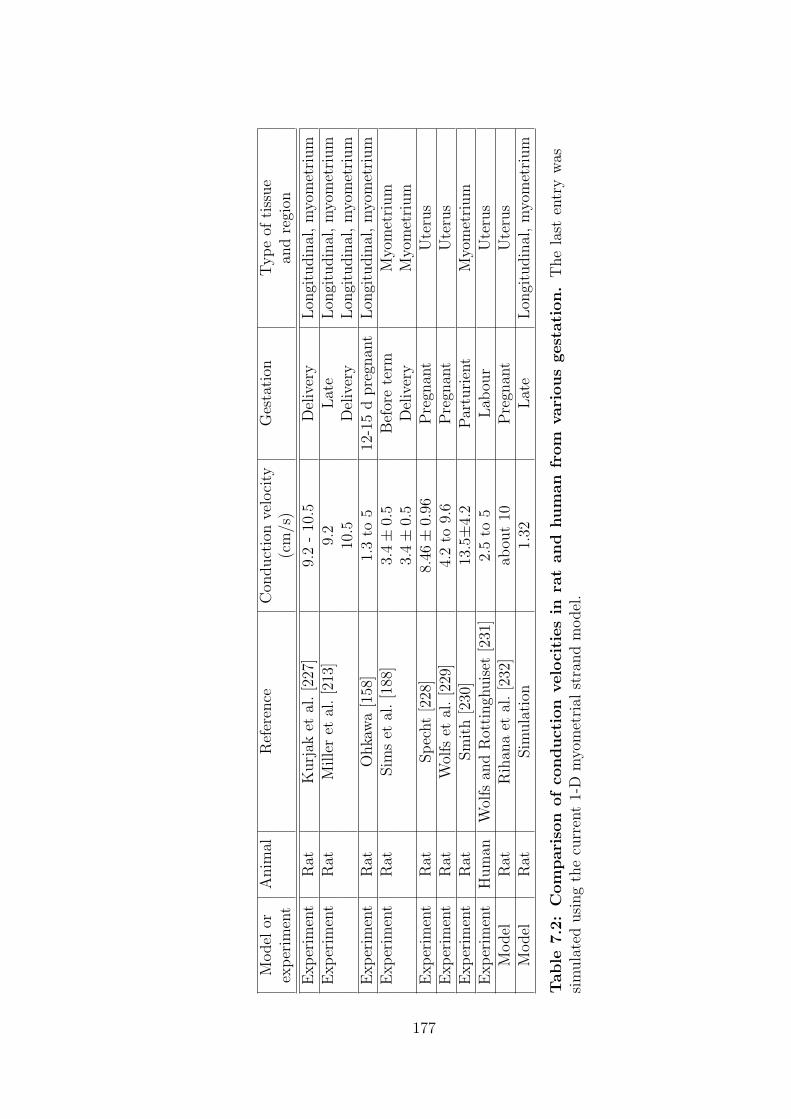
Model
orA
nim
alR
efer
ence
Con
duct
ion
velo
city
Ges
tati
onT
ype
ofti
ssue
exper
imen
t(c
m/s
)an
dre
gion
Exper
imen
tR
atK
urj
aket
al.[2
27]
9.2
-10
.5D
eliv
ery
Lon
gitu
din
al,m
yom
etri
um
Exper
imen
tR
atM
ille
ret
al.[2
13]
9.2
Lat
eLon
gitu
din
al,m
yom
etri
um
10.5
Del
iver
yLon
gitu
din
al,m
yom
etri
um
Exper
imen
tR
atO
hka
wa
[158
]1.
3to
512
-15
dpre
gnan
tLon
gitu
din
al,m
yom
etri
um
Exper
imen
tR
atSim
set
al.[1
88]
3.4±
0.5
Bef
ore
term
Myo
met
rium
3.4±
0.5
Del
iver
yM
yom
etri
um
Exper
imen
tR
atSpec
ht
[228
]8.
46±
0.96
Pre
gnan
tU
teru
sE
xper
imen
tR
atW
olfs
etal
.[2
29]
4.2
to9.
6P
regn
ant
Ute
rus
Exper
imen
tR
atSm
ith
[230
]13
.5±4
.2Par
turi
ent
Myo
met
rium
Exper
imen
tH
um
anW
olfs
and
Rot
tingh
uis
et[2
31]
2.5
to5
Lab
our
Ute
rus
Model
Rat
Rih
ana
etal
.[2
32]
abou
t10
Pre
gnan
tU
teru
sM
odel
Rat
Sim
ula
tion
1.32
Lat
eLon
gitu
din
al,m
yom
etri
um
Table
7.2
:C
om
pari
son
of
conduct
ion
velo
citi
es
inra
tand
hum
an
from
vari
ous
gest
ati
on.
The
last
entr
yw
assi
mula
ted
usi
ng
the
curr
ent
1-D
myo
met
rial
stra
nd
model
.
177
Chapter 8
Discussion
A biophysically detailed mathematical model of a single late pregnant rat myome-
trial cell was constructed. The model successfully reproduced electrical, chemical
and mechanical behaviour of a single cell. The simulated results were validated
using available experimental recordings. Drug actions and sensitivity analysis
were also utilised for the model validation, as this highlighted some limitations
of the model and provided guidance for future improvements. The cell model
was further integrated into a 1-D strand to investigate how an electrical signal
propagate along a fibre.
8.1 Whole cell membrane, SR currents model
In the whole cell myometrial model, all the major currents identified experimen-
tally so far are included and the descriptions in the model of all the currents agreed
well with the experimental voltage- and current-clamp recordings. The model
was divided into electrochemical and chemo-mechanical subsystems. The elec-
trochemical subsystem consisted of five inward currents ( Ih , ICaL , ICaT , INa and
ISOC ), five outward currents ( IK1 , IK2 , IKA , IKCa and IKleak ) and two other cur-
rents that flows in both directions ( ICl and INSCC ). Ionic pumps, exchanger and
co-transporter currents ( ICapump , INaK , INaCa and INaKCl ) were included to reg-
ulate the cellular concentration across the membrane. A simple calcium-induced
calcium release mechanism in the SR was also described. Calcium buffering and
the balance of intracellular Na+ and K+ were also taken into account in the
myometrial model.
The reversal potential for ICaL and ICaT in the myometrial model was fixed
178
at 45 mV. Although this approach might be less realistic, it was proven to be
a good estimation since the simulations of ICaL and ICaT fitted the I-V relation-
ships from the experimental data well. However, an improved description of
the Ca2+ reversal potential is needed for a more realistic depiction of the cell
behaviours and activities.
Unlike cardiac and other types of muscles, there are only limited experimental
data specifically for ionic channels in myometrium available to date. Most of the
time, extractions of data from raw experimental recordings in published literature
were often needed and this increased potential errors in the model. When data
in myometrium was not available, for example: IKCa , ISOC and INaKCl , record-
ings from different types of smooth muscle data in similar excitable organs were
adapted. However, experimental data often required modifying and rescaling,
which also increased the uncertainties in the model.
Furthermore, the model was developed based on body temperature experimen-
tal data recordings, but some experiments were carried out in room temperature.
Although a temperature coefficient, Q10, accounted for this temperature differ-
ence in Ih and INaK , when Q10 was not available, it was assumed the dynamics of
the channel do not change significantly. This limited the model’s ability to predict
cell behaviour, since some macroscopic gating properties, for example: steady-
state inactivation, inactivation time and I-V relationship in ICaL , and also the
levels of [ Ca2+ ]i , all have different temperature dependencies and some changes
are highly dependent on the temperature [233].
Different types of potassium channels in myometrium are poorly differenti-
ated, meaning only limited experimental data can be used to construct the model.
The lack of experimental data, especially in activation and inactivation time con-
stants, highly affected the shape of I-V relationship as well as the rise and decay
kinetics in current traces. This in turn imposed an effect on the whole cell action
potential.
There are also some disagreements over the role and the significance of the
Ca2+ -activated Cl− current in myometrial cells. A research group reported the
functional importance of ICl in the plateau phase of the AP [15,32], while another
independent research group claimed that Cl− channels are not important in uter-
ine electrophsyiology at all [12]. Both groups however, agreed that only 30%
of the pregnant myometrial cells consist of Cl− channels and all of the samples
are from rat uterus. Also an inhibition of ICl significantly reduced the frequency
179
of the spontaneous contractions (this effect was seen in simulations). More de-
tailed experimental data is needed to clarify this dispute in order to improve the
myometrial model.
In the myometrial SR mode, a two-pool uptake and release compartment sys-
tem, which is used widely in cardiac modelling was adapted. In myometrium,
there is evidence that subcompartments exist within the SR and they are func-
tionally separated [234]. Although the majority of the cardiac models have
included a IP3-sensitive store, releasing Ca2+ from SR in the uptake comport-
ment [112,134,235–237], in the myometrial model, the uptake compartment con-
sists of only the SERCA pump to replenish the Ca2+ store by cytosolic Ca2+ and
no release mechanism was considered. Despite the fact that IP3 receptor has also
been identified in the uterus, studies from various species have suggested release
from IP3 receptor does not play an important role in activation of force [15].
However, omitting this mechanism may lead to inaccurate prediction of the cell
behaviour, as IP3 receptors still contribute and regulate the content of Ca2+ in
a cell. More detailed and qualitative analysis on how the receptor operates is
needed to fully describe the effects on a myometrial cell.
8.2 Electrophysiological responses
8.2.1 Cell dynamics in control condition
The membrane current model described and predicted the uterine activity rela-
tively well in terms of the shape of the AP and the magnitude of the spikes in
the normal physiological condition. The profile of the APs matched closely to the
experimental recordings observed in Okabe et al. and Inoue et al. [71,108]. This
spiking type of AP can be found in less than 50% of the non-labouring late preg-
nant myometrial cells in human [15]. The I-V relationship of the peak outward
current agreed relatively well with the experimental data (figure 3.2), however
the inward current was slightly exaggerated as a consequence of a larger than
normal contribution of the Ca2+ -related currents. The inward current peaked at
around -8 mV in simulations while the reported experimental value was around
0 mV [26,71].
180
8.2.1.1 Repetitive depolarisation
When the myometrial model undergos repetitive depolarisation, it was shown
that the maximum peak of ICa−tot did not decay as quickly as it did in the ex-
periment. The incomplete recovery of [ Ca2+ ]i was more severe in experiments
than results produced in simulations. This was due to the Ca2+ extrusion mecha-
nisms, with for example, the Ca2+ pump and Na+ /Ca2+ exchanger set too strong
in the model. However, trial simulations showed that if the strength or the mag-
nitude of the extrusion mechanisms were not as strong (results not shown), the
[ Ca2+ ]i transient would not decay after reaching its initial peak when the model
was held at a voltage-clamp for a long period of time (see control condition in
nifedipine drug action). If the magnitude of the extrusion mechanisms were set
higher, the peaks would be negatively shifted when the model was depolarised
with various magnitude pulses, and deviate from the experimental recordings (see
figure 5.1). On balance, the model’s parameters were chosen so that the results
would best match the most features from the experimental data.
8.2.2 Cell dynamics under estradiol condition
The myometrial model mimicked an estradiol effect by reducing the conductances
of the voltage-gated, Ca2+ -activated K+ currents and voltage-gated Ca2+ currents
by 30-60%. The model was able to produce a plateau type AP with an elevated
level of RMP compared to control (-56 mV), similar to the recordings seen in
experiments [108]. Spikes were suppressed as described in experiments and only
the first spike was observed. The corresponding [ Ca2+ ]i peaked at 462 nM, and
a smooth crescent-like profile with a summation of [ Ca2+ ]i during the clamp was
presented. The I-V relationship showed the magnitude of the total cell current
was reduced in both inward and outward directions in estradiol condition (since
the conductances of the K+ and Ca2+ currents were reduced). Both inward and
outward currents fitted well with the experimental data, although the peak of the
inward current was left shifted toward the negative membrane potential.
The description of the estradiol effect in the myometrial model is still incom-
plete. Yamamoto reported the voltage-dependent inactivation curve of Ba2+ was
left-shifted in cells treated with estradiol [68]. Estradiol also influences a my-
ometrial cell in a dose- and time-dependent manner. In studies carried out by
Okabe et al., the concentration of estradiol used in the experiment was about
181
3 µM higher than the normal level during pregnancy (the 17β-estradiol in the
serum level is about 30 to 100 nM in human [159]). Such high concentration
was needed to observe the inhibition of uterine contractions. Furthermore, it was
reported that the longer estradiol was present in the cell, the greater the inhi-
bition of Ca2+ and K+ currents. In order to improve the myometrial model, all
this information will have to be considered and more detailed studies have to be
carried out.
8.2.3 Inhibiting individual current
In experiments carried out in estrogen-treated non-pregnant rat tissues, it was re-
ported that myometrial excitation was not sustained by only Ca2+ or Na+ alone
[238]. It is shown in simulations that inhibiting ICaL and INa have similar effects
on the AP. The profile of the AP dramatically changed, spikes were suppressed
and Vmax was noticeably lowered, but the resting membrane potential remained
approximately the same. Blocking ICaL completely diminished the inward por-
tion of the total membrane current, but had little effect when INa was inhibited.
This proved that ICaL is the major contributor of the total inward current in the
myometrium [13].
Inhibiting INaCa slightly lowered the resting membrane potential, but sup-
pressed the generation of spikes without noticeably altering the magnitude of the
total membrane current. In experiments, it was suggested that the electrogenic
Na+ pump plays an important role in the normal resting membrane potential in
smooth muscles [239] and myometrium [240]. Experiments on guinea pig taenia
muscles revealed that blocking the Na+ pump with ouabain lowered the resting
membrane potential [241] and this decrease was due to the loss of K+ in the
cell [242].
Inhibiting K+ currents, IK1 and IK2 , has a dramatic effects on the AP in simu-
lations. The resting membrane potentials in both cases were raised significantly,
no spikes were formed (apart from the initial spike which was slightly raised)
and the APs were not returned to their original values. Blocking both currents
individually reduced the outward part of the total membrane current. The ef-
fect of blocking the fast K+ current was examined in experiment using TEA, a
K+ blocker, in non-pregnant guinea-pig myometrial tissues [243]. It was recorded
that spike amplitude was increased in the AP with a slow repolarisation phase,
undershoot was abolished and the membrane resistance was increased when a
182
current pulse was applied. A noticeable increase was also recorded in the in-
ward current. The differences in the results might be due to the remodelling the
K+ channels undergo during pregnancy, which modify the physiological responses
in the myometrial cell.
Jones et al. reported that inhibiting ICl significantly decreased the frequency
of the uterine contractions [32]. This effect was observed in simulations by block-
ing ICl and reduced the frequency of the spikes in the AP without significantly
changing the spike amplitude, resting membrane potential and the total current.
The non-specific cation channel, NSCC is responsible in maintaining the
pacemaking activity and regulates the frequency of the contraction in the my-
ometrium. Miyoshi et al. investigated the effects of inhibiting one of the NSCC
mechanisms, ATP receptors using Mg2+ [244]. It was reported that the ATP-
induced depolarisation was suppressed in 18-22 days pregnant isolated rat my-
ometrium. In simulations illustrated in figure 3.12, the resting membrane po-
tential was significantly reduced and the spikes were suppressed when INSCC was
blocked.
8.3 Cell mechanics and force generation
In the chemo-mechanical subsystem, the myometrial model adapted the Hai and
Murphy 4-state model to describe the myosin phosophrylation process, which
was developed originally for smooth muscles. This model was then coupled to the
Yang cerebrovascular model to generate mechanical contractions. The mechanical
model was described by separate force components (passive, active, visocelastic,
cross-bridge) that coupled together to create tension. The equations and param-
eters were mostly unmodified since the data for uterus was not available.
The myometrial model successfully predicted contractile activities in single,
twin and multiple stimulations with characteristics similar to experimental record-
ings observed in myometrium. When a train of repetitive depolarisation pulses
were applied to the model, it was shown that the maximum stress level generated
by this protocol was higher than a single pulse stimulation, although the durations
of the contraction was approximately the same. Ca2+ -spikes from the twin-pulse
simulations illustrated in figure 4.2 shows that the Ca2+ decayed slower compared
to the experimental recordings. The [ Ca2+ ]i transient elicited from the first pulse
was not able to fully recover before the next pulse was applied in simulations,
183
this indicates the rate of the Ca2+ extrusion mechanism in the myometrial model
might be too slow.
The incorporation of the cerebrovascular mechanical model from Yang et al.
allowed the myometrial model to predict cellular events that are not easily mea-
sured. This includes the temporal distribution of the cross-bridge cycling states
and the changes in the internal length components. It is shown in figure 4.4 that
la was shortened when a stimulus voltage pulse was applied. Both ls and lx
expanded to compensate for this shortening, but the expansion of lx was much
shorter compared to ls .
The magnitude of the total force from simulations was considerably lower
compared to experiential data. This is because the majority of the parameter sets
obtained from the Yang et al. model were unchanged due to a lack of experimental
data for myometrium. Since the myometrial model assumed Ca2+ -Calmodulin-
MLCK is the only excitation pathway, the low magnitude of the total force may
also be due to the model’s exclusion of the extra pathways which lead to force
generation, for example: agonist- and stretch-induced contractions.
8.4 Drug actions
Imitating different drug actions in simulations can serve as a validation of the
model, and also address the limitations of the model. Drug action simulations
were carried out to focus on the effects drugs have on [ Ca2+ ]i transient and
contractile force. As discussed previously, simulation times were carried out in a
shorter time scale than the experiments due to the instability of the model in a
long duration of time.
The mechanisms responsible for the lowering of the intracellular Ca2+ when a
cell is relaxed are the plasmalemmal Ca2+ pump and the Na+ /Ca2+ exchanger.
Although the sarcolemmal mechanisms do play a part in reducing the level of
[ Ca2+ ]i , the contribution from them is relatively small since the SR Ca2+ stores
have a finite capacity [123]. When the plasmalemmal Ca2+ pump was inhibited
using carboxyeosin in experiments demonstrated by Shmigol et al. [123], the
decay rate of [ Ca2+ ]i markedly reduced after a train of 10 voltage pulses were
applied compared to the control case. No detectable change in the current was
observed in carboxyeosin treated cells. In simulations, although a slight rise
in the peak [ Ca2+ ]i and the resting level of [ Ca2+ ]i was recorded similar to the
184
experiments when ICapump was blocked, the decay of the [ Ca2+ ]i transient was not
changed significantly compared to the control case. The inconsistency may due
to the tissue and species differences of the adopted equations describing INaCa and
ICapump . However, there are some conflicting results in the literature. Shmigol et
al. found that the Ca2+ pump contributes to about 30% of the Ca2+ decay and
the remaining 70% is attributed to the Na+ /Ca2+ exchanger and the SR-related
mechanisms. But Kosterin et al. claimed that Ca2+ pump is the most dominant
Ca2+ extrusion mechanism in myometrium [245]. More studies have to be done to
clarify the confusion in order to provide better descriptions of the Ca2+ extrusion
mechanisms, INaCa and ICapump .
The L-type Ca2+ current proved to be the major contributor of [ Ca2+ ]i ,
ICa−tot and mechanical contractions since inhibiting the current nearly completely
abolished both the [ Ca2+ ]i transient, ICa−tot and force. However, the inconsis-
tency in the [ Ca2+ ]i decay caused by the inaccurate descriptions of INaCa and
ICapump , also affected the simulated results when a long voltage pulse (10 s) was
applied. As illustrated in figure 5.3, although the upstroke of the [ Ca2+ ]i fit well
with the experimental data in control, the decay rate of the [ Ca2+ ]i transient
was noticeably slower than the experimental recordings.
The effect of ryanodine was also examined in simulations and it was found
that when a twin-pulse protocol was applied, the second increment in [ Ca2+ ]i was
slightly smaller than the first increment. Whereas in the experiments, the dif-
ference between the first and the second peaks with the presence of ryanodine
was not notable. A negative staircase effect was observed in both simulations
and experiments, i.e. the second peak of the [ Ca2+ ]i transient increased while
the corresponding peak of the total Ca2+ current decreased. It is important to
note that a relatively low dose of ryanodine (5 µM) was used in the experiment,
and such a low dose is not sufficient to totally inhibit CICR, but rather slowly
dissipate and eventually exhaust the releasing of Ca2+ from the SR [69]. Since
Irel was blocked completely in simulations, this may contribute to the discrepancy
obtained in simulations.
Carbachol increased the maximal force compared to control cells in experi-
ments, by releasing Ca2+ from the internal SR store. This effect was replicated
in simulations and the results agreed well with experimental data. The myome-
trial model also successfully replicated the CPA response of the [Ca2+]i transient.
Simulations showed the amplitude of the [ Ca2+ ]i transient increased when CPA
185
was applied. The basal level of [ Ca2+ ]i was raised and gradually declined as time
progressed. It also showed the prolonged duration of the [ Ca2+ ]i transient and
force when Iup was inhibited, similar to experimentally observed data [136]. How-
ever, unlike experimental recordings, the basal level of force was also increased
in response to the elevated level of [ Ca2+ ]i in simulations. It is unclear why the
contractile proteins were not affected in CPA treated cells [13], more research has
to be done experimentally in order to improve the myometrial model.
Application of Wortmannin to rat myometrial cells showed the spontaneous
contractions were gradually abolished while the [ Ca2+ ]i level and ICa−tot were
unchanged. The model was able to demonstrate this effect when MLCK was
inhibited, but the gradual decline in force was not seen. This is due to the as-
sumption that no additional force generating pathways, apart from Ca2+ -CaCM-
MLCK exisit in the myometrial model. In reality, various different pathways can
also contribute to the generation of force without increasing the level of Ca2+ .
Luckas et al. demonstrated that agonist-induced (e.g. oxytocin) contractions can
fire a single contraction in human pregnant myometrium at term in the absence of
extracellular Ca2+ [28, 246]. This explains the rapid declination in force seen in
simulations when the effect of Wortmannin was applied. The level of [ Ca2+ ]i was
unchanged when MLCK was inhibited. Including the Ca2+ -independent force
producing pathways will provide a more realistic approach in predicting the con-
tractile activities in myometrium.
When the effect of Ca2+ -free solution was demonstrated on myometrium, it
was found that the total contractile force declined to zero and raised back to
its original level when the Ca2+ was re-introduced. The level of [ Ca2+ ]i slowly
declined in both experiments and simulations as the balance of Ca2+ in the cell
was restored, thus confirming the importance of external Ca2+ in contractions.
8.5 Sensitivity Analysis
Sensitivity analysis was performed to predict the physiological effects it has on
changing parameters. This also tested the model’s ability to see whether the
model can be used in different gestation of the pregnancy.
The cellular surface area to volume ratio has a direct effect on the intracel-
lular concentration of Na+ , K+ , Cl− and Ca2+ . It is also inversely related to
ICapump and INaCa . The total force reached a maximum faster when the surface
186
area to volume ratio was increased, although the duration of the contraction
remained approximately the same when the ratio was varied.
Using the current mechanical descriptions of the force and length of the cell
from Yang et al. cerebrovascular smooth muscle model, the analysis showed
that contraction increased until lc reached 150 µm, and further extension of
the length restricted force generation drastically. This is most likely due to the
constraint imposed by the existing force model equations which were optimised
to the length of the cerebrovascular cell (123 to 140 µm). Although the length
of a late pregnant myometrial cell in rat is about 200 to 700 µm, parameters of
all the force components for examples: the series and parallel stiffness constants,
optimal length of the active force component and cell length at zero passive force
were intended for cells with cell length similar to a vascular smooth muscle cell.
Therefore the parameter set belonging to the mechanical model will have to be
adjusted before applying to the myometrium.
Changing the current density of ICa−tot provided the most effective way of
raising the level of [ Ca2+ ]i , since the L-type Ca2+ channel is the major contrib-
utor to the Ca2+ influx in myometrium. When increasing the current density of
ICa−tot to four times the original value, the [ Ca2+ ]i level was increased drastically
to 334.65%, however the increase in contractions was only 53.73% compared to
the control case. This indicates other factors and mechanisms, not just the rising
level of [ Ca2+ ]i , also played a role in force generation. These factors include the
cell surface area to volume ratio and the length of the cell discussed previously.
Furthermore, varying values of ICa−tot changed the activation and inactivation
kinetics of the total force. When the influx of Ca2+ increased, the corresponding
contractions were more pronounced and lasted for a shorter time despite being
increased in magnitude. In contrast, the contractions were more sustained when
less Ca2+ was introduced to the cell.
Varying the current densities of INa−tot and IK−tot did not significantly affect
the maximum, time to peak and the relaxation of the contractions. This is due
to the fact that both Na+ and K+ currents do not play an important role in
force generation in myometrium. However, the decay of the [ Ca2+ ]i transient
was influenced strongly by the intracellular content of Na+ through the Na+ -
Ca2+ exchanger. Although the activation kinetics were not affected, the increase
of the influx of Na+ caused the [ Ca2+ ]i transient to decay faster in the model.
187
This contradicted the results obtained reported from Shmigol et al. [69]; the de-
cay of the [ Ca2+ ]i should be steeper when less Na+ was presented in the cell. As
discussed previously in carboxyeosin drug actions, the discrepancy might due to
the model’s description of INaCa . The equations describing INaCa were adapted
from the Hund-Rudy canine ventricular model, and not from pregnant rat my-
ometrium. Such tissue and species specific differences may account for the dis-
agreement.
Changes of the level of MLCK directly affected the magnitude of the contrac-
tions, because the Ca2+ -calmodulin-MLCK process was assumed to be the only
pathway for force generation in the myometrial model. Increasing the MLCK
level not only almost linearly elevated the basal and maximal contraction, it also
accelerated the activation kinetics so contractions reached their peak faster.
8.6 1-D strand
The myometrial cell model was integrated into a more complex description. A
1-D strand model was developed using a reaction-diffusion-type cable equation
to investigate how an action potential propagated along a fibre containing 50
cells. It was assumed that the myometrial cells were uniformly coupled and the
diffusion coefficient was spatially homogeneous. A current stimulus pulse was
applied to the first 10 cells in the strand for 2 s to investigate how the action
potential propagated.
Simulations from a 1-D strand model show the resting membrane potential
agreed well with the experimental values and stayed constant, while the AP
dampened along the strand. The conduction velocity measured from the model
was 1.32 cm/s which was slower compared to the experimentally observed values
in rat. Simulations also showed the AP was able to propagate along the strand
when the first 10 cells were stimulated. However, test simulations showed that
propagation over 60 cells were not observed even when different values of param-
eters were used. This may indicate that myometrial cells do not initiate electrical
signals from a defined area which consists of pacemaking cells unlike cardiac tis-
sues [227]. This also suggest that myometrial cells may have pacemaker activity
as proposed by various research groups [15, 247]. It was demonstrated in exper-
iments that multiple pacemaker sites were found in progesterone-dominated rat
and rabbit myometrium [248, 249]. More simulations have to be conducted with
188
multiple stimulating sites randomly distributed to clarify this finding.
8.7 Model limitations
The model successfully replicated the electrophysiological and mechanical activi-
ties seen in experimental recordings, however, the model was limited by the lack
of experimental data available for some of the membrane currents and the ex-
changer. Qualitative data on the SR was also not available in the myometrium
and the descriptions from other tissue types and different animals were therefore
substituted. Since the myometrium has unique characteristic which are not seen
in other smooth muscles, this might give rise to the discrepancies seen in some
simulated results. Furthermore, spatial heterogeneity of the cell, stretch- and
agonist-induced contractions are all important factors in regulating the myome-
trial cell function during pregnancy. These factors have to be considered in future
generations of the model in order to enhance the prediction of the myometrial
cell activity.
8.7.1 Mixing species and tissues data
Due to the shortage of late-pregnant rat myometrial data, descriptions of the
equations and parameters from human and other animals or different similar tis-
sues were substituted in the model. These equations were then adjusted to fit
the experimental recordings from myometrium. This limits the model’s ability
to accurately reproduce results seen in experiments, both in ionic currents and
contraction related data. Shmygol et al. addressed that there are clear discrep-
ancies between human and rat myometrial pacemaking mechanisms, which leads
to the concerns whether mechanisms found in rodent models can be eventually
applicable to human myometrium, and how relevant rodent studies are to hu-
man [15,201]. Different types of tissues also posed discrepancies and ideally, the
model will be significantly improved with additional myometrial data in both
species. Extra data is needed especially on INaCa and ICapump which greatly af-
fected the model’s output according to simulations of drug actions and sensitivity
analysis.
189
8.7.2 Stretch-induced effects on myometrium
Stretch-induced channel currents have been identified in various smooth muscles,
pregnant and non-pregnant myometrial cells [193, 250, 251], and is also studied
extensively in myocardium [252]. Kasai et al. reported that stretching tissues or
cells enhances uterine contractions in rats [253]. It induces a myogenic transient
contraction due to a sudden Ca2+ influx, the contraction generated depends on
the excursion and velocity of the stretch, i.e. rapidly stretching a tissue 30 to
35% its original length for 0.2 to 0.5 s create maximum contractions, whereas
stretching slowly rarely induces a contraction. In human cultured myometrial
cells, Dalrymple et al. found that stretch changes the [ Ca2+ ]i signalling and the
transient receptor potential canonical (TRPC) isoform expression [196]. This
effect has been described in various smooth muscle cell models [49], but it has
never been quantified in myometrium due to lack of experimental data. Including
this effect may increase the total force to a magnitude similar to that observed
experimentally.
8.7.3 Spatial heterogeneity
Spatial heterogeneity has been widely discussed in cardiac modelling [254–257],
but not in smooth muscles. The majority of existing smooth muscle models
assume spatial homogeneity and ignore some of the internal cellular compart-
ments. It has been reported that spatial heterogeneity in the cell result in dy-
namic changes and complex regulatory function which can affect physiological
responses in gastrointestinal and myometrial cells [4,36,135,179,258–262]. How-
ever more detailed studies are needed to fully describe the complicated structure
and dynamics in the SR.
8.7.4 Addition force generation pathways
As demonstrated in Wortmannin and force simulation, the description of con-
tractile force in the myometrial model is incomplete. Additional contractile force
generation pathways, aside from Ca2+ -CaCm-MLCK, do exist and the exclusion
of the extra pathways has therefore introduced greater limitations to the model.
Ultratonic agonists such as oxytocin, endothelin-1, carbachol, prostaglandins
and acetylcholine are known to increase [ Ca2+ ]i and contraction in myometrium
190
[246, 263, 264]. Various agonist-induced uterine contractions through protein ki-
nase C (PKC) were reported but not quantified. Endothelin-1 was found to be
involved in contraction through PKC in both non-pregnant [265] and late preg-
nant human tissues [266, 267]. In isometric force studies on human longitudinal
tissues, it was shown that the activation of PKC was vital for oxytocin-induced
contraction in labour [268]. However, this contradicted studies performed in
pregnant rat myometrial tissues in which it was reported that PKC activation
suppressed phasic contractions [269]. Furthermore, it was demonstrated that
phorbol 12,13-dibutylate also induced sustained contractions without increasing
[ Ca2+ ]i in both non-pregnant and pregnant human myometrium [263]. Exclu-
sion of all these mechanisms may result in the low magnitude of the total force
recorded and a rapid drop in contraction when MLCK was inhibited in simulation.
Therefore, to enhance the model’s ability in predicting the excitation-contraction
coupling in a myometrial cell, extra pathways must be considered.
8.7.5 1-D strand
The incorporation of the 1-D strand model was a simple one. The stimulus sites
initiated propagation at the beginning of the strand and occupied 20% (10 cells)
of the length of the total strand (50 cells). Although the number of stimulus sites
was relatively high, it was necessary for sufficient propagation along the strand.
However, there is no evidence as yet to support a defined anatomical pacemaking
site in the uterus, and if the pacemaking sites were distributed in several different
areas, less stimulus sites may be needed.
191
Chapter 9
Future plan
The understanding of the regulation of uterine function and contractility is in-
complete. As mentioned in the introduction, pre-term birth is by far the most
common cause of mortality and morbidity around the world and 40-45% of all pre-
term births are the result of pre-term labour [270]. The precise cause of pre-term
labour still remains elusive and little has changed in the last 40 years [271]. Stud-
ies have identified four different pathways that can cause pre-term labour, if one
or more of the pathways are activated. They are: 1) precocious fetal endocrine
activation, 2) uterine over-distension, 3) decidual bleeding and 4) intrauterine in-
flammation or infection [272]. However, prevention of pre-term labour has proven
difficult. Most of the drugs available to date lack uterine selectivity and may
present serious side effects to both mother and foetus [273]. Further development
of the myometrial model may help in the testing or validation of theories and
hypotheses raised. This may help in the identification of the underlying causes
of pre-term labour and allow better drugs to be developed for its treatment.
9.1 Single cell level
Simulated results highlighted some limitations of the myometrial model which
need to be addressed in order to improve the model. As discussed previously, there
are small but significant functional differences between human and rat myometrial
cells and tissues. Focus on developing a purely human myometrial model will
provide more accurate predictions when integrated into a tissue model. It has
been shown in experiments that the effects of oxytocin are important during
pregnancies in both human and rats. Oxytocin is a naturally occurring drug
192
produced in the third stage of labour [171]. The release of the drug provides
extra force, necessary to expel the foetus during delivery (the drug can also be
given externally). The effect of oxytocin has never been quantified in a modelling
environment. Stretch-induced contraction also proved to be significant, especially
during late gestation of the pregnancies [195] - adding these mechanisms may be
beneficial. The calcium handling of the model is a simple process. A more
complex system, for example including descriptions of IP3 receptors in the cell, is
needed in order to accurately predict the cellular calcium activities. Other force
generation pathways, aside from Ca2+ -CaCm-MLCK, should also be added in
the future generations of the model as it provides a more realistic approach.
Modelling G protein signalling and second messenger formation is also impor-
tant, since experimental evidence has shown that the increased levels of G α s,
promotes the effect of agonists that increase cAMP formation which assist re-
laxation in the uterus. Spontaneous labour may occur when the levels of G α s
drop, triggering contractions before term [273]. Therefore the management of this
G protein is vital during pregnancy and modelling this mechanism will provide
deeper insights into the cause of pre-term labour.
9.2 Tissue level
More detailed 1-D studies are needed to develop the model further. It is also
necessary to further integrate the 1-D strand model into a more complex 2-D
or 3-D model. Stimulations can be initiated from multiple sites (randomly or
fixed) to investigate electrical and mechanical activities during contraction and
observe how these signals travel across a tissue. This may help clarify and explain
whether all uterine cells have the capacity to act as pacemaker cells to initiate
spontaneous contractions, or if the uterus has defined pacemaking cells where
contractions are generated from.
193
Bibliography
[1] Wray S. Uterine contraction and physiological mechanisms of modulation.
Am J Physiol 1993;264(1 Pt 1):C1–18.
[2] Khan RN, Matharoo-Ball B, Arulkumaran S, Ashford ML. Potassium chan-
nels in the human myometrium. Exp Physiol 2001;86(2):255–64.
[3] Hall. The importance of preterm birth. Churchill Livingstone, London,
1997.
[4] Wray S, Jones K, Kupittayanant S, Li Y, Matthew A, Monir-Bishty E,
Noble K, Pierce SJ, Quenby S, Shmygol AV. Calcium signaling and uterine
contractility. J Soc Gynecol Investig Jul 2003;10(5):252–264.
[5] Adelstein RS, Hathaway DR. Role of calcium and cyclic adenosine 3’:5’
monophosphate in regulating smooth muscle contraction. Mechanisms of
excitation-contraction coupling in smooth muscle. Am J Cardiol 1979;
44(5):783–7.
[6] Blackburn S, Loper D. Maternal, fetal, and neonatal physiology: A clinical
perspective. Saunders Philadelphia, 1992.
[7] Hurd WW, Gibbs SG, Ventolini G, Horowitz GM, Guy SR. Shortening
increases spontaneous contractility in myometrium from pregnant women
at term. Am J Obstet Gynecol Apr 2005;192(4):1295–301; discussion 1301–
3.
[8] Yoshino M, Wang SY, Kao CY. Sodium and calcium inward currents in
freshly dissociated smooth myocytes of rat uterus. J Gen Physiol 1997;
110(5):565–77.
194
[9] Young RC. Tissue-level signaling and control of uterine contractility: the
action potential-calcium wave hypothesis. J Soc Gynecol Investig 2000;
7:146–52.
[10] Lammers WJ, Stephen B, Hamid R, Harron DW. The effects of oxytocin
on the pattern of electrical propagation in the isolated pregnant uterus of
the rat. Pflugers Arch Feb 1999;437(3):363–370.
[11] Kawarbayashi T. The Uterus-Electrophysiology of the human myometrium.
Cambridge University Press, 1994.
[12] Young RC. Myocytes, myometrium, and uterine contractions. Ann N Y
Acad Sci 2007;1101:72–84.
[13] Wray S, Kupittayanant S, Shmygol A, Smith RD, Burdyga T. The physio-
logical basis of uterine contractility: a short review. Exp Physiol Mar 2001;
86(2):239–246.
[14] Horowitz B, Ward SM, Sanders KM. Cellular and molecular basis for electri-
cal rhythmicity in gastrointestinal muscles. Annu Rev Physiol 1999;61:19–
43.
[15] Shmygol A, Blanks AM, Bru-Mercier G, Gullam JE, Thornton S. Control of
uterine Ca2+ by membrane voltage: toward understanding the excitation-
contraction coupling in human myometrium. Ann N Y Acad Sci 2007;
1101:97–109.
[16] Duquette RA, Shmygol A, Vaillant C, Mobasheri A, Pope M, Burdyga T,
Wray S. Vimentin-positive, c-kit-negative interstitial cells in human and
rat uterus: a role in pacemaking? Biol Reprod Feb 2005;72(2):276–283.
[17] Sanborn BM. Ion channels and the control of myometrial electrical activity.
Semin Perinatol 1995;19(1):31–40.
[18] Wilde DW, Marshall JM. Effects of tetraethylammonium and 4-
aminopyridine on the plateau potential of circular myometrium from the
pregnant rat. Biol Reprod May 1988;38(4):836–845.
[19] Bengtsson B, Chow EM, Marshall JM. Activity of circular muscle of rat
uterus at different times in pregnancy. Am J Physiol 1984;246(3 Pt 1):C216–
23.
195
[20] Chamley WA, Parkington HC. Relaxin inhibits the plateau component of
the action potential in the circular myometrium of the rat. J Physiol 1984;
353:51–65.
[21] RUDZIK AD, MILLER JW. The effect of altering the catecholamine con-
tent of the uterus on the rate of contractions and the sensitivity of the
myometrium to relaxin. J Pharmacol Exp Ther Oct 1962;138:88–95.
[22] RUDZIK AD, MILLER JW. The mechanism of uterine inhibitory action
of relaxin-containing ovarian extracts. J Pharmacol Exp Ther Oct 1962;
138:82–87.
[23] Sanborn BM. Relationship of ion channel activity to control of myometrial
calcium. J Soc Gynecol Investig 2000;7(1):4–11.
[24] Gilloteaux J, Szczepanski M. The fibre dimensions of uterine smooth muscle
of the rabbit following treatment by female sex steroids. Tissue Cell Jun
2000;32(3):243–248.
[25] Parkington HC, Tonta MA, Brennecke SP, Coleman HA. Contractile activ-
ity, membrane potential, and cytoplasmic calcium in human uterine smooth
muscle in the third trimester of pregnancy and during labor. Am J Obstet
Gynecol Dec 1999;181(6):1445–1451.
[26] Okabe K, Inoue Y, Kawarabayashi T, Kajiya H, Okamoto F, Soeda H. Phys-
iological significance of hyperpolarization-activated inward currents (Ih) in
smooth muscle cells from the circular layers of pregnant rat myometrium.
Pflugers Arch 1999;439(1-2):76–85.
[27] Inoue Y, Sperelakis N. Gestational change in Na+ and Ca2+ channel
current densities in rat myometrial smooth muscle cells. Am J Physiol
1991;260(3 Pt 1):C658–63.
[28] Tribe RM. Regulation of human myometrial contractility during pregnancy
and labour: are calcium homeostatic pathways important? Exp Physiol
Mar 2001;86(2):247–254.
[29] Knock GA, Smirnov SV, Aaronson PI. Voltage-gated K+ currents in freshly
isolated myocytes of the pregnant human myometrium. J Physiol 1999;518
(Pt 3):769–81.
196
[30] Knock GA, Tribe RM, Hassoni AA, Aaronson PI. Modulation of potas-
sium current characteristics in human myometrial smooth muscle by 17beta-
estradiol and progesterone. Biol Reprod 2001;64(5):1526–34.
[31] Wang SY, Yoshino M, Sui JL, Wakui M, Kao PN, Kao CY. Potassium
currents in freshly dissociated uterine myocytes from nonpregnant and late-
pregnant rats. J Gen Physiol 1998;112(6):737–756.
[32] Jones K, Shmygol A, Kupittayanant S, Wray S. Electrophysiological charac-
terization and functional importance of calcium-activated chloride channel
in rat uterine myocytes. Pflugers Arch 2004;448(1):36–43.
[33] Miyoshi H, Yamaoka K, Garfield RE, Ohama K. Identification of a non-
selective cation channel current in myometrial cells isolated from pregnant
rats. Pflugers Arch 2004;447(4):457–64.
[34] Molleman A. Patch Clamping : An Introductory Guide to Patch Clamp
Electrophysiology. New York John Wiley & Sons, Ltd., 2003.
[35] Wray S, Ravens U, Verkhratsky A, Eisner D. Two centuries of excitation-
contraction coupling. Cell Calcium Jun 2004;35(6):485–489.
[36] Wray S. Insights into the uterus. Exp Physiol Jul 2007;92(4):621–631.
[37] Wray S, Burdyga T, Noble K. Calcium signalling in smooth muscle. Cell
Calcium 2005;38(3-4):397–407.
[38] Bursztyn L, Eytan O, Jaffa AJ, Elad D. Mathematical model of excitation-
contraction in a uterine smooth muscle cell. Am J Physiol Cell Physiol
2007;292(5):C1816–29.
[39] Shmigol AV, Eisner DA, Wray S. The role of the sarcoplasmic reticulum
as a ca2+ sink in rat uterine smooth muscle cells. J Physiol 1999;520 Pt
1:153–163.
[40] Word RA. Myosin phosphorylation and the control of myometrial contrac-
tion/relaxation. Semin Perinatol Feb 1995;19(1):3–14.
[41] Wray S, Noble K. Sex hormones and excitation-contraction coupling in the
uterus: the effects of oestrous and hormones. J Neuroendocrinol Apr 2008;
20(4):451–461.
197
[42] Matthew A, Kupittayanant S, Burdyga T, Wray S. Characterization of
contractile activity and intracellular ca2+ signalling in mouse myometrium.
J Soc Gynecol Investig May 2004;11(4):207–212.
[43] Sanborn BM. Hormones and calcium: mechanisms controlling uterine
smooth muscle contractile activity. the litchfield lecture. Exp Physiol Mar
2001;86(2):223–237.
[44] Sanborn BM. Hormonal signaling and signal pathway crosstalk in the
control of myometrial calcium dynamics. Semin Cell Dev Biol Jun 2007;
18(3):305–314.
[45] Noble K, Matthew A, Burdyga T, Wray S. A review of recent insights
into the role of the sarcoplasmic reticulum and ca entry in uterine smooth
muscle. Eur J Obstet Gynecol Reprod Biol May 2009;144 Suppl 1:S11–S19.
[46] Lodish H, Berk A, Zipursky SL, Matsudaira P, Baltimore D, Darnell JE.
Molecular Cell Biology. 4th edition. W. H. Freeman & Co., 1999.
[47] Martini F. Fundamentals of Anatomy and Physiology. 7th edition. Pearson
Education, 2006.
[48] Gestrelius S, Borgstrm P. A dynamic model of smooth muscle contraction.
Biophys J Jul 1986;50(1):157–169.
[49] Yang J, Clark JW, Bryan RM, Robertson C. The myogenic response in
isolated rat cerebrovascular arteries: smooth muscle cell model. Med Eng
Phys Oct 2003;25(8):691–709.
[50] Hai CM, Murphy RA. Cross-bridge phosphorylation and regulation of latch
state in smooth muscle. Am J Physiol Jan 1988;254(1 Pt 1):C99–106.
[51] Hai CM, Murphy RA. Regulation of shortening velocity by cross-bridge
phosphorylation in smooth muscle. Am J Physiol Jul 1988;255(1 Pt 1):C86–
C94.
[52] Fung Y. Biomechanics: mechanical properties of living tissues. 2nd edition.
Springer, 1993.
198
[53] Youm JB, Kim N, Han J, Kim E, Joo H, Leem CH, Goto G, Noma A,
Earm YE. A mathematical model of pacemaker activity recorded from
mouse small intestine. Philos Transact A Math Phys Eng Sci May 2006;
364(1842):1135–1154.
[54] Rihana S, Santos J, Mondie S, Marque C. Dynamical analysis of uterine
cell electrical activity model. Conf Proc IEEE Eng Med Biol Soc 2006;
1:4179–4182.
[55] Kapela A, Bezerianos A, Tsoukias NM. A mathematical model of ca2+
dynamics in rat mesenteric smooth muscle cell: agonist and no stimulation.
J Theor Biol Jul 2008;253(2):238–260.
[56] Hai CM, Murphy RA. Ca2+, crossbridge phosphorylation, and contraction.
Annu Rev Physiol 1989;51:285–298.
[57] Hai CM, Murphy RA. Crossbridge phosphorylation and regulation of vascu-
lar smooth muscle contraction. Am J Hypertens Aug 1990;3(8 Pt 2):235S–
237S.
[58] P. FC, Marland ES, Wagner JM, Tyson JJ. Computational cell biology.
Springer Science, 2002.
[59] Hodgkin AL, Huxley AF. A quantitative description of membrane current
and its application, to conduction and excitation in nerve. J Physiol 1952;
117:500–544.
[60] Satoh H. Identification of a hyperpolarization-activated inward current
in uterine smooth muscle cells during pregnancy. Gen Pharmacol 1995;
26(6):1335–8.
[61] Chang DC. Dependence of cellular potential on ionic concentrations. data
supporting a modification of the constant field equation. Biophys J Aug
1983;43(2):149–156.
[62] Miyoshi H, Urabe T, Fujiwara A. Electrophysiological properties of mem-
brane currents in single myometrial, cells isolated from pregnant rats.
Pflugers Arch 1991;419(3-4):386–393.
199
[63] Sperelakis N, Inoue Y, Ohya Y. Fast Na+ channels and slow Ca2+ current
in smooth muscle from pregnant rat uterus. Mol Cell Biochem 1992;114(1-
2):79–89.
[64] Young RC, Smith LH, McLaren MD. T-type and l-type calcium currents in
freshly dispersed human uterine smooth muscle cells. Am J Obstet Gynecol
1993;169:785–792.
[65] Erulkar SD, Ludmir J, Ger B, Nori RD. Expression of different potassium
channels in cells isolated from human myometrium and leiomyomas. Am J
Obstet Gynecol 1993;168(5):1628–39.
[66] Jmari K, Mironneau C, Mironneau J. Inactivation of calcium channel
current in rat uterine smooth muscle: evidence for calcium- and voltage-
mediated mechanisms. J Physiol 1986;380:111–126.
[67] Amedee T, Mironneau C, Mironneau J. The calcium channel current of
pregnant rat single myometrial cells, in short-term primary culture. J Phys-
iol 1987;392:253–272.
[68] Yamamoto T. Effects of estrogens on Ca channels in myometrial cells iso-
lated from pregnant rats. Am J Physiol 1995;268(1 Pt 1):C64–9.
[69] Shmigol AV, Eisner DA, Wray S. Properties of voltage-activated [Ca2+]i
transients in single smooth muscle cells isolated from pregnant rat uterus.
J Physiol 1998;511 ( Pt 3):803–11.
[70] McDonald TF, Pelzer S, Trautwein W, Pelzer DJ. Regulation and mod-
ulation of calcium channels in cardiac, skeletal, and smooth muscle cells.
Physiol Rev Apr 1994;74(2):365–507.
[71] Okabe K, Inoue Y, Soeda H. Estradiol inhibits Ca2+ and K+ channels
in smooth muscle cells from pregnant rat myometrium. Eur J Pharmacol
1999;376(1-2):101–8.
[72] Ohya Y, Sperelakis N. Fast Na+ and slow Ca2+ channels in single uterine
muscle cells from pregnant rats. Am J Physiol 1989;257(2 Pt 1):C408–12.
[73] Parkington HC, Coleman HA. Excitability in uterine smooth muscle. Front
Horm Res 2001;27:179–200.
200
[74] Ohkubo T, Inoue Y, Kawarabayashi T, Kitamura K. Identification and
electrophysiological characteristics of isoforms of T-type calcium channel
Ca(v)3.2 expressed in pregnant human uterus. Cell Physiol Biochem 2005;
16(4-6):245–54.
[75] Asokan KT, Sarkar SN, Mishra SK, Raviprakash V. Effects of mibefradil
on uterine contractility. Eur J Pharmacol Nov 2002;455(1):65–71.
[76] Mishra SK, Hermsmeyer K. Selective inhibition of t-type ca2+ channels by
ro 40-5967. Circ Res Jul 1994;75(1):144–148.
[77] de Paoli MM, Manongi R, Klepp KI. Counsellors’ perspectives on antenatal
hiv testing and infant feeding dilemmas facing women with hiv in northern
tanzania. Reprod Health Matters Nov 2002;10(20):144–156.
[78] Inoue Y, Nakao K, Okabe K, Izumi H, Kanda S, Kitamura K, Kuriyama H.
Some electrical properties of human pregnant myometrium. Am J Obstet
Gynecol 1990;162(4):1090–8.
[79] Serrano JR, Perez-Reyes E, Jones SW. State-dependent inactivation of the
alpha1g t-type calcium channel. J Gen Physiol 1999;114:185–201.
[80] Hering J, Feltz A, Lambert RC. Slow inactivation of the Cav3.1 isotype of
T-type calcium channels. J Physiol 2003;555:331–344.
[81] Knock GA, Aaronson PI. Calcium antagonistic properties of the
cyclooxygenase-2 inhibitor nimesulide in human myometrial myocytes. Br
J Pharmacol 1999;127:1470–1478.
[82] Blanks AM, Zhao ZH, Shmygol A, Bru-Mercier G, Astle S, Thornton S.
Characterization of the molecular and electrophysiological properties of the
t-type calcium channel in human myometrium. J Physiol 2007;581:915–926.
[83] Amde T, Renaud JF, Jmari K, Lombet A, Mironneau J, Lazdunski M. The
presence of na+ channels in myometrial smooth muscle cells is revealed by
specific neurotoxins. Biochem Biophys Res Commun Jun 1986;137(2):675–
681.
[84] Young RC, Herndon-Smith L. Characterization of sodium channels in cul-
tured human uterine smooth muscle cells. Am J Obstet Gynecol Jan 1991;
164(1 Pt 1):175–181.
201
[85] Sperelakis N, Inoue Y, Ohya Y. Fast Na+ channels in smooth muscle from
pregnant rat uterus. Can J Physiol Pharmacol 1992;70(4):491–500.
[86] Greenwood IA, Leblanc N. Overlapping pharmacology of Ca2+-activated
Cl- and K+ channels. Trends Pharmacol Sci 2007;28(1):1–5.
[87] Putney JW. A model for receptor-regulated calcium entry. Cell Calcium
Feb 1986;7(1):1–12.
[88] Dalrymple A, Slater DM, Beech D, Poston L, Tribe RM. Molecular iden-
tification and localization of trp homologues, putative calcium channels, in
pregnant human uterus. Mol Hum Reprod Oct 2002;8(10):946–951.
[89] Yang M, Gupta A, Shlykov SG, Corrigan R, Tsujimoto S, Sanborn BM.
Multiple trp isoforms implicated in capacitative calcium entry are expressed
in human pregnant myometrium and myometrial cells. Biol Reprod Sep
2002;67(3):988–994.
[90] Beech DJ, Muraki K, Flemming R. Non-selective cationic channels of
smooth muscle and the mammalian homologues of drosophila trp. J Physiol
Sep 2004;559(Pt 3):685–706.
[91] Beech DJ. Trpc1: store-operated channel and more. Pflugers Arch Oct
2005;451(1):53–60.
[92] Babich LG, Ku CY, Young HWJ, Huang H, Blackburn MR, Sanborn BM.
Expression of capacitative calcium trpc proteins in rat myometrium during
pregnancy. Biol Reprod Apr 2004;70(4):919–924.
[93] Shimamura K, Kusaka M, Sperelakis N. Oxytocin induces an inward cur-
rent in pregnant rat myometrial cells. Can J Physiol Pharmacol Jul 1994;
72(7):759–763.
[94] Albert AP, Large WA. Store-operated ca2+-permeable non-selective cation
channels in smooth muscle cells. Cell Calcium 2003;33(5-6):345–356.
[95] Arnon A, Hamlyn JM, Blaustein MP. Na(+) entry via store-operated chan-
nels modulates ca(2+) signaling in arterial myocytes. Am J Physiol Cell
Physiol Jan 2000;278(1):C163–C173.
202
[96] Piedras-Renteria E, Stefani E, Toro L. Potassium currents in freshly dis-
persed myometrial cells. Am J Physiol 1991;261:C278–84.
[97] Khan RN, Smith SK, Ashford ML. Contribution of calcium-sensitive
potassium channels to NS1619-induced relaxation in human pregnant my-
ometrium. Hum Reprod 1998;13(1):208–213.
[98] Amberg GC, Baker SA, Koh SD, Hatton WJ, Murray KJ, Horowitz B,
Sanders KM. Characterization of the A-type potassium current in murine
gastric antrum. J Physiol 2002;544(Pt 2):417–28.
[99] Amberg GC, Koh SD, Imaizumi Y, Ohya S, Sanders KM. A-type potassium
currents in smooth muscle. Am J Physiol Cell Physiol 2003;284(3):C583–95.
[100] Anwer K, Toro L, Oberti C, Stefani E, Sanborn BM. Ca(2+)-activated K+
channels in pregnant rat myometrium: modulation by a beta-adrenergic
agent. Am J Physiol 1992;263(5 Pt 1):C1049–56.
[101] Zhou XB, Wang GX, Ruth P, Hneke B, Korth M. Bk(ca) channel activation
by membrane-associated cgmp kinase may contribute to uterine quiescence
in pregnancy. Am J Physiol Cell Physiol Dec 2000;279(6):C1751–C1759.
[102] Prez GJ, Toro L, Erulkar SD, Stefani E. Characterization of large-
conductance, calcium-activated potassium channels from human my-
ometrium. Am J Obstet Gynecol Feb 1993;168(2):652–660.
[103] Brainard AM, Miller AJ, Martens JR, England SK. Maxi-K channels local-
ize to caveolae in human myometrium: a role for an actin-channel-caveolin
complex in the regulation of myometrial smooth muscle K+ current. Am J
Physiol Cell Physiol 2005;289(1):C49–57.
[104] Shmygol A, Noble K, Wray S. Depletion of membrane cholesterol eliminates
the ca2+-activated component of outward potassium current and decreases
membrane capacitance in rat uterine myocytes. J Physiol Jun 2007;581(Pt
2):445–456.
[105] Flandroy L, Galand P. Oestrogen-induced increase in uterine cgmp con-
tent in vitro: effects of inhibitors of protein and rna synthesis. Mol Cell
Endocrinol Jan 1982;25(1):49–54.
203
[106] Izumi H, Garfield RE. Relaxant effects of nitric oxide and cyclic gmp on
pregnant rat uterine longitudinal smooth muscle. Eur J Obstet Gynecol
Reprod Biol Jun 1995;60(2):171–180.
[107] Mistry DK, Garland CJ. Nitric oxide (no)-induced activation of large con-
ductance ca2+-dependent k+ channels (bk(ca)) in smooth muscle cells iso-
lated from the rat mesenteric artery. Br J Pharmacol Jul 1998;124(6):1131–
1140.
[108] Inoue Y, Okabe K, Soeda H. Augmentation and suppression of action
potentials by estradiol in the myometrium of pregnant rat. Can J Physiol
Pharmacol 1999;77(6):447–53.
[109] Mironneau J. Ion channels and the control of uterine contractility. 1994.
[110] Manabe K, Takano M, Noma A. Non-selective cation current of guinea-pig
endocardial endothelial cells. J Physiol Sep 1995;487 ( Pt 2):407–419.
[111] Coleman HA, Parkington HC. Single channel cl- and k+ currents from cells
of uterus not treated with enzymes. Pflugers Arch Nov 1987;410(4-5):560–
562.
[112] Luo CH, Rudy Y. A dynamic model of the cardiac ventricular action po-
tential. II. Afterdepolarizations, triggered activity, and potentiation. Circ
Res 1994;74(6):1097–113.
[113] Hartzell C, Putzier I, Arreola J. Calcium-activated chloride channels. Annu
Rev Physiol 2005;67:719–58.
[114] Grover AK, Kwan CY, Daniel EE. Na–ca exchange in rat myometrium
membrane vesicles highly enriched in plasma membranes. Am J Physiol
1981;240:C175–82.
[115] Grover AK, Kwan CY, Rangachari PK, Daniel EE. Na-ca exchange in a
smooth muscle plasma membrane-enriched fraction. Am J Physiol 1983;
244:C158–65.
[116] Grover AK, Kwan CY. High affinity ca-binding to smooth muscle plasma
membrane: Inhibition by cations. Cell Calcium 1986;7:187–192.
204
[117] Taylor GS, Paton DM, Daniel EE. Evidence for an electrogenic sodium
pump in smooth muscle. Life Sci 1969;8:769–773.
[118] Taylor GS, Paton DM, Daniel EE. Characteristics of electrogenic sodium
pumping in rat myometrium. J Gen Physiol 1970;56:360–375.
[119] Turi A, Marcsek Z, Mullner N, Kucsera M, Bori Z. The activity
of na+/k(+)-atpase and abundance of its mrna are regulated in rat
myometrium during pregnancy. Biochem Biophys Res Commun 1992;
188:1191–1198.
[120] Nakao M, Gadsby DC. [na] and [k] dependence of the na/k pump current-
voltage relationship in guinea pig ventricular myocytes. J Gen Physiol 1989;
94:539–565.
[121] Nakamura Y, Ohya Y, Abe I, Fujishima M. Sodium-potassium pump cur-
rent in smooth muscle cells from mesenteric resistance arteries of the guinea-
pig. J Physiol 1999;519:203–212.
[122] Taggart MJ, Wray S. Agonist mobilization of sarcoplasmic reticular calcium
in smooth muscle: functional coupling to the plasmalemmal na+/ca2+
exchanger? Cell Calcium Nov 1997;22(5):333–341.
[123] Shmigol A, Eisner DA, Wray S. Carboxyeosin decreases the rate of decay of
the [Ca2+]i transient in uterine smooth muscle cells isolated from pregnant
rats. Pflugers Arch 1998;437(1):158–60.
[124] Abe Y. Effects of changing the ionic environment on passive and ac-
tive membrane properties of pregnant rat uterus. J Physiol Apr 1971;
214(1):173–190.
[125] Weber CR, Ginsburg KS, Philipson KD, Shannon TR, Bers DM. Allosteric
regulation of Na/Ca exchange current by cytosolic ca in intact cardiac my-
ocytes. J Gen Physiol 2001;117:119–131.
[126] Hund TJ, Rudy Y. Rate dependence and regulation of action potential and
calcium transient in a canine cardiac ventricular cell model. Circulation
2004;110(20):3168–3174.
205
[127] Johns A, Cutshaw SV. Furosemide-sensitive thallium fluxes in smooth mus-
cle of rabbit uterus. Am J Physiol Dec 1983;245(6):F778–F783.
[128] Pace AJ, Lee E, Athirakul K, Coffman TM, O’Brien DA, Koller BH. Fail-
ure of spermatogenesis in mouse lines deficient in the na(+)-k(+)-2cl(-)
cotransporter. J Clin Invest Feb 2000;105(4):441–450.
[129] Russell DW. Oxysterol biosynthetic enzymes. Biochim Biophys Acta Dec
2000;1529(1-3):126–135.
[130] Parkington HC, Tonta MA, Davies NK, Brennecke SP, Coleman HA. Hy-
perpolarization and slowing of the rate of contraction in human uterus in
pregnancy by prostaglandins e2 and f2alpha: involvement of the na+ pump.
J Physiol Jan 1999;514 ( Pt 1):229–243.
[131] Strieter J, Stephenson JL, Palmer LG, Weinstein AM. Volume-activated
chloride permeability can mediate cell volume regulation in a mathematical
model of a tight epithelium. J Gen Physiol Aug 1990;96(2):319–344.
[132] Volpe P, Martini A, Furlan S, Meldolesi J. Calsequestrin is a component of
smooth muscles: the skeletal- and cardiac-muscle isoforms are both present,
although in highly variable amounts and ratios. Biochem J Jul 1994;301 (
Pt 2):465–469.
[133] Milner RE, Baksh S, Shemanko C, Carpenter MR, Smillie L, Vance JE,
Opas M, Michalak M. Calreticulin, and not calsequestrin, is the major
calcium binding protein of smooth muscle sarcoplasmic reticulum and liver
endoplasmic reticulum. J Biol Chem Apr 1991;266(11):7155–7165.
[134] Jafri MS, Rice JJ, Winslow RL. Cardiac ca2+ dynamics: the roles of
ryanodine receptor adaptation and sarcoplasmic reticulum load. Biophys J
Mar 1998;74(3):1149–1168.
[135] Taggart MJ, Wray S. Contribution of sarcoplasmic reticular calcium to
smooth muscle contractile activation: gestational dependence in isolated
rat uterus. J Physiol Aug 1998;511 ( Pt 1):133–144.
[136] Kupittayanant S, Luckas MJM, Wray S. Effect of inhibiting the sarcoplas-
mic reticulum on spontaneous and oxytocin-induced contractions of human
myometrium. BJOG Mar 2002;109(3):289–296.
206
[137] Noble K, Wray S. The role of the sarcoplasmic reticulum in neonatal uterine
smooth muscle: enhanced role compared to adult rat. J Physiol Dec 2002;
545(Pt 2):557–566.
[138] Peterson JW. Simple model of smooth muscle myosin phosphorylation
and dephosphorylation as rate-limiting mechanism. Biophys J Feb 1982;
37(2):453–459.
[139] Kato S, Osa T, Ogasawara T. Kinetic model for isometric contraction in
smooth muscle on the basis of myosin phosphorylation hypothesis. Biophys
J Jul 1984;46(1):35–44.
[140] Murphy RA, Rembold CM, Hai CM. Contraction in smooth muscle: what
is latch? Prog Clin Biol Res 1990;327:39–50.
[141] Murphy RA, Rembold CM. The latch-bridge hypothesis of smooth muscle
contraction. Can J Physiol Pharmacol Oct 2005;83(10):857–864.
[142] Hai CM, Kim HR. An expanded latch-bridge model of protein kinase c-
mediated smooth muscle contraction. J Appl Physiol Apr 2005;98(4):1356–
1365.
[143] Hai CM, Rembold CM, Murphy RA. Can different four-state crossbridge
models explain latch and the energetics of vascular smooth muscle? Adv
Exp Med Biol 1991;304:159–170.
[144] Rembold CM, Murphy RA. Models of the mechanism for crossbridge at-
tachment in smooth muscle. J Muscle Res Cell Motil Jun 1993;14(3):325–
334.
[145] Bennett MR, Farnell L, Gibson WG. A quantitative description of the con-
traction of blood vessels following the release of noradrenaline from sympa-
thetic varicosities. J Theor Biol May 2005;234(1):107–122.
[146] Fajmut A, Brumen M. Mlc-kinase/phosphatase control of ca2+ signal
transduction in airway smooth muscles. J Theor Biol Jun 2008;252(3):474–
481.
[147] Parthimos D, Edwards DH, Griffith TM. Minimal model of arterial chaos
generated by coupled intracellular and membrane ca2+ oscillators. Am J
Physiol Sep 1999;277(3 Pt 2):H1119–H1144.
207
[148] Gasser H, Hill A. The dynamics of muscular contraction. Proceedings of
the Royal Society of London Series B Containing Papers of a Biological
Character 1924;96(678):398–437.
[149] Carlson BE, Secomb TW. A theoretical model for the myogenic response
based on the length-tension characteristics of vascular smooth muscle. Mi-
crocirculation Jun 2005;12(4):327–338.
[150] Kroon M. A constitutive model for smooth muscle including active tone
and passive viscoelastic behaviour. Math Med Biol Jul 2009;.
[151] Stlhand J, Klarbring A, Holzapfel GA. Smooth muscle contraction:
mechanochemical formulation for homogeneous finite strains. Prog Biophys
Mol Biol 2008;96(1-3):465–481.
[152] Warshaw DM, Fay FS. Cross-bridge elasticity in single smooth muscle cells.
J Gen Physiol Aug 1983;82(2):157–199.
[153] Warshaw DM. Force: velocity relationship in single isolated toad stomach
smooth muscle cells. J Gen Physiol May 1987;89(5):771–789.
[154] Warshaw DM, Rees DD, Fay FS. Characterization of cross-bridge elastic-
ity and kinetics of cross-bridge cycling during force development in single
smooth muscle cells. J Gen Physiol Jun 1988;91(6):761–779.
[155] Holmes JW. Teaching from classic papers: Hill’s model of muscle contrac-
tion. Adv Physiol Educ Jun 2006;30(2):67–72.
[156] Mollard P, Mironneau J, Amedee T, Mironneau C. Electrophysiological
characterization of single pregnant rat myometrial cells in short-term pri-
mary culture. Am J Physiol 1986;250(1 Pt 1):C47–54.
[157] Loewenstein WR. Junctional intercellular communication: the cell-to-cell
membrane channel. Physiol Rev Oct 1981;61(4):829–913.
[158] Okawa H. Electrical and mechanical interaction between the muscle layers
of rat uterus and different sensitivities to oxytocin. Bull Yamaguchi Med
School 1975;22:197–210.
[159] M.A. S, L. G, Kase N. Clinical gynecologic endocrinology and infertility.
5th edition. Williams and Wilkins, Baltimore, MA., 1994.
208
[160] Osa T, Ogasawara T. Effects in vitro of progesterone and estradiol-17b on
the contractileand electrical responses in rat myometrium. Jpn J Physiol
1984;34:427–411.
[161] Burdyga T, Borisova L, Burdyga A, Wray S. Temporal and spatial vari-
ations in spontaneous ca events and mechanical activity in pregnant rat
myometrium. European Journal of Obstetrics Gynecology and Reproduc-
tive Biology 2009;144:S25–S32.
[162] Choi HS, A. ED. The role of sarcolemmal ca2+-atpase in the regulation of
resting calcium concentration in rat ventricular myocytes. J Physiol 1998;
515:109–119.
[163] Gatto C, Hale CC, Xu W, Milanick MA. Eosin, a potent inhibitor of the
plasma membrane ca pump, does not inhibit the cardiac na-ca exchanger.
Biochemistry Jan 1995;34(3):965–972.
[164] Bassani RA, Bassani JW, Bers DM. Relaxation in ferret ventricular my-
ocytes: unusual interplay among calcium transport systems. J Physiol Apr
1994;476(2):295–308.
[165] King JF, Flenady V, Papatsonis D, Dekker G, Carbonne B. Calcium chan-
nel blockers for inhibiting preterm labour; a systematic review of the evi-
dence and a protocol for administration of nifedipine. Aust N Z J Obstet
Gynaecol Jun 2003;43(3):192–198.
[166] Maigaard S, Forman A, Brogaard-Hansen KP, Andersson KE. Inhibitory
effects of nitrendipine on myometrial and vascular smooth muscle in human
pregnant uterus and placenta. Acta Pharmacol Toxicol Copenh Jul 1986;
59(1):1–10.
[167] Balke CW, Goldman L. Excitation contraction coupling in cardiac muscle:
is there a purely voltage-dependent component? J Gen Physiol May 2003;
121(5):349–352.
[168] Iino M, Kobayashi T, Endo M. Use of ryanodine for functional removal
of the calcium store in smooth muscle cells of the guinea-pig. Biochem
Biophys Res Commun Apr 1988;152(1):417–422.
209
[169] Gilchrist JS, Belcastro AN, Katz S. Intraluminal ca2+ dependence of ca2+
and ryanodine-mediated regulation of skeletal muscle sarcoplasmic reticu-
lum ca2+ release. J Biol Chem Oct 1992;267(29):20850–20856.
[170] Young RC, Zhang P. The mechanism of propagation of intracellular calcium
waves in cultured human uterine myocytes. Am J Obstet Gynecol May
2001;184(6):1228–1234.
[171] Burghardt RC, Barhoumi R, Sanborn BM, Andersen J. Oxytocin-induced
ca2+ responses in human myometrial cells. Biol Reprod Apr 1999;
60(4):777–782.
[172] Westerblad H, Allen DG. Intracellular calibration of the calcium indicator
indo-1 in isolated fibers of xenopus muscle. Biophys J Aug 1996;71(2):908–
917.
[173] Mitsui M, Karaki H. Dual effects of carbachol on cytosolic ca2+ and con-
traction in intestinal smooth muscle. Am J Physiol May 1990;258(5 Pt
1):C787–C793.
[174] Kitazawa T, Hirama R, Masunaga K, Nakamura T, Asakawa K, Cao
J, Teraoka H, Unno T, ichi Komori S, Yamada M, Wess J, Taneike T.
Muscarinic receptor subtypes involved in carbachol-induced contraction of
mouse uterine smooth muscle. Naunyn Schmiedebergs Arch Pharmacol Jun
2008;377(4-6):503–513.
[175] Earley L, Wray S. Effects of hypoxia on force produced by agonists and
depolarization and arising spontaneously in the rat uterus. J Reprod Fertil
Nov 1993;99(2):539–544.
[176] Bae J, Peters-Golden M, Loch-Caruso R. Stimulation of pregnant rat uter-
ine contraction by the polychlorinated biphenyl (pcb) mixture aroclor 1242
may be mediated by arachidonic acid release through activation of phos-
pholipase a2 enzymes. J Pharmacol Exp Ther May 1999;289(2):1112–1120.
[177] Shmigol AV, Eisner DA, Wray S. Simultaneous measurements of changes
in sarcoplasmic reticulum and cytosolic. J Physiol Mar 2001;531(Pt 3):707–
713.
210
[178] Zraly Z, Kummer V, Veznik Z. Use of carbachol for dilatation of the cervix
in heifers. Theriogenology 1980;13(3):217–220.
[179] Shmygol A, Wray S. Modulation of agonist-induced ca2+ release by sr ca2+
load: direct sr and cytosolic ca2+ measurements in rat uterine myocytes.
Cell Calcium Mar 2005;37(3):215–223.
[180] Holda JR, Klishin A, Sedova M, Hser J, Blatter LA. Capacitative calcium
entry. News Physiol Sci Aug 1998;13:157–163.
[181] Putney Jr J, McKay R. Capacitative calcium entry channels. Bioessays
1999;21(1):38–46.
[182] Embrey MP. Letter: prostaglandin-induced abortion and cervical incom-
petence. Br Med J May 1975;2(5969):497.
[183] Keirse MJ. Therapeutic uses of prostaglandins. Baillieres Clin Obstet
Gynaecol Dec 1992;6(4):787–808.
[184] Longbottom ER, Luckas MJ, Kupittayanant S, Badrick E, Shmigol T, Wray
S. The effects of inhibiting myosin light chain kinase on contraction and
calcium signalling in human and rat myometrium. Pflugers Arch Jun 2000;
440(2):315–321.
[185] Sanborn BM, Rao BR, Korenman SG. Interaction of 17 -estradiol and
its specific uterine receptor. evidence for complex kinetic and equilibrium
behavior. Biochemistry Dec 1971;10(26):4955–4962.
[186] Puri CP, Garfield RE. Changes in hormone levels and gap junctions in
the rat uterus during pregnancy and parturition. Biol Reprod Nov 1982;
27(4):967–975.
[187] Sanborn BM, Dodge K, Monga M, Qian A, Wang W, Yue C. Molecular
mechanisms regulating the effects of oxytocin on myometrial intracellular
calcium. Adv Exp Med Biol 1998;449:277–286.
[188] Sims SM, Daniel EE, Garfield RE. Improved electrical coupling in uterine
smooth muscle is associated with increased numbers of gap junctions at
parturition. J Gen Physiol Sep 1982;80(3):353–375.
211
[189] CASTEELS R, KURIYAMA H. Membrane potential and ionic content in
pregnant and non-pregnant rat myometrium. J Physiol Mar 1965;177:263–
287.
[190] Garfield RE. Classic illustration from gap junctions: their presence and
necessity in myometrium during parturition. by r. e. garfield, et al, science
1977. Eur J Obstet Gynecol Reprod Biol Oct 1988;29(2):179–180.
[191] Word RA, Stull JT, Casey ML, Kamm KE. Contractile elements and myosin
light chain phosphorylation in myometrial tissue from nonpregnant and
pregnant women. J Clin Invest Jul 1993;92(1):29–37.
[192] Shynlova O, Kwong R, Lye SJ. Mechanical stretch regulates hypertrophic
phenotype of the myometrium during pregnancy. Reproduction Jan 2010;
139(1):247–253.
[193] Celik H, Ayar A, Sapmaz E. Effects of erythromycin on stretch-induced
contractile activity of isolated myometrium from pregnant women. Acta
Obstet Gynecol Scand Aug 2001;80(8):697–701.
[194] Shynlova OP, Oldenhof AD, Liu M, Langille L, Lye SJ. Regulation of c-fos
expression by static stretch in rat myometrial smooth muscle cells. Am J
Obstet Gynecol Jun 2002;186(6):1358–1365.
[195] Oldenhof AD, Shynlova OP, Liu M, Langille BL, Lye SJ. Mitogen-
activated protein kinases mediate stretch-induced c-fos mrna expression
in myometrial smooth muscle cells. Am J Physiol Cell Physiol Nov 2002;
283(5):C1530–C1539.
[196] Dalrymple A, Mahn K, Poston L, Songu-Mize E, Tribe RM. Mechanical
stretch regulates trpc expression and calcium entry in human myometrial
smooth muscle cells. Mol Hum Reprod Mar 2007;13(3):171–179.
[197] Rendt JM, Toro L, Stefani E, Erulkar SD. Progesterone increases ca2+
currents in myometrial cells from immature and nonpregnant adult rats.
Am J Physiol Feb 1992;262(2 Pt 1):C293–C301.
[198] Tezuka N, Ali M, Chwalisz K, Garfield RE. Changes in transcripts encod-
ing calcium channel subunits of rat myometrium during pregnancy. Am J
Physiol Oct 1995;269(4 Pt 1):C1008–C1017.
212
[199] Collins PL, Moore JJ, Lundgren DW, Choobineh E, Chang SM, Chang
AS. Gestational changes in uterine l-type calcium channel function and
expression in guinea pig. Biol Reprod Nov 2000;63(5):1262–1270.
[200] Mershon JL, Mikala G, Schwartz A. Changes in the expression of the l-type
voltage-dependent calcium channel during pregnancy and parturition in the
rat. Biol Reprod Nov 1994;51(5):993–999.
[201] Byron KL, Brueggemann LI. Labour pains: giving birth to new mechanisms
for the regulation of myometrial contractility. J Physiol May 2009;587(Pt
10):2109–2110.
[202] Greenwood IA, Yeung SY, Tribe RM, Ohya S. Loss of functional k+ chan-
nels encoded by ether--go-go-related genes in mouse myometrium prior to
labour onset. J Physiol May 2009;587(Pt 10):2313–2326.
[203] Smith RC, McClure MC, Smith MA, Abel PW, Bradley ME. The role of
voltage-gated potassium channels in the regulation of mouse uterine con-
tractility. Reprod Biol Endocrinol 2007;5:41.
[204] Song M, Helguera G, Eghbali M, Zhu N, Zarei MM, Olcese R, Toro L,
Stefani E. Remodeling of kv4.3 potassium channel gene expression under
the control of sex hormones. J Biol Chem Aug 2001;276(34):31883–31890.
[205] Lukas TJ, Haiech J, Lau W, Craig TA, Zimmer WE, Shattuck RL, Shoe-
maker MO, Watterson DM. Calmodulin and calmodulin-regulated protein
kinases as transducers of intracellular calcium signals. Cold Spring Harb
Symp Quant Biol 1988;53 Pt 1:185–193.
[206] Moore F, Bernal AL. Myosin light chain kinase and the onset of labour in
humans. Exp Physiol Mar 2001;86(2):313–318.
[207] Szal SE, Repke JT, Seely EW, Graves SW, Parker CA, Morgan KG. [ca2+]i
signaling in pregnant human myometrium. Am J Physiol Jul 1994;267(1
Pt 1):E77–E87.
[208] Weber LP, Lierop JEV, Walsh MP. Ca2+-independent phosphorylation of
myosin in rat caudal artery and chicken gizzard myofilaments. J Physiol
May 1999;516 ( Pt 3):805–824.
213
[209] Horowitz A, Clment-Chomienne O, Walsh MP, Morgan KG. Epsilon-
isoenzyme of protein kinase c induces a ca(2+)-independent contraction in
vascular smooth muscle. Am J Physiol Aug 1996;271(2 Pt 1):C589–C594.
[210] Garfield RE, Ali M, Yallampalli C, Izumi H. Role of gap junctions and
nitric oxide in control of myometrial contractility. Semin Perinatol Feb
1995;19(1):41–51.
[211] Cole WC, Garfield RE, Kirkaldy JS. Gap junctions and direct intercellular
communication between rat uterine smooth muscle cells. Am J Physiol Jul
1985;249(1 Pt 1):C20–C31.
[212] Cole WC, Garfield RE. Evidence for physiological regulation of myometrial
gap junction permeability. Am J Physiol Sep 1986;251(3 Pt 1):C411–C420.
[213] Miller SM, Garfield RE, Daniel EE. Improved propagation in myometrium
associated with gap junctions during parturition. Am J Physiol Jan 1989;
256(1 Pt 1):C130–C141.
[214] Sakai N, Tabb T, Garfield RE. Modulation of cell-to-cell coupling between
myometrial cells of the human uterus during pregnancy. Am J Obstet
Gynecol Aug 1992;167(2):472–480.
[215] Benson AP, Clayton RH, Holden AV, Kharche S, Tong WC. Endogenous
driving and synchronization in cardiac and uterine virtual tissues: bifurca-
tions and local coupling. Philos Transact A Math Phys Eng Sci May 2006;
364(1842):1313–1327.
[216] Fitzhugh R. Impulses and physiological states in theoretical models of nerve
membrane. Biophys J Jul 1961;1(6):445–466.
[217] Nagumo J, Arimoto S, Yoshizawa S. An active pulse transmission line
simulating nerve axon. Proceedings of the IRE 1962;50(10):2061–2070.
[218] Rihana S, Lefranois E, Marque C. A two dimension model of the uterine
electrical wave propagation. Conf Proc IEEE Eng Med Biol Soc 2007;
2007:1109–1112.
[219] Rihana S, Marque C. Preterm labor–modeling the uterine electrical activity
from cellular level to surface recording. Conf Proc IEEE Eng Med Biol Soc
2008;2008:3726–3729.
214
[220] Kuriyama H, Suzuki H. Changes in electrical properties of rat myometrium
during gestation and following hormonal treatments. J Physiol 1976;
260:315–333.
[221] Wesselink WA, Holsheimer J, Boom HB. A model of the electrical behaviour
of myelinated sensory nerve fibres based on human data. Med Biol Eng
Comput Mar 1999;37(2):228–235.
[222] FitzHugh R. Computation of impulse initiation and saltatory conduction
in a myelinated nerve fiber. Biophys J Jan 1962;2:11–21.
[223] Mori Y, Fishman GI, Peskin CS. Ephaptic conduction in a cardiac strand
model with 3d electrodiffusion. Proc Natl Acad Sci U S A Apr 2008;
105(17):6463–6468.
[224] Aslanidi OV, Stewart P, Boyett MR, Zhang H. Optimal velocity and safety
of discontinuous conduction through the heterogeneous purkinje-ventricular
junction. Biophys J Jul 2009;97(1):20–39.
[225] Stewart P, Aslanidi OV, Noble D, Noble PJ, Boyett MR, Zhang H. Math-
ematical models of the electrical action potential of purkinje fibre cells.
Philos Transact A Math Phys Eng Sci Jun 2009;367(1896):2225–2255.
[226] Cabo C, Barr RC. Reflection after delayed excitation in a computer model
of a single fiber. Circ Res Aug 1992;71(2):260–270.
[227] Kurjak A, Chervenak F. Textbook of perinatal medicine. Informa Health-
Care, 2006.
[228] Specht PC. Phase-plane analysis of action potentials in uterine smooth
muscle. Pflugers Arch Nov 1976;367(1):89–95.
[229] Wolfs GM, van Leeuwen M. Electromyographic observations on the human
uterus during labour. Acta Obstet Gynecol Scand Suppl 1979;90:1–61.
[230] Smith R. The endocrinology of parturition: Basic science and clinical ap-
plication. S Karger Pub, 2001.
[231] Wolfs G, Rottinghuis H. Electrical and mechanical activity of the human
uterus during labour. Arch Gynakol Apr 1970;208(4):373–385.
215
[232] Rihana S, Terrien J, Germain G, Marque C. Mathematical modeling of
electrical activity of uterine muscle cells. Med Biol Eng Comput Jun 2009;
47(6):665–675.
[233] Allen TJ. Temperature dependence of macroscopic L-type calcium channel
currents, in single guinea pig ventricular myocytes. J Cardiovasc Electro-
physiol 1996;7(4):307–321.
[234] Shmygol A, Wray S. Functional architecture of the sr calcium store in
uterine smooth muscle. Cell Calcium Jun 2004;35(6):501–508.
[235] Lindblad DS, Murphey CR, Clark JW, Giles WR. A model of the action
potential and underlying membrane currents in a rabbit atrial cell. Am J
Physiol Oct 1996;271(4 Pt 2):H1666–H1696.
[236] Wong AY, Klassen GA. A model of calcium regulation in smooth muscle
cell. Cell Calcium Mar 1993;14(3):227–243.
[237] Wong AY, Klassen GA. Endothelin-induced electrical activity and calcium
dynamics in vascular smooth muscle cells: a model study. Ann Biomed Eng
1996;24(5):547–560.
[238] Anderson NC, Ramon F, Snyder A. Studies on calcium and sodium in
uterine smooth muscle excitation under current-clamp and voltage-clamp
conditions. J Gen Physiol Sep 1971;58(3):322–339.
[239] Thomas RC. Electrogenic sodium pump in nerve and muscle cells. Physiol
Rev Jul 1972;52(3):563–594.
[240] Daniel E, Sehdev H, Robinson K. Mechanisms for activation of smooth
muscle. Physiol Rev 1962;42(Suppl 5):228–260.
[241] Casteels R. The action of ouabain on the smooth muscle cells of the guinea-
pig’s taenia coli. J Physiol May 1966;184(1):131–142.
[242] Matthews E, Sutter M. Ouabain-induced changes in the contractile and
electrical activity, potassium content, and response to drugs, of smooth
muscle cells. Canadian journal of physiology and pharmacology 1967;
45(3):509.
216
[243] Vassort G. Voltage-clamp analysis of transmembrane ionic currents in
guinea-pig myometrium: evidence for an initial potassium activation trig-
gered by calcium influx. J Physiol Nov 1975;252(3):713–734.
[244] Miyoshi H, Urabe S, Shimazutsu R, Samura O, Fujiwara H, Kudo Y. Mag-
nesium sulphate suppresses atp receptors in myometrial cells to inhibit uter-
ine contractility for tocolysis. American Journal of Obstetrics and Gyne-
cology 2006;195(6):S96.
[245] Kosterin SA, Burdyga TV, Fomin VP, Grover AK. Mechanisms of Ca2+
transport in myometrium In control of uterine contractility. Boca Raton,
FL: CRC press Inc., 1994.
[246] Luckas MJ, Taggart MJ, Wray S. Intracellular calcium stores and agonist-
induced contractions in isolated human myometrium. Am J Obstet Gynecol
Aug 1999;181(2):468–476.
[247] Marshall J. The physiology of the myometrium, In the Uterus. Baltimore:
Williams and Wilkins 89-109, 1973.
[248] MARSHALL JM. Regulation of activity in uterine smooth muscle. Physiol
Rev Suppl Jul 1962;5:213–227.
[249] Sigger JN, Harding R, Jenkin G. Relationship between electrical activ-
ity of the uterus and surgically isolated myometrium in the pregnant and
nonpregnant ewe. J Reprod Fertil Jan 1984;70(1):103–114.
[250] Shintani Y, Hirano K, Nishimura J, Nakano H, Kanaide H. Enhanced
contractile response to thrombin in the pregnant rat myometrium. Br J
Pharmacol Dec 2000;131(8):1619–1628.
[251] Douglas AJ, Clarke EW, Goldspink DF. Influence of mechanical stretch on
growth and protein turnover of rat uterus. Am J Physiol May 1988;254(5
Pt 1):E543–E548.
[252] Riemer RK, Heymann MA. Regulation of uterine smooth muscle function
during gestation. Pediatr Res Nov 1998;44(5):615–627.
[253] Kasai Y, Tsutsumi O, Taketani Y, Endo M, Iino M. Stretch-induced en-
hancement of contractions in uterine smooth muscle of rats. J Physiol Jul
1995;486 ( Pt 2):373–384.
217
[254] Dupont G, Pontes J, Goldbeter A. Modeling spiral ca2+ waves in single
cardiac cells: role of the spatial heterogeneity created by the nucleus. Am
J Physiol Oct 1996;271(4 Pt 1):C1390–C1399.
[255] Tea BS, Dam TV, Moreau P, Hamet P, deBlois D. Apoptosis during regres-
sion of cardiac hypertrophy in spontaneously hypertensive rats. temporal
regulation and spatial heterogeneity. Hypertension Aug 1999;34(2):229–235.
[256] Decking UKM. Spatial heterogeneity in the heart: recent insights and open
questions. News Physiol Sci Dec 2002;17:246–250.
[257] Huo Y, Kaimovitz B, Lanir Y, Wischgoll T, Hoffman JIE, Kassab GS.
Biophysical model of the spatial heterogeneity of myocardial flow. Biophys
J May 2009;96(10):4035–4043.
[258] Toescu EC. Temporal and spatial heterogeneities of ca2+ signaling: mech-
anisms and physiological roles. Am J Physiol Aug 1995;269(2 Pt 1):G173–
G185.
[259] Young RC, Zhang P. Functional separation of deep cytoplasmic calcium
from subplasmalemmal space calcium in cultured human uterine smooth
muscle cells. Cell Calcium Jul 2004;36(1):11–17.
[260] Draeger A, Wray S, Babiychuk EB. Domain architecture of the smooth-
muscle plasma membrane: regulation by annexins. Biochem J Apr 2005;
387(Pt 2):309–314.
[261] Noble K, Zhang J, Wray S. Lipid rafts, the sarcoplasmic reticulum and
uterine calcium signalling: an integrated approach. J Physiol Jan 2006;
570(Pt 1):29–35.
[262] Floyd R, Wray S. Calcium transporters and signalling in smooth muscles.
Cell Calcium 2007;42(4-5):467–476.
[263] Ozaki H, Yasuda K, Kim YS, Egawa M, Kanzaki H, Nakazawa H, Hori M,
Seto M, Karaki H. Possible role of the protein kinase c/cpi-17 pathway
in the augmented contraction of human myometrium after gestation. Br J
Pharmacol Dec 2003;140(7):1303–1312.
218
[264] Sanborn BM, Yue C, Wang W, Dodge KL. G protein signalling pathways
in myometrium: affecting the balance between contraction and relaxation.
Rev Reprod Sep 1998;3(3):196–205.
[265] Breuiller-Fouch M, Tertrin-Clary C, Hluy V, Fournier T, Ferr F. Role of
protein kinase c in endothelin-1-induced contraction of human myometrium.
Biol Reprod Jul 1998;59(1):153–159.
[266] Eude I, Paris B, Cabrol D, Ferr F, Breuiller-Fouch M. Selective protein
kinase c isoforms are involved in endothelin-1-induced human uterine con-
traction at the end of pregnancy. Biol Reprod Nov 2000;63(5):1567–1573.
[267] Liberto GD, Dallot E, Parco IEL, Cabrol D, Ferr F, Breuiller-Fouch M. A
critical role for pkc zeta in endothelin-1-induced uterine contractions at the
end of pregnancy. Am J Physiol Cell Physiol Sep 2003;285(3):C599–C607.
[268] Morrison JJ, Dearn SR, Smith SK, Ahmed A. Activation of protein ki-
nase c is required for oxytocin-induced contractility in human pregnant
myometrium. Hum Reprod Oct 1996;11(10):2285–2290.
[269] Phillippe M. Protein kinase c, an inhibitor of oxytocin-stimulated phasic
myometrial contractions. Biol Reprod Apr 1994;50(4):855–859.
[270] Goldenberg RL, Culhane JF, Iams JD, Romero R. Epidemiology and causes
of preterm birth. Lancet Jan 2008;371(9606):75–84.
[271] Creasy RK. Preventing preterm birth. N Engl J Med Sep 1991;325(10):727–
729.
[272] Simhan HN, Caritis SN. Prevention of preterm delivery. N Engl J Med
Aug 2007;357(5):477–487.
[273] Bernal AL, Europe-Finner GN, Phaneuf S, Watson SP. Preterm labour: a
pharmacological challenge. Trends Pharmacol Sci Apr 1995;16(4):129–133.
219
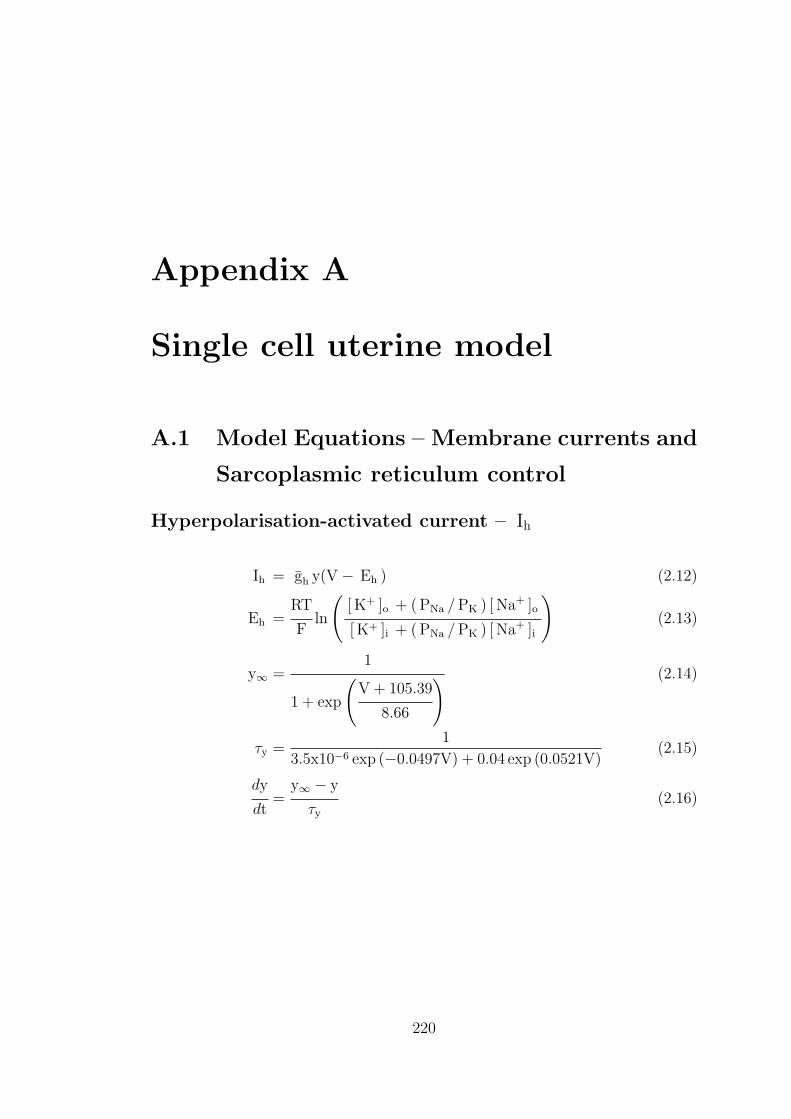
Appendix A
Single cell uterine model
A.1 Model Equations – Membrane currents and
Sarcoplasmic reticulum control
Hyperpolarisation-activated current – Ih
Ih = gh y(V − Eh ) (2.12)
Eh =RT
Fln
([ K+ ]o + ( PNa / PK ) [ Na+ ]o
[ K+ ]i + ( PNa / PK ) [ Na+ ]i
)(2.13)
y∞ =1
1 + exp
(V + 105.39
8.66
) (2.14)
τy =1
3.5x10⁻⁶ exp (−0.0497V) + 0.04 exp (0.0521V)(2.15)
dy
dt=
y∞ − y
τy
(2.16)
220
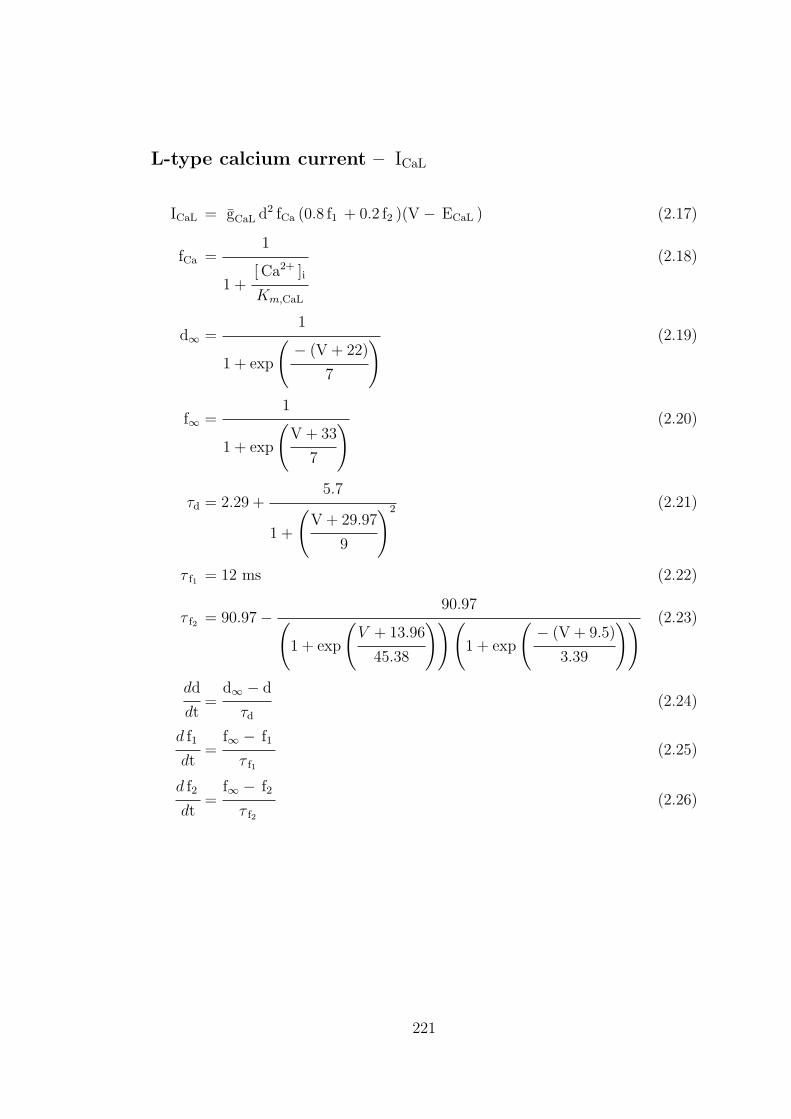
L-type calcium current – ICaL
ICaL = gCaL d2 fCa (0.8 f1 + 0.2 f2 )(V − ECaL ) (2.17)
fCa =1
1 +[ Ca2+ ]i
Km,CaL
(2.18)
d∞ =1
1 + exp
(− (V + 22)
7
) (2.19)
f∞ =1
1 + exp
(V + 33
7
) (2.20)
τd = 2.29 +5.7
1 +
(V + 29.97
9
)2 (2.21)
τ f1 = 12 ms (2.22)
τ f2 = 90.97− 90.97(
1 + exp
(V + 13.96
45.38
))(1 + exp
(− (V + 9.5)
3.39
)) (2.23)
dd
dt=
d∞ − d
τd
(2.24)
d f1
dt=
f∞ − f1
τ f1
(2.25)
d f2
dt=
f∞ − f2
τ f2
(2.26)
221
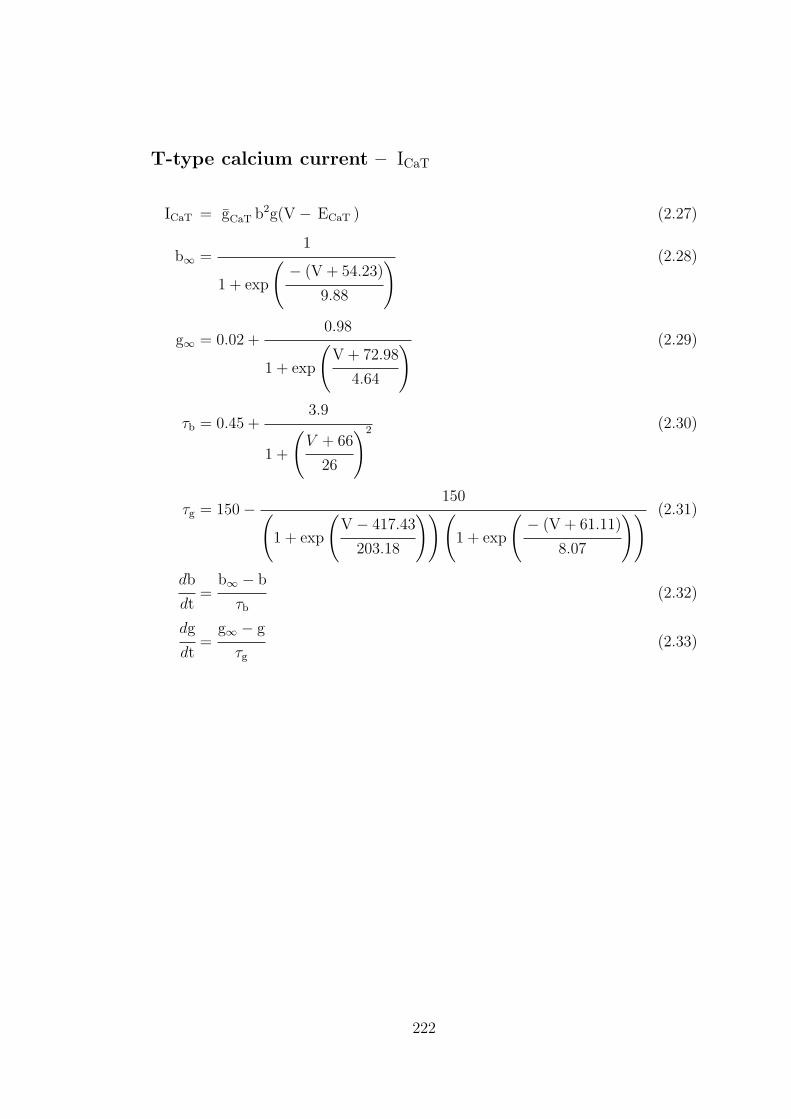
T-type calcium current – ICaT
ICaT = gCaT b2g(V − ECaT ) (2.27)
b∞ =1
1 + exp
(− (V + 54.23)
9.88
) (2.28)
g∞ = 0.02 +0.98
1 + exp
(V + 72.98
4.64
) (2.29)
τb = 0.45 +3.9
1 +
(V + 66
26
)2 (2.30)
τg = 150− 150(
1 + exp
(V − 417.43
203.18
))(1 + exp
(− (V + 61.11)
8.07
)) (2.31)
db
dt=
b∞ − b
τb
(2.32)
dg
dt=
g∞ − g
τg
(2.33)
222
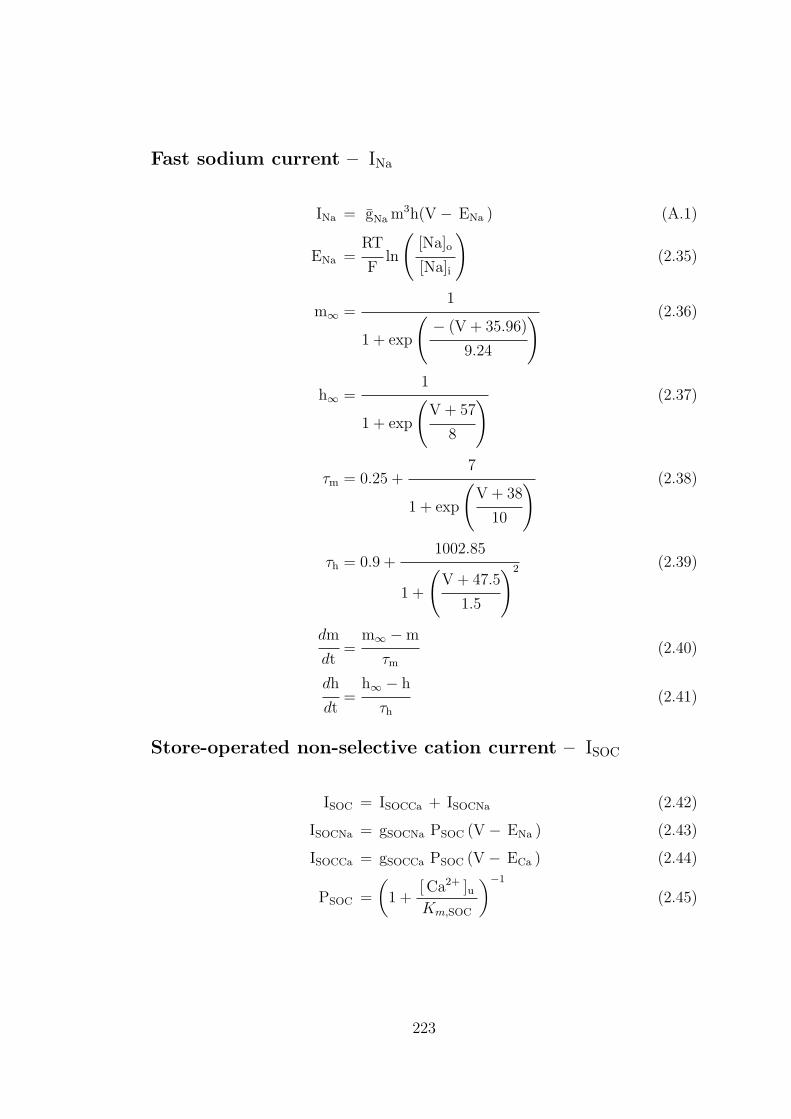
Fast sodium current – INa
INa = gNa m3h(V − ENa ) (A.1)
ENa =RT
Fln
([Na]o
[Na]i
)(2.35)
m∞ =1
1 + exp
(− (V + 35.96)
9.24
) (2.36)
h∞ =1
1 + exp
(V + 57
8
) (2.37)
τm = 0.25 +7
1 + exp
(V + 38
10
) (2.38)
τh = 0.9 +1002.85
1 +
(V + 47.5
1.5
)2 (2.39)
dm
dt=
m∞ −m
τm
(2.40)
dh
dt=
h∞ − h
τh
(2.41)
Store-operated non-selective cation current – ISOC
ISOC = ISOCCa + ISOCNa (2.42)
ISOCNa = gSOCNa PSOC (V − ENa ) (2.43)
ISOCCa = gSOCCa PSOC (V − ECa ) (2.44)
PSOC =
(1 +
[ Ca2+ ]uKm,SOC
)−1
(2.45)
223
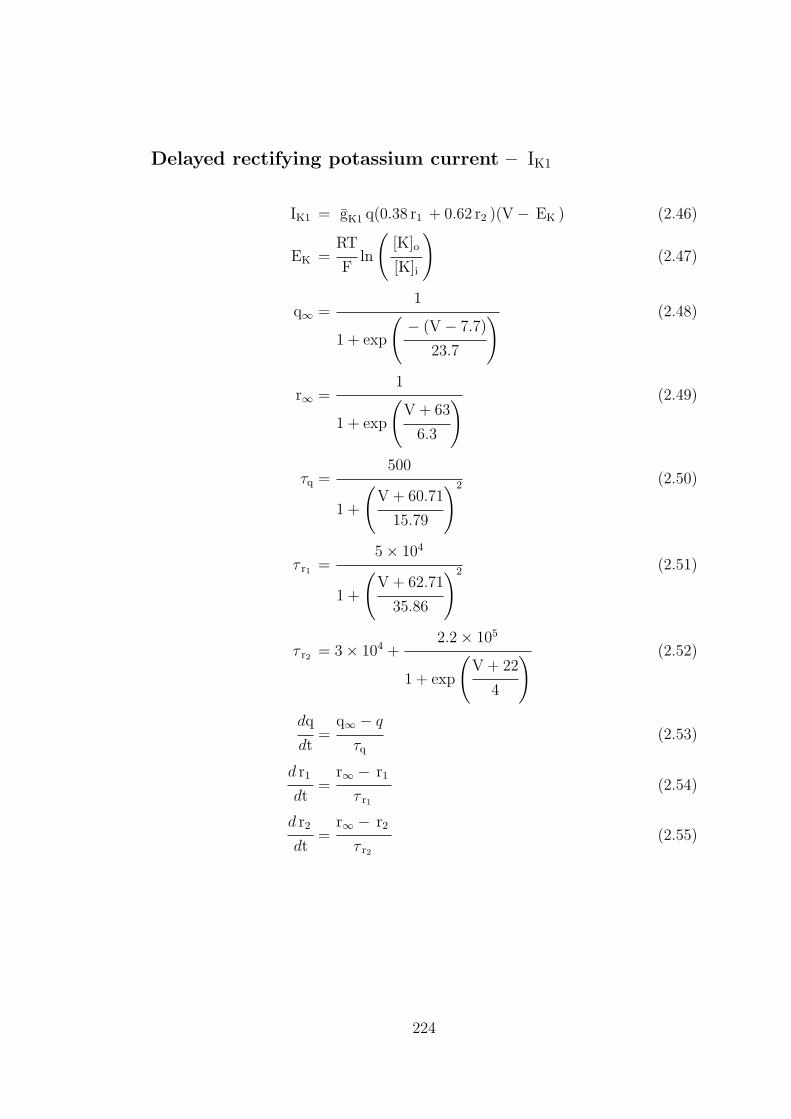
Delayed rectifying potassium current – IK1
IK1 = gK1 q(0.38 r1 + 0.62 r2 )(V − EK ) (2.46)
EK =RT
Fln
([K]o
[K]i
)(2.47)
q∞ =1
1 + exp
(− (V − 7.7)
23.7
) (2.48)
r∞ =1
1 + exp
(V + 63
6.3
) (2.49)
τq =500
1 +
(V + 60.71
15.79
)2 (2.50)
τ r1 =5× 10⁴
1 +
(V + 62.71
35.86
)2 (2.51)
τ r2 = 3× 10⁴ +2.2× 10⁵
1 + exp
(V + 22
4
) (2.52)
dq
dt=
q∞ − q
τq
(2.53)
d r1
dt=
r∞ − r1
τ r1
(2.54)
d r2
dt=
r∞ − r2
τ r2
(2.55)
224
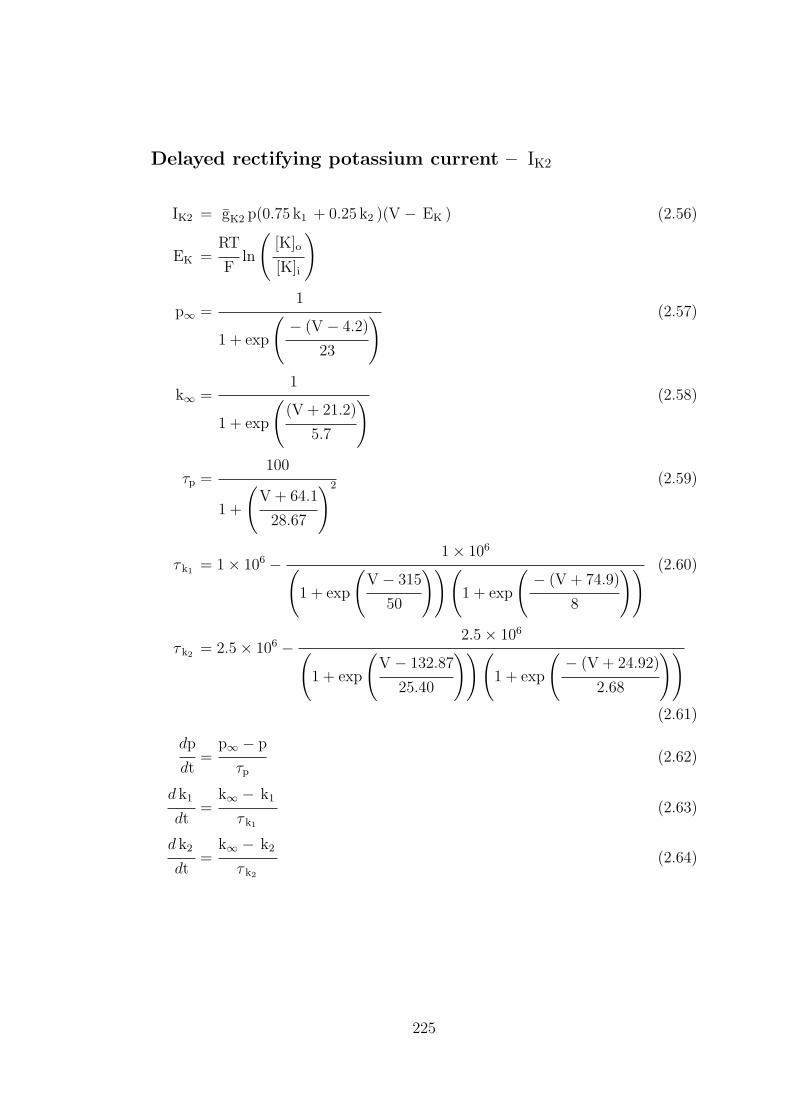
Delayed rectifying potassium current – IK2
IK2 = gK2 p(0.75 k1 + 0.25 k2 )(V − EK ) (2.56)
EK =RT
Fln
([K]o
[K]i
)
p∞ =1
1 + exp
(− (V − 4.2)
23
) (2.57)
k∞ =1
1 + exp
((V + 21.2)
5.7
) (2.58)
τp =100
1 +
(V + 64.1
28.67
)2 (2.59)
τ k1 = 1× 10⁶ − 1× 10⁶
(1 + exp
(V − 315
50
))(1 + exp
(− (V + 74.9)
8
)) (2.60)
τ k2 = 2.5× 10⁶ − 2.5× 10⁶
(1 + exp
(V − 132.87
25.40
))(1 + exp
(− (V + 24.92)
2.68
))
(2.61)
dp
dt=
p∞ − p
τp
(2.62)
d k1
dt=
k∞ − k1
τ k1
(2.63)
d k2
dt=
k∞ − k2
τ k2
(2.64)
225
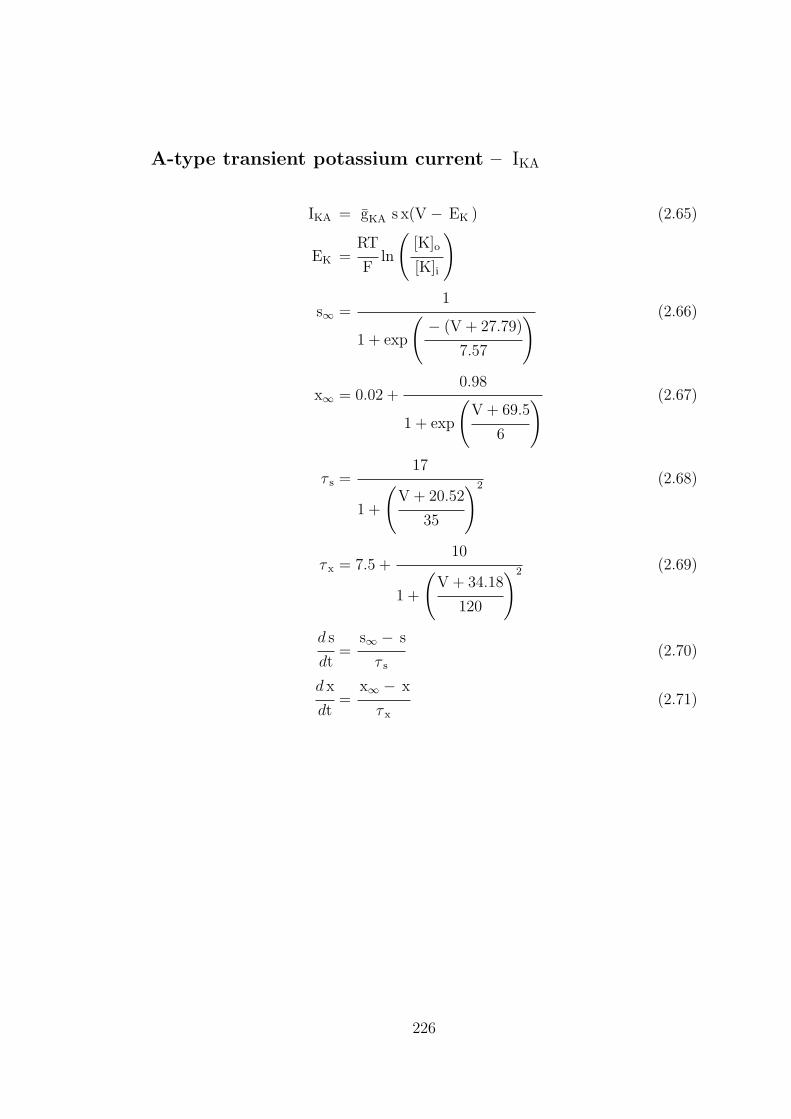
A-type transient potassium current – IKA
IKA = gKA s x(V − EK ) (2.65)
EK =RT
Fln
([K]o
[K]i
)
s∞ =1
1 + exp
(− (V + 27.79)
7.57
) (2.66)
x∞ = 0.02 +0.98
1 + exp
(V + 69.5
6
) (2.67)
τ s =17
1 +
(V + 20.52
35
)2 (2.68)
τ x = 7.5 +10
1 +
(V + 34.18
120
)2 (2.69)
d s
dt=
s∞ − s
τ s
(2.70)
d x
dt=
x∞ − x
τ x
(2.71)
226
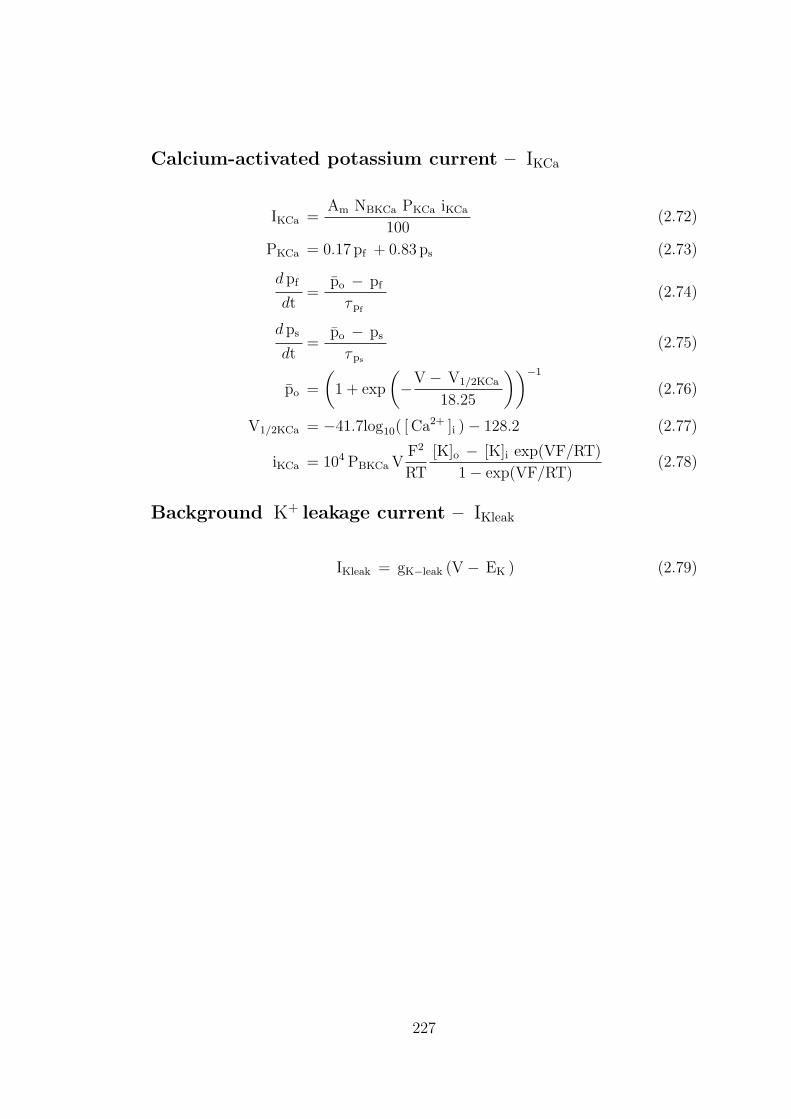
Calcium-activated potassium current – IKCa
IKCa =Am NBKCa PKCa iKCa
100(2.72)
PKCa = 0.17 pf + 0.83 ps (2.73)
d pf
dt=
po − pf
τpf
(2.74)
d ps
dt=
po − ps
τ ps
(2.75)
po =
(1 + exp
(−V − V1/2KCa
18.25
))−1
(2.76)
V1/2KCa = −41.7log10( [ Ca2+ ]i )− 128.2 (2.77)
iKCa = 104 PBKCa VF2
RT
[K]o − [K]i exp(VF/RT)
1− exp(VF/RT)(2.78)
Background K+ leakage current – IKleak
IKleak = gK−leak (V − EK ) (2.79)
227
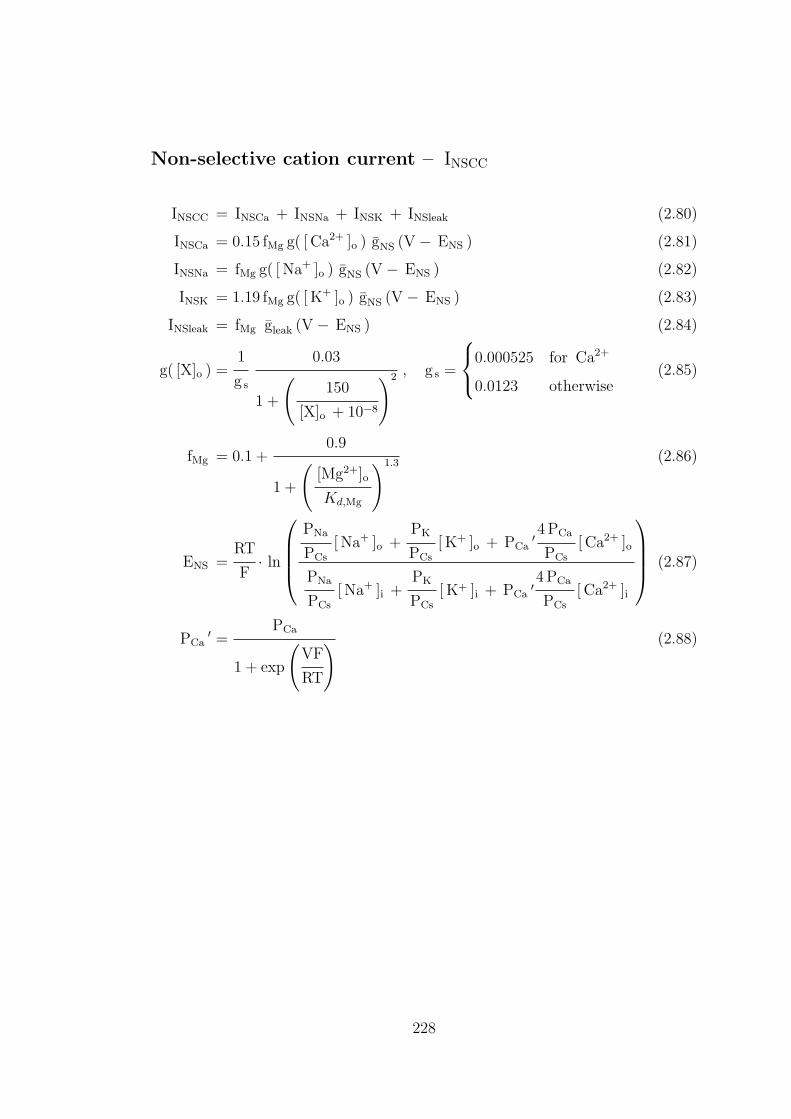
Non-selective cation current – INSCC
INSCC = INSCa + INSNa + INSK + INSleak (2.80)
INSCa = 0.15 fMg g( [ Ca2+ ]o ) gNS (V − ENS ) (2.81)
INSNa = fMg g( [ Na+ ]o ) gNS (V − ENS ) (2.82)
INSK = 1.19 fMg g( [ K+ ]o ) gNS (V − ENS ) (2.83)
INSleak = fMg gleak (V − ENS ) (2.84)
g( [X]o ) =1
g s
0.03
1 +
(150
[X]o + 10−8
)2 , g s =
0.000525 for Ca2+
0.0123 otherwise(2.85)
fMg = 0.1 +0.9
1 +
([Mg2+]o
Kd,Mg
)1.3 (2.86)
ENS =RT
F· ln
PNa
PCs
[ Na+ ]o +PK
PCs
[ K+ ]o + PCa′4 PCa
PCs
[ Ca2+ ]o
PNa
PCs
[ Na+ ]i +PK
PCs
[ K+ ]i + PCa′4 PCa
PCs
[ Ca2+ ]i
(2.87)
PCa′ =
PCa
1 + exp
(VF
RT
) (2.88)
228
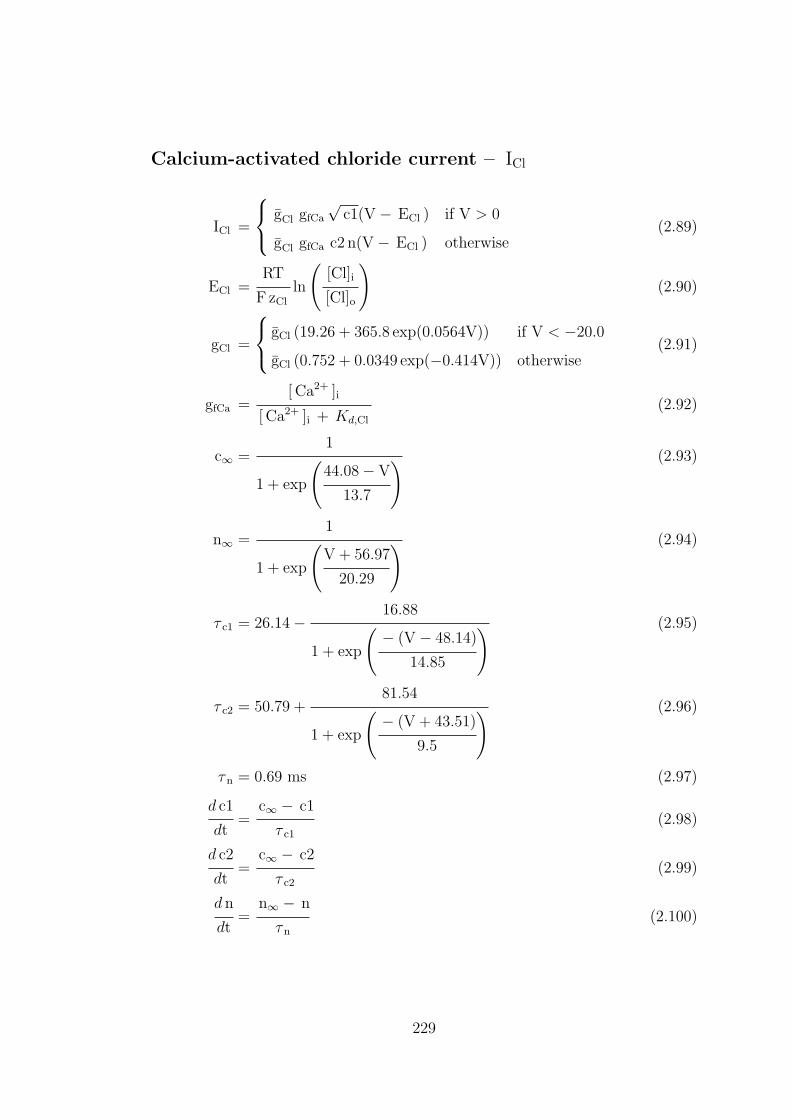
Calcium-activated chloride current – ICl
ICl =
gCl gfCa
√c1(V − ECl ) if V > 0
gCl gfCa c2 n(V − ECl ) otherwise(2.89)
ECl =RT
F zCl
ln
([Cl]i
[Cl]o
)(2.90)
gCl =
gCl (19.26 + 365.8 exp(0.0564V)) if V < −20.0
gCl (0.752 + 0.0349 exp(−0.414V)) otherwise(2.91)
gfCa =[ Ca2+ ]i
[ Ca2+ ]i + Kd,Cl
(2.92)
c∞ =1
1 + exp
(44.08− V
13.7
) (2.93)
n∞ =1
1 + exp
(V + 56.97
20.29
) (2.94)
τ c1 = 26.14− 16.88
1 + exp
(− (V − 48.14)
14.85
) (2.95)
τ c2 = 50.79 +81.54
1 + exp
(− (V + 43.51)
9.5
) (2.96)
τn = 0.69 ms (2.97)
d c1
dt=
c∞ − c1
τ c1
(2.98)
d c2
dt=
c∞ − c2
τ c2
(2.99)
d n
dt=
n∞ − n
τn
(2.100)
229
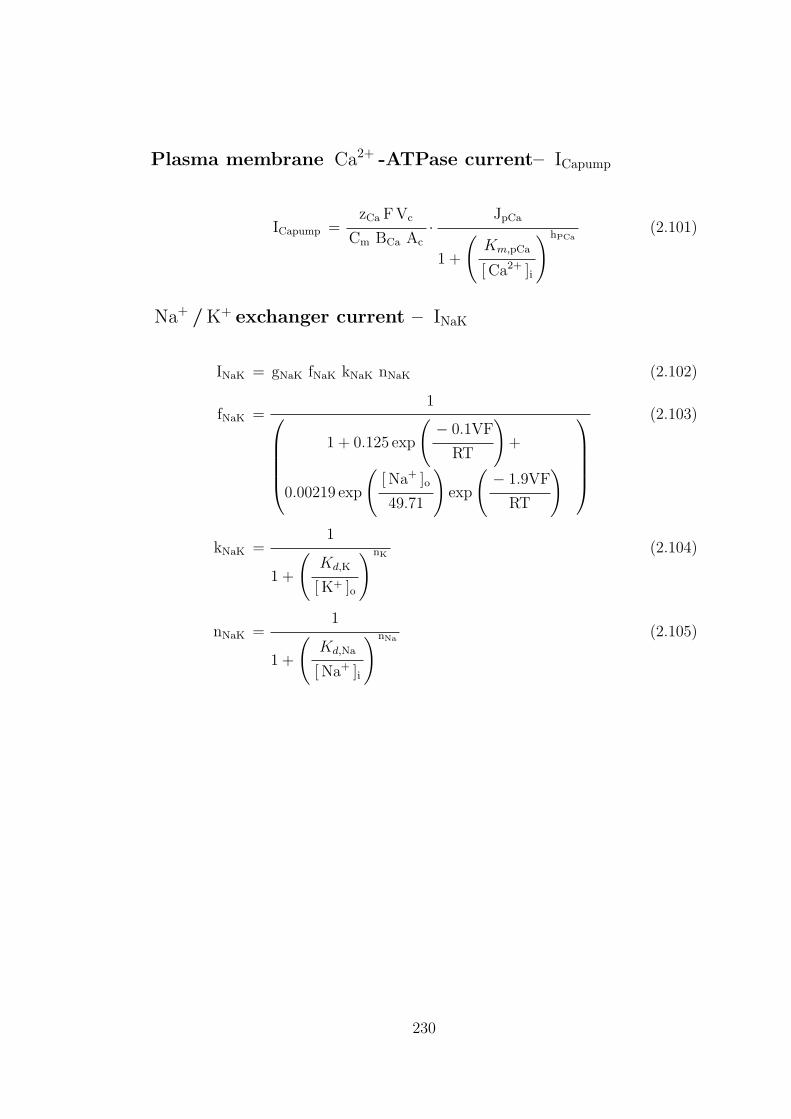
Plasma membrane Ca2+ -ATPase current– ICapump
ICapump =zCa F Vc
Cm BCa Ac
· JpCa
1 +
(Km,pCa
[ Ca2+ ]i
) hPCa(2.101)
Na+ / K+ exchanger current – INaK
INaK = gNaK fNaK kNaK nNaK (2.102)
fNaK =1
1 + 0.125 exp
(− 0.1VF
RT
)+
0.00219 exp
([ Na+ ]o
49.71
)exp
(− 1.9VF
RT
)
(2.103)
kNaK =1
1 +
(Kd,K
[ K+ ]o
)nK(2.104)
nNaK =1
1 +
(Kd,Na
[ Na+ ]i
)nNa(2.105)
230
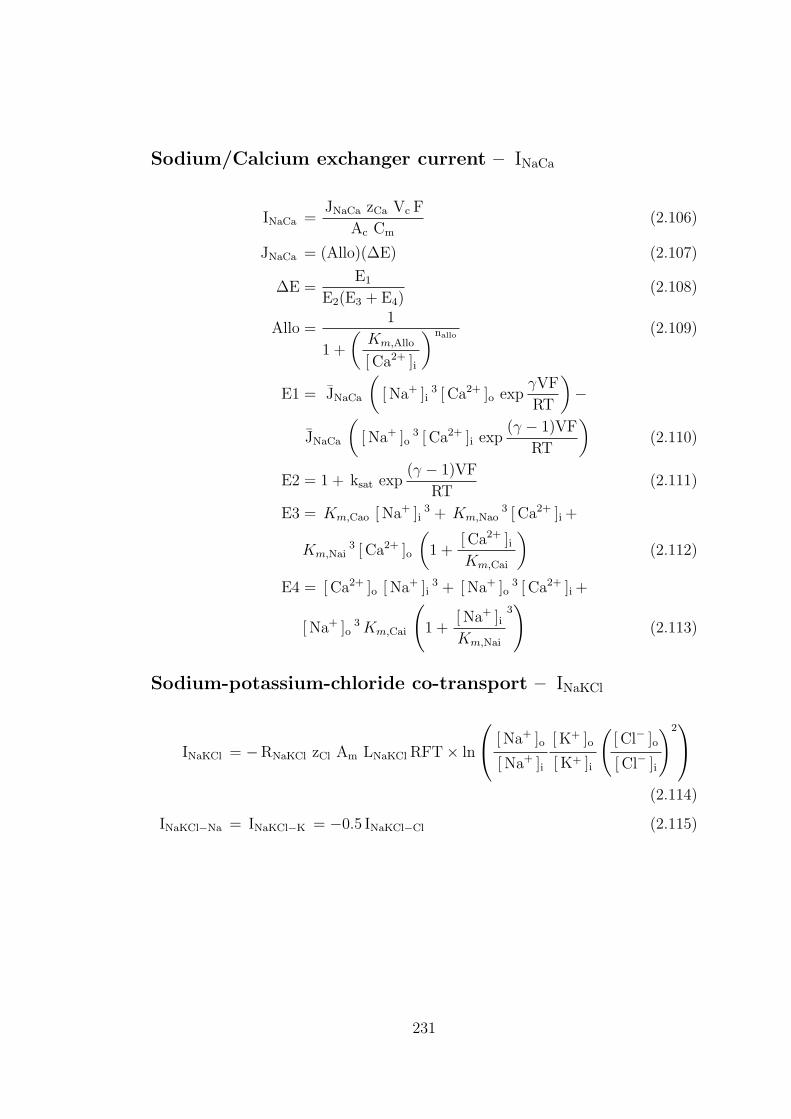
Sodium/Calcium exchanger current – INaCa
INaCa =JNaCa zCa Vc F
Ac Cm
(2.106)
JNaCa = (Allo)(∆E) (2.107)
∆E =E1
E2(E3 + E4)(2.108)
Allo =1
1 +
(Km,Allo
[ Ca2+ ]i
) nallo(2.109)
E1 = JNaCa
([ Na+ ]i
3 [ Ca2+ ]o expγVF
RT
)−
JNaCa
([ Na+ ]o
3 [ Ca2+ ]i exp(γ − 1)VF
RT
)(2.110)
E2 = 1 + ksat exp(γ − 1)VF
RT(2.111)
E3 = Km,Cao [ Na+ ]i3 + Km,Nao
3 [ Ca2+ ]i +
Km,Nai3 [ Ca2+ ]o
(1 +
[ Ca2+ ]iKm,Cai
)(2.112)
E4 = [ Ca2+ ]o [ Na+ ]i3 + [ Na+ ]o
3 [ Ca2+ ]i +
[ Na+ ]o3 Km,Cai
(1 +
[ Na+ ]iKm,Nai
3)
(2.113)
Sodium-potassium-chloride co-transport – INaKCl
INaKCl = −RNaKCl zCl Am LNaKCl RFT× ln
[ Na+ ]o
[ Na+ ]i
[ K+ ]o
[ K+ ]i
([ Cl− ]o
[ Cl− ]i
)2
(2.114)
INaKCl−Na = INaKCl−K = −0.5 INaKCl−Cl (2.115)
231
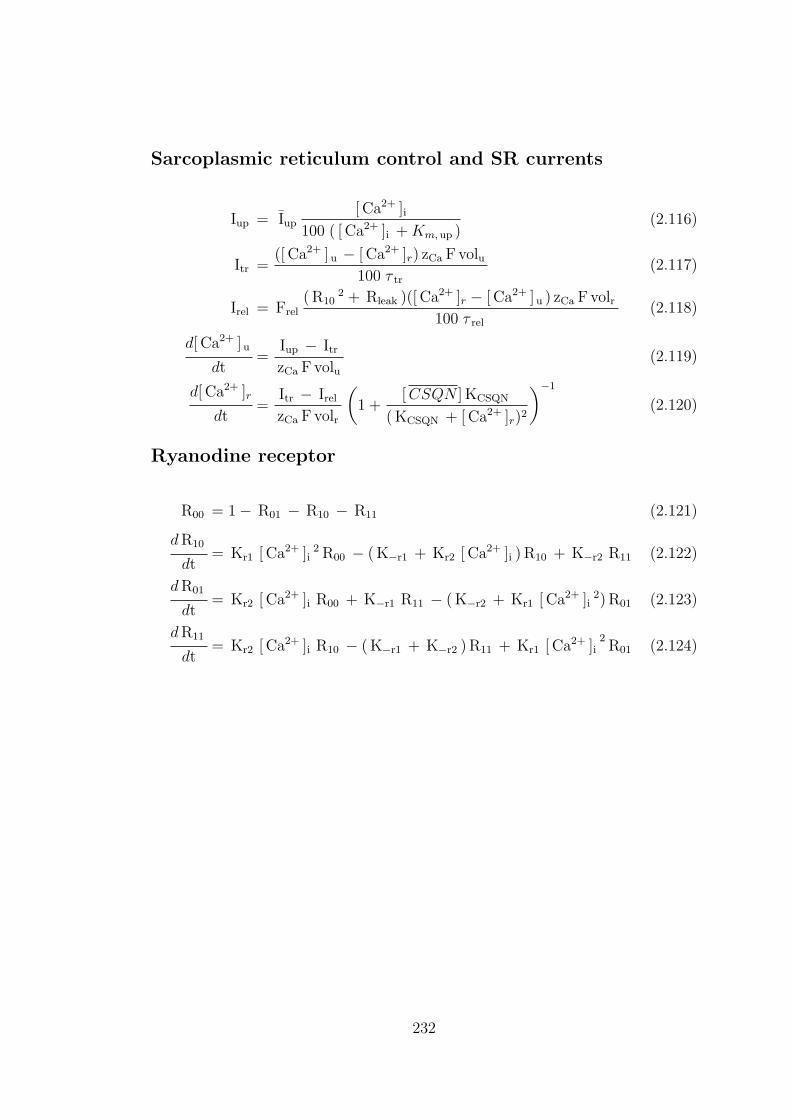
Sarcoplasmic reticulum control and SR currents
Iup = Iup[ Ca2+ ]i
100 ( [ Ca2+ ]i + Km, up )(2.116)
Itr =([ Ca2+ ]u − [ Ca2+ ]r) zCa F volu
100 τ tr
(2.117)
Irel = Frel( R10
2 + Rleak )([ Ca2+ ]r − [ Ca2+ ]u ) zCa F volr100 τ rel
(2.118)
d[ Ca2+ ] u
dt=
Iup − ItrzCa F volu
(2.119)
d[ Ca2+ ]r
dt=
Itr − IrelzCa F volr
(1 +
[ CSQN ] KCSQN
( KCSQN + [ Ca2+ ]r)2
)−1
(2.120)
Ryanodine receptor
R00 = 1− R01 − R10 − R11 (2.121)
d R10
dt= Kr1 [ Ca2+ ]i
2 R00 − ( K−r1 + Kr2 [ Ca2+ ]i ) R10 + K−r2 R11 (2.122)
d R01
dt= Kr2 [ Ca2+ ]i R00 + K−r1 R11 − ( K−r2 + Kr1 [ Ca2+ ]i
2) R01 (2.123)
d R11
dt= Kr2 [ Ca2+ ]i R10 − ( K−r1 + K−r2 ) R11 + Kr1 [ Ca2+ ]i
2R01 (2.124)
232
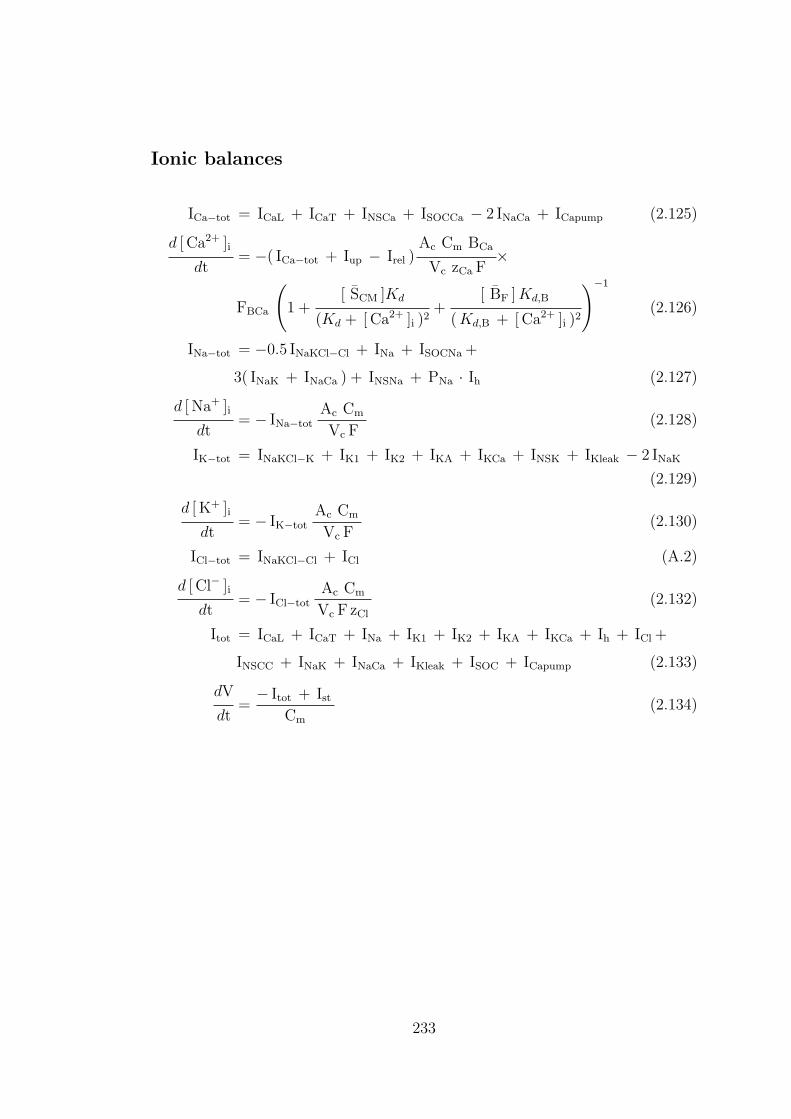
Ionic balances
ICa−tot = ICaL + ICaT + INSCa + ISOCCa − 2 INaCa + ICapump (2.125)
d [ Ca2+ ]i
dt= −( ICa−tot + Iup − Irel )
Ac Cm BCa
Vc zCa F×
FBCa
(1 +
[ SCM ]Kd
(Kd + [ Ca2+ ]i )2+
[ BF ] Kd,B
( Kd,B + [ Ca2+ ]i )2
)−1
(2.126)
INa−tot = −0.5 INaKCl−Cl + INa + ISOCNa +
3( INaK + INaCa ) + INSNa + PNa · Ih (2.127)
d [ Na+ ]i
dt= − INa−tot
Ac Cm
Vc F(2.128)
IK−tot = INaKCl−K + IK1 + IK2 + IKA + IKCa + INSK + IKleak − 2 INaK
(2.129)
d [ K+ ]i
dt= − IK−tot
Ac Cm
Vc F(2.130)
ICl−tot = INaKCl−Cl + ICl (A.2)
d [ Cl− ]i
dt= − ICl−tot
Ac Cm
Vc F zCl
(2.132)
Itot = ICaL + ICaT + INa + IK1 + IK2 + IKA + IKCa + Ih + ICl +
INSCC + INaK + INaCa + IKleak + ISOC + ICapump (2.133)
dV
dt=− Itot + Ist
Cm
(2.134)
233
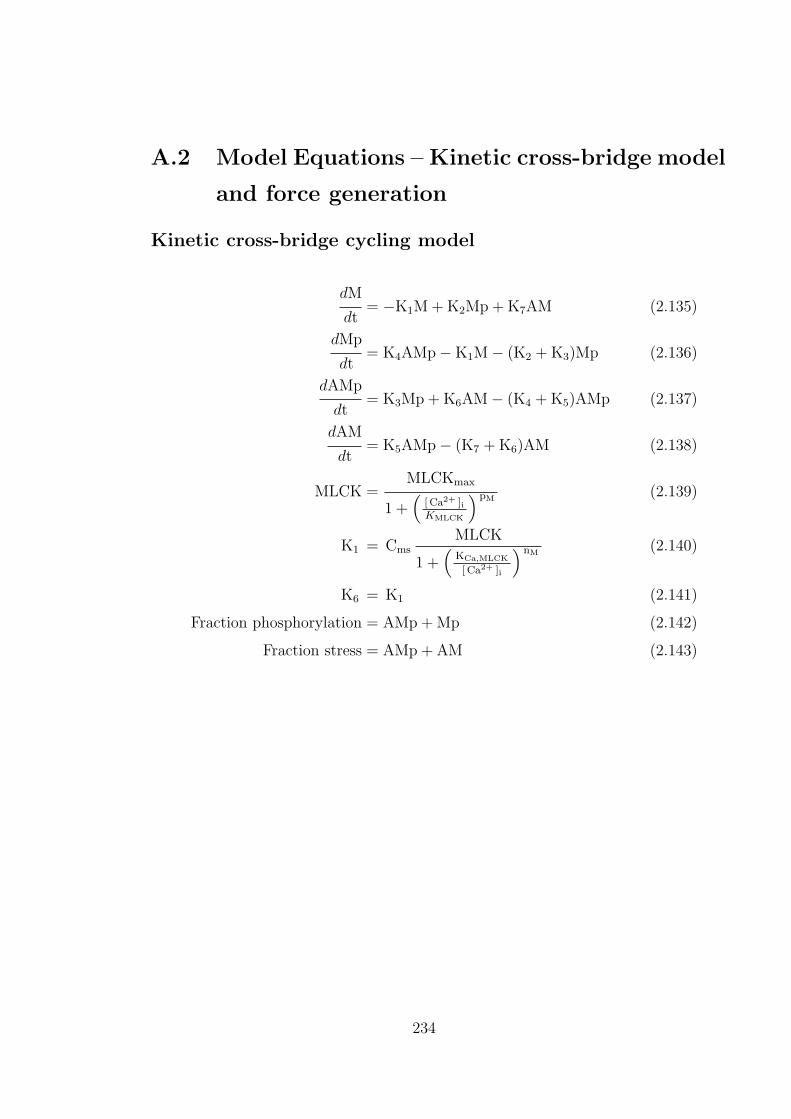
A.2 Model Equations – Kinetic cross-bridge model
and force generation
Kinetic cross-bridge cycling model
dM
dt= −K1M + K2Mp + K7AM (2.135)
dMp
dt= K4AMp−K1M− (K2 + K3)Mp (2.136)
dAMp
dt= K3Mp + K6AM− (K4 + K5)AMp (2.137)
dAM
dt= K5AMp− (K7 + K6)AM (2.138)
MLCK =MLCKmax
1 +(
[ Ca2+ ]iKMLCK
) pM(2.139)
K1 = CmsMLCK
1 +(
KCa,MLCK
[ Ca2+ ]i
) nM(2.140)
K6 = K1 (2.141)
Fraction phosphorylation = AMp + Mp (2.142)
Fraction stress = AMp + AM (2.143)
234
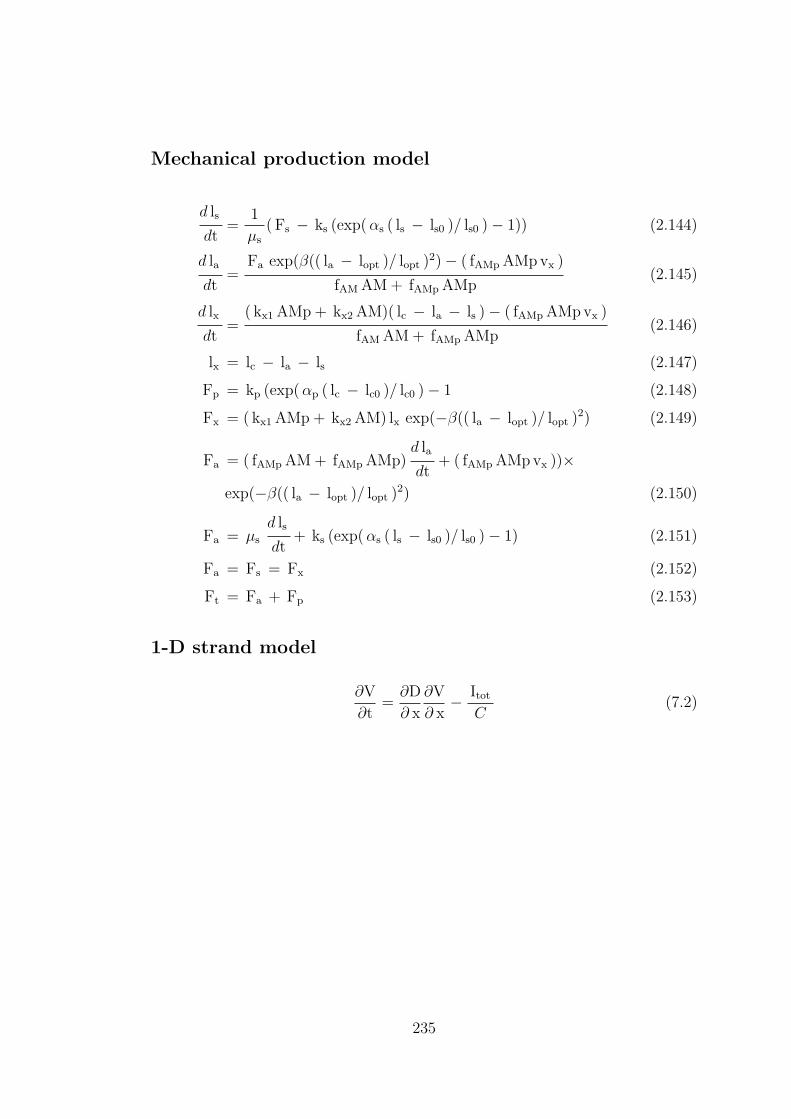
Mechanical production model
d ls
dt=
1
µs
( Fs − ks (exp( αs ( ls − ls0 )/ ls0 )− 1)) (2.144)
d la
dt=
Fa exp(β(( la − lopt )/ lopt )2)− ( fAMp AMp vx )
fAM AM + fAMp AMp(2.145)
d lx
dt=
( kx1 AMp + kx2 AM)( lc − la − ls )− ( fAMp AMp vx )
fAM AM + fAMp AMp(2.146)
lx = lc − la − ls (2.147)
Fp = kp (exp( αp ( lc − lc0 )/ lc0 )− 1 (2.148)
Fx = ( kx1 AMp + kx2 AM) lx exp(−β(( la − lopt )/ lopt )2) (2.149)
Fa = ( fAMp AM + fAMp AMp)d la
dt+ ( fAMp AMp vx ))×
exp(−β(( la − lopt )/ lopt )2) (2.150)
Fa = µs
d ls
dt+ ks (exp( αs ( ls − ls0 )/ ls0 )− 1) (2.151)
Fa = Fs = Fx (2.152)
Ft = Fa + Fp (2.153)
1-D strand model
∂V
∂t=
∂D
∂ x
∂V
∂ x− Itot
C(7.2)
235
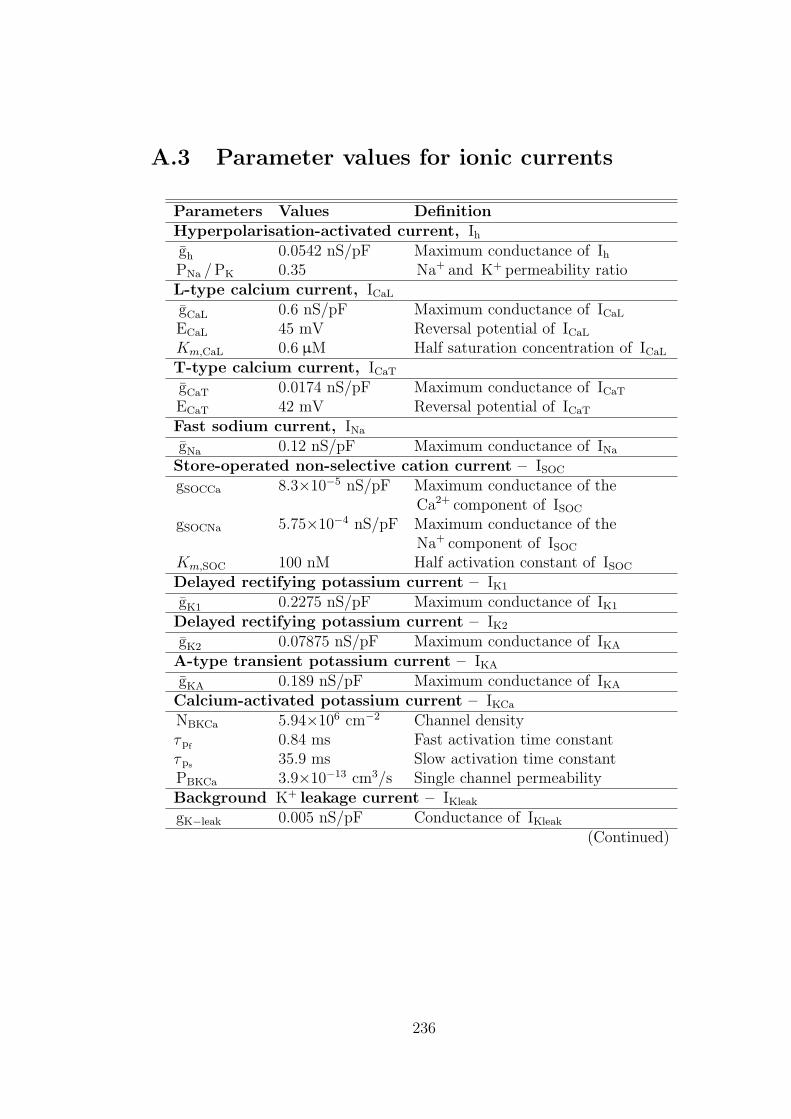
A.3 Parameter values for ionic currents
Parameters Values DefinitionHyperpolarisation-activated current, Ihgh 0.0542 nS/pF Maximum conductance of IhPNa /PK 0.35 Na+ and K+ permeability ratioL-type calcium current, ICaL
gCaL 0.6 nS/pF Maximum conductance of ICaL
ECaL 45 mV Reversal potential of ICaL
Km,CaL 0.6 µM Half saturation concentration of ICaL
T-type calcium current, ICaT
gCaT 0.0174 nS/pF Maximum conductance of ICaT
ECaT 42 mV Reversal potential of ICaT
Fast sodium current, INa
gNa 0.12 nS/pF Maximum conductance of INa
Store-operated non-selective cation current – ISOC
gSOCCa 8.3×10⁻⁵ nS/pF Maximum conductance of theCa2+ component of ISOC
gSOCNa 5.75×10⁻⁴ nS/pF Maximum conductance of theNa+ component of ISOC
Km,SOC 100 nM Half activation constant of ISOC
Delayed rectifying potassium current – IK1
gK1 0.2275 nS/pF Maximum conductance of IK1
Delayed rectifying potassium current – IK2
gK2 0.07875 nS/pF Maximum conductance of IKA
A-type transient potassium current – IKA
gKA 0.189 nS/pF Maximum conductance of IKA
Calcium-activated potassium current – IKCa
NBKCa 5.94×106 cm−2 Channel densityτ pf
0.84 ms Fast activation time constantτ ps 35.9 ms Slow activation time constantPBKCa 3.9×10⁻¹³ cm3/s Single channel permeabilityBackground K+ leakage current – IKleak
gK−leak 0.005 nS/pF Conductance of IKleak
(Continued)
236
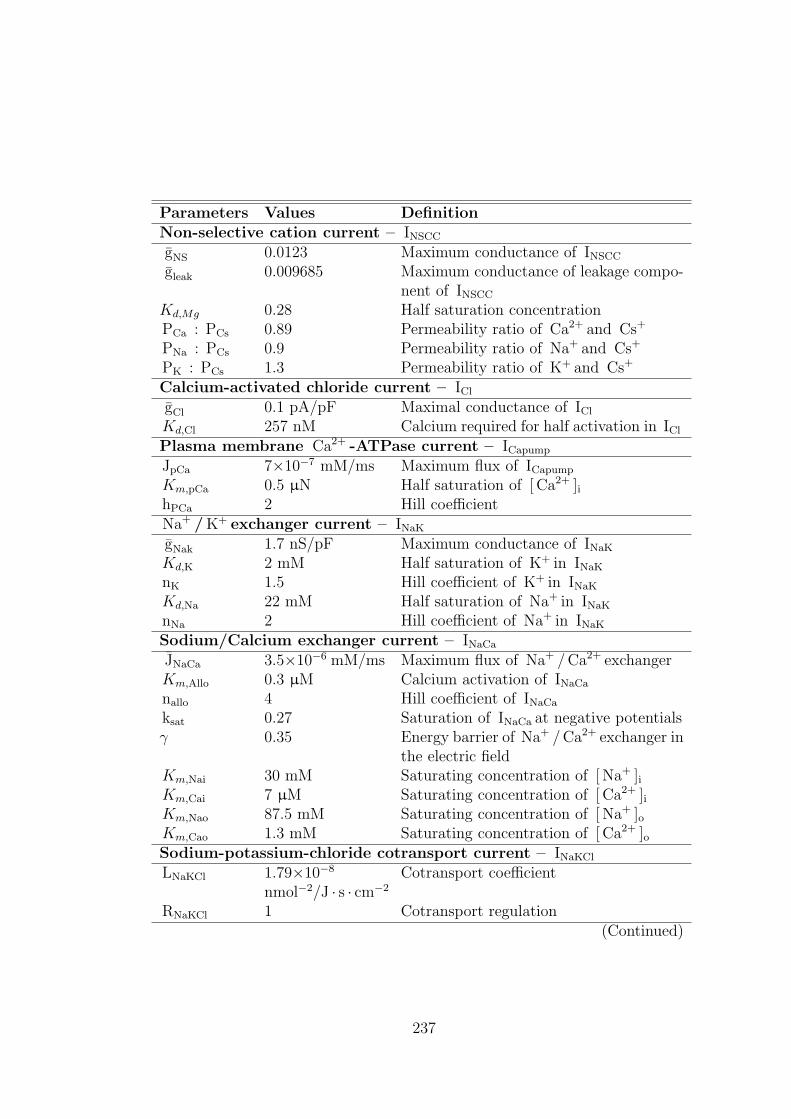
Parameters Values DefinitionNon-selective cation current – INSCC
gNS 0.0123 Maximum conductance of INSCC
gleak 0.009685 Maximum conductance of leakage compo-nent of INSCC
Kd,Mg 0.28 Half saturation concentrationPCa : PCs 0.89 Permeability ratio of Ca2+ and Cs+
PNa : PCs 0.9 Permeability ratio of Na+ and Cs+
PK : PCs 1.3 Permeability ratio of K+ and Cs+
Calcium-activated chloride current – ICl
gCl 0.1 pA/pF Maximal conductance of ICl
Kd,Cl 257 nM Calcium required for half activation in ICl
Plasma membrane Ca2+ -ATPase current – ICapump
JpCa 7×10⁻⁷ mM/ms Maximum flux of ICapump
Km,pCa 0.5 µN Half saturation of [ Ca2+ ]ihPCa 2 Hill coefficientNa+ / K+ exchanger current – INaK
gNak 1.7 nS/pF Maximum conductance of INaK
Kd,K 2 mM Half saturation of K+ in INaK
nK 1.5 Hill coefficient of K+ in INaK
Kd,Na 22 mM Half saturation of Na+ in INaK
nNa 2 Hill coefficient of Na+ in INaK
Sodium/Calcium exchanger current – INaCa
JNaCa 3.5×10⁻⁶ mM/ms Maximum flux of Na+ /Ca2+ exchangerKm,Allo 0.3 µM Calcium activation of INaCa
nallo 4 Hill coefficient of INaCa
ksat 0.27 Saturation of INaCa at negative potentialsγ 0.35 Energy barrier of Na+ /Ca2+ exchanger in
the electric fieldKm,Nai 30 mM Saturating concentration of [ Na+ ]iKm,Cai 7 µM Saturating concentration of [ Ca2+ ]iKm,Nao 87.5 mM Saturating concentration of [ Na+ ]oKm,Cao 1.3 mM Saturating concentration of [ Ca2+ ]oSodium-potassium-chloride cotransport current – INaKCl
LNaKCl 1.79×10⁻⁸ Cotransport coefficientnmol−2/J · s · cm−2
RNaKCl 1 Cotransport regulation(Continued)
237
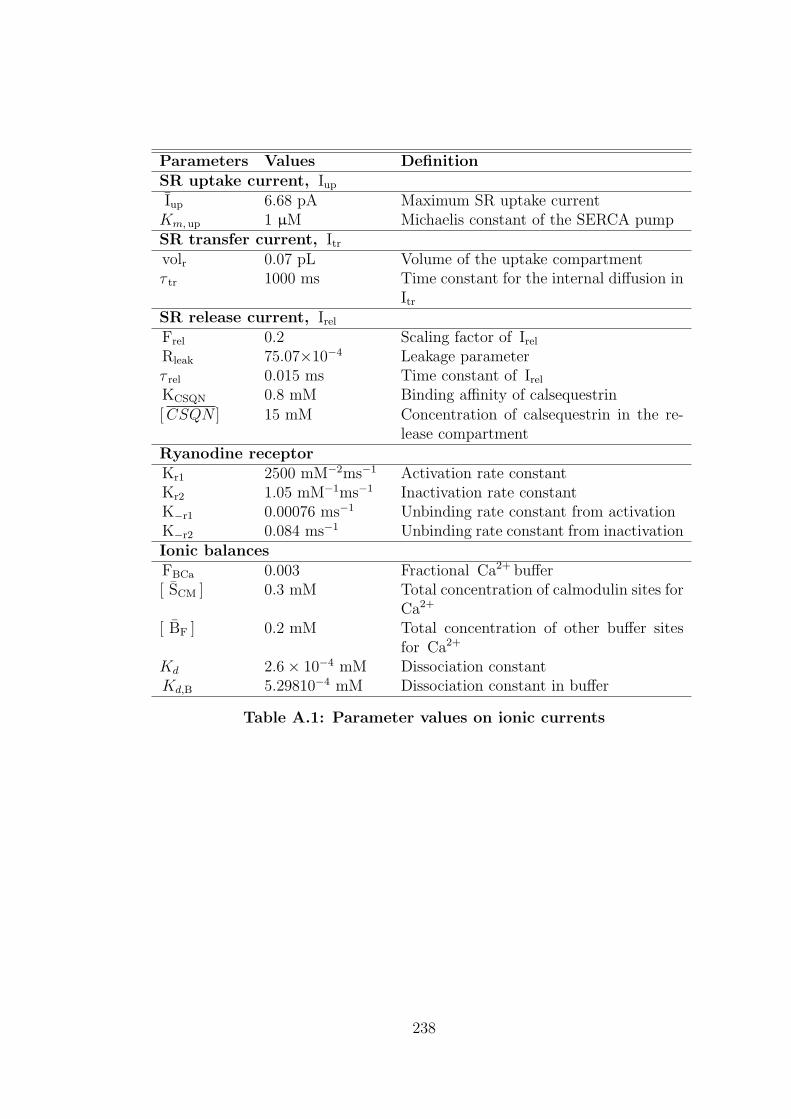
Parameters Values DefinitionSR uptake current, Iup
Iup 6.68 pA Maximum SR uptake currentKm, up 1 µM Michaelis constant of the SERCA pumpSR transfer current, Itrvolr 0.07 pL Volume of the uptake compartmentτ tr 1000 ms Time constant for the internal diffusion in
ItrSR release current, IrelFrel 0.2 Scaling factor of IrelRleak 75.07×10⁻⁴ Leakage parameterτ rel 0.015 ms Time constant of IrelKCSQN 0.8 mM Binding affinity of calsequestrin[CSQN ] 15 mM Concentration of calsequestrin in the re-
lease compartmentRyanodine receptorKr1 2500 mM−2ms−1 Activation rate constantKr2 1.05 mM−1ms−1 Inactivation rate constantK−r1 0.00076 ms−1 Unbinding rate constant from activationK−r2 0.084 ms−1 Unbinding rate constant from inactivationIonic balancesFBCa 0.003 Fractional Ca2+ buffer[ SCM ] 0.3 mM Total concentration of calmodulin sites for
Ca2+
[ BF ] 0.2 mM Total concentration of other buffer sitesfor Ca2+
Kd 2.6× 10⁻⁴ mM Dissociation constantKd,B 5.29810−4 mM Dissociation constant in buffer
Table A.1: Parameter values on ionic currents
238
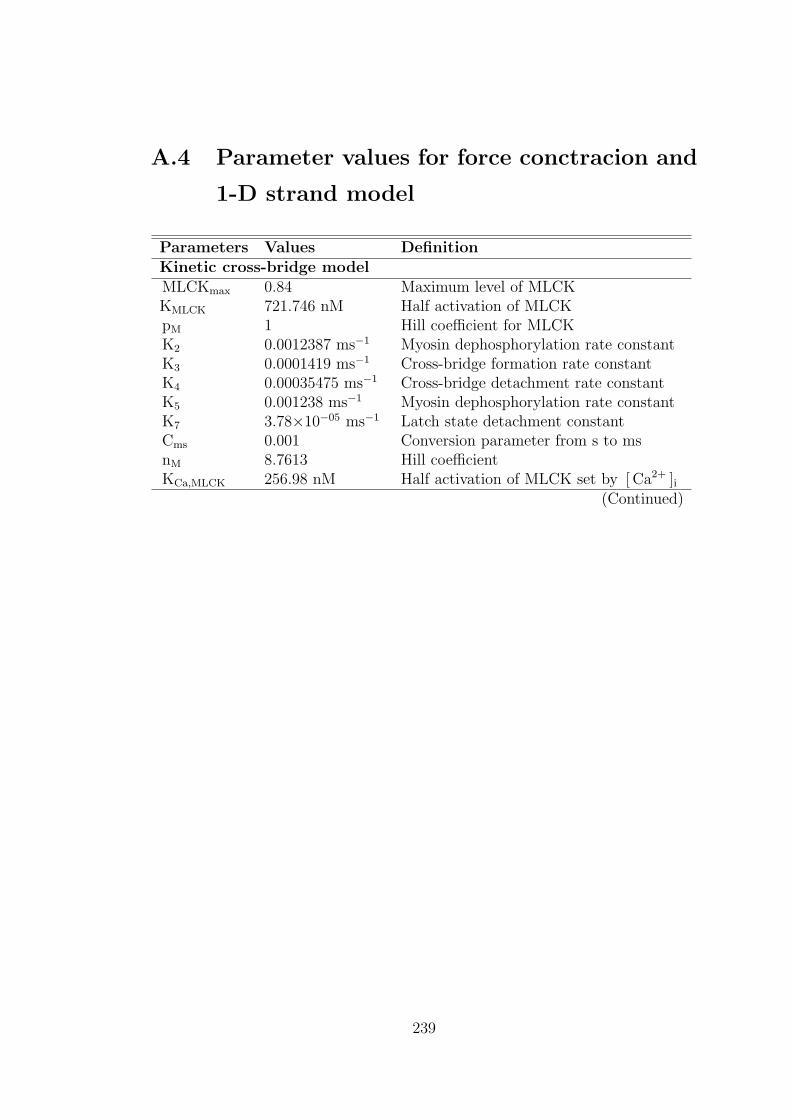
A.4 Parameter values for force conctracion and
1-D strand model
Parameters Values DefinitionKinetic cross-bridge modelMLCKmax 0.84 Maximum level of MLCKKMLCK 721.746 nM Half activation of MLCKpM 1 Hill coefficient for MLCKK2 0.0012387 ms−1 Myosin dephosphorylation rate constantK3 0.0001419 ms−1 Cross-bridge formation rate constantK4 0.00035475 ms−1 Cross-bridge detachment rate constantK5 0.001238 ms−1 Myosin dephosphorylation rate constantK7 3.78×10−05 ms−1 Latch state detachment constantCms 0.001 Conversion parameter from s to msnM 8.7613 Hill coefficientKCa,MLCK 256.98 nM Half activation of MLCK set by [ Ca2+ ]i
(Continued)
239
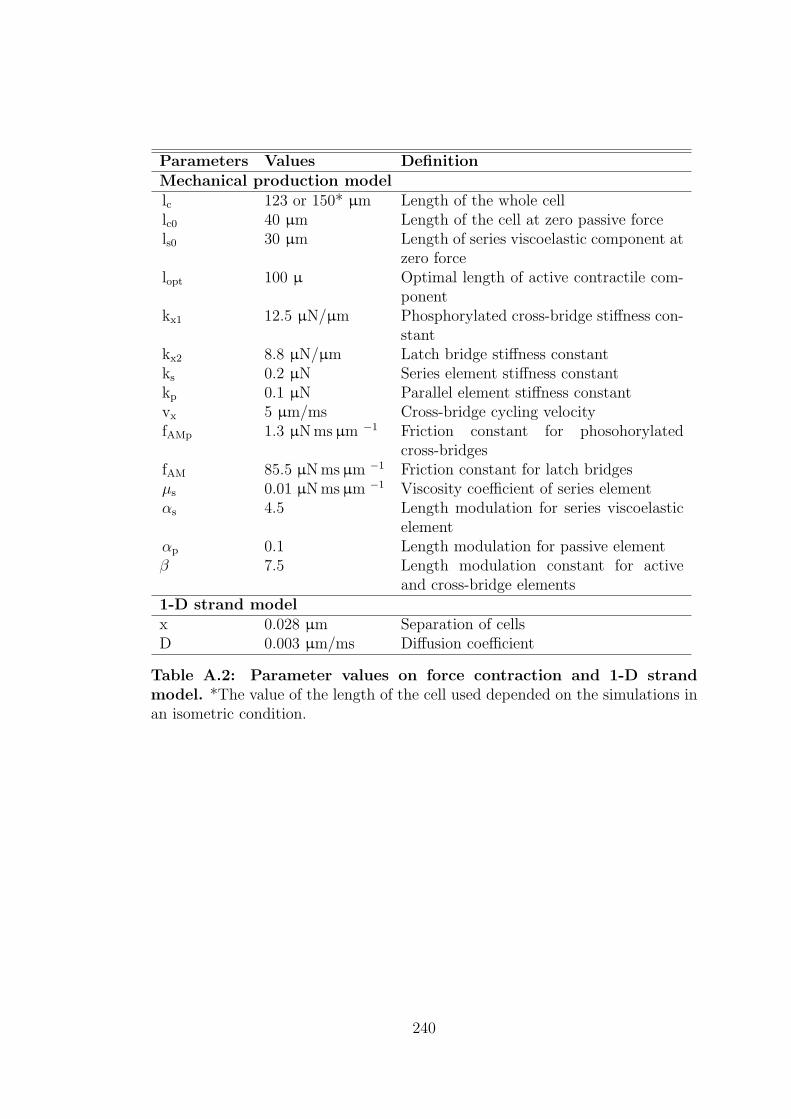
Parameters Values DefinitionMechanical production modellc 123 or 150* µm Length of the whole celllc0 40 µm Length of the cell at zero passive forcels0 30 µm Length of series viscoelastic component at
zero forcelopt 100 µ Optimal length of active contractile com-
ponentkx1 12.5 µN/µm Phosphorylated cross-bridge stiffness con-
stantkx2 8.8 µN/µm Latch bridge stiffness constantks 0.2 µN Series element stiffness constantkp 0.1 µN Parallel element stiffness constantvx 5 µm/ms Cross-bridge cycling velocityfAMp 1.3 µN ms µm −1 Friction constant for phosohorylated
cross-bridgesfAM 85.5 µN ms µm −1 Friction constant for latch bridgesµs 0.01 µN ms µm −1 Viscosity coefficient of series elementαs 4.5 Length modulation for series viscoelastic
elementαp 0.1 Length modulation for passive elementβ 7.5 Length modulation constant for active
and cross-bridge elements1-D strand modelx 0.028 µm Separation of cellsD 0.003 µm/ms Diffusion coefficient
Table A.2: Parameter values on force contraction and 1-D strandmodel. *The value of the length of the cell used depended on the simulations inan isometric condition.
240
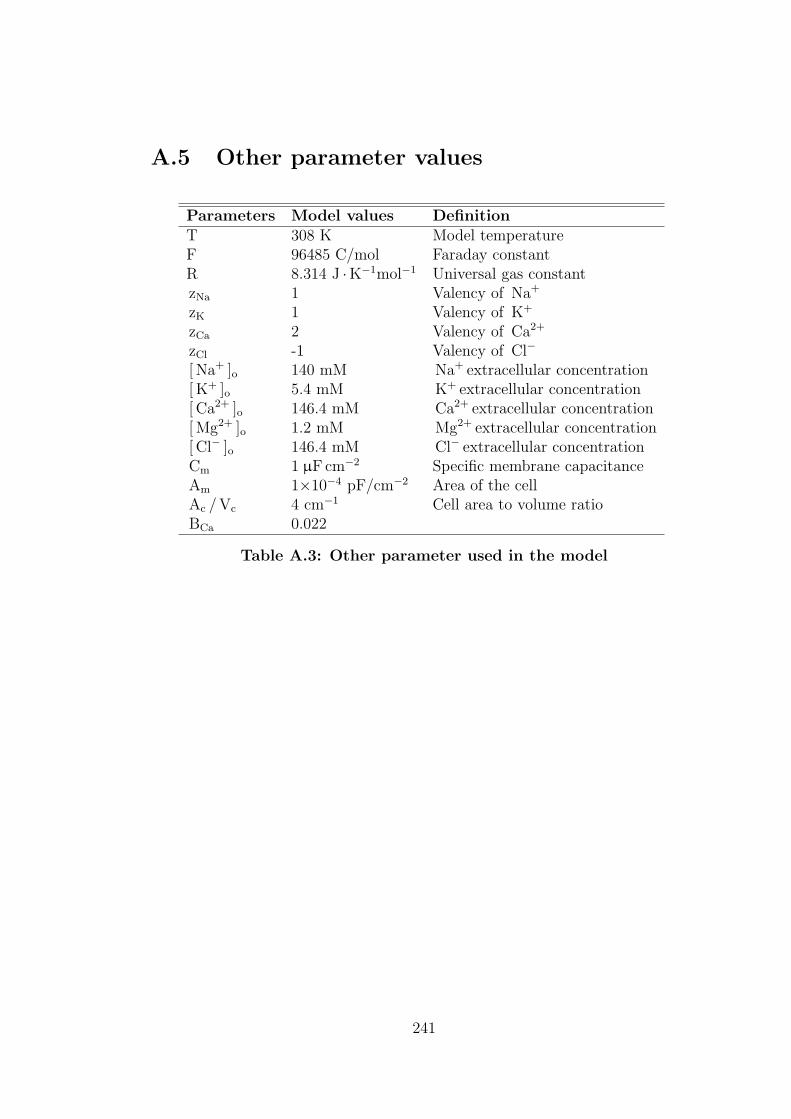
A.5 Other parameter values
Parameters Model values DefinitionT 308 K Model temperatureF 96485 C/mol Faraday constantR 8.314 J ·K−1mol−1 Universal gas constantzNa 1 Valency of Na+
zK 1 Valency of K+
zCa 2 Valency of Ca2+
zCl -1 Valency of Cl−
[ Na+ ]o 140 mM Na+ extracellular concentration[ K+ ]o 5.4 mM K+ extracellular concentration[ Ca2+ ]o 146.4 mM Ca2+ extracellular concentration[ Mg2+ ]o 1.2 mM Mg2+ extracellular concentration[ Cl− ]o 146.4 mM Cl− extracellular concentrationCm 1 µF cm−2 Specific membrane capacitanceAm 1×10⁻⁴ pF/cm−2 Area of the cellAc /Vc 4 cm−1 Cell area to volume ratioBCa 0.022
Table A.3: Other parameter used in the model
241
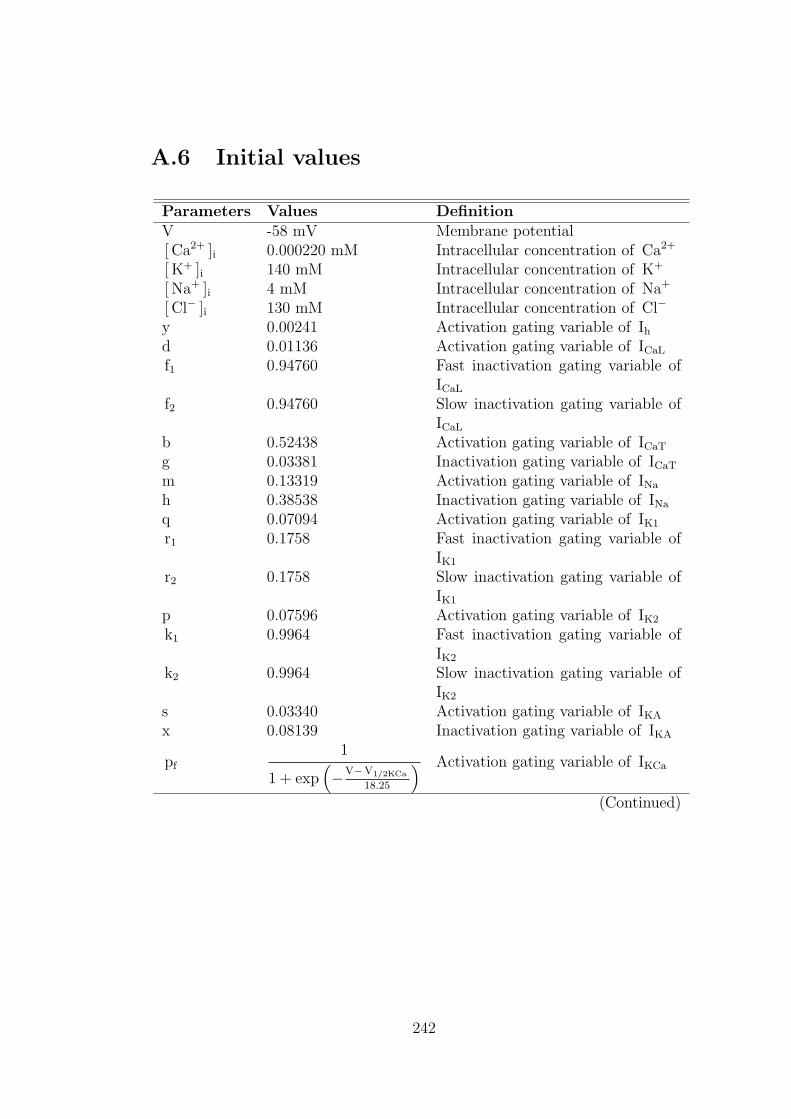
A.6 Initial values
Parameters Values DefinitionV -58 mV Membrane potential[ Ca2+ ]i 0.000220 mM Intracellular concentration of Ca2+
[ K+ ]i 140 mM Intracellular concentration of K+
[ Na+ ]i 4 mM Intracellular concentration of Na+
[ Cl− ]i 130 mM Intracellular concentration of Cl−
y 0.00241 Activation gating variable of Ihd 0.01136 Activation gating variable of ICaL
f1 0.94760 Fast inactivation gating variable ofICaL
f2 0.94760 Slow inactivation gating variable ofICaL
b 0.52438 Activation gating variable of ICaT
g 0.03381 Inactivation gating variable of ICaT
m 0.13319 Activation gating variable of INa
h 0.38538 Inactivation gating variable of INa
q 0.07094 Activation gating variable of IK1
r1 0.1758 Fast inactivation gating variable ofIK1
r2 0.1758 Slow inactivation gating variable ofIK1
p 0.07596 Activation gating variable of IK2
k1 0.9964 Fast inactivation gating variable ofIK2
k2 0.9964 Slow inactivation gating variable ofIK2
s 0.03340 Activation gating variable of IKA
x 0.08139 Inactivation gating variable of IKA
pf
1
1 + exp(−V−V1/2KCa
18.25
) Activation gating variable of IKCa
(Continued)
242
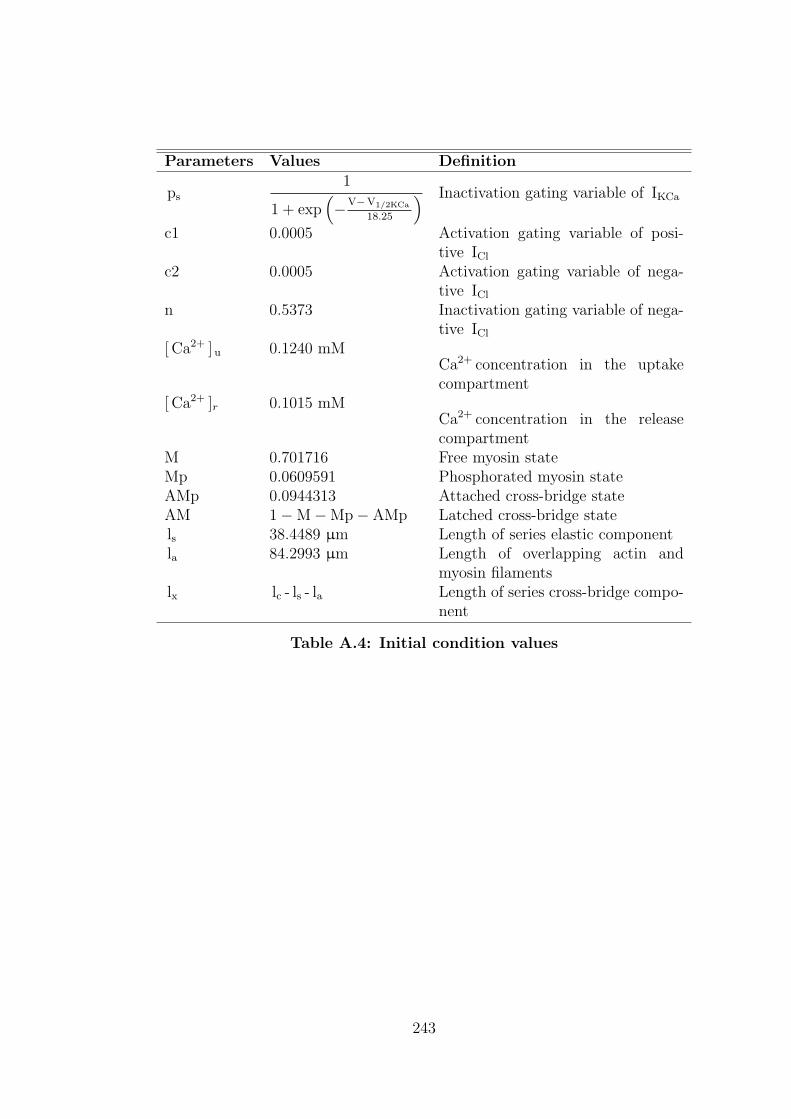
Parameters Values Definition
ps
1
1 + exp(−V−V1/2KCa
18.25
) Inactivation gating variable of IKCa
c1 0.0005 Activation gating variable of posi-tive ICl
c2 0.0005 Activation gating variable of nega-tive ICl
n 0.5373 Inactivation gating variable of nega-tive ICl
[ Ca2+ ]u 0.1240 mMCa2+ concentration in the uptakecompartment
[ Ca2+ ]r 0.1015 mMCa2+ concentration in the releasecompartment
M 0.701716 Free myosin stateMp 0.0609591 Phosphorated myosin stateAMp 0.0944313 Attached cross-bridge stateAM 1−M−Mp− AMp Latched cross-bridge statels 38.4489 µm Length of series elastic componentla 84.2993 µm Length of overlapping actin and
myosin filamentslx lc - ls - la Length of series cross-bridge compo-
nent
Table A.4: Initial condition values
243
Recommended


![Robotics: Science and Systems 2010 Zaragoza, Spain … · Biophysically Inspired Development of a ... Many desert organisms like scorpions, snakes, and lizards ... [42], partitions](https://img.pdfslide.us/doc/110x75/5b86f75d7f8b9a1f248bcab8/robotics-science-and-systems-2010-zaragoza-spain-biophysically-inspired-development.jpg)