A Baseline for Change: What We Know About the Foods
Eaten from US Worksites, Cafeterias, and Vending Machines
Stephen Onufrak, Ph.D.Epidemiologist
Obesity Prevention and Control BranchNOPREN FSG Workgroup
May 21, 2019
National Center for Chronic Disease Prevention and Health PromotionDivision of Nutrition, Physical Activity, and Obesity

CONTENTS
The Worksite Food Environment
Foods from Work
Foods from Cafeterias
Foods from Vending
Supports for Healthy Eating Among US Employers

The Worksite Food Environment
Approximately 150 million working adults in the US
Half of employees report food or beverage vending machines at work
One third of employees report cafeteria or snack bar at work
Three fourths report a break room with refrigerator and microwave
Only 20% of employees agree that their “employer provides opportunities to eat a healthy diet”
Source: Onufrak et al. Worksite Food and Physical Activity Environments and Wellness Supports Reported by Employed Adults in the United States, 2013. Am J Health Promot. 2018 Jan;32(1):96-105.

Foods Obtained at Work
During a typical week, nearly a quarter (23.4%) of working adults obtain foods at work• Includes vending, cafeterias, free foods from meetings and social
events• 17% obtained free foods• 9% purchased food
Among consumers, work foods average 1,292 kcal per person per week• Nearly 70% of calories consumed are from free foods
Source: Onufrak et al. Foods and Beverages Obtained at Worksites in the United States. J Acad Nutr Diet. 2019 Jan 16.

Meal Occasion for Work Food Acquisitions
Source: Onufrak et al. Foods and Beverages Obtained at Worksites in the United States. J Acad Nutr Diet. 2019 Jan 16.
Snack/Drink48%
Lunch29%
Breakfast17%
Dinner6%

Most Frequently Obtained Foods from Work
Source: Onufrak et al. Foods and Beverages Obtained at Worksites in the United States. J Acad Nutr Diet. 2019 Jan 16.
Rank Number of Times Obtained
1 Coffee (849 times)
2 Reg. Soft Drinks (511 times)
3 Sandwiches (317 times)
4 TapWater (274 times)
5 Tea(258 times)
6 Diet Soft Drinks (258 times)
7 Cookies/Brownies(150 times)
8 Lettuce Salad (143 times)
9 FrenchFries (120 times)
10 Potato Chips(118 times)
These ten food categories account for 44% of work items

Leading Food Sources of Calories Obtained from Work
Source: Onufrak et al. Foods and Beverages Obtained at Worksites in the United States. J Acad Nutr Diet. 2019 Jan 16.
Rank Per Capita Calories Among Work Food Consumers
1 Pizza (146 kcal)2 Sandwiches (137 kcal)3 Reg. Soft Drinks (99 kcal)4 Cookies/Brownies (49 kcal)5 Burgers (48 kcal)
6 Egg/BreakfastSandwiches (43kcal)
7 Doughnuts/Pastries (40 kcal)8 Burritos/Tacos(38 kcal)9 Chicken (37 kcal)10 Potato Chips(34kcal)
These ten food categories account for 52% of work calories
Diet Quality of Foods From Work
HEI 2010* Component Worksite Foods ScoreTotal Fruit 1.8 out of 5Whole Fruit 2.5 out of 5Total Vegetables 3.5 out of 5Greens and Beans 3.4 out of 5Whole Grains 2.6 out of 10Dairy 5.2 out of 10Total Protein Foods 5 out of 5Seafood and Plant Proteins
2.4 out of 5
Fatty Acids 7.7 out of 10Refined Grains 3.2 out of 10Empty Calories 7.4 out of 20Sodium 3.5 out of 10
Total HEI 2010 Score 48.2 out of 100
*HEI 2010 = 2010 Healthy Eating Index Source: Onufrak et al. Foods and Beverages Obtained at Worksites in the United States. J Acad Nutr Diet. 2019 Jan 16.
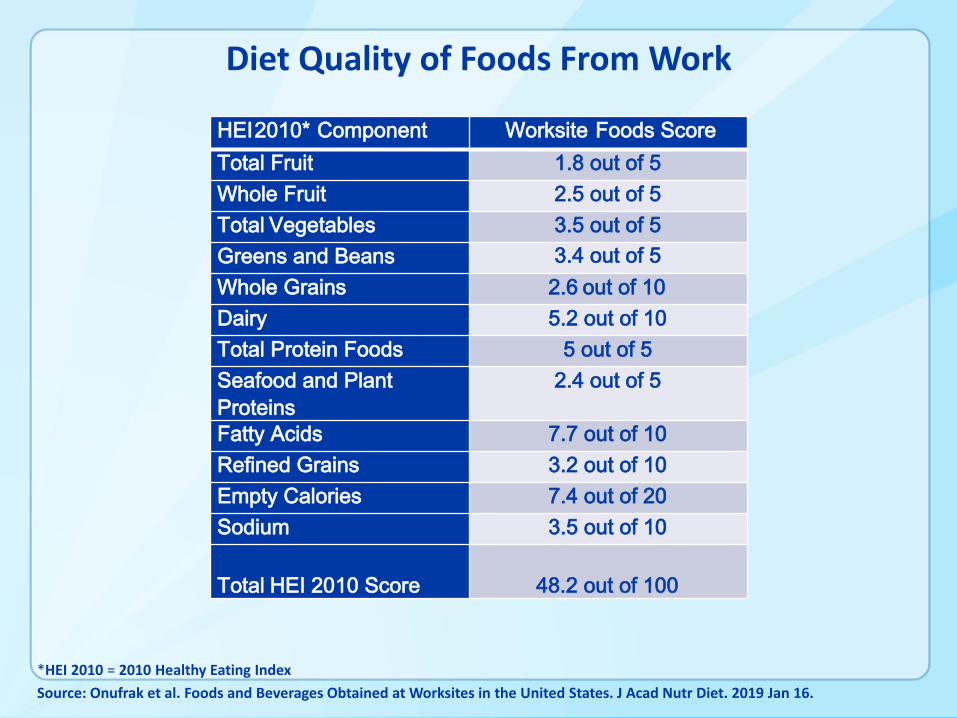
Diet Quality of Foods From Work
Source: Onufrak et al. Foods and Beverages Obtained at Worksites in the United States. J Acad Nutr Diet. 2019 Jan 16.
HEI 2010 Component Worksite Foods ScoreTotal Fruit 1.8 out of 5Whole Fruit 2.5 out of 5Total Vegetables 3.5 out of 5Greens and Beans 3.4 out of 5Whole Grains 2.6 out of 10Dairy 5.2 out of 10Total Protein Foods 5 out of 5Seafood and Plant Proteins
2.4 out of 5
Fatty Acids 7.7 out of 10Refined Grains 3.2 out of 10Empty Calories 7.4 out of 20Sodium 3.5 out of 10
Total HEI 2010 Score 48.2 out of 100

Foods from Cafeterias(NHANES 2005 to 2014)
Prevalence• 3% of US adults consume foods from a non-school cafeteria on a
given day • Average 706 calories from cafeterias/day/consumer
Perceptions of Workplace Cafeteria Healthfulness• 77% of adults with cafeteria at work report “some” or “many”
healthy options are available
Source: Onufrak et al. Foods Consumed by US Adults From Cafeterias and Vending Machines: NHANES 2005 to 2014. Am J Health Promot. 2019

Most Frequently Obtained Foods from Cafeterias
Source: Onufrak et al. Foods Consumed by US Adults From Cafeterias and Vending Machines: NHANES 2005 to 2014. Am J Health Promot. 2019
Rank Number of Times Obtained
1 Raw Vegetables (283 times)
2 Soft Drinks (282 times)
3 White bread/rolls (171 times)
4 Grain mixtures (155 times)
5 Salad dressings (117 times)
6 Raw tomatoes (114 times)
7 Tomato sauces (106 times)
8 Chicken (106 times)
9 Cooked vegetables(105 times)
10 Fruits (96 times)
These ten food categories account for 40% of cafeteria foods

Leading Food Sources of Calories from Cafeterias
*Grain mixtures includes pizza, pasta dishes, rice dishes, sushi dishes, and Mexican dishesSource: Onufrak et al. Foods Consumed by US Adults From Cafeterias and Vending Machines: NHANES 2005 to 2014. Am J
Health Promot. 2019
Rank Per Capita Calories Among Work Food Consumers
1 Grain mixtures* (89 kcal)
2 Soft Drinks (45 kcal)
3 White bread/rolls (43 kcal)
4 Chicken (37 kcal)
5 Salad dressings (24 kcal)
6 Egg dishes(21 kcal)
7 Sausage/deli meats (17 kcal)
8 French fries (16 kcal)
9 Cooked cereal/rice (15 kcal)
10 Fish (13 kcal)
These ten food categories account for 46% of cafeteria calories
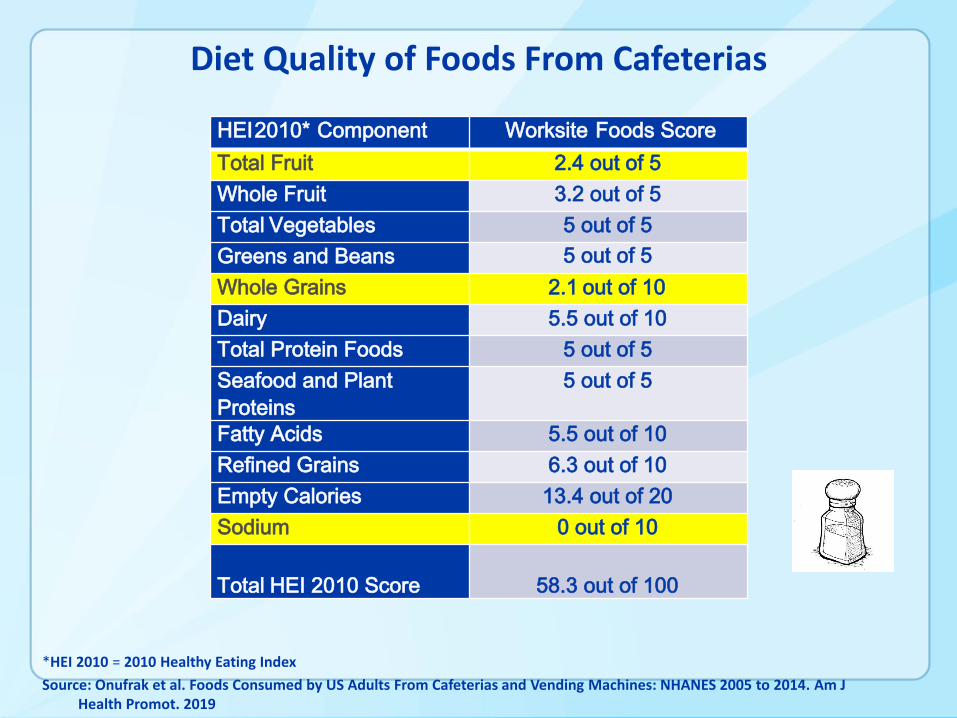
Diet Quality of Foods From Cafeterias
*HEI 2010 = 2010 Healthy Eating Index Source: Onufrak et al. Foods Consumed by US Adults From Cafeterias and Vending Machines: NHANES 2005 to 2014. Am J
Health Promot. 2019
HEI 2010* Component Worksite Foods ScoreTotal Fruit 2.4 out of 5Whole Fruit 3.2 out of 5Total Vegetables 5 out of 5Greens and Beans 5 out of 5Whole Grains 2.1 out of 10Dairy 5.5 out of 10Total Protein Foods 5 out of 5Seafood and Plant Proteins
5 out of 5
Fatty Acids 5.5 out of 10Refined Grains 6.3 out of 10Empty Calories 13.4 out of 20Sodium 0 out of 10
Total HEI 2010 Score 58.3 out of 100

Foods from Vending Machines(NHANES 2005 to 2014)
Prevalence• 4% of US adults consume foods from a vending machine on a
given day • Average 264 calories from vending/day/consumer
Perceptions of Workplace Vending Machines• 65% of adults with vending machines at work report “few” or “no”
healthy options**
Sources:Onufrak et al. Foods Consumed by US Adults From Cafeterias and Vending Machines: NHANES 2005 to 2014. Am J Health
Promot. 2019Onufrak et al. Worksite Food and Physical Activity Environments and Wellness Supports Reported by Employed Adults in the
United States, 2013. Am J Health Promot. 2018 Jan;32(1):96-105.

Most Frequently Obtained Foods from Vending Machines
Source: Onufrak et al. Foods Consumed by US Adults From Cafeterias and Vending Machines: NHANES 2005 to 2014. Am J Health Promot. 2019
Rank Number of Times Obtained
1 Soft drinks (728 times)
2 Bottled Water (119 times)
3 Salty grain snacks (106 times)
4 Candies (98 times)
5 Potato Chips (76 times)
6 Cookies (54 times)
7 Crackers (48 times)
8 Coffee (45 times)
9 White bread/rolls (37 times)
10 Danishes/Pastries (22 times)
These ten food categories account for 84% of vending foods

Leading Food Sources of Calories from Vending Machines
*Grain mixtures includes pizza, pasta dishes, rice dishes, sushi dishes, and Mexican dishesSource: Onufrak et al. Foods Consumed by US Adults From Cafeterias and Vending Machines: NHANES 2005 to 2014. Am J
Health Promot. 2019
Rank Per Capita Calories Among Work Food Consumers
1 Soft drinks (108 kcal)
2 Candies (26 kcal)
3 Salty grain snacks (24 kcal)
4 White bread/rolls (14 kcal)
5 Cookies (14 kcal)
6 Potato Chips (14 kcal)
7 Crackers (10 kcal)
8 Grain mixture* (10 kcal)
9 Cakes (9 kcal)
10 Danishes/Pastries (7 kcal)
These ten food categories account for 89% of vending calories

Diet Quality of Foods From Vending Machines
HEI 2010* Component Worksite Foods ScoreTotal Fruit 0.7 out of 5Whole Fruit 0.3 out of 5Total Vegetables 0.9 out of 5Greens and Beans 0.04 out of 5Whole Grains 1.9 out of 10Dairy 1.7 out of 10Total Protein Foods 2.0 out of 5Seafood and Plant Proteins
4.0 out of 5
Fatty Acids 6.5 out of 10Refined Grains 8.7 out of 10Empty Calories 0 out of 20Sodium 10 out of 10
Total HEI 2010 Score 36.7 out of 100
*HEI 2010 = 2010 Healthy Eating Index Source: Onufrak et al. Foods Consumed by US Adults From Cafeterias and Vending Machines: NHANES 2005 to 2014. Am J
Health Promot. 2019

Environmental Supports for Healthy Eating Among US Employers
Source: Onufrak et al. Supports for Healthy Eating in the Workplace: Results from the 2017 Workplace Health in America Survey. Abstract. 2019 Art and Science of Health Promotion Conference
2415 15
6
24
43 4452
9
34
0102030405060708090
100
Written nutritionguidelines*
Nutritionlabeling*
Identify healthyfoods with signs
or symbols*
Discount healthychoices*
Healthy MeetingPolicy
Worksites < 100 Employees Worksites ≥ 100 Employees
%
Prevalence of Policy and Environmental Supports for Healthy Eating Among Worksite Wellness Programs*
* Among worksites that offer food

Conclusions
Many working adults have access to cafeterias, snack bars, or vending machines at work
Around a quarter get food from during the week; most of the calories they get are free
Diet quality of cafeteria foods is ok but high in sodium and low in whole grains
Diet quality of vending foods is low Few employers have written nutrition standards for work
foods or other environmental supports for healthy eating

Future Research and Gaps
Effectiveness of FSG policies on changing dietary behaviors Best practices for measurement and evaluation using sales
and procurement data
Emergence of micromarkets FSG in unique settings such as corrections facilities, food
pantries, senior centers, faith-based organizations How do FSG policies affect the food supply chain?

Questions?

For more information please contact Centers for Disease Control and Prevention
1600 Clifton Road NE, Atlanta, GA 30333Telephone: 1-800-CDC-INFO (232-4636)/TTY: 1-888-232-6348Visit: www.cdc.gov | Contact CDC at: 1-800-CDC-INFO or www.cdc.gov/info
The findings and conclusions in this report are those of the authors and do not necessarily represent the official position of the Centers for Disease Control and Prevention.
National Center for Chronic Disease Prevention and Health PromotionDivision Name in this space

Frequency Obtaining Work Foods
Onufrak. FoodAPS
11% of working adults obtained food 3 or more times during the week
Recommended