99. PROFILE ON POULTRY BREEDING AND
MULTIPLICATION CENTER
99-2
TABLE OF CONTENTS
PAGE
I. SUMMARY 99-3
II. PROJECT DESCRIPTION 99-3
III. MARKET STUDY AND PROJECT CAPACITY 99-4
A. MARKET STUDY 99-4
B. PROJECT CAPACITY & PRODUCTION PROGRAMME 99-6
IV. MATERIALS AND INPUTS 99-7
A. RAW & AUXILIARY MATERIALS 99-7
B. UTILITIES 99-8
V. LOCATION, SITE & ENVIRONMENT 99-9
A. LOCATION & SITE 99-9
VI. TECHNOLOGY & ENGINEERING 99-9
A. TECHNOLOGY 99-9
B. ENGINEERING 99-11
VII. MANPOWER & TRAINING REQUIREMENT 99-15
A. MANPOWER REQUIREMENT 99-15
B. TRAINING REQUIREMENT 99-16
VIII. FINANCIAL ANLYSIS 99-16
A. TOTAL INITIAL INVESTMENT COST 99-17
B. PRODUCTION COST 99-18
C. FINANCIAL EVALUATION 99-18
D. ECONOMIC BENEFITS 99-21
99-3
I. SUMMARY
This profile envisages the establishment of a poultry breeding and multiplication center
with a capacity of 70,000 cockerels and pullets, 70,000 day old chicks , 60,000 fertile
eggs for egg production and 120,000 day old checks for broiler production per annum.
The present demand for the proposed product is estimated at 1.42 million heads per
annum. The demand is expected to reach at 1.99 million heads by the year 2020.
The total investment requirement is estimated at about Birr 10.71 million, out of which
Birr 1.72 million is required for machinery and equipment. The center will create
employment opportunities for 31 persons.
The project is financially viable with an internal rate of return (IRR) of 21.66 % and a
net present value (NPV) of Birr 5.53 million, discounted at 8.5%.
The project will create forward linkage with poultry farms.
II. PROJCECT DESCRIPTION
This project is aimed at producing 3 months old Pullets and cockerels, day old chicks
for broilers and layers, and fertile eggs for those who own incubators and would like to
hatch egg using local chicken. The breeds selected for parent stock could be imported
from countries that are known to produce layers and broiler breeding avian stock.

99-4
III. MARKET STUDY AND PROJECT CAPACITY
A. MARKET STUDY
1. Past Supply and Current Demand
Poultry breeding and multiplication center is a center that selects new and improved types
of poultry and conduct insemination by natural or artificial means. The center can supply
improved breed of layers and broilers for poultry farms in the city and to the farmers in
different areas.
The demand for layers and broilers is met mostly through import. However, import data
of Customs Authority do not indicate annually imported quantity. Therefore, in order to
estimate demand for the product end use approach is employed.
According to the unpublished data of the City Administration’s Urban Agriculture
Department, the per capita consumption in Addis Ababa was about 2.5 kg of poultry
meat. Accordingly, considering the total population size of Addis Ababa in 2008, which
is 3.4 million the total consumption of the product is estimated at 8,500 tones. Assuming
that one poultry weights on average 1.5 kg the total demand is estimated at 5,666,667.
Moreover, conservatively assuming that about 25% of the demand is supplied by modern
poultry farms the corresponding demand for poultry layers and broilers is estimated at
1,416,666.
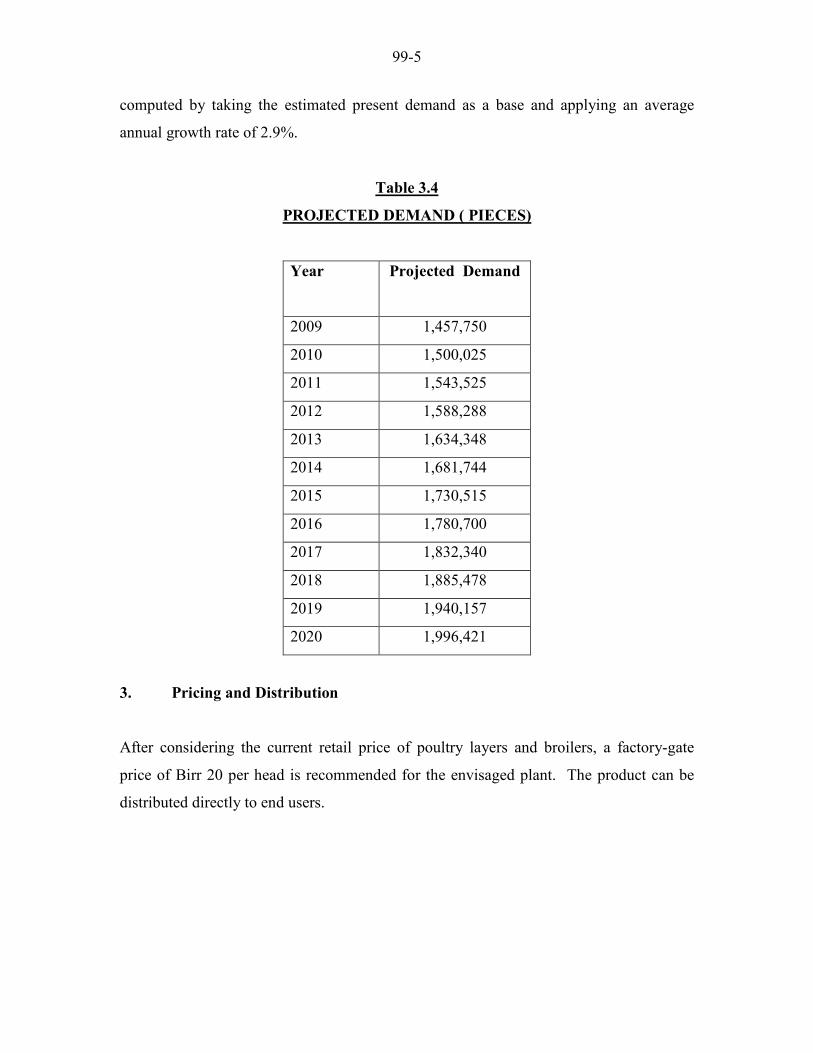
2. Projected Demand
The demand for poultry layers and broilers is directly related to poultry meat
consumption which is mainly influenced by population growth and income rise. The
population grows at an average annual growth rate of 2.9%. Accordingly, the demand for
the products is estimated to grow at 2.9% per annum which is equivalent to the
population growth. Table 3.1 shows the projected demand for poultry layers and broilers
99-5
computed by taking the estimated present demand as a base and applying an average
annual growth rate of 2.9%.
Table 3.4
PROJECTED DEMAND ( PIECES)
Year
Projected Demand
2009 1,457,750
2010 1,500,025
2011 1,543,525
2012 1,588,288
2013 1,634,348
2014 1,681,744
2015 1,730,515
2016 1,780,700
2017 1,832,340
2018 1,885,478
2019 1,940,157
2020 1,996,421
3. Pricing and Distribution
After considering the current retail price of poultry layers and broilers, a factory-gate
price of Birr 20 per head is recommended for the envisaged plant. The product can be
distributed directly to end users.

99-6
B. PROJECT CAPACITY AND PRODUCTION PROGRAMME
1. Capacity
The center is expected to start at full capacity starting the first year by introducing 1,100
broiler and 1,100 layer day old breeding stocks from known producers’ world wide. The
reason why it is assumed to start at full capacity is because of the existing high demand
for poultry in the city.
2. Production Programme
The center will introduce 2200 day old meat and egg type chicks and rear them for 5
months as parent stocks. Starting the fifth month the hens will start laying eggs which
could be supplied either hatched as day old chicks, or pullets and cockerels or fertile
eggs. The chicks that will be supplied in a form of day old or rear pullets and cockerels
all they reach 3 months old will be hatched in the center. Thus, the center is expected to
supply 70,000 cockerels and pullets, 70,000 day old chicks and 60,000 fertile eggs for
egg production similarly 120,000 day old chicks for broiler production are expected to be
supplied in one year. The envisaged project starts operating at 75% of its full capacity
and grows to 90% and 100% in the second and third year. Production programme of the
envisaged project is envisaged in the Table 3.3 below.

99-7
Table 3.3
PRODUCTION PROGRAMME
Production(no.) Year Capacity
Utilization
(%)
Cockerels
and Pullets
Day Old
Chicks for
Egg
Production
Fertile Eggs Day old
Chicks for
Broiler
Production
1 75 52,500 52,500 45,000 90,000
2 90 63,000 63,000 54,000 108,000
3-10 100 70,000 70,000 60,000 120,000
IV. MATERIALS AND INPUTS
A. RAW MATERIALS
The raw materials and inputs used in the production of chicks and eggs are poultry
breeding stock (parent stock), feed and medicament. The breeding stocks will be
imported through importers in Addis Ababa where as the other inputs are available
locally.

99-8
Table 4.1
RAW MATERIAL REQUIREMENT & COST
Cost in Birr
Sr.
No.
Electricity
Qty.
Foreign Local Total
1 Parent stocks (in No) 2,200 374,000 - 374,000
2 Feed (Quintal.) 565 - 1,697,100 1,697,100
3
3.1
3.2
Medicament
Parent stock
For pullets and
cockerels
2,200
70,000
-
-
33,000
350,000
33,000
350,000
Grand Total 374,000 2,080,100 2,454,100
B. UTILITIES
The major utilities needed for the operation of the multiplication center are electricity and
water. Electric power is required for 365 days to run the incubators and for heating the
chicks, for at least 3 weeks. The power to be installed will be 3 phase. The daily
requirement is estimated at 240 kw and the total annual requirement will be 87600 kwh.
Similarly the plant consumes 300m3 of water per annum. The annual requirement of
utility and the corresponding cost is given in Table 4.2.

99-9
Table 4.2
UTILITIES REQUIREMENT AND COST
Sr.
No.
Utility
Unit of
Measure
Qty.
Unit Cost
(Birr)
Cost
(Birr)
1 Electricity kWh 87,600 0.4736 41,487
2 Waters m3 300 3.25 975
3 Fuel and lubricant 21922
Total 64,384
V. LOCATION, SITE AND ENVIRONMENT
A. LOCATION & SITE
The location and site that would be selected for poultry multiplication center should be
closer to mountains at a far distance from residential areas. The site must be accessible by
car all the year through.
In addition to this all the necessary infrastructure like electricity and water should be
obtained with little problem.
VI. TECHNOLOGY AND ENGINEERING
A. TECHNOLOGY
1. Production Process
First and foremost the parent stocks will be imported at the age of day old. These chicks
will be reared by getting electrical heat for 3 weeks. During the 5 months of rearing the
99-10
chicks will be fed with feeds that have high protein content so that their growth will be
fast. Starting the end of the fifth month the hens will start laying. The eggs will be
collected carefully and stored in a cool and dry place. After doing this the average sized
eggs will be incubated for 18 days. After the 18th day the eggs will be transferred to the
hatchery where the hatching process will take place. The baby chicks will be sexed and
distributed for customers at their own choice. If they are to be distributed as pullets and
cockerels they will be treated to the age of 3 months.
In the modern world, it has been possible to control all problems that are bound to affect
any developmental endeavors. With this regard all places in the country are suitable or
could be made suitable for poultry production. The enterprise can have an adverse effect
on the environment unless mitigating measures are taken. Poultry manure can pollute the
environment if proper management practices are utilized.
Because of high Nitrogen content poultry manure is excellent natural fertilizer if, it is
composted properly. Besides the composted manure can also be sold and be taken as
another source of income.
2. Sources of Technology
Machinery and equipment required can be acquired from Italy, Bulgaria, Brazil, etc
through contacts with the commercial attaches of respective embassies to Ethiopia. The
following company can be considered as one of the possible source of technology:
Dah Chong Hong (Japan) Ltd.
(K.K. Taisha) Bouekekou (10). 18-2, Roppongi 5-Chome, Minato-Ku, 106-0032
Tel. 03-3582-0706
Fax. 03-3586-8393 03-3582-7148.

99-11
B. ENGINEERING
1. Machinery And Equipment
The list of machinery and equipment required by the project is shown in Table 6.1. The
total cost of the machinery and equipment is estimated at Birr 1.72 million.
Table 6.1
MACHINERY AND EQUIPMENT REQUIREMENT & COST
Sr.No Description Qty
(Nos)
Total
Price
1 Incubator 1 500,000
2 Generator 1 100,000
3 Automatic water drinker 115 2300
4 Feeder (suspended) 230 12,650
5 Egg Tray (plastic) 3200 48,000
6 Egg Tray crate 10 2,200
7 Be baker 1 11,000
8 Hover with resistor 15 33,000
9 Egg room cooler 1 205,000
10 Coop 100 165,000
11 Chick Guard 50 600,000
12 Laying Nest 40 15,000
13 Egg displaying shelf 3 19,500
14 Candler 1 1,200
15 Egg selecting 1 3,500
16 Fumigation box 1 3000
17 Wheel barrow 10 2,250
18 Spade 10 200
19 Hoe 10 200
20 Hose (”) 200 400
21 Scale (5kg) 1 500
Total 1,724,900

99-12
2. Land, Building and Civil Works
The total area of land required for the plant is about 5,500 square meters. The total built-
up area will be 3,500 square meters and the estimated cost of building, at the rate of Birr
1,800 per m2, will amount to Birr 6.3 million. The rearing buildings covers the
3,000 m2 area, the store 350m
2 and the office building 150 m
2.
According to the Federal Legislation on the Lease Holding of Urban Land (Proclamation
No. 272/2002) in principle, urban land permit by lease is on auction or negotiation basis,
however, the time and condition of applying the proclamation shall be determined by the
concerned regional or city government depending on the level of development.
In Addis Ababa the City’s Land Administration and Development Authority is directly
responsible in dealing with matters concerning land. Regarding the manufacturing
sector, industrial zone preparation is one of the strategic intervention measures adopted
by the City Administration for the promotion of the sector and all manufacturing projects
are assumed to be located in the developed industrial zones.
However, the project under consideration is an urban agriculture project. Therefore, it is
assumed that the project will be located outside the industrial zones. Accordingly, the
initial land lease rate in Addis Ababa set by the City’s Land Administration and
Development Authority based on the location of land is as shown in Table 6.1.

99-13
Table 6.1
INITIAL LAND LEASE RATE IN ADDIS ABABA
Sr.
No. Location of the land
Land
Grade
Initial Price in
m2
1
Central Business zones
1
2
3
4
5
1167.3
1062.9
916.2
751.5
619.2
2
Places That are Under
Transit
1
2
3
4
5
716.4
647.1
559.8
472.5
384.3
3
Expansion Zones
1
2
3
4
245.7
207
150.3
132.3
Source: Addis Ababa City Land Administration Authority.
As can be seen from Table 6.1, the initial land lease rate ranges from Birr 1,167.3 to Birr
132.3 per m2.
Considering the nature of the project, the expansion zones of the City are recommended
as the best locations. Moreover, as the project have to be located away from residential
houses the lowest land lease rates in the expansion zones of the city which is Birr
132.3/ m2 is adopted.
The Federal Legislation on the Lease Holding of Urban Land legislation has also set the
maximum on lease period and the payment of lease prices (see Table 6.2 and Table 6.3.)

99-14
Table 6.2
LEASE PERIOD
Type of Service
Lease Period
( Years)
Residential area 99
Industry 80
Education, cultural research health, sport,
NGO and religious 99
Trade 70
Urban Agriculture 15
Other service 70
Table 6.3
LEASE PAYMENT PERIOD
Sr.
No.
Service Type
Period of Payment
According to the Grade of
Towns
1
Private residential are obtained
through tender or negotiation 50 - 60 years
2 Trade 40 - 50 years
3 Industry 40 - 50 years
4 Real estate 40 -50 years
5 Urban Agriculture 8 - 10 years
6 Trade and social service 40 - 50 years
7 Others 40 – 50 years
Moreover, advance payment of lease based on the type of investment ranges from 5% to
10%. For those that pay the entire amount of the lease will receive 0.5% discount from
the total lease value and those that pay in installments will be charged interest based on
the prevailing interest rate of banks. Moreover, based on the type of investment, two to
seven years grace period shall also be provided. The lease price is payable after the grace
period annually.

99-15
Regarding, the terms and conditions of land lease the Addis Ababa City Government
have adopted Article 6 of the Federal Legislation with very minimal changes. Therefore,
for the purpose of this project profile since the project is urban agriculture , 15 years lease
period, 10 years lease payment completion period, 10% down payment and two years
grace period is used.
Accordingly, the land lease cost of the project, at rate of Birr 132.3 m2 for 15 years of
holding is estimated at Birr 10.91 million. Assuming 10% of the total cost ( Birr
1,091,475 ) will be paid in advance as down payment and the remaining Birr 9.82
million will be paid in equal installments with in 10 years, the annual lease payment is
estimated at Birr 982,328.
VII. MANPOWER AMD TRAINING REQUIREMENT
A. MANPOWER REQUIREMENT
Since the center operates all the year through, some of the workers that are working in the
cheeks growing room and layers room are expected to work day and right on shift basis.
In addition to this the assistant veterinarians will also work at a shift. However the other
staff will work 6 days in a week. Based on this assumption the total manpower required
at labour cost is shown in Table 7.1.

99-16
Table 7.1
MANPOWER REQUIREMENT & LABOUR COST (BIRR)
Salary Sr.
No.
Description
Req.
No. Monthly Annual
1 General manager 1 3,000 36,000
2 Production manger 1 2,500 30,000
3 Hatchery expert 1 1,500 18,000
4 Hatchery unit workers 4 2,400 28,800
5 Parent stock growers and chick 20 10,000 120,000
6 Janitors 2 800 9,600
7 Guards 2 800 9,600
Sub Total 31 252,000
Employees benefit(25% of basic salary) 63,000
Total 315,000
B. TRAINING REQUIREMENT
Since strict bio-security measures are to be taken all the attendants will be highlighted on
what bio security is all about for one week by the manager and the assistant veterinarians.
VIII. FINANCIAL ANALYSIS
The financial analysis of the poultry breeding project is based on the data presented in the
previous chapters and the following assumptions:-
Construction period 1 year
Source of finance 30 % equity
70 % loan

99-17
Tax holidays 3 years
Bank interest 8.5%
Discount cash flow 8.5%
Accounts receivable 30 days
Raw material local 30 days
Work in progress 15 days
Finished products 2 days
Cash in hand 5 days
Accounts payable 30 days
Repair and maintenance 5% of machinery cost
A. TOTAL INITIAL INVESTMENT COST
The total investment cost of the project including working capital is estimated at Birr
10.71 million. The major breakdown of the total initial investment cost is shown in Table
7.1.
Table 7.1
INITIAL INVESTMENT COST ( ‘000 Birr)
Sr.
No.
Cost Items Local
Cost
Foreign
Cost
Total
Cost
1 Land lease value 1,091.47 - 1,091.47
2 Building and Civil Work 6,300.00 - 6,300.00
3 Plant Machinery and Equipment 1,724.9 - 1,724.90
4 Office Furniture and Equipment 75.00 - 75.00
5 Vehicle 450.00 - 450.00
6 Pre-production Expenditure* 637.38 - 637.38
7 Working Capital 429.67 - 429.67
Total Investment cost 10,708.42 - 10,708.42
* N.B Pre-production expenditure includes interest during construction ( Birr 562.38
thousand, and Birr 75 thousand costs of registration, licensing and formation of the
company including legal fees, commissioning expenses, etc.

99-18
B. PRODUCTION COST
The annual production cost at full operation capacity is estimated at Birr 4.95 million
(see Table 7.2). The raw material cost accounts for 49.57 per cent of the production
cost. The other major components of the production cost are land lease, depreciation and
financial cost which account for 19.84%, 12.12% and 9.06% respectively. The remaining
9.41% is the share of utility, repair, maintenance, direct labour and other administration
cost.
Table 7.2
ANNUAL PRODUCTION COST AT FULL CAPACITY ('000 BIRR)
Items Cost %
Raw Material and Inputs 2,454.10 49.57
Utilities 64.38 1.30
Maintenance and repair 86.25 1.74
Labour direct 151.20 3.05
Labour overheads 63.00 1.27
Administration Costs 100.80 2.04
Land lease cost 982.33 19.84
Total Operating Costs 3,902.06 78.82
Depreciation 599.99 12.12
Cost of Finance 448.66 9.06
Total Production Cost
4,950.71 100

99-19
C. FINANCIAL EVALUATION
1. Profitability
Based on the projected profit and loss statement, the project will generate a profit through
out its operation life. Annual net profit after tax will grow from Birr 1.41 million to Birr
1.37 million during the life of the project. Moreover, at the end of the project life the
accumulated cash flow amounts to Birr 16.52 million.
2. Ratios
In financial analysis financial ratios and efficiency ratios are used as an index or yardstick
for evaluating the financial position of a firm. It is also an indicator for the strength and
weakness of the firm or a project. Using the year-end balance sheet figures and other
relevant data, the most important ratios such as return on sales which is computed by
dividing net income by revenue, return on assets ( operating income divided by assets),
return on equity ( net profit divided by equity) and return on total investment ( net profit
plus interest divided by total investment) has been carried out over the period of the
project life and all the results are found to be satisfactory.
3. Break-even Analysis
The break-even analysis establishes a relationship between operation costs and revenues.
It indicates the level at which costs and revenue are in equilibrium. To this end, the
break-even point of the project including cost of finance when it starts to operate at full
capacity ( year 3) is estimated by using income statement projection.
BE = Fixed Cost = 24 %
Sales – Variable Cost

99-20
4. Payback Period
The pay back period, also called pay – off period is defined as the period required to
recover the original investment outlay through the accumulated net cash flows earned by
the project. Accordingly, based on the projected cash flow it is estimated that the
project’s initial investment will be fully recovered within 5 years.
5. Internal Rate of Return
The internal rate of return (IRR) is the annualized effective compounded return rate that
can be earned on the invested capital, i.e., the yield on the investment. Put another way,
the internal rate of return for an investment is the discount rate that makes the net present
value of the investment's income stream total to zero. It is an indicator of the efficiency or
quality of an investment. A project is a good investment proposition if its IRR is greater
than the rate of return that could be earned by alternate investments or putting the money
in a bank account. Accordingly, the IRR of this porject is computed to be 21.66 %
indicating the vaiability of the project.
6. Net Present Value
Net present value (NPV) is defined as the total present ( discounted) value of a time
series of cash flows. NPV aggregates cash flows that occur during different periods of
time during the life of a project in to a common measuring unit i.e. present value. It is a
standard method for using the time value of money to appraise long-term projects. NPV
is an indicator of how much value an investment or project adds to the capital invested. In
principal a project is accepted if the NPV is non-negative.
Accordingly, the net present value of the project at 8.5% discount rate is found to be
Birr 5.53 million which is acceptable.
99-21
D. ECONOMIC BENEFITS
The project can create employment for 31 persons. In addition to supply of the
domestic needs, the project will generate Birr 3.67 million in terms of tax revenue. The
project will create forward linkage with poultry farms.
Recommended