NISTIR 7880-9
NIST Micronutrients Measurement Quality Assurance Program
Winter 2008 Comparability Studies
Results for Round Robin LXIII Fat-Soluble Vitamins and Carotenoids in Human Serum
and Round Robin 28 Ascorbic Acid in Human Serum
David L. Duewer Jeanice B. Thomas

NISTIR 7880-9
NIST Micronutrients Measurement Quality Assurance Program
Winter 2008 Comparability Studies
Results for Round Robin LXIII Fat-Soluble Vitamins and Carotenoids in Human Serum
and Round Robin 28 Ascorbic Acid in Human Serum
David L. Duewer Jeanice B. Thomas
Chemical Sciences Division Materials Measurement Laboratory
April, 2013
U.S. Department of Commerce Rebecca Blank, Acting Secretary
National Institute of Standards and Technology Patrick D. Gallagher, Under Secretary of Commerce for Standards and Technology and Director

(This page intentionally blank)
ii
Abstract
The National Institute of Standards and Technology coordinates the Micronutrients Measurement Quality Assurance Program (MMQAP) for laboratories that measure fat- and water-soluble vitamins and carotenoids in human serum and plasma. This report describes the design of and results for the Winter 2008 MMQAP measurement comparability improvement studies: 1) Round Robin LXIII Fat-Soluble Vitamins and Carotenoids in Human Serum and 2) Round Robin 28 Total Ascorbic Acid in Human Serum. The materials for both studies were shipped to participants in November 2007; participants were requested to provide their measurement results by March 3, 2008.
Keywords
Human Serum Retinol, α-Tocopherol, γ-Tocopherol, Total and Trans-β-Carotene
SRM 968d, SRM 1950 Total Ascorbic Acid
iii
Table of Contents
Abstract............................................................................................................................................... iii Keywords ............................................................................................................................................ iii Table of Contents ............................................................................................................................... iv Introduction......................................................................................................................................... 1 Round Robin LXIII: Fat-Soluble Vitamins and Carotenoids in Human Serum......................... 1 Round Robin 28: Vitamin C in Human Serum............................................................................... 2 References ............................................................................................................................................ 3
Appendix A. Shipping Package Inserts for RR63........................................................................ A1 Appendix B. Final Report for RR63 ..............................................................................................B1 Appendix C. “All-Lab Report” for RR63 ......................................................................................C1 Appendix D. Representative “Individualized Report” for RR63 ............................................... D1 Appendix E. Shipping Package Inserts for RR28 ......................................................................... E1 Appendix F. Final Report for RR28............................................................................................... F1 Appendix G. “All-Lab Report” for RR28..................................................................................... G1 Appendix H. Representative “Individualized Report” for RR28............................................... H1
iv
Introduction
Beginning in 1988, the National Institute of Standards and Technology (NIST) has coordinated the Micronutrients Measurement Quality Assurance Program (MMQAP) for laboratories that measure fat- and water-soluble vitamins and carotenoids in human serum and plasma. The MMQAP provides participants with measurement comparability assessment through use of interlaboratory studies, Standard Reference Materials (SRMs) and control materials, and methods development and validation. Serum-based samples with assigned values for the target analytes (retinol, alpha-tocopherol, gamma/beta-tocopherol, trans- and total beta-carotene, and total ascorbic acid) and performance-evaluation standards are distributed by NIST to laboratories for analysis.
Participants use the methodology of their choice to determine analyte content in the control and study materials. Participants provide their data to NIST, where it is compiled and evaluated for trueness relative to the NIST value, within-laboratory precision, and concordance within the participant community. NIST provides the participants with a technical summary report concerning their performance for each exercise and suggestions for methods development and refinement. Participants who have concerns regarding their laboratory’s performance are encouraged to consult with the MMQAP coordinators.
All MMQAP interlaboratory studies consist of individual units of batch-prepared samples that are distributed to each participant. For historical reasons these studies are referred to as “Round Robins”. The MMQAP program and the nature of its studies are described elsewhere. [1,2]
Round Robin LXIII: Fat-Soluble Vitamins and Carotenoids in Human Serum
Participants in the MMQAP Fat-Soluble Vitamins and Carotenoids in Human Serum Round Robin LXIII comparability study (hereafter referred to as RR63) received eight liquid-frozen human serum test samples for analysis. Unless multiple vials were previously requested, participants received one vial of each serum. These sera were shipped on dry ice to participants in November 2007. The communication materials included in the sample shipment are provided in Appendix A.
Participants are requested to report values for all fat-soluble vitamin-related analytes that are of interest to their organizations. Not all participants report values for the target analytes, and many participants report values for non-target analytes.
The final report delivered to every participant in RR63 consists of three documents:
• A cover letter for the current study, a brief description of the other two documents, and a discussion of our analysis of the overall results that may be of broad interest. This cover letter is reproduced as Appendix B.
• The “All-Lab Report” that lists all of the reported measurement results, a number of consensus statistics for analytes reported by more than one participant, and the mean median and pooled SD from any prior distributions of the serum. This report also provides a numerical “score card” for each participant’s measurement comparability for the more commonly reported analytes. This report is reproduced as Appendix C.
1
• An “Individualized Report” that graphically analyzes each participant’s results for all analytes reported by at least five participants. This report also provides a graphical summary of their measurement comparability. The graphical tools used in this report are described in detail elsewhere [3]. An example “Individualized Report” is reproduced as Appendix D.
Round Robin 28: Vitamin C in Human Serum
Participants in the MMQAP Vitamin C in Human Serum Round Robin 28 comparability study (hereafter referred to as RR28) received four frozen serum test samples, one frozen control serum, and a solid ascorbic acid control material for analysis. Unless multiple vials were previously requested, participants received one vial of each material. These sample materials were shipped on dry ice to participants in November 2007. The communication materials included in the sample shipment are provided in Appendix E.
The test and control serum materials were prepared by adding equal volumes of 10 % metaphosphoric acid (MPA) to human serum that had been spiked with ascorbic acid. While these samples contain some dehydroascorbic acid, its content is variable. Therefore, the participants report only total ascorbic acid (TAA, ascorbic acid plus dehydroascorbic acid). Participants are also encouraged to prepare calibration solutions from the supplied solid control to enable calibrating their serum measurements to the same reference standard.
The final report delivered to every participant in RR28 consists of three documents:
• A cover letter for the current study, a brief description of the other two documents, and a discussion of our analysis of overall results that may be of broad interest. This cover letter is reproduced as Appendix F.
• The “All-Lab Report” that summarizes all of the reported measurement results and provides several consensus statistics. This report is reproduced as Appendix G.
• An “Individualized Report” that graphically analyzes each participant’s results for TAA, including a graphical summary of their measurement comparability. The graphical tools used in this report are described in detail elsewhere [3]. An example “Individualized Report” is reproduced as Appendix H.
2
References
1 Duewer DL, Brown Thomas J, Kline MC, MacCrehan WA, Schaffer R, Sharpless KE, May WE, Crowell JA. NIST/NCI Micronutrients Measurement Quality Assurance Program: Measurement Repeatabilities and Reproducibilities for Fat-Soluble Vitamin-Related Compounds in Human Sera. Anal Chem 1997;69(7):1406-1413.
2 Margolis SA, Duewer DL. Measurement Of Ascorbic Acid in Human Plasma and Serum: Stability, Intralaboratory Repeatability, and Interlaboratory Reproducibility. Clin Chem 1996;42(8):1257-1262.
3 Duewer DL, Kline MC, Sharpless KE, Brown Thomas J, Gary KT, Sowell AL. Micronutrients Measurement Quality Assurance Program: Helping Participants Use Interlaboratory Comparison Exercise Results to Improve Their Long-Term Measurement Performance. Anal Chem 1999;71(9):1870-1878.
3
Appendix A. Shipping Package Inserts for RR63
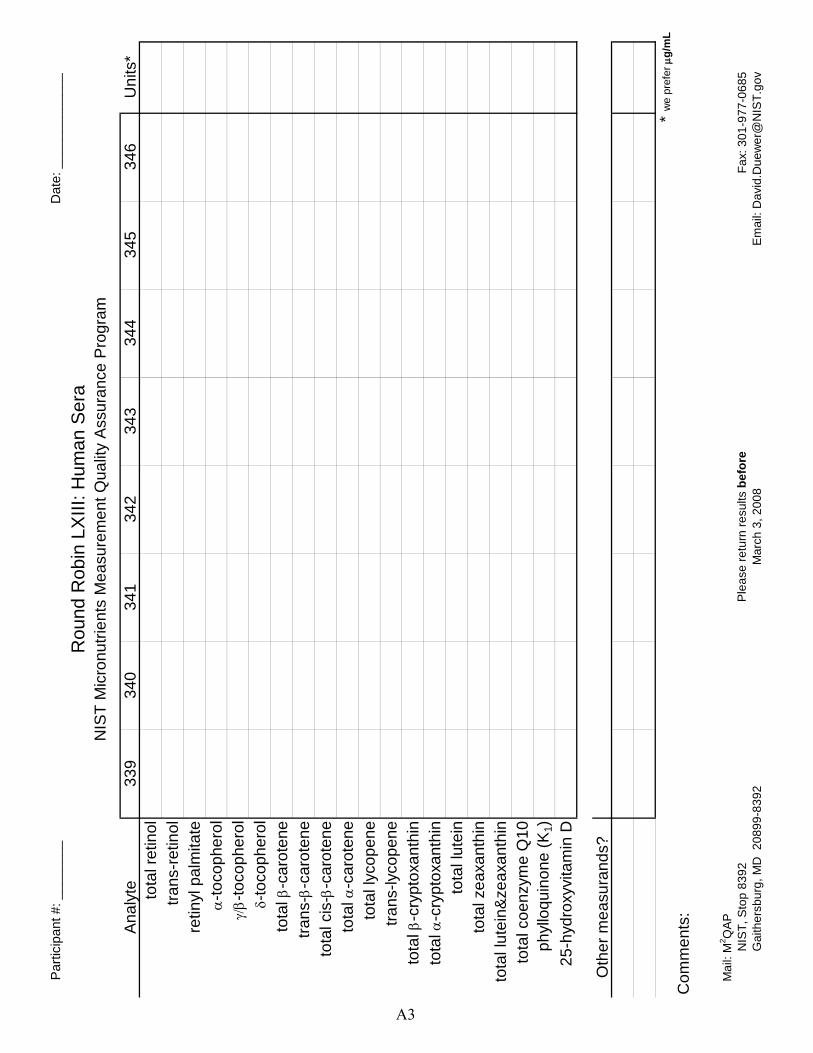
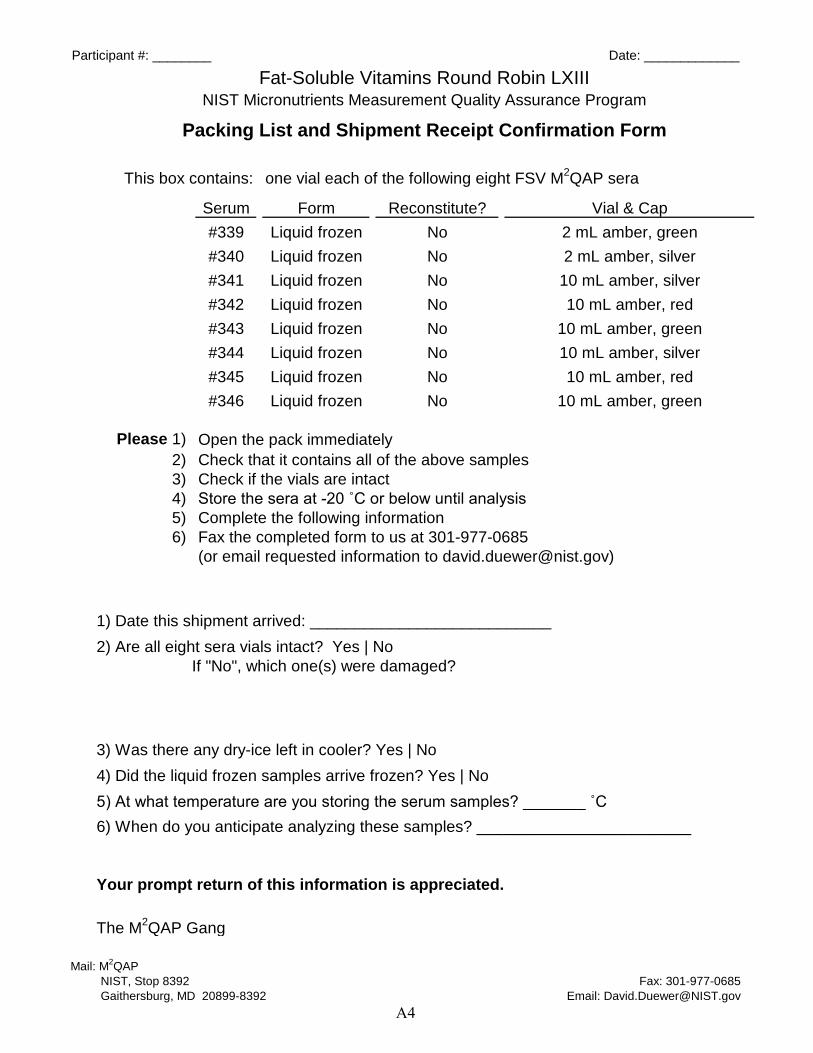
The following three items were included in each package shipped to an RR63 participant: • Cover letter • Datasheet • Packing List and Shipment Receipt Confirmation Form
The cover letter and datasheet were enclosed in a sealed waterproof bag along with the samples themselves. The packing list was placed at the top of the shipping box, between the cardboard covering and the foam insulation.
A1
UNn'ED STATES DEPARTMENT OF COMMERCE National Institute of Standards and Technology Gaithersburg, Maryland 20899-
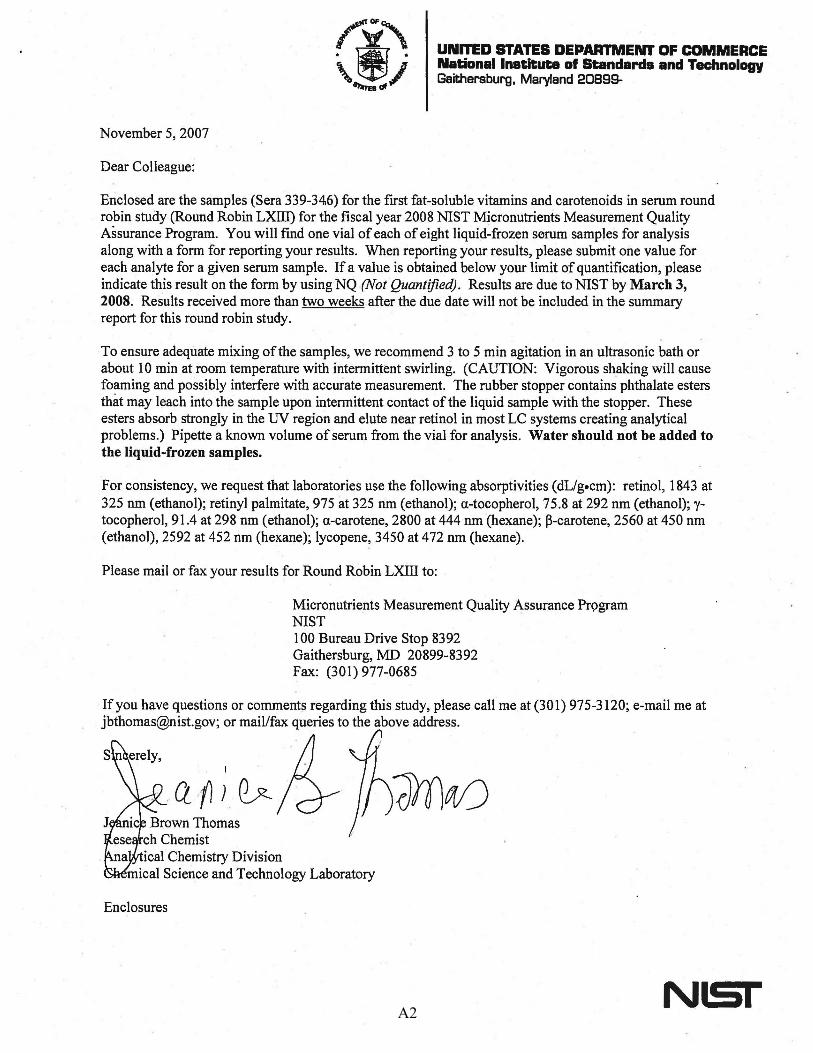
November 5, 2007
Dear Colleague:
Enclosed are the samples (Sera 339-346) for the first fat-soluble vitamins and carotenoids in serum round robin study (Round Robin LXIII) for the fiscal year 2008 NIST Micronutrients Measurement Quality Assurance Program. You will find one vial of each of eight liquid-frozen serum samples for analysis along with a form for reporting your results. When reporting your results, please submit one value for each analyte for a given serum sample. If a value is obtained below your limit of quantification, please indicate this result on the form by using NQ (Not Quantified). Results are due to NIST by March 3, 2008. Results received more than two weeks after the due date will not be included in the summary report for this round robin study.
To ensure adequate mixing of the samples, we recommend 3 to 5 min agitation in an ultrasonic bath or about 10 min at room temperature with intermittent swirling. (CAUTION: Vigorous shaking will cause foaming and possibly interfere with accurate measurement. The rubber stopper contains phthalate esters that may leach into the sample upon intermittent contact of the liquid sample with the stopper. These esters absorb strongly in the UV region and elute near retinal in most LC systems creating analytical problems.) Pipette a known volume of serum from the vial for analysis. Water should not be added to the liquid-frozen samples.
For consistency, we request that laboratories use the following absorptivities (dL/g.cm): retinal, 1843 at 325 nm (ethanol); retinyl palmitate, 975 at 325 nm (ethanol); a-tocopherol, 75.8 at 292 nm (ethanol); ytocopherol, 91.4 at 298 nm (ethanol); a-carotene, 2800 at 444 nm (hexane); P-carotene, 2560 at 450 nm (ethanol), 2592 at 452 nm (hexane); lycopene, 3450 at 4 72 nm (hexane).
Please mail or fax your results for Round Robin LXIII to:
Micronutrients Measurement Quality Assurance Program NIST l 00 Bureau Drive Stop 8392 Gaithersburg, MD 20899-8392 Fax: (301) 977-0685
If you have questions or comments regarding this study, please call me at (301) 975-3120; e-mail me at [email protected]; or mail/fax queries to the above address.
Q~; Qy__! na ical Chemistry Division
mical Science and Technology Laboratory
Enclosures
NISI A2
Parti
cipa
nt #
: ___
____
_ D
ate:
___
____
____
__
Rou
nd R
obin
LXI
II: H
uman
Ser
a N
IST
Mic
ronu
trien
ts M
easu
rem
ent Q
ualit
y As
sura
nce
Prog
ram
A3
Anal
yte
339
340
341
342
343
344
345
346
Uni
ts*
tota
l ret
inol
tra
ns-re
tinol
re
tinyl
pal
mita
te
α-to
coph
erol
γ/β-
toco
pher
ol
δ-to
coph
erol
to
tal β
-car
oten
e tra
ns-β
-car
oten
e to
tal c
is-β
-car
oten
e to
tal α
-car
oten
e to
tal l
ycop
ene
trans
-lyco
pene
to
tal β
-cry
ptox
anth
in
tota
l α-c
rypt
oxan
thin
to
tal l
utei
n to
tal z
eaxa
nthi
n to
tal l
utei
n&ze
axan
thin
tota
l coe
nzym
e Q
10
phyl
loqu
inon
e (K
1)
25-h
ydro
xyvi
tam
in D
Oth
er m
easu
rand
s?
* w
e pr
efer
µg/
mL
Com
men
ts:
Mai
l: M
2 QAP
N
IST,
Sto
p 83
92
Plea
se re
turn
resu
lts b
efor
e Fa
x: 3
01-9
77-0
685
G
aith
ersb
urg,
MD
208
99-8
392
Mar
ch 3
, 200
8 Em
ail:
Dav
id.D
uew
er@
NIS
T.go
v
Participant #: ________ Date: _____________
Fat-Soluble Vitamins Round Robin LXIII NIST Micronutrients Measurement Quality Assurance Program
Packing List and Shipment Receipt Confirmation Form
This box contains: one vial each of the following eight FSV M2QAP sera
Serum Form Reconstitute? Vial & Cap #339 Liquid frozen No 2 mL amber, green #340 Liquid frozen No 2 mL amber, silver #341 Liquid frozen No 10 mL amber, silver #342 Liquid frozen No 10 mL amber, red #343 Liquid frozen No 10 mL amber, green #344 Liquid frozen No 10 mL amber, silver #345 Liquid frozen No 10 mL amber, red #346 Liquid frozen No 10 mL amber, green
Please 1) Open the pack immediately 2) Check that it contains all of the above samples 3) Check if the vials are intact 4) Store the sera at -20 ˚C or below until analysis 5) Complete the following information 6) Fax the completed form to us at 301-977-0685
(or email requested information to [email protected])
1) Date this shipment arrived: ___________________________ 2) Are all eight sera vials intact? Yes | No
If "No", which one(s) were damaged?
3) Was there any dry-ice left in cooler? Yes | No 4) Did the liquid frozen samples arrive frozen? Yes | No 5) At what temperature are you storing the serum samples? _______ ˚C 6) When do you anticipate analyzing these samples? ________________________
Your prompt return of this information is appreciated.
The M2QAP Gang
Mail: M2QAP NIST, Stop 8392 Fax: 301-977-0685 Gaithersburg, MD 20899-8392 Email: [email protected]
A4
Appendix B. Final Report for RR63
The following four pages are the final report as provided to all participants: • Cover letter. • An information sheet that:
o describes the contents of the “All-Lab” report, o describes the content of the “Individualized” report, o describes the nature of the test samples and details their previous distributions,
if any, and o summarizes aspects of the study that we believe may be of interest to the
participants.
B1
May 2, 2008
Dear Colleague:
.
UNrrED STATES DEPARTMENT OF COMMERCE Nat:ionai Institute of Standards and Technology Gaithel'$burg, Maryland 20899-
Enclosed is the summary report of the results for round robin LXIII (RR63) of the 2008 NIST Micronutrients Measurement Quality Assurance Program (M2QAP) for the fat-soluble vitamins and carotenoids in human serum. Included in this report are: 1) a summary of data and measurement comparability scores for all laboratories, 2) a detailed graphical analysis of your results; and 3) a graphical summary of your measurement comparability.
We apologize for distributing four samples, sera #342, 343, 345, and 346 that proved to be quite heterogeneous in ~-carotene. We have elected to exclude all results for these sera from further analysis, on the basis of possible heterogeneity in other analytes and that the observed low levels of mosf analytes in these materials are amply represented by the other RR63 samples. Sera {342, 345} and {343, 346} were each duplicates of two different serum pools, the first from the beginning of their bottling runs and the second from the end.
The "All Lab" and "Individualized" reports present results only for the other four RR63 samples, Sera 339, 340, 341and343. Your overall measurement comparability is summarized in the "Score Card" summary, page 5 of the All Lab Report. Combined results rated 1to3 are within 1 to'3 standard deviations of the assigned value, respectively; those rated 4 are >3 standard deviations from the assigned value. Similar information is presented graphically in the "target plots" that are the last page of your · Individualized Report. If you have concerns regarding your laboratory's performance, please contact us for consultation.
Samples for the second 2008 QA interlaboratory exercise will be shipped starting the week of May 19, 2008. We will send you a reminder via e-mail or fax a week prior to shipment. It is critical that you careful~y inspect all samples upon arrival and that you promptly confirm to us that they have arrived. We will replace samples (lost or damaged in shipment or miss-packaged by us) only for participants who report the problem within one calendar week after the package arrives.
If you have any questions regarding this report, please contact Dave Duewer at [email protected] or me [email protected], tel: 301/975-3120, or fax: 301/977-0685.
Je ice Brown Thomas search Chemist
Analytical Chemistry Division Chemical Science and Technology Laboratory
Cc: L.C. Sander D.L. Duewer
N51 B2
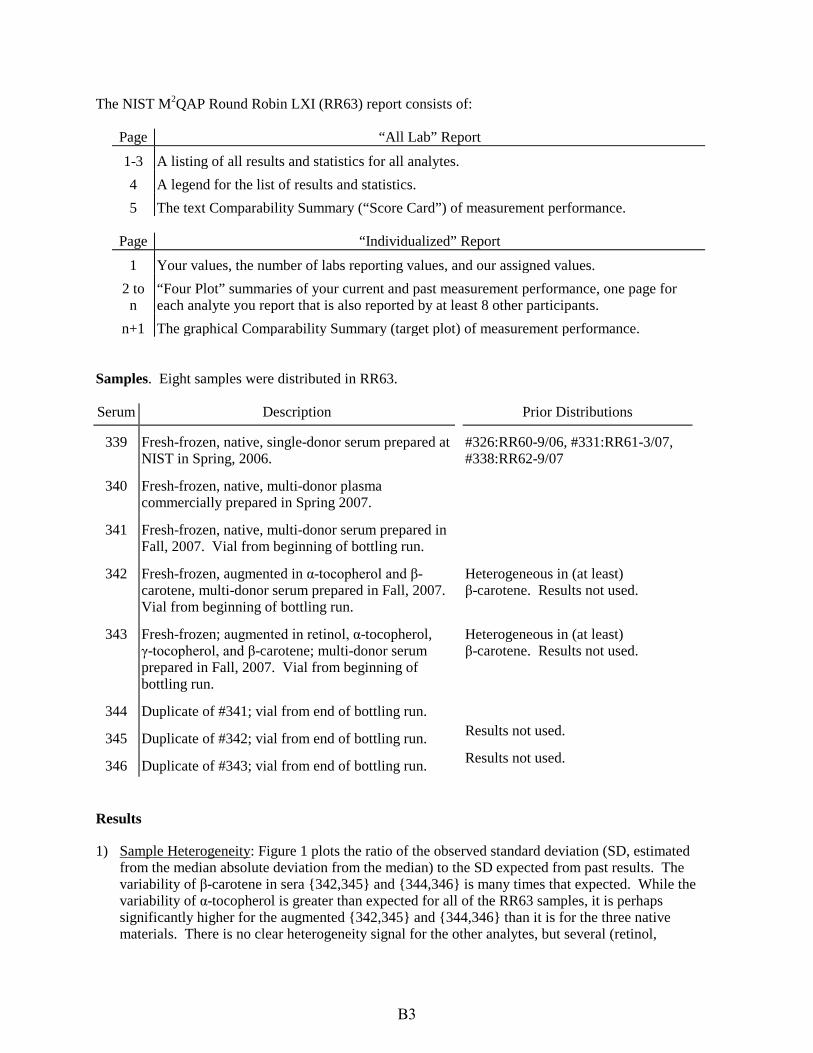
The NIST M2QAP Round Robin LXI (RR63) report consists of:
Page 1-3 A listing of all results and statistics for all analytes. 4 A legend for the list of results and statistics. 5 The text Comparability Summary (“Score Card”) of measurement performance.
Page “Individualized” Report 1
2 to n
n+1
Samples.
Serum
339
340
341
342
343
344
345
346
“All Lab” Report
Your values, the number of labs reporting values, and our assigned values. “Four Plot” summaries of your current and past measurement performance, one page for each analyte you report that is also reported by at least 8 other participants. The graphical Comparability Summary (target plot) of measurement performance.
Eight samples were distributed in RR63.
Description
Fresh-frozen, native, single-donor serum prepared at NIST in Spring, 2006.
Fresh-frozen, native, multi-donor plasma commercially prepared in Spring 2007.
Fresh-frozen, native, multi-donor serum prepared in Fall, 2007. Vial from beginning of bottling run.
Fresh-frozen, augmented in α-tocopherol and βcarotene, multi-donor serum prepared in Fall, 2007. Vial from beginning of bottling run.
Fresh-frozen; augmented in retinol, α-tocopherol, γ-tocopherol, and β-carotene; multi-donor serum prepared in Fall, 2007. Vial from beginning of bottling run.
Duplicate of #341; vial from end of bottling run.
Duplicate of #342; vial from end of bottling run.
Duplicate of #343; vial from end of bottling run.
Prior Distributions
#326:RR60-9/06, #331:RR61-3/07, #338:RR62-9/07
Heterogeneous in (at least) β-carotene. Results not used.
Heterogeneous in (at least) β-carotene. Results not used.
Results not used.
Results not used.
Results
1) Sample Heterogeneity: Figure 1 plots the ratio of the observed standard deviation (SD, estimated from the median absolute deviation from the median) to the SD expected from past results. The variability of β-carotene in sera {342,345} and {344,346} is many times that expected. While the variability of α-tocopherol is greater than expected for all of the RR63 samples, it is perhaps significantly higher for the augmented {342,345} and {344,346} than it is for the three native materials. There is no clear heterogeneity signal for the other analytes, but several (retinol,
B3
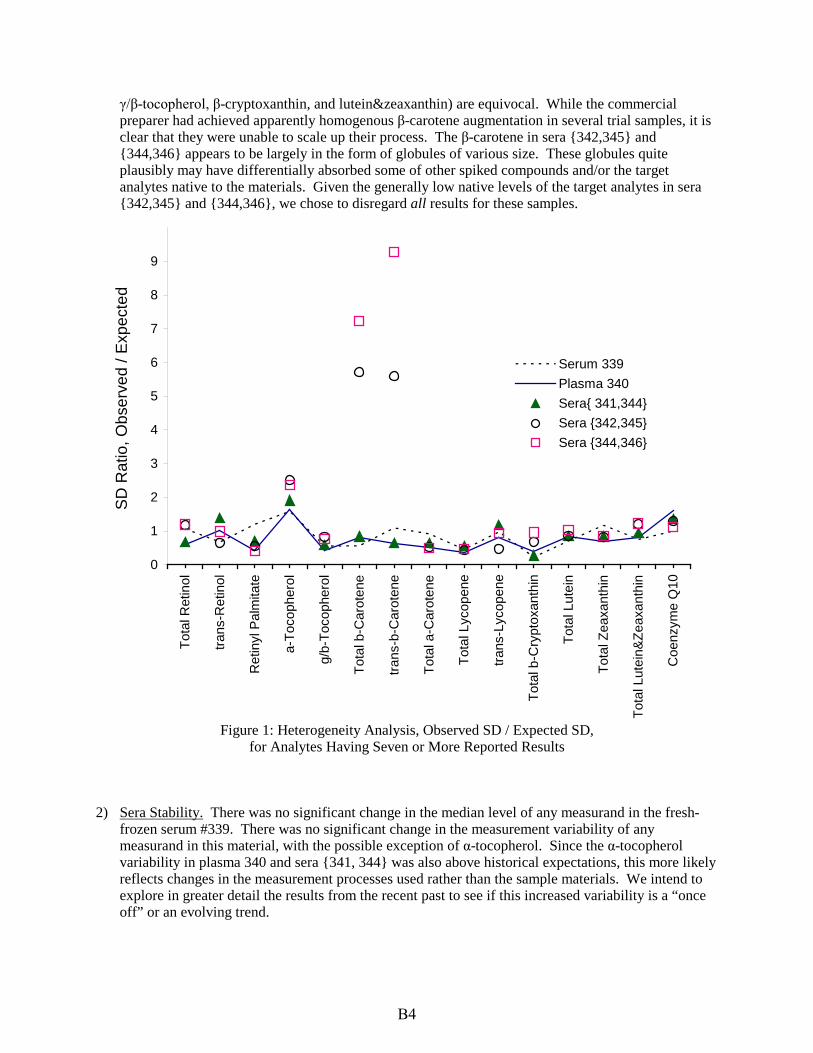
γ/β-tocopherol, β-cryptoxanthin, and lutein&zeaxanthin) are equivocal. While the commercial preparer had achieved apparently homogenous β-carotene augmentation in several trial samples, it is clear that they were unable to scale up their process. The β-carotene in sera {342,345} and {344,346} appears to be largely in the form of globules of various size. These globules quite plausibly may have differentially absorbed some of other spiked compounds and/or the target analytes native to the materials. Given the generally low native levels of the target analytes in sera {342,345} and {344,346}, we chose to disregard all results for these samples.
9
SD R
atio
, Obs
erve
d / E
xpec
ted 8
7
6
5
4
3
2
1
0
Serum 339
Plasma 340
Sera{ 341,344} Sera {342,345} Sera {344,346}
Tota
l Ret
inol
trans
-Ret
inol
Ret
inyl
Pal
mita
te
a-To
coph
erol
g/b-
Toco
pher
ol
Tota
l b-C
arot
ene
trans
-b-C
arot
ene
Tota
l a-C
arot
ene
Tota
l Lyc
open
e
trans
-Lyc
open
e
Tota
l b-C
rypt
oxan
thin
Tota
l Lut
ein
Tota
l Zea
xant
hin
Tota
l Lut
ein&
Zeax
anth
in
Coe
nzym
e Q
10
Figure 1: Heterogeneity Analysis, Observed SD / Expected SD, for Analytes Having Seven or More Reported Results
2) Sera Stability. There was no significant change in the median level of any measurand in the fresh-frozen serum #339. There was no significant change in the measurement variability of any measurand in this material, with the possible exception of α-tocopherol. Since the α-tocopherol variability in plasma 340 and sera {341, 344} was also above historical expectations, this more likely reflects changes in the measurement processes used rather than the sample materials. We intend to explore in greater detail the results from the recent past to see if this increased variability is a “once off” or an evolving trend.
B4
3) Plasma vs. serum. Plasma #340 is Candidate SRM 1950, Metabolites in Human Plasma. There were no analysis problems reported for this material. Your results will contribute to establishing reference and information values for the “Fat Soluble” measurands in this material. We hope to make this material available as an SRM soon.
4) Sera {341,344}: The sera {341, 344} material was intended to be the “Low Level” component of SRM 968d Fat-Soluble Vitamins and Carotenoids in Human Serum. Unfortunately, the intended “Middle” and “High” level components proved to be quite unacceptable. While resource constraints have delayed developing replacement materials for this quite high-priority SRM, we intend to make the {341,344} “Low” material available in some form. From our evaluation of the entire bottling run and from your evaluations of samples from the first and last of the run, the serum pool for Sera 341 and 344 appears to be adequately homogenous in all measurands. One laboratory, however, indicated that the level of α-tocopherol for these sera was near their limit of quantification. We will continue to look into this issue.
B5
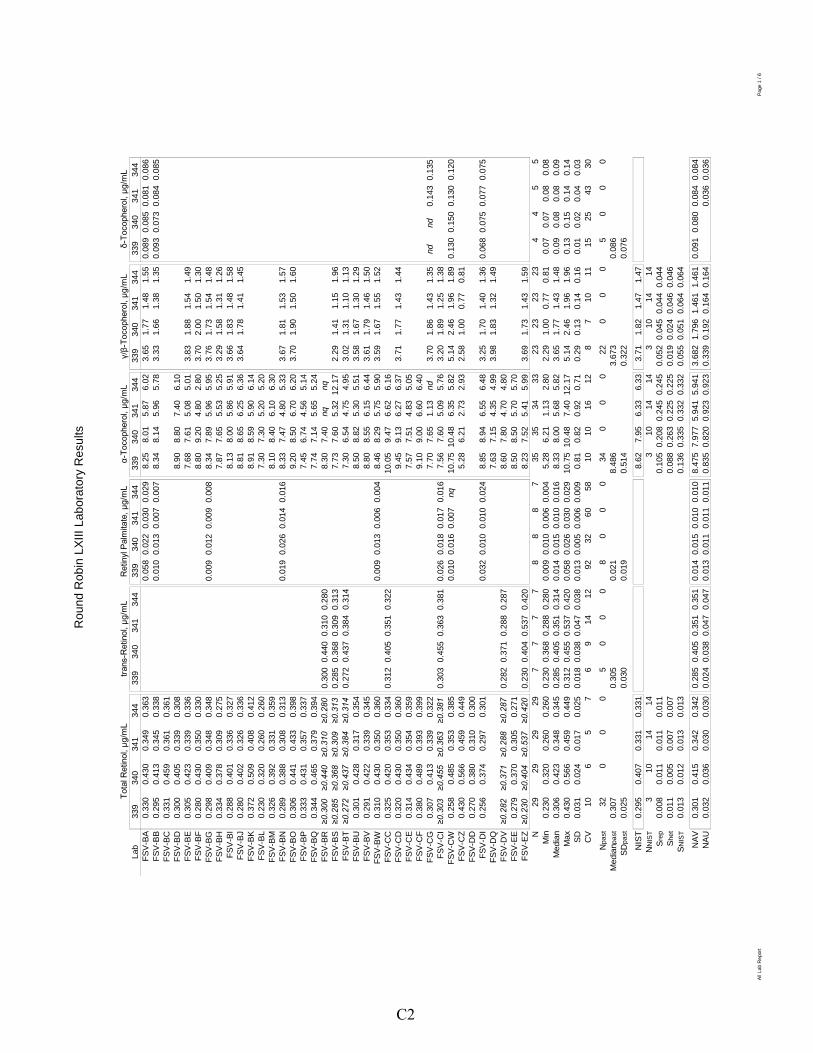
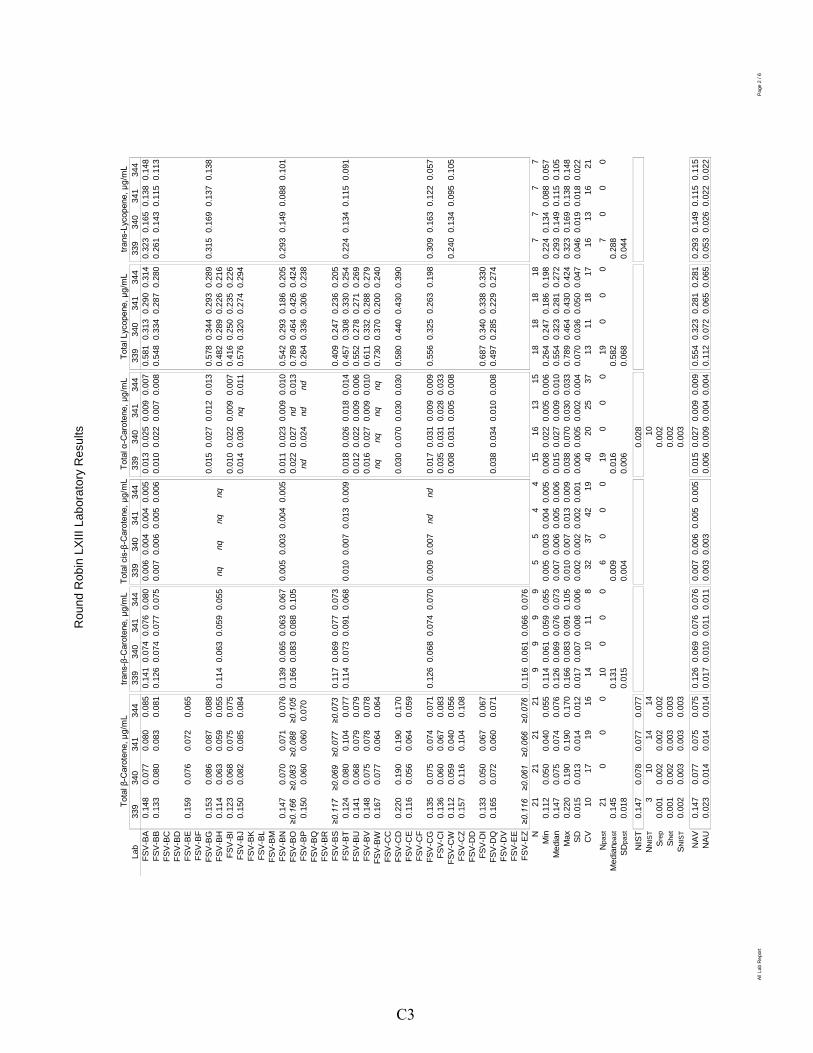
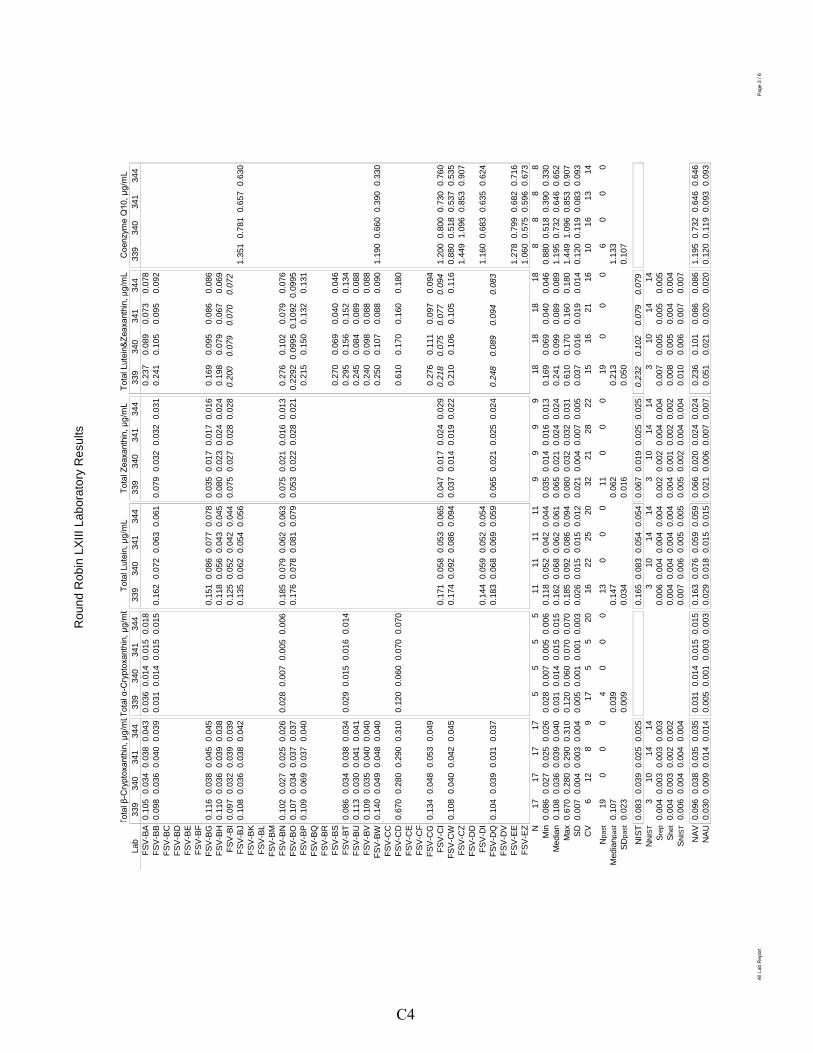
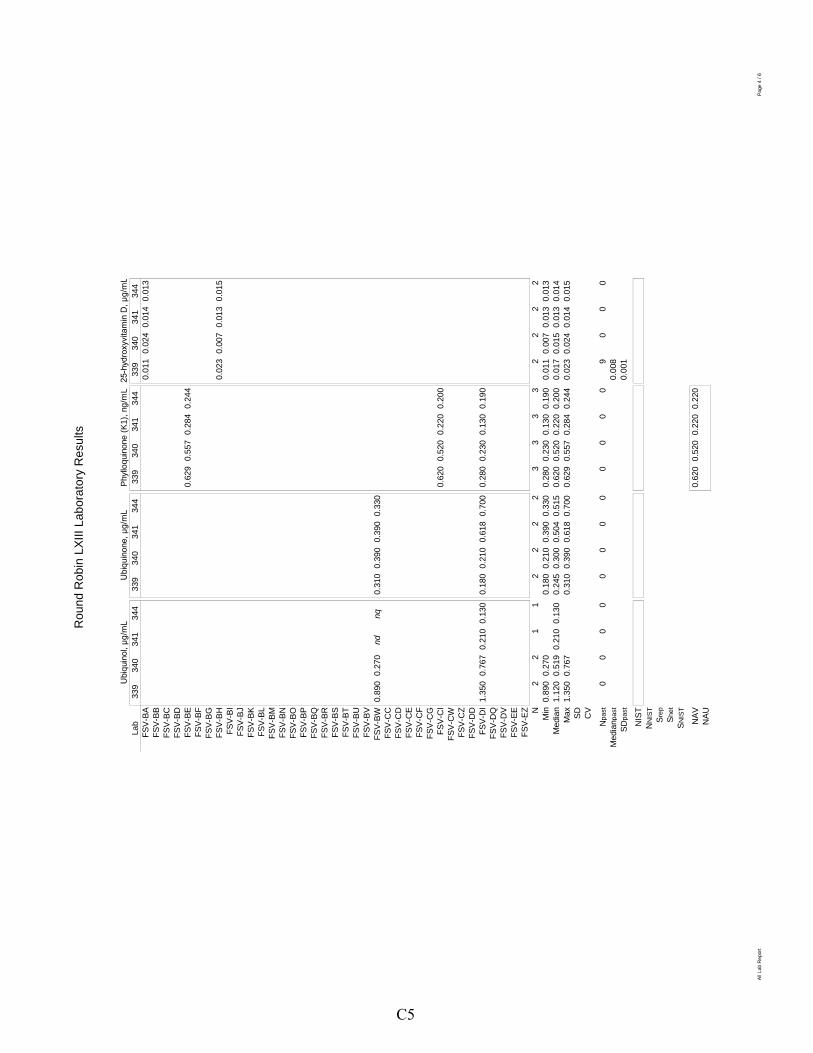
Appendix C. “All-Lab Report” for RR63
The following six pages are the “All-Lab Report” as provided to all participants, with two exceptions:
• the participant identifiers (Lab) have been altered. • the order in which the participant results are listed has been altered.
The data summary in the “All-Lab Report” has been altered to ensure confidentiality of identification codes assigned to laboratories. The only attributed results are those reported by NIST. The NIST results are not used in the assessment of the consensus summary results of the study.
C1
Rou
nd R
obin
LXI
II La
bora
tory
Res
ults
Total R
etinol, μg/mL
trans-Retinol, μg/mL
Retinyl Pa
lmitate, μg/mL
α-To
copherol, μg/mL
γ/β-To
copherol, μg/mL
δ-To
copherol, μg/mL
Lab
339
340
341
344
C2
FSV-
BA
0.33
0 0.
430
0.34
9 0.
363
FSV-
BB
0.29
5 0.
413
0.34
5 0.
338
FSV-
BC
0.33
1 0.
459
0.36
1 0.
361
FSV-
BD
0.30
0 0.
405
0.33
9 0.
308
FSV-
BE
0.30
5 0.
423
0.33
9 0.
336
FSV-
BF
0.28
0 0.
430
0.35
0 0.
330
FSV-
BG
0.29
8 0.
409
0.34
8 0.
348
FSV-
BH
0.33
4 0.
378
0.30
9 0.
275
FSV-
BI
0.28
8 0.
401
0.33
6 0.
327
FSV-
BJ
0.28
0 0.
402
0.32
6 0.
336
FSV-
BK
0.37
2 0.
509
0.40
8 0.
412
FSV-
BL
0.23
0 0.
320
0.26
0 0.
260
FSV-
BM
0.32
6 0.
392
0.33
1 0.
359
FSV-
BN
0.28
9 0.
388
0.30
8 0.
313
FSV-
BO
0.30
6 0.
441
0.43
3 0.
398
FSV-
BP
0.33
3 0.
431
0.35
7 0.
337
FSV-
BQ
0.34
4 0.
465
0.37
9 0.
394
FSV-
BR ≥0.300
≥0.440
≥0.310
≥0.280
≥0.285
≥0.368
≥0.309
≥0.313
FS
V-BS
≥0.272
≥0.437
≥0.384
≥0.314
FS
V-BT
FS
V-BU
0.
301
0.42
8 0.
317
0.35
4 FS
V-BV
0.
291
0.42
2 0.
339
0.34
5 FS
V-BW
0.
310
0.43
0 0.
350
0.36
0 FS
V-C
C
0.32
5 0.
420
0.35
3 0.
334
FSV-
CD
0.
320
0.43
0 0.
350
0.36
0 FS
V-C
E 0.
314
0.43
4 0.
354
0.35
9 FS
V-C
F 0.
380
0.48
9 0.
393
0.39
9 FS
V-C
G
0.30
7 0.
413
0.33
9 0.
322
FSV-
CI ≥0.303
≥0.455
≥0.363
≥0.381
FS
V-C
W
0.25
8 0.
485
0.35
3 0.
385
FSV-
CZ
0.43
0 0.
566
0.45
9 0.
449
FSV-
DD
0.
270
0.38
0 0.
310
0.30
0 FS
V-D
I 0.
256
0.37
4 0.
297
0.30
1 FS
V-D
Q
FSV-
DV ≥0.282
≥0.371
≥0.288
≥0.287
FS
V-EE
0.
279
0.37
0 0.
305
0.27
1 FS
V-EZ
≥0.230
≥0.404
≥0.537
≥0.420
339
340
341
344
0.30
0 0.
440
0.31
0 0.
280
0.28
5 0.
368
0.30
9 0.
313
0.27
2 0.
437
0.38
4 0.
314
0.31
2 0.
405
0.35
1 0.
322
0.30
3 0.
455
0.36
3 0.
381
0.28
2 0.
371
0.28
8 0.
287
0.23
0 0.
404
0.53
7 0.
420
339
340
341
344
0.05
8 0.
022
0.03
0 0.
029
0.01
0 0.
013
0.00
7 0.
007
0.00
9 0.
012
0.00
9 0.
008
0.01
9 0.
026
0.01
4 0.
016
0.00
9 0.
013
0.00
6 0.
004
0.02
6 0.
018
0.01
7 0.
016
0.01
0 0.
016
0.00
7 nq
0.03
2 0.
010
0.01
0 0.
024
339
340
341
344
8.25
8.
01
5.87
6.
02
8.34
8.
14
5.96
5.
78
8.90
8.
80
7.40
6.
10
7.68
7.
61
5.08
5.
01
8.80
9.
20
4.80
2.
80
8.34
7.
89
5.96
5.
95
7.87
7.
65
5.53
5.
25
8.13
8.
00
5.86
5.
91
8.81
8.
65
6.25
6.
36
8.91
8.
59
5.90
6.
14
7.30
7.
30
5.20
5.
20
8.10
8.
40
6.10
6.
30
8.33
7.
47
4.80
5.
33
9.20
8.
50
6.70
6.
20
7.45
6.
74
4.56
5.
14
7.74
7.
14
5.65
5.
24
8.30
7.
40
nq
nq
7.73
7.
60
5.32
12.
17
7.30
6.
54
4.75
4.
95
8.50
8.
82
5.30
5.
51
8.80
8.
55
6.15
6.
44
8.46
8.
29
5.75
5.
90
10.0
5 9.
47
6.62
6.
16
9.45
9.
13
6.27
6.
37
7.57
7.
51
4.83
5.
05
9.10
9.
00
6.60
6.
40
7.70
7.
65
1.13
nd
7.
56
7.60
5.
09
5.76
10
.75
10.4
8 6.
35
5.82
5.
28
6.21
2.
73
2.93
8.85
8.
94
6.55
6.
48
7.63
7.
15
4.35
4.
99
8.60
7.
80
4.70
4.
80
8.50
8.
50
5.70
5.
70
8.23
7.
52
5.41
5.
99
339
340
341
344
3.65
1.
77
1.48
1.
55
3.33
1.
66
1.38
1.
35
3.83
1.
88
1.54
1.
49
3.70
2.
00
1.50
1.
30
3.76
1.
73
1.54
1.
48
3.29
1.
58
1.31
1.
26
3.66
1.
83
1.48
1.
58
3.64
1.
78
1.41
1.
45
3.67
1.
81
1.53
1.
57
3.70
1.
90
1.50
1.
60
2.29
1.
41
1.15
1.
96
3.02
1.
31
1.10
1.
13
3.58
1.
67
1.30
1.
29
3.61
1.
79
1.46
1.
50
3.59
1.
67
1.55
1.
52
3.71
1.
77
1.43
1.
44
3.70
1.
86
1.43
1.
35
3.20
1.
89
1.25
1.
38
5.14
2.
46
1.96
1.
89
2.58
1.
00
0.77
0.
81
3.25
1.
70
1.40
1.
36
3.98
1.
83
1.32
1.
49
3.69
1.
73
1.43
1.
59
339
340
341
344
0.08
9 0.
085
0.08
1 0.
086
0.09
3 0.
073
0.08
4 0.
085
nd
nd
0.14
3 0.
135
0.13
0 0.
150
0.13
0 0.
120
0.06
8 0.
075
0.07
7 0.
075
N
29
29
29
29
7 7
7 7
8 8
8 7
35
35
34
33
23
23
23
23
4 4
5 5
Min
0.
230
0.32
0 0.
260
0.26
0 0.
230
0.36
8 0.
288
0.28
0 0.
009
0.01
0 0.
006
0.00
4 5.
28
6.21
1.
13
2.80
2.
29
1.00
0.
77
0.81
0.
07
0.07
0.
08
0.08
M
edia
n 0.
306
0.42
3 0.
348
0.34
5 0.
285
0.40
5 0.
351
0.31
4 0.
014
0.01
5 0.
010
0.01
6 8.
33
8.00
5.
68
5.82
3.
65
1.77
1.
43
1.48
0.
09
0.08
0.
08
0.09
M
ax
0.43
0 0.
566
0.45
9 0.
449
0.31
2 0.
455
0.53
7 0.
420
0.05
8 0.
026
0.03
0 0.
029
10.7
5 10
.48
7.40
12.
17
5.14
2.
46
1.96
1.
96
0.13
0.
15
0.14
0.
14
SD
0.03
1 0.
024
0.01
7 0.
025
0.01
8 0.
038
0.04
7 0.
038
0.01
3 0.
005
0.00
6 0.
009
0.81
0.
82
0.92
0.
71
0.29
0.
13
0.14
0.
16
0.01
0.
02
0.04
0.
03
CV
10
6 5
7 6
9 14
12
92
32
60
58
10
10
16
12
8
7 10
11
15
25
43
30
Npa
st
32
0 0
0 5
0 0
0 8
0 0
0 34
0
0 0
22
0 0
0 5
0 0
0 M
edia
npas
t 0.
307
0.30
5 0.
021
8.48
6 3.
673
0.08
6 SD
past
0.
025
0.03
0 0.
019
0.51
4 0.
322
0.07
6
NIS
T 0.
295
0.40
7 0.
331
0.33
1 8.
62
7.95
6.
33
6.33
3.
71
1.82
1.
47
1.47
N
NIS
T 3
10
14
14
3 10
14
14
3
10
14
14
Srep
0.
008
0.01
1 0.
011
0.01
1 0.
105
0.20
8 0.
245
0.24
5 0.
052
0.04
5 0.
044
0.04
4
Shet
0.
011
0.00
5 0.
007
0.00
7 0.
088
0.26
3 0.
225
0.22
5 0.
019
0.02
4 0.
046
0.04
6
SNIS
T 0.
013
0.01
2 0.
013
0.01
3 0.
136
0.33
5 0.
332
0.33
2 0.
055
0.05
1 0.
064
0.06
4
NAV
0.
301
0.41
5 0.
342
0.34
2 0.
285
0.40
5 0.
351
0.35
1 0.
014
0.01
5 0.
010
0.01
0 8.
475
7.97
7 5.
941
5.94
1 3.
682
1.79
6 1.
461
1.46
1 0.
091
0.08
0 0.
084
0.08
4 N
AU
0.03
2 0.
036
0.03
0 0.
030
0.02
4 0.
038
0.04
7 0.
047
0.01
3 0.
011
0.01
1 0.
011
0.83
5 0.
820
0.92
3 0.
923
0.33
9 0.
192
0.16
4 0.
164
0.03
6 0.
036
All L
ab R
epor
t Pa
ge 1
/ 6
Rou
nd R
obin
LXI
II La
bora
tory
Res
ults
Total β-Carotene, μg/mL
trans-β-Carotene, μg/mL
Total cis-β-Carotene, μg/mL
Total α-Carotene, μg/mL
Total Lycopene, μg/mL
trans-Lycopene, μg/mL
Lab
339
340
341
344
C3
FSV-
BA
0.14
8 0.
077
0.08
0 0.
085
FSV-
BB
0.13
3 0.
080
0.08
3 0.
081
FSV-
BC
FSV-
BD
FSV-
BE
0.15
9 0.
076
0.07
2 0.
065
FSV-
BF
FSV-
BG
0.15
3 0.
086
0.08
7 0.
088
FSV-
BH
0.11
4 0.
063
0.05
9 0.
055
FSV-
BI
0.12
3 0.
068
0.07
5 0.
075
FSV-
BJ
0.15
0 0.
082
0.08
5 0.
084
FSV-
BK
FSV-
BL
FSV-
BM
FSV-
BN
0.14
7 0.
070
0.07
1 0.
076
FSV-
BO ≥0.166
≥0.083
≥0.088
≥0.105
FS
V-BP
0.
150
0.06
0 0.
060
0.07
0 FS
V-BQ
FS
V-BR
FS
V-BS
≥0.117
≥0.069
≥0.077
≥0.073
FS
V-BT
0.
124
0.08
0 0.
104
0.07
7 FS
V-BU
0.
141
0.06
8 0.
079
0.07
9 FS
V-BV
0.
148
0.07
5 0.
078
0.07
8 FS
V-BW
0.
167
0.07
7 0.
064
0.06
4 FS
V-C
C
FSV-
CD
0.
220
0.19
0 0.
190
0.17
0 FS
V-C
E 0.
116
0.05
6 0.
064
0.05
9 FS
V-C
F FS
V-C
G
0.13
5 0.
075
0.07
4 0.
071
FSV-
CI
0.13
6 0.
060
0.06
7 0.
083
FSV-
CW
0.
112
0.05
9 0.
040
0.05
6 FS
V-C
Z 0.
157
0.11
6 0.
104
0.10
8 FS
V-D
D
FSV-
DI
0.13
3 0.
050
0.06
7 0.
067
FSV-
DQ
0.
165
0.07
2 0.
060
0.07
1 FS
V-D
V FS
V-EE
FS
V-EZ
≥0.116
≥0.061
≥0.066
≥0.076
339
340
341
344
0.14
1 0.
074
0.07
6 0.
080
0.12
6 0.
074
0.07
7 0.
075
0.11
4 0.
063
0.05
9 0.
055
0.13
9 0.
065
0.06
3 0.
067
0.16
6 0.
083
0.08
8 0.
105
0.11
7 0.
069
0.07
7 0.
073
0.11
4 0.
073
0.09
1 0.
068
0.12
6 0.
068
0.07
4 0.
070
0.11
6 0.
061
0.06
6 0.
076
339
340
341
344
0.00
6 0.
004
0.00
4 0.
005
0.00
7 0.
006
0.00
5 0.
006
nq
nq
nq
nq
0.00
5 0.
003
0.00
4 0.
005
0.01
0 0.
007
0.01
3 0.
009
0.00
9 0.
007
nd
nd
339
340
341
344
0.01
3 0.
025
0.00
9 0.
007
0.01
0 0.
022
0.00
7 0.
008
0.01
5 0.
027
0.01
2 0.
013
0.01
0 0.
022
0.00
9 0.
007
0.01
4 0.
030
nq
0.01
1
0.01
1 0.
023
0.00
9 0.
010
0.02
2 0.
027
nd
0.01
3 nd
0.
024
nd
nd
0.01
8 0.
026
0.01
8 0.
014
0.01
2 0.
022
0.00
9 0.
006
0.01
6 0.
027
0.00
9 0.
010
nq
nq
nq
nq
0.03
0 0.
070
0.03
0 0.
030
0.01
7 0.
031
0.00
9 0.
009
0.03
5 0.
031
0.02
8 0.
033
0.00
8 0.
031
0.00
5 0.
008
0.03
8 0.
034
0.01
0 0.
008
339
340
341
344
0.58
1 0.
313
0.29
0 0.
314
0.54
8 0.
334
0.28
7 0.
280
0.57
8 0.
344
0.29
3 0.
289
0.48
2 0.
289
0.22
6 0.
216
0.41
6 0.
250
0.23
5 0.
226
0.57
6 0.
320
0.27
4 0.
294
0.54
2 0.
293
0.18
6 0.
205
0.78
9 0.
464
0.42
6 0.
424
0.26
4 0.
336
0.30
6 0.
238
0.40
9 0.
247
0.23
6 0.
205
0.45
7 0.
308
0.33
0 0.
254
0.55
2 0.
278
0.27
1 0.
269
0.61
1 0.
332
0.28
8 0.
279
0.73
0 0.
370
0.20
0 0.
240
0.58
0 0.
440
0.43
0 0.
390
0.55
6 0.
325
0.26
3 0.
198
0.68
7 0.
340
0.33
8 0.
330
0.49
7 0.
285
0.22
9 0.
274
339
340
341
344
0.32
3 0.
165
0.13
8 0.
148
0.26
1 0.
143
0.11
5 0.
113
0.31
5 0.
169
0.13
7 0.
138
0.29
3 0.
149
0.08
8 0.
101
0.22
4 0.
134
0.11
5 0.
091
0.30
9 0.
163
0.12
2 0.
057
0.24
0 0.
134
0.09
5 0.
105
N
21
21
21
21
9 9
9 9
5 5
4 4
15
16
13
15
18
18
18
18
7 7
7 7
Min
0.
112
0.05
0 0.
040
0.05
5 0.
114
0.06
1 0.
059
0.05
5 0.
005
0.00
3 0.
004
0.00
5 0.
008
0.02
2 0.
005
0.00
6 0.
264
0.24
7 0.
186
0.19
8 0.
224
0.13
4 0.
088
0.05
7 M
edia
n 0.
147
0.07
5 0.
074
0.07
6 0.
126
0.06
9 0.
076
0.07
3 0.
007
0.00
6 0.
005
0.00
6 0.
015
0.02
7 0.
009
0.01
0 0.
554
0.32
3 0.
281
0.27
2 0.
293
0.14
9 0.
115
0.10
5 M
ax
0.22
0 0.
190
0.19
0 0.
170
0.16
6 0.
083
0.09
1 0.
105
0.01
0 0.
007
0.01
3 0.
009
0.03
8 0.
070
0.03
0 0.
033
0.78
9 0.
464
0.43
0 0.
424
0.32
3 0.
169
0.13
8 0.
148
SD
0.01
5 0.
013
0.01
4 0.
012
0.01
7 0.
007
0.00
8 0.
006
0.00
2 0.
002
0.00
2 0.
001
0.00
6 0.
005
0.00
2 0.
004
0.07
0 0.
036
0.05
0 0.
047
0.04
6 0.
019
0.01
8 0.
022
CV
10
17
19
16
14
10
11
8 32
37
42
19
40
20
25
37
13
11
18
17
16
13
16
21
Npa
st
21
0 0
0 10
0
0 0
6 0
0 0
19
0 0
0 19
0
0 0
7 0
0 0
Med
ianp
ast
0.14
5 0.
131
0.00
9 0.
016
0.58
2 0.
288
SDpa
st
0.01
8 0.
015
0.00
4 0.
006
0.06
8 0.
044
NIS
T 0.
147
0.07
8 0.
077
0.07
7 0.
028
N
NIS
T 3
10
14
14
10
Srep
0.
001
0.00
2 0.
002
0.00
2 0.
002
Sh
et
0.00
1 0.
002
0.00
3 0.
003
0.00
2
SNIS
T 0.
002
0.00
3 0.
003
0.00
3 0.
003
NAV
0.
147
0.07
7 0.
075
0.07
5 0.
126
0.06
9 0.
076
0.07
6 0.
007
0.00
6 0.
005
0.00
5 0.
015
0.02
7 0.
009
0.00
9 0.
554
0.32
3 0.
281
0.28
1 0.
293
0.14
9 0.
115
0.11
5 N
AU
0.02
3 0.
014
0.01
4 0.
014
0.01
7 0.
010
0.01
1 0.
011
0.00
3 0.
003
0.00
6 0.
009
0.00
4 0.
004
0.11
2 0.
072
0.06
5 0.
065
0.05
3 0.
026
0.02
2 0.
022
All L
ab R
epor
t Pa
ge 2
/ 6
Rou
nd R
obin
LXI
II La
bora
tory
Res
ults
Total β-Cryptoxanthin, μg/mL Total α-Cryptoxanthin, μg/mL
Total Lutein, μg/mL
Total Zeaxanthin, μg/mL
Total Lutein&
Zeaxanthin, μg/mL
Coenzym
e Q10, μg/mL
Lab
339
340
341
344
C4
FSV-
BA 0
.105
0.0
34 0
.038
0.0
43
FSV-
BB 0
.098
0.0
36 0
.040
0.0
39
FSV-
BC
FSV-
BD
FSV-
BE
FSV-
BF
FSV-
BG 0
.116
0.0
38 0
.045
0.0
45
FSV-
BH 0
.110
0.0
36 0
.039
0.0
38
FSV-
BI 0
.097
0.0
32 0
.039
0.0
39
FSV-
BJ 0
.108
0.0
36 0
.038
0.0
42
FSV-
BK
FSV-
BL
FSV-
BM
FSV-
BN 0
.102
0.0
27 0
.025
0.0
26
FSV-
BO 0
.107
0.0
34 0
.037
0.0
37
FSV-
BP 0
.109
0.0
69 0
.037
0.0
40
FSV-
BQ
FSV-
BR
FSV-
BS
FSV-
BT 0
.086
0.0
34 0
.038
0.0
34
FSV-
BU 0
.113
0.0
30 0
.041
0.0
41
FSV-
BV 0
.109
0.0
35 0
.040
0.0
40
FSV-
BW 0
.140
0.0
49 0
.048
0.0
40
FSV-
CC
FS
V-C
D 0
.670
0.2
80 0
.290
0.3
10
FSV-
CE
FSV-
CF
FSV-
CG
0.1
34 0
.048
0.0
53 0
.049
FS
V-C
I FS
V-C
W 0
.108
0.0
40 0
.042
0.0
45
FSV-
CZ
FSV-
DD
FS
V-D
I FS
V-D
Q 0
.104
0.0
39 0
.031
0.0
37
FSV-
DV
FSV-
EE
FSV-
EZ
339
340
341
344
0.03
6 0.
014
0.01
5 0.
018
0.03
1 0.
014
0.01
5 0.
015
0.02
8 0.
007
0.00
5 0.
006
0.02
9 0.
015
0.01
6 0.
014
0.12
0 0.
060
0.07
0 0.
070
339
340
341
344
0.16
2 0.
072
0.06
3 0.
061
0.15
1 0.
086
0.07
7 0.
078
0.11
8 0.
056
0.04
3 0.
045
0.12
5 0.
052
0.04
2 0.
044
0.13
5 0.
062
0.05
4 0.
056
0.18
5 0.
079
0.06
2 0.
063
0.17
6 0.
078
0.08
1 0.
079
0.17
1 0.
058
0.05
3 0.
065
0.17
4 0.
092
0.08
6 0.
094
0.14
4 0.
059
0.05
2 0.
054
0.18
3 0.
068
0.06
9 0.
059
339
340
341
344
0.07
9 0.
032
0.03
2 0.
031
0.03
5 0.
017
0.01
7 0.
016
0.08
0 0.
023
0.02
4 0.
024
0.07
5 0.
027
0.02
8 0.
028
0.07
5 0.
021
0.01
6 0.
013
0.05
3 0.
022
0.02
8 0.
021
0.04
7 0.
017
0.02
4 0.
029
0.03
7 0.
014
0.01
9 0.
022
0.06
5 0.
021
0.02
5 0.
024
339
340
341
344
0.23
7 0.
089
0.07
3 0.
078
0.24
1 0.
105
0.09
5 0.
092
0.16
9 0.
095
0.08
6 0.
086
0.19
8 0.
079
0.06
7 0.
069
0.20
0 0.
079
0.07
0 0.
072
0.27
6 0.
102
0.07
9 0.
076
0.22
92 0
.099
5 0.
1092
0.0
995
0.21
5 0.
150
0.13
2 0.
131
0.27
0 0.
069
0.04
0 0.
046
0.29
5 0.
156
0.15
2 0.
134
0.24
5 0.
084
0.08
9 0.
088
0.24
0 0.
098
0.08
8 0.
088
0.25
0 0.
107
0.08
8 0.
090
0.61
0 0.
170
0.16
0 0.
180
0.27
6 0.
111
0.09
7 0.
094
0.21
8 0.
075
0.07
7 0.
094
0.21
0 0.
106
0.10
5 0.
116
0.24
8 0.
089
0.09
4 0.
083
339
340
341
344
1.35
1 0.
781
0.65
7 0.
630
1.19
0 0.
660
0.39
0 0.
330
1.20
0 0.
800
0.73
0 0.
760
0.88
0 0.
518
0.53
7 0.
535
1.44
9 1.
096
0.85
3 0.
907
1.16
0 0.
683
0.63
5 0.
624
1.27
8 0.
799
0.68
2 0.
716
1.06
0 0.
575
0.59
6 0.
673
N
17
17
17
17
5 5
5 5
11
11
11
11
9 9
9 9
18
18
18
18
8 8
8 8
Min
0.0
86 0
.027
0.0
25 0
.026
0.
028
0.00
7 0.
005
0.00
6 0.
118
0.05
2 0.
042
0.04
4 0.
035
0.01
4 0.
016
0.01
3 0.
169
0.06
9 0.
040
0.04
6 0.
880
0.51
8 0.
390
0.33
0 M
edia
n 0.
108
0.03
6 0.
039
0.04
0 0.
031
0.01
4 0.
015
0.01
5 0.
162
0.06
8 0.
062
0.06
1 0.
065
0.02
1 0.
024
0.02
4 0.
241
0.09
9 0.
089
0.08
9 1.
195
0.73
2 0.
646
0.65
2 M
ax 0
.670
0.2
80 0
.290
0.3
10
0.12
0 0.
060
0.07
0 0.
070
0.18
5 0.
092
0.08
6 0.
094
0.08
0 0.
032
0.03
2 0.
031
0.61
0 0.
170
0.16
0 0.
180
1.44
9 1.
096
0.85
3 0.
907
SD 0
.007
0.0
04 0
.003
0.0
04
0.00
5 0.
001
0.00
1 0.
003
0.02
6 0.
015
0.01
5 0.
012
0.02
1 0.
004
0.00
7 0.
005
0.03
7 0.
016
0.01
9 0.
014
0.12
0 0.
119
0.08
3 0.
093
CV
6 12
8
9 17
5
5 20
16
22
25
20
32
21
28
22
15
16
21
16
10
16
13
14
Npa
st
19
0 0
0 4
0 0
0 13
0
0 0
11
0 0
0 19
0
0 0
6 0
0 0
Med
ianp
ast
0.10
7 0.
039
0.14
7 0.
062
0.21
3 1.
133
SDpa
st
0.02
3 0.
009
0.03
4 0.
016
0.05
0 0.
107
NIS
T 0.
232
0.10
2 0.
079
0.07
9 0.
083
0.03
9 0.
025
0.02
5 0.
165
0.08
3 0.
054
0.05
4 0.
067
0.01
9 0.
025
0.02
5 N
NIS
T 3
10
14
14
3 10
14
14
3
10
14
14
3 10
14
14
Sr
ep
0.00
4 0.
003
0.00
3 0.
003
0.00
6 0.
004
0.00
4 0.
004
0.00
2 0.
002
0.00
4 0.
004
0.00
7 0.
005
0.00
5 0.
005
Shet
0.
004
0.00
3 0.
002
0.00
2 0.
004
0.00
4 0.
004
0.00
4 0.
004
0.00
1 0.
002
0.00
2 0.
008
0.00
5 0.
004
0.00
4 SN
IST
0.00
6 0.
004
0.00
4 0.
004
0.00
7 0.
006
0.00
5 0.
005
0.00
5 0.
002
0.00
4 0.
004
0.01
0 0.
006
0.00
7 0.
007
NAV
0.0
96 0
.038
0.0
35 0
.035
0.
031
0.01
4 0.
015
0.01
5 0.
163
0.07
6 0.
059
0.05
9 0.
066
0.02
0 0.
024
0.02
4 0.
236
0.10
1 0.
086
0.08
6 1.
195
0.73
2 0.
646
0.64
6 N
AU 0
.030
0.0
09 0
.014
0.0
14
0.00
5 0.
001
0.00
3 0.
003
0.02
9 0.
018
0.01
5 0.
015
0.02
1 0.
006
0.00
7 0.
007
0.05
1 0.
021
0.02
0 0.
020
0.12
0 0.
119
0.09
3 0.
093
All L
ab R
epor
t Pa
ge 3
/ 6
Rou
nd R
obin
LXI
II La
bora
tory
Res
ults
Ubiquinol, μg/mL
Ubiquinone, μg/mL
Phyll
oqui
none
(K1)
, ng/
mL
25-hydroxyvitamin D, μg/mL
C5
Lab
339
340
341
344
339
340
341
344
339
340
341
344
339
340
341
344
FSV-
BA
0.01
1 0.
024
0.01
4 0.
013
FSV-
BB
FSV-
BC
FSV-
BD
FSV-
BE
0.62
9 0.
557
0.28
4 0.
244
FSV-
BF
FSV-
BG
FSV-
BH
0.02
3 0.
007
0.01
3 0.
015
FSV-
BI
FSV-
BJ
FSV-
BK
FSV-
BL
FSV-
BM
FSV-
BN
FSV-
BO
FSV-
BP
FSV-
BQ
FSV-
BR
FSV-
BS
FSV-
BT
FSV-
BU
FSV-
BV
FSV-
BW 0
.890
0.2
70
nd
nq
0.31
0 0.
390
0.39
0 0.
330
FSV-
CC
FS
V-C
D
FSV-
CE
FSV-
CF
FSV-
CG
FS
V-C
I 0.
620
0.52
0 0.
220
0.20
0 FS
V-C
W
FSV-
CZ
FSV-
DD
FS
V-D
I 1.
350
0.76
7 0.
210
0.13
0 0.
180
0.21
0 0.
618
0.70
0 0.
280
0.23
0 0.
130
0.19
0 FS
V-D
Q
FSV-
DV
FSV-
EE
FSV-
EZ
N
2 2
1 1
2 2
2 2
3 3
3 3
2 2
2 2
Min
0.8
90 0
.270
0.
180
0.21
0 0.
390
0.33
0 0.
280
0.23
0 0.
130
0.19
0 0.
011
0.00
7 0.
013
0.01
3 M
edia
n 1.
120
0.51
9 0.
210
0.13
0 0.
245
0.30
0 0.
504
0.51
5 0.
620
0.52
0 0.
220
0.20
0 0.
017
0.01
5 0.
013
0.01
4 M
ax 1
.350
0.7
67
0.31
0 0.
390
0.61
8 0.
700
0.62
9 0.
557
0.28
4 0.
244
0.02
3 0.
024
0.01
4 0.
015
SD
CV
Npa
st
0 0
0 0
0 0
0 0
0 0
0 0
9 0
0 0
Med
ianp
ast
0.00
8 SD
past
0.
001
NIS
T
NN
IST
Srep
Shet
SNIS
T
NAV
0.
620
0.52
0 0.
220
0.22
0
NAU
All L
ab R
epor
t Pa
ge 4
/ 6
Round Robin LXIII Laboratory Results
Term N
MinMedian
MaxSDCV
Npast
Medianpast
SDpast
NIST NNIST
Srep Shet
SNIST
NAVNAU
-ndnq≤x
italics
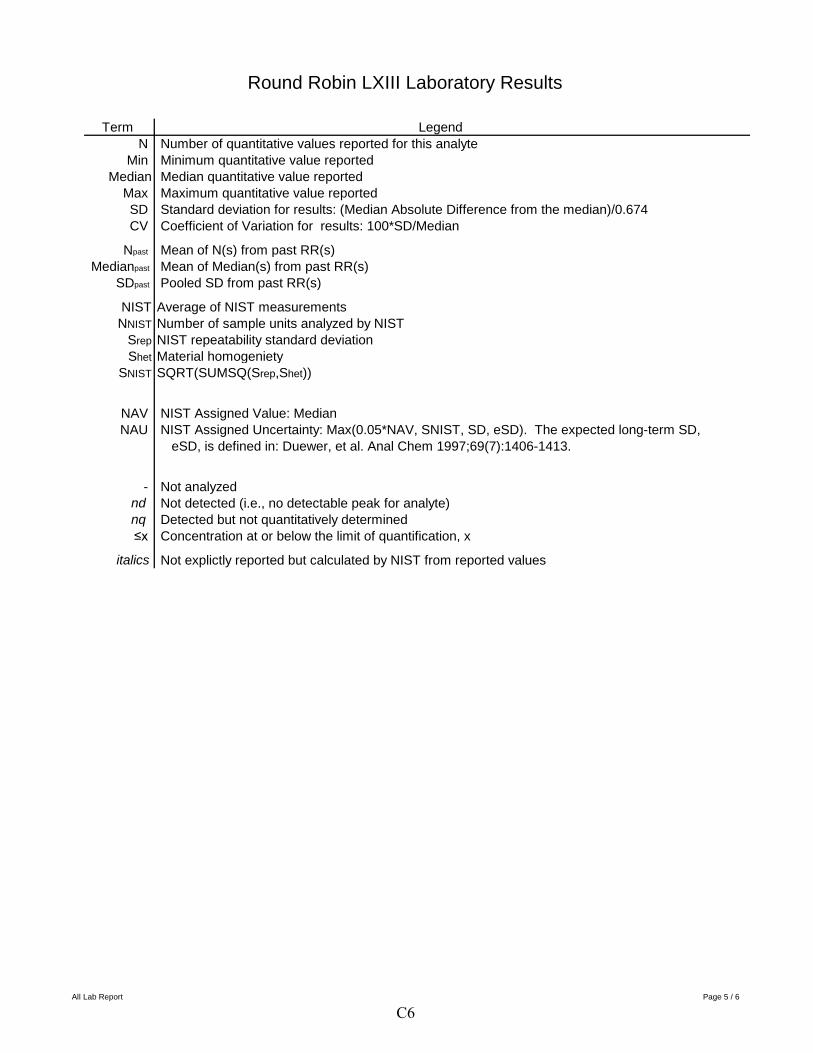
Legend Number of quantitative values reported for this analyte Minimum quantitative value reported Median quantitative value reported Maximum quantitative value reported Standard deviation for results: (Median Absolute Difference from the median)/0.674 Coefficient of Variation for results: 100*SD/Median
Mean of N(s) from past RR(s) Mean of Median(s) from past RR(s) Pooled SD from past RR(s)
Average of NIST measurements Number of sample units analyzed by NIST NIST repeatability standard deviation Material homogeniety SQRT(SUMSQ(Srep,Shet))
NIST Assigned Value: Median NIST Assigned Uncertainty: Max(0.05*NAV, SNIST, SD, eSD). The expected long-term SD, eSD, is defined in: Duewer, et al. Anal Chem 1997;69(7):1406-1413.
Not analyzed Not detected (i.e., no detectable peak for analyte) Detected but not quantitatively determined Concentration at or below the limit of quantification, x
Not explictly reported but calculated by NIST from reported values
All Lab Report Page 5 / 6
C6
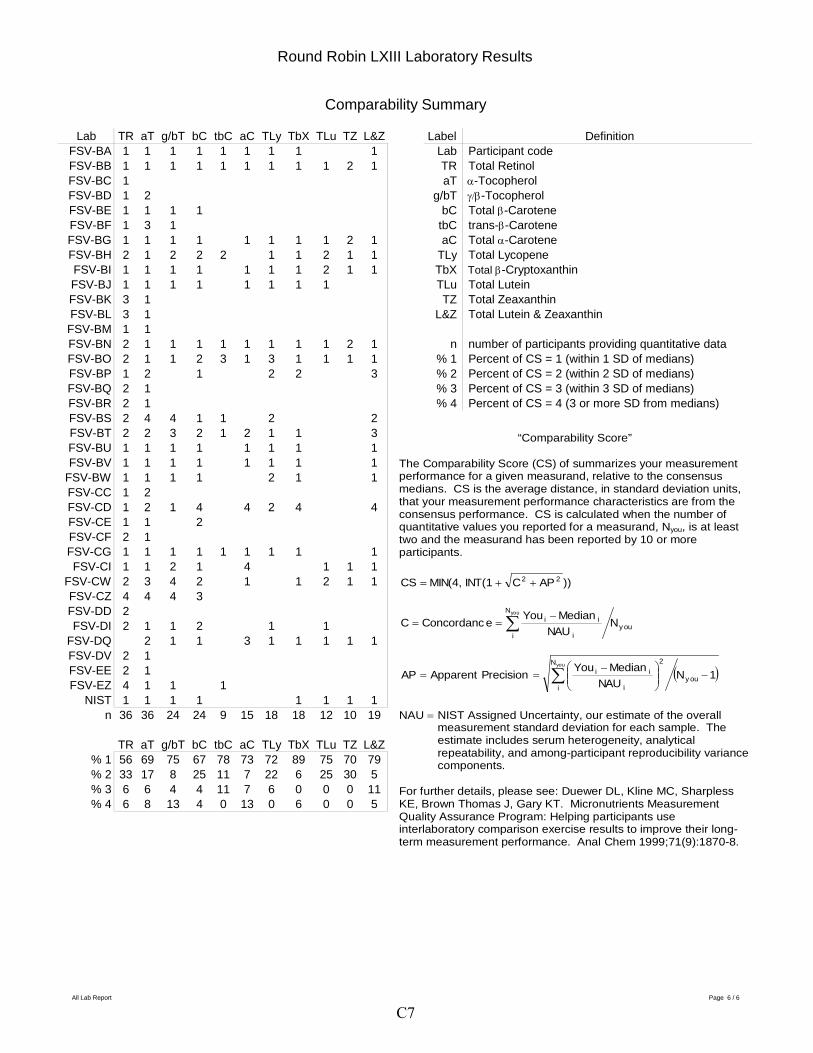
Round Robin LXIII Laboratory Results
Comparability Summary
Lab FSV-BA FSV-BB FSV-BC FSV-BD FSV-BE FSV-BF FSV-BG FSV-BH FSV-BI FSV-BJ FSV-BK FSV-BL FSV-BM FSV-BN FSV-BO FSV-BP FSV-BQ FSV-BR FSV-BS FSV-BT FSV-BU FSV-BV
FSV-BW FSV-CC FSV-CD FSV-CE FSV-CF FSV-CG FSV-CI
FSV-CW FSV-CZ FSV-DD FSV-DI
FSV-DQ FSV-DV FSV-EE FSV-EZ
NIST n
% 1 % 2 % 3 % 4
TR aT g/bT bC tbC aC TLy TbX TLu TZ L&Z 1 1 1 1 1 1 1 1 1 1 1 1 1 1 1 1 1 1 2 1 1 1 2 1 1 1 1 1 3 1 1 1 1 1 1 1 1 1 2 1 2 1 2 2 2 1 1 2 1 1 1 1 1 1 1 1 1 2 1 1 1 1 1 1 1 1 1 1 3 1 3 1 1 1 2 1 1 1 1 1 1 1 1 2 1 2 1 1 2 3 1 3 1 1 1 1 1 2 1 2 2 3 2 1 2 1 2 4 4 1 1 2 2 2 2 3 2 1 2 1 1 3 1 1 1 1 1 1 1 1 1 1 1 1 1 1 1 1 1 1 1 1 2 1 1 1 2 1 2 1 4 4 2 4 4 1 1 2 2 1 1 1 1 1 1 1 1 1 1 1 1 2 1 4 1 1 1 2 3 4 2 1 1 2 1 1 4 4 4 3 2 2 1 1 2 1 1
2 1 1 3 1 1 1 1 1 2 1 2 1 4 1 1 1 1 1 1 1 1 1 1 1
36 36 24 24 9 15 18 18 12 10 19
TR aT g/bT bC tbC aC TLy TbX TLu TZ L&Z 56 69 75 67 78 73 72 89 75 70 79 33 17 8 25 11 7 22 6 25 30 5 6 6 4 4 11 7 6 0 0 0 11 6 8 13 4 0 13 0 6 0 0 5
LabelLab TR aT
g/bTbC
tbC aC
TLy TbX TLu TZ
L&Z
n % 1 % 2 % 3 % 4
Definition Participant code Total Retinol α-Tocopherol γ/β-Tocopherol Total β-Carotene trans-β-Carotene Total α-Carotene Total Lycopene Total β-Cryptoxanthin Total Lutein Total Zeaxanthin Total Lutein & Zeaxanthin
number of participants providing quantitative data Percent of CS = 1 (within 1 SD of medians) Percent of CS = 2 (within 2 SD of medians) Percent of CS = 3 (within 3 SD of medians) Percent of CS = 4 (3 or more SD from medians)
“Comparability Score”
The Comparability Score (CS) of summarizes your measurement performance for a given measurand, relative to the consensus medians. CS is the average distance, in standard deviation units, that your measurement performance characteristics are from the consensus performance. CS is calculated when the number of quantitative values you reported for a measurand, Nyou, is at least two and the measurand has been reported by 10 or more participants.
CS = MIN(4, INT(1 + C2 + AP 2 ))
∑yo uN You − Median C = Concordanc e = i i Ny ou i NAU i
yo u N You i − Median i 2
AP = Apparent Precision = ∑ (Ny ou − 1) NAU i i
NAU = NIST Assigned Uncertainty, our estimate of the overallmeasurement standard deviation for each sample. The estimate includes serum heterogeneity, analytical repeatability, and among-participant reproducibility variance components.
For further details, please see: Duewer DL, Kline MC, Sharpless KE, Brown Thomas J, Gary KT. Micronutrients Measurement Quality Assurance Program: Helping participants use interlaboratory comparison exercise results to improve their long-term measurement performance. Anal Chem 1999;71(9):1870-8.
All Lab Report Page 6 / 6
C7
Appendix D. Representative “Individualized Report” for RR63
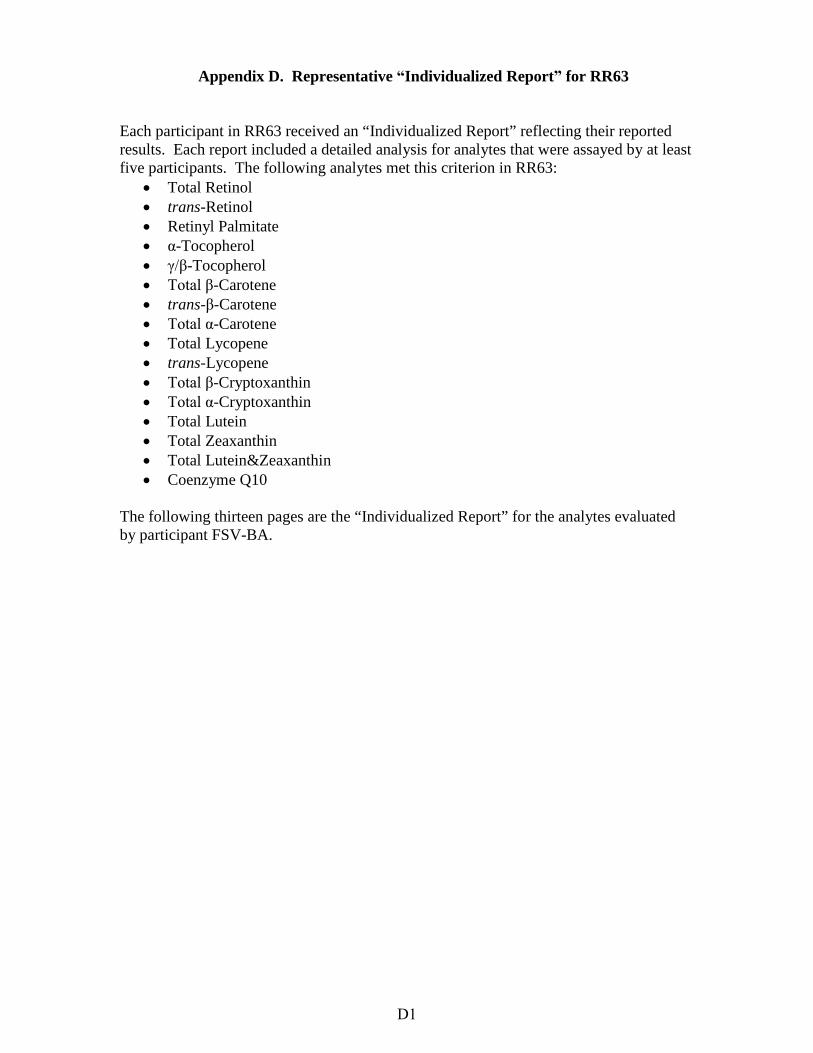
Each participant in RR63 received an “Individualized Report” reflecting their reported results. Each report included a detailed analysis for analytes that were assayed by at least five participants. The following analytes met this criterion in RR63:
• Total Retinol • trans-Retinol • Retinyl Palmitate • α-Tocopherol • γ/β-Tocopherol • Total β-Carotene • trans-β-Carotene • Total α-Carotene • Total Lycopene • trans-Lycopene • Total β-Cryptoxanthin • Total α-Cryptoxanthin • Total Lutein • Total Zeaxanthin • Total Lutein&Zeaxanthin • Coenzyme Q10
The following thirteen pages are the “Individualized Report” for the analytes evaluated by participant FSV-BA.
D1
Set 1 of 38
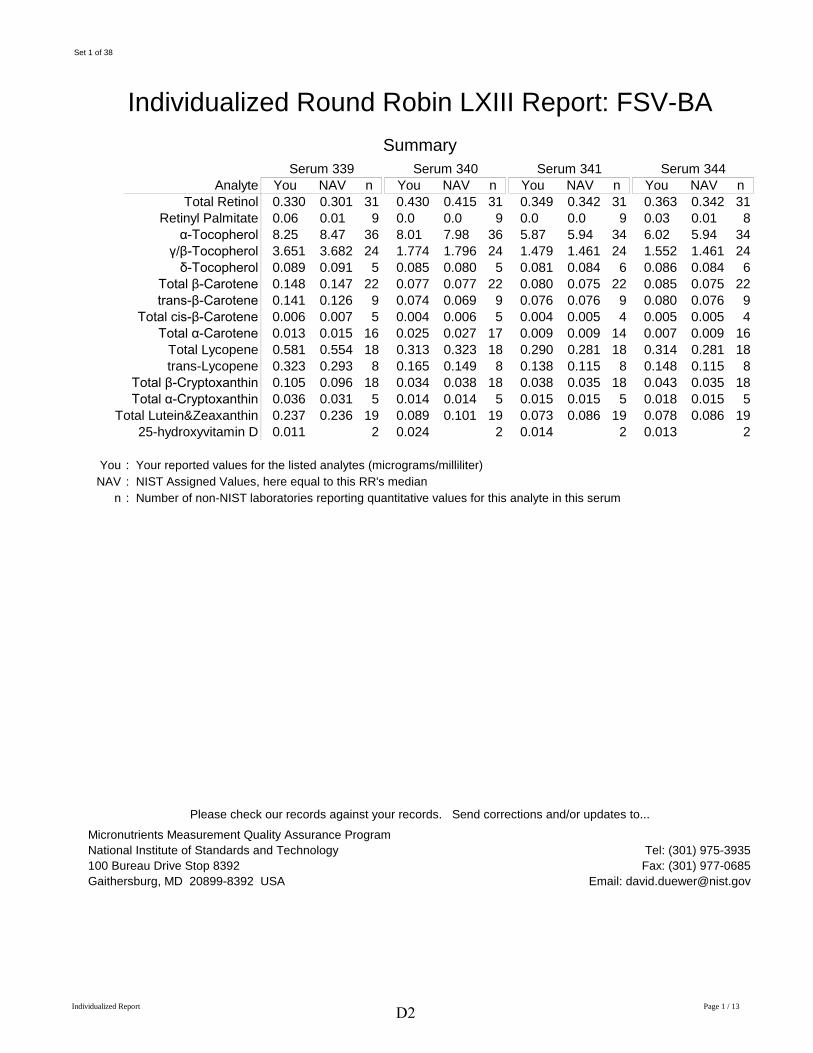
Individualized Round Robin LXIII Report: FSV-BA Summary
Serum 339 Serum 340 Serum 341 Serum 344 Analyte You NAV n You NAV n You NAV n You NAV n
Total Retinol 0.330 0.301 31 0.430 0.415 31 0.349 0.342 31 0.363 0.342 31 Retinyl Palmitate 0.06 0.01 9 0.0 0.0 9 0.0 0.0 9 0.03 0.01 8
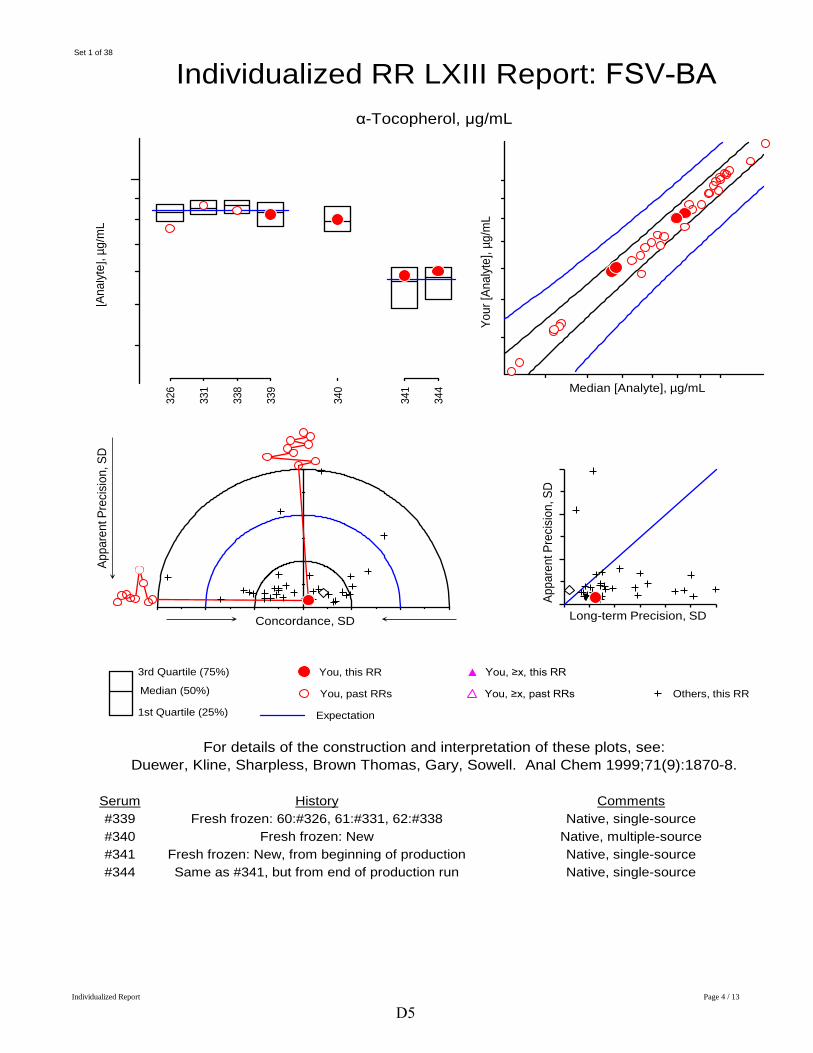
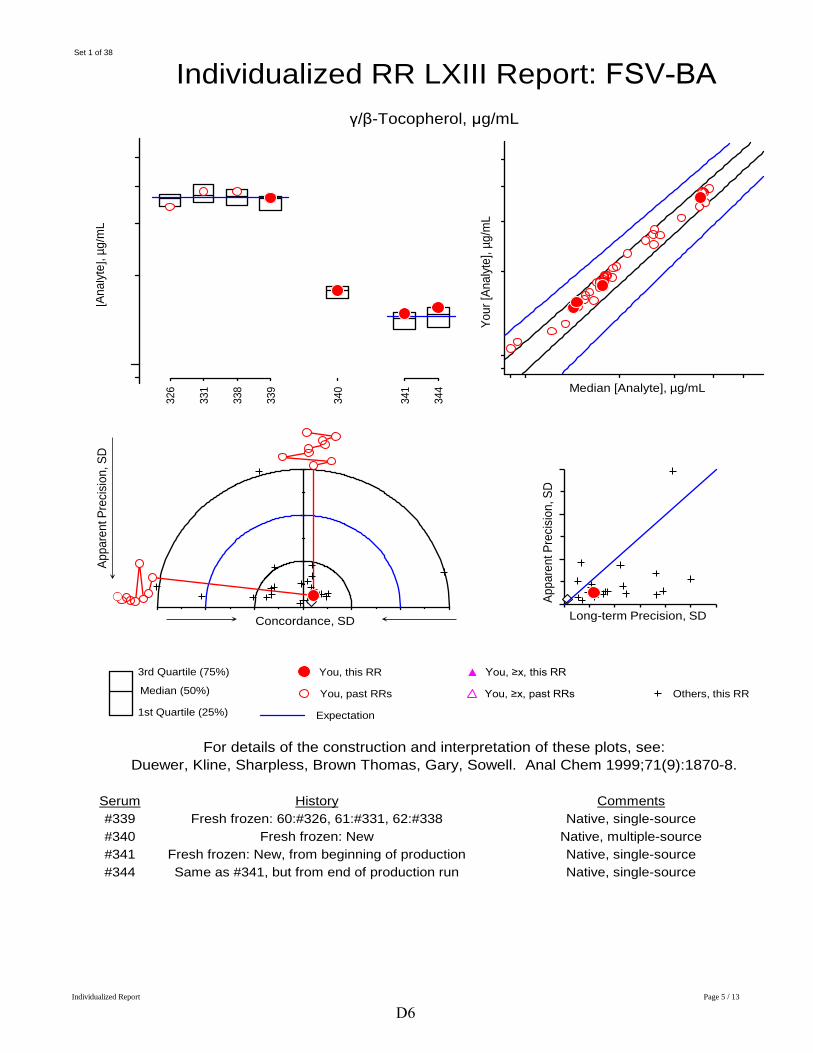
α-Tocopherol 8.25 8.47 36 8.01 7.98 36 5.87 5.94 34 6.02 5.94 34 γ/β-Tocopherol 3.651 3.682 24 1.774 1.796 24 1.479 1.461 24 1.552 1.461 24 δ-Tocopherol 0.089 0.091 5 0.085 0.080 5 0.081 0.084 6 0.086 0.084 6
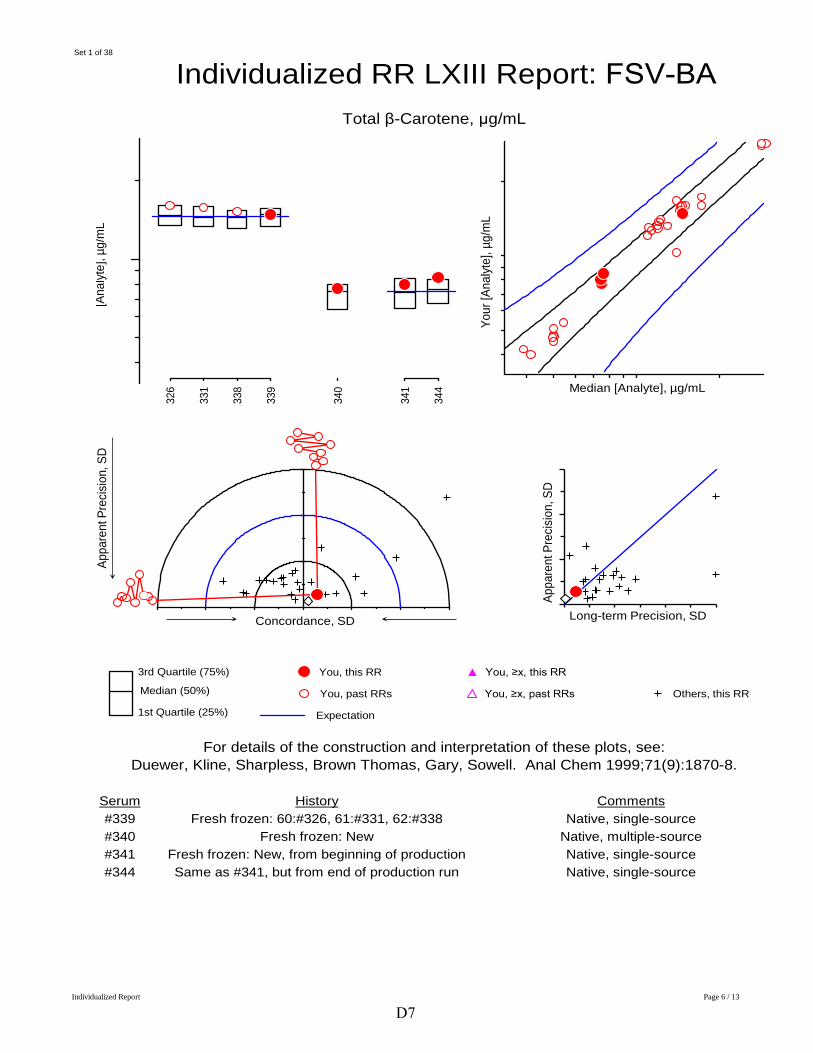
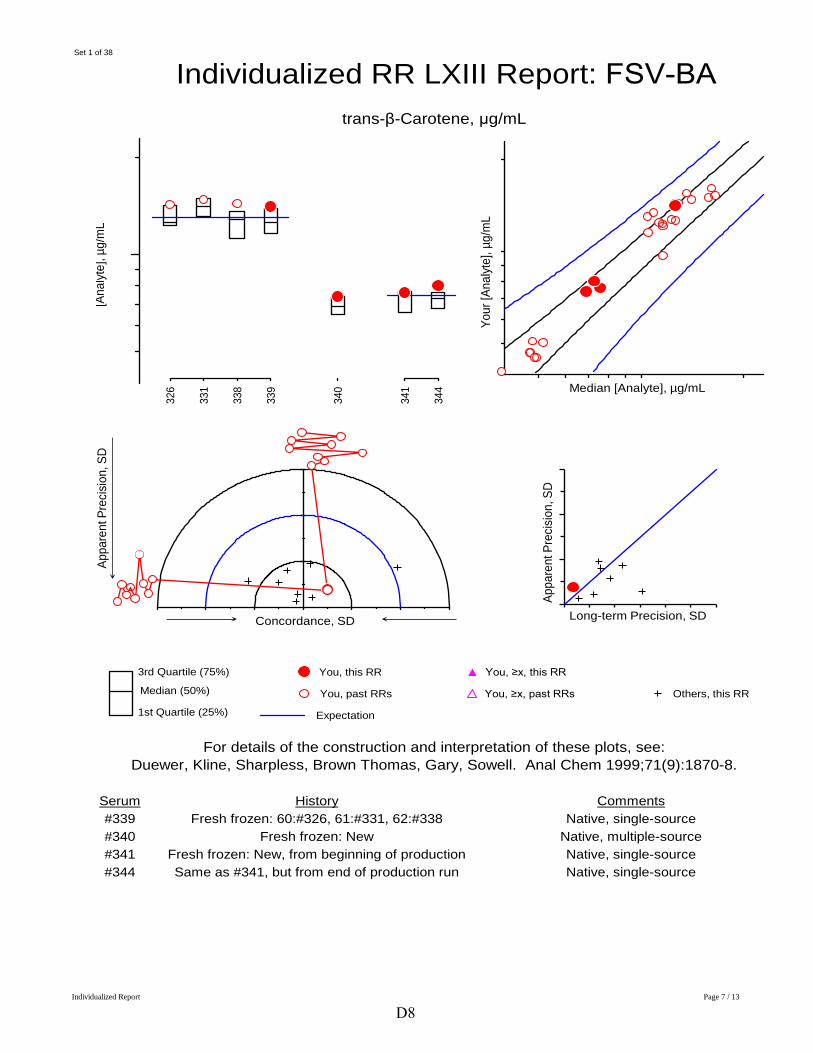
Total β-Carotene 0.148 0.147 22 0.077 0.077 22 0.080 0.075 22 0.085 0.075 22 trans-β-Carotene 0.141 0.126 9 0.074 0.069 9 0.076 0.076 9 0.080 0.076 9
Total cis-β-Carotene 0.006 0.007 5 0.004 0.006 5 0.004 0.005 4 0.005 0.005 4 Total α-Carotene 0.013 0.015 16 0.025 0.027 17 0.009 0.009 14 0.007 0.009 16
Total Lycopene 0.581 0.554 18 0.313 0.323 18 0.290 0.281 18 0.314 0.281 18 trans-Lycopene 0.323 0.293 8 0.165 0.149 8 0.138 0.115 8 0.148 0.115 8
Total β-Cryptoxanthin 0.105 0.096 18 0.034 0.038 18 0.038 0.035 18 0.043 0.035 18 Total α-Cryptoxanthin 0.036 0.031 5 0.014 0.014 5 0.015 0.015 5 0.018 0.015 5
Total Lutein&Zeaxanthin 0.237 0.236 19 0.089 0.101 19 0.073 0.086 19 0.078 0.086 19 25-hydroxyvitamin D 0.011 2 0.024 2 0.014 2 0.013 2
You : Your reported values for the listed analytes (micrograms/milliliter) NAV : NIST Assigned Values, here equal to this RR's median
n : Number of non-NIST laboratories reporting quantitative values for this analyte in this serum
Please check our records against your records. Send corrections and/or updates to...
Micronutrients Measurement Quality Assurance Program National Institute of Standards and Technology Tel: (301) 975-3935 100 Bureau Drive Stop 8392 Fax: (301) 977-0685 Gaithersburg, MD 20899-8392 USA Email: [email protected]
Individualized Report Page 1 / 13 D2
NIST, this RR
Set 1 of 38
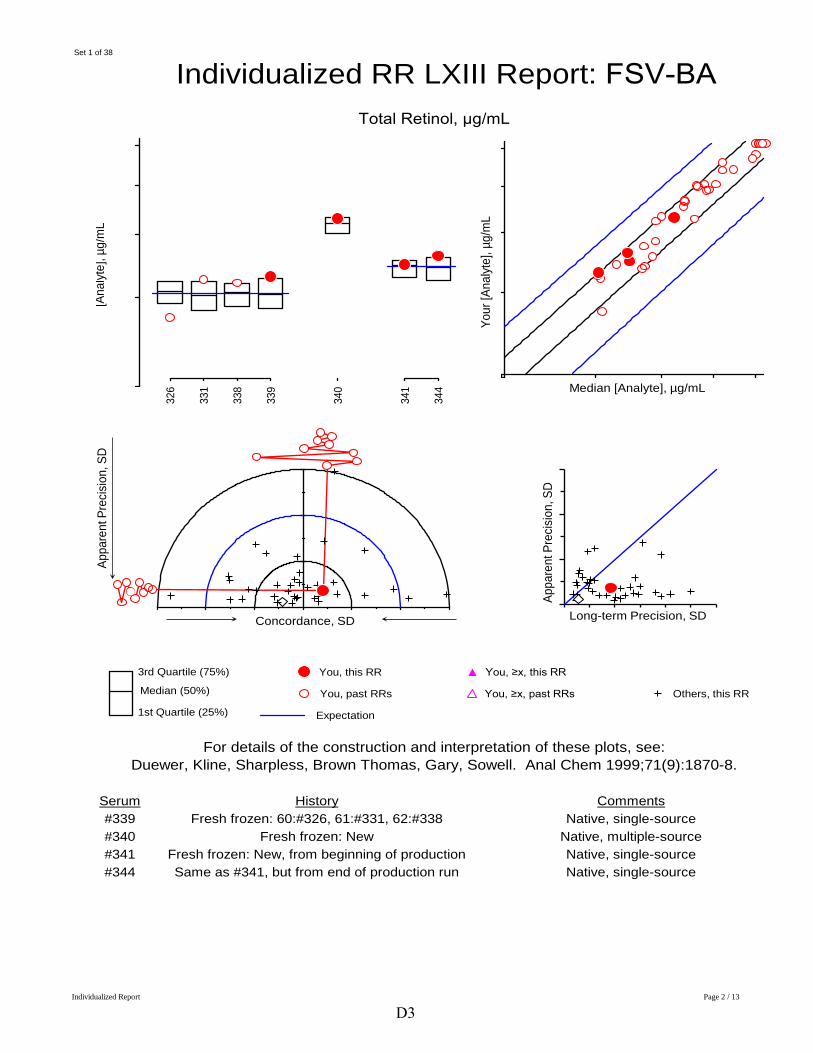
Individualized RR LXIII Report: FSV-BA
Total Retinol, μg/mL Ap
pare
nt P
recis
ion,
SD
[Ana
lyte]
, µg/
mL
326
331
338
339
340
341
344
Your
[Ana
lyte]
, µg/
mL
Median [Analyte], µg/mL
Appa
rent
Pre
cisio
n, S
D
Long-term Precision, SD
Median (50%) You, past RRs You, ≥x, past RRs Others, this RR
1st Quartile (25%) Expectation
For details of the construction and interpretation of these plots, see: Duewer, Kline, Sharpless, Brown Thomas, Gary, Sowell. Anal Chem 1999;71(9):1870-8.
Serum History Comments #339 Fresh frozen: 60:#326, 61:#331, 62:#338 Native, single-source #340 Fresh frozen: New Native, multiple-source #341 Fresh frozen: New, from beginning of production Native, single-source #344 Same as #341, but from end of production run Native, single-source
Concordance, SD
3rd Quartile (75%) You, this RR You, ≥x, this RR
Individualized Report Page 2 / 13
D3
NIST, this RR
Set 1 of 38
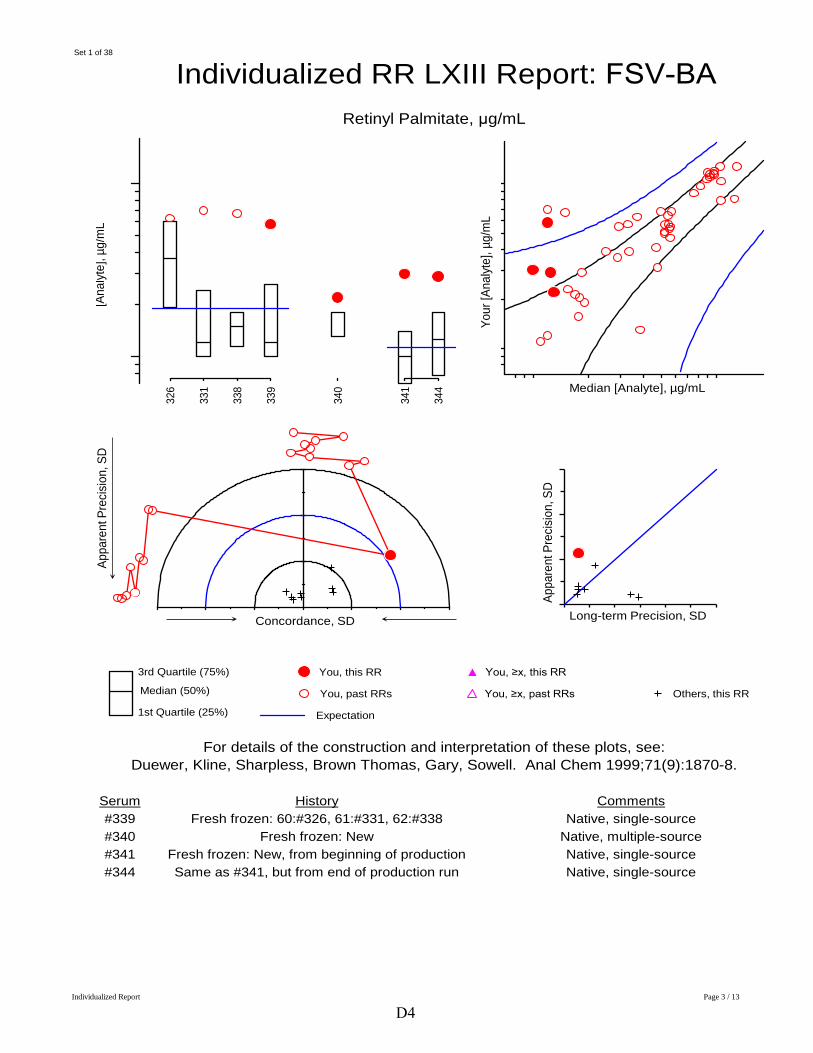
Individualized RR LXIII Report: FSV-BA
Retinyl Palmitate, μg/mL [A
nalyt
e], µ
g/m
L
Your
[Ana
lyte]
, µg/
mL
Median [Analyte], µg/mL
Appa
rent
Pre
cisio
n, S
D
326
331
338
339
340
341
344
Appa
rent
Pre
cisio
n, S
D
Long-term Precision, SD
Median (50%) You, past RRs You, ≥x, past RRs Others, this RR
1st Quartile (25%) Expectation
For details of the construction and interpretation of these plots, see: Duewer, Kline, Sharpless, Brown Thomas, Gary, Sowell. Anal Chem 1999;71(9):1870-8.
Serum History Comments #339 Fresh frozen: 60:#326, 61:#331, 62:#338 Native, single-source #340 Fresh frozen: New Native, multiple-source #341 Fresh frozen: New, from beginning of production Native, single-source #344 Same as #341, but from end of production run Native, single-source
Concordance, SD
3rd Quartile (75%) You, this RR You, ≥x, this RR
Individualized Report Page 3 / 13
D4
NIST, this RR
Set 1 of 38
Individualized RR LXIII Report: FSV-BA
α-Tocopherol, μg/mL [A
nalyt
e], µ
g/m
L
Your
[Ana
lyte]
, µg/
mL
Median [Analyte], µg/mL
Appa
rent
Pre
cisio
n, S
D
326
331
338
339
340
341
344
Appa
rent
Pre
cisio
n, S
D
Long-term Precision, SD
Median (50%) You, past RRs You, ≥x, past RRs Others, this RR
1st Quartile (25%) Expectation
For details of the construction and interpretation of these plots, see: Duewer, Kline, Sharpless, Brown Thomas, Gary, Sowell. Anal Chem 1999;71(9):1870-8.
Serum History Comments #339 Fresh frozen: 60:#326, 61:#331, 62:#338 Native, single-source #340 Fresh frozen: New Native, multiple-source #341 Fresh frozen: New, from beginning of production Native, single-source #344 Same as #341, but from end of production run Native, single-source
Concordance, SD
3rd Quartile (75%) You, this RR You, ≥x, this RR
Individualized Report Page 4 / 13
D5
NIST, this RR
Set 1 of 38
Individualized RR LXIII Report: FSV-BA
γ/β-Tocopherol, μg/mL [A
nalyt
e], µ
g/m
L
Your
[Ana
lyte]
, µg/
mL
Median [Analyte], µg/mL
Appa
rent
Pre
cisio
n, S
D
326
331
338
339
340
341
344
Appa
rent
Pre
cisio
n, S
D
Long-term Precision, SD
Median (50%) You, past RRs You, ≥x, past RRs Others, this RR
1st Quartile (25%) Expectation
For details of the construction and interpretation of these plots, see: Duewer, Kline, Sharpless, Brown Thomas, Gary, Sowell. Anal Chem 1999;71(9):1870-8.
Serum History Comments #339 Fresh frozen: 60:#326, 61:#331, 62:#338 Native, single-source #340 Fresh frozen: New Native, multiple-source #341 Fresh frozen: New, from beginning of production Native, single-source #344 Same as #341, but from end of production run Native, single-source
Concordance, SD
3rd Quartile (75%) You, this RR You, ≥x, this RR
Individualized Report Page 5 / 13
D6
NIST, this RR
Set 1 of 38
Individualized RR LXIII Report: FSV-BA
Total β-Carotene, μg/mL [A
nalyt
e], µ
g/m
L
Your
[Ana
lyte]
, µg/
mL
Median [Analyte], µg/mL
Appa
rent
Pre
cisio
n, S
D
326
331
338
339
340
341
344
Appa
rent
Pre
cisio
n, S
D
Long-term Precision, SD
Median (50%) You, past RRs You, ≥x, past RRs Others, this RR
1st Quartile (25%) Expectation
For details of the construction and interpretation of these plots, see: Duewer, Kline, Sharpless, Brown Thomas, Gary, Sowell. Anal Chem 1999;71(9):1870-8.
Serum History Comments #339 Fresh frozen: 60:#326, 61:#331, 62:#338 Native, single-source #340 Fresh frozen: New Native, multiple-source #341 Fresh frozen: New, from beginning of production Native, single-source #344 Same as #341, but from end of production run Native, single-source
Concordance, SD
3rd Quartile (75%) You, this RR You, ≥x, this RR
Individualized Report Page 6 / 13
D7
NIST, this RR
Set 1 of 38
Individualized RR LXIII Report: FSV-BA
trans-β-Carotene, μg/mL [A
nalyt
e], µ
g/m
L
Your
[Ana
lyte]
, µg/
mL
Median [Analyte], µg/mL
Appa
rent
Pre
cisio
n, S
D
326
331
338
339
340
341
344
Appa
rent
Pre
cisio
n, S
D
Long-term Precision, SD
Median (50%) You, past RRs You, ≥x, past RRs Others, this RR
1st Quartile (25%) Expectation
For details of the construction and interpretation of these plots, see: Duewer, Kline, Sharpless, Brown Thomas, Gary, Sowell. Anal Chem 1999;71(9):1870-8.
Serum History Comments #339 Fresh frozen: 60:#326, 61:#331, 62:#338 Native, single-source #340 Fresh frozen: New Native, multiple-source #341 Fresh frozen: New, from beginning of production Native, single-source #344 Same as #341, but from end of production run Native, single-source
Concordance, SD
3rd Quartile (75%) You, this RR You, ≥x, this RR
Individualized Report Page 7 / 13
D8
NIST, this RR
Set 1 of 38
Individualized RR LXIII Report: FSV-BA
Total α-Carotene, μg/mL [A
nalyt
e], µ
g/m
L
Your
[Ana
lyte]
, µg/
mL
Median [Analyte], µg/mL
Appa
rent
Pre
cisio
n, S
D
326
331
338
339
340
341
344
Appa
rent
Pre
cisio
n, S
D
Long-term Precision, SD
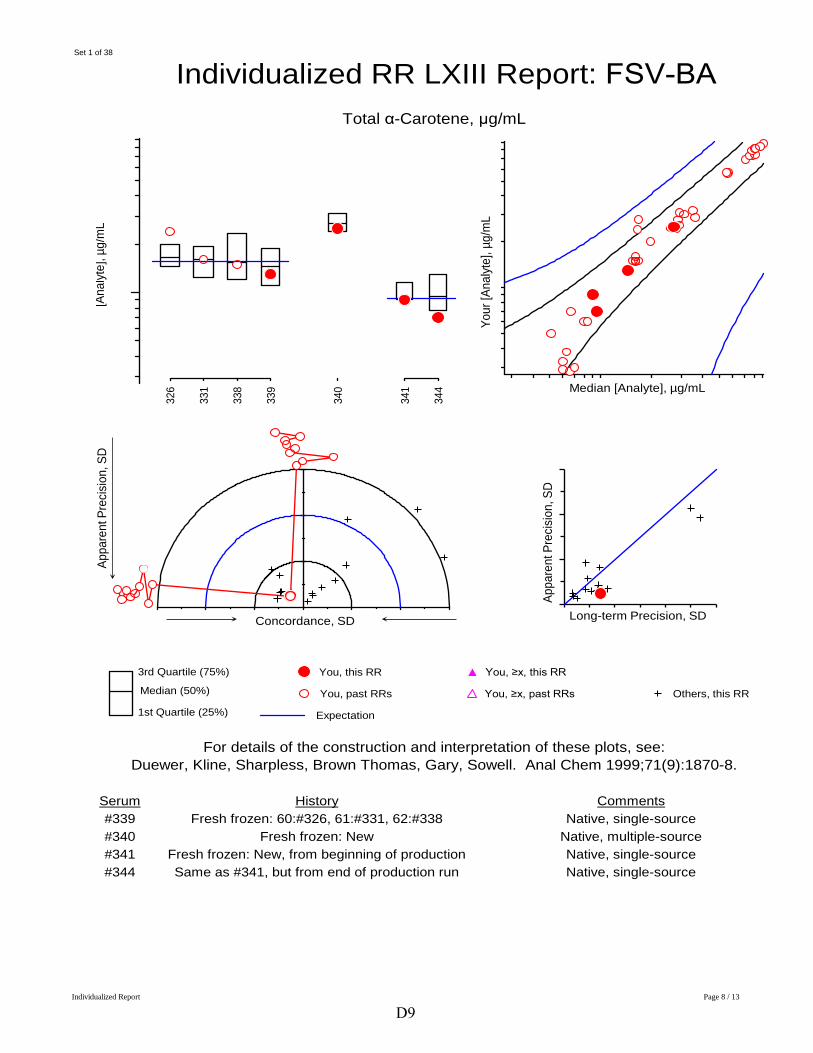
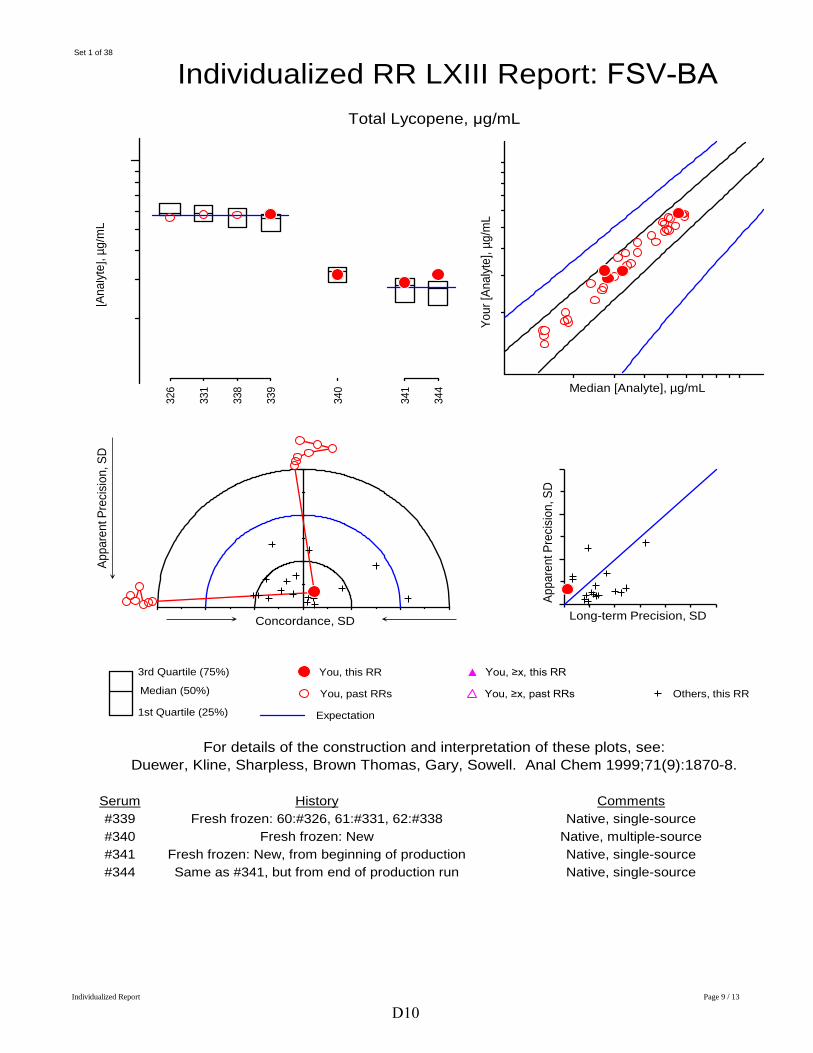
Median (50%) You, past RRs You, ≥x, past RRs Others, this RR
1st Quartile (25%) Expectation
For details of the construction and interpretation of these plots, see: Duewer, Kline, Sharpless, Brown Thomas, Gary, Sowell. Anal Chem 1999;71(9):1870-8.
Serum History Comments #339 Fresh frozen: 60:#326, 61:#331, 62:#338 Native, single-source #340 Fresh frozen: New Native, multiple-source #341 Fresh frozen: New, from beginning of production Native, single-source #344 Same as #341, but from end of production run Native, single-source
Concordance, SD
3rd Quartile (75%) You, this RR You, ≥x, this RR
Individualized Report Page 8 / 13
D9
NIST, this RR
Set 1 of 38
Individualized RR LXIII Report: FSV-BA
Total Lycopene, μg/mL [A
nalyt
e], µ
g/m
L
Your
[Ana
lyte]
, µg/
mL
Median [Analyte], µg/mL
326
331
338
339
340
341
344
Appa
rent
Pre
cisio
n, S
D
Appa
rent
Pre
cisio
n, S
D
Long-term Precision, SD
Median (50%) You, past RRs You, ≥x, past RRs Others, this RR
1st Quartile (25%) Expectation
For details of the construction and interpretation of these plots, see: Duewer, Kline, Sharpless, Brown Thomas, Gary, Sowell. Anal Chem 1999;71(9):1870-8.
Serum History Comments #339 Fresh frozen: 60:#326, 61:#331, 62:#338 Native, single-source #340 Fresh frozen: New Native, multiple-source #341 Fresh frozen: New, from beginning of production Native, single-source #344 Same as #341, but from end of production run Native, single-source
Concordance, SD
3rd Quartile (75%) You, this RR You, ≥x, this RR
Individualized Report Page 9 / 13
D10
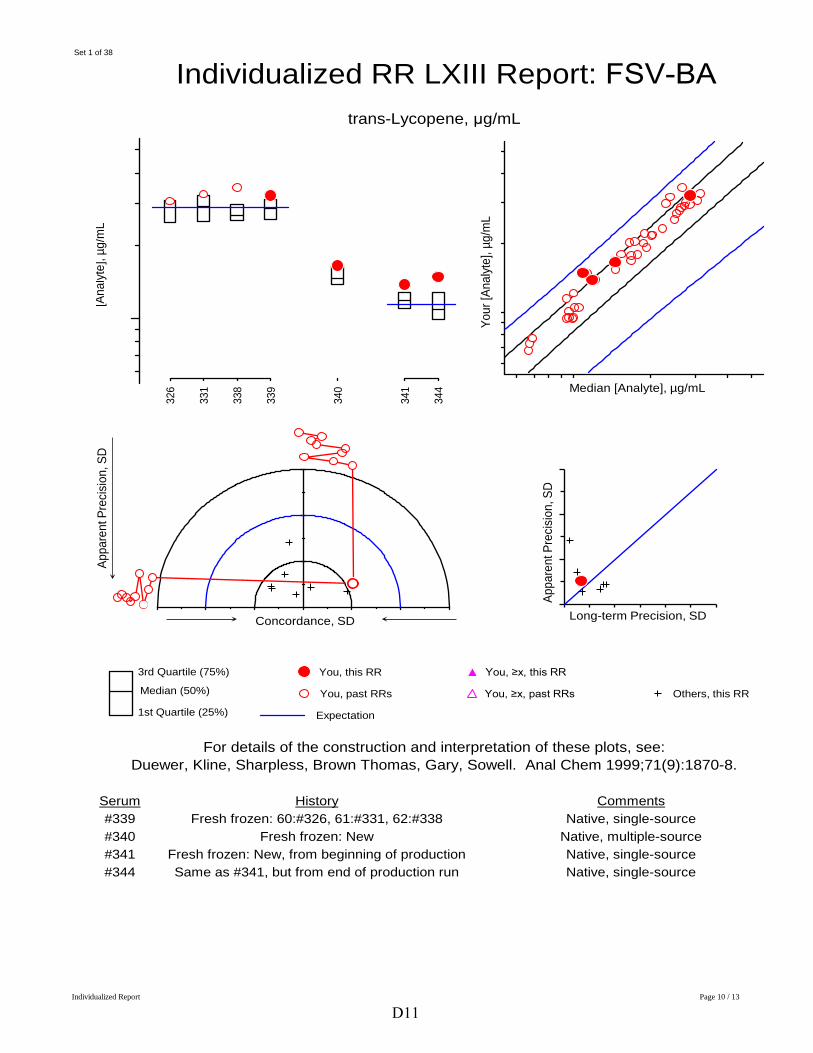
NIST, this RR
Set 1 of 38
Individualized RR LXIII Report: FSV-BA
trans-Lycopene, μg/mL [A
nalyt
e], µ
g/m
L
Your
[Ana
lyte]
, µg/
mL
Median [Analyte], µg/mL
Appa
rent
Pre
cisio
n, S
D
326
331
338
339
340
341
344
Appa
rent
Pre
cisio
n, S
D
Long-term Precision, SD
Median (50%) You, past RRs You, ≥x, past RRs Others, this RR
1st Quartile (25%) Expectation
For details of the construction and interpretation of these plots, see: Duewer, Kline, Sharpless, Brown Thomas, Gary, Sowell. Anal Chem 1999;71(9):1870-8.
Serum History Comments #339 Fresh frozen: 60:#326, 61:#331, 62:#338 Native, single-source #340 Fresh frozen: New Native, multiple-source #341 Fresh frozen: New, from beginning of production Native, single-source #344 Same as #341, but from end of production run Native, single-source
Concordance, SD
3rd Quartile (75%) You, this RR You, ≥x, this RR
Individualized Report Page 10 / 13
D11
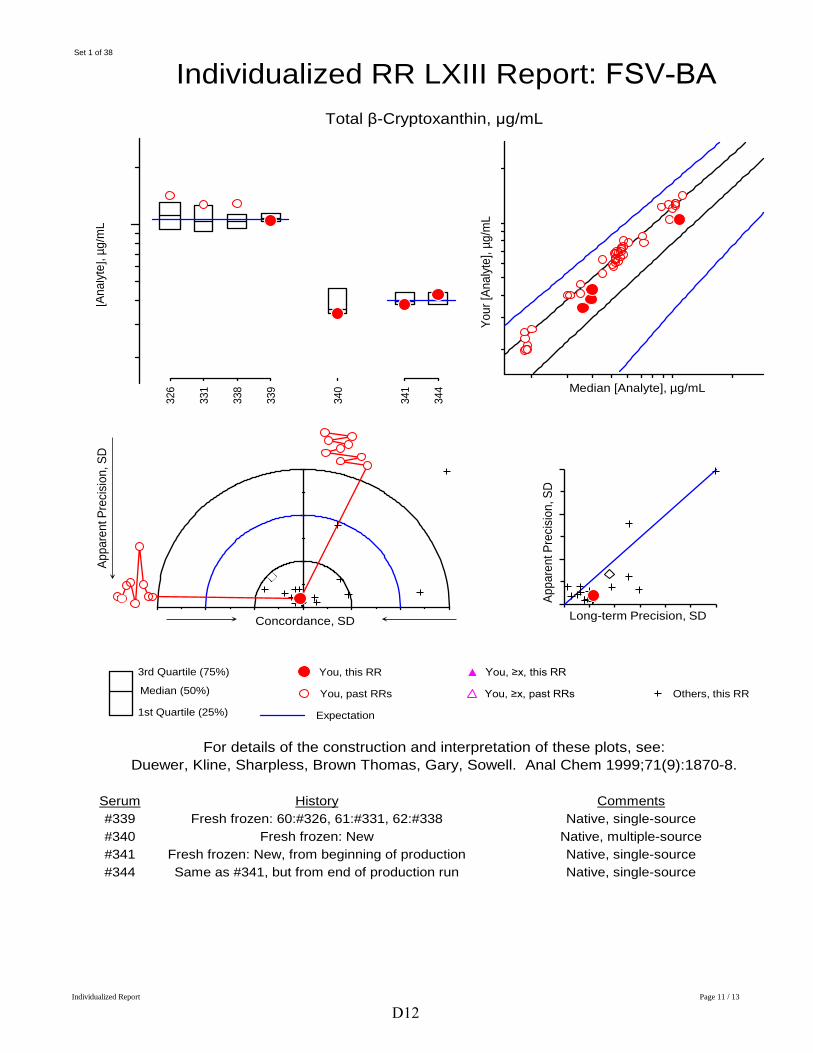
NIST, this RR
Set 1 of 38
Individualized RR LXIII Report: FSV-BA
Total β-Cryptoxanthin, μg/mL [A
nalyt
e], µ
g/m
L
Your
[Ana
lyte]
, µg/
mL
Median [Analyte], µg/mL
Appa
rent
Pre
cisio
n, S
D
326
331
338
339
340
341
344
Appa
rent
Pre
cisio
n, S
D
Long-term Precision, SD
Median (50%) You, past RRs You, ≥x, past RRs Others, this RR
1st Quartile (25%) Expectation
For details of the construction and interpretation of these plots, see: Duewer, Kline, Sharpless, Brown Thomas, Gary, Sowell. Anal Chem 1999;71(9):1870-8.
Serum History Comments #339 Fresh frozen: 60:#326, 61:#331, 62:#338 Native, single-source #340 Fresh frozen: New Native, multiple-source #341 Fresh frozen: New, from beginning of production Native, single-source #344 Same as #341, but from end of production run Native, single-source
Concordance, SD
3rd Quartile (75%) You, this RR You, ≥x, this RR
Individualized Report Page 11 / 13
D12
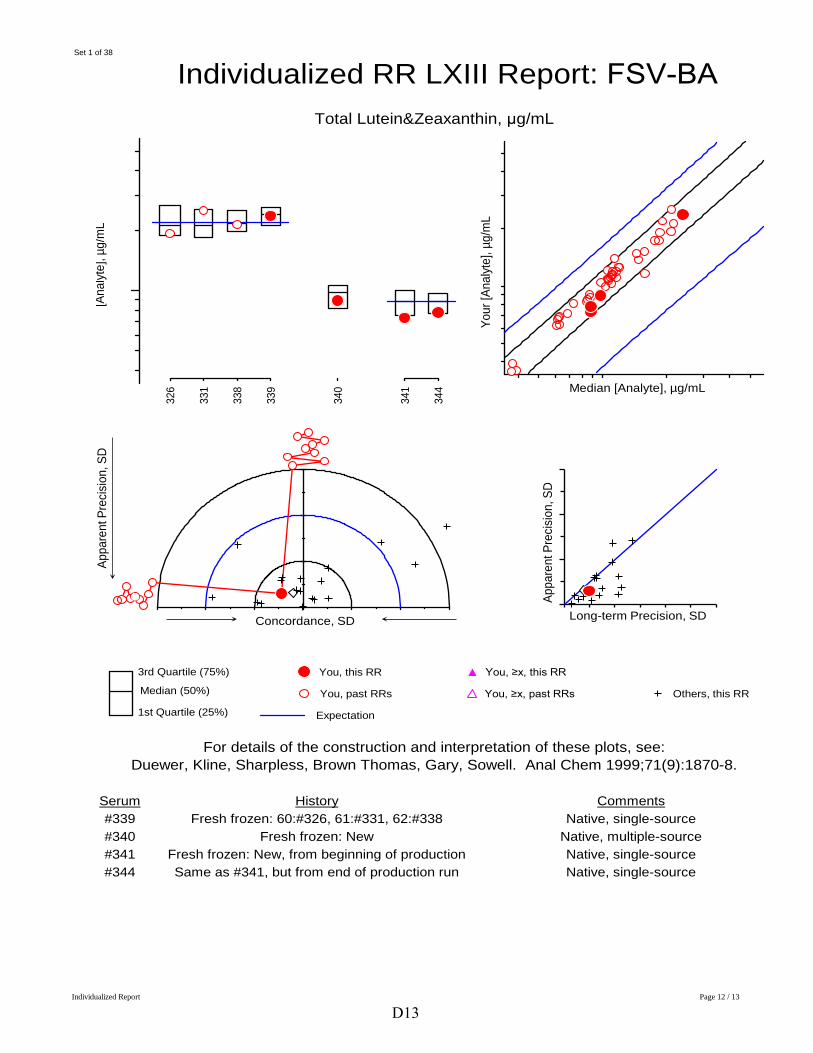
NIST, this RR
Set 1 of 38
Individualized RR LXIII Report: FSV-BA
Total Lutein&Zeaxanthin, μg/mL [A
nalyt
e], µ
g/m
L
Your
[Ana
lyte]
, µg/
mL
Median [Analyte], µg/mL
Appa
rent
Pre
cisio
n, S
D
326
331
338
339
340
341
344
Appa
rent
Pre
cisio
n, S
D
Long-term Precision, SD
Median (50%) You, past RRs You, ≥x, past RRs Others, this RR
1st Quartile (25%) Expectation
For details of the construction and interpretation of these plots, see: Duewer, Kline, Sharpless, Brown Thomas, Gary, Sowell. Anal Chem 1999;71(9):1870-8.
Serum History Comments #339 Fresh frozen: 60:#326, 61:#331, 62:#338 Native, single-source #340 Fresh frozen: New Native, multiple-source #341 Fresh frozen: New, from beginning of production Native, single-source #344 Same as #341, but from end of production run Native, single-source
Concordance, SD
3rd Quartile (75%) You, this RR You, ≥x, this RR
Individualized Report Page 12 / 13
D13
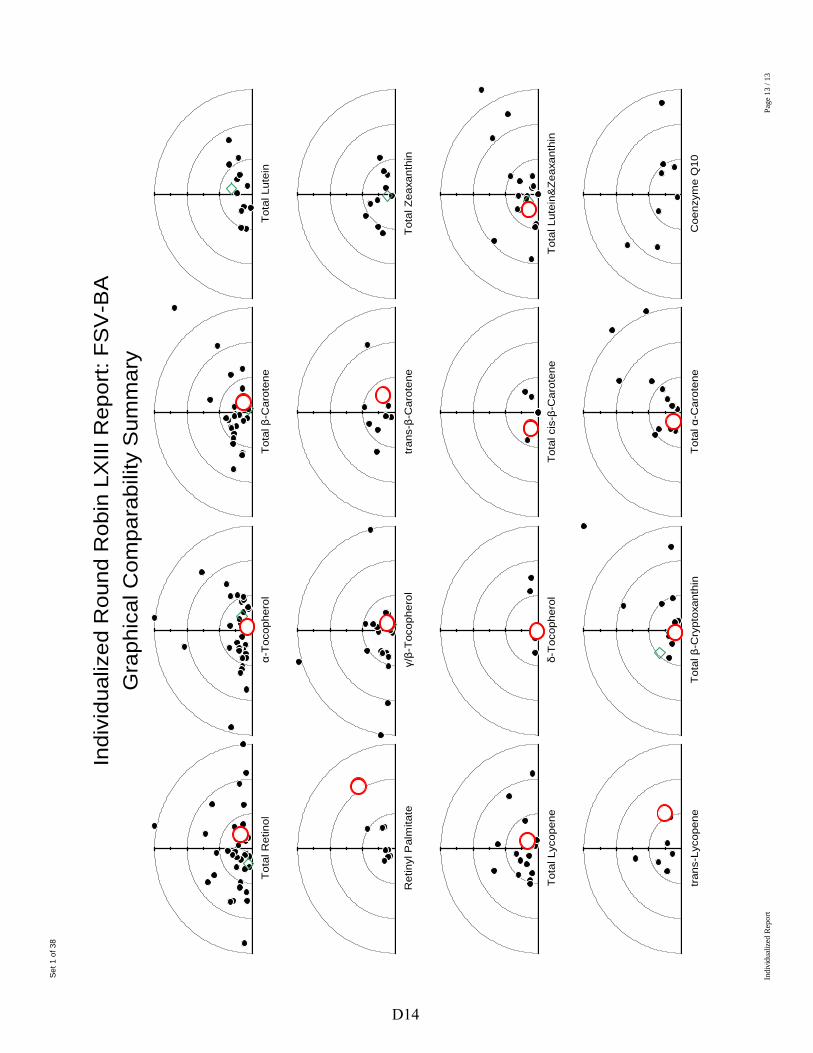
Set
1 o
f 38
Indi
vidu
aliz
ed R
ound
Rob
in L
XIII
Rep
ort:
FSV
-BA
Gra
phic
al C
ompa
rabi
lity
Sum
mar
y
Tota
l Ret
inol
α-
Toco
pher
ol
Tota
l β-C
arot
ene
Tota
l Lut
ein
D14
Ret
inyl
Pal
mita
te
γ/β-
Toco
pher
ol
trans
-β-C
arot
ene
Tota
l Zea
xant
hin
Tota
l Lyc
open
e δ-
Toco
pher
ol
Tota
l cis
-β-C
arot
ene
Tota
l Lut
ein&
Zeax
anth
in
trans
-Lyc
open
e To
tal β
-Cry
ptox
anth
in
Tota
l α-C
arot
ene
Coe
nzym
e Q
10
Indi
vidu
aliz
ed R
epor
t Pa
ge 1
3 / 1
3
Appendix E. Shipping Package Inserts for RR28
The following five items were included in each package shipped to an RR28 participant: • Cover letter • Protocol for Preparation and Analysis of the Ascorbic Acid Solid Control
Material • Preparation and Validation of Ascorbic Acid Solid Control Material Datasheet • Analysis of Control Materials and Test Samples Datasheet • Packing List and Shipment Receipt Confirmation Form
The cover letter, preparation protocol, and the two datasheets were enclosed in a sealed waterproof bag along with the samples themselves. The packing list was placed at the top of the shipping box, between the cardboard covering and the foam insulation.
E1
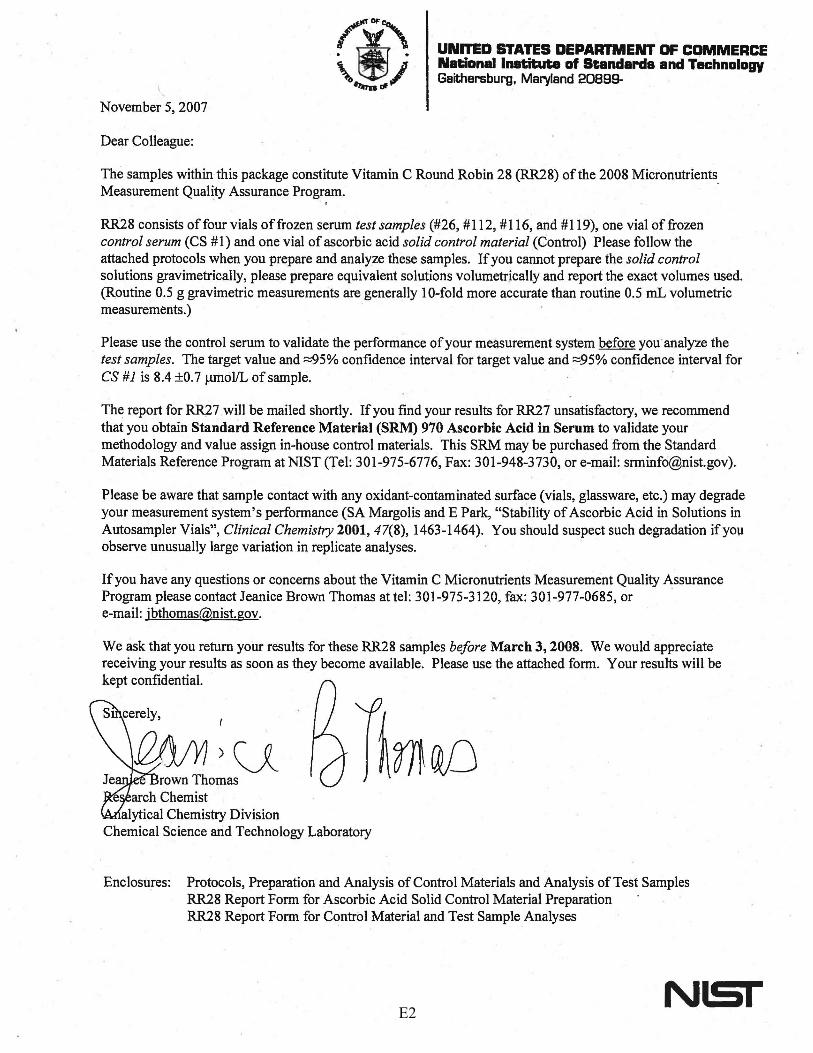
November 5, 2007
Dear Colleague:
UNn'ED STATES DEPARTMENT OF COMMERCE National Institute of Standards and Technology Gaithersburg, Maryland 20899-
The samples within this package constitute Vitamin C Round Robin 28 (RR28) of the 2008 Micronutrients Measurement Quality Assurance Program. ·
'
RR28 consists of four vials of frozen serum test samples (#26, #112, #116, and #119), one vial of frozen control serum (CS # 1) and one vial of ascorbic acid solid control material (Control) Please follow the attached protocols when you prepare and analyze these samples. If you cannot prepare the solid control solutions gravimetrically, please prepare equivalent solutions volumetrjcally and report the exact volumes used. (Routine 0.5 g gravimetric measurements are generally 10-fold more accurate than routine 0.5 mL volumetric measurements.) ·
Please use the control serum to validate the performance of your measurement system before you· analyze the test samples. The target value and >=::95% confidence interval for target value and ::::95% confidence interval for CS #1 is 8.4 ±0.7 µmol/L of sample.
Th~ report for RR27 will be mailed shortly. If you find your results for RR27 unsatisfactory, we recommend that you obtain Standard Reference Material (SRM) 970 Ascorbic Acid in Serum to validate your methodology and value assign in-house control materials. This SRM may be purchased from the Standard Materials Reference Program at NIST (Tel: 301-975-6776, Fax: 301-948-3730, or e-mail: [email protected]).
Please be aware that sample contact with any oxidant-contaminated surface (vials, glassware, etc.) may degrade your measurement system's performance (SA Margolis and E Park, "Stability of Ascorbic Acid in Solutions in Autosampler Vials'', Clinical Chemistry 2001, 47(8), 1463-1464). You should suspect such degradation if yoµ observe unusually large variation in replicate analyses.
If you have any questions or concerns about the Vitamin C Micronutrients Measurement Quality Assurance Program please contact Jeanice Brown Thomas at tel: 301-975-3120, fax: 301-977-0685, or · e-mail: [email protected].
We ask that you return your results for these RR28 samples before March 3, 2008. We would appreciate receiving your results as soon as they become available. Please use the attached form. Your results will be kept confidential.
e alytical Chemistry Division
Chemical Science and Technology Laboratory
Enclosures: Protocols, Preparation and Analysis of Control Materials and Analysis of Test Samples RR28 Report Form for Ascorbic Acid Solid Control Material Preparation RR28 Re.port Form for Control Material and Test Sample Analyses
NlSI E2
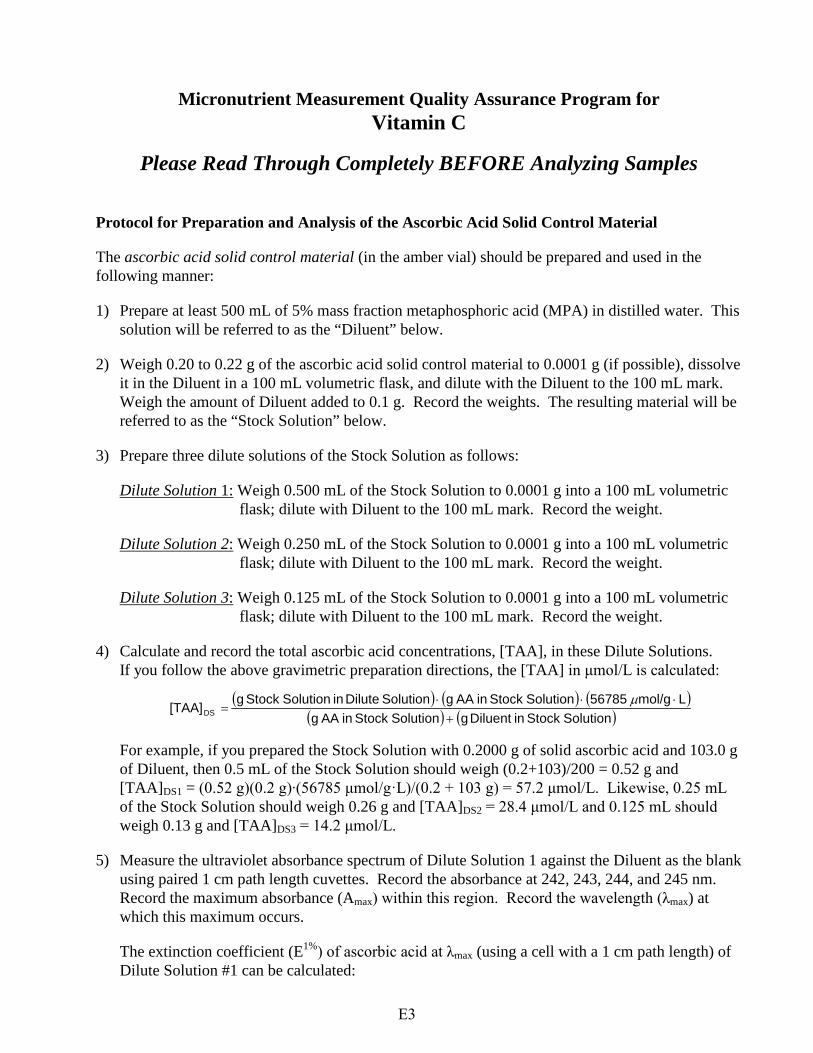
Micronutrient Measurement Quality Assurance Program for Vitamin C
Please Read Through Completely BEFORE Analyzing Samples
Protocol for Preparation and Analysis of the Ascorbic Acid Solid Control Material
The ascorbic acid solid control material (in the amber vial) should be prepared and used in the following manner:
1) Prepare at least 500 mL of 5% mass fraction metaphosphoric acid (MPA) in distilled water. This solution will be referred to as the “Diluent” below.
2) Weigh 0.20 to 0.22 g of the ascorbic acid solid control material to 0.0001 g (if possible), dissolve it in the Diluent in a 100 mL volumetric flask, and dilute with the Diluent to the 100 mL mark. Weigh the amount of Diluent added to 0.1 g. Record the weights. The resulting material will be referred to as the “Stock Solution” below.
3) Prepare three dilute solutions of the Stock Solution as follows:
Dilute Solution 1: Weigh 0.500 mL of the Stock Solution to 0.0001 g into a 100 mL volumetric flask; dilute with Diluent to the 100 mL mark. Record the weight.
Dilute Solution 2: Weigh 0.250 mL of the Stock Solution to 0.0001 g into a 100 mL volumetric flask; dilute with Diluent to the 100 mL mark. Record the weight.
Dilute Solution 3: Weigh 0.125 mL of the Stock Solution to 0.0001 g into a 100 mL volumetric flask; dilute with Diluent to the 100 mL mark. Record the weight.
4) Calculate and record the total ascorbic acid concentrations, [TAA], in these Dilute Solutions. If you follow the above gravimetric preparation directions, the [TAA] in μmol/L is calculated:
( ) ( ⋅ 56785 mol/g ⋅ L)g Stock Solution in Dilute Solution ⋅ g AA in Stock Solution ) ( µ[TAA] DS = (g AA in Stock Solution ) + (g Diluent in Stock Solution)
For example, if you prepared the Stock Solution with 0.2000 g of solid ascorbic acid and 103.0 g of Diluent, then 0.5 mL of the Stock Solution should weigh (0.2+103)/200 = 0.52 g and [TAA]DS1 = (0.52 g)(0.2 g)∙(56785 μmol/g·L)/(0.2 + 103 g) = 57.2 μmol/L. Likewise, 0.25 mL of the Stock Solution should weigh 0.26 g and [TAA]DS2 = 28.4 μmol/L and 0.125 mL should weigh 0.13 g and [TAA]DS3 = 14.2 μmol/L.
5) Measure the ultraviolet absorbance spectrum of Dilute Solution 1 against the Diluent as the blank using paired 1 cm path length cuvettes. Record the absorbance at 242, 243, 244, and 245 nm. Record the maximum absorbance (Amax) within this region. Record the wavelength (λmax) at which this maximum occurs.
The extinction coefficient (E1%) of ascorbic acid at λmax (using a cell with a 1 cm path length) of Dilute Solution #1 can be calculated:
E3
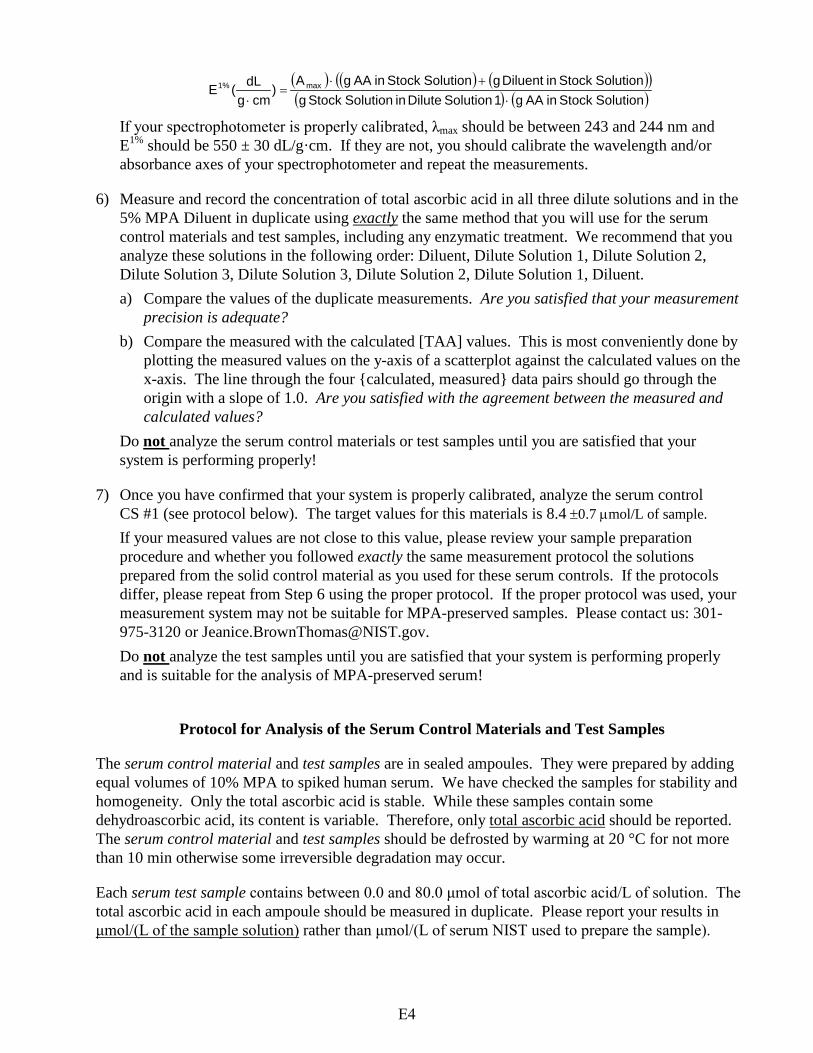
1% dL (A max ) ( ( g AA in Stock Solution ) + (g Diluent in Stock Solution )⋅ )E ( ) =
g ⋅ cm (g Stock Solution in Dilute Solution 1) (⋅ g AA in Stock Solution) If your spectrophotometer is properly calibrated, λmax should be between 243 and 244 nm and E1% should be 550 ± 30 dL/g·cm. If they are not, you should calibrate the wavelength and/or absorbance axes of your spectrophotometer and repeat the measurements.
6) Measure and record the concentration of total ascorbic acid in all three dilute solutions and in the 5% MPA Diluent in duplicate using exactly the same method that you will use for the serum control materials and test samples, including any enzymatic treatment. We recommend that you analyze these solutions in the following order: Diluent, Dilute Solution 1, Dilute Solution 2, Dilute Solution 3, Dilute Solution 3, Dilute Solution 2, Dilute Solution 1, Diluent. a) Compare the values of the duplicate measurements. Are you satisfied that your measurement
precision is adequate? b) Compare the measured with the calculated [TAA] values. This is most conveniently done by
plotting the measured values on the y-axis of a scatterplot against the calculated values on the x-axis. The line through the four {calculated, measured} data pairs should go through the origin with a slope of 1.0. Are you satisfied with the agreement between the measured and calculated values?
Do not analyze the serum control materials or test samples until you are satisfied that your system is performing properly!
7) Once you have confirmed that your system is properly calibrated, analyze the serum control CS #1 (see protocol below). The target values for this materials is 8.4 ±0.7 µmol/L of sample.
If your measured values are not close to this value, please review your sample preparation procedure and whether you followed exactly the same measurement protocol the solutions prepared from the solid control material as you used for these serum controls. If the protocols differ, please repeat from Step 6 using the proper protocol. If the proper protocol was used, your measurement system may not be suitable for MPA-preserved samples. Please contact us: 301975-3120 or [email protected]. Do not analyze the test samples until you are satisfied that your system is performing properly and is suitable for the analysis of MPA-preserved serum!
Protocol for Analysis of the Serum Control Materials and Test Samples
The serum control material and test samples are in sealed ampoules. They were prepared by adding equal volumes of 10% MPA to spiked human serum. We have checked the samples for stability and homogeneity. Only the total ascorbic acid is stable. While these samples contain some dehydroascorbic acid, its content is variable. Therefore, only total ascorbic acid should be reported. The serum control material and test samples should be defrosted by warming at 20 °C for not more than 10 min otherwise some irreversible degradation may occur.
Each serum test sample contains between 0.0 and 80.0 μmol of total ascorbic acid/L of solution. The total ascorbic acid in each ampoule should be measured in duplicate. Please report your results in μmol/(L of the sample solution) rather than μmol/(L of serum NIST used to prepare the sample).
E4
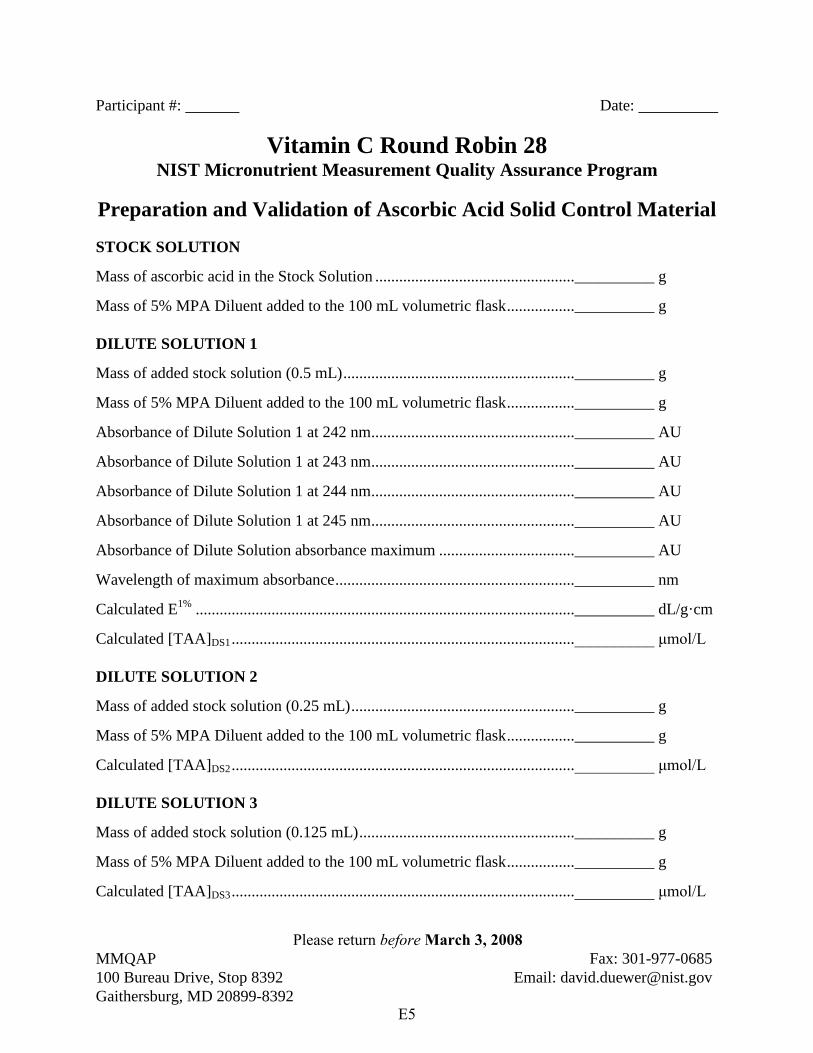
Participant #: Date:
Vitamin C Round Robin 28 NIST Micronutrient Measurement Quality Assurance Program
Preparation and Validation of Ascorbic Acid Solid Control Material
STOCK SOLUTION
Mass of ascorbic acid in the Stock Solution ..................................................__________ g
Mass of 5% MPA Diluent added to the 100 mL volumetric flask .................__________ g
DILUTE SOLUTION 1
Mass of added stock solution (0.5 mL) ..........................................................__________ g
Mass of 5% MPA Diluent added to the 100 mL volumetric flask .................__________ g
Absorbance of Dilute Solution 1 at 242 nm...................................................__________ AU
Absorbance of Dilute Solution 1 at 243 nm...................................................__________ AU
Absorbance of Dilute Solution 1 at 244 nm...................................................__________ AU
Absorbance of Dilute Solution 1 at 245 nm...................................................__________ AU
Absorbance of Dilute Solution absorbance maximum ..................................__________ AU
Wavelength of maximum absorbance............................................................__________ nm
Calculated E1% ...............................................................................................__________ dL/g·cm
Calculated [TAA]DS1......................................................................................__________ μmol/L
DILUTE SOLUTION 2
Mass of added stock solution (0.25 mL) ........................................................__________ g
Mass of 5% MPA Diluent added to the 100 mL volumetric flask.................__________ g
Calculated [TAA]DS2......................................................................................__________ μmol/L
DILUTE SOLUTION 3
Mass of added stock solution (0.125 mL) ......................................................__________ g
Mass of 5% MPA Diluent added to the 100 mL volumetric flask .................__________ g
Calculated [TAA]DS3......................................................................................__________ μmol/L
Please return before March 3, 2008 MMQAP Fax: 301-977-0685 100 Bureau Drive, Stop 8392 Email: [email protected] Gaithersburg, MD 20899-8392
E5
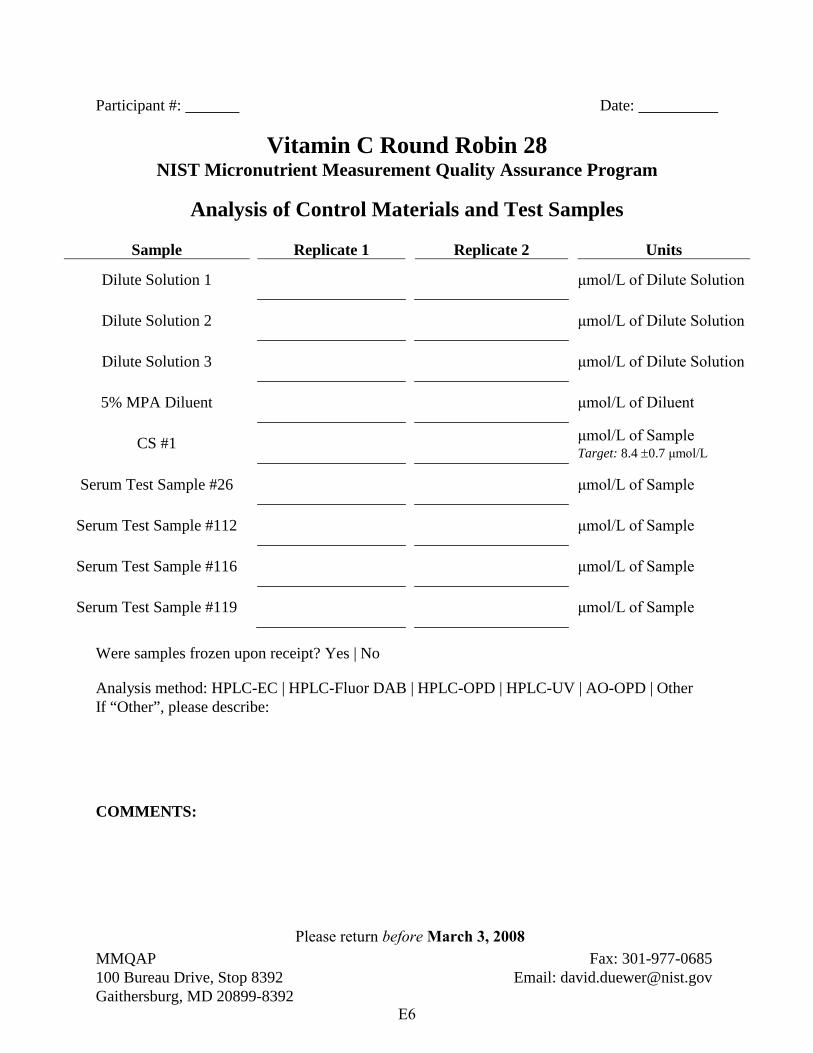
Participant #: Date:
Vitamin C Round Robin 28 NIST Micronutrient Measurement Quality Assurance Program
Analysis of Control Materials and Test Samples
Sample Replicate 1 Replicate 2 Units
Dilute Solution 1 μmol/L of Dilute Solution
Dilute Solution 2 μmol/L of Dilute Solution
Dilute Solution 3 μmol/L of Dilute Solution
5% MPA Diluent μmol/L of Diluent
μmol/L of Sample CS #1 Target: 8.4 ±0.7 μmol/L
Serum Test Sample #26 μmol/L of Sample
Serum Test Sample #112 μmol/L of Sample
Serum Test Sample #116 μmol/L of Sample
Serum Test Sample #119 μmol/L of Sample
Were samples frozen upon receipt? Yes | No
Analysis method: HPLC-EC | HPLC-Fluor DAB | HPLC-OPD | HPLC-UV | AO-OPD | Other If “Other”, please describe:
COMMENTS:
Please return before March 3, 2008MMQAP Fax: 301-977-0685 100 Bureau Drive, Stop 8392 Email: [email protected] Gaithersburg, MD 20899-8392
E6
Participant #: ________ Date: _____________
Vitamin C Round Robin 28 NIST Micronutrients Measurement Quality Assurance Program
Packing List and Shipment Receipt Confirmation Form
This box contains one vial each of the following six VitC M2QAP samples:
Label Form
VitC #26 Liquid frozen (1:1 serum:10% MPA) VitC #112 Liquid frozen (1:1 serum:10% MPA) VitC #116 Liquid frozen (1:1 serum:10% MPA) VitC #119 Liquid frozen (1:1 serum:10% MPA)
CS #1 Liquid frozen (1:1 serum:10% MPA) Control Solid AA
Please 1) Open the pack immediately 2) Check that it contains one vial each of the above samples 3) Check if the samples arrived frozen 4) Store the samples at -20 ˚C or below until analysis 5) Complete the following information 6) Fax the completed form to us at 301-977-0685
(or email requested information to [email protected])
1) Date this shipment arrived: ___________________________ 2) Are all of the vials intact? Yes | No
If "No", which one(s) were damaged?
3) Was there any dry-ice left in cooler? Yes | No 4) Did the samples arrive frozen? Yes | No 5) At what temperature are you storing the samples? _______ ˚C 6) When do you anticipate analyzing these samples? ________________________
Your prompt return of this information is appreciated.
The M2QAP Gang
Mail: M2QAP NIST, Stop 8392 Fax: 301-977-0685 Gaithersburg, MD 20899-8392 Email: [email protected]
E7

Appendix F. Final Report for RR28
The following three pages are the final report as provided to all participants: • Cover letter. • An information sheet that:
o describes the contents of the “All-Lab” report, o describes the content of the “Individualized” report, o describes the nature of the test samples and details their previous distributions,
if any, and o summarizes aspects of the study that we believe may be of interest to the
participants.
F1
May 2, 2008
Dear Colleague:
UNITED STATES DEPARTMENT OF COMMERCE National Institute of Standards and Technology Gaithersburg, Maryland 20899-
Enclosed is the summary report of the results for Round Robin 28 (RR 28) for the measurement of total ascorbic acid (T AA, ascorbic acid plus dehydroascorbic acid) in human serum. Included in this report are a summary of data for all laboratories and an individualized summary of your laboratory's measurement performance. The robust median is used to estimate the consensus value for all samples, the "median absolute deviation from the median" (MADe) is used to estimate the expected standard deviation, and the coefficient of variation (CV) is defined as 1 OOxMADe/median.
RR 28 consisted of four test samples (#26, #112, #116, and #119), one serum control material (CS # 1 ), and one solid control material for preparation of TAA control solutions. Details regarding the samples can be found in the enclosed repo1i.
If you have concerns regarding your laboratory's performance, we suggest that you obtain anq analyze a unit of Standard Reference Material (SRM) 970, Vitamin C in Frozen Human Serum. SRM 970 can be purchased from the NIST SRM Program at phone: 301-975-6776; fax: 301-948-3730. If your measured values do not agree with the certified values, we suggest that you contact us for consultation.
Samples for the second vitamin C round robin (RR 29) of the 2007 M2QAP will be shipped during the week of May 19, 2008.
If you have questions or concerns regarding this report, please contact David Duewer at 301-975-3935; e-mail: [email protected] or me at 301-975-3120; e-mail: [email protected]; or fax: 301-977-0685.
in erely, \,
. ea ce Brown Thomas search Chemist
Analytical Chemistry Division Chemical Science and Technology Laboratory
Enclosures
Cc: L. C. Sander D.L. Duewer
NlSI F2
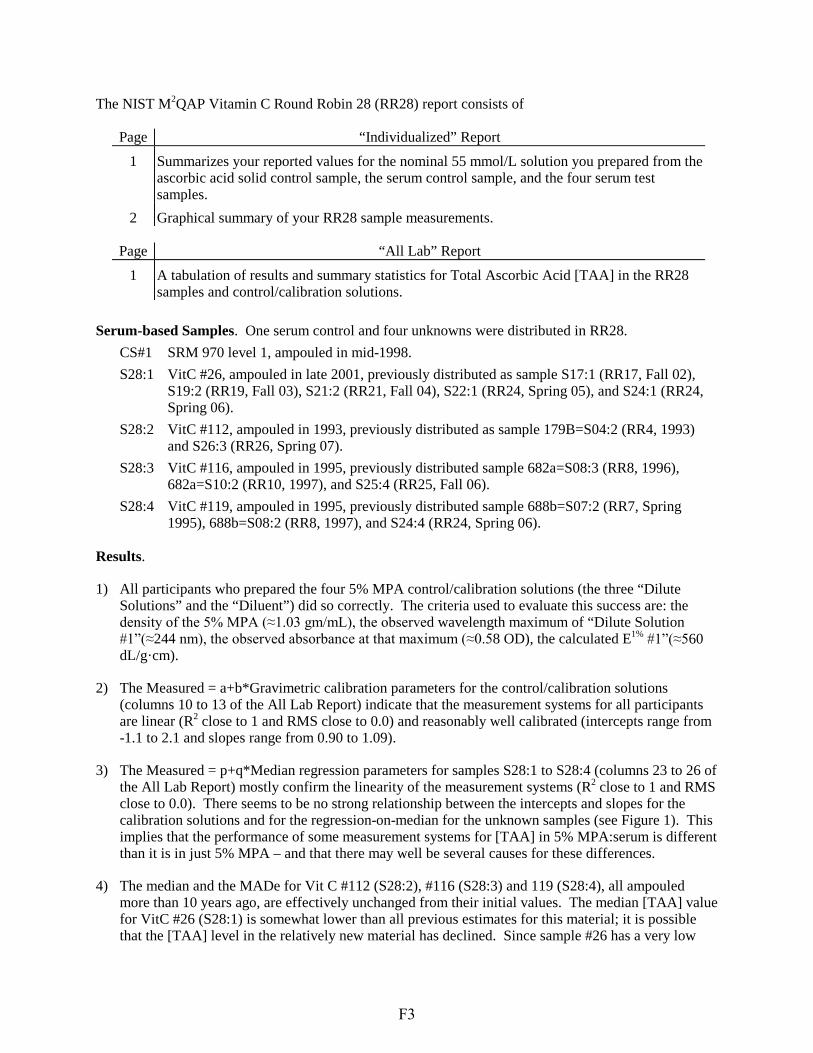
The NIST M2QAP Vitamin C Round Robin 28 (RR28) report consists of
Page “Individualized” Report 1 Summarizes your reported values for the nominal 55 mmol/L solution you prepared from the
ascorbic acid solid control sample, the serum control sample, and the four serum test samples.
2 Graphical summary of your RR28 sample measurements.
Page “All Lab” Report 1 A tabulation of results and summary statistics for Total Ascorbic Acid [TAA] in the RR28
samples and control/calibration solutions.
Serum-based Samples. One serum control and four unknowns were distributed in RR28. CS#1 SRM 970 level 1, ampouled in mid-1998. S28:1 VitC #26, ampouled in late 2001, previously distributed as sample S17:1 (RR17, Fall 02),
S19:2 (RR19, Fall 03), S21:2 (RR21, Fall 04), S22:1 (RR24, Spring 05), and S24:1 (RR24, Spring 06).
S28:2 VitC #112, ampouled in 1993, previously distributed as sample 179B=S04:2 (RR4, 1993) and S26:3 (RR26, Spring 07).
S28:3 VitC #116, ampouled in 1995, previously distributed sample 682a=S08:3 (RR8, 1996), 682a=S10:2 (RR10, 1997), and S25:4 (RR25, Fall 06).
S28:4 VitC #119, ampouled in 1995, previously distributed sample 688b=S07:2 (RR7, Spring 1995), 688b=S08:2 (RR8, 1997), and S24:4 (RR24, Spring 06).
Results.
1) All participants who prepared the four 5% MPA control/calibration solutions (the three “Dilute Solutions” and the “Diluent”) did so correctly. The criteria used to evaluate this success are: the density of the 5% MPA (≈1.03 gm/mL), the observed wavelength maximum of “Dilute Solution #1”(≈244 nm), the observed absorbance at that maximum (≈0.58 OD), the calculated E1% #1”(≈560 dL/g·cm).
2) The Measured = a+b*Gravimetric calibration parameters for the control/calibration solutions (columns 10 to 13 of the All Lab Report) indicate that the measurement systems for all participants are linear (R2 close to 1 and RMS close to 0.0) and reasonably well calibrated (intercepts range from -1.1 to 2.1 and slopes range from 0.90 to 1.09).
3) The Measured = p+q*Median regression parameters for samples S28:1 to S28:4 (columns 23 to 26 of the All Lab Report) mostly confirm the linearity of the measurement systems (R2 close to 1 and RMS close to 0.0). There seems to be no strong relationship between the intercepts and slopes for the calibration solutions and for the regression-on-median for the unknown samples (see Figure 1). This implies that the performance of some measurement systems for [TAA] in 5% MPA:serum is different than it is in just 5% MPA – and that there may well be several causes for these differences.
4) The median and the MADe for Vit C #112 (S28:2), #116 (S28:3) and 119 (S28:4), all ampouled more than 10 years ago, are effectively unchanged from their initial values. The median [TAA] value for VitC #26 (S28:1) is somewhat lower than all previous estimates for this material; it is possible that the [TAA] level in the relatively new material has declined. Since sample #26 has a very low
F3
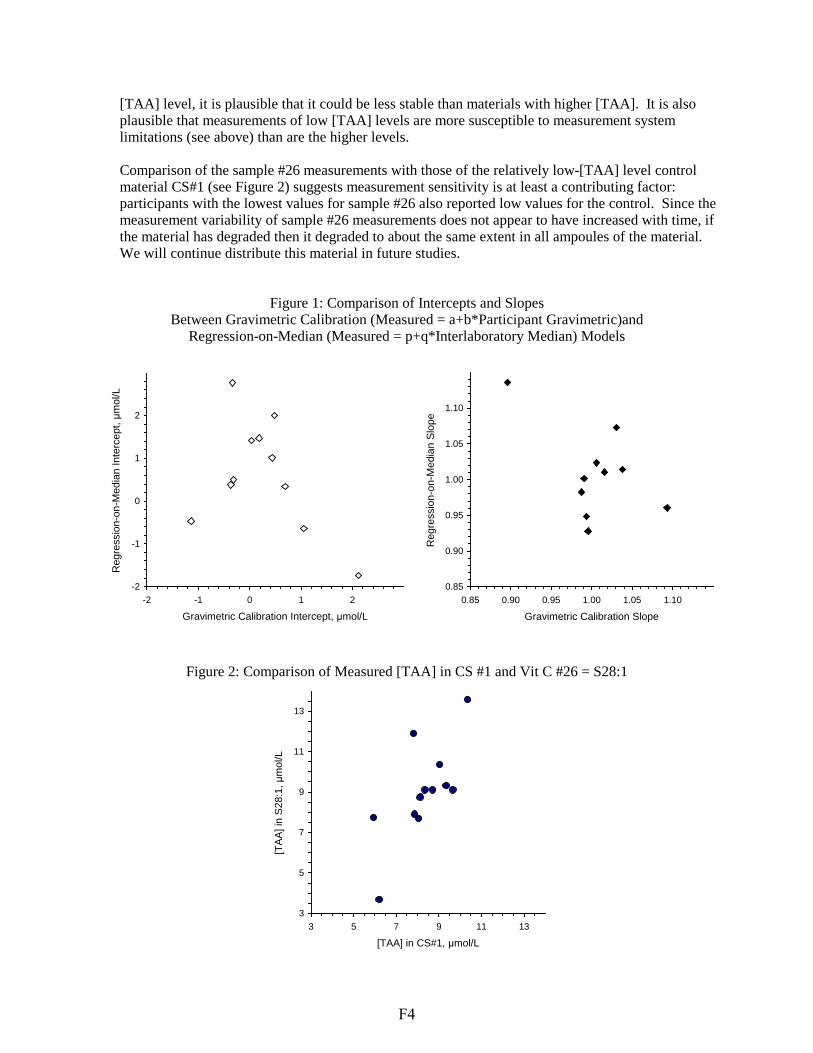
-1
0
1
2
Reg
ress
ion-
on-M
edia
n In
terc
ept, μm
ol/L
[TAA] level, it is plausible that it could be less stable than materials with higher [TAA]. It is also plausible that measurements of low [TAA] levels are more susceptible to measurement system limitations (see above) than are the higher levels.
Comparison of the sample #26 measurements with those of the relatively low-[TAA] level control material CS#1 (see Figure 2) suggests measurement sensitivity is at least a contributing factor: participants with the lowest values for sample #26 also reported low values for the control. Since the measurement variability of sample #26 measurements does not appear to have increased with time, if the material has degraded then it degraded to about the same extent in all ampoules of the material. We will continue distribute this material in future studies.
Figure 1: Comparison of Intercepts and Slopes Between Gravimetric Calibration (Measured = a+b*Participant Gravimetric)and
Regression-on-Median (Measured = p+q*Interlaboratory Median) Models
Reg
ress
ion-
on-M
edia
n Sl
ope
1.10
1.05
1.00
0.95
0.90
-2 0.85 -2 -1 0 1 2 0.85 0.90 0.95 1.00 1.05 1.10
Gravimetric Calibration Intercept, μmol/L Gravimetric Calibration Slope
Figure 2: Comparison of Measured [TAA] in CS #1 and Vit C #26 = S28:1
13
[TAA
] in
S28:
1, μ
mol
/L 11
9
7
5
3 3 5 7 9 11 13
[TAA] in CS#1, μmol/L
F4
Appendix G. “All-Lab Report” for RR28
The following single page is the “All-Lab Report” as provided to all participants, with two exceptions:
• the participant identifiers (Lab) have been altered. • the order in which the participant results are listed has been altered.
The data summary in the “All-Lab Report” has been altered to ensure confidentiality of identification codes assigned to laboratories.
G1
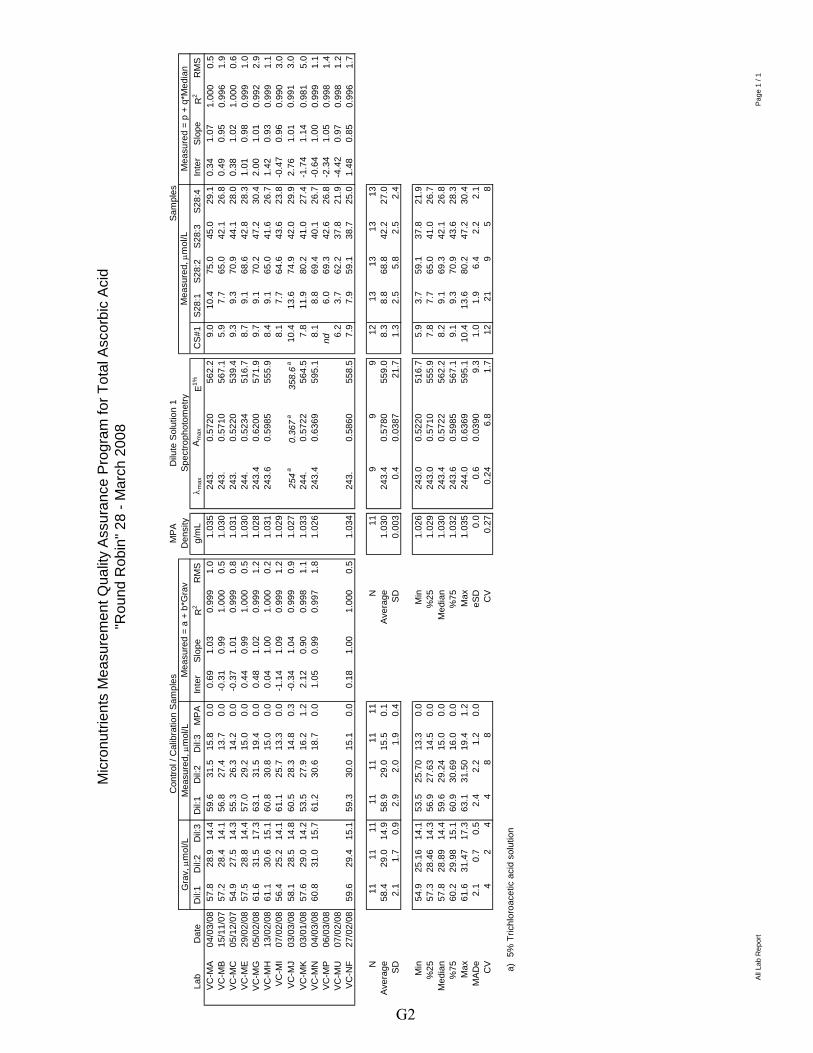
Mic
ronu
trien
ts M
easu
rem
ent Q
ualit
y As
sura
nce
Prog
ram
for T
otal
Asc
orbi
c Ac
id
"Rou
nd R
obin
" 28
- Mar
ch 2
008
Con
trol /
Cal
ibra
tion
Sam
ples
M
PA
Dilu
te S
olut
ion
1 Sa
mpl
es
Mea
sure
d, µ
mol
/L
Mea
sure
d =
a +
b*G
rav
Mea
sure
d =
p +
q*M
edia
n D
ensi
ty
Spec
troph
otom
etry
G
rav,
µm
ol/L
M
easu
red,
µm
ol/L
La
b D
ate
Dil:
1 D
il:2
Dil:
3 D
il:1
Dil:
2 D
il:3
MPA
In
ter
Slop
e R
2 R
MS
g/m
L C
S#1
S28:
1 S2
8:2
S28:
3 S2
8:4
Inte
r Sl
ope
R2
RM
S λ m
ax
A max
E1%
VC-M
A 04
/03/
08
57.8
28
.9
14.4
59
.6
31.5
15
.8
0.0
0.69
1.
03
0.99
9 1.
0 1.
035
243.
0.
5720
56
2.2
9.0
10.4
75
.0
45.0
29
.1
0.34
1.
07
1.00
0 0.
5 VC
-MB
15/1
1/07
57
.2
28.4
14
.1
56.8
27
.4
13.7
0.
0 -0
.31
0.99
1.
000
0.5
1.03
0 24
3.
0.57
10
567.
1 5.
9 7.
7 65
.0
42.1
26
.8
0.49
0.
95
0.99
6 1.
9 VC
-MC
05
/12/
07
54.9
27
.5
14.3
55
.3
26.3
14
.2
0.0
-0.3
7 1.
01
0.99
9 0.
8 1.
031
243.
0.
5220
53
9.4
9.3
9.3
70.9
44
.1
28.0
0.
38
1.02
1.
000
0.6
VC-M
E 29
/02/
08
57.5
28
.8
14.4
57
.0
29.2
15
.0
0.0
0.44
0.
99
1.00
0 0.
5 1.
030
244.
0.
5234
51
6.7
8.7
9.1
68.6
42
.8
28.3
1.
01
0.98
0.
999
1.0
VC-M
G
05/0
2/08
61
.6
31.5
17
.3
63.1
31
.5
19.4
0.
0 0.
48
1.02
0.
999
1.2
1.02
8 24
3.4
0.62
00
571.
9 9.
7 9.
1 70
.2
47.2
30
.4
2.00
1.
01
0.99
2 2.
9 VC
-MH
13
/02/
08
61.1
30
.6
15.1
60
.8
30.8
15
.0
0.0
0.04
1.
00
1.00
0 0.
2 1.
031
243.
6 0.
5985
55
5.9
8.4
9.1
65.0
41
.6
26.7
1.
42
0.93
0.
999
1.1
VC-M
I 07
/02/
08
56.4
25
.2
14.1
61
.1
25.7
13
.3
0.0
-1.1
4 1.
09
0.99
9 1.
2 1.
029
8.1
7.7
64.6
43
.6
23.8
-0
.47
0.96
0.
990
3.0
VC-M
J 03
/03/
08
58.1
28
.5
14.8
60
.5
28.3
14
.8
0.3
-0.3
4 1.
04
0.99
9 0.
9 1.
027
10.4
13
.6
74.9
42
.0
29.9
2.
76
1.01
0.
991
3.0
254
a 0.
367
a 35
8.6
a
VC-M
K 03
/01/
08
57.6
29
.0
14.2
53
.5
27.9
16
.2
1.2
2.12
0.
90
0.99
8 1.
1 1.
033
244.
0.
5722
56
4.5
7.8
11.9
80
.2
41.0
27
.4
-1.7
4 1.
14
0.98
1 5.
0 VC
-MN
04
/03/
08
60.8
31
.0
15.7
61
.2
30.6
18
.7
0.0
1.05
0.
99
0.99
7 1.
8 1.
026
243.
4 0.
6369
59
5.1
8.1
8.8
69.4
40
.1
26.7
-0
.64
1.00
0.
999
1.1
VC-M
P 06
/03/
08
nd
6.0
69.3
42
.6
26.8
-2
.34
1.05
0.
998
1.4
VC-M
U
07/0
2/08
6.
2 3.
7 62
.2
37.8
21
.9
-4.4
2 0.
97
0.99
8 1.
2 VC
-NF
27/0
2/08
59
.6
29.4
15
.1
59.3
30
.0
15.1
0.
0 0.
18
1.00
1.
000
0.5
1.03
4 24
3.
0.58
60
558.
5 7.
9 7.
9 59
.1
38.7
25
.0
1.48
0.
85
0.99
6 1.
7
G2
N
11
11
11
11
11
11
11
58.4
29
.0
14.9
58
.9
29.0
15
.5
0.1
2.1
1.7
0.9
2.9
2.0
1.9
0.4
N
11
9 9
9 12
13
13
13
13
Av
erag
e Av
erag
e 1.
030
243.
4 0.
5780
55
9.0
8.3
8.8
68.8
42
.2
27.0
SD
SD
0.
003
0.4
0.03
87
21.7
1.
3 2.
5 5.
8 2.
5 2.
4
Min
54
.9
25.1
6 14
.1
57.3
28
.46
14.3
57
.8
28.8
9 14
.4
60.2
29
.98
15.1
61
.6
31.4
7 17
.3
2.1
0.7
0.5
4 2
4
53.5
25
.70
13.3
0.
0 56
.9
27.6
3 14
.5
0.0
59.6
29
.24
15.0
0.
0 60
.9
30.6
9 16
.0
0.0
63.1
31
.50
19.4
1.
2 2.
4 2.
2 1.
2 0.
0 4
8 8
Min
1.
026
243.
0 0.
5220
51
6.7
5.9
3.7
59.1
37
.8
21.9
%
25
%25
1.
029
243.
0 0.
5710
55
5.9
7.8
7.7
65.0
41
.0
26.7
M
edia
n M
edia
n 1.
030
243.
4 0.
5722
56
2.2
8.2
9.1
69.3
42
.1
26.8
%
75
%75
1.
032
243.
6 0.
5985
56
7.1
9.1
9.3
70.9
43
.6
28.3
M
ax
Max
1.
035
244.
0 0.
6369
59
5.1
10.4
13
.6
80.2
47
.2
30.4
M
ADe
eSD
0.
0 0.
6 0.
0390
9.
3 1.
0 1.
9 6.
4 2.
2 2.
1 C
V C
V 0.
27
0.24
6.
8 1.
7 12
21
9
5 8
a)
5% T
richl
oroa
cetic
aci
d so
lutio
n
All L
ab R
epor
t Pa
ge 1
/ 1
Appendix H. Representative “Individualized Report” for RR28
Each participant in RR28 received an “Individualized Report” reflecting their reported results. The following two pages are the “Individualized Report” for participant “VC-MA”.
H1
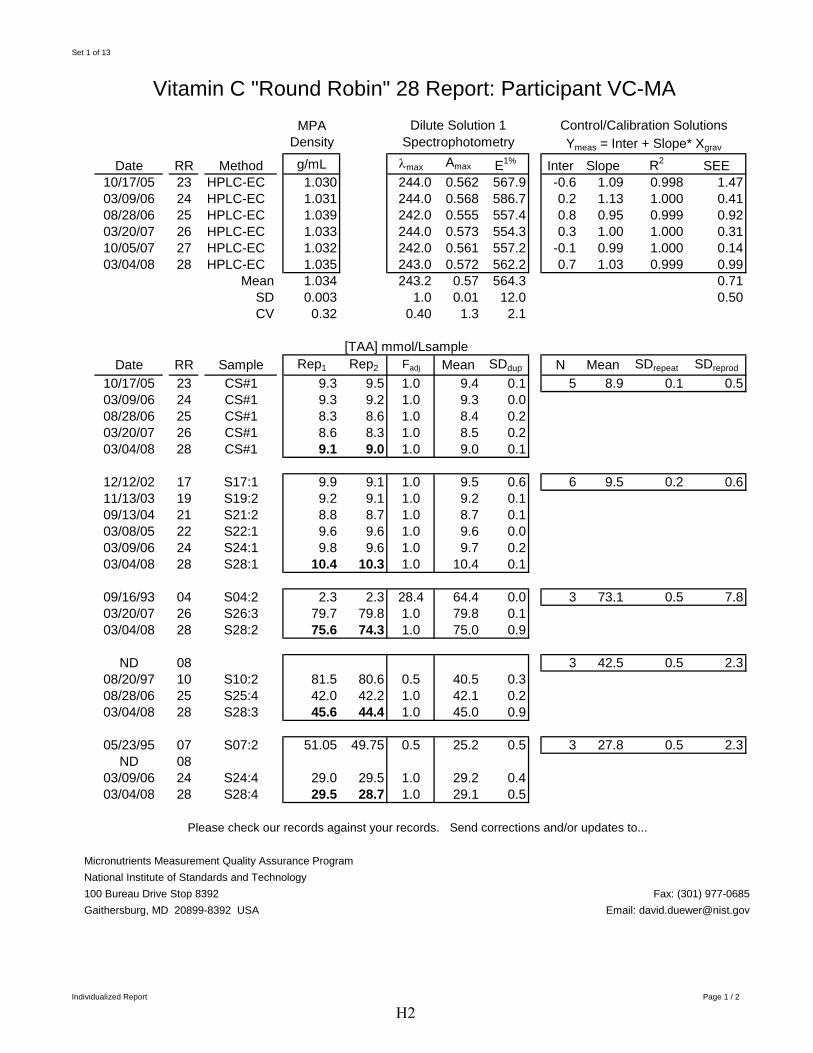
Set 1 of 13
Vitamin C "Round Robin" 28 Report: Participant VC-MA
MPA Dilute Solution 1 Control/Calibration Solutions Density Spectrophotometry Ymeas = Inter + Slope* Xgrav
Date RR Method 10/17/05 23 HPLC-EC 03/09/06 24 HPLC-EC 08/28/06 25 HPLC-EC 03/20/07 26 HPLC-EC 10/05/07 27 HPLC-EC 03/04/08 28 HPLC-EC
g/mL 1.030 1.031 1.039 1.033 1.032 1.035
λmax Amax E1%
244.0 0.562 567.9 244.0 0.568 586.7 242.0 0.555 557.4 244.0 0.573 554.3 242.0 0.561 557.2 243.0 0.572 562.2
Inter Slope R2 SEE -0.6 1.09 0.998 1.47 0.2 1.13 1.000 0.41 0.8 0.95 0.999 0.92 0.3 1.00 1.000 0.31
-0.1 0.99 1.000 0.14 0.7 1.03 0.999 0.99
Mean 1.034 243.2 0.57 564.3 0.71 SD 0.003 1.0 0.01 12.0 0.50 CV 0.32 0.40 1.3 2.1
[TAA] mmol/Lsample
6 9.5 0.2 0.6
3 73.1 0.5 7.8
3 42.5 0.5 2.3
Date RR Sample 10/17/05 23 CS#1 03/09/06 24 CS#1 08/28/06 25 CS#1 03/20/07 26 CS#1 03/04/08 28 CS#1
12/12/02 17 S17:1 11/13/03 19 S19:2 09/13/04 21 S21:2 03/08/05 22 S22:1 03/09/06 24 S24:1 03/04/08 28 S28:1
09/16/93 04 S04:2 03/20/07 26 S26:3 03/04/08 28 S28:2
ND 08 08/20/97 10 S10:2 08/28/06 25 S25:4 03/04/08 28 S28:3
05/23/95 07 S07:2
Rep1 Rep2 Fadj Mean SDdup
9.3 9.5 1.0 9.4 0.1 9.3 9.2 1.0 9.3 0.0 8.3 8.6 1.0 8.4 0.2 8.6 8.3 1.0 8.5 0.2 9.1 9.0 1.0 9.0 0.1
N Mean SDrepeat SDreprod
5 8.9 0.1 0.5
9.9 9.1 1.0 9.5 0.6 9.2 9.1 1.0 9.2 0.1 8.8 8.7 1.0 8.7 0.1 9.6 9.6 1.0 9.6 0.0 9.8 9.6 1.0 9.7 0.2
10.4 10.3 1.0 10.4 0.1
2.3 2.3 28.4 64.4 0.0 79.7 79.8 1.0 79.8 0.1 75.6 74.3 1.0 75.0 0.9
81.5 80.6 0.5 40.5 0.3 42.0 42.2 1.0 42.1 0.2 45.6 44.4 1.0 45.0 0.9
3 27.8 0.5 2.3 ND 08
03/09/06 24 S24:4 03/04/08 28 S28:4
Please check our records against your records. Send corrections and/or updates to...
Micronutrients Measurement Quality Assurance Program National Institute of Standards and Technology 100 Bureau Drive Stop 8392 Fax: (301) 977-0685 Gaithersburg, MD 20899-8392 USA Email: [email protected]
51.05 49.75 0.5 25.2 0.5
29.0 29.5 1.0 29.2 0.4 29.5 28.7 1.0 29.1 0.5
Individualized Report Page 1 / 2
H2
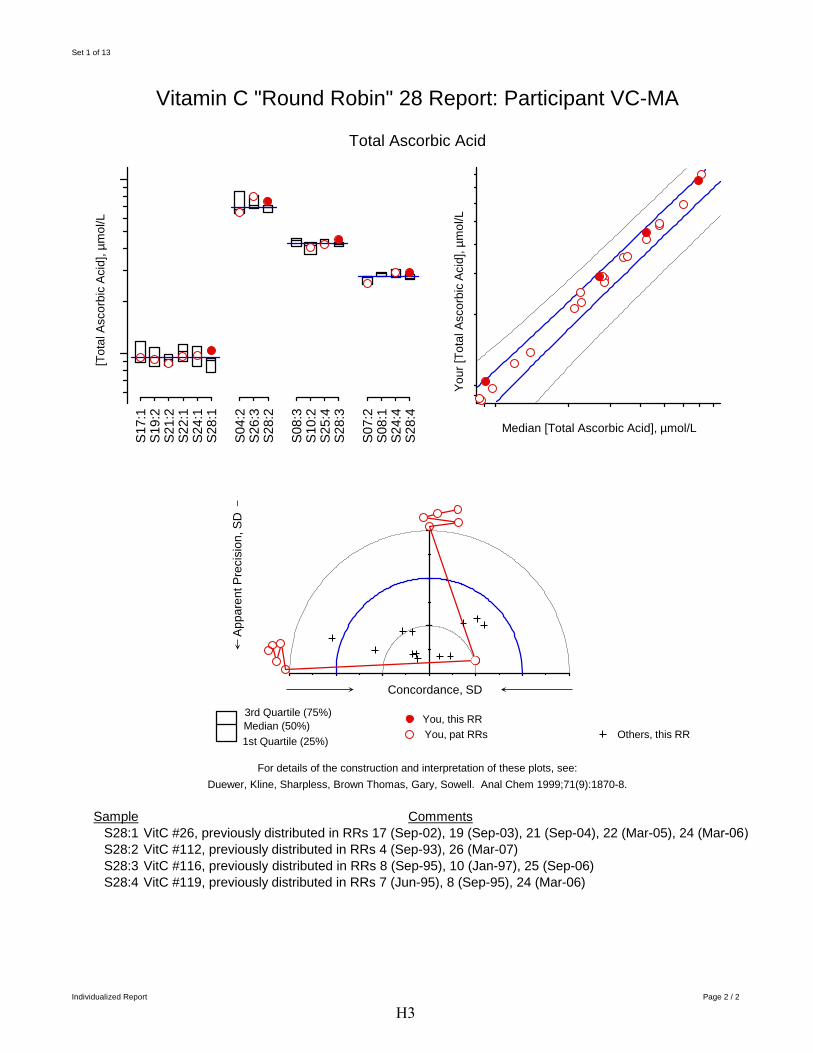
NIST, RR 22
Set 1 of 13
Vitamin C "Round Robin" 28 Report: Participant VC-MA
Total Ascorbic Acid
[Tot
al A
scor
bic
Acid
], µm
ol/L
Your
[Tot
al A
scor
bic
Acid
], µm
ol/L
S17:
1S1
9:2
S21:
2S2
2:1
S24:
1S2
8:1
Appa
rent
Pre
cisi
on, S
D
S04:
2S2
6:3
S28:
2
S08:
3S1
0:2
S25:
4S2
8:3
S07:
2S0
8:1
S24:
4S2
8:4
Median [Total Ascorbic Acid], µmol/L
Concordance, SD
3rd Quartile (75%) You, this RR Median (50%) You, pat RRs Others, this RR 1st Quartile (25%)
For details of the construction and interpretation of these plots, see: Duewer, Kline, Sharpless, Brown Thomas, Gary, Sowell. Anal Chem 1999;71(9):1870-8.
Sample Comments S28:1 VitC #26, previously distributed in RRs 17 (Sep-02), 19 (Sep-03), 21 (Sep-04), 22 (Mar-05), 24 (Mar-06) S28:2 VitC #112, previously distributed in RRs 4 (Sep-93), 26 (Mar-07) S28:3 VitC #116, previously distributed in RRs 8 (Sep-95), 10 (Jan-97), 25 (Sep-06) S28:4 VitC #119, previously distributed in RRs 7 (Jun-95), 8 (Sep-95), 24 (Mar-06)
Individualized Report Page 2 / 2
H3
Recommended