INDEPENDENT JOURNAL OF MANAGEMENT & PRODUCTION (IJM&P) http://www.ijmp.jor.br v. 4, n. 2, July – September 2013. ISSN: 2236-269X DOI: 10.14807/ijmp.v4i2.76
391
KEY FACTORS FOR A CONTINUOUS IMPROVEMENT PROCESS
Hector Ricardo Formento National University of General Sarmiento, Argentina
E-mail: [email protected]
Franco Javier Chiodi National University of General Sarmiento, Argentina
E-mail: [email protected]
Fernando Juan Cusolito National University of General Sarmiento, Argentina
E-mail: [email protected]
Lucas Ariel Altube National University of General Sarmiento, Argentina
E-mail: [email protected]
Sebastian Pablo Gatti National University of General Sarmiento, Argentina
E-mail: [email protected]
Submission: 27/04/2013 Revisions: 09/06/2013
Accept: 24/06/2013 ABSTRACT
The goal of this work was to examine the content of continuous
improvement processes, taking into account its inclusion in modern
organizations´ strategies. Continuous improvement plays an important
role in ISO 9000 norms and excellence models.
This paper argues that several specific issues must be taken into
account in order to reach successful outcomes.
This work starts with a literature review on the matter. On this basis we
designed a survey of a group of 30 large companies, selected
according to their billing, its market share, its membership to quality
institutions and the existence of a certified management system.
Finally, we compared the development of continuous improvement
process in companies with very effective results and with scarce
results. Differences that emerged from this comparison enabled us to
identify critical factors for achieving a successful improvement process.
INDEPENDENT JOURNAL OF MANAGEMENT & PRODUCTION (IJM&P) http://www.ijmp.jor.br v. 4, n. 2, July – September 2013. ISSN: 2236-269X DOI: 10.14807/ijmp.v4i2.76
392
As there are no recent researches on continuous improvement programs in
Argentina, this paper contributes to recognizing and systematizing what has been
done, comparing it with theoretical framework and uncovering research gaps for
future studies. However, further research must confirm these findings and move
forward on the analysis of intangible factors, like: internal communications, climate,
culture, self reflexion, consensus, etc.
Keywords: Continuous improvement; key factors; management; team work
1. INTRODUCTION
In the approach proposed by Imai (1986), the kaizen or continuous
improvement implies a shift in the Taylorist paradigm of labor division. That means, to
generate a dual function of work, shared between routine and improvement. That is,
everyone in the organization will use a portion of their time to solve problems or
develop opportunities for improvement. This will be made applying their experience
through a scientific method of diagnosis. This idea is so simple to understand but
complex to implement in daily practice.
Some surveys confirm this perception. A study of U.S. firms showed that while
70% of the plants had implemented techniques "Lean manufacturing", 74% of them
were dissatisfied with the results achieved (PAY, quoted in ANAND; WARD;
TATIKONDA; SHILLING, 2009).
Another study showed that only 11% of companies considered their
continuous improvement initiatives had been successful (MENDELBAUM, quoted in
ANAND et al., 2009).
Multiple studies have analyzed the continuous improvement processes in
companies and organizations of different types. Using a simplified classification, the
main approaches are: the analysis of core competencies, barriers and facilitators
(MESQUITA; ALLIPRANDINI, 2003; MARIN GARCIA; PARDO DEL VAL; BONAVIA
MARTIN, 2008; ALBORS GARRIGOS; HERVAS OLIVER; SEGARRA OÑA, 2009;
GARCIA SABATER; MARIN GARCIA, 2009), models (BESSANT; CAFFYN;
GALLAGER, 2001; WU; CHEN, 2006), knowledge and learning process (BUCKLER,
1996; MURRAY; CHAPMAN, 2003; DAVISON; GORDON; ROBINSON, 2005;
SAVOLAINEN; HAIKONEN, 2007; JABROUNI; KAMSU-FOGUEN; GENESTE;
VAYSSE, 2011), quantitative studies of programs in different sectors and countries
INDEPENDENT JOURNAL OF MANAGEMENT & PRODUCTION (IJM&P) http://www.ijmp.jor.br v. 4, n. 2, July – September 2013. ISSN: 2236-269X DOI: 10.14807/ijmp.v4i2.76
393
(TERSIOVSKI; SOHAL, 2000; SCOTT; WILCOCK; KANETKAR, 2009) the
relationship of continuous improvement with change management and TQM (CHOI,
1995; JUNG; WANG, 2006), and history and evolution of continuous improvement
(BHUIYAN; BAGHEL, 2005; SUÁREZ-BARRAZA; DÁVILA, 2009).
While all of these work together with others not mentioned here, have made
important contributions to the understanding of continuous improvement processes, it
is still difficult to explain why the teachings of Deming, Juran, Ishikawa and other
great teachers have not yet been able to be fully implemented in many
organizations? And why it is so difficult to copy the successful systems (for example,
the Toyota Production System)? when the concepts they applied are simple and
easy to understand.
The objective of this work is to answer questions previously expressed. To do
so, from the theory, we analyze the reality of continuous improvement processes in
large organizations.
2. THEORETICAL FRAMEWORK
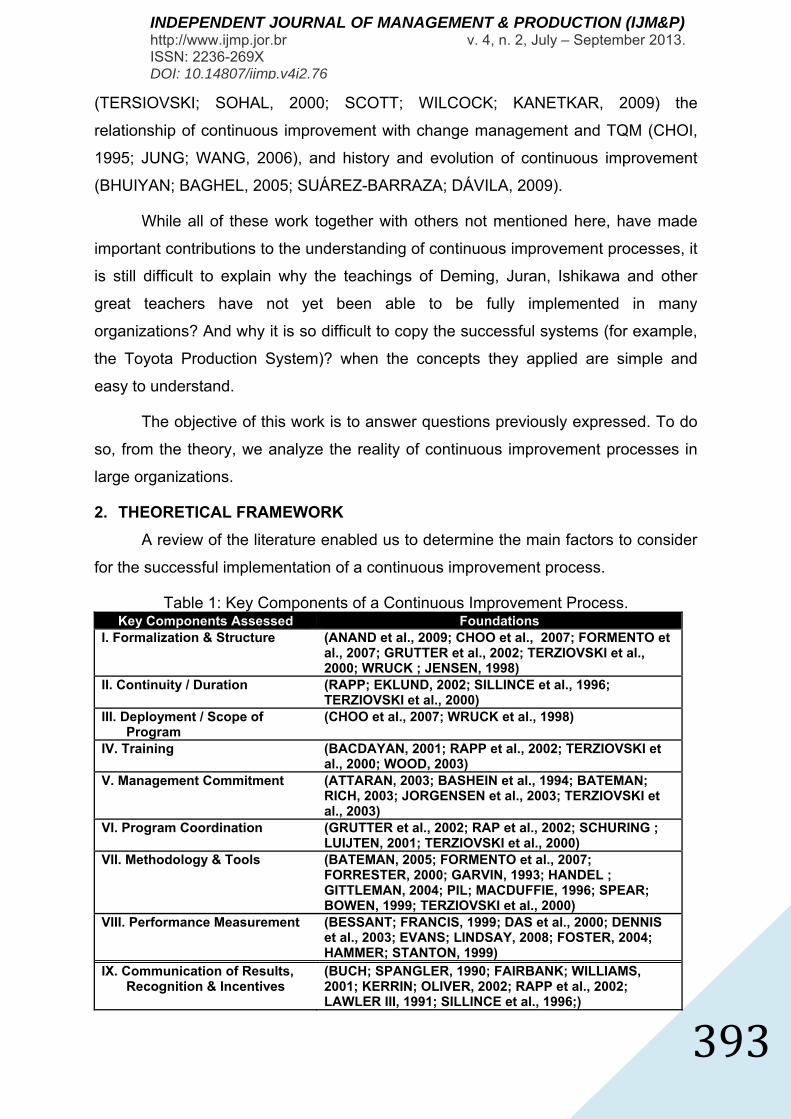
A review of the literature enabled us to determine the main factors to consider
for the successful implementation of a continuous improvement process.
Table 1: Key Components of a Continuous Improvement Process. Key Components Assessed Foundations
I. Formalization & Structure
(ANAND et al., 2009; CHOO et al., 2007; FORMENTO et al., 2007; GRUTTER et al., 2002; TERZIOVSKI et al., 2000; WRUCK ; JENSEN, 1998)
II. Continuity / Duration (RAPP; EKLUND, 2002; SILLINCE et al., 1996; TERZIOVSKI et al., 2000)
III. Deployment / Scope of Program
(CHOO et al., 2007; WRUCK et al., 1998)
IV. Training (BACDAYAN, 2001; RAPP et al., 2002; TERZIOVSKI et al., 2000; WOOD, 2003)
V. Management Commitment
(ATTARAN, 2003; BASHEIN et al., 1994; BATEMAN; RICH, 2003; JORGENSEN et al., 2003; TERZIOVSKI et al., 2003)
VI. Program Coordination (GRUTTER et al., 2002; RAP et al., 2002; SCHURING ; LUIJTEN, 2001; TERZIOVSKI et al., 2000)
VII. Methodology & Tools
(BATEMAN, 2005; FORMENTO et al., 2007; FORRESTER, 2000; GARVIN, 1993; HANDEL ; GITTLEMAN, 2004; PIL; MACDUFFIE, 1996; SPEAR; BOWEN, 1999; TERZIOVSKI et al., 2000)
VIII. Performance Measurement
(BESSANT; FRANCIS, 1999; DAS et al., 2000; DENNIS et al., 2003; EVANS; LINDSAY, 2008; FOSTER, 2004; HAMMER; STANTON, 1999)
IX. Communication of Results, Recognition & Incentives
(BUCH; SPANGLER, 1990; FAIRBANK; WILLIAMS, 2001; KERRIN; OLIVER, 2002; RAPP et al., 2002; LAWLER III, 1991; SILLINCE et al., 1996;)
INDEPENDENT JOURNAL OF MANAGEMENT & PRODUCTION (IJM&P) http://www.ijmp.jor.br v. 4, n. 2, July – September 2013. ISSN: 2236-269X DOI: 10.14807/ijmp.v4i2.76
394
The following table summarizes references from previous works that support
the key components evaluated in our investigation.
I. Formalization & Structure
In the absence of a formalized program, continuous improvement efforts are
intermittent and depend on personal attitudes and circumstantial pressures.
Formalization generates the field needed to create the support structure and
establish the routines mentioned by Bessant et al. (2001) in their five evolutionary
stages of process improvement. Without formalization and structure, it is impossible
to move beyond the first level of evolution.
II. Continuity / Duration
A continuous improvement process—as the name implies—has no end to it. In
contrast, improvement routines are expected to be integrated into the organization’s
daily activities and used to generate results in line with the firm’s strategic objectives.
The most prominent examples—such as the Toyota Production System—are stable
and facilitate the spread of practices through the company (GARCÍA-SABATER et
al., 2009).
The inability to maintain continuity creates a very negative impact on
employees and has a limited duration (between one and four years) after going
through three phases: introduction, spread, and decline. The reasons for this are
diverse, but are generally related to static programs with no capacity for development
(LAWLER III, 1991; SILLINCE et al., 1996). Sometimes there is a fourth phase in
which the improvement effort is relaunched (RAPP et al., 2002). Regarding this same
idea, Wu et al. (2006) argue that all activities (including improvements) have a life
cycle which moves through introduction, growth, maturity, and decline. If a
regenerative impulse is not achieved at the appropriate time, the program declines.
III. Deployment / Scope of Program
If continuous improvement is inadequately deployed and poorly coordinated,
the process becomes less effective, even after achieving some initial results (CHOO
et al., 2007; WRUCK et al., 1998).
Continuity is important, but another critical factor is the way processes are
deployed in order for improvement routines to reach all levels of the organization.
The systemic approach (DEMING, 1993) requires that different processes are viewed
INDEPENDENT JOURNAL OF MANAGEMENT & PRODUCTION (IJM&P) http://www.ijmp.jor.br v. 4, n. 2, July – September 2013. ISSN: 2236-269X DOI: 10.14807/ijmp.v4i2.76
395
as part of a global system where the final result depends on the quality of the
interactions between them. In this sense, it is unthinkable for continuous
improvement to work without the integration of all sectors and processes.
IV. Training
Modifying the classic structure of problem-solving using trial and error—based
on individual experience—to the scientific method—using teams—requires specific
training in methodologies and tools for analysis.
In addition to the need of large-scale training, it is reasonable to start with
upper management and focus on the agents of change, which will generate a big
impact on the process (SPEAR et al., 1999; SPEAR, 2004). Several studies highlight
the importance of implementing training in basic tools and of moving toward new
tools as soon as more complex problems make them necessary (BACDAYAN, 2001;
RAPP et al., 2002; TERZIOVSKI et al., 2000; WOOD, 2003).
V. Management Commitment
Management commitment is needed so that participation and teamwork
become part of the organizational culture (ATTARAN, 2003; BASHEIN; MARKUS;
RILEY, 1994; JORGENSEN; BOER; GERTSEN, 2003; TERZIOVSKI; FITZPATRICK;
O’NEILL, 2003).
It is not possible to develop a continuous improvement program without a
strong commitment from top and senior management. Directors must agree to
commit the required resources; align activities with strategic objectives; establish
systems, procedures, and policies; and, most importantly, generate a culture of
continuous improvement (GARCÍA-SABATER et al., 2009).
VI. Program Coordination
The promotion of continuous improvement within the organizational routine
requires actors which facilitate this within day-to-day activities. This role goes beyond
specific team leaders and refers to the figure of one or more internal coordinators
who support activities, facilitating access to resources and to providing
methodological advice to team members (GARCÍA-SABATER et al., 2009).
VII. Methodology & Tools
The existence of a common scientific method is vital, and should include a
predetermined routine of steps for the development of improvement projects
INDEPENDENT JOURNAL OF MANAGEMENT & PRODUCTION (IJM&P) http://www.ijmp.jor.br v. 4, n. 2, July – September 2013. ISSN: 2236-269X DOI: 10.14807/ijmp.v4i2.76
396
(FORRESTER, 2000; GARVIN, 1993; SPEAR et al., 1999). A formalized
methodology enables a common working basis on which to developing changes
(BATEMAN, 2005).
This systematic analysis process replaces the traditional trial-and-error
approach to problem-solving.
A previous study of Australian firms by Terziovski et al. (2000) shows that
these companies still prefer the seven basic tools over more advanced ones such as
Failure Mode and Effect Analysis (FMEA) and Quality Function Deployment (QFD).
Another study conducted in Argentina demonstrates the ongoing use of the
PDCA cycle and methods derived from it in a high percentage of improvement
projects. The Six Sigma methodology is an alternative, using DMAIC cycle, and
currently applied in lower percentage of cases. Both methods apply the 7 basic tools,
which remain the most widely used (FORMENTO, 2008).
VIII. Performance Measurement
The development of continuous improvement capacities requires a process of
monitoring and measuring results against the strategic objectives of the firm
(BESSANT; FRANCIS, 1999).
Continuous improvement is based on continuous assessment techniques
applied to systems, processes, and key results (DAS; HANDFIELD; CALANTONE;
GHOSH, 2000; DENNIS; CARTE; KELLY, 2003; EVANS et al., 2008; FOSTER,
2004; HAMMER et al., 1999).
IX. Communication of Results, Recognition, and Incentives
The experiences feedback within a continuous improvement program allows
the building, analyzing, and facilitating of the exchange of knowledge between
experts in problems solving (JABROUNI; KAMSU-FOGUEM; GENESTE; VAYSSE,
2011). When teams show their results for internal events, the knowledge they have
developed is deployed beyond their own team members and applied to the whole
organization. Additionally, in cases of external events, showing the successful results
of a project operates as a motivational factor.
Significant contributions—measured in terms of their impact on results—are
usually rewarded. These recognition programs can take different forms but always
INDEPENDENT JOURNAL OF MANAGEMENT & PRODUCTION (IJM&P) http://www.ijmp.jor.br v. 4, n. 2, July – September 2013. ISSN: 2236-269X DOI: 10.14807/ijmp.v4i2.76
397
attempt to reinforce and spread positive attitudes (BUCH et al., 1990; KERRIN et al.,
2002; LAWLER III, 1991; RAPP et al., 2002; SILLINCE et al., 1996;).
3. METHODOLOGY
A qualitative and exploratory research design was undertaken in order to
determine prominent components of key factors who explain the success of a
continuous improvement program.
We analyzed, through an in-depth survey, a group of 30 large companies
pertaining to the following activities: oil (5), foodstuffs (8), steel (5), automotive (4),
chemicals (4) and services (4).
Companies considered for this study were chosen based on the following
criteria:
• Large companies (more than $ 25 million in annual sales).
• Leaders in their markets (considering their market share).
• Members of SAMECO (Argentine Society for Continuous Improvement) or
FUNDECE (Business Foundation for Quality and Excellence).
• With a certified management system (ISO 9001, ISO 14001 or other
specific norms of the activity.
The survey form was designed based on the theoretical framework for the
project, which was made up of the classical literature on continuous improvement,
placing emphasis on the key components described above.
The resulting survey included 67 questions, 20 of which were multiple choice.
The survey was sent by e-mail to the continuous improvement coordinator of 52
companies. After telephone follow-up, response was obtained in 30 firms.
The rating of the results obtained, by the continuous improvement process, in
each company was taken from the vision of the coordinator. The options were: very
effective results, effective results, scarce results and ineffective results.
Survey results were processed statistically and stratified to display trends. The
comments in open questions were discussed qualitatively to find signs of significant
differences.
Finally we compared the answers and comments in companies with very
effective results, by one side, with companies with scarce and ineffective results, by
INDEPENDENT JOURNAL OF MANAGEMENT & PRODUCTION (IJM&P) http://www.ijmp.jor.br v. 4, n. 2, July – September 2013. ISSN: 2236-269X DOI: 10.14807/ijmp.v4i2.76
398
the other side. Differences that emerged from this comparison enabled us to identify
prominent components, inside the key factors, that seem to be critical, for achieving
successful continuous improvement processes.
4. OBSERVED RESULTS
4.1 Sample Profile
Firms for this study correspond to the group called large companies, according
to their billing levels and market share. Previous investigations in Argentina
(FORMENTO; BRAIDOT; PITTALIGA, 2007), shows that companies of this size were
the first to implement continuous improvement. Making a survey of the presentations
made at the annual conference SAMECO (Argentina Society for Continuous
Improvement), over 15 years, it appears that continuous improvement processes of
these companies are among the most advanced in Argentina. The latter aspect is
especially important to this study as it allows us to determine trends in the field.
Another feature of this group is that all companies have a certified
management system. In addition, 18 companies have two or more certified
standards, and 14 companies have an integrated management system.
Additionally, eight of these companies have won quality awards, including a
National Quality Award of Argentina, the Iberoamerican Quality Award, the prize TPM
in Japan, and the International Team Excellence Award of the American Society for
Quality. These data confirm the level of the sample in terms of formal achievements
in the field of quality systems, both locally and internationally.
4.2 Findings on Key Factors
I. Formalization & Structure
At first glance, it would appear that there are few doubts, among firms,
regarding the need for the existence of continuous improvement, given that 28
companies of the sample said that they have a formalized program. This contrasts
strongly with a previous study of Argentinian SMEs (FORMENTO; ALTUBE;
BRAIDOT; NICOLINI, 2006), which showed that there are improvement teams within
only 36% of companies in the automotive sector, 17% in the steel sector, and around
10% in other sectors.
INDEPENDENT JOURNAL OF MANAGEMENT & PRODUCTION (IJM&P) http://www.ijmp.jor.br v. 4, n. 2, July – September 2013. ISSN: 2236-269X DOI: 10.14807/ijmp.v4i2.76
399
II. Continuity / Duration
The average age of the continuous improvement programs evaluated in this
research is nine years. In 14 cases, programs were over 10 years old, and two firms
had programs with more than 20 years.
This confirms that we are evaluating a set of pioneers in the field in Argentina.
These kinds of programs first started to be developed in Argentina in the late 1980s.
Of all the companies that claim to have implemented a continuous
improvement program, five of them said they had discontinued at some point. The
same number of companies acknowledged that the continuous improvement
program had not evolved within their organizations, which in principle could be
considered a negative feature.
The main characteristics mentioned as evolving positively were: scope,
results, number of projects, and people involved.
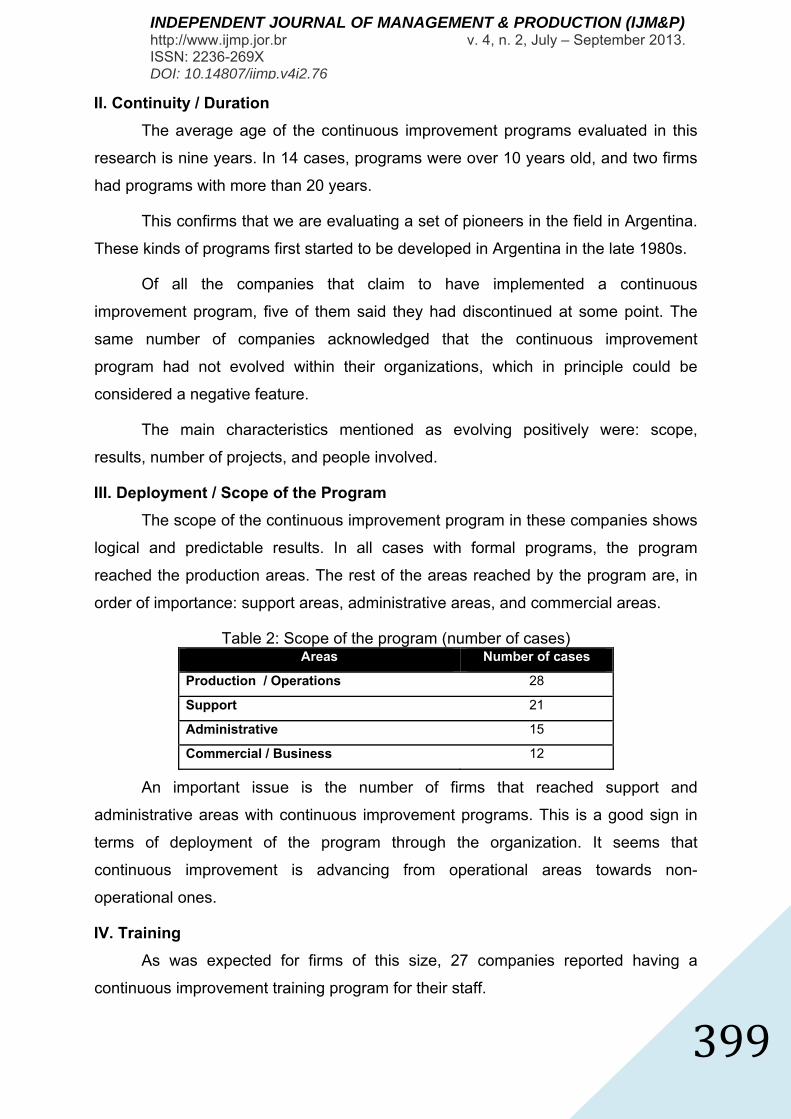
III. Deployment / Scope of the Program
The scope of the continuous improvement program in these companies shows
logical and predictable results. In all cases with formal programs, the program
reached the production areas. The rest of the areas reached by the program are, in
order of importance: support areas, administrative areas, and commercial areas.
Table 2: Scope of the program (number of cases) Areas Number of cases
Production / Operations 28
Support 21
Administrative 15
Commercial / Business 12
An important issue is the number of firms that reached support and
administrative areas with continuous improvement programs. This is a good sign in
terms of deployment of the program through the organization. It seems that
continuous improvement is advancing from operational areas towards non-
operational ones.
IV. Training
As was expected for firms of this size, 27 companies reported having a
continuous improvement training program for their staff.
INDEPENDENT JOURNAL OF MANAGEMENT & PRODUCTION (IJM&P) http://www.ijmp.jor.br v. 4, n. 2, July – September 2013. ISSN: 2236-269X DOI: 10.14807/ijmp.v4i2.76
400
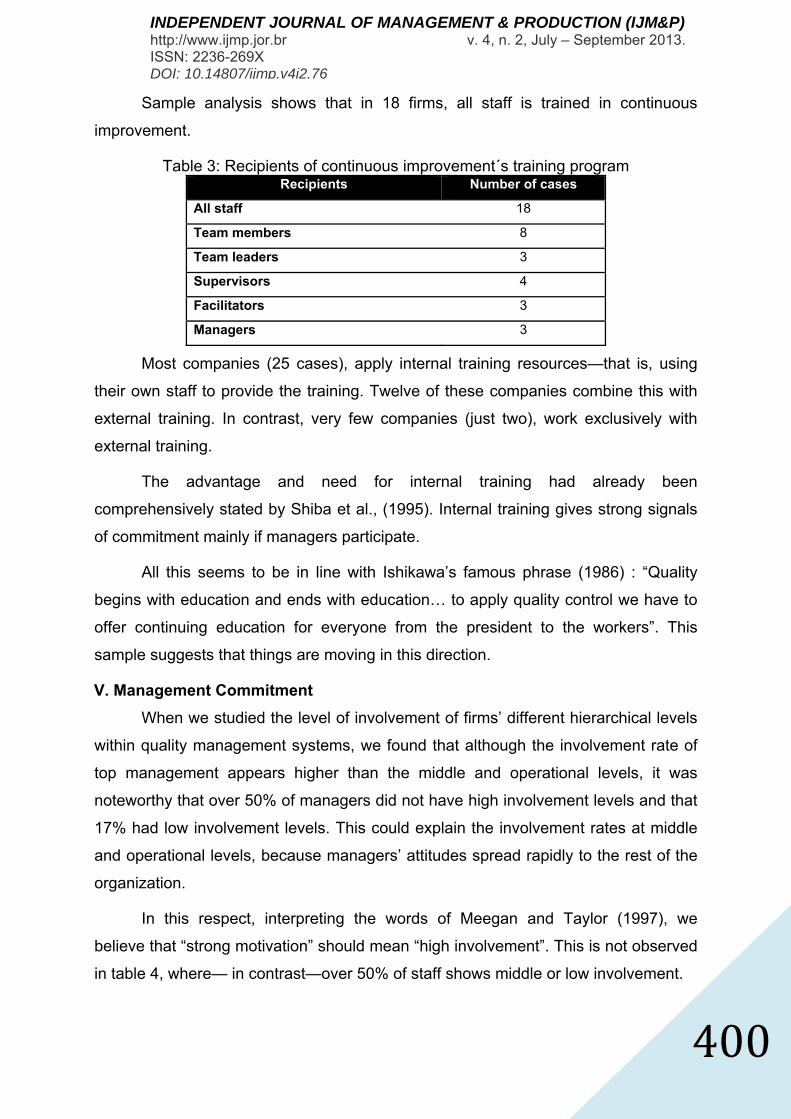
Sample analysis shows that in 18 firms, all staff is trained in continuous
improvement.
Table 3: Recipients of continuous improvement´s training program Recipients Number of cases
All staff 18
Team members 8
Team leaders 3
Supervisors 4
Facilitators 3
Managers 3
Most companies (25 cases), apply internal training resources—that is, using
their own staff to provide the training. Twelve of these companies combine this with
external training. In contrast, very few companies (just two), work exclusively with
external training.
The advantage and need for internal training had already been
comprehensively stated by Shiba et al., (1995). Internal training gives strong signals
of commitment mainly if managers participate.
All this seems to be in line with Ishikawa’s famous phrase (1986) : “Quality
begins with education and ends with education… to apply quality control we have to
offer continuing education for everyone from the president to the workers”. This
sample suggests that things are moving in this direction.
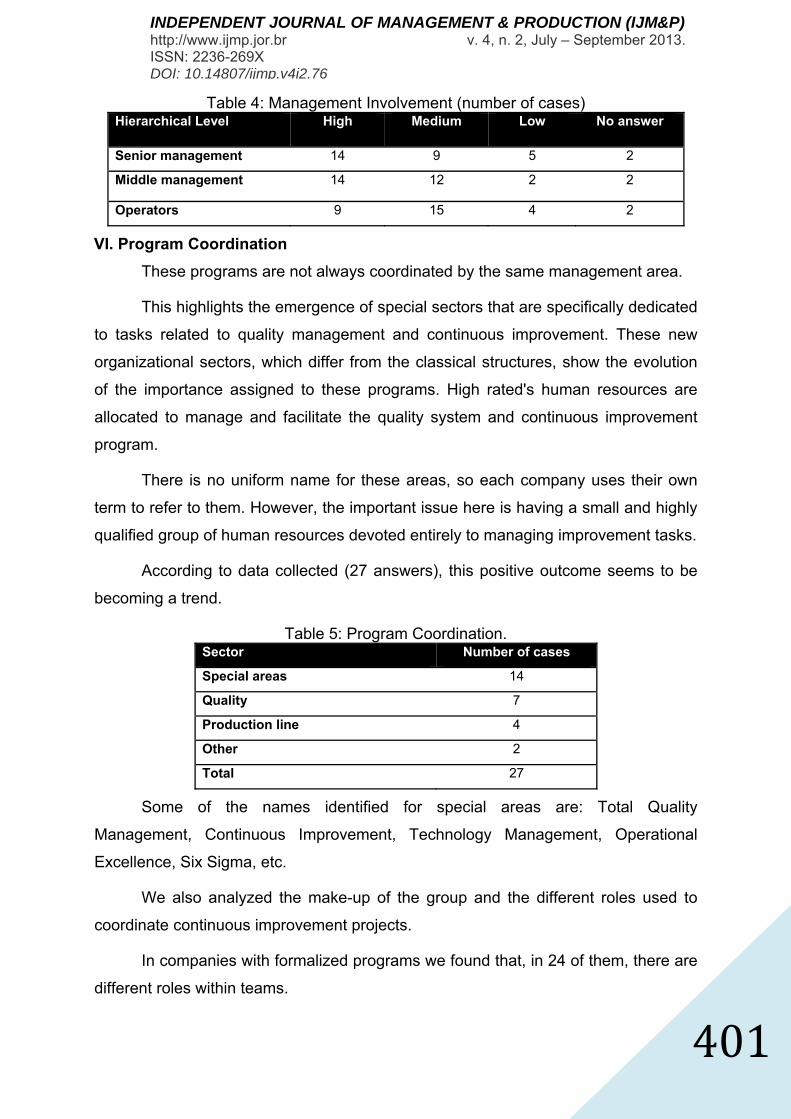
V. Management Commitment
When we studied the level of involvement of firms’ different hierarchical levels
within quality management systems, we found that although the involvement rate of
top management appears higher than the middle and operational levels, it was
noteworthy that over 50% of managers did not have high involvement levels and that
17% had low involvement levels. This could explain the involvement rates at middle
and operational levels, because managers’ attitudes spread rapidly to the rest of the
organization.
In this respect, interpreting the words of Meegan and Taylor (1997), we
believe that “strong motivation” should mean “high involvement”. This is not observed
in table 4, where— in contrast—over 50% of staff shows middle or low involvement.
INDEPENDENT JOURNAL OF MANAGEMENT & PRODUCTION (IJM&P) http://www.ijmp.jor.br v. 4, n. 2, July – September 2013. ISSN: 2236-269X DOI: 10.14807/ijmp.v4i2.76
401
Table 4: Management Involvement (number of cases) Hierarchical Level High Medium Low No answer
Senior management 14 9 5 2
Middle management 14 12 2 2
Operators 9 15 4 2
VI. Program Coordination
These programs are not always coordinated by the same management area.
This highlights the emergence of special sectors that are specifically dedicated
to tasks related to quality management and continuous improvement. These new
organizational sectors, which differ from the classical structures, show the evolution
of the importance assigned to these programs. High rated's human resources are
allocated to manage and facilitate the quality system and continuous improvement
program.
There is no uniform name for these areas, so each company uses their own
term to refer to them. However, the important issue here is having a small and highly
qualified group of human resources devoted entirely to managing improvement tasks.
According to data collected (27 answers), this positive outcome seems to be
becoming a trend.
Table 5: Program Coordination. Sector Number of cases
Special areas 14
Quality 7
Production line 4
Other 2
Total 27
Some of the names identified for special areas are: Total Quality
Management, Continuous Improvement, Technology Management, Operational
Excellence, Six Sigma, etc.
We also analyzed the make-up of the group and the different roles used to
coordinate continuous improvement projects.
In companies with formalized programs we found that, in 24 of them, there are
different roles within teams.
INDEPENDENT JOURNAL OF MANAGEMENT & PRODUCTION (IJM&P) http://www.ijmp.jor.br v. 4, n. 2, July – September 2013. ISSN: 2236-269X DOI: 10.14807/ijmp.v4i2.76
402
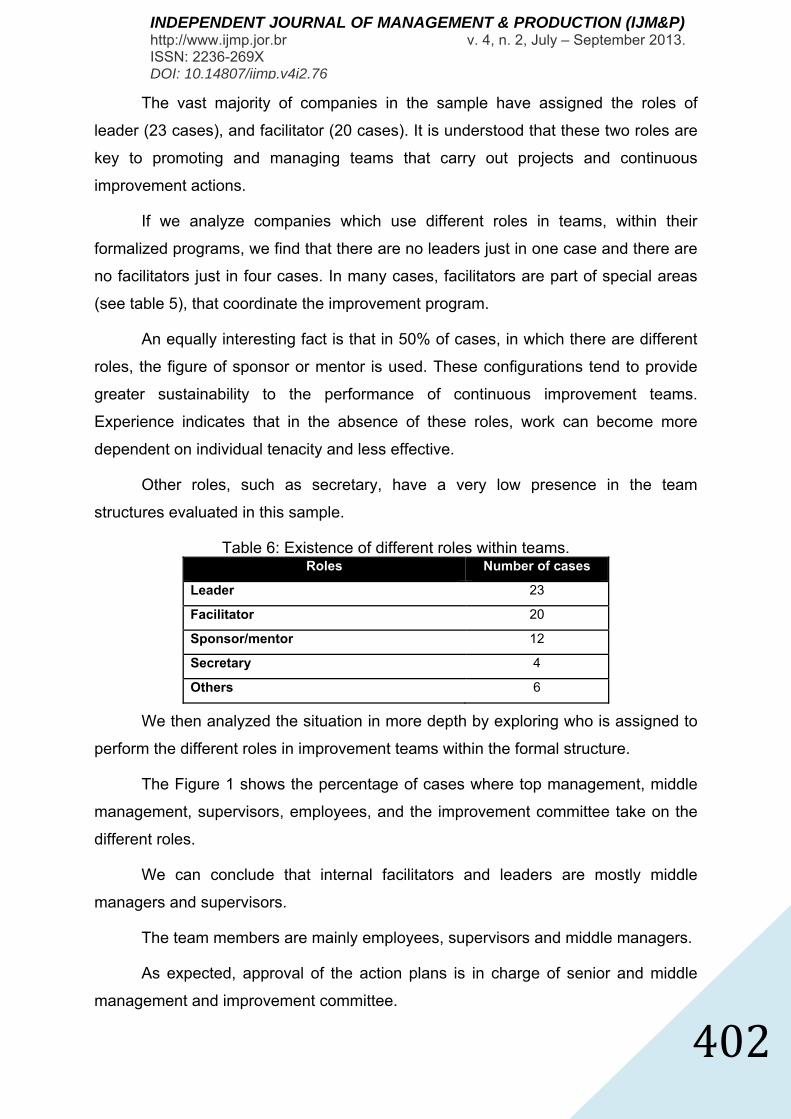
The vast majority of companies in the sample have assigned the roles of
leader (23 cases), and facilitator (20 cases). It is understood that these two roles are
key to promoting and managing teams that carry out projects and continuous
improvement actions.
If we analyze companies which use different roles in teams, within their
formalized programs, we find that there are no leaders just in one case and there are
no facilitators just in four cases. In many cases, facilitators are part of special areas
(see table 5), that coordinate the improvement program.
An equally interesting fact is that in 50% of cases, in which there are different
roles, the figure of sponsor or mentor is used. These configurations tend to provide
greater sustainability to the performance of continuous improvement teams.
Experience indicates that in the absence of these roles, work can become more
dependent on individual tenacity and less effective.
Other roles, such as secretary, have a very low presence in the team
structures evaluated in this sample.
Table 6: Existence of different roles within teams. Roles Number of cases
Leader 23
Facilitator 20
Sponsor/mentor 12
Secretary 4
Others 6
We then analyzed the situation in more depth by exploring who is assigned to
perform the different roles in improvement teams within the formal structure.
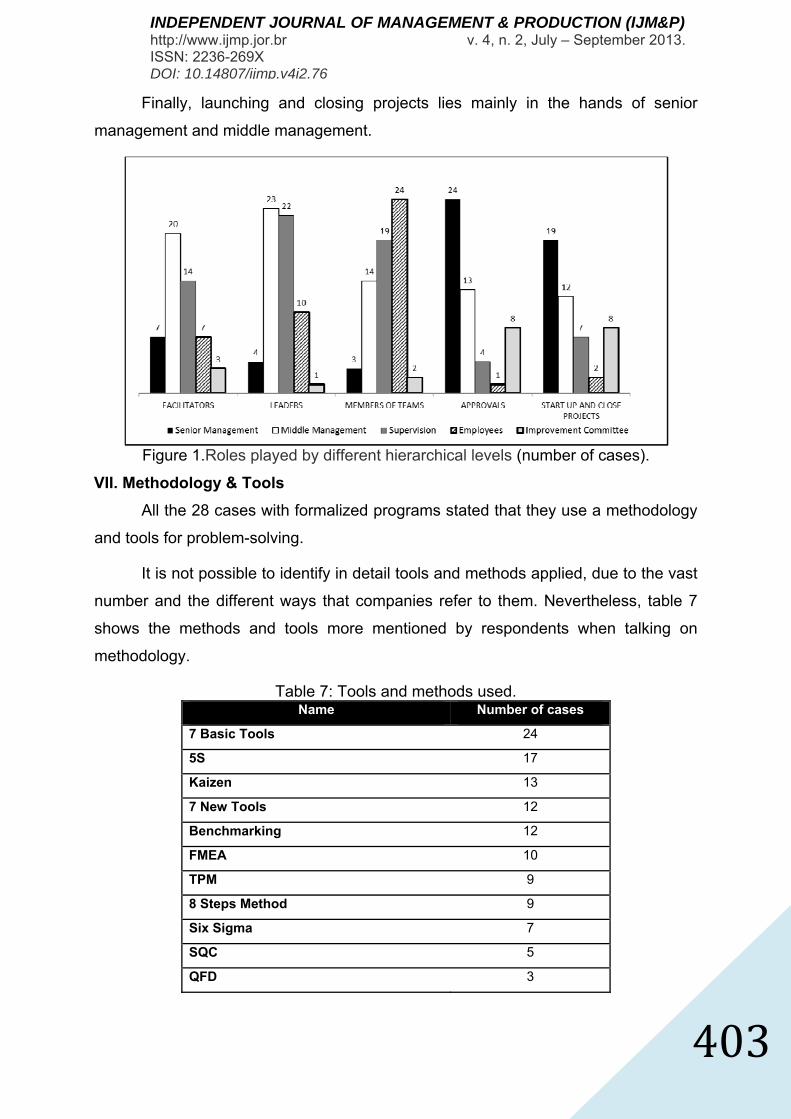
The Figure 1 shows the percentage of cases where top management, middle
management, supervisors, employees, and the improvement committee take on the
different roles.
We can conclude that internal facilitators and leaders are mostly middle
managers and supervisors.
The team members are mainly employees, supervisors and middle managers.
As expected, approval of the action plans is in charge of senior and middle
management and improvement committee.
INDEPENDENT JOURNAL OF MANAGEMENT & PRODUCTION (IJM&P) http://www.ijmp.jor.br v. 4, n. 2, July – September 2013. ISSN: 2236-269X DOI: 10.14807/ijmp.v4i2.76
403
Finally, launching and closing projects lies mainly in the hands of senior
management and middle management.
Figure 1.Roles played by different hierarchical levels (number of cases).
VII. Methodology & Tools
All the 28 cases with formalized programs stated that they use a methodology
and tools for problem-solving.
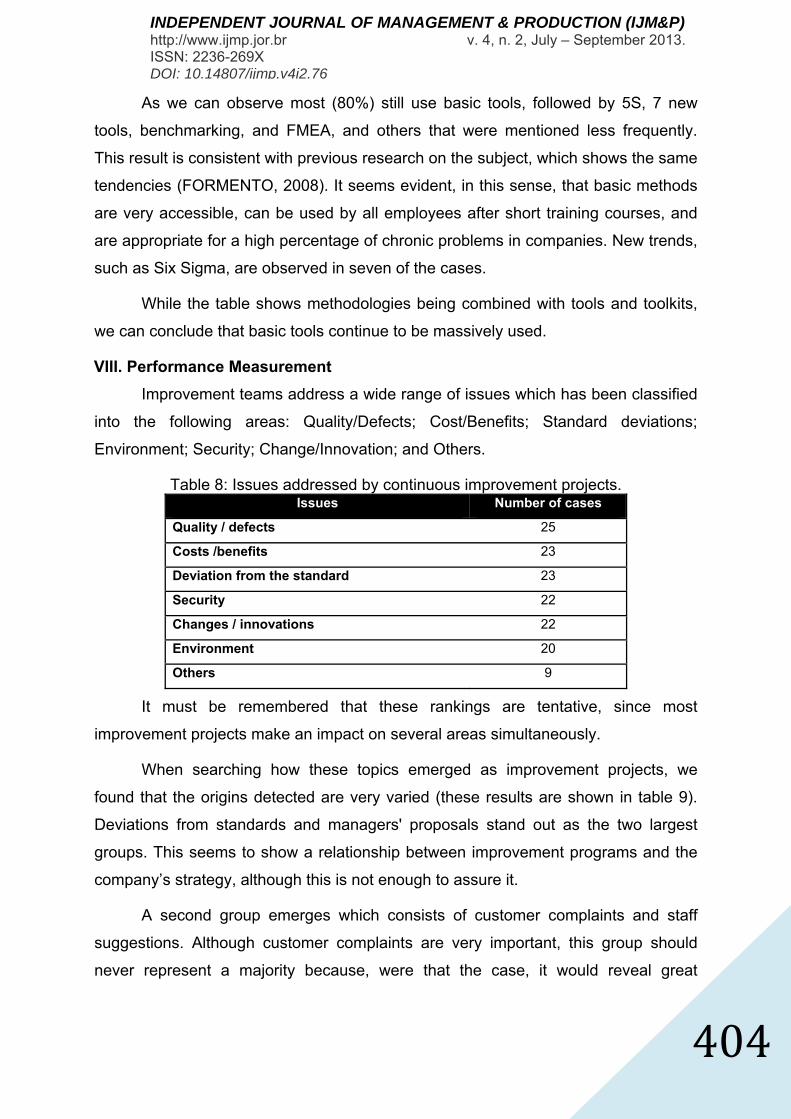
It is not possible to identify in detail tools and methods applied, due to the vast
number and the different ways that companies refer to them. Nevertheless, table 7
shows the methods and tools more mentioned by respondents when talking on
methodology.
Table 7: Tools and methods used. Name Number of cases
7 Basic Tools 24
5S 17
Kaizen 13
7 New Tools 12
Benchmarking 12
FMEA 10
TPM 9
8 Steps Method 9
Six Sigma 7
SQC 5
QFD 3
INDEPENDENT JOURNAL OF MANAGEMENT & PRODUCTION (IJM&P) http://www.ijmp.jor.br v. 4, n. 2, July – September 2013. ISSN: 2236-269X DOI: 10.14807/ijmp.v4i2.76
404
As we can observe most (80%) still use basic tools, followed by 5S, 7 new
tools, benchmarking, and FMEA, and others that were mentioned less frequently.
This result is consistent with previous research on the subject, which shows the same
tendencies (FORMENTO, 2008). It seems evident, in this sense, that basic methods
are very accessible, can be used by all employees after short training courses, and
are appropriate for a high percentage of chronic problems in companies. New trends,
such as Six Sigma, are observed in seven of the cases.
While the table shows methodologies being combined with tools and toolkits,
we can conclude that basic tools continue to be massively used.
VIII. Performance Measurement
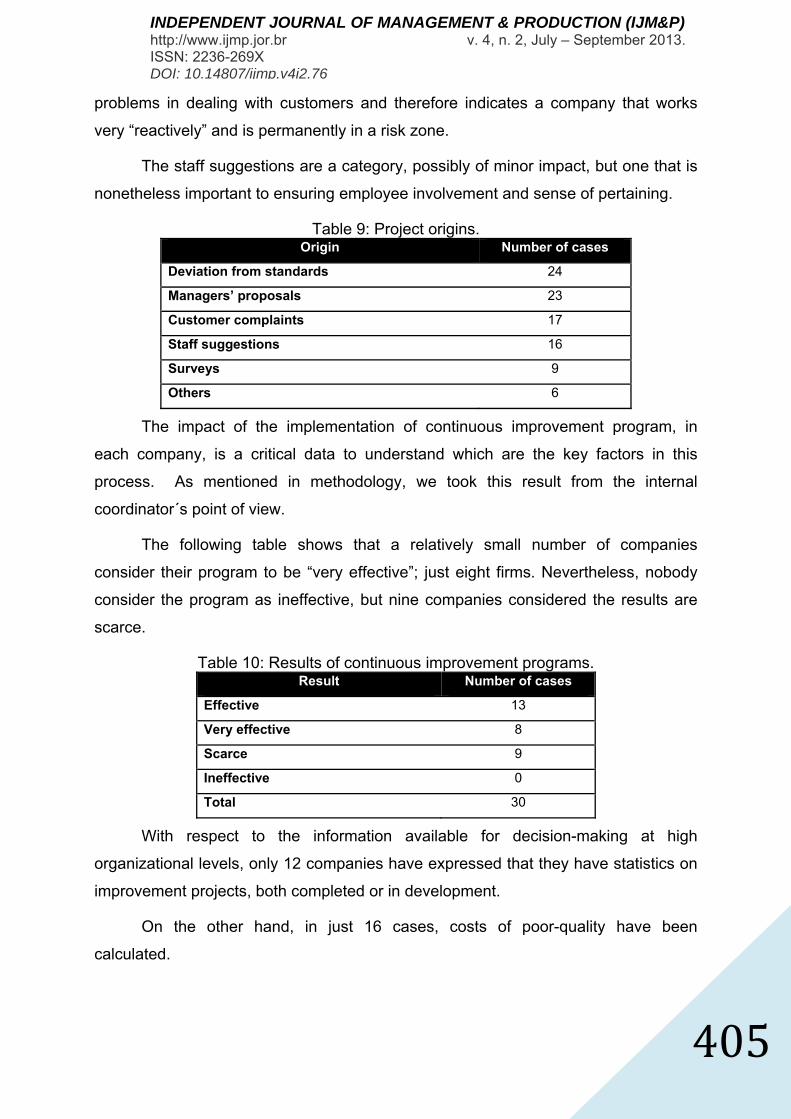
Improvement teams address a wide range of issues which has been classified
into the following areas: Quality/Defects; Cost/Benefits; Standard deviations;
Environment; Security; Change/Innovation; and Others.
Table 8: Issues addressed by continuous improvement projects. Issues Number of cases
Quality / defects 25
Costs /benefits 23
Deviation from the standard 23
Security 22
Changes / innovations 22
Environment 20
Others 9
It must be remembered that these rankings are tentative, since most
improvement projects make an impact on several areas simultaneously.
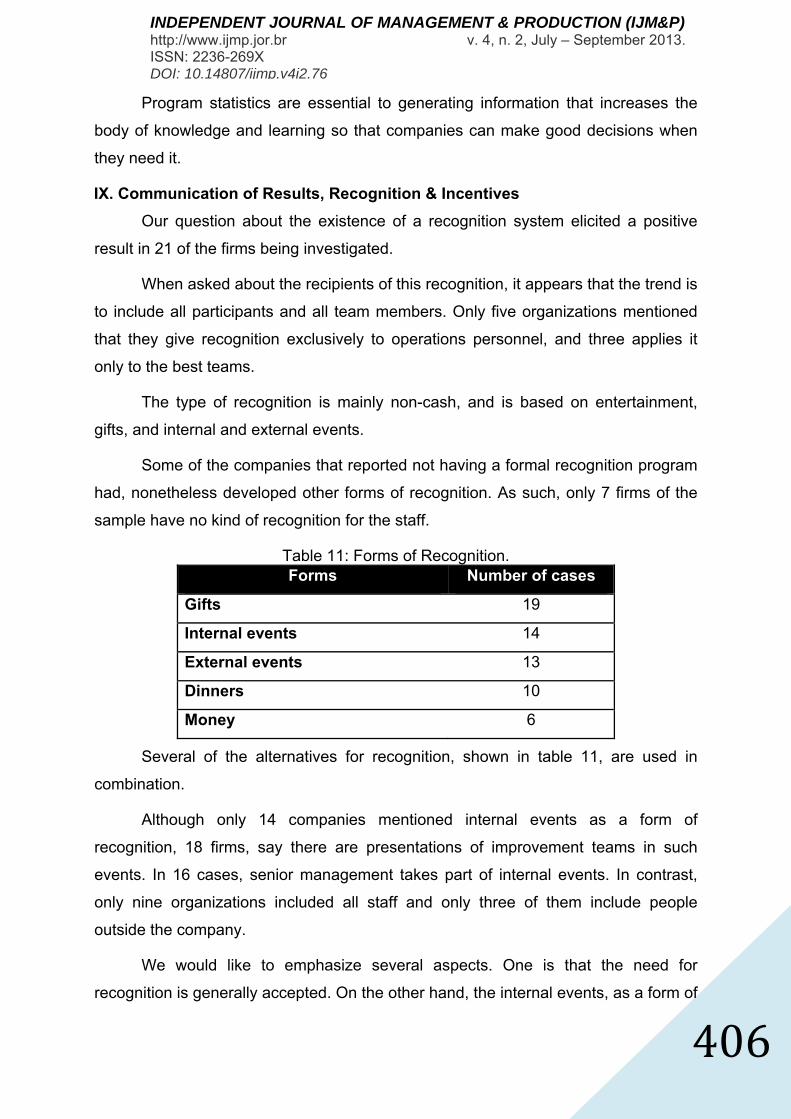
When searching how these topics emerged as improvement projects, we
found that the origins detected are very varied (these results are shown in table 9).
Deviations from standards and managers' proposals stand out as the two largest
groups. This seems to show a relationship between improvement programs and the
company’s strategy, although this is not enough to assure it.
A second group emerges which consists of customer complaints and staff
suggestions. Although customer complaints are very important, this group should
never represent a majority because, were that the case, it would reveal great
INDEPENDENT JOURNAL OF MANAGEMENT & PRODUCTION (IJM&P) http://www.ijmp.jor.br v. 4, n. 2, July – September 2013. ISSN: 2236-269X DOI: 10.14807/ijmp.v4i2.76
405
problems in dealing with customers and therefore indicates a company that works
very “reactively” and is permanently in a risk zone.
The staff suggestions are a category, possibly of minor impact, but one that is
nonetheless important to ensuring employee involvement and sense of pertaining.
Table 9: Project origins. Origin Number of cases
Deviation from standards 24
Managers’ proposals 23
Customer complaints 17
Staff suggestions 16
Surveys 9
Others 6
The impact of the implementation of continuous improvement program, in
each company, is a critical data to understand which are the key factors in this
process. As mentioned in methodology, we took this result from the internal
coordinator´s point of view.
The following table shows that a relatively small number of companies
consider their program to be “very effective”; just eight firms. Nevertheless, nobody
consider the program as ineffective, but nine companies considered the results are
scarce.
Table 10: Results of continuous improvement programs. Result Number of cases
Effective 13
Very effective 8
Scarce 9
Ineffective 0
Total 30
With respect to the information available for decision-making at high
organizational levels, only 12 companies have expressed that they have statistics on
improvement projects, both completed or in development.
On the other hand, in just 16 cases, costs of poor-quality have been
calculated.
INDEPENDENT JOURNAL OF MANAGEMENT & PRODUCTION (IJM&P) http://www.ijmp.jor.br v. 4, n. 2, July – September 2013. ISSN: 2236-269X DOI: 10.14807/ijmp.v4i2.76
406
Program statistics are essential to generating information that increases the
body of knowledge and learning so that companies can make good decisions when
they need it.
IX. Communication of Results, Recognition & Incentives
Our question about the existence of a recognition system elicited a positive
result in 21 of the firms being investigated.
When asked about the recipients of this recognition, it appears that the trend is
to include all participants and all team members. Only five organizations mentioned
that they give recognition exclusively to operations personnel, and three applies it
only to the best teams.
The type of recognition is mainly non-cash, and is based on entertainment,
gifts, and internal and external events.
Some of the companies that reported not having a formal recognition program
had, nonetheless developed other forms of recognition. As such, only 7 firms of the
sample have no kind of recognition for the staff.
Table 11: Forms of Recognition. Forms Number of cases
Gifts 19
Internal events 14
External events 13
Dinners 10
Money 6
Several of the alternatives for recognition, shown in table 11, are used in
combination.
Although only 14 companies mentioned internal events as a form of
recognition, 18 firms, say there are presentations of improvement teams in such
events. In 16 cases, senior management takes part of internal events. In contrast,
only nine organizations included all staff and only three of them include people
outside the company.
We would like to emphasize several aspects. One is that the need for
recognition is generally accepted. On the other hand, the internal events, as a form of
INDEPENDENT JOURNAL OF MANAGEMENT & PRODUCTION (IJM&P) http://www.ijmp.jor.br v. 4, n. 2, July – September 2013. ISSN: 2236-269X DOI: 10.14807/ijmp.v4i2.76
407
recognition, are only used in less than 50% of the sample, even in cases where
managers’ involvement is high.
Finally there is little external benchmarking, since less than 50% of sample
participate in external events and people of other companies are only invited to
internal team presentations in just three cases.
5. DISCUSSION OF FINDINGS
This section contains a comparative analysis of data.
We confront data from companies with very effective results with data from
companies with scarce results. The group of companies that qualifies only as
effective is not part of this comparison, to seek a better contrast between the
extremes.
The above remark is based on an understanding that the label “effective” is a
necessary but insufficient condition. In other words, if this type of initiative does not
generate enthusiasm, it will have limited consistency and its permanence will be in
doubt. It should be kept in mind that continuous improvement generates a permanent
stress (in terms of resource commitment) with companies’ daily routines.
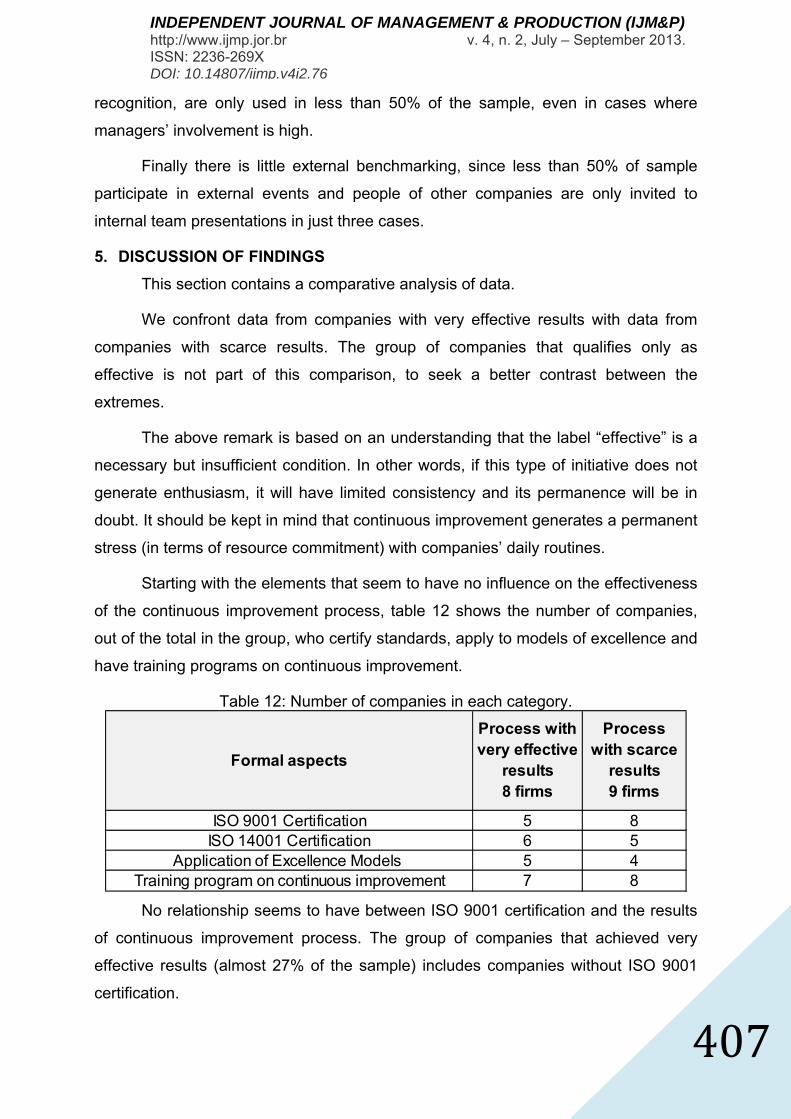
Starting with the elements that seem to have no influence on the effectiveness
of the continuous improvement process, table 12 shows the number of companies,
out of the total in the group, who certify standards, apply to models of excellence and
have training programs on continuous improvement.
Table 12: Number of companies in each category.
ISO 9001 Certification 5 8ISO 14001 Certification 6 5
Application of Excellence Models 5 4Training program on continuous improvement 7 8
Process with very effective
results 8 firms
Process with scarce
results 9 firms
Formal aspects
No relationship seems to have between ISO 9001 certification and the results
of continuous improvement process. The group of companies that achieved very
effective results (almost 27% of the sample) includes companies without ISO 9001
certification.
INDEPENDENT JOURNAL OF MANAGEMENT & PRODUCTION (IJM&P) http://www.ijmp.jor.br v. 4, n. 2, July – September 2013. ISSN: 2236-269X DOI: 10.14807/ijmp.v4i2.76
408
Likewise, there is no evidence that models of excellence and quality awards
ensure an adequate continuous improvement process. When we analyze the seven
cases, in the whole sample, that have won quality awards, it emerges that only three
of them have continuous improvement programs very effective, two qualify just as
merely effectives, one as scarce results, while the remaining do not have a
formalized program.
Additionally, the existence of a continuous improvement´s training program
does not seem to be an element that produce a difference on results.
From the above we conclude that the systems and strategies mentioned
(certification and models), and the training programs are desirable but do not ensure
a very effective continuous improvement process.
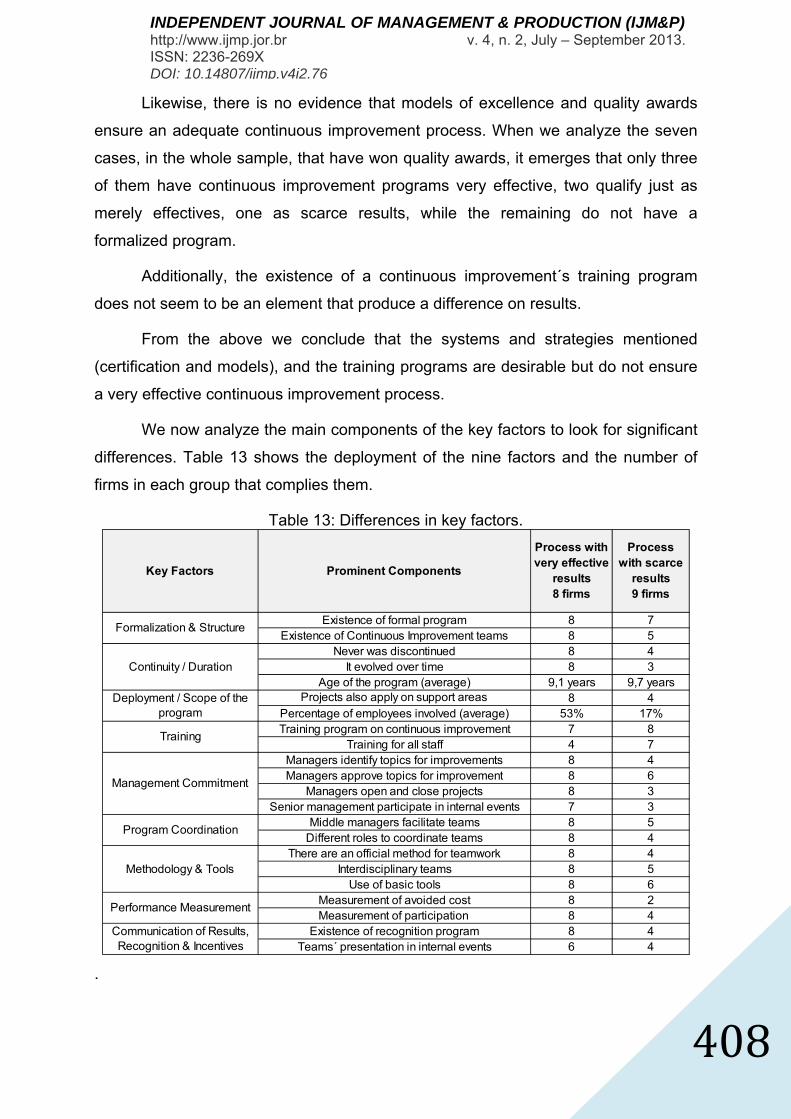
We now analyze the main components of the key factors to look for significant
differences. Table 13 shows the deployment of the nine factors and the number of
firms in each group that complies them.
Table 13: Differences in key factors.
Existence of formal program 8 7Existence of Continuous Improvement teams 8 5
Never was discontinued 8 4It evolved over time 8 3
Age of the program (average) 9,1 years 9,7 yearsProjects also apply on support areas 8 4
Percentage of employees involved (average) 53% 17%Training program on continuous improvement 7 8
Training for all staff 4 7Managers identify topics for improvements 8 4Managers approve topics for improvement 8 6
Managers open and close projects 8 3Senior management participate in internal events 7 3
Middle managers facilitate teams 8 5Different roles to coordinate teams 8 4
There are an official method for teamwork 8 4Interdisciplinary teams 8 5
Use of basic tools 8 6Measurement of avoided cost 8 2Measurement of participation 8 4
Existence of recognition program 8 4Teams´ presentation in internal events 6 4
Program Coordination
Methodology & Tools
Performance Measurement
Communication of Results, Recognition & Incentives
Formalization & Structure
Continuity / Duration
Deployment / Scope of the program
Training
Management Commitment
Key Factors Prominent Components
Process with very effective
results 8 firms
Process with scarce
results 9 firms
.
INDEPENDENT JOURNAL OF MANAGEMENT & PRODUCTION (IJM&P) http://www.ijmp.jor.br v. 4, n. 2, July – September 2013. ISSN: 2236-269X DOI: 10.14807/ijmp.v4i2.76
409
The table shows another component that does not impact the difference in
results: the duration of the process. This means that a continuous improvement
program can exist for a long time and still have poor results.
Looking for components that can explain the differences we observed a
number of items present in 100% of companies with very effective results. These
items appear only in some of the companies with scarce results.
However, all components are present in some company of the second group.
Therefore, a question that arises is: any of these companies meets all the key
factors?.
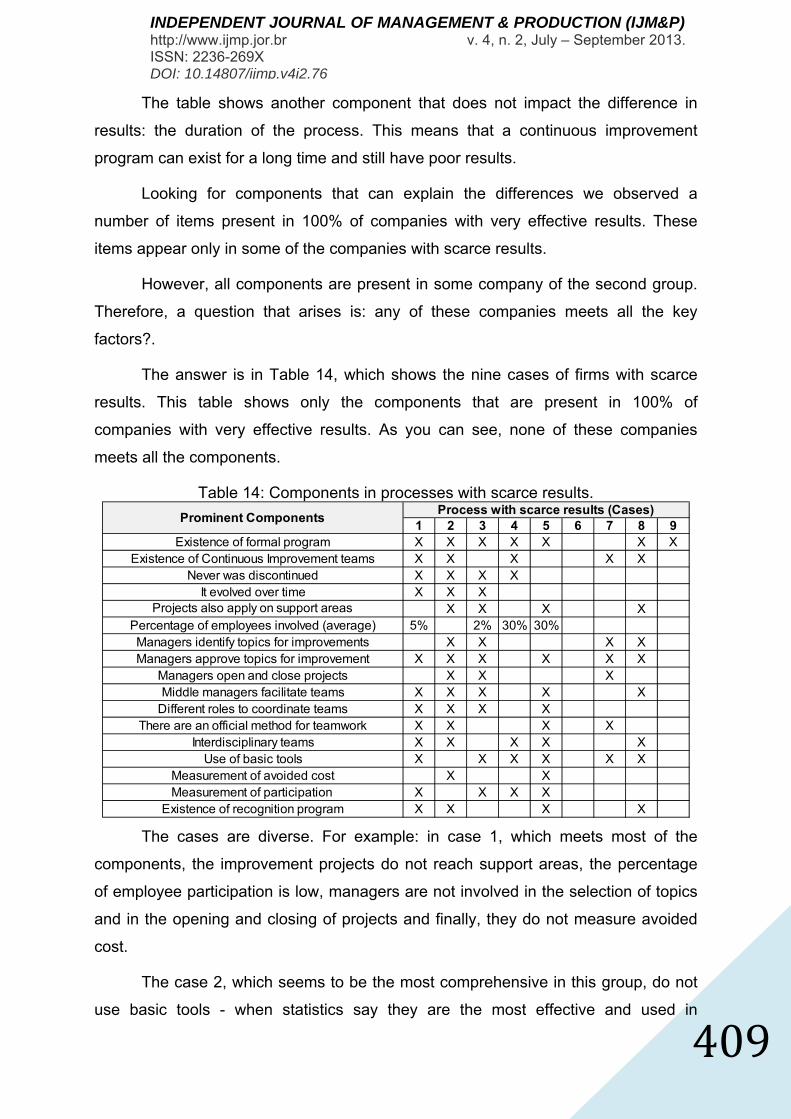
The answer is in Table 14, which shows the nine cases of firms with scarce
results. This table shows only the components that are present in 100% of
companies with very effective results. As you can see, none of these companies
meets all the components.
Table 14: Components in processes with scarce results.
1 2 3 4 5 6 7 8 9Existence of formal program X X X X X X X
Existence of Continuous Improvement teams X X X X XNever was discontinued X X X X
It evolved over time X X XProjects also apply on support areas X X X X
Percentage of employees involved (average) 5% 2% 30% 30%Managers identify topics for improvements X X X XManagers approve topics for improvement X X X X X X
Managers open and close projects X X XMiddle managers facilitate teams X X X X X
Different roles to coordinate teams X X X XThere are an official method for teamwork X X X X
Interdisciplinary teams X X X X XUse of basic tools X X X X X X
Measurement of avoided cost X XMeasurement of participation X X X X
Existence of recognition program X X X X
Process with scarce results (Cases)Prominent Components
The cases are diverse. For example: in case 1, which meets most of the
components, the improvement projects do not reach support areas, the percentage
of employee participation is low, managers are not involved in the selection of topics
and in the opening and closing of projects and finally, they do not measure avoided
cost.
The case 2, which seems to be the most comprehensive in this group, do not
use basic tools - when statistics say they are the most effective and used in
INDEPENDENT JOURNAL OF MANAGEMENT & PRODUCTION (IJM&P) http://www.ijmp.jor.br v. 4, n. 2, July – September 2013. ISSN: 2236-269X DOI: 10.14807/ijmp.v4i2.76
410
continuous improvement projects - and do not recorded or measured participation.
The latter suggests that may be low.
Completely different from Case 2 is the case 6, where none of evaluated
components are present. Interestingly, this company is certified ISO 9001, ISO
14001 and won the national quality award of Argentina.
In summary, all these cases have shortcomings with respect to very effective
processes. Cases 3 and 4, do not have recognition program and a standardized
method for teamwork, among other difficulties.
In case 5, we see: discontinuity, lack of evolution and poor managerial
involvement.
Finally in cases 7 to 9, appear as common shortcomings lack of: continuity,
evolution, measurements and roles in teams.
6. CONCLUSIONS
The observations above enable us to draw some preliminary conclusions,
which must be confirmed or refuted in future research.
On the basis of the findings discussed in the previous sections, we can infer
that approximately one in three large companies have a continuous improvement
program with very effective results. This means that they have developed high
standards and are thus benchmarks for other companies, even though they still need
to develop further themselves.
It seems evident from previous comparison that the prominent components
identified, into the nine key factors, make a difference in terms of the effectiveness of
results. Table 14 shows the seventeen mentioned components.
Companies with continuous improvement processes very effective, in 100% of
cases, meet all these components. In contrast, none of the companies with poor
results meets all prominent components.
From Table 13 it appears that the most remarkable differences are observed
in:
Measurement (avoided cost and participation)
Percentage of employees involved
Management participation
INDEPENDENT JOURNAL OF MANAGEMENT & PRODUCTION (IJM&P) http://www.ijmp.jor.br v. 4, n. 2, July – September 2013. ISSN: 2236-269X DOI: 10.14807/ijmp.v4i2.76
411
Recognition
Projects applying to support areas
Continuity
Different roles in teams
Standard method for teamwork
To summarize, we recommend establishing lines of work which take into
account the nine key factors and, specially, the seventeen prominent components
mentioned in the previous paragraph, since they seem to explain the difference
between very effective and ineffective processes.
It is important to clarify that the presence of a key factor or a prominent
component in a company that did not experience very effective results does not
contradict our findings, since the key factors and their components operate together,
as a system. Therefore the appearance of one of these factors alone does not
guarantee results.
The latter may apply to training, which has not been demonstrated to be a
differentiating factor. Training is a key factor (Table 13), of continuous improvement,
but it is as a necessary but insufficient condition. In other words, most of the firms in
the group with scarce results have a training program for continuous improvement,
which is fine, but the process lacks other key components which prevent them from
reaping the benefits of training.
While each organization must develop its own continuous improvement
strategy, a working plan oriented to these findings may increase the success
possibilities.
We understand this research contributes to the study of continuous
improvement processes in Argentina and could be of interest to develop more
effective strategies on the matter.
However, further research must confirm these findings and move forward on
the analysis of intangible factors, like: internal communications, internal climate,
culture, self reflexion, consensus, etc. Those factors could play an important role in
building a highly effective continuous improvement program in conjunction with the
ones here researched.
INDEPENDENT JOURNAL OF MANAGEMENT & PRODUCTION (IJM&P) http://www.ijmp.jor.br v. 4, n. 2, July – September 2013. ISSN: 2236-269X DOI: 10.14807/ijmp.v4i2.76
412
7. ACKNOWLEDGEMENT
The authors want to acknowledge the support provided by SAMECO
(Argentine society for continuous improvement), opening the access to a great
number of cases for study and the Industry Institute at the National University of
General Sarmiento where we developed our work during the two years of research.
REFERENCES
ALBORS GARRIGOS, J.; HERVAS OLIVER J. L.; SEGARRA OÑA, M. (2009) Análisis de las prácticas de mejora continua en España. Economía Industrial, n. 373, p. 185-195.
ANAND, G.; WARD, P.; TATIKONDA, M.; SHILLING, D. (2009) Dynamic capabilities through continuous improvement infrastructure. Journal of Operations Management, v. 27, n. 6, p. 444–461.
ATTARAN, M. (2003) Information technology and business-process redesign. Business Process Management Journal, v. 9, n. 4, p. 440–459.
BACDAYAN, P. (2001) Quality improvement teams that stall due to poor project selection: an exploration of contributing factors. Total Quality Management, v. 12, n. 5, p. 589–598.
BATEMAN, N. (2005) Sustainability: the elusive element of process improvement. International Journal of Operations & Production Management, v. 25, n. 3, p. 261–276.
BATEMAN, N.; RICH N. (2003) Companies’ perceptions of inhibitors and enablers for process improvement activities. International Journal of Operations & Production Management, v. 23, n. 2, p. 185–199.
BASHEIN, B.; MARKUS, L.; RILEY, P. (1994) Preconditions for BPR success and how to prevent failures. Information System Management, v. 11, n. 2, p. 7–13.
BESSANT, J.; CAFFYN, S.; GALLAGHER, M. (2001) An evolutionary model of continuous improvement behaviour. Technovation, v. 21, n. 2, p. 67–77.
BESSANT, J.; FRANCIS, D. (1999) Developing strategic continuous improvement capability. International Journal of Operations & Production Management, v. 19, n. 11, p. 1106–1119.
BHUIYAN, N.; BAGHEL, A. (2005) An overview of continuous improvement: from the past to the Present. Management Decision, v. 43, n. 5, p. 761–771.
BUCH, K.; SPANGLER, R. (1990) The effects of quality circles on performance and promotions. Human Relations, v. 43, n. 6, p. 573–582.
BUCKLER, B. (1996) A learning process model to achieve continuous improvement and innovation. The Learning Organization. V. 3, n. 3, p. 31-39.
CHOI, T. (1995) Conceptualizing continuous improvement: Implications for organizational change. Omega, v. 23, n. 6, p. 607-624.
CHOO, A.; LINDERMAN, K.; SCHROEDER, R. (2007) Method and context perspectives on learning and knowledge creation in quality management. Journal of Operations Management, v. 25, n. 4, p. 918–931.
INDEPENDENT JOURNAL OF MANAGEMENT & PRODUCTION (IJM&P) http://www.ijmp.jor.br v. 4, n. 2, July – September 2013. ISSN: 2236-269X DOI: 10.14807/ijmp.v4i2.76
413
DAS, A.; HANDFIELD, R.; CALANTONE, R.; GHOSH, S. (2000) A contingent view of quality management—the impact of international competition on quality. Decision Sciences, v. 31, n. 3, p. 649–690.
DAVISON, S.; GORDON, J. L.; ROBINSON, J. A. (2005) Studying continuous improvement from a knowledge perspective. Knowledge-Based Systems, v. 18, n. 4-5, p. 197-206.
DEMING, W. E. (1993) The new economics. Cambridge: MIT Center for advanced engineering study.
DENNIS, A.; CARTE, T.; KELLY, C. (2003) Breaking the rules: Success and failure in group-ware-supported BRP. Decision Support Systems, v. 36, n. 1, p. 31–48.
EVANS, J. R.; LINDSAY, W. R. (2008) Managing for quality and performance excellence. SW: Thomson.
FAIRBANK, J.; WILLIAMS, S. (2001) Motivating creativity and enhancing innovation through employee suggestion system technology. Creativity & Innovation Management, v. 10, n. 2, p. 68.
Formento, H. (2008). Tendencias en el uso de herramientas para mejora e innovación. Inaugural conference 13th congress of SAMECO-Argentine Society for Continuous Improvement. Buenos Aires: Oct., 2008. Available: http://mejoracontinuatotal.blogspot.com/2012/03/estadisticas-sobre-el-uso-de.html
FORMENTO, H.; ALTUBE, L.; BRAIDOT, N.; NICOLINI, J. (2006) Estudio sobre los resultados y la correlación de variables de un modelo diagnóstico específico para PyMEs aplicado a distintas áreas de actividad industrial. LITTEC IFI 2-Research´s laboratory on technology, work, enterprise and competitiveness (Research paper 2). Available: http://www.littec.ungs.edu.ar/pdfespa%F1ol/IFI%2002-2006%20Formento-Braidot-Nicollini-Altube.pdf
FORMENTO, H.; BRAIDOT, N.; PITTALUGA, J. (2007) El proceso de mejora continua en PyMEs Argentinas: Investigaciones y modelos posibles. Buenos Aires: UNGS.
FORMENTO, H.; BRAIDOT, N.; FARDELLI, C.; CUSOLITO, F. (2007) Equipos de mejora contínua: Reglas para trabajo en equipo y resolución de problemas. Buenos Aires: UNGS.
FORRESTER, R. (2000) Capturing learning and applying knowledge: an investigation of the use of innovation teams in Japanese and American automotive firms. Journal of Business Research, v. 47, n. 1, p. 35–45.
FOSTER, S. T. (2004) Managing Quality: An Integrative Approach. NY: Prentice Hall.
GARCÍA-SABATER, J.; MARIN-GARCIA, J. (2009) Facilitadores y barreras para la sostenibilidad de la mejora continua: Un estudio cualitativo en proveedores del automóvil de la Comunidad Valenciana. Intangible Capital, v. 5, n. 2, 183–209.
GARVIN, D. A. (1993) Building a learning organization. Harvard Business Review, v. 71, n. 4, p. 78–91.
GRUTTER, A.; FIELD, J.; FAULL, N. (2002) Work team performance over time: three case studies of South African manufacturers. Journal of Operations Management, v. 20, n. 5, p. 641–657.
INDEPENDENT JOURNAL OF MANAGEMENT & PRODUCTION (IJM&P) http://www.ijmp.jor.br v. 4, n. 2, July – September 2013. ISSN: 2236-269X DOI: 10.14807/ijmp.v4i2.76
414
HAMMER, M.; STANTON, S. (1999) How process enterprise really work. Harvard Business Review, v. 77, n. 6, p. 108–119.
HANDEL, M.; GITTLEMAN, M. (2004) Is there a wage payoff to innovative work practices?. Industrial Relations, v. 43, n. 1, p. 67–97.
IMAI, M. (1986) Kaizen: the key to Japan’s competitive success. NY: Random House.
ISHIKAWA, K. (1986) ¿Qué es el control total de calidad?: la modalidad Japonesa. Bogota: Norma.
JABROUNI, H.; KAMSU-FOGUEM, B.; GENESTE, L.; VAYSSE, C. (2011) Continuous improvement through knowledge-guided analysis in experience feedback. Engineering Applications of Artificial Intelligence, v. 24, n. 8, p. 1419-1431.
JORGENSEN, F.; BOER, H.; GERTSEN, F. (2003) Jump-starting continuous improvement through self-assessment. International Journal of Operations & Production Management, v. 23, n. 10, p. 1260–1278.
JUNG, J. Y.; WANG, Y. J. (2006) Relationship between total quality management (TQM) and continuous improvement of international project management (CIIPM). Technovation, v. 26, n. 5-6, p.716-722.
KERRIN, M.; OLIVER, N. (2002) Collective and individual improvement activities: the role of reward systems. Personnel review, v. 31, m. 3, p. 320–337.
LAWLER III, E. E. (1991) High involvement management. San Francisco: Jossey-Bass.
MARIN GARCIA, J. A.; PARDO DEL VAL, M. BONAVIA MARTIN, T. (2008) La mejora continua como innovación incremental. El caso de una empresa industrial española. Economía Industrial, n. 368, p. 155-167.
MEEGAN, S. T.; TAYLOR, W. A. (1997) Factors influencing a successful transition from ISO 9000 to TQM: the influence of understanding and motivation. International Journal of Quality & Reliability Management, v. 14, n. 2, p. 100-117.
MESQUITA, M.; ALLIPRANDINI, D. H. (2003) Competências essenciais para melhoria contínua da produção: estudo de caso em empresas da indústria de autopeças. Gestão & Produção, v.10, n.1, p.17-33.
MURRAY, P.; CHAPMAN, R. (2003) From continuous improvement to organizational learning. The Learning Organization, v. 10, n. 5, p. 272-282.
PIL, F.; MACDUFFIE, J. (1996) The adoption of high-involvement work practices. Industrial Relations, V. 35, N. 3, P. 423–455.
RAPP, C.; EKLUND, J. (2002) Sustainable development of improvement activities: the long-term operation of a suggestion scheme in a Swedish company. Total Quality Management, v. 13, n. 7, p. 945–969.
SAVOLAINEN, T.; HAIKONEN, A. (2007) Dynamics of organizational learning and continuous improvement in six sigma implementation. The TQM Magazine, v. 19, n. 1, p. 6–17.
INDEPENDENT JOURNAL OF MANAGEMENT & PRODUCTION (IJM&P) http://www.ijmp.jor.br v. 4, n. 2, July – September 2013. ISSN: 2236-269X DOI: 10.14807/ijmp.v4i2.76
415
SCHURING, R.; LUIJTEN, H. (2001) Reinventing suggestion systems for continuous improvement. International Journal of Technology Management, v. 22, n. 4, p. 359–372.
SCOTT, S. C.; WILCOCK, E. A.; KANETKAR, V. (2009) A survey of structured continuous improvement programs in the Canadian food sector. Food Control, v. 20, n. 3, p. 209-217.
SHIBA, S.; GRAHAM, A.; WALDEN, D. (1995) TQM desarrollos avanzados. Madrid: Productivity Press.
SILLINCE, J.; SYKES, G.; SINGH, D. (1996) Implementation, problems, success and longevity of quality circle programs: a study of 95 UK organizations. International Journal of Operations and Production Management, v. 16, n. 4, p. 88–111.
SPEAR, S.; BOWEN, H. K. (1999) Decoding the DNA of the Toyota Production System. Harvard Business Review, V. 77, N. 5, P. 96-106.
SPEAR, S. J. (2004) Learning to lead at Toyota. Harvard Business Review, v. 82, n. 5, p. 78-91.
SUAREZ-BARRAZA, F. M.; MIGUEL-DAVILA, J. A. (2008) Encontrando al "Kaizen": un análisis teórico de la "mejora continua". Pecunia, n. 7, p. 285-311.
TERZIOVSKI, M.; FITZPATRICK, P.; O’NEILL, P. (2003) Successful predictors of business process reengineering (BPR) in financial services. International Journal of Production Economics, v. 84, n. 1, p. 35–51.
TERZIOVSKI, M.; SOHAL, A. S. (2000) The adoption of continuous improvement and innovation strategies in Australian manufacturing firms. Technovation, v. 20, n. 10, p. 539–550.
WOOD, A. (2003) Managing employees’ ideas: from where do ideas come?. Journal for Quality & Participation, v. 26, n. 2, p. 22.
WRUCK, K.; JENSEN, M. (1998) The two key principles behind effective TQM program. European Financial Management, v. 4, n. 3, p. 401–423.
WU, C.; CHEN, C. (2006) An integrated structural model toward successful continuous improvement activity. Technovation, v. 26, n. 5-6, p. 697–707.
Recommended


![PDF [391 K]](https://img.pdfslide.us/doc/110x75/586e035d1a28ab8b3b8b5f73/pdf-391-k.jpg)