7/27/2019 60-Trilok-WEKA Approach for Comparative
http://slidepdf.com/reader/full/60-trilok-weka-approach-for-comparative 1/7
ISSN (Print) : 2319-5940
ISSN (Online) : 2278-1021
Internat ional Journal of Advanced Research in Computer and Commun icat ion Engineer ing
Vol. 2, Issue 4, Apri l 2013
Copyright to IJARCCE www.ijarcce.com 1925
WEKA Approach for Comparative Study of
Classification Algorithm
Trilok Chand Sharma1, Manoj Jain
2
Lecturer, Department Of Technical Education , Haryana, (M.Tech. Computer Science& Engg., Lingaya‟s University
Faridabad)1
Associate. Professor (Computer Sc. & Engg.), Lingaya‟s University Faridabad2
Abstract - This paper discusses data mining techniques to process a dataset and identify the relevance of classificationtest data. Mining tools to solve large amounts of problems such as classification, clustering, association rule, neural
networks, it is a open access tools directly communicates with each tool or called from java code to implement usingthis. In this paper we present machine learning data mining tool used for different analysis, Waikato Environment for
Knowledge Analysis is introduced by university of New Zealand it has capacity to convert CSV file to Flat file. Our
work shows the process of WEKA analysis of file converts and selection of attributes to be mined and comparison with
Knowledge Extraction of Evolutionary Learning not only analysis the data mining classifications but also the genetic,
evolutionary algorithms is the best efficient tool in learning. We have provided an evaluation based on applying these
classification methods to our dataset and measuring the accuracy of test results.
Keywords – Data Mining Tools, Classification Algorithm, Machine Learning, WEKA.
I. INTRODUCTION
The Waikato Environment for Knowledge Analysis(Weka) is a machine learning toolkit introduced by
Waikato University, New Zealand. It is open source
software written in Java (GNU Public License) and
usedfor research, education and Projects. It can be run on
Windows, Linux and Mac. It consists of collection of
machine learning algorithms for implementing data
mining tasks. GUI (data visualization) based tool mainlyused for preprocessing tools,evaluation methods and
has an environment for comparing learning techniques.
There are several versions of Weka like Weka 3.0 “bookversion”compatible with description in data mining book.WEKA3.2: “GUI version” adds graphical user interfaces
(book version is command-line only). WEKA3.3:“development version” with lots of im provements.
This talk is based on the latest snapshot of WEKA
3.5.Thisarticle gives a comparative study of open
source tools of data mining available in the market and
focuses on the vital role of Weka in comparison with other
tools and its implementation in the real world scenario.Many classification methods have been developed with the
aid of learning algorithms such as Bayesian, DecisionTree,
K-nn (K-nearest neighbour), Support Vector
Machine(SVM) and boosting. All these classifiers are
basically learning methods and adopt sets of rules.
Bayesian classifiers are derived from Bayesian Decision
Theory.
This is the simplest and most widely used classification
method due to its manipulating capabilities of tokens andassociated probabilities according to the user‟sclassification decisions and empirical performance.
Support vector machine (SVM) is a powerful, state-of the-
art algorithm can guarantee the lowest true error due to
increasing the generalization capabilities . Random Forest
(RF) is a classifier that is based on a combination of many
decision tree predictors such that each tree depends on the
values of a random vector sampled independently and with
the same distribution for all trees in the forest. RF has
excellent accuracy among current classifier algorithms. Italso has an effective method for estimating missing data
and it maintains accuracy when a large proportion of the
data are missing
II. CLASSIFICATION
In Classification, training examples are used to learn a
model that can classify the data samples into known
classes. The Classification process involves following
steps:
a. Create training data set.
b. Identify class attribute and classes.c. Identify useful attributes for classification
(Relevance analysis).
d. Learn a model using training examples in
Training set.
e. Use the model to classify the unknown data
samples.
7/27/2019 60-Trilok-WEKA Approach for Comparative
http://slidepdf.com/reader/full/60-trilok-weka-approach-for-comparative 2/7
ISSN (Print) : 2319-5940
ISSN (Online) : 2278-1021
Internat ional Journal of Advanced Research in Computer and Commun icat ion Engineer ing
Vol. 2, Issue 4, Apri l 2013
Copyright to IJARCCE www.ijarcce.com 1926
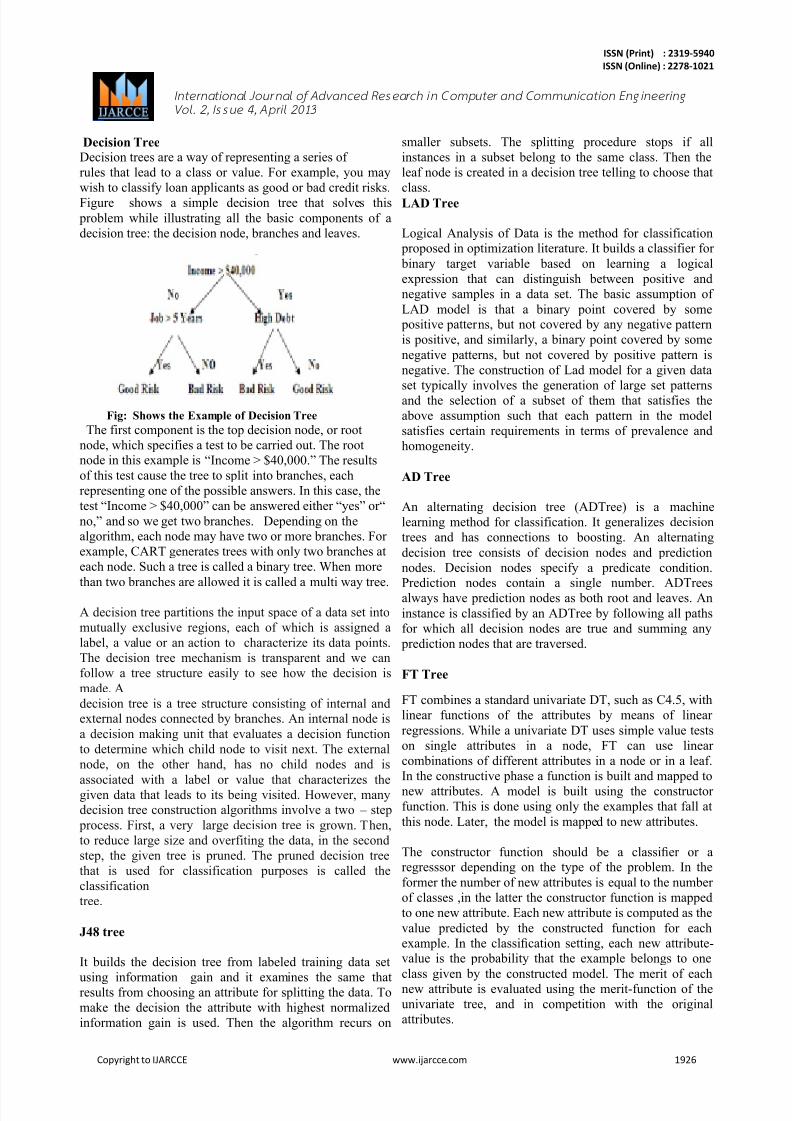
Decision Tree Decision trees are a way of representing a series of
rules that lead to a class or value. For example, you may
wish to classify loan applicants as good or bad credit risks.
Figure shows a simple decision tree that solves this
problem while illustrating all the basic components of a
decision tree: the decision node, branches and leaves.
Fig: Shows the Example of Decision Tree
The first component is the top decision node, or root
node, which specifies a test to be carried out. The rootnode in this example is “Income > $40,000.” The results
of this test cause the tree to split into branches, each
representing one of the possible answers. In this case, the
test “Income > $40,000” can be answered either “yes” or“
no,” and so we get two branches. Depending on thealgorithm, each node may have two or more branches. For
example, CART generates trees with only two branches at
each node. Such a tree is called a binary tree. When more
than two branches are allowed it is called a multi way tree.
A decision tree partitions the input space of a data set into
mutually exclusive regions, each of which is assigned a
label, a value or an action to characterize its data points.
The decision tree mechanism is transparent and we can
follow a tree structure easily to see how the decision is
made. A
decision tree is a tree structure consisting of internal andexternal nodes connected by branches. An internal node is
a decision making unit that evaluates a decision function
to determine which child node to visit next. The external
node, on the other hand, has no child nodes and is
associated with a label or value that characterizes thegiven data that leads to its being visited. However, manydecision tree construction algorithms involve a two – step
process. First, a very large decision tree is grown. Then,
to reduce large size and overfiting the data, in the second
step, the given tree is pruned. The pruned decision tree
that is used for classification purposes is called the
classification
tree.
J48 tree
It builds the decision tree from labeled training data set
using information gain and it examines the same thatresults from choosing an attribute for splitting the data. To
make the decision the attribute with highest normalized
information gain is used. Then the algorithm recurs on
smaller subsets. The splitting procedure stops if all
instances in a subset belong to the same class. Then the
leaf node is created in a decision tree telling to choose that
class.
LAD Tree
Logical Analysis of Data is the method for classification proposed in optimization literature. It builds a classifier for
binary target variable based on learning a logical
expression that can distinguish between positive and
negative samples in a data set. The basic assumption of
LAD model is that a binary point covered by some positive patterns, but not covered by any negative pattern
is positive, and similarly, a binary point covered by some
negative patterns, but not covered by positive pattern is
negative. The construction of Lad model for a given data
set typically involves the generation of large set patterns
and the selection of a subset of them that satisfies the
above assumption such that each pattern in the model
satisfies certain requirements in terms of prevalence and
homogeneity.
AD Tree
An alternating decision tree (ADTree) is a machine
learning method for classification. It generalizes decision
trees and has connections to boosting. An alternating
decision tree consists of decision nodes and prediction
nodes. Decision nodes specify a predicate condition.
Prediction nodes contain a single number. ADTreesalways have prediction nodes as both root and leaves. An
instance is classified by an ADTree by following all paths
for which all decision nodes are true and summing any
prediction nodes that are traversed.
FT Tree
FT combines a standard univariate DT, such as C4.5, with
linear functions of the attributes by means of linear
regressions. While a univariate DT uses simple value tests
on single attributes in a node, FT can use linear
combinations of different attributes in a node or in a leaf.
In the constructive phase a function is built and mapped to
new attributes. A model is built using the constructor
function. This is done using only the examples that fall at
this node. Later, the model is mapped to new attributes.
The constructor function should be a classifier or aregresssor depending on the type of the problem. In the
former the number of new attributes is equal to the number
of classes ,in the latter the constructor function is mapped
to one new attribute. Each new attribute is computed as the
value predicted by the constructed function for each
example. In the classification setting, each new attribute-value is the probability that the example belongs to one
class given by the constructed model. The merit of each
new attribute is evaluated using the merit-function of the
univariate tree, and in competition with the original
attributes.
7/27/2019 60-Trilok-WEKA Approach for Comparative
http://slidepdf.com/reader/full/60-trilok-weka-approach-for-comparative 3/7
ISSN (Print) : 2319-5940
ISSN (Online) : 2278-1021
Internat ional Journal of Advanced Research in Computer and Commun icat ion Engineer ing
Vol. 2, Issue 4, Apri l 2013
Copyright to IJARCCE www.ijarcce.com 1927
III WEKA
The Waikato Environment for Knowledge Analysis
(WEKA) came about through the perceived need for a
unified work bench that would allow researchers easy
access to state-of the-art techniques in machine learning.
At the time of the project‟s inception in 1992, learning
algorithms were available in various languages, for use on
diff erent platforms, and operated on a variety of dataformats. The task of collecting together learning schemes
for a comparative study on a collection of data sets was
daunting at best. WEKA would not only provide a
toolbox of learning algorithms, but also a framework
inside which researchers could implement new algorithms
without having to be concerned with supportinginfrastructure for data manipulation and scheme
evaluation. Nowadays, WEKA is recognized as alandmark system in data mining and machine learning . It
has achieved widespread acceptance within academia and
business circles, and has become a widely used tool for
data mining research. The book that accompanies it [35] is
a popular textbook for data mining and is frequently cited
in machine learning publications. Little, if any, of this
success would have been possible if the system had not
been released as open source software. Giving users free
access to the source code has enabled a thrivingcommunity to develop and facilitated the creation of many
projects that incorporate or extend WEKA.In this paper we
briefly review the WEKA workbench and the history of
project, discuss new features in the recent3.6 stablerelease, and highlight some of the many projects based on
WEKA.
Data can be loaded from various sources, including files,URLs and databases. Supported file formats includeWEKA‟s own ARFF format, CSV, Lib SVM‟s format,and C4.5‟s format. It is also possible to generate data
using an artificial data source and edit data manually usinga dataset editor .The second panel in the Explorer gives
access to WEKA‟s classification and regressionalgorithms.
The corresponding panel is called “Classify” becauseregression techniques are viewed as predictors of
“continuous classes”. By default, the panel runs a cross -
validation for a selected learning algorithm on the dataset
that has been been prepared in the Preprocess panel to
estimate predictive performance. It also shows a textual
representation of the model built from the full dataset.
However, other modes of evaluation, e.g. based on a
separate test set, are also supported. If applicable, the panel also provides access to graphical representations of
models, e.g. decision trees. Moreover, it can visualize
prediction errors in scatter plots, and also allows
evaluation via ROC curves and other “threshold curves”.Models can also be saved and loaded in this panel. Alongwith supervised algorithms, WEKA also supports
application of unsupervised algorithms, namely clustering
algorithms and methods for association rule mining. These
are accessible in the Explorer via the third and fourth
panel respectively. The “Cluster” panel enables users torun a clustering algorithm on the data loaded in the
Preprocess panel. It provides simple statistics for
evaluation of clustering performance: likelihood-based
performance for statistical clustering algorithms and
comparison to “true” cluster membership if this isspecified in one of the attributes in the data. If applicable,visualization of the clustering structure is also possible,
and models can be stored persistently if necessary.
WEKA‟s support for clustering tasks is not as extensive as
its support for classification and regression, but it has moretechniques for clustering than for association rule mining,
which has up to this point been somewhat neglected.
Nevertheless, it does contain an implementation of themost well-known algorithm in this area, as well as a few
other ones. These methods can be accessed via the
“Associate” panel in the Explorer.
IV. IMPLEMENTATION
WEKA has the capacity to read in ".csv" format files is
fortunate since many databases or spreadsheet applications
can save or export data into flat files in this format can be
seen in the sample data file, the first row contains the
attribute names (separated by commas) followed by each
data row with attribute values listed in the same order
(also separated by commas). In fact, once loaded intoWEKA, the data set can be saved into ARFF format.
Interested in converting a ".csv" file into WEKA's native
ARFF, then the recommended approach is to use the
following from the command line: java
weka.core.converters. CSV Loader filename.csv >
filename.arff Load the data set into WEKA, perform a
series of operations using WEKA's attribute and
discretization filters, and then perform association rule
mining on the resulting data set. While all of theseoperations can be performed from the command line, we
use the GUI interface for WEKA Knowledge Explorer.
Initially (in the Preprocess tab) click "open" and navigate
to the directory containing the data file (.csv or .arff). Inthis case we will open the above data file. This is shown in
Figure
7/27/2019 60-Trilok-WEKA Approach for Comparative
http://slidepdf.com/reader/full/60-trilok-weka-approach-for-comparative 4/7
ISSN (Print) : 2319-5940
ISSN (Online) : 2278-1021
Internat ional Journal of Advanced Research in Computer and Commun icat ion Engineer ing
Vol. 2, Issue 4, Apri l 2013
Copyright to IJARCCE www.ijarcce.com 1928
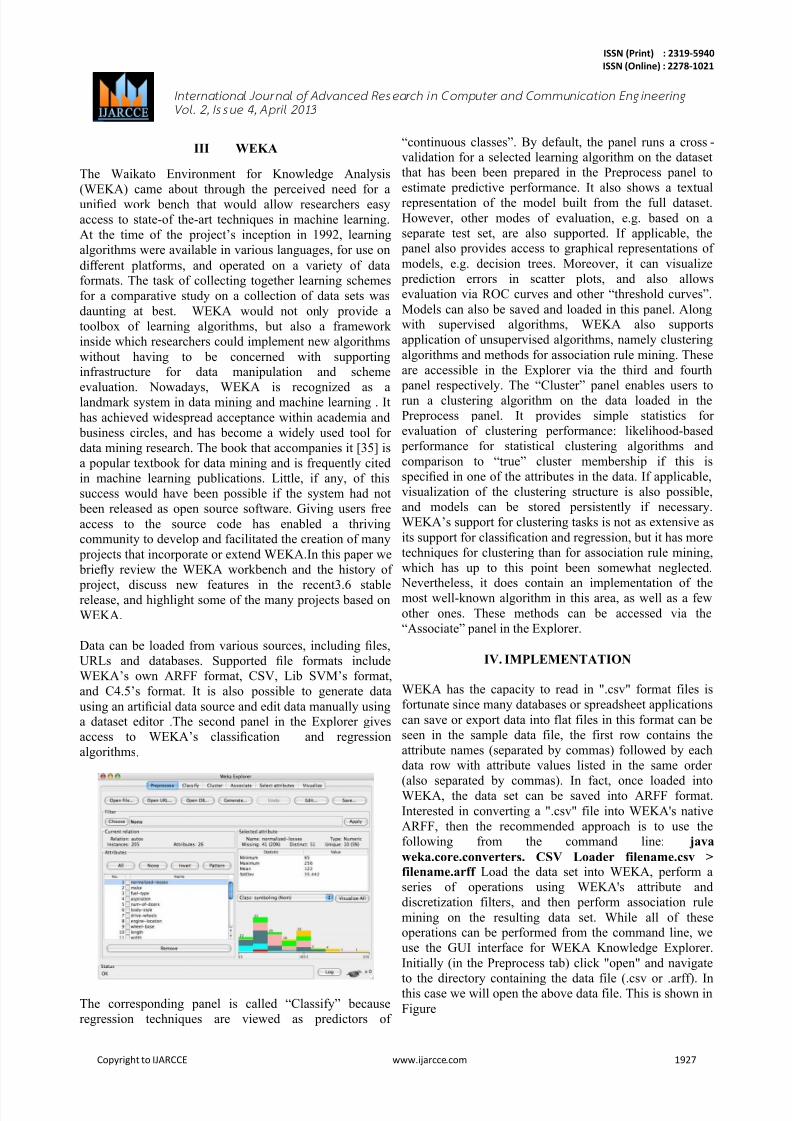
Fig 1. Screen 1- Loading the Data into WEKA
A. Choosing The Data Fr om Fi le
After data is loaded, WEKA will recognize the attributes
and during the scan of the data will compute some basic
statistics on each attribute. The left panel in Figure 2
shows the list of recognized attributes, while the top
panels indicate the names of the base relation (table) and
the current working relation. Clicking on any attribute in
the left panel will show the basic statistics on thatattribute. For categorical attributes, the frequency for eachattribute value is shown; while for continuous attributes
we can obtain min, max, mean, standard deviation, etc.
Fig 2. Screen 2 – Choosing the Data into File
B. Prepare the Data to Be Mined
1. Selecting Attributes
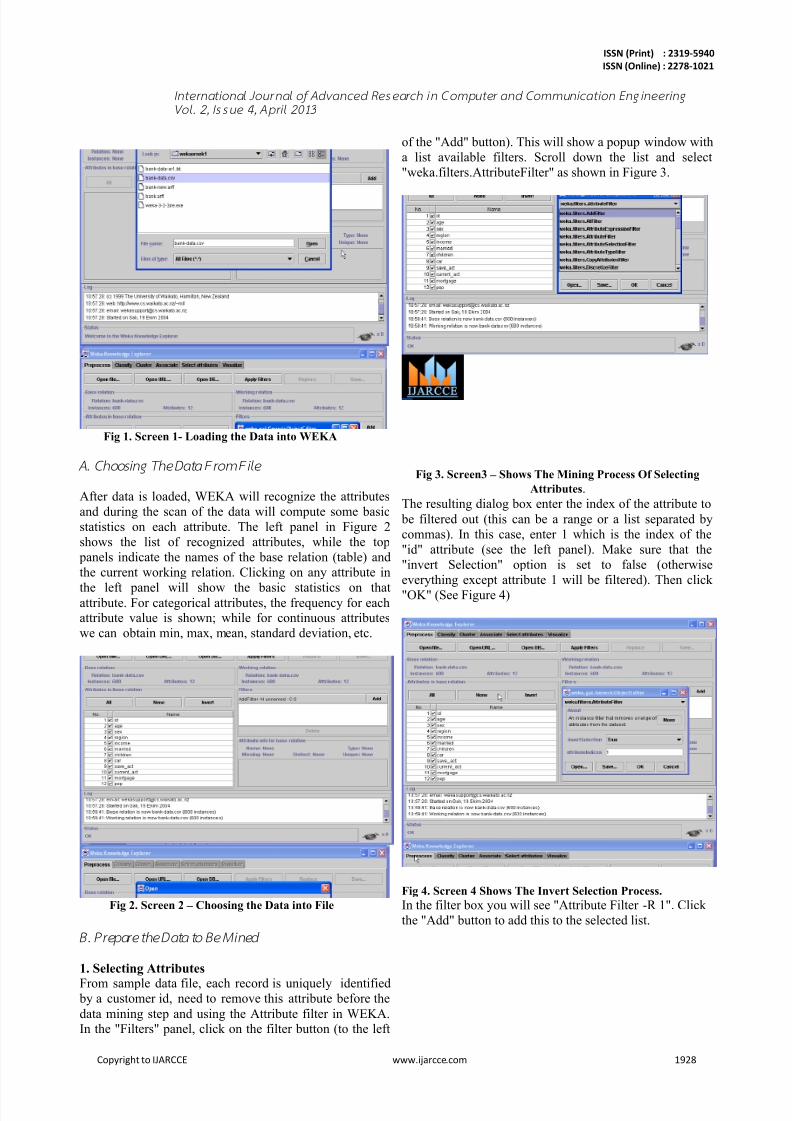
From sample data file, each record is uniquely identified by a customer id, need to remove this attribute before the
data mining step and using the Attribute filter in WEKA.In the "Filters" panel, click on the filter button (to the left
of the "Add" button). This will show a popup window with
a list available filters. Scroll down the list and select
"weka.filters.AttributeFilter" as shown in Figure 3.
Fig 3. Screen3 – Shows The Mining Process Of Selecting
Attributes. The resulting dialog box enter the index of the attribute to
be filtered out (this can be a range or a list separated by
commas). In this case, enter 1 which is the index of the
"id" attribute (see the left panel). Make sure that the
"invert Selection" option is set to false (otherwise
everything except attribute 1 will be filtered). Then click
"OK" (See Figure 4)
Fig 4. Screen 4 Shows The Invert Selection Process.
In the filter box you will see "Attribute Filter -R 1". Click
the "Add" button to add this to the selected list.
7/27/2019 60-Trilok-WEKA Approach for Comparative
http://slidepdf.com/reader/full/60-trilok-weka-approach-for-comparative 5/7
ISSN (Print) : 2319-5940
ISSN (Online) : 2278-1021
Internat ional Journal of Advanced Research in Computer and Commun icat ion Engineer ing
Vol. 2, Issue 4, Apri l 2013
Copyright to IJARCCE www.ijarcce.com 1929
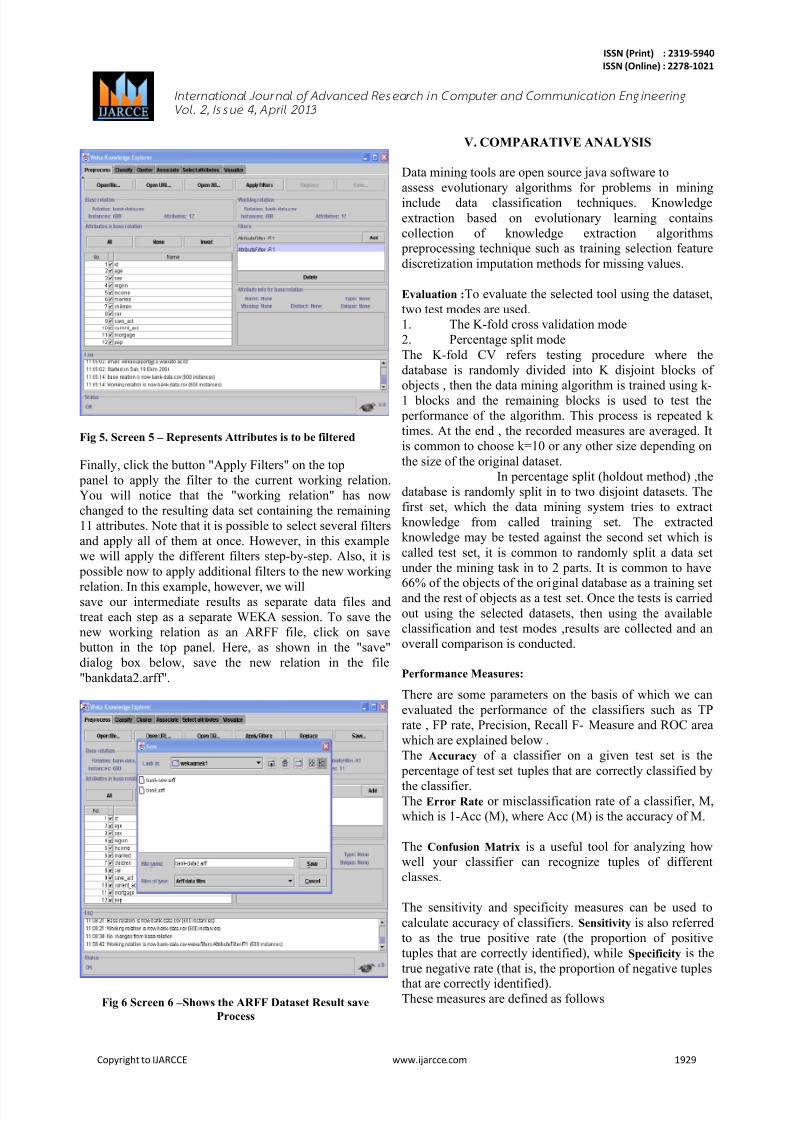
Fig 5. Screen 5 – Represents Attributes is to be filtered
Finally, click the button "Apply Filters" on the top
panel to apply the filter to the current working relation.
You will notice that the "working relation" has now
changed to the resulting data set containing the remaining
11 attributes. Note that it is possible to select several filters
and apply all of them at once. However, in this example
we will apply the different filters step-by-step. Also, it is
possible now to apply additional filters to the new working
relation. In this example, however, we willsave our intermediate results as separate data files and
treat each step as a separate WEKA session. To save the
new working relation as an ARFF file, click on save
button in the top panel. Here, as shown in the "save"
dialog box below, save the new relation in the file
"bankdata2.arff".
Fig 6 Screen 6 – Shows the ARFF Dataset Result save
Process
V. COMPARATIVE ANALYSIS
Data mining tools are open source java software to
assess evolutionary algorithms for problems in mining
include data classification techniques. Knowledge
extraction based on evolutionary learning contains
collection of knowledge extraction algorithms preprocessing technique such as training selection feature
discretization imputation methods for missing values.
Evaluation :To evaluate the selected tool using the dataset,
two test modes are used.1. The K-fold cross validation mode
2. Percentage split mode
The K-fold CV refers testing procedure where the
database is randomly divided into K disjoint blocks of
objects , then the data mining algorithm is trained using k-
1 blocks and the remaining blocks is used to test the
performance of the algorithm. This process is repeated k
times. At the end , the recorded measures are averaged. It
is common to choose k=10 or any other size depending on
the size of the original dataset.
In percentage split (holdout method) ,the
database is randomly split in to two disjoint datasets. The
first set, which the data mining system tries to extract
knowledge from called training set. The extracted
knowledge may be tested against the second set which is
called test set, it is common to randomly split a data set
under the mining task in to 2 parts. It is common to have
66% of the objects of the original database as a training setand the rest of objects as a test set. Once the tests is carried
out using the selected datasets, then using the available
classification and test modes ,results are collected and an
overall comparison is conducted.
Performance Measures:
There are some parameters on the basis of which we can
evaluated the performance of the classifiers such as TP
rate , FP rate, Precision, Recall F- Measure and ROC area
which are explained below .
The Accuracy of a classifier on a given test set is the
percentage of test set tuples that are correctly classified by
the classifier.The Error Rate or misclassification rate of a classifier, M,
which is 1-Acc (M), where Acc (M) is the accuracy of M.
The Confusion Matrix is a useful tool for analyzing how
well your classifier can recognize tuples of different
classes.
The sensitivity and specificity measures can be used to
calculate accuracy of classifiers. Sensitivity is also referred
to as the true positive rate (the proportion of positive
tuples that are correctly identified), while Specificity is the
true negative rate (that is, the proportion of negative tuples
that are correctly identified).These measures are defined as follows
7/27/2019 60-Trilok-WEKA Approach for Comparative
http://slidepdf.com/reader/full/60-trilok-weka-approach-for-comparative 6/7
ISSN (Print) : 2319-5940
ISSN (Online) : 2278-1021
Internat ional Journal of Advanced Research in Computer and Commun icat ion Engineer ing
Vol. 2, Issue 4, Apri l 2013
Copyright to IJARCCE www.ijarcce.com 1930
where t-pos is the number of true positives tuples that
were correctly classified , pos is the number of positive
tuples, t-neg is the number of true negatives tuples that
were correctly classified, neg is the number of negative
tuples, and f-pos is the number of false positives tuples
that were incorrectly labeled.
It can be shown that accuracy is a function of sensitivity
and specificity:
The above stated performance measures are explained as
below –
TP rate: It is the proportion of actual positives which are
predicted as positive. The formula is defines as – TP rate = tp
( tp+fn)
Where tp stands for true positive and fn stands for false
negative.
FP rate: It is the rate of negatives tuples that are
incorrectly labeled. The formula is defined as –
FP rate of class „yes‟ = f n
( f n +t n )
FP rate of class „no‟= = f p
( tp+fp)
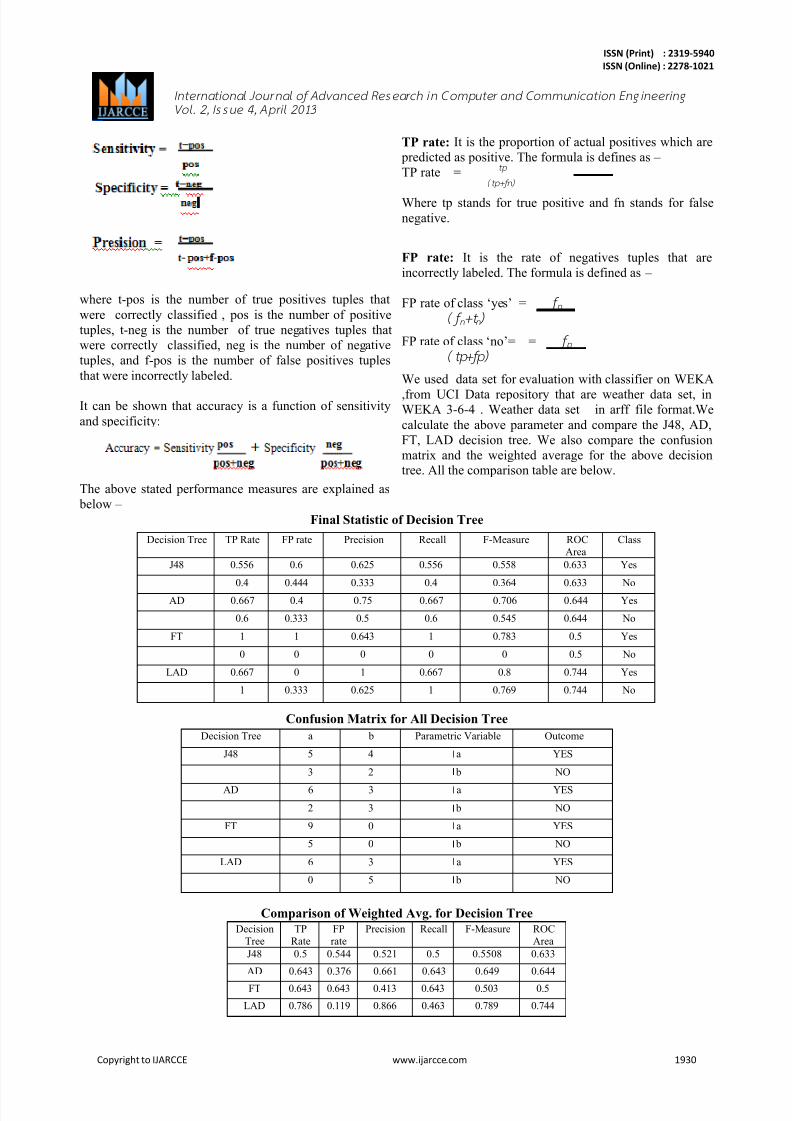
We used data set for evaluation with classifier on WEKA
,from UCI Data repository that are weather data set, inWEKA 3-6-4 . Weather data set in arff file format.We
calculate the above parameter and compare the J48, AD,
FT, LAD decision tree. We also compare the confusion
matrix and the weighted average for the above decisiontree. All the comparison table are below.
Final Statistic of Decision Tree
Decision Tree TP Rate FP rate Precision Recall F-Measure ROC
Area
Class
J48 0.556 0.6 0.625 0.556 0.558 0.633 Yes
0.4 0.444 0.333 0.4 0.364 0.633 No
AD 0.667 0.4 0.75 0.667 0.706 0.644 Yes
0.6 0.333 0.5 0.6 0.545 0.644 No
FT 1 1 0.643 1 0.783 0.5 Yes
0 0 0 0 0 0.5 No
LAD 0.667 0 1 0.667 0.8 0.744 Yes
1 0.333 0.625 1 0.769 0.744 No
Confusion Matrix for All Decision Tree
Decision Tree a b Parametric Variable Outcome
J48 5 4 a YES
3 2 b NO
AD 6 3 a YES
2 3 b NO
FT 9 0 a YES
5 0 b NO
LAD 6 3 a YES
0 5 b NO
Comparison of Weighted Avg. for Decision Tree
Decision
Tree
TP
Rate
FP
rate
Precision Recall F-Measure ROC
Area
J48 0.5 0.544 0.521 0.5 0.5508 0.633
AD 0.643 0.376 0.661 0.643 0.649 0.644
FT 0.643 0.643 0.413 0.643 0.503 0.5
LAD 0.786 0.119 0.866 0.463 0.789 0.744
7/27/2019 60-Trilok-WEKA Approach for Comparative
http://slidepdf.com/reader/full/60-trilok-weka-approach-for-comparative 7/7
ISSN (Print) : 2319-5940
ISSN (Online) : 2278-1021
Internat ional Journal of Advanced Research in Computer and Commun icat ion Engineer ing
Vol. 2, Issue 4, Apri l 2013
Copyright to IJARCCE www.ijarcce.com 1931
VI. CONCLUSION
In this paper Decision Tree classification algorithms are
analysing and an explanation mechanism to explain the
results. The specific approaches for classification are
characterized, we developed the WEKA method is based
on choosing the file and selecting attributes to convert .csvfile to flat file and discussed features of WEKA
performance. Our work extends to utilize the
implementation of different dataset. Each decision tree
present and achieve a high rate of accuracy. It classify the
data into the correctly and incorrectly instance. We canuse these decision tree algorithms in medical , banking ,
stock market and various area.
REFERENCES
[1] An Implementation of ID3: Decision Tree Learning
Algorithm Wei Peng, Juhua Chen and Haiping Zhou
Project of Comp 9417: Machine Learning University of
New South Wales, School of Computer Science &
Engineering, Sydney, NSW 2032, and Australia.
[2] Han, J., Kamber, M., Jian P., Data Mining Concepts
and Techniques. San Francisco, CA: Morgan Kaufmann
Publishers, 2011.
[3] Hall, M., Frank, E., Holmes, G., Pfahringer, B.,
Reutemann P., Witten, I., H., The WEKA data mining
software: an update, ACM SIGKDD Explorations
Newsletter, v.11 n.1, June 2009
[doi>10.1145/1656274.1656278].[4] Hornik, K., Buchta, C., Zeileis, A., Open-Source
Machine Learning: R Meets Weka, Journal of
Computational Statistics - Proceedings of DSC
2007, Volume 24 Issue 2, May 2009
[doi>10.1007/s00180-008-0119-7]. Hunyadi, D., RapidMiner E-Commerce, Proceedings of the 12th
WSEAS International Conference on Automatic Control,
Modelling & Simulation, 2010.
[5] www.junauza.com/2010/11/free-data-mining
software.html
[6] King, M., A., and Elder, J., F., Evaluation of Fourteen
Desktop Data Mining Tools, in Proceedings of the 1998
IEEE International Conference on Systems, Man andCybernetics, 1998.
[7]Giraud-Carrier,C., and Povel, O., Characterising Data
Mining software, Intelligent Data Analysis, v.7 n.3, p.181-
192, August 2003
[8] WEKA, the University of Waikato, Available
at:http://www.cs.waikato.ac.nz/ml/weka/, (Accessed 20
April 2011).
[9] UCI Machine Learning Repository, Available at:
http:// http://archive.ics.uci.edu/ml/, (Accessed 22 April 2011).
[10] Zhou, S., Ling, T., W., Guan, J., Hu, J., Zhou, A.,
Fast Text Classification: A Training-Corpus Pruning
Based Approach. Proceedings of the Eighth International
Conference on Database Systems for AdvancedApplications, pp.127, 2003.
Recommended