PHENOL 149
6 POTENTIAL FOR HUMAN EXPOSURE
61 OVERVIEW
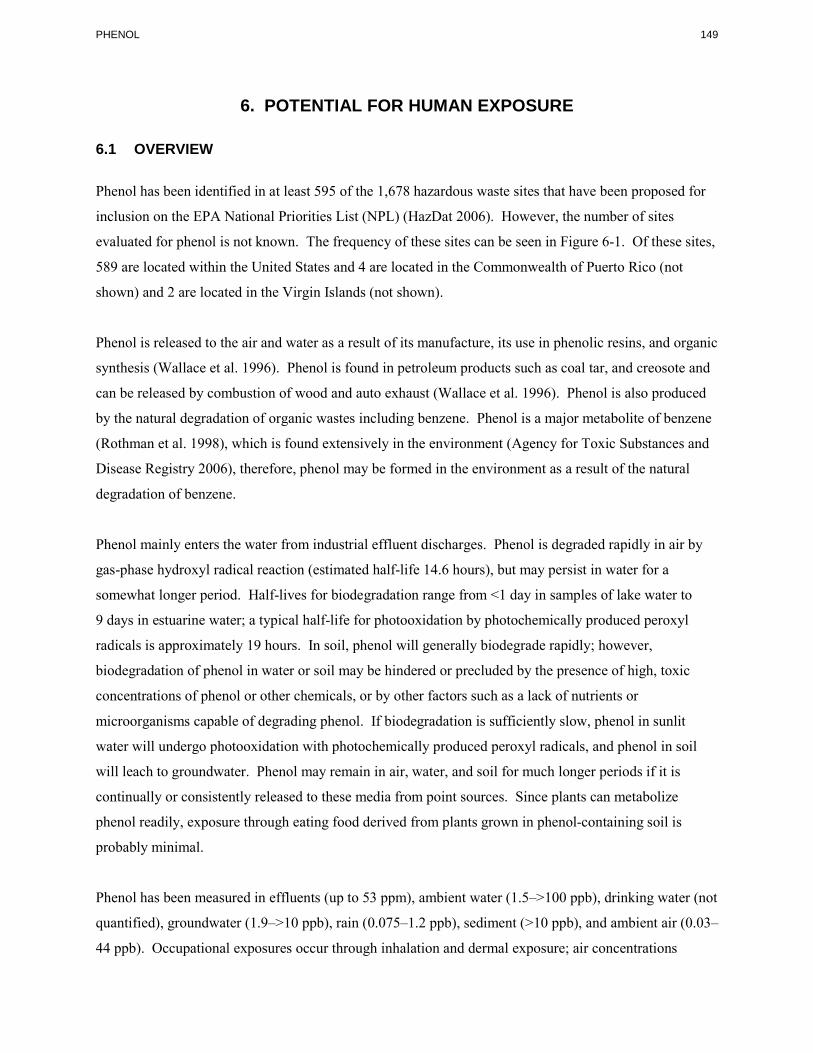
Phenol has been identified in at least 595 of the 1678 hazardous waste sites that have been proposed for
inclusion on the EPA National Priorities List (NPL) (HazDat 2006) However the number of sites
evaluated for phenol is not known The frequency of these sites can be seen in Figure 6-1 Of these sites
589 are located within the United States and 4 are located in the Commonwealth of Puerto Rico (not
shown) and 2 are located in the Virgin Islands (not shown)
Phenol is released to the air and water as a result of its manufacture its use in phenolic resins and organic
synthesis (Wallace et al 1996) Phenol is found in petroleum products such as coal tar and creosote and
can be released by combustion of wood and auto exhaust (Wallace et al 1996) Phenol is also produced
by the natural degradation of organic wastes including benzene Phenol is a major metabolite of benzene
(Rothman et al 1998) which is found extensively in the environment (Agency for Toxic Substances and
Disease Registry 2006) therefore phenol may be formed in the environment as a result of the natural
degradation of benzene
Phenol mainly enters the water from industrial effluent discharges Phenol is degraded rapidly in air by
gas-phase hydroxyl radical reaction (estimated half-life 146 hours) but may persist in water for a
somewhat longer period Half-lives for biodegradation range from lt1 day in samples of lake water to
9 days in estuarine water a typical half-life for photooxidation by photochemically produced peroxyl
radicals is approximately 19 hours In soil phenol will generally biodegrade rapidly however
biodegradation of phenol in water or soil may be hindered or precluded by the presence of high toxic
concentrations of phenol or other chemicals or by other factors such as a lack of nutrients or
microorganisms capable of degrading phenol If biodegradation is sufficiently slow phenol in sunlit
water will undergo photooxidation with photochemically produced peroxyl radicals and phenol in soil
will leach to groundwater Phenol may remain in air water and soil for much longer periods if it is
continually or consistently released to these media from point sources Since plants can metabolize
phenol readily exposure through eating food derived from plants grown in phenol-containing soil is
probably minimal
Phenol has been measured in effluents (up to 53 ppm) ambient water (15ndashgt100 ppb) drinking water (not
quantified) groundwater (19ndashgt10 ppb) rain (0075ndash12 ppb) sediment (gt10 ppb) and ambient air (003ndash
44 ppb) Occupational exposures occur through inhalation and dermal exposure air concentrations
PHENOL 151
6 POTENTIAL FOR HUMAN EXPOSURE
monitored in various workplaces range from 01 to 125 mgm3 (003ndash32 ppm) Occupational as well as
consumer exposure may also occur through dermal contact with phenol or phenol-containing products
62 RELEASES TO THE ENVIRONMENT
The Toxics Release Inventory (TRI) data should be used with caution because only certain types of
facilities are required to report (EPA 2005) This is not an exhaustive list Manufacturing and processing
facilities are required to report information to the TRI only if they employ 10 or more full-time
employees if their facility is included in Standard Industrial Classification (SIC) Codes 10 (except 1011
1081 and 1094) 12 (except 1241) 20ndash39 4911 (limited to facilities that combust coal andor oil for the
purpose of generating electricity for distribution in commerce) 4931 (limited to facilities that combust
coal andor oil for the purpose of generating electricity for distribution in commerce) 4939 (limited to
facilities that combust coal andor oil for the purpose of generating electricity for distribution in
commerce) 4953 (limited to facilities regulated under RCRA Subtitle C 42 USC section 6921 et seq)
5169 5171 and 7389 (limited SC section 6921 et seq) 5169 5171 and 7389 (limited to facilities
primarily engaged in solvents recovery services on a contract or fee basis) and if their facility produces
imports or processes ge25000 pounds of any TRI chemical or otherwise uses gt10000 pounds of a TRI
chemical in a calendar year (EPA 2005)
621 Air
Estimated releases of 76 million pounds (~3480 metric tons) of phenol to the atmosphere from
677 domestic manufacturing and processing facilities in 2004 accounted for about 64 of the estimated
total environmental releases from facilities required to report to the TRI (TRI05 2007) These releases are
summarized in Table 6-1
During manufacturing phenol is released primarily to the atmosphere from storage tank vents and during
transport loading (EPA 1979c) Other major sources of release to the atmosphere are residential wood
burning and automobile exhaust (EPA 1981a) Volatilization from environmental waters and soils has
been shown to be a slow process (see Section 631) and is not expected to be a significant source of
atmospheric phenol Phenol is released into the atmosphere from industrial combustion processes For
example phenol has been detected at a concentration of 036 ppb in the emissions of a waste incinerator
plant in Germany (Jay and Stieglitz 1995) In Brazil an estimated 64 kgyear of phenol is released to the
urban areas located near coal-fired power stations indicating that people who live near coal-fired power
stations may have an increased risk of exposure to phenol (Moreira dos Santos et al 2004) Phenol is also
PHENOL 152
6 POTENTIAL FOR HUMAN EXPOSURE
Table 6-1 Releases to the Environment from Facilities that Produce Process or Use Phenola
Reported amounts released in pounds per yearb
Total release On- and
Statec RFd Aire Waterf UIg Landh Otheri On-sitej Off-sitek off-site AL 33 407745 278 0 8213 0 408261 7975 416236 AR 15 53803 136 0 4781 0 54241 4479 58720 AZ 2 5499 No data 0 100 0 5499 100 5599 CA 33 100135 1974 0 5544 305 102117 5841 107958 CO 2 32 No data 0 0 0 32 0 32 CT 4 5631 No data 0 649 728 5631 1377 7008 DE 2 160 44595 0 0 0 44755 0 44755 FL 12 114230 950 0 91 0 115272 0 115272 GA 25 146687 518 0 1468 2102 147242 3533 150775 IA 5 17126 36 0 100501 0 17162 100501 117663 ID 2 1005 5 0 4428 0 1010 4428 5438 IL 28 614954 602 0 50925 251 616526 50206 666732 IN 32 391396 3660 100000 35975 5 495190 35845 531035 KS 7 76565 54 0 5869 1829 76637 7680 84317 KY 13 108867 809 0 56542 0 109676 56542 166218 LA 36 124638 15173 150002 10660 120 295401 5192 300593 MA 6 15108 No data 0 803 0 15108 803 15911 MD 2 13004 No data 0 0 0 13004 0 13004 ME 5 25852 15 0 906 0 25893 880 26773 MI 29 121520 660 19 78038 44762 122188 122810 244998 MN 8 55892 150 0 98 3 56117 26 56143 MO 9 15024 0 0 0 0 15024 0 15024 MS 12 67983 207 0 1238 0 68190 1238 69428 MT 5 3724 25 0 23 0 3772 0 3772 NC 23 186812 311 0 164098 0 187269 163952 351221 ND 1 220 49 2100 0 0 2369 0 2369 NE 4 888 No data 0 147 0 896 139 1035 NH 2 6203 No data 0 1 0 6203 1 6204 NJ 10 6218 1828 0 10327 0 16022 2351 18373 NM 1 1078 No data 0 0 0 1078 0 1078 NY 23 57689 62 0 22704 56518 57777 79196 136973 OH 45 522126 1219 34 119210 807 528880 114516 643397 OK 10 21713 558 0 17557 4855 38249 6434 44683 OR 22 186431 189 0 12935 3453 187736 15272 203008 PA 29 424309 9699 0 4994 2093 434776 6319 441096 PR 3 4974 No data 0 4561 0 4974 4561 9535 RI 1 724 No data 0 0 0 724 0 724
PHENOL 153
6 POTENTIAL FOR HUMAN EXPOSURE
Table 6-1 Releases to the Environment from Facilities that Produce Process or Use Phenola
Reported amounts released in pounds per yearb
Total release On- and
Statec RFd Aire Waterf UIg Landh Otheri On-sitej Off-sitek off-site SC 20 93387 1284 0 148473 0 115489 127656 243145 TN 15 81725 305 0 2006 45 82439 1642 84081 TX 75 233116 7659 1225465 99083 118 1416533 148909 1565442 UT 3 31100 No data 0 7600 0 38700 0 38700 VA 12 56625 299 0 31225 750 87264 1635 88899 VI 1 78848 612 0 1 0 79460 1 79461 WA 19 127933 5382 0 427 181 133355 568 133923 WI 23 305630 55 0 27762 30 305685 27792 333477 WV 6 20279 188 0 69 44 20475 105 20580 WY 2 750 No data 0 0 0 750 0 750 Total 677 4935360 99546 1477621 1040033 118999 6561054 1110505 7671559
aThe TRI data should be used with caution since only certain types of facilities are required to report This is not an exhaustive list Data are rounded to nearest whole number bData in TRI are maximum amounts released by each facility cPost office state abbreviations are used dNumber of reporting facilitieseThe sum of fugitive and point source releases are included in releases to air by a given facility fSurface water discharges waste water treatment-(metals only) and publicly owned treatment works (POTWs) (metal and metal compounds)gClass I wells Class II-V wells and underground injectionhResource Conservation and Recovery Act (RCRA) subtitle C landfills other on-site landfills land treatment surface impoundments other land disposal other landfillsiStorage only solidificationstabilization (metals only) other off-site management transfers to waste broker for disposal unknownjThe sum of all releases of the chemical to air land water and underground injection wellskTotal amount of chemical transferred off-site including to POTWs
RF = reporting facilities UI = underground injection
Source TRI05 2007 (Data are from 2005)
PHENOL 154
6 POTENTIAL FOR HUMAN EXPOSURE
found in cigarette smoke and in plastics (Graedel 1978) but no data are available to determine the extent
of exposure to phenol from these sources
622 Water
Estimated releases of 99546 pounds (~45 metric tons) of phenol to surface water from 677 domestic
manufacturing and processing facilities in 2005 accounted for about 01 of the estimated total
environmental releases from facilities required to report to the TRI (TRI05 2007) These releases are
summarized in Table 6-1
The most common anthropogenic sources of phenol in natural water include coal tar (Thurman 1982) and
waste water from manufacturing industries such as resins plastics fibers adhesives iron steel
aluminum leather rubber (EPA 1981b) and effluents from synthetic fuel manufacturing (Parkhurst et al
1979) Phenol is also released from paper pulp mills (Keith 1976) and wood treatment facilities (Goerlitz
et al 1985) Other releases of phenol result from commercial use of phenol and phenol-containing
products including slimicides general disinfectants (Budavari et al 1989 Hawley 1981) and medicinal
preparations such as throat lozenges mouthwashes gargles and antiseptic lotions (Darisimall 2006)
Two natural sources of phenol in aquatic media are animal wastes and decomposition of organic wastes
(EPA 1980) As a metabolite of benzene phenol may be released from publicly owned treatment works
(POTWs) and sewage overflow For example it has been estimated that 38 kgday of phenol are released
to Newark Bay in New Jersey from municipal treatment facilities (Crawford et al 1995) Phenol was
detected in 2 of the effluent samples from New York City sewage waste facilities collected during 1989
to 1993 at concentrations of 6ndash310 gL (Stubin et al 1996) Because it is a metabolite phenol is likely to
be found in other sewage and POTWs facilities No data are available to determine the extent of exposure
from these sources
Estimated releases of 85700 pounds (~39 metric tons) of phenol to surface water from 689 domestic
manufacturing and processing facilities in 2004 accounted for about 01 of the estimated total
environmental releases from facilities required to report to the TRI (TRI05 2007) These releases are
summarized in Table 6-1
The most common anthropogenic sources of phenol in natural water include coal tar (Thurman 1982) and
waste water from manufacturing industries such as resins plastics fibers adhesives iron steel
aluminum leather rubber (EPA 1981b) and effluents from synthetic fuel manufacturing (Parkhurst et al
PHENOL 155
6 POTENTIAL FOR HUMAN EXPOSURE
1979) Phenol is also released from paper pulp mills (Keith 1976) and wood treatment facilities (Goerlitz
et al 1985) Other releases of phenol result from commercial use of phenol and phenol-containing
products including slimicides general disinfectants (Budavari et al 1989 Hawley 1981) and medicinal
preparations such as throat lozenges mouthwashes gargles and antiseptic lotions (Darisimall 2006)
623 Soil
Estimated releases of 1 million pounds (~472 metric tons) of phenol to soils from 689 domestic
manufacturing and processing facilities in 2005 accounted for about 14 of the estimated total
environmental releases from facilities required to report to the TRI (TRI05 2007) An additional
15 million pounds (~670 metric tons) constituting about 19 of the total environmental emissions were
released via underground injection (TRI05 2007) These releases are summarized in Table 6-1
Phenol may be released to the soil during its manufacturing process when spills occur during loading and
transport and when it leaches from hazardous waste sites and landfills (Xing et al 1994) Generally data
on concentrations of phenol found in soil at sites other than hazardous waste sites are lacking This may
be due in part to a rapid rate of biodegradation and leaching (see Sections 631 and 6323) Phenol can
be expected to be found in soils that receive continuous or consistent releases from a point source Phenol
that leaches through soil to groundwater spends at least some time in that soil as it travels to the
groundwater Phenol has been found in groundwater mainly at or near hazardous waste sites
63 ENVIRONMENTAL FATE 631 Transport and Partitioning
Phenol is released into the air and discharged into water from both manufacturing and use Based on its
high water solubility (see Table 4-2) and the fact that it has been detected in rainwater some phenol may
wash out of the atmosphere however it is probable that only limited amounts wash out because of the
short atmospheric half-life of phenol During the day when photochemically produced hydroxyl radical
concentrations are highest in the atmosphere very little atmospheric transport of phenol is likely to occur
In water neither volatilization nor sorption to sediments and suspended particulates are expected to be
important transport mechanisms Using the Henrys Law constant of 3x10⁻⁷ atm m3mol (Gaffney et al
1987) a volatilization half-life of 88 days was calculated for phenol evaporation from a model river 1 m
deep with a current of 1 msecond and wind velocity of 3 msecond (Lyman et al 1982) The biological
PHENOL 156
6 POTENTIAL FOR HUMAN EXPOSURE
treatment of waste water containing phenol has shown that lt1 of phenol is removed by stripping
(Kincannon et al 1983 Petrasek et al 1983)
Phenol has been reported in sediments at levels as high as 608 ppm dry weight however it is not known
whether the location of the site where this concentration was reported is at or near a point source of
release such as a hazardous waste dump The concentrations of the overlying waters were not reported
The moderately low soil sorption partition coefficient (121ndash196) suggests that sorption to sediment is
not an important transport process There is very little sorption of phenol onto aquifer materials (Ehrlich
et al 1982) suggesting that phenol sorption to sediments may also be minimal Based on the soil
adsorption coefficient phenol is expected to leach to groundwater however the rate of phenol
biodegradation in the soil may be so rapid except in cases of large releases such as spills or continuous
releases such as leaching from landfill sites that the probability of groundwater contamination may be
low (Ehrlich et al 1982) Phenol has been detected in groundwater as a result of leaching through soil
from a spill of phenol (Delfino and Dube 1976) from landfill sites (Clark and Piskin 1977) and from
hazardous waste sites (Plumb 1987) The sorption coefficient for phenol by soils increases with
increasing soil organic matter which may indicate that soil organic matter may be the primary phenol
sorbent in soil (Xing et al 1994)
Phenol is not expected to bioconcentrate significantly in aquatic organisms Reported log bioconcentra-
tion factors (BCF) in fish for phenol include 028 for goldfish (Kobayashi et al 1979) and 13 for golden
orfe (Freitag et al 1984) The highest mean level of phenol detected in bottom fish from Commencement
Bay in Tacoma Washington was 014 ppm (Nicola et al 1987) The levels of phenol in the water or
sediments were not stated
The pKa of phenol is 10 (OrsquoNeil 2001) indicating that phenol will primarily exist as the protonated acid
at environmental pH values In alkaline soils and water phenol will partially exist as an anion which can
affect its fate and transport processes
Although it has been shown that plants readily uptake phenol (DOE 1987) bioaccumulation does not take
place due to a high rate of respiratory decomposition of phenol to CO2
PHENOL 157
6 POTENTIAL FOR HUMAN EXPOSURE
632 Transformation and Degradation 6321 Air
The gas-phase reaction of phenol with photochemically produced hydroxyl radicals is probably a major
removal mechanism in the atmosphere An estimated half-life for phenol for this reaction is 061 days
(EPA 1979a) The reaction of phenol with nitrate radicals during the night may constitute a significant
removal process This is based on a rate constant of 38x10-12 cm3molecule second for this reaction
corresponding to a half-life of 15 minutes at an atmospheric concentration of 2x10⁸ nitrate radicals per
cm3 (Atkinson et al 1987) The reaction of phenol with nitrate radicals present in the atmosphere during
smog episodes may decrease the half-life of phenol in polluted atmospheres The above data indicate that
phenol has a short half-life in the atmosphere probably lt1 day Phenol does not absorb light in the
region of 290ndash330 nm (Lide and Milne 1994) therefore it should not photodegrade directly in the
atmosphere
6322 Water
Although phenol does not absorb light at wavelengths gt290 phenols react rapidly to sunlit natural water
via an indirect reaction with photochemically produced hydroxyl radicals and peroxyl radicals typical
half-lives for hydroxyl and peroxyl radical reactions are on the order of 100 and 192 hours of sunlight
respectively (Canonica et al 1995 Mill and Mabey 1985) These reactions require dissolved natural
organic materials that function as photosensitizers (Canonica et al 1995) The estimated half-life for the
reaction of phenol with photochemically produced singlet oxygen in sunlit surface waters contaminated
by humic substances is 83 days (assuming Switzerland summer sunlight and a singlet oxygen
concentration of 4x10-14 molar [M]) (Scully and Hoigne 1987)
Phenol is readily biodegradable in natural water provided the concentration is not high enough to cause
significant inhibition through microbial toxicity Complete degradation in lt1 day has been reported in
water from three lakes the rates of degradation were affected by the concentration of organic and
inorganic nutrients in the water (Rubin and Alexander 1983) Complete removal of phenol in river water
has been reported after 2 days at 20 degC and after 4 days at 4 degC (Ludzack and Ettinger 1960) The
degradation of phenol is somewhat slower in salt water and a half-life of 9 days has been reported in an
estuarine river (EPA 1979b) Rapid degradation of phenol also has been reported in various sewage and
water treatment processes Removal in aerobic activated sludge reactors is frequently gt90 with a
retention time of 8 hours (Stover and Kincannon 1983) In aerobic reactors using municipal seed
PHENOL 158
6 POTENTIAL FOR HUMAN EXPOSURE
(conventional activated sludge organisms) and in reactors using an industrial seed (mixture of organisms)
it was noted that concentrations as low as 50 mgL inhibited organism respiration rates but complete
inhibition was not observed at concentrations as high as 200 mgL (Davis et al 1981) Utilization is also
very high in anaerobic reactors although acclimation periods are longer and degradation usually takes
about 2 weeks (Boyd et al 1983 Healy and Young 1978) One method of phenol breakdown is
accomplished by the bacterium Pseudomonas sp CF600 which uses a set of enzymes encoded by the
plasmid dmp operon (Powlowski and Shingler 1994) The use of sequence batch reactors (SBR) in
treating sludge contaminated with phenolic compounds has proven effective in breaking down the
compounds biologically with no evidence of phenol volatility (Al-Harazin et al 1991) Levels as high as
a one-time treatment of 1600 mgL can be broken down by 75 with a 1-day retention time Lower
concentrations as high as 800 mgL can be broken down to lt05 mgL with a 1-day retention time The
alga Ochromonas danica has also been shown to degrade phenol (Semple and Cain 1996) When grown
in the dark with 01ndash1 mM phenol as the sole carbon source phenol was removed within 3 days Because
of the rapid rate of biodegradation groundwater is generally free of phenol even though it is highly
mobile in soil However monitoring data in Section 642 contain groundwater concentrations in areas of
large phenol releases
While the evidence presented in the literature cited above suggests that phenol can be rapidly and
virtually completely degraded under both natural water and sewage treatment plant conditions
monitoring data presented in Section 64 below indicate that phenol despite this apparent
biodegradability is still present in the environment This suggests that the exact conditions under which
phenol is rapidly degraded are not present in all instances In some situations the concentration of phenol
may be too high or the populations of microorganisms may not be present in sufficient concentration for
significant biodegradation to occur
6323 Sediment and Soil
Available data indicate that phenol biodegrades in soil under both aerobic and anaerobic soil conditions
The half-life of phenol in soil is generally lt5 days (Baker and Mayfield 1980) but acidic soils and some
surface soils may have half-lives of up to 23 days (Shiu et al 1994) Mineralization in an alkaline para-
brown soil under aerobic conditions was 455 48 and 65 after 3 7 and 70 days respectively (Haider et
al 1974) Half-lives for degradation of low concentrations of phenol in two silt loam soils were 270 and
351 hours (Scott et al 1983) Plants have been shown to be capable of metabolizing phenol readily
(DOE 1987)
PHENOL 159
6 POTENTIAL FOR HUMAN EXPOSURE
While degradation is slower under anaerobic conditions evidence presented in the literature suggests that
phenol can be rapidly and virtually completely degraded in soil under both aerobic and anaerobic
conditions (Baker and Mayfield 1980)
64 LEVELS MONITORED OR ESTIMATED IN THE ENVIRONMENT
Reliable evaluation of the potential for human exposure to phenol depends in part on the reliability of
supporting analytical data from environmental samples and biological specimens Concentrations of
phenol in unpolluted atmospheres and in pristine surface waters are often so low as to be near the limits of
current analytical methods In reviewing data on phenol levels monitored or estimated in the
environment it should also be noted that the amount of chemical identified analytically is not necessarily
equivalent to the amount that is bioavailable The analytical methods available for monitoring phenol in a
variety of environmental media are detailed in Chapter 7
641 Air
There are very few monitoring data concerning the presence of phenol in ambient air Phenol was found
at a median concentration of 30 parts per trillion (ppt) in 7 samples from 1 US urbansuburban site in
1974 and at an overall median concentration of 5000 ppt in 83 samples from 7 source-dominated sites
between 1974 and 1978 (EPA 1982) The individual medians of the seven source sites ranged from
520 to 44000 ppt (EPA 1982) Phenol was detected but not quantified in air above the Niagara River in
September of 1982 (Hoff and Chan 1987) Phenol concentrations in two urban areas ranged from 13 to
91 ppt and from lt5 to 75 ppb with 50 of all measurements lt8 ppb (EPA 1981a) Phenol was found at
approximately 1 ppb in the ambient air near a fishmeal factory in Japan (Hoshika et al 1981) In a study
to determine contaminants in the air of agricultural areas phenol was found in 42 out of 53 air samples
taken from 8 farms at an average concentration of 10 μgm3 (Sunesson et al 2001) Phenol was detected
in indoor and outdoor air in the city of Ottawa Canada at concentration ranges of 001ndash516 and 001ndash
141 μgm3 respectively (Zhu et al 2005)
In a study of various air samples from Helsinki Finland 92 of outdoor air and 86 of indoor air did
not have detectible quantities of phenol (Edwards et al 2001) Workplace and personal exposure samples
also had low relative percentages of phenol with only 12 and 11 of the samples above the limits of
detection respectively (Edwards et al 2001)
PHENOL 160
6 POTENTIAL FOR HUMAN EXPOSURE
Higher phenol concentrations may occur when there is smog or in highly contaminated air During a
smog episode in West Covina California in July of 1973 phenol concentrations ranged from 16 to
91 ppt with a mean concentration of 60 ppt (Cronn et al 1977) During a haze episode in 1998 in Brunei
Syria phenol was found in 8 out of 15 sites tested in concentrations ranging from 007 to 041 μgm3 of
these sites 4 were near a hospital (Muraleedharan et al 2000)
Phenol and other volatile organic compounds were measured in the air of 50 homes or apartments in
Finland (Kostiainen 1995) The average concentration was 023 ppb with a range of 0ndash077 ppb Phenol
levels were not significantly higher in houses in which people complained of symptoms that resembled
those of a sick building syndrome
Phenol has been detected in the ash phase of burning pine oak and eucalyptus in concentrations of 524
300 and 434 mgkg respectively (Schauer et al 2001) Phenol has also been identified in the combustion
of soft fireplace wood hard fireplace wood stove wood and synthetic wood at concentrations of 158
247 142 and 858 mgkg respectively (McDonald et al 2000)
Phenol is released to the atmosphere from burning coal In a study of three urban sites in Brazil near
coal-fired power stations phenol was detected in all three locations with concentrations ranging from
098 to 160 μgm3 (Moreira dos Santos et al 2004) This indicates that families living near coal-fired
power stations may be exposed to higher concentrations of phenol
642 Water
Phenol has been detected in surface waters rainwater sediments drinking water groundwater industrial
effluents urban runoff and at hazardous waste sites Background levels of phenol from relatively pristine
sites can be as high as 1 ppb for unpolluted groundwater and have been reported to range from 001 to
1 ppb in unpolluted rivers (Thurman 1985) Phenol has been detected in Lake Huron water at 3ndash24 ppb
(Konasewich et al 1978) and industrial rivers in the United States at 0ndash5 ppb (Sheldon and Hites 1978
1979) The annual mean concentration of phenol in water from the lower Mississippi River was 15 ppb
(EPA 1980) River water in an unspecified location in the United States was reported to contain 10ndash
100 ppb of phenol (Jungclaus et al 1978) Phenol was detected but not quantified in a Niagara River
watershed (Elder et al 1981) and in 2 of 110 raw water samples analyzed during the National Organic
Monitoring Survey (EPA 1980)
PHENOL 161
6 POTENTIAL FOR HUMAN EXPOSURE
In a study of 95 organic waste components from 139 streams in 30 states from 1999 to 2000 phenol was
detected in 85 samples with a median concentration of 07 μgL (Kolpin et al 2002) Phenol has been
detected in China in water samples taken near the Huanchao River water factory in the Tanking River
and near the Tanking River water factory at concentrations of 0053 0044 and 0033 μgL respectively
(Huang et al 2003)
Each year about 30 million m3 of mine water is pumped into the Samara River in the Ukraine Phenol
was detected in the surface water in the Samara River from 1987 to 1990 with concentrations ranging
from 15 to 83 μgL (Goncharuk and Milyukin 1999) In a study of organic contaminants in the
groundwater from creosote contaminated sites in Denmark phenol was detected in all 11 sites tested with
concentrations ranging from 11 to 249 μgL (Johansen et al 1997)
In general higher levels of phenol appear to be found in lakes and rivers that serve as water sources and
discharge receivers for industrial and population centers probably as a result of industrial activity and
commercial use of phenol-containing products For example the presence of higher levels of phenol in
the Delaware River near Philadelphia is the result of industrial effluents discharged into the sewer system
(Sheldon and Hites 1979) Phenol was detected in 23 of samples of influent of waste water from New
York City during 1989 to 1993 at concentrations ranging from 8 to 490 gL phenol was detected in 2 of
effluent samples at concentrations ranging from 6 to 310 gL during the same period (Stubin et al 1996)
The presence of phenol in drinking water probably results from using contaminated surface water or
groundwater as a source Its presence in groundwater is probably the result of release to soil often
industrial releases or leachate from waste dumps and the subsequent leaching of phenol through the soil
to the groundwater Phenol has been detected but not quantified in drinking water from 5 of 14 drinking
water treatment plants between July 1977 and June 1979 in one of three sites (groundwater source) in
three out of ten (surface water source) as well as water source used after distribution (Fielding et al
1981) Phenol levels in tap water spring water and mineral water in Italy were 058 0051 and
0161 μgL respectively (Achilli et al 1995) Phenol was detected at a maximum concentration of
1130 ppm in ninewells in Wisconsin after a spill and was detected for at least 15 years after the spill
(Delfino and Dube 1976) It was found at concentrations up to 104 ppm in groundwater from a sand
aquifer adjacent to waste ponds at a wood-preserving facility in Florida (Goerlitz et al 1985) and was
detected at 6510000 ppb in two aquifers 15 months after the completion of a coal gasification project
(Stuermer et al 1982) Phenol was detected at a maximum concentration of 19 ppm in leachates from
landfill sites in Illinois (Clark and Piskin 1977) Near a landfill in central Florida phenol was found in
PHENOL 162
6 POTENTIAL FOR HUMAN EXPOSURE
groundwater and surface water at about 17and 15 ppb respectively (Chen and Zoltek 1995) Phenol was
detected but not quantified in the groundwater at 136 of 178 CERCLA hazardous waste sites (Plumb
1987)
Phenol was detected during seven rain events in Portland Oregon between February and April of 1984
Concentrations in rain ranged from gt75 to 1200 ppt and averaged above 280 ppt Gas-phase
concentrations ranged from 220 (561 ppt) to 410 ngm3 (105 ppt) and averaged 320 ngm3 (82 ppt)
(Leuenberger et al 1985)
Phenol can also be transported in snow and rain In Germany phenol has also been detected in clouds at
Mount Brocken in June 1994 and during April to May in Great Dun Fell with mean concentrations of
30 μgL and 54 μgL respectively (Luumlttke 1999) Snow from Neulaniemi Muonio and Levi Finland
contained phenol in concentrations of 016 004 and 002 μgkg respectively (Poliakova et al 2000) In
Russia phenol was detected in snow samples at concentrations of 002 021 and 13 μgkg in Butovo
Moscow State University and Shosse Entuzoastov (a heavily industrial district in Moscow) respectively
(Poliakova et al 2000)
Phenol has been detected in the effluent discharges of a variety of industries It was found in petroleum
refinery waste water at concentrations of 335 ppm (Pfeffer 1979) and 100 ppb (Paterson et al 1996) in
the treated and untreated effluent from a coal conversion plant at 4 and 4780 ppm respectively
(Parkhurst et al 1979) and in shale oil waste water at a maximum of 45 ppm (Hawthorne and Sievers
1984) It has also been detected in the effluent from a chemical specialties manufacturing plant at 001ndash
030 ppm (Jungclaus et al 1978) in effluent from paper mills at 5ndash8 ppb (Keith 1976 Paterson et al
1996) and at 03 ppm in a 24-hour composite sample from a plant on the Delaware River 2 and 4 miles
downriver from a sewage treatment plant (Sheldon and Hites 1979)
A study of the seasonal effects on the concentration of pesticides as well as other contaminants in Gulf of
Gdansk in the Baltic Sea from autumn 2001 to spring 2003 showed only 1 out of 14 samples taken in
autumn to have a detectable level of phenol with a concentration of 23 μgL (Kot-Wasik et al 2004) In
the spring phenol was detected in 11 of the 14 samples at concentrations ranging from 03 to 08 μgL
(Kot-Wasik et al 2004)
Phenol has also been found in the primary and secondary effluent from the Los Angeles City Treatment
Plant at concentrations of 32 and lt10 ppb respectively (Young et al 1983) It was found in 3 of
PHENOL 163
6 POTENTIAL FOR HUMAN EXPOSURE
86 samples of runoff from 2 of 15 cities at 3ndash10 ppb by the US Nationwide Urban Runoff Program as of
July of 1982 (Cole et al 1984)
643 Sediment and Soil
Very few data concerning the presence of phenol in soils were found Phenol generally does not adsorb
very strongly to soils and tends to leach rapidly through soil which may account for the lack of
monitoring data since any phenol released to soils is likely to leach to groundwater Moreover phenol is
readily degraded in the environment which is expected to attenuate its levels in soil
Sediment collected 6 km northwest of the Los Angeles County waste-water treatment plant discharge
zone at Palos Verdes California contained 10 ppb (dry weight) phenol (Gossett et al 1983)
In a study of contaminants in stream bed sediments across the United States phenol was detected at
536 sites at a maximum concentration of 210 μgkg (Lopes and Furlong 2001)
644 Other Environmental Media
Phenol has been reported at concentrations of 7 and 286 ppm in smoked summer sausage and smoked
pork belly respectively (EPA 1980) and was identified but not quantified in mountain cheese (Dumont
and Adda 1978) fried bacon (Ho et al 1983) fried chicken (Tang et al 1983) and black fermented tea
(Kaiser 1967) Phenol has also been found in honey at concentrations ranging from 0 (detection limit
01 ppm) to 19 ppm (Sporns 1981) It was present each time the honey was collected with phenol-treated
boards Phenol has been reported in three different types of fermented soybean curds at concentrations
ranging from 450 to 6000 μgkg (Chung 1999)
Phenol has been found in bottomfish from five sites in Commencement Bay in Tacoma Washington at a
highest maximum average and overall maximum concentration of 014 and 022 ppm respectively
(Nicola et al 1987) Phenol has been reported to be a natural component of animal matter it has been
found at 0ndash16 ppm in rabbit muscle tissue (EPA 1980)
Phenol has been detected in the eggs of birds in the Lake Baikal Region of Siberia Russia in concentrations ranging
from 840 to lt20 μgkg dry weight (Lebedev et al 1998)
PHENOL 164
6 POTENTIAL FOR HUMAN EXPOSURE
Phenol is also found in medicinal preparations including throat lozenges mouthwashes gargles and
antiseptic lotions (Darisimall 2006) Commercial antiseptic lotions may contain up to 14 phenol
(Darisimall 2006) Package labeling information indicates that commercial throat lozenges contain up to
29 mg of phenol per lozenge (Darisimall 2006) Other consumer products such as disinfectants and
cleaners may contain phenol (OrsquoNeil 2001) It has been found that the smoke of 1 nonfilter cigarette
contains 60ndash140 μg of phenol 19ndash35 μg for a filter-tipped cigarette and 24ndash107 μg in cigars (IARC
1986 NCI 1998) Using a testing method developed by the US Federal Trade Commission (FTC)
analysis of the smoke from several different brands and types of cigarettes found phenol in concentrations
ranging from 03 to 68 μgcigarette (Roemer et al 2004) The lowest concentration came from an
electrically heated prototype cigarette while most of the commercial brands were within a range of 26ndash
234 μgcigarette (Roemer et al 2004)
While not detected in topsoil from Holy Cross Mountain Park Poland and surrounding area phenol was
detected in 4 out of the 12 pine needle samples taken from the same area (Migaszewski 1999)
Phenol was detected in 303 of 389 samples of settled dust from indoor residences in Sweden the mean
concentration of phenol was 4 μgg dust (Nilsson et al 2005)
65 GENERAL POPULATION AND OCCUPATIONAL EXPOSURE
Data concerning concentrations of phenol in ambient air are insufficient to estimate the potential for
exposure by inhalation However smoke from a single nonfilter cigarette was observed to contain 60ndash
140 μg phenol while levels of phenol range from 19 to 35 μg in the smoke of filter-tipped cigarettes and
from 24 to 107 μg in the smoke of cigars (IARC 1986 NCI 1998) Therefore indoor environments
polluted with tobacco smoke are likely to contain measurable amounts of phenol (Guerin et al 1992)
Nonsmokers who live with smokers are thought to be exposed to as much as 11 μgm3 This would
account for a daily inhalation of 6ndash14 μgday (Nazaroff and Singer 2004)
Phenol concentrations in surface and drinking waters are expected to vary with location and proximity to
varying industrial and municipal discharges Considering the lack of quantitative current monitoring data
and the probable seasonal spatial and temporal variations in the concentrations of phenol at these
sources it is not possible to estimate accurately a potential daily dose of phenol from drinking
contaminated water or from dermal exposure to contaminated water Nonetheless it is probable that only
those systems that receive their water from contaminated surface water and groundwater contain phenol
PHENOL 165
6 POTENTIAL FOR HUMAN EXPOSURE
Although phenol has been identified in various food products a quantitative estimate regarding the intake
of phenol from the ingestion of food has not been estimated
Few data concerning occupational exposures to phenol were located The average airborne
concentrations of phenol to which workers were exposed at three locations within two wood creosote
impregnation plants ranged from 003 to 05 ppm (Heikkila et al 1987) A phenol concentration of
approximately 05 ppm was measured in the workroom air at a casting factory in Osaka City Japan
(Kuwata et al 1980) and concentrations as high as 32 ppm were measured in Japanese Bakelite factories
(Ohtsuji and Ikeda 1972) Considering the lack of quantitative monitoring data for phenol in occupational
atmospheres it is not possible to estimate the potential for occupational exposure to phenol The data
however do show that exposure to phenol through breathing and dermal contact with contaminated
workroom atmospheres is possible The National Occupational Exposure Survey (NOES) conducted by
NIOSH estimated that 584372 workers were exposed to phenol in the United States (NIOSH 1990) The
NOES database does not contain information on the frequency concentration or duration of exposures
The survey provides only estimates of workers potentially exposed to chemicals in the workplace
Other occupations that may have increased exposure risk include laboratory workers morticians and
house cleaners Phenol is a common solvent used in laboratory research as well as a component of
embalming fluid The general population may be exposed to phenol found in consumer products such as
general disinfectants used to clean toilets floors drains and other areas (Lewis 2001 OrsquoNeil 2001)
House cleaners and people who work with these products daily are likely to have increased exposure
Exposure to phenol also occurs through the use and subsequent ingestion of phenol-containing products
including mouthwashes gargles and throat sprays (Darisimall 2006) The concentration of phenol in
throat sprays ranged from 05 to 14 phenol Determining actual dosage from these sprays would be
difficult as the delivery method is not precise Cepastatreg lozenges a readily available remedy for sore
throats contains 145ndash29 mg phenollozenge (Darisimall 2006) If a patient (adults and children over 6)
takes the maximum recommended daily number of 18 lozenges this would result in approximate doses of
270ndash520 mg phenolday There is no control over the intake of non-prescription drugs and therefore
some individuals may consume considerably higher doses of phenol
The estimated relative contributions of the various exposure routes and sources of total phenol exposure
cannot be estimated using the available data Nonetheless for persons not exposed to phenol in the
workplace exposure will most likely result from inhalation of contaminated ambient air primarily in the
PHENOL 166
6 POTENTIAL FOR HUMAN EXPOSURE
vicinity of industries and municipalities that release significant amounts of phenol into the atmosphere
ingestion of drinking water from contaminated surface waters or groundwaters ingestion of phenol-
containing products and dermal exposure to contaminated water and to phenol-containing products
Dermal contact with phenol or ingestion of phenol-containing products probably constitutes the largest
consumer exposure although this exposure may occur on an acute basis Inhalation and dermal
exposures appear to be most significant in occupational settings Total phenol exposure for workers
exposed to phenol in the workplace is probably substantially higher than for those not exposed in the
workplace
Exposure to benzene is likely to increase phenol exposure because phenol is a metabolite of benzene and
is often used to detect benzene exposure Major releases of benzene include cigarette smoke auto
exhaust and gasoline fumes
66 EXPOSURES OF CHILDREN
This section focuses on exposures from conception to maturity at 18 years in humans Differences from
adults in susceptibility to hazardous substances are discussed in Section 37 Childrenrsquos Susceptibility
Children are not small adults A childrsquos exposure may differ from an adultrsquos exposure in many ways
Children drink more fluids eat more food breathe more air per kilogram of body weight and have a
larger skin surface in proportion to their body volume A childrsquos diet often differs from that of adults
The developing humanrsquos source of nutrition changes with age from placental nourishment to breast milk
or formula to the diet of older children who eat more of certain types of foods than adults A childrsquos
behavior and lifestyle also influence exposure Children crawl on the floor put things in their mouths
sometimes eat inappropriate things (such as dirt or paint chips) and spend more time outdoors Children
also are closer to the ground and they do not use the judgment of adults to avoid hazards (NRC 1993)
Oral dermal and combined oral-dermal exposures are the most likely routes by which children will be
exposed to phenol Oral exposure to low levels of phenol among children is likely because many
consumer products contain phenol particularly in medicines such as gargles throat lozenges and others
(Darisimall 2006) Products other than medicines that contain phenols include general disinfectants
cleaners and epoxies
PHENOL 167
6 POTENTIAL FOR HUMAN EXPOSURE
Some foods containing phenol have been identified (see Section 644) and ingestion of these could result
in low levels of phenol exposure in children In addition phenol is produced endogenously as a
breakdown product of protein metabolism normal concentrations in urine generally do not exceed
20 mgL (ACGIH 2001)
Since phenol can be readily absorbed through the skin (ACGIH 2001) children may be more susceptible
to low levels of phenol exposure since they have a higher skin-surface-area to weight ratio Since young
children are more likely to come in contact with the floor and other low-lying areas they may be exposed
to phenol found in consumer products such as general disinfectants used to clean toilets floors drains
and other areas (Lewis 2001 OrsquoNeil 2001)
Exposure to phenol through inhalation is a less probable route than oral and dermal It is known that both
cigarettes and cigars contain small amounts (19ndash140 μg) of phenol (IARC 1986 NCI 1998) and smoking
these products indoors produces a measurable amount of phenol (Guerin et al 1992) If children are
present in indoor environments polluted with tobacco smoke they may be exposed to low levels of
phenol
67 POPULATIONS WITH POTENTIALLY HIGH EXPOSURES
Populations with potentially high exposure to phenol generally include those who are exposed to
relatively highly contaminated environments over long periods of time These include populations
exposed to both identified and unidentified phenol-containing waste disposal sites and landfills
Populations residing in the vicinity of industries that manufacture or use phenol and large population
centers may be exposed to potentially high levels of phenol Persons who work at establishments that
manufacture or use phenol have a risk for high exposure to phenol Populations that regularly ingest food
contaminated with phenol or that regularly ingest or come in contact with phenol-containing products are
at risk for high exposure to phenol Populations that live near a phenol spill site especially those whose
water supply sources are near the spill sites have a risk for high exposure to phenol Relatively high
exposure may also result from exposure to emissions from municipal waste incinerators and cigarette
smoke although no quantitative data concerning phenol emission from these sources were located Low
income communities and minority populations are more likely to live adjacent to waste disposal sites and
landfills where phenol is present
PHENOL 168
6 POTENTIAL FOR HUMAN EXPOSURE
THE NOES conducted by NIOSH estimated that 584372 workers were exposed to phenol in the United
States (CDC Website) Workers in the petroleum industry as well as workers in industries that
manufacture of caprolactam (nylon manufacture) bisphenol A (epoxy resin and polycarbonate
manufacture) herbicides wood preservatives hydraulic fluids heavy-duty surfactants lube-oil additives
tank linings and coatings and intermediates for plasticizers and other specialty chemicals may be
exposed to phenol Phenol is also used in throat lozenges disinfectants and ointments It is also used for
facial skin peels and to cause nerve block (Gingell et al 2001) A list of estimated work induced
exposure events for 19 different industries is presented in Table 6-2 (Brandorff et al 1995)
People who are exposed to large amounts of benzene are also likely to be exposed to large amounts of
phenol a metabolite of benzene Elevated levels of phenol have been detected in workers occupationally
exposed to benzene Workers exposed to 08ndash251 or 331ndash3317 ppm for 25ndash3 hours during an 8-hour
workday had median urinary phenol levels of 556 and 351 ngg creatine respectively (Rothman et al
1998) Control workers who were not exposed to benzene at the workplace had urinary phenol levels of
173 ngg creatine (Rothman et al 1998)
68 ADEQUACY OF THE DATABASE
Section 104(i)(5) of CERCLA as amended directs the Administrator of ATSDR (in consultation with the
Administrator of EPA and agencies and programs of the Public Health Service) to assess whether
adequate information on the health effects of phenol is available Where adequate information is not
available ATSDR in conjunction with NTP is required to assure the initiation of a program of research
designed to determine the health effects (and techniques for developing methods to determine such health
effects) of phenol
681 Identification of Data Needs
Physical and Chemical Properties Knowledge of physical and chemical properties is essential for
estimating the partitioning of a chemical in the environment Information about the physical and
chemical properties of phenol is available (Hawley 1981 HSDB 2008 IARC 1989) and the database is
adequate for the input requirements of environmental models that predict the behavior of a chemical
under specific conditions
Production ImportExport Use Release and Disposal According to the Emergency
Planning and Community Right-to-Know Act of 1986 42 USC Section 11023 industries are required
PHENOL 169
6 POTENTIAL FOR HUMAN EXPOSURE
Table 6-2 Estimated Exposure To Phenol At Various Industry Sites
Industry Estimated number of exposure events
Estimated weight used in tonnes of substance
Manufacture of basic metals 180 17 Manufacture of fabricated metal products 8200 27 Electrical machinery and apparatus 1400 00012 Manufacture of transport equipment 700 40 Painters and carpenters 440 0021 Construction 4300 11 Wholesale trade 840 16 Manufacture of textiles and leather 2600 1 Manufacture of wood and furniture 670 12 Manufacture of chemicals 580 085 Manufacture of non-metallic mineral products
1300 4100
Manufacture of precision and optical instruments
1300 00023
Manufacture of plastic and boat building repair
840 lt00001
Personal services cleaning and hair dressing
260 00002
Sewage and refuse disposal 210 00009 Agricultural hunting and forestry 550 065 Health sciences and pharmacies 1200 025
Source Brandorff et al 1995
PHENOL 170
6 POTENTIAL FOR HUMAN EXPOSURE
to submit substance release and off-site transfer information to the EPA The TRI which contains this
information for 2005 became available in May of 2007 This database is updated yearly and should
provide a list of industrial production facilities and emissions
Additional production data are available from the Chemical Marketing Reporter (CMR 2005) and
importexport data for phenol are available on the US International Trade Commission website (USITC
2008) Additional data are not needed at this time
Environmental Fate Based on the physical properties of phenol volatilization and sorption of
phenol to sediments are not expected to be important transport mechanisms (Lyman et al 1982) The
adsorption of phenol to soils has been shown to increase with increasing organic matter (Xing et al
1994) Photochemical degradation of phenol is thought to be an important process both in air (EPA
1979a) and water (Scully and Hoigne 1987) Phenol is also readily biodegradable (Ludzack and Ettinger
1960 Rubin and Alexander 1983 Scott et al 1983 Stover and Kincannon 1983) Soil sorption data are
available (Artiola-Fortuny and Fuller 1982 Boyd 1982 Briggs 1981 Sacan and Balcioglu 1996 Scott et
al 1983) Additional data are not needed at this time
Bioavailability from Environmental Media Data from monitoring studies indicate that phenol is
present in the environment (EPA 1981a 1982 Gossett et al 1983 Hoff and Chan 1987 Konasewich et
al 1978 Sheldon and Hites 1978 1979 Thurman 1985) as well as in environmental organisms (Nicola et
al 1987) Exposure to phenol is most likely to be highest in areas at or near industrial centers and
population centers where drinking and bathing water ambient air and certain foods such as fish are
obtained from sources contaminated with phenol Reliable data on the bioavailability of phenol from
inhaled air and from skin exposed to phenol vapor have been reported for humans (Piotrowski 1971)
Studies of bioavailability of phenol from ingested soil and foods and dermal contact with contaminated
water are needed for evaluating the hazards posed by ingesting materials that have been contaminated
with phenol
Food Chain Bioaccumulation No studies were located regarding the food chain bioaccumulation
of phenol from environmental media Data from monitoring studies indicate that phenol is present in the
environment as well as in environmental organisms (Nicola et al 1987) The available bioaccumulation
studies are concerned only with exposure of fish to aqueous concentrations of phenol Although the
results of these studies indicate a low potential for bioaccumulation (see Section 631) the detection of
phenol in fish (see Section 644) indicates that phenol can be found in aquatic organisms it is possible
PHENOL 171
6 POTENTIAL FOR HUMAN EXPOSURE
that food chain bioaccumulation may occur A clearer understanding of the potential for bioaccumulation
would aid in determining how levels in the environment affect the food chain and potentially impact
human exposure levels A study examining phenol levels in organisms from several trophic levels is
needed
Exposure Levels in Environmental Media Reliable monitoring data for the levels of phenol in
contaminated media at hazardous waste sites are needed so that the information obtained on levels of
phenol in the environment can be used in combination with the known body burden of phenol to assess
the potential risk of adverse health effects in populations living in the vicinity of hazardous waste sites
Phenol has been measured in air (Cronn et al 1977 EPA 1981a 1982) water (EPA 1980 Sheldon and
Hites 1978 1979 Thurman 1985) and sediments (Gossett et al 1983) Additional more recent
monitoring data would help to estimate human exposure to phenol
Exposure Levels in Humans Data concerning exposure levels in humans are incomplete and not
current (Heikkila et al 1987 Kuwata et al 1980 Ohtsuji and Ikeda 1972) A detailed recent database of
exposure would be helpful in determining the current exposure levels thereby allowing the estimation of
the average daily dose associated with various scenarios such as living near a hazardous waste site or
landfill or with drinking water containing phenol An environmental media monitoring program would
provide the necessary information for estimating environmental exposures while a detailed examination
of the uses of phenol and the kinds of potential exposure in addition to workplace monitoring would
probably provide adequate workplace information The environmental media that would provide the most
useful information are air groundwater and surface and drinking water in urban and industrial locations
and air groundwater and surface water at hazardous waste sites Performing the monitoring over a
1-year period would allow estimation of seasonal variations
This information is necessary for assessing the need to conduct health studies on these populations
Exposures of Children Children are likely to be exposed to low levels of phenol from the use of
many consumer products including medicines and cleaning agents (Budavari et al 1989 Douglas 1972
EPA 1980 Hawley 1981) There are no known data that quantify the level of exposure to phenol in
children It is likely that young children may be exposed to low levels of phenol because they come into
contact with the floor and other areas where disinfectants containing phenol might be used More studies
are needed to assess whether children differ in their weight-adjusted intake of phenol as little or no
PHENOL 172
6 POTENTIAL FOR HUMAN EXPOSURE
information is known Studies are needed to measure the baseline phenol level in childrenrsquos urine in
order to use phenol levels in urine as a biomarker of exposure
Child health data needs relating to susceptibility are discussed in Section 3122 Identification of Data
Needs Childrenrsquos Susceptibility
Exposure Registries No exposure registries for phenol were located This substance is not
currently one of the compounds for which a sub-registry has been established in the National Exposure
Registry The substance will be considered in the future when chemical selection is made for sub-
registries to be established The information that is amassed in the National Exposure Registry facilitates
the epidemiological research needed to assess adverse health outcomes that may be related to exposure to
this substance
682 Ongoing Studies
The Federal Research in Progress (FEDRIP 2006) database provides additional information obtainable
from a few ongoing studies that may fill in some of the data needs identified in Section 681 The only
study pertaining to the potential for human exposure found in this database was an exposure assessment
study done at Mount Sinai School of Medicine at New York University and supported by National
Institute of Environmental Health Sciences Part of this research is to design new approaches to assess
and quantify the levels of exposures to known toxicants in children and infants
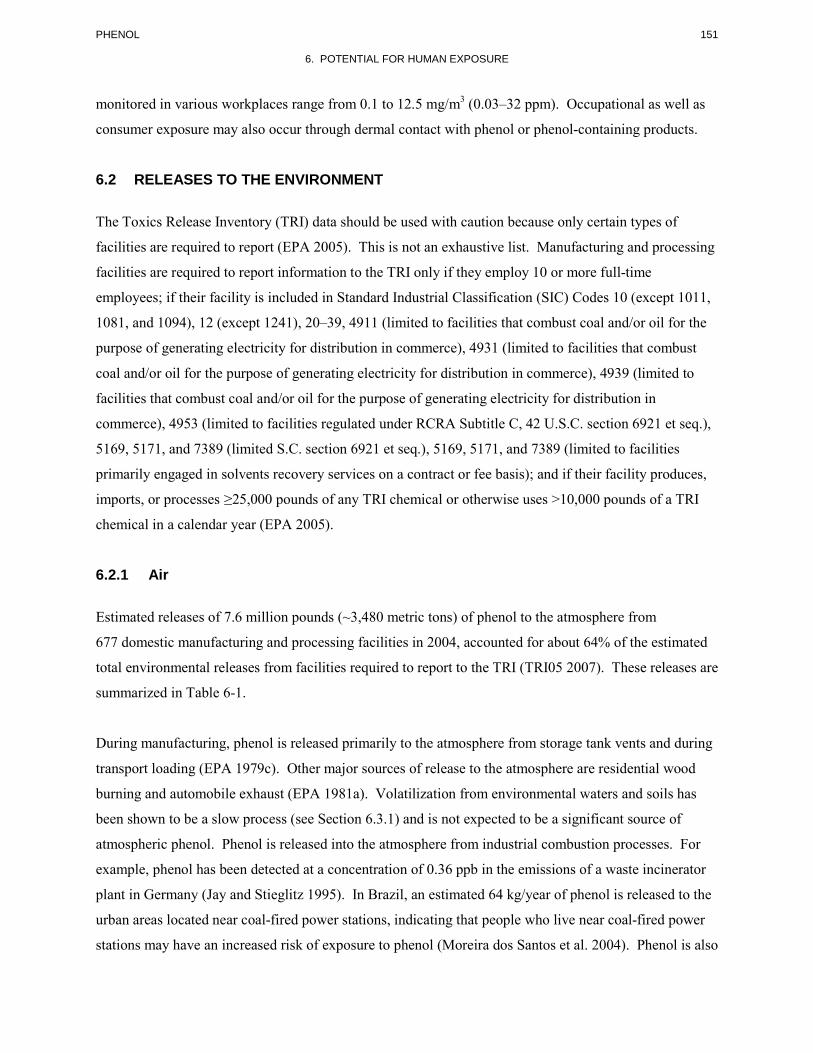
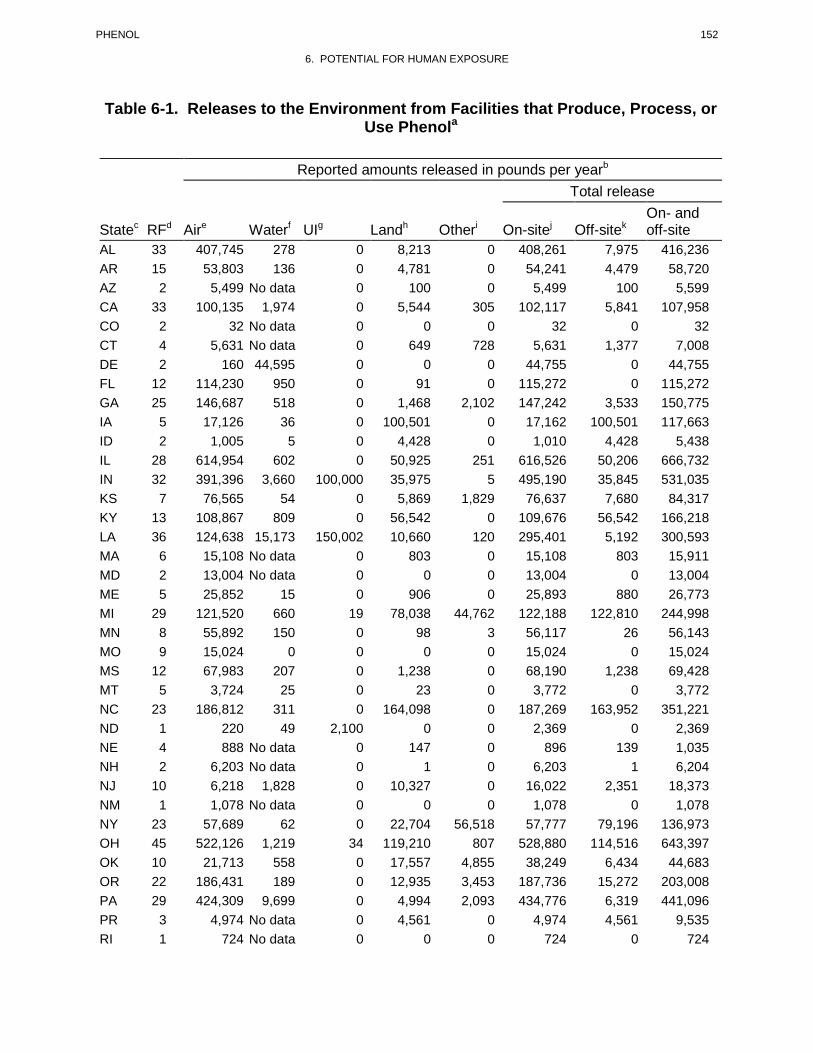
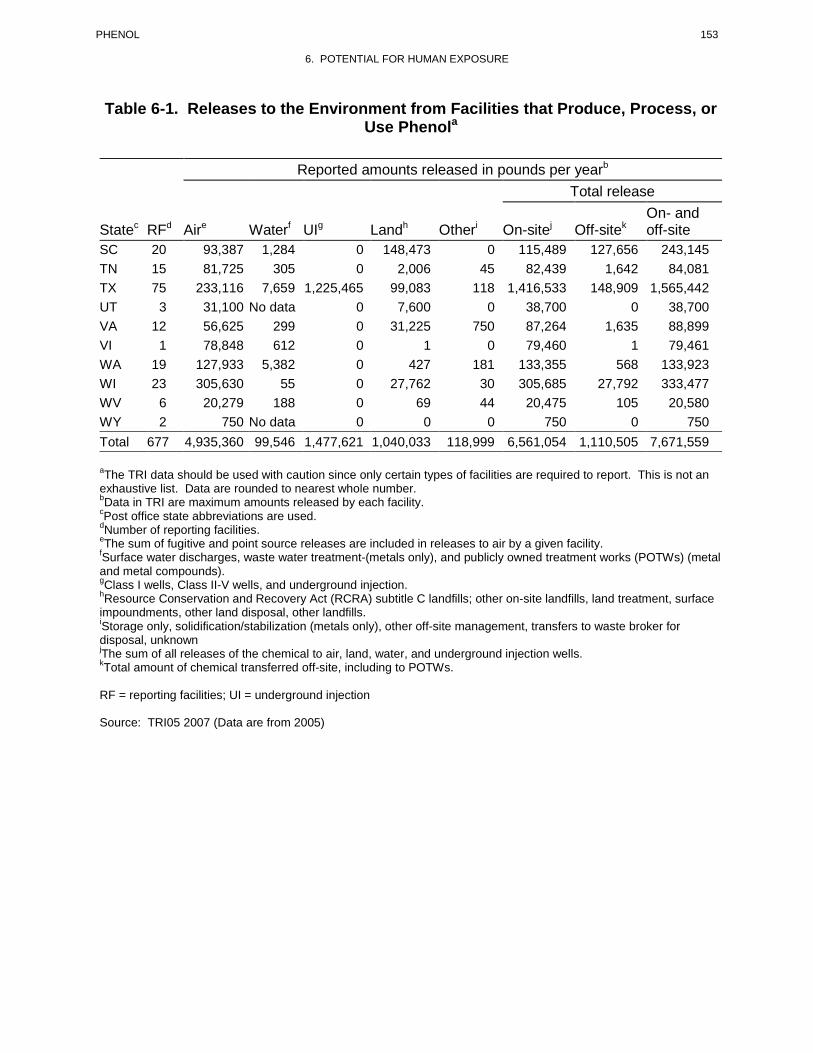
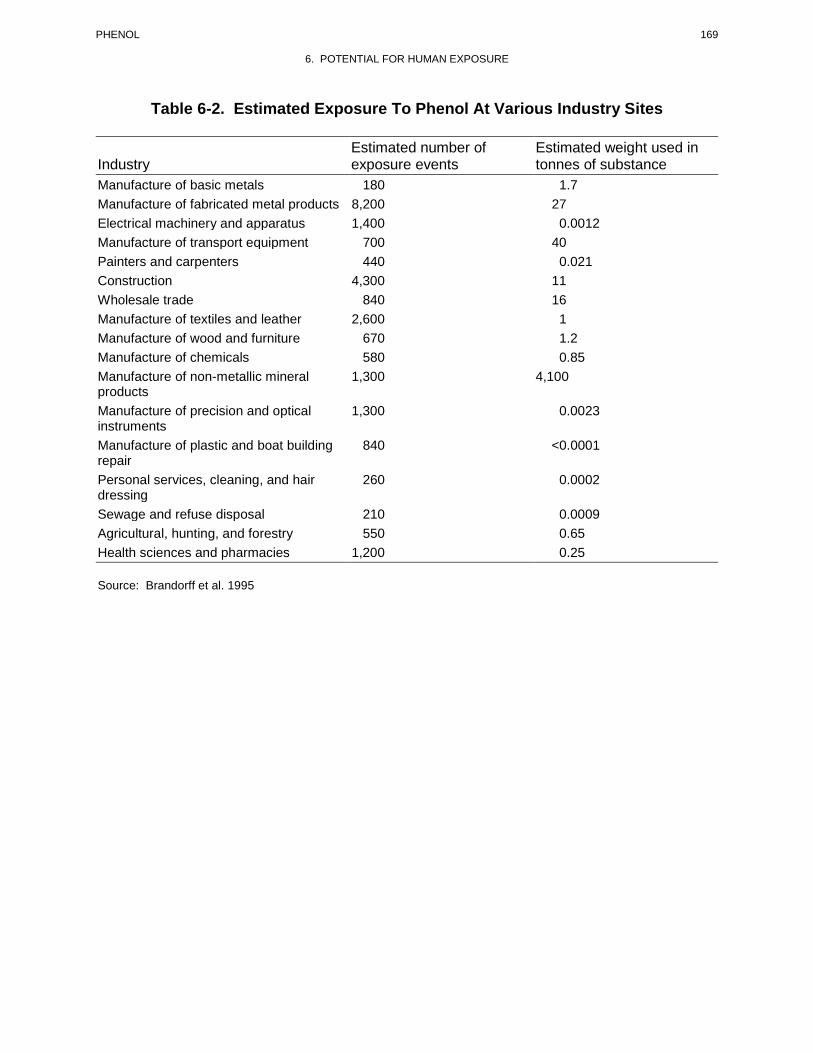
Recommended