Consumer Confidence Tracker
July 2014
PREPARED BY:Luke Reaper and Ciara McCarthy
Behaviour & AttitudesJ.5271

22
Introduction
3
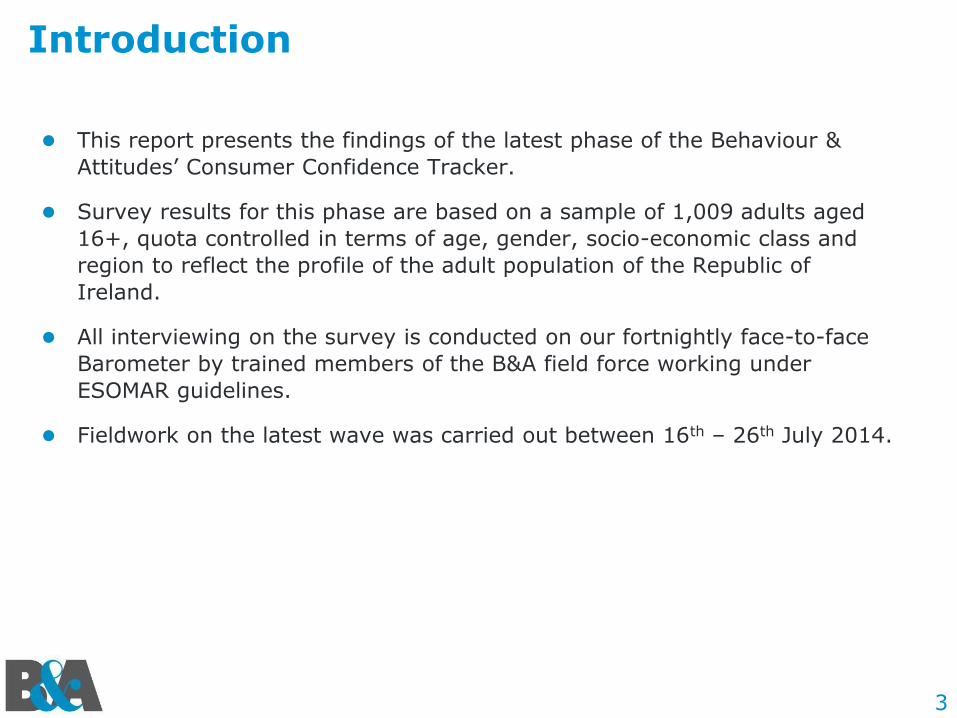
Introduction
This report presents the findings of the latest phase of the Behaviour &
Attitudes’ Consumer Confidence Tracker.
Survey results for this phase are based on a sample of 1,009 adults aged
16+, quota controlled in terms of age, gender, socio-economic class and
region to reflect the profile of the adult population of the Republic of
Ireland.
All interviewing on the survey is conducted on our fortnightly face-to-face
Barometer by trained members of the B&A field force working under
ESOMAR guidelines.
Fieldwork on the latest wave was carried out between 16th – 26th July 2014.
4
About Behaviour & Attitudes
B&A is Ireland’s largest and most experienced independently owned
research company.
We pride ourselves on having the most experienced director team
in Ireland. All projects have a director involved.
Established over 25 years ago, Behaviour and Attitudes provides a full
range of market research services, ranging from CAPI, CATI, online and of
course qualitative.
Specialist sectors include: Retail & Shopper, Technology & Telecoms, Media,
Financial, Political & Social, Polling, Automotive, Healthcare and Public
Sector & Utilities.
For more information please visit our website at: www.banda.ie or contact
us on +353 1 2057500.
66
The Macro Context
7
Summary
Forecasted GDP (Source: Davy August 2014) for the year is expected to reach
3.5% with GNP at 2.7%, exceeding all previous forecasts. Consumer spending is
forecast to grow by 1.5% in 2014 (Source: Davy August 2014).
Good news also evident on the employment front: unemployment figures are at
the lowest they have ever been now vs. pre recessionary times in Ireland.
Overall, there are 8.4% less people on the live register now versus July 2013.
The unemployment rate is now 11.5% compared to 14.7% in 2012.
8
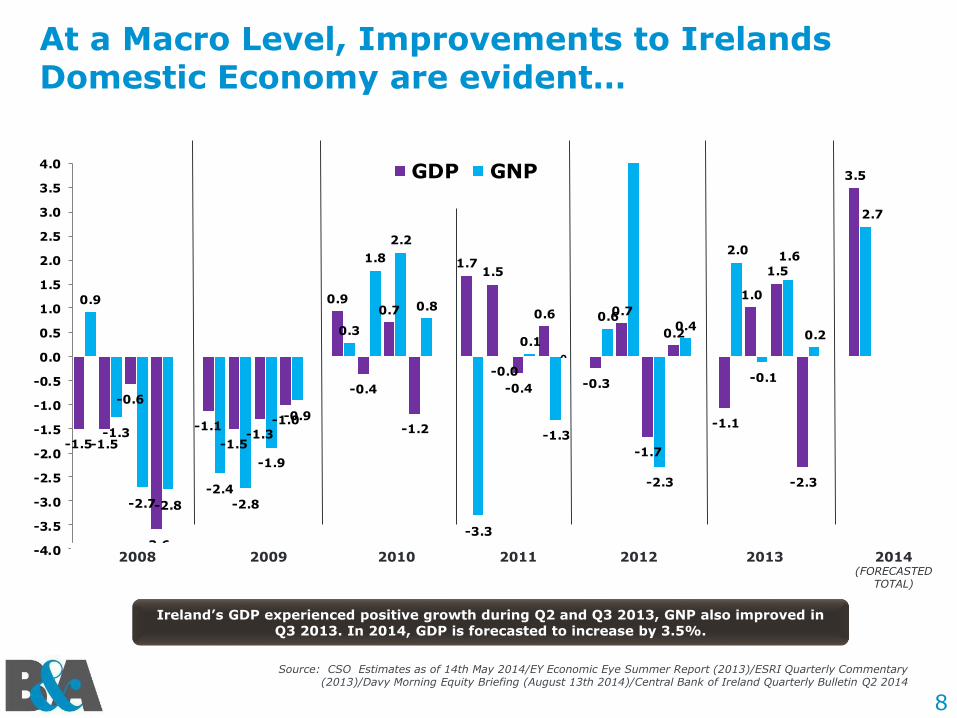
At a Macro Level, Improvements to Irelands Domestic Economy are evident…
Source: CSO Estimates as of 14th May 2014/EY Economic Eye Summer Report (2013)/ESRI Quarterly Commentary (2013)/Davy Morning Equity Briefing (August 13th 2014)/Central Bank of Ireland Quarterly Bulletin Q2 2014
-1.5 -1.5
-0.6
-3.6
-1.1
-1.5 -1.3
-1.0
0.9
-0.4
0.7
-1.2
1.7 1.5
-0.4
0.6
-0.3
0.7
-1.7
0.2
-1.1
1.0
1.5
-2.3
3.5
0.9
-1.3
-2.7 -2.8
-2.4
-2.8
-1.9
-0.9
0.3
1.8
2.2
0.8
-3.3
-0.0
0.1
-1.3
0.6
-2.3
0.4
2.0
-0.1
1.6
0.2
2.7
-4.0
-3.5
-3.0
-2.5
-2.0
-1.5
-1.0
-0.5
0.0
0.5
1.0
1.5
2.0
2.5
3.0
3.5
4.0GDP GNP
0
2008 2009 2010 2011 2012 2013 2014(FORECASTED
TOTAL)
Ireland’s GDP experienced positive growth during Q2 and Q3 2013, GNP also improved in Q3 2013. In 2014, GDP is forecasted to increase by 3.5%.
Consumer Spendingis expected to grow by 1.5% in 2014 and 1.9% in 2015.
Source: Davy Morning Equity Briefing (August 13th 2014)
10
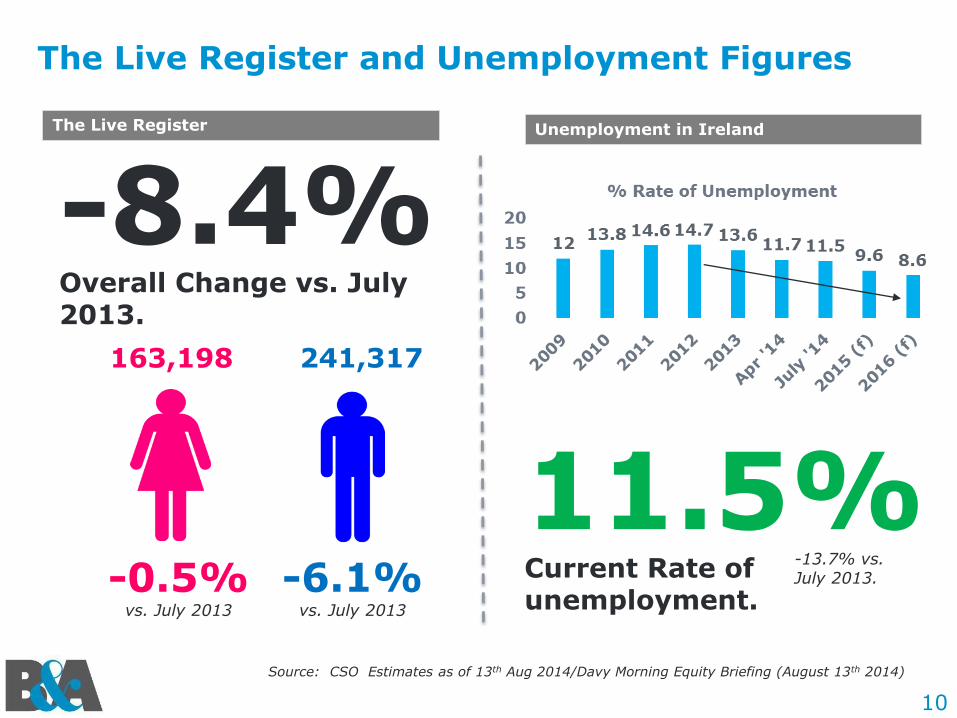
Source: CSO Estimates as of 13th Aug 2014/Davy Morning Equity Briefing (August 13th 2014)
-8.4%Overall Change vs. July 2013.
-0.5%vs. July 2013
-6.1%vs. July 2013
11.5%Current Rate of unemployment.
163,198 241,317
The Live Register
The Live Register and Unemployment Figures
Unemployment in Ireland
-13.7% vs. July 2013.

Source: Morgan McKinley Irish Employment Monitor (2014).
Professional Job Vacancieswere up 2% this July 2014 vs. July 2013.
12
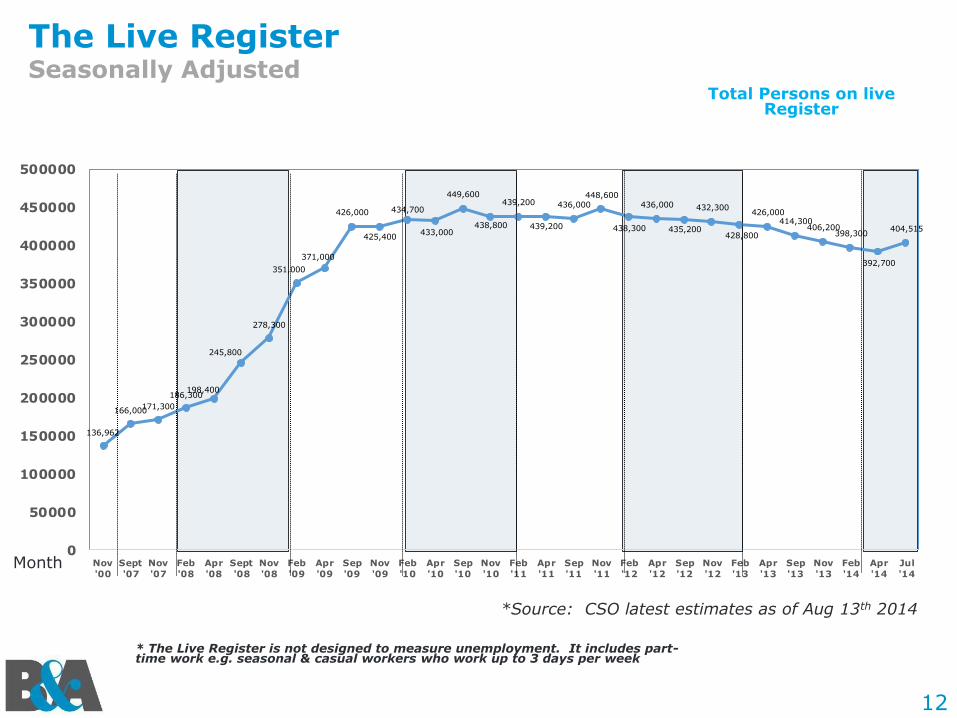
The Live RegisterSeasonally Adjusted
* The Live Register is not designed to measure unemployment. It includes part-time work e.g. seasonal & casual workers who work up to 3 days per week
*Source: CSO latest estimates as of Aug 13th 2014
136,962
166,000171,300
186,300198,400
245,800
278,300
351,000
371,000
426,000
425,400
434,700
433,000
449,600
438,800
439,200
439,200
436,000448,600
438,300
436,000
435,200
432,300
428,800
426,000414,300
406,200398,300
392,700
404,515
0
50000
100000
150000
200000
250000
300000
350000
400000
450000
500000
Nov
'00
Sept
'07
Nov
'07
Feb
'08
Apr
'08
Sept
'08
Nov
'08
Feb
'09
Apr
'09
Sep
'09
Nov
'09
Feb
'10
Apr
'10
Sep
'10
Nov
'10
Feb
'11
Apr
'11
Sep
'11
Nov
'11
Feb
'12
Apr
'12
Sep
'12
Nov
'12
Feb
'13
Apr
'13
Sep
'13
Nov
'13
Feb
'14
Apr
'14
Jul
'14
Total Persons on live Register
Month
Source: Davy Morning Equity Briefing (August 13th 2014)
Investment in the
Construction Sector is expected to increaseby 14.5% this year and8.6% next year.
14
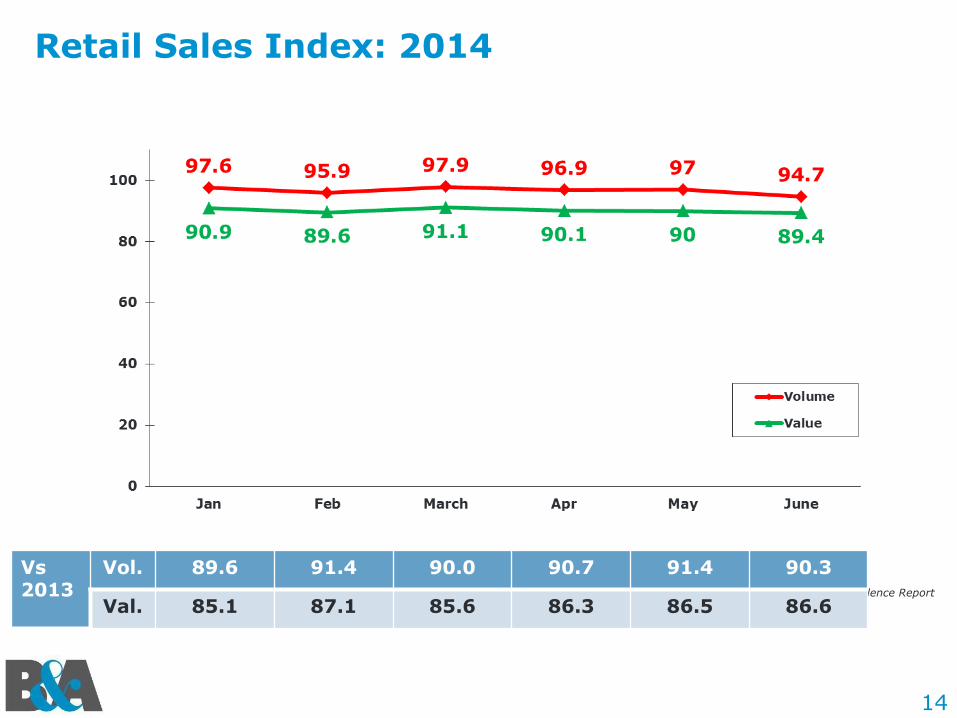
Retail Sales Index: 2014
Source: B&A Consumer Confidence Report
Vs 2013
Vol. 89.6 91.4 90.0 90.7 91.4 90.3
Val. 85.1 87.1 85.6 86.3 86.5 86.6
15
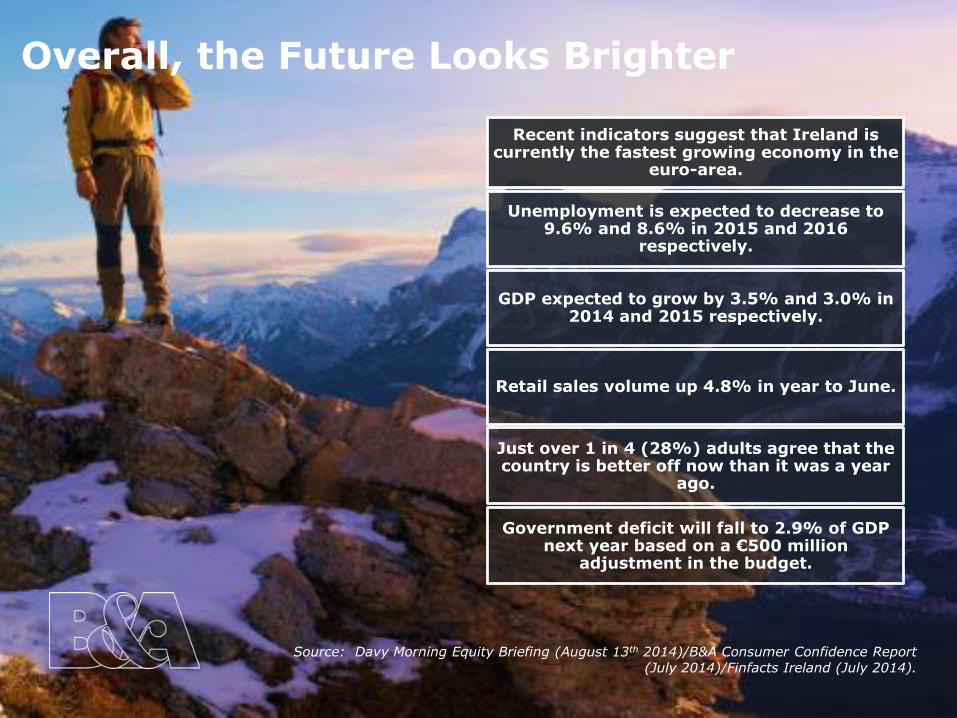
Overall, the Future Looks Brighter
Recent indicators suggest that Ireland is currently the fastest growing economy in the
euro-area.
Unemployment is expected to decrease to 9.6% and 8.6% in 2015 and 2016
respectively.
GDP expected to grow by 3.5% and 3.0% in 2014 and 2015 respectively.
Retail sales volume up 4.8% in year to June.
Just over 1 in 4 (28%) adults agree that the country is better off now than it was a year
ago.
Government deficit will fall to 2.9% of GDP next year based on a €500 million
adjustment in the budget.
Source: Davy Morning Equity Briefing (August 13th 2014)/B&A Consumer Confidence Report (July 2014)/Finfacts Ireland (July 2014).
1616
Consumer ConfidenceFindings
17
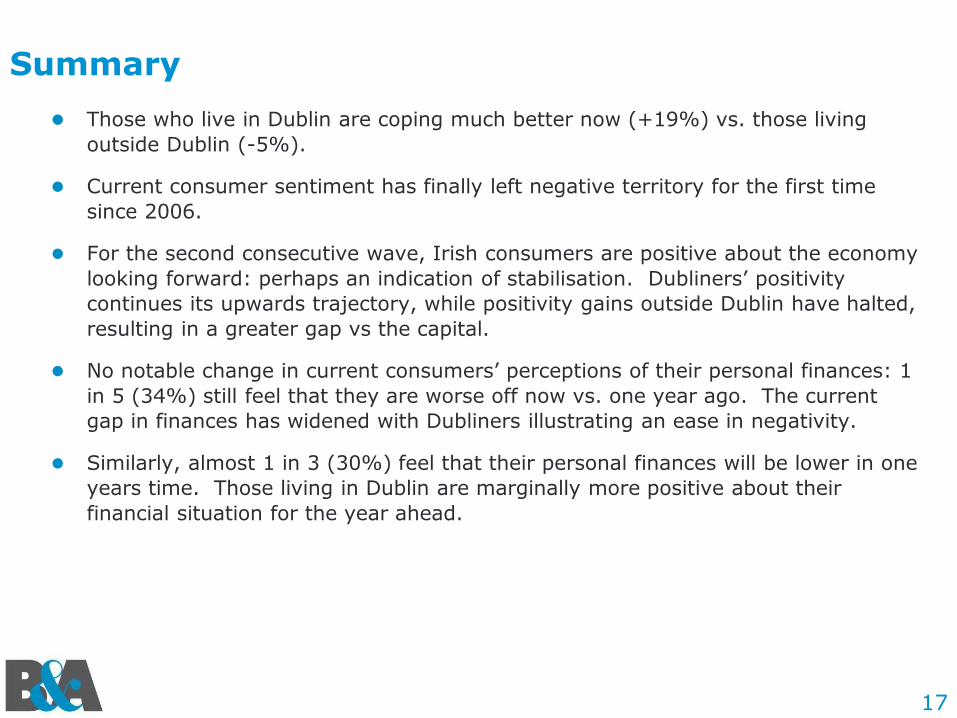
Summary
Those who live in Dublin are coping much better now (+19%) vs. those living
outside Dublin (-5%).
Current consumer sentiment has finally left negative territory for the first time
since 2006.
For the second consecutive wave, Irish consumers are positive about the economy
looking forward: perhaps an indication of stabilisation. Dubliners’ positivity
continues its upwards trajectory, while positivity gains outside Dublin have halted,
resulting in a greater gap vs the capital.
No notable change in current consumers’ perceptions of their personal finances: 1
in 5 (34%) still feel that they are worse off now vs. one year ago. The current
gap in finances has widened with Dubliners illustrating an ease in negativity.
Similarly, almost 1 in 3 (30%) feel that their personal finances will be lower in one
years time. Those living in Dublin are marginally more positive about their
financial situation for the year ahead.
18
Summary
In terms of saving, just 1 in 10 (10%) feel that they expect to save more in the
year ahead vs. now.
Overall, personal asset value has improved (largely fuelled by Dubliners) and has
left negative territory for the first time since 2007.
Dubliners are more positive about their personal asset value increasing in the year
ahead, whereas those outside Dublin remain in negative territory.
Purchasing power: just 1 in 10 (11%) expect that they will be spending more in
the year ahead. These were mainly younger adults (U35 years), Dubliners, and
those from a white collar background.
The average disposable income levels has halved in 5 years, but decline appears
to have abated. Again, a further indication of stabilisation.
19
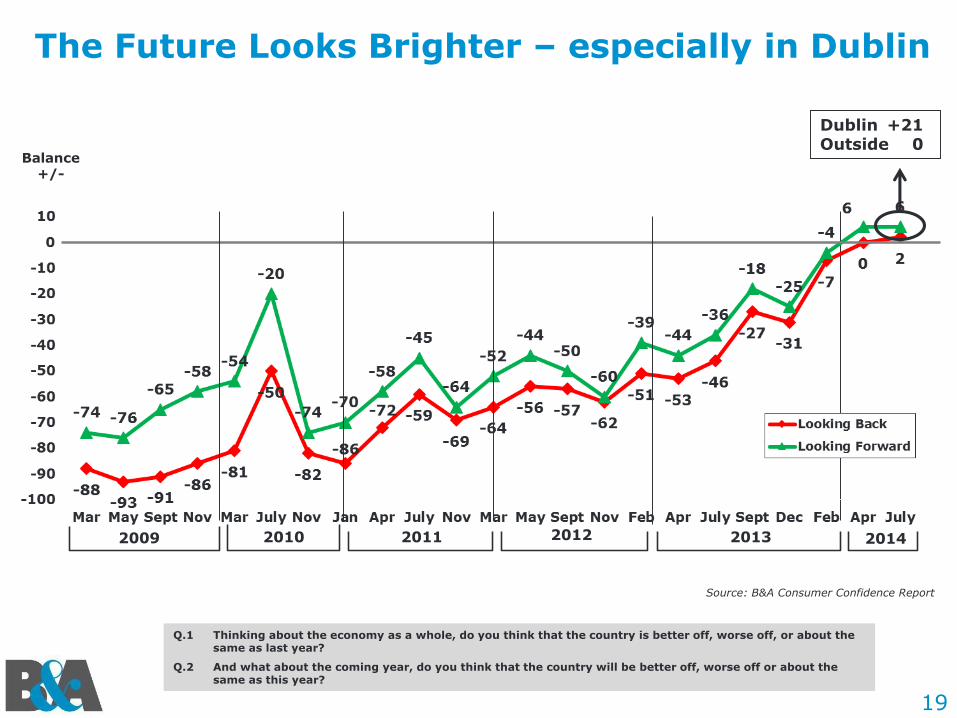
The Future Looks Brighter – especially in Dublin
Balance +/-
2009 2010 2011 2012
Source: B&A Consumer Confidence Report
2013
Q.1 Thinking about the economy as a whole, do you think that the country is better off, worse off, or about the same as last year?
Q.2 And what about the coming year, do you think that the country will be better off, worse off or about the same as this year?
Dublin +21Outside 0
2014
23
The Economy:Looking Forward
24
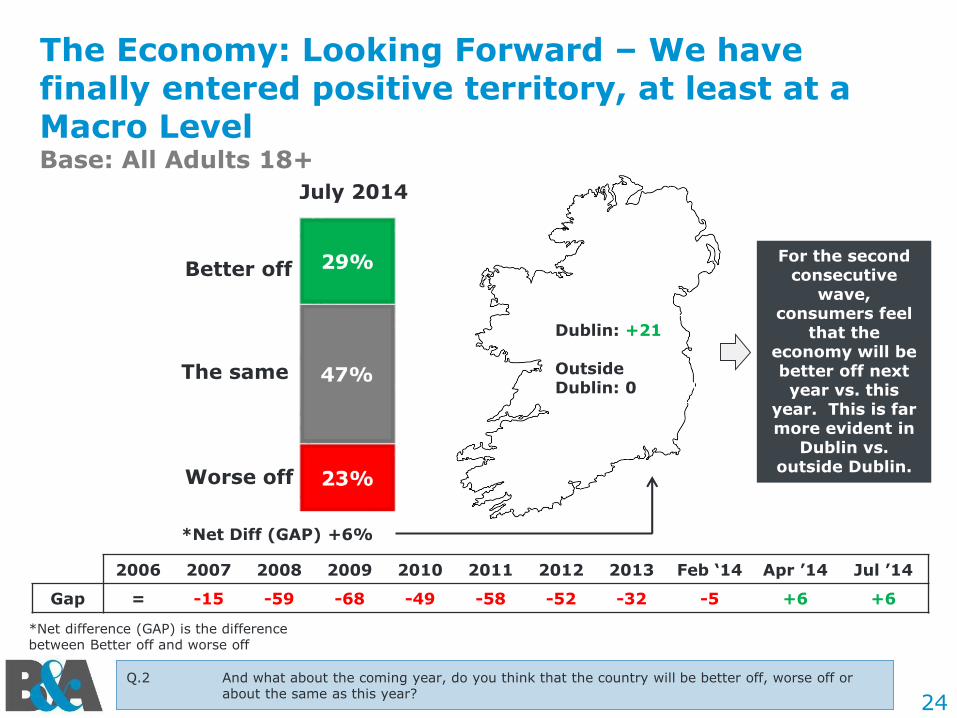
The Economy: Looking Forward – We have finally entered positive territory, at least at a Macro LevelBase: All Adults 18+
Q.2 And what about the coming year, do you think that the country will be better off, worse off or about the same as this year?
Dublin: +21
OutsideDublin: 0
2006 2007 2008 2009 2010 2011 2012 2013 Feb ‘14 Apr ’14 Jul ’14
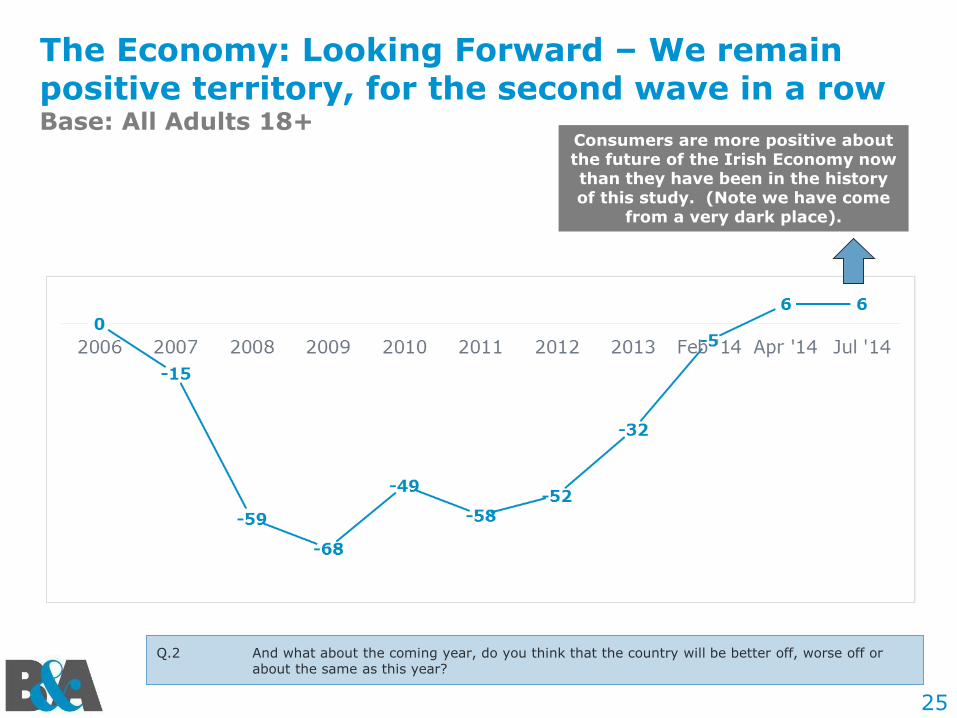
Gap = -15 -59 -68 -49 -58 -52 -32 -5 +6 +6
Better off
The same
Worse off
For the second consecutive
wave, consumers feel
that the economy will be better off next year vs. this
year. This is far more evident in
Dublin vs. outside Dublin.
July 2014
*Net Diff (GAP) +6%
*Net difference (GAP) is the difference between Better off and worse off
25
The Economy: Looking Forward – We remain positive territory, for the second wave in a rowBase: All Adults 18+
Q.2 And what about the coming year, do you think that the country will be better off, worse off or about the same as this year?
Consumers are more positive about the future of the Irish Economy now than they have been in the history of this study. (Note we have come
from a very dark place).
26
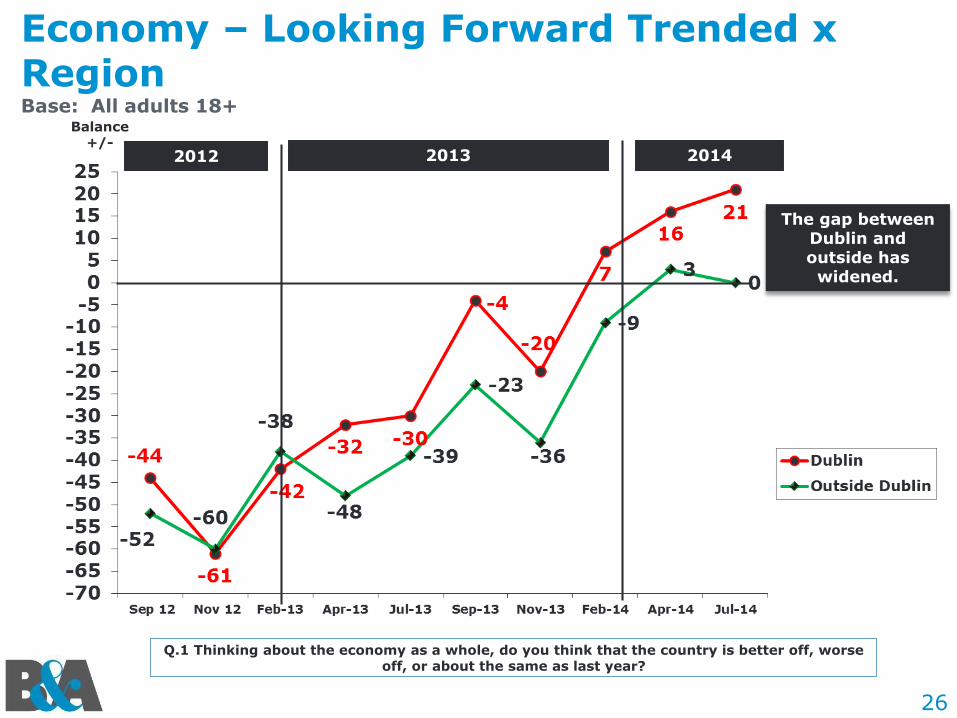
Economy – Looking Forward Trended x Region Base: All adults 18+
Q.1 Thinking about the economy as a whole, do you think that the country is better off, worse off, or about the same as last year?
Balance +/-
2012 2013
The gap between Dublin and outside has widened.
2014
30
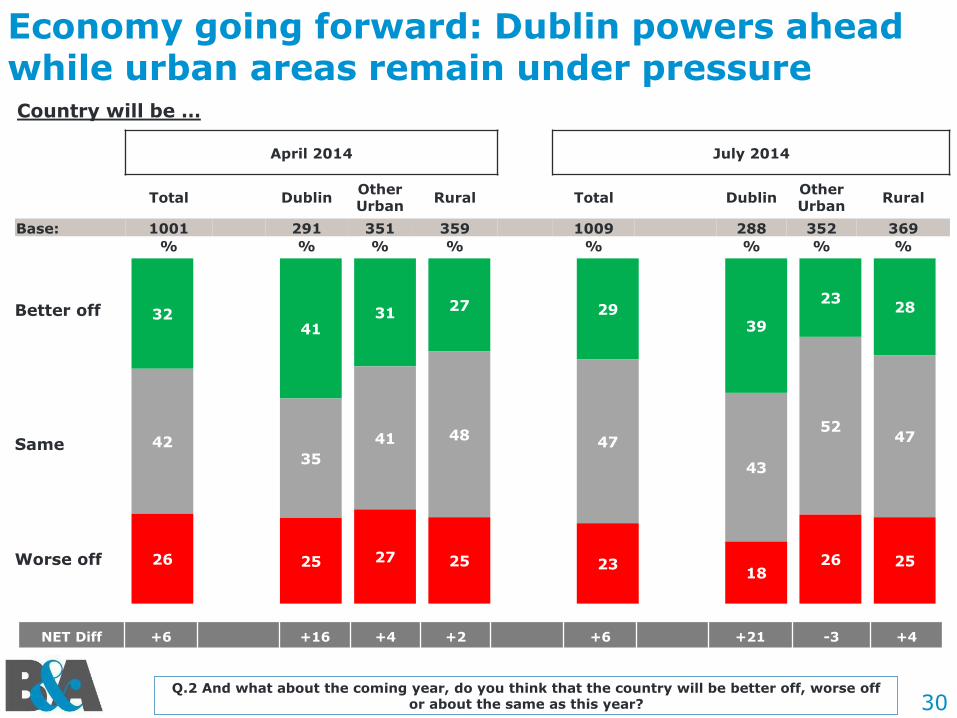
Economy going forward: Dublin powers ahead while urban areas remain under pressureCountry will be …
Q.2 And what about the coming year, do you think that the country will be better off, worse off or about the same as this year?
Better off
Same
Worse off
3241
3127 29
39
2328
4235
41 48 47
43
5247
26 25 27 25 2318
26 25
NET Diff +6 +16 +4 +2 +6 +21 -3 +4
April 2014 July 2014
Total DublinOther Urban
Rural Total DublinOther Urban
Rural
Base: 1001 291 351 359 1009 288 352 369
% % % % % % % %
31
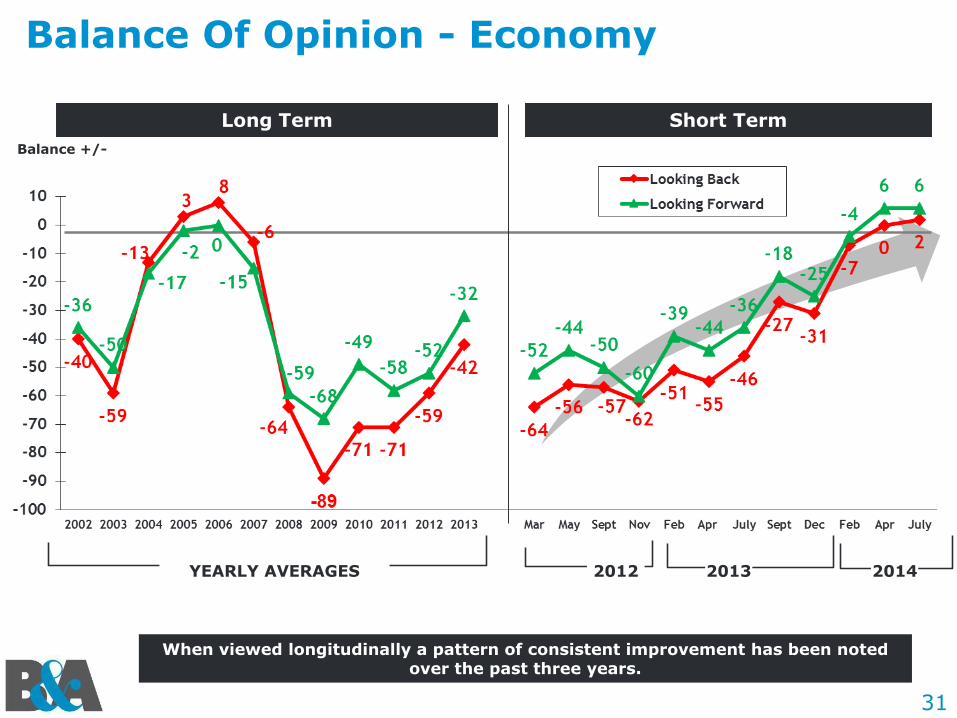
Balance Of Opinion - Economy
Balance +/-
YEARLY AVERAGES 2012
Long Term Short Term
2013
When viewed longitudinally a pattern of consistent improvement has been noted over the past three years.
2014
32
Personal Finances
37
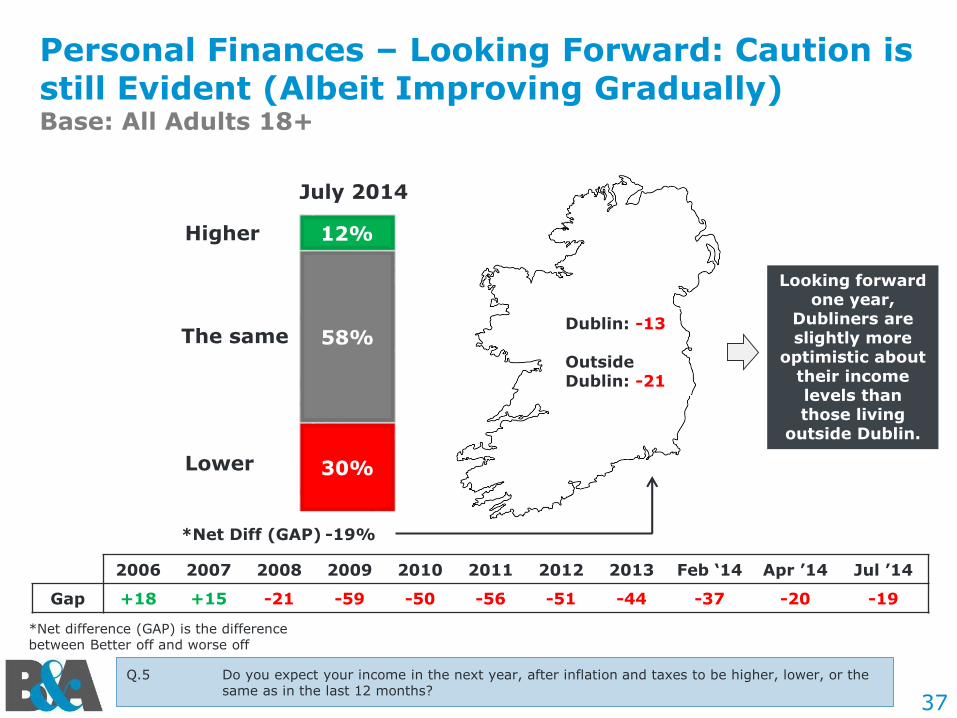
Personal Finances – Looking Forward: Caution is still Evident (Albeit Improving Gradually)Base: All Adults 18+
Q.5 Do you expect your income in the next year, after inflation and taxes to be higher, lower, or the same as in the last 12 months?
Dublin: -13
OutsideDublin: -21
2006 2007 2008 2009 2010 2011 2012 2013 Feb ‘14 Apr ’14 Jul ’14
Gap +18 +15 -21 -59 -50 -56 -51 -44 -37 -20 -19
Higher
The same
Lower
Looking forward one year,
Dubliners are slightly more
optimistic about their income levels than those living
outside Dublin.
July 2014
*Net Diff (GAP) -19%
*Net difference (GAP) is the difference between Better off and worse off
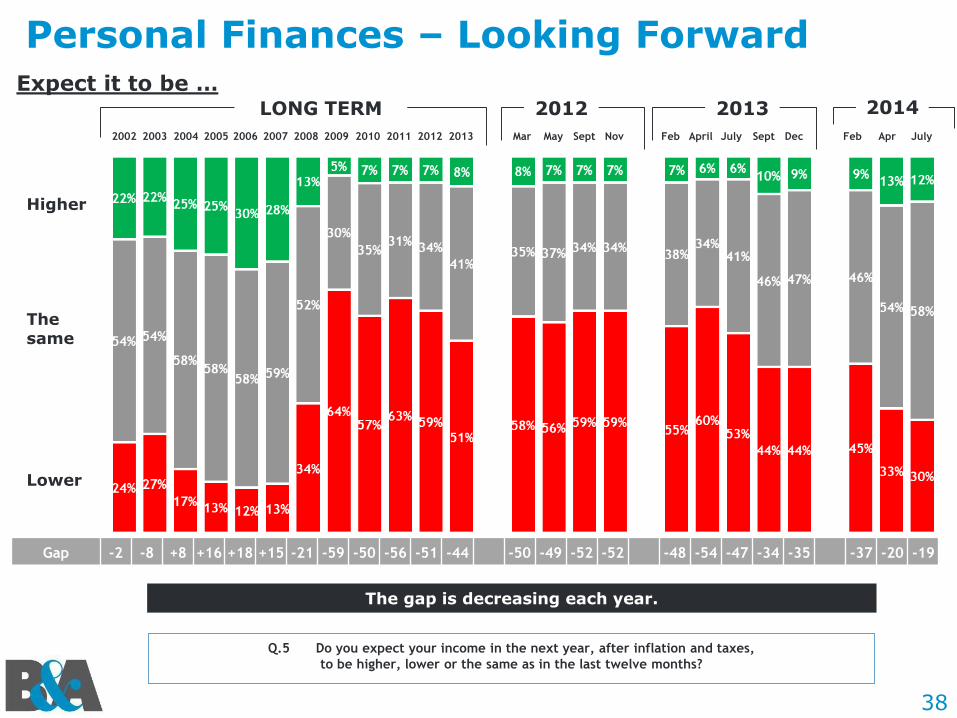
38
Q.5 Do you expect your income in the next year, after inflation and taxes,
to be higher, lower or the same as in the last twelve months?
Personal Finances – Looking Forward
Higher
The same
Lower
Expect it to be …
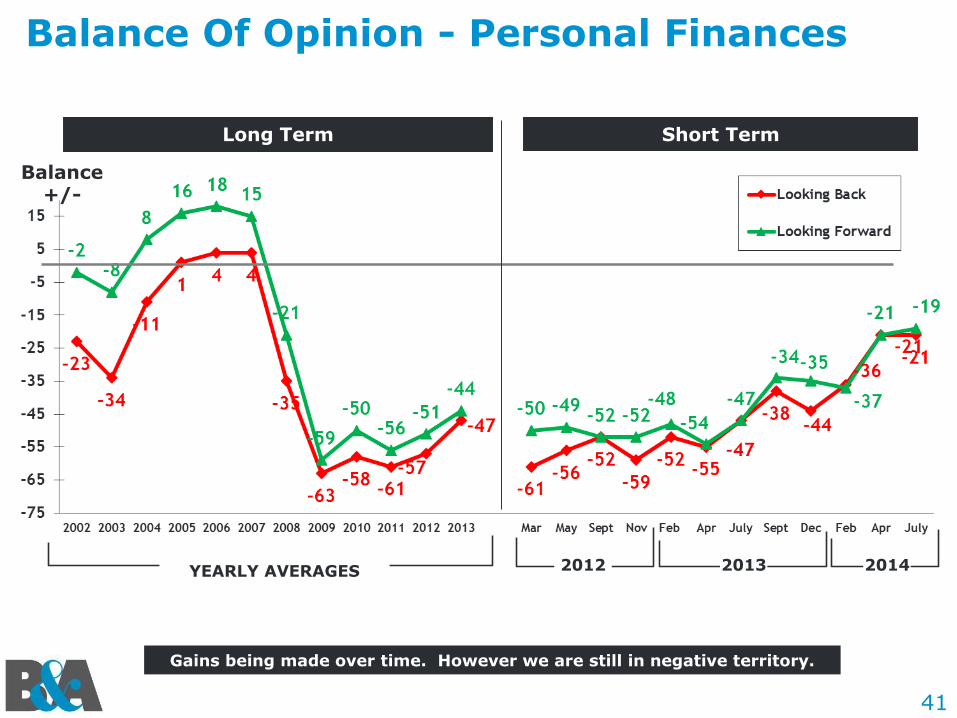
Gap -2 -8 +8 +16 +18 +15 -21 -59 -50 -56 -51 -44 -50 -49 -52 -52 -48 -54 -47 -34 -35 -37 -20 -19
The gap is decreasing each year.
LONG TERM 2012 2013
2002 2003 2004 2005 2006 2007 2008 2009 2010 2011 2012 2013 Mar May Sept Nov Feb April July Sept Dec Feb Apr July
2014
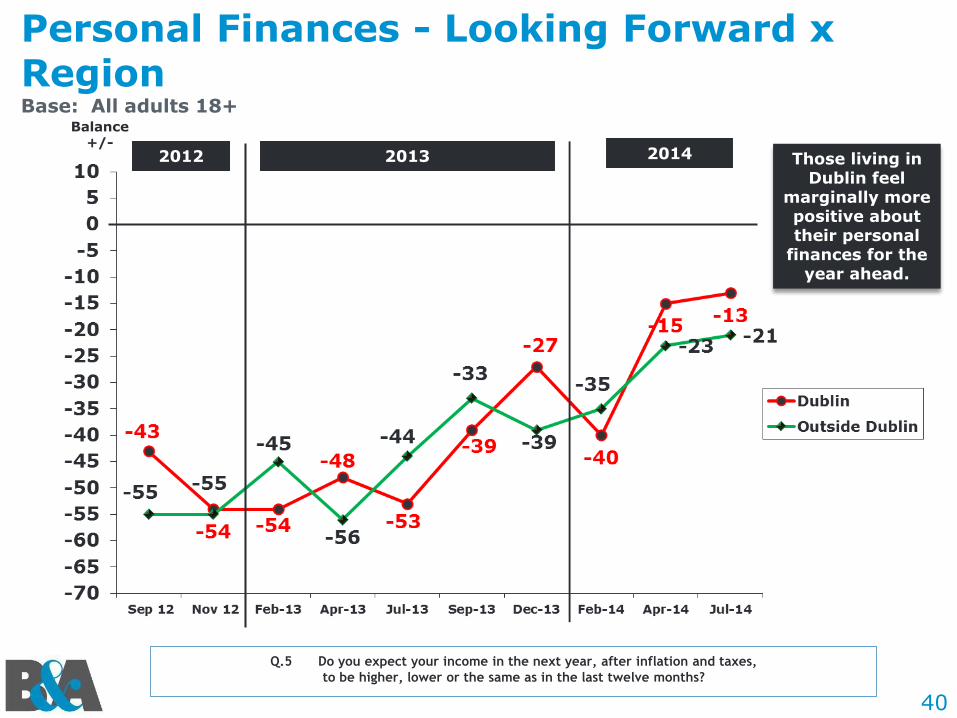
40
Personal Finances - Looking Forward x Region Base: All adults 18+
Q.5 Do you expect your income in the next year, after inflation and taxes,
to be higher, lower or the same as in the last twelve months?
Balance +/-
Those living in Dublin feel
marginally more positive about their personal
finances for the year ahead.
2012 2013 2014
41
Balance Of Opinion - Personal Finances
Balance +/-
Long Term Short Term
Gains being made over time. However we are still in negative territory.
YEARLY AVERAGES 2012 2013 2014
42
Savings
43
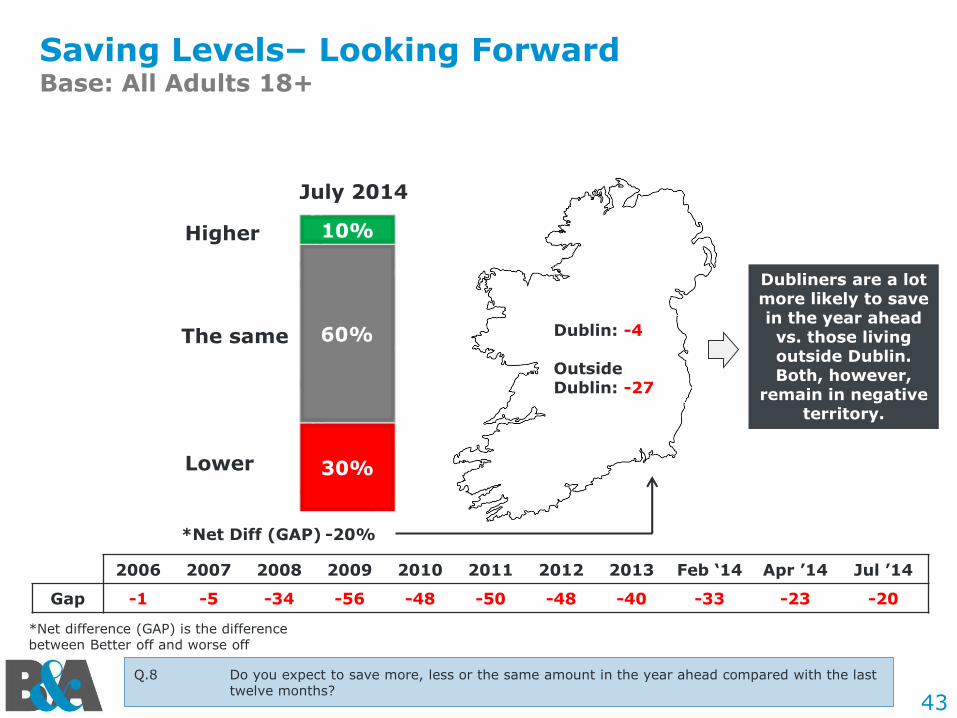
Saving Levels– Looking ForwardBase: All Adults 18+
Q.8 Do you expect to save more, less or the same amount in the year ahead compared with the last twelve months?
Dublin: -4
OutsideDublin: -27
2006 2007 2008 2009 2010 2011 2012 2013 Feb ‘14 Apr ’14 Jul ’14
Gap -1 -5 -34 -56 -48 -50 -48 -40 -33 -23 -20
Higher
The same
Lower
Dubliners are a lot more likely to save in the year ahead vs. those living outside Dublin. Both, however,
remain in negative territory.
July 2014
*Net Diff (GAP) -20%
*Net difference (GAP) is the difference between Better off and worse off
46
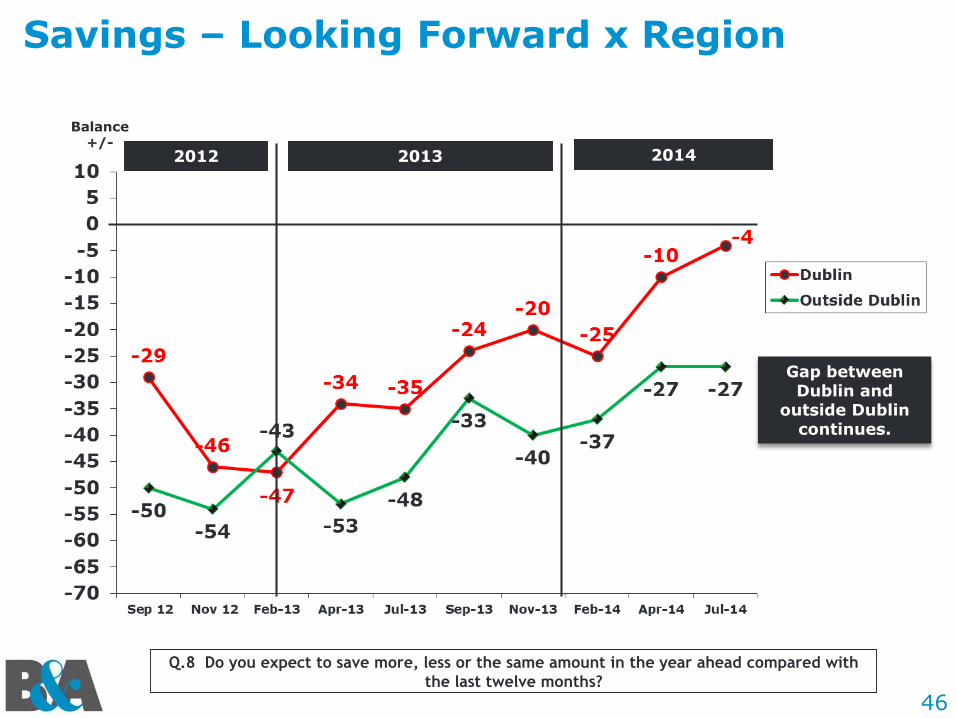
Q.8 Do you expect to save more, less or the same amount in the year ahead compared with
the last twelve months?
Savings – Looking Forward x Region
Balance +/-
Gap between Dublin and
outside Dublin continues.
2012 2013 2014

47
Personal Assets
48
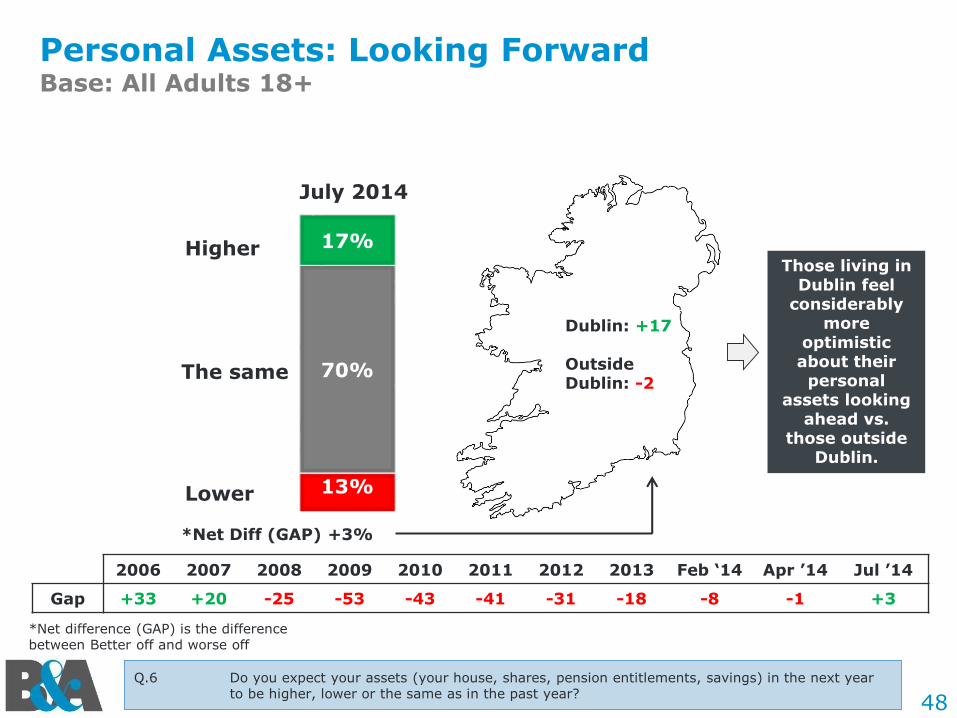
Personal Assets: Looking ForwardBase: All Adults 18+
Q.6 Do you expect your assets (your house, shares, pension entitlements, savings) in the next year to be higher, lower or the same as in the past year?
Dublin: +17
OutsideDublin: -2
2006 2007 2008 2009 2010 2011 2012 2013 Feb ‘14 Apr ’14 Jul ’14
Gap +33 +20 -25 -53 -43 -41 -31 -18 -8 -1 +3
Higher
The same
Lower
Those living in Dublin feel
considerably more
optimistic about their personal
assets looking ahead vs.
those outside Dublin.
July 2014
*Net Diff (GAP) +3%
*Net difference (GAP) is the difference between Better off and worse off
51
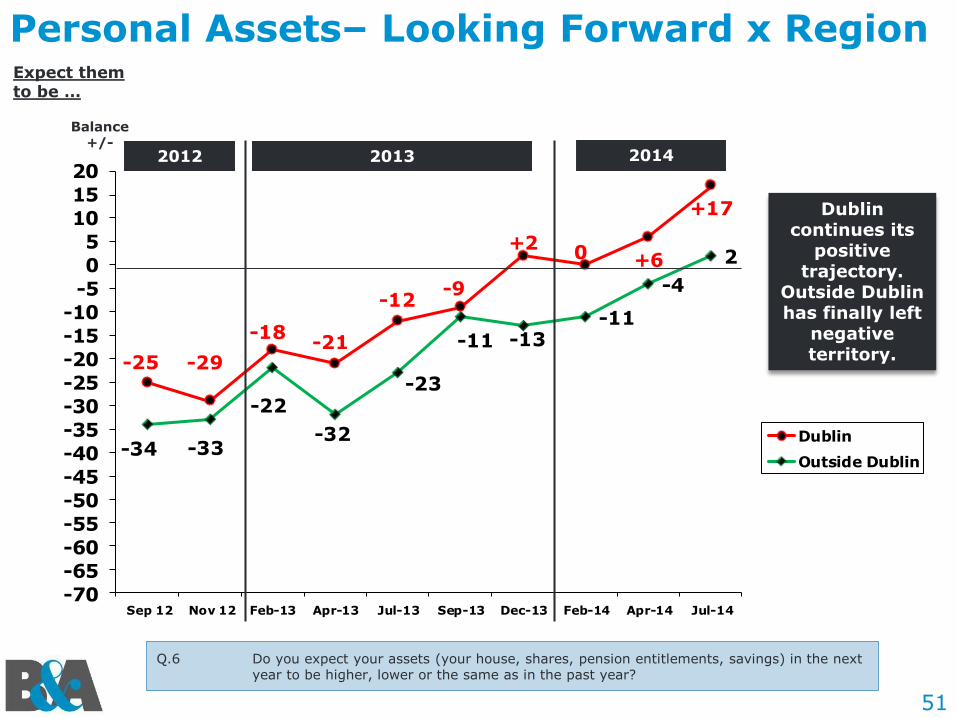
Personal Assets– Looking Forward x RegionExpect them to be …
-25 -29
-18-21
-12-9
+20 +6
+17
-34 -33
-22
-32
-23
-11 -13-11
-4
2
-70
-65
-60
-55
-50
-45
-40
-35
-30
-25
-20
-15
-10
-5
0
5
10
15
20
Sep 12 Nov 12 Feb-13 Apr-13 Jul-13 Sep-13 Dec-13 Feb-14 Apr-14 Jul-14
Dublin
Outside Dublin
Balance +/-
Dublin continues its
positive trajectory.
Outside Dublin has finally left
negative territory.
2012 2013 2014
Q.6 Do you expect your assets (your house, shares, pension entitlements, savings) in the next year to be higher, lower or the same as in the past year?

52
Purchasing Goods and Services
53
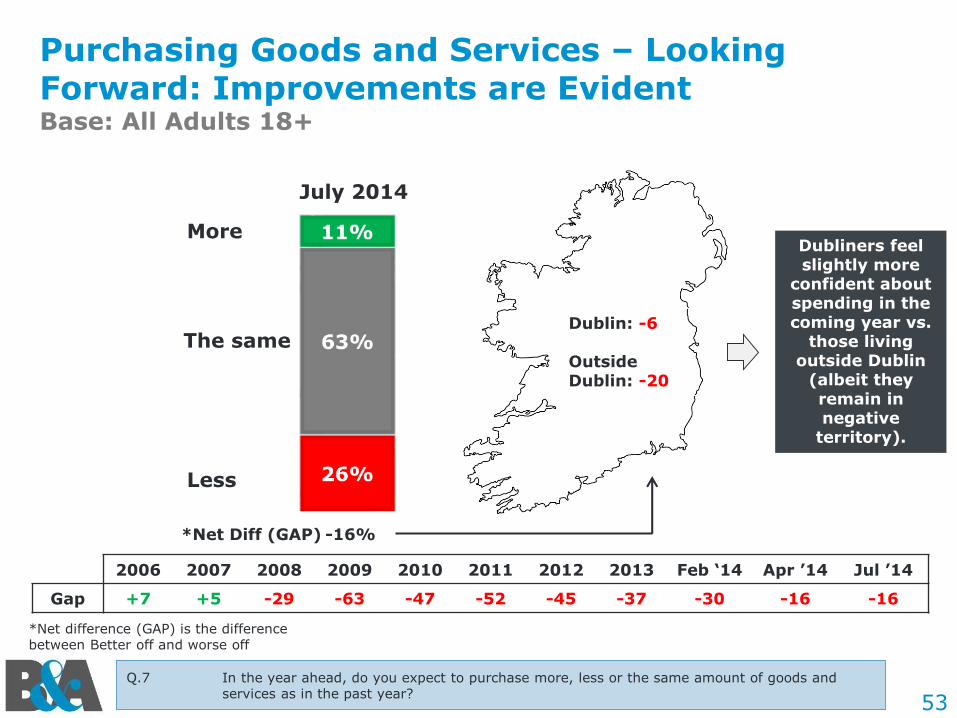
Purchasing Goods and Services – Looking Forward: Improvements are EvidentBase: All Adults 18+
Q.7 In the year ahead, do you expect to purchase more, less or the same amount of goods and services as in the past year?
Dublin: -6
OutsideDublin: -20
2006 2007 2008 2009 2010 2011 2012 2013 Feb ‘14 Apr ’14 Jul ’14
Gap +7 +5 -29 -63 -47 -52 -45 -37 -30 -16 -16
More
The same
Less
Dubliners feel slightly more
confident about spending in the coming year vs.
those living outside Dublin
(albeit they remain in negative
territory).
July 2014
*Net Diff (GAP) -16%
*Net difference (GAP) is the difference between Better off and worse off
56
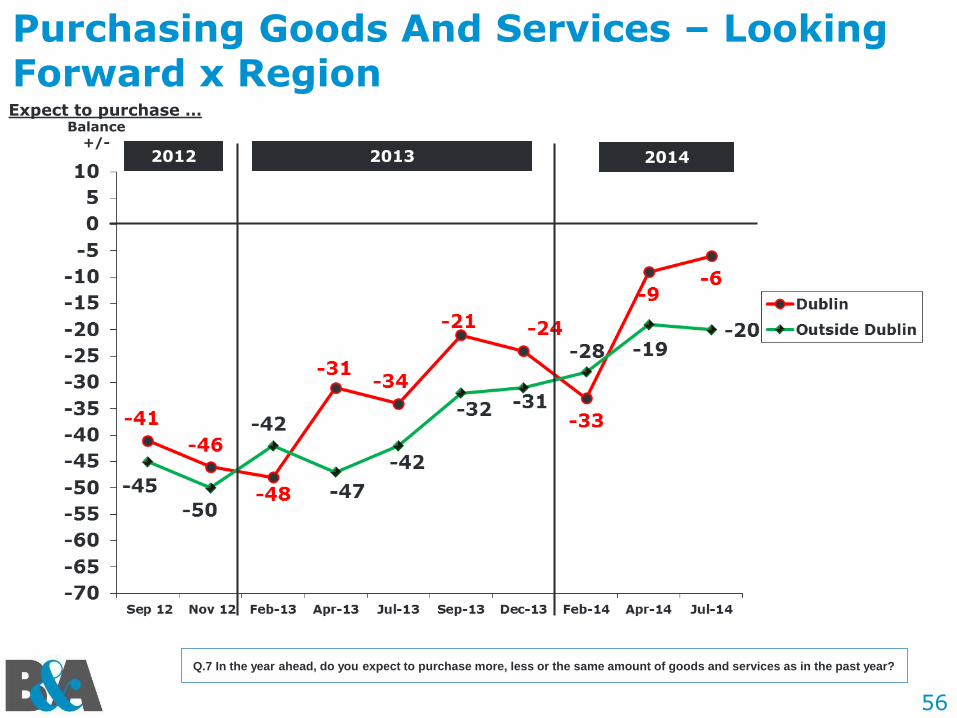
Q.7 In the year ahead, do you expect to purchase more, less or the same amount of goods and services as in the past year?
Purchasing Goods And Services – Looking Forward x RegionExpect to purchase …
Balance +/-
2012 2013 2014
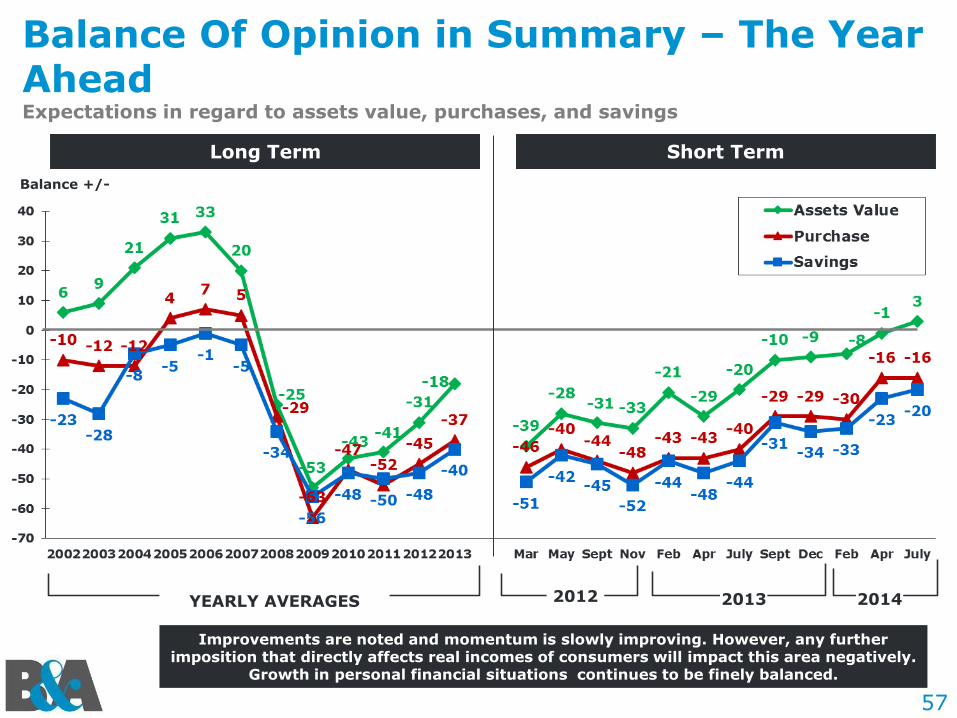
57
Balance Of Opinion in Summary – The Year AheadExpectations in regard to assets value, purchases, and savings
Balance +/-
Long Term Short Term
Improvements are noted and momentum is slowly improving. However, any further imposition that directly affects real incomes of consumers will impact this area negatively.
Growth in personal financial situations continues to be finely balanced.
YEARLY AVERAGES 2012 2013 2014
Disposable Income
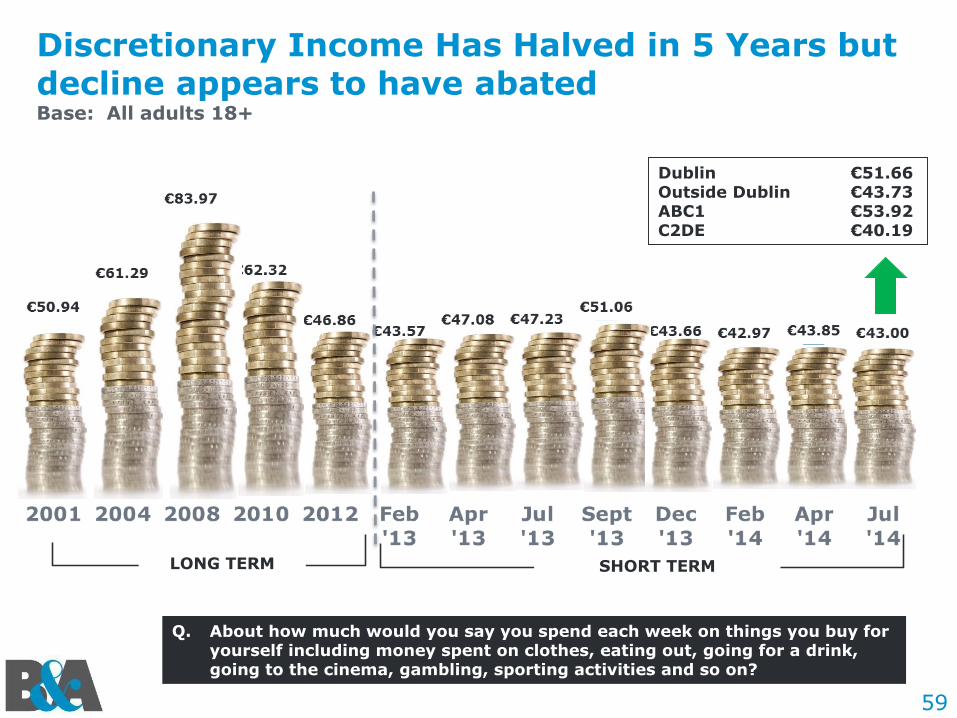
59
Discretionary Income Has Halved in 5 Years but decline appears to have abatedBase: All adults 18+
Q. About how much would you say you spend each week on things you buy for yourself including money spent on clothes, eating out, going for a drink, going to the cinema, gambling, sporting activities and so on?
LONG TERM SHORT TERM
Dublin €51.66Outside Dublin €43.73ABC1 €53.92C2DE €40.19
Recommended