From the Works of Susan P. Baker
Fifty Favorites 50
Fifty Favorites
From the works of
Susan P. Baker
The Johns Hopkins Center for
Injury Research and Policy
Baltimore, Maryland
2012
i
CREDITS
Cover: Sitting on the wing of Margaret Lamb‟s Navion as we plotted our
route for the next flight (see Page 26). Photo by Margaret W. Lamb.
Cover design by Lynne Heiser
Page 63: Photo by Keith Weller.
Manuscript preparation by Rachel L. Howard
ii
PREFACE
Here in my office in the summer of 2012, I look with a mixture of pleasure
and despair at the shelves of books and file cabinets of papers and wonder how
I will dispose of everything by the end of the year, as I have promised myself
to do.
The task of putting together these papers was more fun than the rest of that job
will be, but perhaps some of my readers will come to my rescue and tell me
which of these volumes and documents you would like to have.
The favorites that I have included are 50 peer-reviewed papers and two
examples of testimony before Congressional committees. In addition is Bill
Haddon‟s Foreword to The Injury Fact Book because he describes that book
so well. Bill played such an important role in my career that I wanted him to
be represented here.
The hard part of developing this collection was narrowing the selection to 50 –
deciding which fifty. The delightful part was contacting many old friends and
former colleagues and reminiscing about the „old days‟ when many of these
papers were written -- my earliest injury papers go back to 1970, 42 years ago!
The disappointing part was not being able to mention colleagues with whom I
worked on other papers. I treasure you and our papers just as much as the ones
I included, but for a variety of reasons each of these 50 called out to me, “Take
me, take me.”
My comments that precede the abstracts are a mixture of recollections, some
of which may be inaccurate. But together they capture much of my enjoyable
career. Thank goodness it is not over.
Sue Baker

iii
iv
TABLE OF CONTENTS
CREDITS ........................................................................................................... i
PREFACE ......................................................................................................... ii
FAVORITE WORKS………………………………………………………………………
Anuria Produced by Alpha-Naphthyl Thiourea .............................................................. 1
An Evaluation of the Hazard Created by Natural Death at the Wheel............................ 2
Age Effects and Autopsy Evidence of Disease in Fatally Injured Drivers ..................... 3
Tattoos, Alcohol, and Violent Death .............................................................................. 4
Evaluation of the Management of Vehicular Fatalities Secondary to Abdominal
Injury ............................................................................................................................... 5
Fatal Unintentional Carbon Monoxide Poisoning in Motor Vehicles ............................ 6
The Injury Severity Score: A Method for Describing Patients with Multiple
Injuries and Evaluating Emergency Care ........................................................................ 7
Drowning: Epidemiology and Prevention ....................................................................... 8
How Drivers Prevented from Driving Would Reach Work: Implications for
Penalties .......................................................................................................................... 9
The Man in the Street: A Tale of Two Cities ................................................................ 10
28,000 Gun Deaths a Year: What is Our Role? ............................................................ 11
Fatally Injured Truck Drivers ....................................................................................... 12
Children in Motor Vehicles: Never Too Young to Die................................................. 13
Motor Vehicle Occupant Deaths in Young Children .................................................... 14
Childhood Asphyxiation by Choking or Suffocation.................................................... 15
Freedom and Protection: A Balancing of Interests ....................................................... 16
Childhood Injuries: The Community Approach to Prevention ..................................... 17
Recent Trends in Fatal Poisoning by Opiates ............................................................... 18
Fatal Occupational Injuries ........................................................................................... 19
Fatal Housefires in an Urban Population ...................................................................... 20
Injuries Among the Hopi Indians: A Population-Based Survey ................................... 21
Smoke Detector Legislation: Its Effect on Owner-Occupied Homes ........................... 22
Fatalities in the Peace Corps: A Retrospective Study, 1962-1983 ................................ 23
Poisoning Hospitalizations and Deaths from Solids and Liquids Among Children
and Teenagers................................................................................................................ 24
Falls in the Institutionalized Elderly ............................................................................. 25
Hazards of Mountain Flying: Crashes in the Colorado Rockies ................................... 26
Pilots Involved in Multiple Crashes: "Accident Proneness" Revisited ......................... 27
Prior Crash and Violation Records of Pilots in Commuter and Air Taxi Crashes:
A Case-Control Study ................................................................................................... 28
Exploring the Male-Female Discrepancy in Death Rates from Bicycling Injury:
v
The Decomposition Method .......................................................................................... 29
At Work and Play in a Hazardous Environment: Injuries Aboard a Deployed
U.S. Navy Aircraft Carrier ............................................................................................ 30
Biomechanical Epidemiology: A New Approach to Injury Control Research ............. 31
Wartime Civilian Injuries: Epidemiology and Intervention Strategies ......................... 32
A Modification of the Injury Severity Score that Both Improves Accuracy and
Simplifies Scoring ......................................................................................................... 33
Back Injury in Municipal Workers: A Case-Control Study .......................................... 34
Effects of High School Driver Education on Motor Vehicle Crashes, Violations,
and Licensure ................................................................................................................ 35
Carrying Passengers as a Risk Factor for Crashes Fatal to 16- and 17-Year Old
Drivers ........................................................................................................................... 36
Characteristics of General Aviation Crashes Involving Mature Male and Female
Pilots .............................................................................................................................. 37
Age, Flight Experience, and Risk of Crash Involvement in a Cohort of
Professional Pilots ......................................................................................................... 38
Inmate-Made Weapons: Assessing the Risk ................................................................. 39
Crash Resistant Fuel System Effectiveness in Civil Helicopter Crashes ...................... 40
EMS Helicopter Crashes: What Influences Fatal Outcome? ........................................ 41
Graduated Driver Licensing Programs and Fatal Crashes of 16-Year Old
Drivers: A National Evaluation ..................................................................................... 42
Sharpless Surgery: A Prospective Study of The Feasibility of Performing
Operations Using Non-Sharp Techniques in an Urban, University-Based
Surgical Practice............................................................................................................ 43
Crashes of Sightseeing Helicopter Tours in Hawaii ..................................................... 44
Preventing Injuries by Understanding Energy Damage ................................................ 45
Injury Statistics, High Risk Groups, and Individuals: Falling Through the Cracks ..... 46
Alcohol in Fatal Crashes Involving Mexican and Canadian Drivers in the United
States ............................................................................................................................. 47
Comparing Road Traffic Mortality Rates from Police-Reported Data and Death
Registration Data in China ............................................................................................ 48
Trauma in the Russian Federation: Then and Now ....................................................... 49
Helicopter Crashes Related to Oil and Gas Operations in the Gulf of Mexico ............ 50
Testimony: Heavy Truck Safety .................................................................................. 51
Testimony: Passive Restraints - Airbags ..................................................................... 52
Foreword to The Injury Fact Book by William Haddon, Jr. ......................................... 55
ACRONYMS .................................................................................................. 59
INDEX OF AUTHORS .................................................................................. 60
ABOUT THE AUTHOR ................................................................................ 63
1
ANURIA PRODUCED BY ALPHA-NAPHTHYL THIOUREA
SP Baker
My first paper was written a year after I graduated from Cornell with a BA in
Zoology. It had nothing to do with injury, although the rats might have disagreed
with that. Working in the psychobiology lab of Curt Richter—famous for his concept
of ‗biological clocks‘—laid the foundation for my later research habits. A rare
preceptor, he declined to be named as an author because I had conceived and
executed this project (including designing the equipment) and written up the results
while he was out of the country. He encouraged me to submit it first to the journal
where I most wanted to see it published; when the American Journal of Physiology
accepted, I never forgot that lesson.
Abstract: The mechanisms involved in alpha-
naphthyl thiourea (ANTU) poisoning are still not
fully understood. The outstanding feature of
ANTU poisoning is the loss of large amounts of
fluid from the blood stream into the lungs and
pleural cavities. When we realize that the
volume of this fluid often approaches total blood
volume, it is probable that profound changes
must occur in fluid regulators. Although
histological examination of the kidneys of
ANTU-poisoned rats has revealed no patho-
logical changes, we decided to determine
whether this great fluid transfer is reflected in
the urine output. To investigate this we tested the
effects of ANTU on a forced water diuresis. Our
study of the urine output of rats forced to ingest
large amounts of fluid show that in rats, urine
formation returns to normal as pleural effusion
and pulmonary edema diminish. It is suggested
that since anuria and the other symptoms that
characterize ANTU poisoning often accompany
certain types of shock, rats poisoned in this
manner may be considered to be in a condition
of shock.
Citation: Baker SP. Anuria produced by alpha-naphthyl thiourea. Am J Physiol. 1954
Dec;179(3):457-61.
Link to Full-text: http://www.ncbi.nlm.nih.gov/pubmed/13228608
On the PubMed page where the link leads to, there is a rectangular
icon in the top right corner for either the Journal where the article
appears, or a database like Ovid or ScienceDirect; click the icon to
find and download the full text of the article.
2
AN EVALUATION OF THE HAZARD CREATED BY
NATURAL DEATH AT THE WHEEL
SP Baker and WU Spitz
Werner Spitz was Deputy Chief Medical Examiner of Maryland when I telephoned
him in the spring of 1968, toward the end of my MPH program. I asked about the
possibility of reviewing ME cases of drivers who died at the wheel. Instead of telling
me about probable difficulties, he said, ―Come on over, let‘s talk.‖ ―When?‖ ―As
soon as you‘d like.‖ I was on my way that afternoon. That began 14 happy and
productive years digging in a gold mine of data and collaborating with Werner Spitz
and other medical examiners. For the first few years, until we moved to a building
near University Hospital, I had no office, but sat at the table in the residents‘ room,
where they discussed cases, dictated descriptions of the autopsies they had just
performed, and changed into or out of their scrubs—simply standing behind me as
they did so. To identify the cases I would study, I worked my way through ledgers
where cases were entered, one line per case, with codes to identify the cause of
death. Then I would pull a stack of cases from the file, each bearing a description of
the body, the findings revealed by autopsy, and the investigator‘s report of the
circumstances of death. Werner says I ―brought back to daylight the long-forgotten
files which harbored valuable information that no one recognized and no one took
time or had the interest to explore.‖
Abstract: Assessment of the hazard associated
with sudden natural death of drivers suggests
that the magnitude of the problem does not
warrant costly and restrictive control efforts.
Investigation of 591 collisions that caused fatal
injuries to drivers or pedestrians revealed that
none of them resulted from natural death at the
wheel. Natural death of a sober driver apparently
does not entail measurable risk of death or
severe injury to his passengers or other persons.
Collisions caused by these deaths are relatively
infrequent, representing less than 6 per 10,000
motor-vehicle collisions. Nonfatal medical
impairments still need to be explored more
precisely before driver examinations and
restrictions can be considered justified and
effective.
Citation: Baker SP, Spitz WU. An Evaluation of the Hazard Created by Natural Death at the Wheel.
New Eng J Med 283:405-409, August 20, 1970.
Link to Full-text: http://www.ncbi.nlm.nih.gov/pubmed?term=5429807
3
AGE EFFECTS AND AUTOPSY EVIDENCE OF DISEASE IN
FATALLY INJURED DRIVERS
SP Baker and WU Spitz
In 1968, I became the first faculty member at the School of Public Health to
specialize in ―accident prevention,‖ soon to be known as ―injury control,‖ which
was the title of my first textbook chapter. At the beginning of my academic
career, my research focused on highway safety and alcohol, which was
associated with the majority of the 55,000 road deaths annually in those years.
Yet when I described my research to a faculty member who asked what I was
working on, she said, ―But is that Public Health?‖ Her attitude was not unusual
at the time, but today no public health professional would be likely to ask that
about any injury problem. I think that is a real mark of our success. JAMA had
rejected my first paper (on the prior page) but quickly accepted this paper after
NEJM published the first. When a medical news journal described this paper, it
repeatedly referred to the authors as ―Spitz and Baker,‖ apparently in
recognition of Dr. Spitz‘s status as a physician. I wrote the editor that when a
junior, non-MD was first author, one could be sure she had done most of the
work, and should be mentioned first. When the same news journal subsequently
featured the paper on Page 4, it described us as, ―Mrs. Baker and a team of
three (unnamed) physicians.‖
Abstract: A total of 328 drivers who died as the
result of highway crashes were investigated,
using autopsy records and police reports. There
was no correlation between driver responsibility
for the crash and autopsy evidence of disease or
physical disability. Arteriosclerotic heart disease
was found with similar frequency in drivers at
fault and drivers not at fault. Several findings
indicated that a decreased ability to survive
crashes caused older persons to be greatly
overrepresented among fatally injured drivers.
The proportion of drivers who were 60 years of
age or older was five times as high among those
killed as among drivers who survived
multivehicle crashes. Delayed death was more
common among older drivers and was associated
with less-serious injuries than in younger drivers.
Citation: Baker SP, Spitz WU. Age Effects and Autopsy Evidence of Disease in Fatally Injured
Drivers. JAMA 214:1079-1088, 1970.
Link to Full-text: http://www.ncbi.nlm.nih.gov/pubmed?term=5536250

4
TATTOOS, ALCOHOL, AND VIOLENT DEATH
SP Baker, LS Robertson, and WU Spitz
Tattoos were scarcely on my list of proposed research topics. But I was sitting at my
24-inch-wide designated space in the residents‘ room of the Office of the Chief
Medical Examiner, coding cases of fatally injured drivers, when I realized that the
last four were decorated with tattoos. So I went back to the first case and added
tattoos as a variable. Their over-representation among ―at fault‖ drivers caught the
attention of Bill Haddon, then head of NHTSA, when I wrote him asking for $10,000
to expand the study. His deputy, Bob Brenner, phoned me two days later: ―Dr.
Haddon wants to fund this. Just send us a budget.‖ Thus began more than two
decades of funding and collaboration with Bill and his colleagues at the Insurance
Institute for Highway Safety, where Bill became president.
Abstract: Tattoos are often viewed by clinicians
as possible indicators of sociopathic personality,
delinquency, or venereal disease. Among
veterans, tattoos often adorn men whose life
histories include truancy, parental separations,
and courts-martial. Similar findings were
obtained among enlisted men at a submarine
school and inductees into the army who were
tattooed before their recruitment for service.
Studies of a mental institution and a prison show
that tattoos are likely to be acquired during the
first months in the institutions in order to gain
acceptance, rather than later to relieve boredom.
Tattooed inmates of an English special prison
were judged less stable and more intelligent than
their non-tattooed counterparts; ―Tattooing was a
peripheral indicator of a primary ‗psychopathic‘
syndrome.‖ The present study was undertaken to
examine the relationship between tattoos and
violent death and to determine whether, in the
groups studied, tattoos are independent of age,
blood alcohol concentration, occupation, and
other variables. Driver fatalities and homicides
were both studied, since parallel relationships
may be indicative of similarities in the
pathogenesis of these two forms of violent death.
Tattooed drivers fatally injured in crashes and
tattooed homicide victims were more likely than
their non-tattooed counterparts to have
contributed to the events leading to their deaths.
Alcohol was correlated with presence of tattoos
among drivers, and was a major factor in both
forms of violent death.
Citation: Baker SP, Robertson LS, Spitz WU. Tattoos, Alcohol, and Violent Death. J Forensic
Sciences 16:190-196, 1971.
Link to Full-text: http://www.ncbi.nlm.nih.gov/pubmed?term=5557642
5
EVALUATION OF THE MANAGEMENT OF VEHICULAR FATALITIES
SECONDARY TO ABDOMINAL INJURY
HR Gertner Jr., SP Baker, RB Rutherford, and WU Spitz
―The patient‘s blood pressure dropped. I‘ve phoned the doctor on call.‖ As the ME
opened the blood-filled abdomen, I was reading the notes that had been written by a
desperate nurse while her patient was dying for lack of a surgeon. This was not the
first such case from a rural ER. I needed surgeons to help me interpret the data that I
now wanted to collect for my next paper. Rudy Gertner, a surgical resident, and his
chief, Robert Rutherford, joined Werner Spitz and me on a study that, according to R
Adams Cowley, founder of the Shock-Trauma unit at University of Maryland,
provided crucial evidence to support the first statewide trauma system that would
direct trauma victims to hospitals that were staffed and equipped to care for them.
This paper was my first presentation at a scientific meeting (AAAM); when I finished,
still quaking from nervousness, a past-president stood and stated, ―You have opened
Pandora‘s box!‖ Later, when I‘d caught my balance, I asked him, ―Do you want to
just close the lid and sit on it?‖ (Later I learned the questioner was mad because a
non-physician had exposed deficiencies in trauma care.)
Abstract: Each year almost 60,000 Americans
die as the result of motor vehicle collisions. It
has been emphasized that over half of these
persons die before they reach a hospital, thereby
calling attention to the importance of proper
extrication, rapid transportation, and resus-
citative measures applied at the scene of the
accident or in transit to the hospital. We believe
it is equally appropriate to evaluate and improve
the medical care received by those who survive
long enough to reach medical facilities. This
report concerns 33 drivers, passengers, and
pedestrians who died following isolated
abdominal injury, and considers the adequacy of
the hospital care that they received. Hospital
records and postmortem findings were reviewed
for 33 highway deaths in which the main injuries
were intra-abdominal. It was estimated that half
of these lives might possibly have been salvaged
by prompt and proper diagnosis and treatment.
Over one-third of the cases showed a need for
more aggressive treatment of patients in shock.
Nearly half involved either failure to operate or
excessive delay in operation, despite symptoms
of abdominal injury. The results suggest that
greater attention should be given to transporting
injured patients to facilities that are best
equipped and staffed to handle major trauma.
Citation: Gertner HR, Baker SP, et al. Evaluation of the Management of Vehicular Fatalities
Secondary to Abdominal Injuries. J Trauma 12:425-431, 1972.
Link to Full-text: http://www.ncbi.nlm.nih.gov/pubmed?term=5033485
6
FATAL UNINTENTIONAL CARBON MONOXIDE
POISONING IN MOTOR VEHICLES
SP Baker, RS Fisher, WC Masemore, and IM Sopher
During my first years in the ME office, I often started my day in the autopsy room,
reading the investigators‘ reports on the cases and listening to discussions among
the MEs. After watching a number of autopsies of people who died unexpectedly of
carbon monoxide poisoning while trying to stay warm in their car, I talked with Bill
Masemore, Chief Investigator for the ME office, and Irv Sopher, then an assistant
ME and later the chief medical examiner for West Virginia. They convinced me that
those deaths were preventable. After this paper was published in AJPH, I wrote a
layman‘s version that was published in Parade, Status Report, Autosafe, and
Catholic Digest. Eventually, changes in car design and durability greatly reduced
these deaths. My choice of Parade was based not on the fact that it would pay me
something, but on the number of people likely to read it, far greater than would read
any journal. For dissemination of information based on research published in
journals, we had to depend upon reporters picking up the information from Hopkins‘
press releases, which have always been terrific in their outreach.
Abstract: The potential health hazard created by
sublethal concentrations of carbon monoxide
from automotive exhaust in the atmosphere has
evoked increasing concern. At the same time, the
large number of deaths that occur in vehicles
when lethal concentrations of carbon monoxide
enter the passenger compartment has escaped
widespread attention. This paper presents data
suggesting that over 500 Americans die each
year from carbon monoxide poisoning because
their vehicles are defective due to deterioration,
damage, or poor automotive design. Most of
these deaths occur in non-moving vehicles;
therefore they are not classified as ―*motor
vehicle accidents‖ and rarely are thought of in
connection with vehicular deaths. Yet probably
no other group of deaths is more closely related
to defective motor vehicles. In 1967, 819 deaths
in the U.S. were classified as -'accidental
poisoning by motor vehicle exhaust gas." As
with many types of adult poisoning, information
on these deaths is scanty because they rarely
reach the hospital alive and therefore are not
reported through the poison control information
system. Sopher and Masemore's report on 6
recent carbon monoxide deaths described
methods of investigation and disclosed the role
played by defective vehicles. Their findings led
to this review of all Maryland deaths during the
past six years caused by unintentional carbon
monoxide poisoning in motor vehicles. The
objectives were to document the size of the
problem, describe the age and condition of the
vehicles and the circumstances under which
these deaths occurred, and consider the possible
solutions suggested by the data.
Citation: Baker SP, Fisher R, Masemore WC, Sopher IM. Fatal Unintentional Carbon Monoxide
Poisoning in Motor Vehicles. Am J Public Health 62:1463-1467, 1972.
Link to Full-text: http://www.ncbi.nlm.nih.gov/pubmed/4117472
7
THE INJURY SEVERITY SCORE: A METHOD FOR
DESCRIBING PATIENTS WITH MULTIPLE INJURIES
AND EVALUATING EMERGENCY CARE
SP Baker, B O'Neill, W Haddon Jr., and WB Long
In 1970, Bill Haddon, president of IIHS, suggested that I tear up a grant proposal I
was preparing in hopes of NIH funding and accept IIHS support for to-be-
determined research. The next six frustrating months saw a series of my suggested
research proposals rebuffed. Finally Haddon and Brian O‘Neill, who was then the
Senior Statistician in the IIHS research department (and later the president of IIHS
after Bill died), liked my idea of studying a series of traffic deaths in Baltimore city.
We had no inkling that what would evolve would be the ability to measure the effect
on trauma outcome of having more than one injury. At that time the Abbreviated
Injury Scale (AIS) was the best thing for describing injury severity, but it applied
only to single injuries. When I came up with what is Figure 2 in the following paper,
I was excited to realize I had measured the influence of additional injuries on fatality
rates – but everyone I showed it to said, ―well, of course it is worse to have more
than one injury‖ – until I shared it with Bill Long at a breakfast meeting of ER docs.
Bill, a young surgeon at Shock Trauma who had been trying to measure the effects of
single organ failure and multiple organ failure, looked at the graph for about two
minutes and said, ―this is fascinating – if you square and add the scores for the two
worst injuries, the sum correlates with the case-fatality rate.‖ (Subsequently Brian‘s
calculations showed that it was important to use the 3 worst injuries.) Twenty-five
years later, the ISS is still valued as a very simple way to assess the likelihood of a
fatality given various combinations of injuries. (The NISS, page 33, is even simpler
and better, but regrettably is less widely used).
Abstract: It is essential to take into account
differences in severity of injury when comparing
the morbidity and mortality of various groups for
purposes of evaluating their emergency and
subsequent care. A method for comparing death
rates of groups of injured persons was
developed, using hospital and medical examiner
data for more than two thousand persons.
Controlling for severity of the primary injury
made it possible to measure the effect on
mortality of additional injuries. Injuries that in
themselves would not normally be life-
threatening were shown to have a marked effect
on mortality when they occurred in combination
with other injuries. An Injury Severity Score was
developed that correlates well with survival and
provides a numerical description of the overall
severity of injury for patients with multiple
trauma. Use of the Injury Severity Score
facilitates comparison of the mortality
experience of varied groups of trauma patients,
thereby improving ability to evaluate care of the
injured.
Citation: Baker SP, O'Neill B, Haddon W Jr., Long WB. The Injury Severity Score: A Method for
Describing Patients with Multiple Injuries and Evaluating Emergency Care. J Trauma 14:187-196,
1974.
Link to Full-text: http://www.ncbi.nlm.nih.gov/pubmed/4814394
8
DROWNING: EPIDEMIOLOGY AND PREVENTION
PE Dietz and SP Baker
Park Dietz was a third-year med student when he dropped into my 3rd
floor
cubbyhole at the new ME office to which we had moved. ―I have some free time to
work on a project and someone told me you had lots of ideas.‖ That was probably
the last time Park had to ask anyone to suggest an idea. The project ended his
supposition that data were dull, not worth time collecting and analyzing. I had just
begun this drowning study and was happy to turn it over to him. We made a good
team. He did a great job with the Haddon Matrix, which categorizes injury
prevention measures by whether they apply before, during, or after the crash or other
injury event; the other dimension of the Matrix is divided into factors related to the
host (e.g., driver or injured person), the inanimate vector or vehicle that conveys
harmful energy to the host, and the physical or social environment in which the
injury occurs. Each of the twelve cells of the Matrix contains factors that contribute
to the likelihood or severity of the injury, or factors that would prevent or reduce the
injury. Park later applied the Matrix to the problem of rape, showing its value in
formulating approaches to intentional injury. I suspect his time at the ME office
contributed to his eventual career as a world-famous forensic psychiatrist, and the
Haddon Matrix probably played a role in his development of an entire industry
addressed to workplace violence prevention.
Abstract: From an epidemiological perspective,
drowning may be viewed as an interaction
between host (person) and agent (water),
occurring with or without the intervention of a
vector or vehicle (most often a boat, in the
present case) in a variety of environmental
settings. This view of drowning emphasizes the
similarity not only between drowning and
disease but also between drowning and other
types of injury-producing interactions between
man and his environment. Drowning and
highway death, for example, share certain
etiological factors such as alcohol intoxication
and suggest common preventive measures such
as better emergency systems. The two
phenomena are also similar in regard to some of
the circumstances surrounding the events: for
instance, fatal crashes are not usually associated
with high density rush hour traffic, and drowning
(at least in Maryland) is rare at crowded beaches.
Citation: Dietz PE, Baker SP. Drowning: Epidemiology and Prevention. Am J Public Health 64:303-
312, 1974.
Link to Full-text: http://www.ncbi.nlm.nih.gov/pubmed/4818067
9
HOW DRIVERS PREVENTED FROM DRIVING
WOULD REACH WORK: IMPLICATIONS FOR PENALTIES
SP Baker and LS Robertson
Sometimes we hear something so often that we begin to accept it as fact. I was tired
of hearing that judges had allowed convicted drunk drivers to continue driving
because they said their jobs depended upon it. Leon Robertson at IIHS shared my
skepticism. Always innovative, Leon was willing to add a revealing question to a
survey he was planning: The question was, ―How would you get to work if you broke
your right leg and could not drive because the leg was in a cast?‖ The great majority
of those surveyed would still be able to get to work; usually they expected a friend or
relative would drive them, although one driver claimed he would simply use his left
foot to brake or accelerate. Did this research have any effect? I don‘t know. We
should have made sure that it reached a publication that judges were likely to read.
Today the communication experts at the Center for Injury Research and Policy,
working with the School‘s Public Affairs Department, do a superb job of making sure
our work reaches a wide audience.
Abstract: The validity of the assumption that
loss of a driving license would result in
economic hardship for most drivers was
examined. Persons who drive to work were
asked how they would reach work if a broken leg
prevented them from driving. Only 21 per cent
said they would not be able to make other travel
arrangements. Of those who thought they could
find other transportation, two-thirds said the
alternative would cost no more than driving
themselves. Less than one-fifth said the time
required would be more than an additional half
hour per day. The results indicate that policies
and practices related to license suspension and
revocation should not be based on an assumption
that job loss or economic hardship would be
experienced by most drivers if they were to lose
their driving privileges.
Citation: Baker SP, Robertson LS, How drivers prevented from driving would reach work:
Implications for penalties. Accident Analysis & Prevention. 7(1):45-48; May 1975.
Link to Full-text: http://www.sciencedirect.com/science/article/pii/0001457575900184
10
THE MAN IN THE STREET: A TALE OF TWO CITIES
SP Baker
A summer in Rio de Janeiro offered the chance to study pedestrian deaths there and
compare them to Baltimore‘s. In Rio even a sober adult could easily be killed, as I
learned first-hand when a car narrowly missed me as I tried to navigate a wide
boulevard with no traffic lights. Rio‘s Instituto Medical Legal, which corresponded
to Maryland‘s ME office, gave me permission to access their files. Fighting my way
through ledgers led me to relevant case histories in Portuguese. I learned the words
for ‗pedestrian‘ and other essential clues and abstracted data from hundreds of cases
of MV-related death. The Rio health department had tried in vain to obtain that very
data. But they were mistakenly relying on the Instituto to do what I had done; that
was one of many examples of ‗if you want it done, do it yourself.‘ It was here in Rio
where I recognized that, in order to lure people to the safest way to accomplish any
task, whether it be crossing a street or removing the cornstalks from a jammed corn-
picker, it must be the easiest way. I think it really hit me when I studied a divided
highway near Rio where 200 pedestrians had been killed in a single year. The
pedestrian bridges that facilitated safe crossing were one-quarter mile apart and
required one to climb many stairs, oftentimes carrying groceries, bicycles, or
children. Until they make the pedestrian crossings level with the cars going above or
below, pedestrians will continue to dart across, lifting their bicycles over the
concrete median. First published in Accident Analysis and Prevention in 1977, this
was my first foray into injury prevention in other countries. More recently, Guoqing
Hu (Page 48) and I have found similar undercounts of deaths as reported by police
in China.
Abstract: We compared pedestrians killed in
Baltimore with those killed in Rio de Janeiro.
Three-fourths of all pedestrians killed in
Baltimore are very young, elderly, or intoxicated
-- the kinds of people least likely to perceive
adequately and respond appropriately to the
signals and hazards of the traffic environment.
In Rio de Janeiro, on the other hand, most fatally
injured pedestrians are sober, working-age
adults. In other words, in Rio one need not be
very young, very old, or intoxicated to be killed.
A substantial proportion of able-bodied people
among pedestrian fatalities should call attention
to a difficult task or unusual environmental
hazards. Death may occur when pedestrians
brave the hazards in preference to unacceptable
alternatives. If the ―safe‘ way is slow or
onerous, some will choose a quicker or easier
way, no matter how dangerous. Two ideas: First,
we should design our transport system to protect
the most vulnerable people. Second, to ensure
that pedestrians choose the safest way to their
destination, the safest routes must also be the
easiest and most appealing.
Citation: Baker SP. The Man in the Street: A Tale of Two Cities. The Johns Hopkins Magazine
26:4-6, January, 1975. Reprinted in Am J Public Health 65:524-525, 1975.
Link to Full-text: http://www.ncbi.nlm.nih.gov/pubmed/1130575
11
28,000 GUN DEATHS A YEAR: WHAT IS OUR ROLE?
SP Baker
It is hard to believe today, but prior to this paper, public health attention to gun
deaths was limited to ―accidents.‖ When I gave the paper at a meeting of the
California branch of the American Trauma Society, some members seemed ready to
run me out of town. The notion that homicides and suicides were attributable to the
weapons involved was new and far from acceptable. Sadly, the ―gun lobby‖ has
made this an issue of personal freedom and successfully pushed measures that
increase not only the availability of guns and ammunition but also their
pervasiveness. The notion that ―guns don‘t kill people, people kill people‖ was
widely accepted. Slowly, that would change, especially after Steve Teret (Page 16)
helped to shift the emphasis to the weapons – from their design and manufacture to
distribution and sale.
Abstract: Second only to motor vehicles as
instruments of death, firearms will kill more than
28,000 Americans this year. Gun deaths exceed
the total number of deaths from fires, explosions,
drowning, and poisoning each year. In addition,
firearms cause many serious non-fatal injuries,
often resulting in prolonged disability. Firearm
deaths classified as ―accidental‖ number 2,400 a
year. Suicide by firearms—by far the most
common means of suicide—takes 12,000 lives a
year in the U.S. Firearm homicides in 1974
numbered about 14,000. Because of their
firsthand knowledge of the problem, physicians,
other health professionals, and their professional
associations are in a unique position to help
prevent these injuries, especially by facing up to
the handgun question. In the case of drugs, a
physician who knows that a drug does more
harm than good will not prescribe it for his own
patients and will also, if he wants to protect other
people, support proposals to prevent the
manufacture, importation, sale, or use of the
drug except in special cases where its
demonstrated life-saving benefits outweigh the
hazards. Is there any logical reason not to do as
much against the second leading cause of fatal
trauma?
Citation: Baker SP. 28,000 Gun Deaths a Year: What is Our Role? J Trauma 16:510-511, 1976.
Link to Full-text: http://www.ncbi.nlm.nih.gov/pubmed/933221
12
FATALLY INJURED TRUCK DRIVERS
TA Karlson, SP Baker, and BF Morton
Trudy Karlson had planned to be a cancer epidemiologist until she took the injury
epidemiology course that Bill Haddon and I were teaching in Minnesota. Like many
students here at Hopkins who have taken injury courses with Steve Teret and Jon
Vernick and me, she underwent a major conversion. Years before getting her PhD
with a dissertation on facial injuries, she came to Baltimore for post-grad work with
me at the ME office, reading the autopsy reports that resulted in this paper. Our
findings resulted in my testimony (Page 51) on the need for better crash protection
for truck drivers. By relating the mechanism of injury—striking the horizontal rim of
the steering wheel in big trucks—to the abdominal injury, we were able to emphasize
the need for airbags to protect these drivers, something Volvo took the lead in. Some
years later, when I drove an 18-wheeler with 12 forward gears at the General
Motors proving ground in Phoenix, I recognized the apparent advantage of the
horizontal orientation of the steering wheel.
Abstract: Autopsy findings on 68 fatally injured
truck drivers were reviewed to ascertain severe
injuries sustained upon impact with the occupant
compartments. Injuries of the head, neck, chest,
and abdomen in drivers of vans, pickups, and
heavy trucks are discussed with some
suggestions as to possible mechanisms. Findings
suggest that particular attention is needed to
prevent steering assembly injuries of the chest
and abdomen in drivers of heavy trucks and
pickups, and head injuries of the drivers of vans.
It is urged that existing knowledge of crash
dynamics and occupant protection be applied to
the prevention of injuries to truck occupants.
Citation: Karlson TA, Baker SP, Morton BF. Fatally injured truck drivers, in Proceedings of the 21st
Conference of the American Association for Automotive Medicine. 1977, pp 367-378.
Link to Full-text: http://trid.trb.org/view.aspx?id=73307 (Full-text available on request)
13
CHILDREN IN MOTOR VEHICLES: NEVER TOO YOUNG TO DIE
JJ Karwacki Jr and SP Baker
Jerry Karwacki, a medical student, and I read ME reports of children killed in
crashes – heart-rending tales of babies sitting on the mother‘s lap while dad drove.
Mothers no doubt thought they were protecting their children, not recognizing that
the reverse was true—i.e., that in a forward collision, the child would cushion the
crash forces on the mother, in effect serving as a human airbag. Perhaps this JAMA
paper helped to bring us to the day when that sight is rare. (When is the last time you
saw that once-common scene?) The following paper and this one, written at about
the same time, helped lay the groundwork for child passenger protection laws. This
use of ME records is an example of the treasure to be found in these case histories.
Abstract: In a series of 89 children less than 15
years old who were killed as motor vehicle
occupants, children under 1 year of age were
greatly overrepresented. Only three children
were using child restraint systems or seat belts.
Eight were traveling on their parents' laps. Head
injuries predominated and were most common in
the youngest children. Children under age 1 were
the most likely to have reached the hospital
alive. The high death rate for very young
children was not explained by the circumstances
of the crashes or by the age distribution of
children involved in all crashes.
Citation: Karwacki JJ Jr, Baker SP. Children in Motor Vehicles: Never Too Young to Die. JAMA
242:2848-2851, 1979. Abstracted in Current Contents 8(8):16, 1980.
Link to Full-text: http://www.ncbi.nlm.nih.gov/pubmed/513252
14
MOTOR VEHICLE OCCUPANT DEATHS
IN YOUNG CHILDREN
SP Baker
Based on the cases I was seeing in the autopsy room, I had a hunch that babies had
higher death rates in crashes than older children. But I could not find data that
distinguished the occupants from pedestrians, or that described the fatally injured
children by month and year of age. The National Center for Health Statistics granted
my request for a special tape that allowed me to tease out the needed detail. Once I
had the tape, it took me about 10 minutes to discover that my hunch had been
correct. I remember my excitement, and it turned out that my simple analysis had far-
reaching results. It still amazes me that the especially high risks of infants were not
recognized until this paper was published. In the following decade, the information
would be used in many states by proponents fighting to require that children be
protected in cars.
Abstract: Motor vehicle occupant deaths of US
children aged 0 to 12 years were analyzed.
Surprisingly, the death rate is highest for
children less than 6 months old: 9.0/100,000,
dropping to 4.5/100,000 for 1-year-olds and
about 3/100,000 for children aged 6 to 12. The
second and third months of age are a period of
especially high risk. More attention should
therefore be focused on protecting infants from
injury and death resulting from motor vehicle
crashes.
Citation: Baker SP. Motor Vehicle Occupant Deaths in Young Children. Pediatrics 64:860-861,
1979.
Link to Full-text: http://www.ncbi.nlm.nih.gov/pubmed/514715
15
CHILDHOOD ASPHYXIATION BY CHOKING OR SUFFOCATION
SP Baker and RS Fisher
I had been struck by a statement in a newspaper that ―balloons kill more children
than any other toy.‖ Figuring it must be from aspirating balloons or pieces of them, I
reviewed all of the medical examiner cases of childhood choking in recent years –
and, to my surprise, found three times as many hot dogs as balloons. I mentioned the
finding to a newspaper reporter and found myself quoted on the front page of the
Baltimore SUN – and maligned by some for attacking the American symbol. I might
have turned to problems other than the size and shape of things children put in their
mouths, had it not been for a mother who wrote to me about her daughter who had
been in a vegetative state for 5 years since choking on a hot dog. Other people told
me about members of their families who had choked (not fatally) on hot dogs. One
said that as a child, he had choked on a hot dog and was saved when a doctor at the
picnic pulled out a penknife. The child was so scared that he coughed out the plug of
hot dog. (I often say that a bite of hot dog is the perfect plug for a child‘s airway, and
that if one wanted to design a food that was likely to kill a child, a hot dog would win
the prize.) I asked Russell Fisher, Chief Medical Examiner of Maryland, to co-author
this paper in recognition of the contributions of his office to my research and to the
health and safety of Marylanders. A later paper in JAMA expanded the study
nationwide, assisted by pediatrician Gary Smith and led by Carole Harris, a mother
who used the Heimlich maneuver to save her child when he was choking on a Gerber
meatstick.
Abstract: Medical examiner records were
reviewed for 42 Maryland children younger than
10 years who died of asphyxiation from 1970
through 1978. Twelve children choked on food;
six of these deaths involved hot dogs. Eight
choked on nonfood objects. Size, shape, and
consistency were important, with small, round,
pliable products predominating. Twenty-two
deaths resulted from suffocation, including four
infants who died when plastic bags in their cribs
or playpens pressed against their faces. Twelve
of the 42 deaths resulted from problems that are
now the subject of Consumer Product Safety
Commission activity or regulations. Important
problems not currently addressed include plastic
bags, balloons, and foods that because of their
shape or consistency are especially likely to
cause asphyxiation.
Citation: Baker SP, Fisher RS. Childhood Asphyxiation by Choking or Suffocation. JAMA
244:1343-1346, 1980.
Link to Full-text: http://www.ncbi.nlm.nih.gov/pubmed/7411807
16
FREEDOM AND PROTECTION: A BALANCING OF INTERESTS
SP Baker and SP Teret
Steve Teret, a former plaintiff‘s attorney, came into my life as an MPH candidate,
passionate about the need for society to protect its members against preventable
injury and death. He resorted to litigation only sparingly, and as a last resort – but
used it very effectively to speed regulations requiring airbags in all cars after
decades of delay. As director of our Center for Injury Research and Policy for an
important eight years, he helped to shift the focus of policy research to address the
man-made hazards in our environment and to capitalize on the potential of the law
for reducing those hazards.
Abstract: ―Perspective on the Public Good‖
deserves careful attention because it brings
together, in one article, several often-heard
arguments that are just as dangerous as the
helmetless motorcycling they would promote.
The argument that rock climbers and rodeo
contestants are not required by law to wear crash
helmets implies that if a policy is not applied at
the outer limits of a continuum of circumstances,
it would be unreasonable to apply that policy at
any point along the continuum. But consider the
spectrum of regulations pertinent to motor-
cyclists. At one end would be such measures as
banning the use of motorcycles; at the opposite
extreme would be the complete absence of
restrictions on motorcycle operation and the
exemption of motorcycles from traffic laws. If
both ends of this continuum are unacceptable,
does that mean that a reasonable course of action
cannot be found somewhere in between? Hardly.
Dr. Perkins is disturbed by what he refers to as
Baker‘s ―unqualified call for public health
officials to put a stop to injury and disease losses
resulting from the practice of individual
freedoms.‖ In point of fact, my editorial called
for putting a stop to the ―losses of other people‘s
freedoms‖ (emphasis added) resulting from
special-interest lobbying in the name of
―individual freedom.‖ If we considered only the
balance between the individual‘s freedom of
choice and that same individual‘s health status,
we would most often find in favor of freedom; it
would be paternalistic to do otherwise. But we
are faced with the more difficult task of
incorporating societal concerns—i.e., the
concerns of all individuals combined—into the
equation, and a significant population burden can
outweigh an individual‘s freedom. Courts have
concurred with this approach. Legislators have
the responsibility for regulating safety on public
roads. If they allow the use of motorcycles—for
which the death rate per million person-miles of
travel is more than 10 times the rate for cars—
then it makes sense that they should reduce the
high risk of injury or death by requiring
additional protection for motorcyclists.
Citation: Baker SP, Teret SP. Freedom and Protection: A Balancing of Interests. Am J Public Health
71:295-297, 1981.
Link to Full-text: http://www.ncbi.nlm.nih.gov/pubmed/7468864
17
CHILDHOOD INJURIES:
THE COMMUNITY APPROACH TO PREVENTION
SP Baker
Perhaps my all-time favorite, this paper began as a richly-illustrated presentation at
APHA that opened with a shot of an 1880s tombstone for three children from a single
family, all of whom had died before age 5, probably of diphtheria or other diseases
now rare. Once published, the paper conveyed its message so well that an Arizona
judge phoned to tell me it was the crucial factor in his decision against a club that
balked against fencing its swimming pool. The paper emphasizes the fact (illustrated
by figures) that the most successful preventive measures are those requiring the least
individual action and the least effort. As I often remind students, if we had to take our
children to be vaccinated every month, few would be protected.
Abstract: This paper discusses childhood
injuries that are caused by man-made products
and environments. It excludes a most important
category, namely, injuries related to motor
vehicles, but the basic principles of injury
control are equally relevant on and off the
highway. In either instance, the term injury
control is a good one because it emphasizes that
our goal is controlling or preventing injuries and
reducing their sequelae, not controlling people.
Children will still be inquisitive, imaginative,
and daring long after we have taken successful
steps to keep them from dying because of these
traits. It is pertinent to consider the factors that
determine whether measures that could prevent
injury if they are applied will in fact result in the
needed protection. This is largely a function of
the following: 1) Whether the measure is used,
which in turn depends on (a) how often action is
required of individuals; (b) how much individual
effort is required; (c) the presence of other
deterrents or incentives and 2) Whether the
measure will be used correctly. As long as we
place major responsibility for childhood injury
prevention on children and their parents,
potential solutions that have not been
implemented in 1980 will still be largely unused
in the year 2000, and easily preventable deaths
and injuries will continue to occur. To try to
prevent injuries with advice to behave safely, in
light of what we know in 1981, is the equivalent
of trying to control polio with advice to stay out
of swimming pools even though an effective
vaccine is available.
Citation: Baker SP. Childhood Injuries: The Community Approach to Prevention. J Public Health
Policy 2:235-246, 1981.
Link to Full-text: http://www.ncbi.nlm.nih.gov/pubmed/7298840
18
RECENT TRENDS IN FATAL POISONING BY OPIATES
JS Samkoff and SP Baker
Judith Samkoff, a medical student who was to become an applied epidemiologist, was
helping me dig out facts for the first edition of The Injury Fact Book (she should have
been a co-author of the book) when she showed me some data on poisoning trends
that made no sense. ―Either it‘s a mistake, or it‘s an important discovery,‖ I told her.
It was the latter, and she untangled this mystery – learning in the process how to
‗focus her microscope‘ on ever-smaller details until reaching the essence of an injury
problem. In this case, that meant zeroing in on opiates and specific population
groups. It is interesting that today‘s availability of prescription opiods has triggered
another dramatic upsurge in deaths, so that deaths from poisonings now outnumber
those from motor vehicle crashes.
Abstract: Deaths in the United States classified
as unintentional poisoning by drugs and
medicaments fell from 14.7 per million
population in 1975 to 8.8 in 1978, a 40 per cent
decrease. Seventy-three per cent of this drop was
attributable to a reduction in deaths coded to
opiates and intravenous narcotism. These two
categories accounted for 38 per cent of all
unintentional drug deaths in 1975 but only 15
per cent in 1978. There was no simultaneous
increase in other drug-related deaths, including
suicides, to account for the reduction in deaths
coded to opiates. The highest mortality rates and
the greatest variation in mortality during 1970-
78 occurred in 20-29 year old non-White males.
Racial and sex differences in opiate poisoning
mortality, notable early in the decade, were
greatly reduced by 1978 due to a relatively larger
decline in mortality of males and non-Whites.
Time trends in mortality from opiate poisoning
appear to coincide with variations in the amount
of heroin smuggled into the country.
Citation: Samkoff JS, Baker SP. Recent Trends in Fatal Poisoning by Opiates. Am J Public Health
72:1251-1256, 1982.
Link to Full-text: http://www.ncbi.nlm.nih.gov/pubmed/7125028
19
FATAL OCCUPATIONAL INJURIES
SP Baker, JS Samkoff, RS Fisher, and CB VanBuren
Today, firefighters heading to a fire ride inside the fire truck. But that was not true in
1981, when the strap on the back of a fire truck broke and a fire fighter fell to his
death. Scores of other Maryland workers died on the job in that same year, as
recounted below. The idea that workers susceptible to on-the-job homicide, such as
taxi drivers, bank employees, and guards, should come under OSHA protection was
brand new. So was the suggestion that employers should not provide workers with
unsafe vehicles such as small cars. Dr. Russell Fisher, Chief Medical Examiner of
Maryland, who had given me a place to work on my own for many years, joined us in
this work that required getting sensitive data from other agencies.
Abstract: Deaths resulting from work-related
injuries during a one-year period in Maryland
were identified and reviewed. Of 148 workers
killed, all but two were male. Transportation
vehicles were involved in 41% of the deaths,
with road vehicles accounting for 25% of the
total. Other major groups involved non-road land
vehicles (16%) and firearms, primarily handguns
(11%). Two thirds of the workers died at the
scene or were dead on arrival at the hospital.
Head injuries were the most common cause of
death. Eleven percent of the workers tested had
blood alcohol concentrations of 0.08% by weight
or greater. The majority of the deaths involved
either hazards that are not addressed by the
Occupational Safety and Health Act of 1970 or
workers in categories that are excluded by law
from regulation under this act.
Citation: Baker SP, Samkoff JS, Fisher RS, VanBuren CB. Fatal Occupational Injuries. JAMA
248:692-697, August, 1982. Published in Flemish, JAMA 18-25, March, 1983. Published in Japanese,
JAMA 81-91, March, 1983.
Link to Full-text: http://www.ncbi.nlm.nih.gov/pubmed/7097919
20
FATAL HOUSEFIRES IN AN URBAN POPULATION
MC Mierley and SP Baker
Research on housefires might seem an unlikely recipient of funding by the Insurance
Institute for Highway Safety, but Bill Haddon realized that if the public health world
was to adopt injury control, my research should go beyond highway carnage. This
paper grew from collaborative efforts of the ME office, the fire department, and
Marianne Mierley, an MHS student. Our finding that more than one-third of the
Baltimoreans who died in cigarette-ignited housefires were not the smokers of the
cigarettes starred in the effort to promote ―fire safe‖ cigarettes. In July 2008,
Maryland became the 12th state to require that all cigarettes sold in the state be
manufactured with reduced potential to ignite fires. The Baltimore City Fire
Department became a leader in many types of protection against fires, including
regulatory requirements for sprinkler systems. Too many people had assumed that
one or more smoke detectors in the home would give adequate protection, not
recognizing that sprinklers would extinguish a fire even if occupants were too young,
too old, or incapacitated, and, therefore, unable to protect themselves. Although the
battle is being waged slowly, in individual jurisdictions, the day will surely come
when even single-family homes are required to have sprinklers.
Abstract: House fires kill about 5,000
Americans annually, at a rate (2/100,000) that
has remained almost constant for the past 50
years. House-fire deaths were studied in
Baltimore, where 55 residents died during a
three-year period. More than half of the deaths
resulted from cigarette-ignited fires; 39% of the
people who died in such fires were not the
cigarette smokers themselves. For both blacks
and whites, the death rate was highest in census
tracts where property rental values were low.
The death rate from fires ignited by heating or
electrical equipment was nine times as high in
the lowest-value census tracts as in the highest.
Citation: Mierley MC, Baker SP. Fatal Housefires in an Urban Population. JAMA 249:1466-1468,
March, 1983.
Link to Full-text: http://www.ncbi.nlm.nih.gov/pubmed/6827724
21
INJURIES AMONG THE HOPI INDIANS:
A POPULATION-BASED SURVEY
SG Simpson, R Reid, SP Baker, and SP Teret
Sylvia Simpson and Ray Reid (a Navajo physician) were preventive medicine
residents looking for a project, hardly expecting to spend 2 months living in a trailer
on an Indian reservation. During two visits to our residents, I was captivated by the
beauty of the land and impressed by the many hazards facing these stalwart,
disadvantaged Native Americans. The roads were rough, without guardrail to keep
vehicles from going down the steep embankments. Children riding in the back of
pickup trucks were easily bounced out, people fell from roofs while watching
ceremonial dancers, and, perhaps saddest of all, young men jailed for drunken
binges hung themselves in their cells rather than face disgrace. Ray says the study
helped him to understand the personal feelings people have about injuries.
Abstract: Injuries are the leading cause of death
among American Indians. An epidemiologic
study was conducted on the Hopi reservation to
assess the incidence, circumstances, and
outcome of injuries. The incidence of
hospitalized or fatal injuries during 1979-1980
was 12 per 1,000 persons per year, with the
highest incidence in the age group of those older
than 84 years. Overall, falls, motor vehicle
crashes, self-inflicted injuries, and assaults were
the leading causes of injuries. Suicides and
crashes were the leading causes of death. The
15- to 29-year age group, which constituted only
a quarter of the population, accounted for 46% of
all injuries. This age group had especially high
rates of self-inflicted injuries, crashes, and
assaults. Injury problems of special importance
to the Hopis included single-vehicle rollover
crashes, falls from pickup trucks, falls from
mesas and pueblo roofs, and suicide attempts in
jails.
Citation: Simpson SG, Reid R, Baker SP, Teret SP. Injuries Among the Hopi Indians: A Population-
Based Survey. JAMA 249:1873-1876, 1983.
Link to Full-text: http://www.ncbi.nlm.nih.gov/pubmed/6834582
22
SMOKE DETECTOR LEGISLATION:
ITS EFFECT ON OWNER-OCCUPIED HOMES
E McLoughlin, M Marchone, L Hanger, PS German, and SP Baker
Twenty-five years after her doctoral research that resulted in this paper, Liz
McLoughlin is still remembered and revered by the fire-fighters she worked with.
Smoke detector mandates, as rare at that time as sprinkler system requirements are
today, were crying for evaluation. Liz finished her doctoral work in the shortest time
of any Ph.D. candidate, and then went on to lead California efforts to require
motorcycle helmet use and to assist in the 30-year effort to mandate fire-safe
cigarettes in all states. She also worked with advocates to train health care
professionals about domestic violence and abuse, and was active in California's ten-
year-long youth Violence Prevention Initiative
Abstract: Montgomery County, Maryland was
the first major jurisdiction to pass a law
requiring smoke detectors in all homes. Smoke
detector coverage in the county was evaluated
five years after the law's implementation and
compared to the coverage in neighboring Fairfax
County, Virginia, which has no such law.
Firefighters visited 651 randomly selected
owner-occupied homes and tested each detector.
While a similar percentage of homes in
Montgomery and Fairfax counties complied with
detector codes (42 per cent vs 44 per cent,
respectively), Montgomery County had a
significantly lower percentage of homes with no
working detectors (17 per cent vs 30 per cent)
and with no detectors at all (6 per cent vs 16 per
cent). In general, Montgomery County residents
complied with what they believed the law
required, but lacked knowledge of the law's
details. New homes where building codes
required detectors and homes where owners
assumed that detectors were required by law
were likely to have working detectors. Analyses
of 12 years of fire data suggest that as a county
approaches complete detector coverage, the risk
of residential fire deaths decreases. An
essentially unenforced law seems to be obeyed
because it conforms to community values.
Citation: McLoughlin E, Marchone M, Hanger L, German PS, Baker SP. Smoke Detector
Legislation: Its Effect on Owner-Occupied Homes. Am J Public Health 75:858-862, 1985.
Link to Full-text: http://www.ncbi.nlm.nih.gov/pubmed/4025645
23
FATALITIES IN THE PEACE CORPS:
A RETROSPECTIVE STUDY, 1962-1983
S Hargarten and SP Baker
Steve Hargarten, an EMS physician getting his MPH at Hopkins, joined me in this
study of Peace Corps workers whose lives ended tragically. Although injuries were
overwhelmingly the cause of most deaths of Peace Corps volunteers, they received
little preventive attention from the Peace Corps. When the Peace Corps held a
course in D.C. for its health workers, I gave a talk describing our findings. But the
medical director left the auditorium for the duration of my talk about preventing
these deaths. Sadly, injury prevention was clearly not a top priority, even though
simple measures such as motorcycle helmet use requirements would have made a
great difference.
Abstract: Fatalities among Peace Corps
volunteers were analyzed for 1962 through 1983,
with individual case histories reviewed for all
deaths from 1977 through 1983. Unintentional
injuries accounted for 70% of the 185 deaths of
Peace Corps volunteers, with motor vehicle
crashes the number 1 cause of death. The death
rate from unintentional injuries for women was
significantly higher than the comparable US rate.
Motorcycles caused 12% of all Peace Corps
deaths and 33% of all motor vehicle deaths.
Suicide has emerged as a leading cause of death
among volunteers, accounting for 13% of all
deaths from 1981 through 1983. Greater
emphasis on injury control measures is needed to
reduce this toll.
Citation: Hargarten S, Baker SP. Fatalities in the Peace Corps: A Retrospective Study, 1962-1983.
JAMA 254:1326-1329, 1985.
Link to Full-text: http://www.ncbi.nlm.nih.gov/pubmed/4021010
24
POISONING HOSPITALIZATIONS AND DEATHS FROM SOLIDS AND
LIQUIDS AMONG CHILDREN AND TEENAGERS
A Trinkoff and SP Baker
This paper started in my head when I read the ME investigator‘s report on a teenage
girl who poisoned herself with her mother‘s tranquilizers because she‘d been ditched
by her boyfriend. The numbers of such cases among teens dwarfed the problem of
pediatric poisoning that caught everyone‘s attention. Alison Trinkoff, a nurse who
was a Ph.D. candidate at the time, agreed and took the lead on this paper, which she
realized would be a good showcase for Haddon‘s Ten Strategies. The strategies
related to poisoning prevention are especially important today, when prescription
drug overdoses are so prevalent among teenagers and older adults.
Abstract: Twenty-four deaths and 4,271
hospital admissions due to poisoning occurred in
the 0-19 year age group in Maryland during
1979-82. Four-fifths of the deaths (83 per cent)
and two-thirds of the admissions involved
teenagers. Among teenagers, four out of five
admissions and deaths were of suicidal or
undetermined intent. Black males had the highest
hospitalization rate among young children, and
White females among teenagers. The most
common poisons ingested by children aged 0-4
years were aspirin, solvents and petroleum
products, tranquilizers, and iron compounds.
Among teenagers, aspirin, tranquilizers,
sedatives, and antidepressants were the most
common substances ingested, with anti-
depressants and stimulants most common among
the fatalities. Reducing the availability and
toxicity of the most hazardous drugs is important
if morbidity and mortality from poisoning are to
be prevented.
Citation: Trinkoff A, Baker SP. Poisoning Hospitalizations and Deaths from Solids and Liquids
Among Children and Teenagers. Am J Public Health 76:657-660, 1986.
Link to Full-text: http://www.ncbi.nlm.nih.gov/pubmed/3706592
25
FALLS IN THE INSTITUTIONALIZED ELDERLY
AH Myers, SP Baker, EG Robinson, H Abbey, ET Doll, and S Levenson
When Ann Myers (a nurse with a PhD) and I went to talk with doctors at a nursing
home in preparation for this study, we found they subscribed to the popular belief
that falls in the elderly occurred because of hip fractures, rather than the other way
around. Our results proved just the opposite. Although many patients had limitations
that placed them at greater risk, the environmental factors played a major role: wet
floors, inadequate railings to hold onto, and problems with walking aids, for
example. Wheelchairs became our special concern, so we worked with engineering
undergrads who developed a wheelchair modification that automatically braked the
chair when no one was sitting in it, so it would not move when a patient was getting
to her feet or sitting down. The size of the problem led to Ann‘s research and early
development of hip padding and eventually – with help from airbag inventor Carl
Clark – hip airbags. Currently Ann is working to make the hip airbags user-friendly
so their potential can be realized.
Abstract: Of all types of injuries, those from
falls are the most serious threat to the elderly.
Falls and the resulting injuries are associated
with pain and suffering, fear, restricted activity,
and a reduced level of functioning. Serious
injuries, such as fracture of the femur, can result
in long hospitalization and high costs and in a
high case-fatality rate among older persons. Falls
are an especially serious problem for the
institutionalized elderly, who are more
debilitated than younger people and less likely to
recover as fully from serious injury. This report
describes the findings of a study designed to
identify risk factors associated with falls in the
institutionalized elderly. Measures to reduce
injurious falls are suggested. The largest
proportion of injurious falls involved the patient
tipping the wheelchair over, a problem
apparently unreported in the literature. The
second most frequent problem was that of
unlocked wheelchairs. With increasing
proportions of elderly persons in our society, the
identification of those at high risk of injuries
from falls and the evaluation of interventions
have the potential to make a major impact on
public health.
Citation: Myers AH, Baker SP, Robinson EG, Abbey H, Doll ET, Levenson S. Falls in the
Institutionalized Elderly. J Long-Term Care Administration 17(4):12-18, 1989.
Link to Full-text: http://www.ncbi.nlm.nih.gov/pubmed/10296858
26
HAZARDS OF MOUNTAIN FLYING:
CRASHES IN THE COLORADO ROCKIES
SP Baker and MW Lamb
When I was in my mid-fifties I caught the flying bug, hoping a pilot‘s license would
give me a better understanding of what pilots do, before I dove into aviation
research. The high rates of general aviation crashes in mountainous states, obvious
from a map I made for the Injury Fact Book, led me to Margaret Lamb, an expert in
mountain weather, mountain flying, and mountain climbing. I experienced all these
with her, but our favorite research project – we called it ―bird-feather
epidemiology‖ – culminated in this paper. We flew her Navion over these crash sites
and mountain passes, and landed at typical small mountain airports. In our
conversations with instructors and other pilots, I was surprised that many admitted
to not wearing their shoulder harnesses. Of the pilots in the study, it appeared that
many had no appreciation of the degree to which their plane‘s ability to climb out of
blind canyons or over mountain passes deteriorated with the combination of altitude
and rising temperature and local winds.
Abstract: Between 1964 and 1987, 232
airplanes crashed within 50 nautical miles of
Aspen, CO; 90% were general aviation crashes.
A total of 202 people died and 69 were seriously
injured. The societal cost averaged more than $4
million annually. Most pilots were experienced
and many were flight instructors, but 44% had
flown less than 100 hours in the type of plane in
which they crashed. Forty-one percent of the
pilots were out-of-state residents. Crashes in the
study area were more likely to be fatal than in
the rest of Colorado. Airplanes with three or four
occupants and low-powered four-seater aircraft
were over-represented among crashes involving
failure to outclimb rising terrain. In a subset of
crashes examined for restraint use, 50% of the
front seat occupants using only lap belts were
killed, compared to 13% of those who also wore
shoulder restraints. Preventive recommendations
include shoulder restraint use and better training
in mountain flying, with incentives provided by
the FAA and insurance companies.
Citation: Baker SP, Lamb MW. Hazards of Mountain Flying: Crashes in the Colorado Rockies.
Aviat Space Environ Med 60(6):531-536, 1989.
Link to Full-text: http://www.ncbi.nlm.nih.gov/pubmed/2751582
27
PILOTS INVOLVED IN MULTIPLE CRASHES:
"ACCIDENT PRONENESS" REVISITED
SP Baker, G Li, MW Lamb and M Warner
―Accident proneness‖ has long been offered as an explanation for the fact that some
individuals have more than ―their share‖ of near-misses or injurious events. But
rather than ―accident repeaters‖ suffering apparently from inherent personal
characteristics, we found that the hazardous environments in which some pilots fly
contribute to their over-involvement in crashes. For example, in some instances,
there was no airport and pilots had to land on sand bars or other ―unstable terrain.‖
While behavior (e.g., alcohol overindulgence) and personality also can play major
roles, the challenges of one‘s occupation and recreational choices are very
important – and often ignored by those who prefer to focus on the useless notion of
an inborn tendency to be involved in mishaps.
Abstract: Analysis of crashes of air taxi and
commuter flights explored the controversial
issue of "accident proneness." There were 20
pilots who had 2 or more crashes during 1983-
88. These pilots (repeaters) and their 42 crashes
were compared with 534 pilots who were each
involved in a single air taxi or commuter crash
during the same period (nonrepeaters).
Unexpectedly, repeaters were more experienced
pilots with a mean total flight time of 7016 h vs.
5321 for nonrepeaters. Repeaters did not differ
from nonrepeaters in the overall proportion of
crashes in which pilot performance appeared to
be a major factor. Repeaters differed signif-
icantly from nonrepeaters as to flight hours
during the past 90 d (mean 215 vs. 183 h) and
the proportion of their crashes that occurred in
Alaska (48% vs. 24%). Alaska repeaters differed
from non-Alaska repeaters with regard to the
proportion of crashes on takeoff (40% vs 14%)
and airport conditions as a factor (50% vs. 18%).
The high proportion of repeaters involved in
crashes in Alaska, where environmental
conditions make flying more hazardous, and the
substantially greater recent flight time suggest
that the intensity and amount of occupational
exposure are major determinants of pilot
involvement in more than one crash.
Citation: Baker SP, Li G, Lamb MW, Warner M. Pilots Involved in Multiple Crashes: "Accident
Proneness" Revisited. Aviat Space Environ Med 66:6-10, 1995.
Link to Full-text: http://www.ncbi.nlm.nih.gov/pubmed/7695555
28
PRIOR CRASH AND VIOLATION RECORDS OF
PILOTS IN COMMUTER AND AIR TAXI CRASHES:
A CASE-CONTROL STUDY
G Li and SP Baker
Guohua Li arrived on my doorstep in 1989, soon after the Tiananmen Square
massacre in Beijing. With a rural childhood, medical degree from Beijing and a
master‘s in statistics behind him, he settled down to work with me. In ten years he
had finished a post-doc and a DrPH, made possible the second edition of the Injury
Fact Book, made substantial contributions to injury research methodology, and
perfected his English until he could out-write 99.9% of Americans. Thoughtful and
innovative, he was soon on a fast trajectory to becoming a full professor and a pre-
eminent injury epidemiologist. This outgrowth of his dissertation was one of the first
of dozens of aviation papers.
Abstract: With a case-control design, this study
examined the relationships of crash/incident
history, violation history, pilot age, flight
experience, and recent flight time with the
likelihood of being involved in commuter
aircraft and air taxi crashes. Cases (n = 725)
were pilots who had been involved in commuter
aircraft or air taxi crashes during 1983-88,
identified from the National Transportation
Safety Board aviation crash database. From the
Federal Aviation Administration (FAA) airmen
information system, 1,555 pilots were randomly
selected as controls. Controls were frequency-
matched with cases on medical class and
calendar year. Different databases within the
FAA's airmen information system were linked to
ascertain information about the crash/incident
and violation records in the previous 3 years,
age, total flight time, and flight time in the prior
6 months. Multivariate logistic regression
models were fitted to estimate odds ratios and
evaluate dose-response effects, non-linear
relationships, and interactions. Cases had
significantly higher prevalence rates of prior
crash/incident and violation records. The
estimated odds ratio of being involved in a
commuter aircraft or an air taxi crash was 1.7
(95% confidence interval [CI], 1.3-2.4) for
crash/incident history, and 1.6 (95% CI, 1.1-2.2)
for violation history. A "dose-response effect"
was found with both crash/incident history and
violation history, with higher odds ratios for
pilots involved in crashes versus incidents or
pilots with more serious violations. Total flight
time showed a diminishing protective effect.
Either very small or very large recent flight time
increased the risk of being involved in a
commuter aircraft or an air taxi crash.
Citation: Li G, Baker SP. Prior Crash and Violation Records of Pilots in Commuter and Air Taxi
Crashes: A Case-Control Study. Aviat Space Environ Med 65:979-985, 1994.
Link to Full-text: http://www.ncbi.nlm.nih.gov/pubmed/7840750
29
EXPLORING THE MALE-FEMALE DISCREPANCY IN
DEATH RATES FROM BICYCLING INJURY:
THE DECOMPOSITION METHOD
G Li and SP Baker
This paper, forerunner to Guohua Li‘s award-winning paper in Epidemiology (1998,
―Are female drivers safer?‖) was the first application of the decomposition method
to an injury problem. It arose from my observation that the population-based death
rate equals the case-fatality rate times the ratio of injuries to exposure (e.g., trips)
times the ratio of exposure to population. This method allows us to tease out the
contribution of specific factors, such as exposure and injury severity as well as age
and gender, to differences among various population groups in their injury death
rates. In the case of both this paper and the 1998 paper, as well as other papers on
male and female pilots, we found that media attention could always be counted on
when the topic was gender differences.
Abstract: The population-based death rate as an
important indicator of health status has been
widely used in injury research. Generally, the
death rate from injury for males is about three
times that for females. The importance of the
various factors that contribute to this male-
female discrepancy, however, has not been well
understood. Using the innovative Decomposition
Method, data from the Nationwide Personal
Transportation Survey, the National Electronic
Injury Surveillance System, and the National
Center for Health Statistics were analyzed to
explore the determinants of the male-female
difference in death rates from bicycling injury.
The results revealed that males have a higher
death rate from bicycling injury than females
because they have a greater exposure rate and
case fatality rate. When exposure measured by
number of bicycle trips is taken into account,
males are at slightly lower risk of injury than
females. The relative contribution of case
fatality, exposure, and risk to the 6.4-fold
difference in death rates from bicycling injury
between men and women is 53%, 51%, and -4%,
respectively.
Citation: Li G, Baker SP. Exploring the Male-Female Discrepancy in Death Rates from Bicycling
Injury: The Decomposition Method. Accid Anal Prev 28:537-540, 1996.
Link to Full-text: http://www.ncbi.nlm.nih.gov/pubmed/8870781
30
AT WORK AND PLAY IN A HAZARDOUS ENVIRONMENT:
INJURIES ABOARD A DEPLOYED U.S. NAVY AIRCRAFT CARRIER
MJ Krentz, G Li, and SP Baker
This paper reflects my long-time interest in injuries in the military. Mike Krentz was
an MPH candidate when we began this review of injuries on a carrier. I could never
get funding for recreational injuries in an occupational setting – NIOSH said
recreational injuries were CDC's problem, but CDC would not touch occupational
injuries, claiming that was NIOSH's responsibility. This research was my
introduction to injuries on aircraft carriers and led to a later invitation from Mike,
when he was CMO (Chief Medical Officer) on the George Washington: "Sue, would
you like to spend a couple of weeks with us on maneuvers in August?" ―Love to! But
I could only go for a week." So I walked onto the carrier in Norfolk one evening and
after an exciting and instructive week was catapulted off in a cargo plane.
Abstract: Background: A deployed U.S. Navy
aircraft carrier is a hazardous environment where
work and recreation intermingle. Injuries causing
time lost from assigned duties may impact
aviation safety and operational readiness. This
descriptive study examines injuries sustained on
the flight deck, in the hangar bay, or in the gym
of a deployed aircraft carrier, focusing on those
injuries resulting in lost duty days. Methods:
Injuries recorded by the ship's medical
department were analyzed, relating lost duty
injuries to the following parameters: division,
rank, time of day, location of injury event,
whether injury was job-related or recreational,
type of recreational activity, and mechanism,
type, and anatomic site of injury. Results: During
a 6-mo deployment, 335 injuries occurred in the
shipboard locations studied. More than one-third
(36%) of these injuries resulted in lost duty time,
accounting for 768 man-days of lost duty during
the deployment. Recreational injuries repre-
sented 19% of all injuries, but 25% of all lost
duty injuries, a statistically significant contri-
bution to lost duty time when compared to job-
related injuries (p = 0.04). The sports of
basketball, volleyball, and football were more
likely than other recreational activities to cause
injuries resulting in lost duty time (p = 0.01).
Musculoskeletal injuries, particularly injuries
involving the lower extremity, neck, and back,
were also associated with increased risk of lost
duty time (p < 0.001). Conclusions: Although
recreational injuries are less frequent than job-
related injuries in the study population, they
contribute disproportionately to lost duty time.
Injury prevention in similar environments should
address recreational as well as work-related
activities.
Citation: Krentz MJ, Li G, Baker SP. At Work and Play in a Hazardous Environment: Injuries
Aboard a Deployed U.S. Navy Aircraft Carrier. Aviat Space Environ Med 68:51-55, 1997.
Link to Full-text: http://www.ncbi.nlm.nih.gov/pubmed/9006883

31
BIOMECHANICAL EPIDEMIOLOGY:
A NEW APPROACH TO INJURY CONTROL RESEARCH
FK Winston, DF Schwarz, and SP Baker
When Flaura Winston arrived in 1994 for a post-doctoral fellowship with me,
sponsored by the Snively Foundation, she was part pediatrician and part
biomechanical engineer, eager to put her two passions together for the benefit of
injury victims. During that year, she began a new course for our doctoral students
and laid the foundation for interdisciplinary work in injury control, applying a new
discipline she called ‗Biomechanical Epidemiology.‘ Soon she would be on her way
to building a unique partnership with State Farm Insurance Companies that would
collect, analyze, and publish invaluable information on children in motor vehicle
crashes. Development of her Center for Injury Research and Policy soon followed at
the Children‘s Hospital of Philadelphia. Like Carol Runyan, she was honored by
being admitted into the Society of Scholars of the Johns Hopkins University.
Abstract: Injury control studies, from inception
and design to dissemination of results, tend to
remain within individual discipline. This is
largely because each of the disciplines has a
unique language and approach to research.
Collaborative research is often performed
serially with one discipline presenting the results
of that discipline's studies to another discipline.
Epidemiologists and clinicians tell engineers to
design a safety technology to prevent a specific
injury. Engineers tell lawyers what is feasible to
include in standards. As a result, epidemiological
studies lack mechanical data needed by the
engineers and engineering studies lack
generalizability. The procedure for incorporating
the best of multiple disciplines throughout the
performance of injury control studies has not
existed until recently and is presented
conceptually in this manuscript. This new
approach, Biomechanical Epidemiology, is an
exciting enhancement to current injury control
research.
Citation: Winston FK, Schwarz DF, Baker SP. Biomechanical epidemiology: a new approach to
injury control research. J Trauma. 1996 May;40(5):820-4.
Link to Full-text: http://www.ncbi.nlm.nih.gov/pubmed/8614087
32
WARTIME CIVILIAN INJURIES:
EPIDEMIOLOGY AND INTERVENTION STRATEGIES
MB Aboutanos and SP Baker
Michel Aboutanos is a trauma surgeon who was getting his MPH when we met. He
grew up in Beirut, learning first-hand as a child the challenges to civilian survival
during wartime in 1975 to 1983. He told me, ―I am totally convinced that our entire
family would have been killed many times had it not been for my father's entire
modification of our apartment in Beirut, based on his army and police experience.
Our apartment was shelled many times; once a rocket exploded in our bedroom. We
were isolated in the middle of the building (my dad counted how many walls needed
to be hit and destroyed before the bomb could hit us in the little corridor where we
stayed for weeks, huddled with another family). My dad was the only one who would
leave in order to get water and some bread, avoiding attacks of the snipers who
targeted people trying to get food. I would watch him leave, trying to remember his
face, thinking that this is the last time I would see this great man. Worst of all for me
was the sound of an exploding bomb followed by deadly silence, then the hail of
shrapnel falling like rain on our balcony, then the sound of distant screaming. You
feel helpless.‖ Michel‘s experiences contributed to our suggested preventive
measures, organized using Haddon‘s Ten Basic Strategies.
Abstract: Background: Trauma is the most
important public health risk in wartime. Most
preventive efforts have addressed the political
etiology of armed conflicts and the secondary
effects of war (food, water, shelter, sanitation,
and vector control). Little to no efforts have
addressed the direct prevention and control of
war trauma. Methods: An extensive review of
the literature, with compilation of the most
important data. Results: Civilians are the major
wartime targets in recent wars, and account for
most of the killed and wounded. The trend has
been toward a greater proportion of injuries from
powerful explosive devices such as artillery
shells and mines. Lessons learned from Bosnia
and Lebanon show that the most effective way to
achieve successful surveillance and injury
prevention is to enhance the local skills and
resources. Conclusions: New approaches are
needed to minimize trauma to civilians. Both
political advocacy and local efforts (including
modifying firearms and ammunition, bullet proof
helmets for children, anti-sniper shields) are
needed.
Citation: Aboutanos MB, Baker SP. Wartime Civilian Injuries: Epidemiology and Intervention
Strategies. J Trauma 43:719-726, 1997.
Link to Full-text: http://www.ncbi.nlm.nih.gov/pubmed/9356079
33
A MODIFICATION OF THE INJURY SEVERITY SCORE THAT BOTH
IMPROVES ACCURACY AND SIMPLIFIES SCORING
T Osler, SP Baker, and WB Long
Ever since publication of the ISS in 1974, I had been asked "Why not count more
than one injury in any given body region? Isn't it a whole lot worse to have both a
ruptured liver and spleen than just a spleen?" My answer was that when I did the
original research, I would read a patient‘s record and record the single worst injury
in each region – that was a lot better than the usual information at the time, namely
just using the MAIS (Maximum Abbreviated Injury Scale), a single code for the
patient's worst injury. When I was asked that same question by Turner Osler, a
trauma surgeon at UNM (and later at UVM) with great statistical skill, I suggested
that he use his wealth of data to answer the question. Our subsequent research
revealed that the New Injury Severity Score was not only a better predictor of death
but also far easier to calculate than the ISS. Our big mistake was our failure to
realize that 'NISS' had been omitted from the title, a lesson in reading galley proofs!
Abstract: Objectives: The Injury Severity Score
(ISS) has served as the standard summary
measure of anatomic injury for more than 20
years. Nevertheless, the ISS has an idiosyncrasy
that both impairs its predictive power and
complicates its calculation. We present here a
simple modification of the ISS called the New
Injury Severity Score (NISS), which
significantly outperforms the venerable but dated
ISS as a predictor of mortality. Design:
Retrospective calculation of NISS and
comparison of NISS with prospectively
calculated ISS. Materials and Methods: The
NISS is defined as the sum of the squares of the
Abbreviated Injury Scale scores of each of a
patient's three most severe Abbreviated Injury
Scale injuries regardless of the body region in
which they occur. NISS values were calculated
for every patient in two large independent data
sets: 3,136 patients treated during a 4-year
period at the American College of Surgeons'
Level I trauma center in Albuquerque, New
Mexico, and 3,449 patients treated during a 4-
year period at the American College of Surgeons'
Level I trauma center at the Emanuel Hospital in
Portland, Oregon. The power of NISS to predict
mortality was then compared with previously
calculated ISS values for the same patients in
each of the two data sets. Measurements and
Main Results: We find that NISS is not only
simple to calculate but more predictive of
survival as well (Albuquerque: receiver
operating characteristic (ROC) ISS = 0.869,
ROC NISS = 0.896, p < 0.001; Portland: ROC
ISS = 0.896, ROC NISS = 0.907, p < 0.004).
Moreover, NISS provides a better fit throughout
its entire range of prediction (Hosmer Lemeshow
statistic for Albuquerque ISS = 29.12, NISS =
8.88; Hosmer Lemeshow statistic for Portland
ISS = 83.48, NISS = 19.86). Conclusion: NISS
should replace ISS as the standard summary
measure of human trauma.
Citation: Osler T, Baker SP, Long WB. A Modification of the Injury Severity Score That Both
Improves Accuracy and Simplifies Scoring. J Trauma. 43:922-926, 1997.
Link to Full-text: http://www.ncbi.nlm.nih.gov/pubmed/9420106
34
BACK INJURY IN MUNICIPAL WORKERS:
A CASE-CONTROL STUDY
AH Myers, SP Baker, G Li, G Smith, S Wiker, K Liang, and JV Johnson
Ann Myers and Gordon Smith, a medical epidemiologist, took the lead on this
ambitious study; it involved everything from measuring workers' height and girth to
examining the specific circumstances of injury. One important thing we learned was
that if you ask a person, "How would you keep someone else from being injured the
way you were?" you often receive a useful, perceptive answer — in this case, a way
to redesign the job. (If you asked how their injury might have been prevented, they‘d
say, ―I should have been more careful.‖) Our study was a surprise to the
ergonomists who believed many workers were faking work-related back injury. When
they went to the scenes of injury, however, they found the workers had been required
to accomplish daunting tasks such as loading heavy mowers onto trucks without
assistance from required equipment that never arrived. We reported our results to
city officials. A year or two later we were told the city had greatly reduced back
injury claims—not by addressing any of the problems we identified and reducing
injuries but, sadly, by being a lot stricter about granting claims. Even during the
period of our study, workers had to prove that their back pain was due to a specific
event at work, even though we know that many cases are due to cumulative exposures
over time.
Abstract: Objectives: The purpose of this study
was to identify factors associated with acute low
back injury among municipal employees of a
large city. Methods: For each of 200 injured case
patients, 2 coworker controls were randomly
selected, the first matched on gender, job, and
department and the second matched on gender
and job classification. In-person interviews were
conducted to collect data on demographics, work
history, work characteristics, work injuries, back
pain, psychosocial and work organization, health
behaviors, and anthropometric and ergonomic
factors related to the job. Psychosocial work
organization variables were examined with
factor analysis techniques; an aggregate value
for job strain was entered into the final model.
Risk factors were examined via multivariate
logistic regression techniques. Results: High job
strain was the most important factor affecting
back injury (odds ratio [OR] = 2.12, 95%
confidence interval [CI] = 1.28, 3.52), and it
showed a significant dose-response effect. Body
mass index (OR = 1.54, 95% CI = 1.08, 2.18)
and a work movement index (twisting, extended
reaching, and stooping) (OR = 1.42, 95% CI =
0.97, 2.08) were also significant factors.
Conclusions: Results suggest that increasing
workers' control over their jobs reduces levels of
job strain. Ergonomic strategies and worksite
health promotion may help reduce other risk
factors.
Citation: Myers AH, Baker SP, Li G, Smith G, Wiker S, Liang K, Johnson JV. Back Injury in
Municipal Workers: A Case-Control Study. Am J Public Health 89:1036-1041, 1999.
Link to Full-text: http://www.ncbi.nlm.nih.gov/pubmed/10394312
35
EFFECTS OF HIGH SCHOOL DRIVER EDUCATION ON
MOTOR VEHICLE CRASHES, VIOLATIONS, AND LICENSURE
JS Vernick, G Li, S Ogaitis, EJ MacKenzie, SP Baker, and AC Gielen
A 1977 article about me in People magazine mentioned my skepticism about the
value of high school driver education courses; two decades later, I felt vindicated by
our findings in this paper. With stars such as Ellen MacKenzie; then the director of
the Center for Injury Research and Policy; Andrea Gielen, who was to become the
current director; Guohua Li, who would eventually head a similar center at
Columbia; and Jon Vernick, the stellar leader of this project who did most of the
work, there probably was no need for me on the project. But our conversations
around the table, discussing the findings of Jon and Suzanne Ogaitis (our project
manager) were productive and memorable. In fact, there was little cause for debate.
Abstract: Objective: We sought evidence in the
research literature to determine if (1) high
school-aged persons who enroll in a driver
education course have fewer motor vehicle-
related crashes or violations, or are more likely
to obtain a drivers license, than those who do not
enroll in driver education courses, and (2) the
availability of high school driver education
courses is associated with lower community
rates of motor vehicle crashes among young
drivers. Methods: To be included, a study must:
(1) assess the effects of driver education courses
or legislation for high school-aged persons; (2)
present non-self-reported data for at least one of
the following outcome measures: driver
licensure rates, motor vehicle-related violations,
or crashes; (3) include some form of no
intervention comparison group; (4) adequately
control for potentially confounding variables; (5)
randomly assign participants to control or
treatment groups, if a controlled trial. Results:
Nine studies met our inclusion criteria. Based on
these studies, there is no convincing evidence
that high school driver education reduces motor
vehicle crash involvement rates for young
drivers, either at the individual or community
level. In fact, by providing an opportunity for
early licensure, there is evidence that these
courses are associated with higher crash
involvement rates for young drivers.
Conclusions: Although few driver education
curricula have been carefully evaluated, in the
absence of evidence that driver education
reduces crash involvement rates for young
persons, schools and communities should
consider other ways to reduce motor vehicle-
related deaths in this population, such as
graduated licensing.
Citation: Vernick JS, Li G, Ogaitis S, MacKenzie EJ, Baker SP, Gielen AC. Effects of high school
driver education on motor vehicle crashes, violations, and licensure. Am J Prev Med. 1999 Jan;16(1
Suppl):40-6.
Link to Full-text: http://www.ncbi.nlm.nih.gov/pubmed/9921385
36
CARRYING PASSENGERS AS A RISK FACTOR
FOR CRASHES FATAL TO 16- AND 17-YEAR OLD DRIVERS
LH Chen, SP Baker, ER Braver, and G Li
My curiosity about what was going on in the cars of teenagers who crashed must
have been contagious: Li-Hui Chen, a doctoral candidate, took this on as her
dissertation subject. Our results have contributed to the design and adoption of
restrictions on the carrying of passengers by teenage drivers – restrictions now
incorporated in most GDL programs. To date, however, our findings about the
additional hazard when passengers are male have not been reflected in any policy
changes. Given the over-representation of males in teens‘ crashes, whether as
drivers or passengers, perhaps insurers will eventually make an extra charge if your
teenage driver is a male! Seems unlikely, but think of the other amazing changes in
the recent decades.
Abstract: Context: Injuries from motor vehicle
crashes are the leading cause of death among
teenagers. Carrying passengers has been
identified as a possible risk factor for these
crashes. Objective: To determine whether the
presence of passengers is associated with an
increased risk of crashes fatal to 16- and 17-
year-old drivers and whether the risk varies by
time of day and age and sex of drivers and
passengers. Design and Setting: Incidence study
of data from the Fatality Analysis Reporting
System and General Estimates System (1992-
1997), as well as the Nationwide Personal
Transportation Survey (1995). Subjects: Drivers
aged 16 and 17 years who drove passenger cars,
vans, or pickup trucks. Main Outcome Measure:
Driver deaths per 10 million trips by number of
passengers, driver age and sex, and time of day;
and driver deaths per 1000 crashes by passenger
age and sex. Results: Compared with drivers of
the same age without passengers, the relative
risk of death per 10 million trips was 1.39 (95%
confidence interval [CI], 1.24-1.55) for 16-year-
old drivers with 1 passenger, 1.86 (95% CI,
1.56-2.20) for those with 2 passengers, and 2.82
(95% CI, 2.27-3.50) for those with 3 or more
passengers. The relative risk of death was 1.48
(95% CI, 1.35-1.62) for 17-year-old drivers with
1 passenger, 2.58 (95% CI, 2.24-2.95) for those
with 2 passengers, and 3.07 (95% CI, 2.50-3.77)
for those with 3 or more passengers. The risk of
death increased significantly for drivers
transporting passengers irrespective of the time
of day or sex of the driver, although male drivers
were at greater risk. Driver deaths per 1000
crashes increased for 16- and 17-year-olds
transporting male passengers or passengers
younger than 30 years. Conclusion: Our data
indicate that the risk of fatal injury for a 16- or
17-year-old driver increases with the number of
passengers. This result supports inclusion of
restrictions on carrying passengers in graduated
licensing systems for young drivers.
Citation: Chen LH, Baker SP, Braver ER, Li G. Carrying Passengers as a Risk Factor for Crashes
Fatal to 16- and 17-Year Old Drivers. JAMA 283:1578-1582, 2000.
Link to Full-text: http://www.ncbi.nlm.nih.gov/pubmed/10735394
37
CHARACTERISTICS OF GENERAL AVIATION CRASHES
INVOLVING MATURE MALE AND FEMALE PILOTS
SP Baker, MW Lamb, JG Grabowski, GW Rebok, and G Li
A flight instructor once told me that he would much prefer training women to
training men because, ―The women tend to show up better prepared for their flying
lessons than the men.‖ He rated female pilots slightly better in their stick-and-rudder
skills, but males seemed to have the edge with regard to rapid assessment and
reaction. But neither impression proved to be right when we studied crashes of
general aviation pilots (the level at which he had done most of his instructing): in
general, the women made better decisions, and most of the women‘s crashes involved
stick-and-rudder skills. Whether these gender characteristics are widespread, and
whether they apply to driving, remains to be seen.
Abstract: Background: General aviation crashes
in the United States were analyzed to identify
differences between male and female pilots in
the circumstances of their crashes and the types
of pilot errors involved. Methods: All 144
female pilots who were born between 1933 and
1942 and who were involved in general aviation
crashes between 1983 and 1997 were matched
1:2 with 287 male pilots by age within 2 yr,
medical certificate and pilot certificate, state or
region of crash, and year of crash. Results:
Mechanical failure, gear up landings, improper
IFR approaches, and collisions with wires or
poles were more common in crashes of male
pilots. Loss of control on landing/takeoff was
more common in crashes of female pilots.
Mishandling aircraft kinetics was the most
common error of pilots of both genders and was
noted more often in female pilots' crashes (81%
vs. 48%) (p < 0.001). Males' crashes were more
likely to involve flawed decisions (29% vs. 19%
of females' crashes) (p = 0.027) or inattention
(32% vs. 19%) (p = 0.004). Older pilots made
fewer errors: among males age 55-63, 26% of
crashes were without obvious pilot error
compared with only 7% at age 40-49 (p = 0.003).
Conclusion: There are large gender differences
in the types of pilot error involved in general
aviation crashes. Mishandling aircraft kinetics,
poor decision making, and inattention are the
most common pilot errors and merit increased
attention in pilot training.
Citation: Baker SP, Lamb MW, Grabowski G, Rebok G, Li G. Characteristics of General Aviation
Crashes Involving Mature Male and Female Pilots. Aviat Space Environ Med 72:447-452, 2001.
Link to Full-text: http://www.ncbi.nlm.nih.gov/pubmed/11346011
38
AGE, FLIGHT EXPERIENCE, AND RISK OF CRASH INVOLVEMENT
IN A COHORT OF PROFESSIONAL PILOTS
G Li, SP Baker, JG Grabowski, Y Qiang, ML McCarthy, and GW Rebok
During my years of active flying (mainly in the classic Navion of Margaret Lamb, a
specialist in mountain flying), my pilot‘s license proved to be the ticket to more
opportunities. I was fortunate to be allowed by the FAA and two airlines to fly jump-
seat—i.e., sitting right behind the pilots on the flight deck. Often their conversation
concerned the topic of discrimination against aging pilots: why should they have to
retire at age 60, when their skills and knowledge were generally better than those of
many young pilots who had higher crash rates? As the issue rose to a head in
Congress, the government turned to some of our research findings, including those in
this paper. The resulting change in the regulation—so that pilots could fly until age
65—still smacks of discrimination on the basis of a pilot‘s age rather than capability,
but at least it provides an extra five years of productive life for those whose health
and stamina allow it. Ironically, aging pilots with fewer than 10 passengers can still
fly commercially despite the lack of a second pilot to take over in a medical
emergency; fear of such emergencies had often been used to justify the age-60 rule.
Abstract: Federal aviation regulations prohibit
airline pilots from flying beyond the age of 60
years. However, the relation between pilot age
and flight safety has not been rigorously assessed
using empirical data. From 1987 to 1997, the
authors followed a cohort of 3,306 commuter air
carrier and air taxi pilots who were aged 45-54
years in 1987. During the follow-up period, the
pilots accumulated a total of 12.9 million flight
hours and 66 aviation crashes, yielding a rate of
5.1 crashes per million pilot flight hours. Crash
risk remained fairly stable as the pilots aged
from their late forties to their late fifties. Flight
experience, as measured by total flight time at
baseline, showed a significant protective effect
against the risk of crash involvement. With
adjustment for age, pilots who had 5,000-9,999
hours of total flight time at baseline had a 57%
lower risk of a crash than their less experienced
counterparts (relative risk = 0.43, 95%
confidence interval: 0.21, 0.87). The protective
effect of flight experience leveled off after total
flight time reached 10,000 hours. The lack of an
association between pilot age and crash risk may
reflect a strong "healthy worker effect"
stemming from the rigorous medical standards
and periodic physical examinations required for
professional pilots.
Citation: Li G, Baker SP, Grabowski JG, Qiang Y, McCarthy ML, Rebok GW. Age, Flight
Experience, and Risk of Crash Involvement in a Cohort of Professional Pilots. Am J Epidemiol
157:874-880, 2003.
Link to Full-text: http://www.ncbi.nlm.nih.gov/pubmed/12746239
39
INMATE-MADE WEAPONS: ASSESSING THE RISK
JM Lincoln, LH Chen, JS Mair, PJ Biermann, and SP Baker
Jennifer Lincoln went on to focus her attention on workers whose jobs of fishing on
the high seas put them at great risk, but she spent a year of her pre-doctoral life
working with me and our colleagues to reduce the hazards to correctional officers.
These oft-ignored workers are the targets of prisoners who have little to do except
for trying to design and fashion a weapon from any available object. Through visits
to prisons and hundreds of phone calls, we were able to characterize the seemingly
innocuous materials typically used to devise lethal weapons. (For example, one
inmate rolled up a magazine and blew out a dart made from paper hardened with
toothpaste. In his first test, it pierced a carton in the cell across the corridor!)
Abstract: More than 2400 correctional workers
in the United States required medical attention in
1999 following assaults by inmates, often with
unconventional "homemade" weapons. Little
information is available about these weapons.
The authors surveyed 101 state prisons for a 12
month period within 2002-03, and 70 responded.
A total of 1326 weapons were either confiscated
(1086) or used to injure inmates (203) or staff
(37). Staff were most often attacked with clubs.
The prison store was the most common source of
materials used to make confiscated weapons.
Issued items were the most common source of
materials used to make weapons to injure staff.
The injury rate for staff was 1.0/1000 workers
per year. The annual cost of injuries for time lost
and medical care for staff was estimated at
$1,125,000 in these 70 prisons. Results identify
materials that should be redesigned to prevent
modifications to make weapons. Prison stores
and issued items deserve special attention.
Citation: Lincoln JM, Chen LH, Mair JS, Biermann PJ, Baker SP. Inmate-made weapons: Assessing
the risk. Injury Prevention 12:195-198, 2006.
Link to Full-text: http://www.ncbi.nlm.nih.gov/pubmed/16751452
40
CRASH RESISTANT FUEL SYSTEM EFFECTIVENESS
IN CIVIL HELICOPTER CRASHES
MS Hayden, DF Shanahan, LH Chen, and SP Baker
During his years as a researcher at the US Army Aeromedical Research Laboratory
and other Army crash investigation organizations, Dennis Shanahan had
opportunities to evaluate the effectiveness of a variety of countermeasures designed
to reduce injury to members of the military. This paper stemmed from his realization
that the excellent standards for crashworthy fuel systems of military helicopters were
in danger of being reduced to the less protective Federal standards applied to
civilian helicopters. Apparently, there was some thought that, ―If the standards for
civilian helicopters are adequate, why not save money by applying them to the
military?‖ Mark Hayden, an Army industrial hygienist and master's candidate in
Environmental Health Sciences, took the lead on analyzing data and writing up the
results. Mark had a vested interest in aviation safety because he frequently found
himself as cargo in military aircraft in combat zones. Our hope is that this paper
helps the military standards to survive and, ultimately, to benefit civilians as well as
the military.
Abstract: Background: Crash-resistant fuel
systems (CRFS) have demonstrated close to
100% effectiveness in survivable crashes of
Army helicopters, but the technology has been
slow to transfer into the civil helicopter arena.
Federal standards for civil helicopter CRFS are
less stringent than those for military helicopters.
A reduction in standards for CRFS in military
helicopters is being considered. Objective: The
goal of this study was to determine whether
crashes of civil helicopters with CRFS are less
likely to result in post-crash fire than crashes of
those without. Method: Crashes of civil
helicopters during 1982-2004 were analyzed,
comparing Bell 206 helicopters manufactured
with CRFS with Aerospatial 350 helicopters
manufactured during the same period (post-
1981), but lacking CRFS. Bell 206 helicopters
with CRFS were also compared with earlier
models without CRFS. Results: The highest
proportion of crashes with post-crash fires
(11.3%) was in AS-350s manufactured after
1981 (non-CRFS), and the lowest (3.7%) was in
Bell 206s (with CRFS) [unadjusted risk ratio
(RR) = 3.3, 95% confidence interval (CI) = 1.04,
10.50; adjusted for light and weather, RR = 2.81,
Cl = 0.82, 9.69]. Earlier models of Bell 206s
without CRFS had higher risk of post-crash fire
than post-1981 models with CRFS. Conclusions:
The results of this study suggest a better
performance, in terms of post-crash fire
prevention, of CRFS-equipped civil helicopters
as compared with those without CRFS. It is
possible that CRFS in civil helicopters have not
achieved the same degree of effectiveness as
CRFS in military helicopters. CRFS should be
used more widely in civil helicopters. The more
stringent CRFS requirements for military
helicopters should not be reduced without further
research.
Citation: Hayden MS, Shanahan DF, Chen LH, Baker SP. Crash resistant fuel system effectiveness
in civil helicopter crashes. Aviat Space Environ Med 76:782-785, 2005.
Link to Full-text: http://www.ncbi.nlm.nih.gov/pubmed/16110696
41
EMS HELICOPTER CRASHES:
WHAT INFLUENCES FATAL OUTCOME?
SP Baker, JG Grabowski, RS Dodd, DF Shanahan, MW Lamb, and G Li
In 1988, Bob Dodd‘s research for the NTSB reported that EMS helicopters had a
fatal crash rate that was more than three times the rate for helicopter air taxis. His
subsequent dissertation research revealed that crew members in the rear of EMS
helicopters sustained more severe crash injuries than the flight crew in the cockpit, a
finding he tied to the lack of protection for the EMS providers who tended the
patients. The high occupational death rate for EMS helicopter crews and the need for
protection of these high-risk workers stimulated the following paper, which
recommended elimination of non-essential flights, among other suggestions. Not long
thereafter, Maryland EMS flights by state helicopters dropped by half.
Abstract: Study Objective: In recent years, air
transport of patients has been associated with
disproportionate increases in crashes and deaths.
We identify factors related to fatal outcome in
air medical helicopter crashes and suggest
preventive measures. Methods: This was a
retrospective study using National Transpor-
tation Safety Board records for helicopter
emergency medical services (EMS) crashes
between January 1, 1983, and April 30, 2005.
The main outcome measure was the percentage
of air medical crashes resulting in 1 or more
deaths. Results: There were 182 helicopter EMS
crashes during the 22.3-year study period; 39%
were fatal. One hundred eighty-four occupants
died: 45% of the 44 patients and 32% of the 513
crewmembers. Fifty-six percent of crashes in
darkness were fatal compared with 24% of
crashes not in darkness. Seventy-seven percent
of crashes in instrument meteorological
conditions were fatal compared with 31% in
visual conditions. Thirty-nine percent of all
deaths occurred in crashes with post-crash fires;
76% of crashes with post-crash fire were fatal
compared with 29% of other crashes.
Multivariate logistic regression revealed that
controlling for other factors, the odds of fatal
outcome was increased by post-crash fire (odds
ratio [OR] 16.1; 95% confidence interval [CI]
5.0 to 51.5], bad weather (OR 8.0; 95% CI 2.4 to
26.0), and darkness (OR 3.2; 95% CI 1.3 to 7.9).
Conclusion: Fatalities after helicopter EMS
crashes are associated especially with post-crash
fire and with crashes that occur in darkness or
bad weather and can be addressed with improved
crashworthiness and measures to reduce flights
in hazardous conditions. Further studies will be
necessary to determine which changes will
decrease the fatal crash rate and which are cost
effective.
Citation: Baker SP, Grabowski JG, Dodd RS, Shanahan DF, Lamb MW, Li G. EMS helicopter
crashes: What influences fatal outcome? Ann Emerg Med 47:351-356, 2006.
Link to Full-text: http://www.ncbi.nlm.nih.gov/pubmed/16546620
42
GRADUATED DRIVER LICENSING PROGRAMS AND
FATAL CRASHES OF 16-YEAR OLD DRIVERS:
A NATIONAL EVALUATION
LH Chen, SP Baker, and G Li
Graduated driver licensing programs are now an accepted part of the fabric of the
teen driving experience. This was far less true in 2006. Results of our study have
contributed to the adoption of and stiffening of GDL programs in many states. This
study for NHTSA was followed by one sponsored by, and in collaboration with, the
AAA Foundation. The escalation of GDL has been rewarding, but there is still too
little emphasis on protecting teens when they crash. When parents ask me for advice
about how to keep their teens safe, I astound them by encouraging them to insist that
their teens use the newest car available, because that will usually give the best
protection in a crash. It is not unusual for parents to provide youngsters with the
oldest, cheapest wheels in the family, apparently more interested in protecting their
new car than their children.
Abstract: Context: Implementation of graduated
driver licensing programs is associated with
reductions in crash rates of young drivers, but
graduated driver licensing programs vary in their
components. The impact of programs with
different components is unknown. Objective:
The purpose of this work was to determine
which graduated driver licensing programs are
associated with the greatest reductions in fatal
motor vehicle crashes involving 16-year-old
drivers. Methods: We conducted a retrospective
study of all 16-year-old drivers involved in fatal
crashes in the United States from 1994 through
2004 using data from the Fatality Analysis
Reporting System and the US Census Bureau.
We measured incidence rate ratios of fatal motor
vehicle crashes involving 16-year-old drivers
according to graduated driver licensing
programs, adjusted for state and year. Results:
Compared with state quarters with no graduated
driver licensing program components, reductions
of 16% to 21% in fatal crash involvement rates
of 16-year-old drivers occurred with programs
that included a mandatory waiting period of at
leaslt 3-months, a nighttime driving restriction,
and either at least 30 hours of supervised driving
or passenger restrictions. Reductions of 18% to
21% occurred in state quarters with programs
that included at least 5 of the 7 components
examined. Drivers aged 20 to 24 or 25 to 29
years did not experience significant reductions.
Conclusion: Comprehensive graduated driver
licensing programs are associated with
reductions of approximately 20% in 16-year-old
drivers' fatal crash involvement rates. The
greatest benefit seems to be associated with
programs that include age requirements and at
least 3 months of waiting before the intermediate
stage, nighttime driving restriction, and either 30
hours or more of supervised driving or passenger
restriction.
Citation: Chen LH, Baker SP, Li G. Graduated driver licensing programs and fatal crashes of 16-
year old drivers: A national evaluation. Pediatrics 118;56-62, 2006.
Link to Full-text: http://www.ncbi.nlm.nih.gov/pubmed/16818549
43
SHARPLESS SURGERY: A PROSPECTIVE STUDY OF
THE FEASIBILITY OF PERFORMING OPERATIONS USING
NON-SHARP TECHNIQUES IN AN URBAN,
UNIVERSITY-BASED SURGICAL PRACTICE
MA Makary, PJ Pronovost, ES Weiss, EA Millman, D Chang,
SP Baker, EE Cornwell III, D Syin, and JA Freischlag
Steve Teret and I had long argued that therapeutic misadventures, such as wrong-
side surgery and prescription mix-ups, should be considered with other injuries,
since the basic causes and preventive strategies are the same. Soon after taking my
summer injury epidemiology course in Minnesota, Janine Jagger attended a seminar
at the University of Virginia where needle-stick injuries were being addressed as a
behavioral problem (e.g., staff neglected to put used needles into protective boxes).
She immediately recognized that the problem was with the design of needles and
syringes and began designing devices that would protect the user. She went on to
perform groundbreaking research, develop the Health Care Worker Safety Center at
UVA, and obtain legislation requiring worker protection. When Martin Makary, a
Hopkins surgeon, came to my office one day to discuss injury prevention in the
surgical suite, I was impressed with the potential for preventing injuries to staff by
not even using needles and sharp instruments.
Abstract: Percutaneous injuries occur frequently
during surgical procedures and represent a
significant occupational hazard to operating
room personnel. Objectives: To evaluate the
feasibility of performing select general surgical
procedures using a combination of non-sharp
devices and techniques to replace the
conventional use of scalpels and needles.
Design, Setting, and Participants: Candidate
procedures for which sharpless techniques could
replace conventional scalpels and suture needles
were identified preoperatively. Non-sharp
techniques included monomeric 2-octyl
cyanoacrylate adhesive, electrocautery, tissue
stapler, and minimally invasive instrumentation.
Main Outcome Measures: We rated the
feasibility of performing specific procedures
without sharps. We also documented the rate of
overall reversion to sharps during operations on
patients that had been identified preoperatively
as candidates for sharpless surgery. Results: Of
358 procedures, 91 were identified preop-
eratively as appropriate for sharpless surgery. Of
these, 87% (79/91) were completed without the
use of sharps, including 13/22 (59%) open
laparotomy procedures, 20/22 (91%) laparo-
scopic procedures, and 46/47 (98%) soft tissue
procedures. Conclusions: Select common pro-
cedures can be performed entirely with sharpless
techniques, eliminating the risk to surgical
personnel associated with intraoperative
percutaneous injuries.
Citation: Makary MA, Pronovost PJ, Weiss ES, Millman EA, Chang D, Baker SP, Cornwell EE 3rd,
Syin D, Freischlag JA. Sharpless surgery: a prospective study of the feasibility of performing
operations using non-sharp techniques in an urban, university-based surgical practice. World J Surg.
2006 Jul;30(7):1224-9.
Link to Full-text: http://www.ncbi.nlm.nih.gov/pubmed/16773253
44
CRASHES OF SIGHTSEEING HELICOPTER TOURS IN HAWAII
WI Haaland, DF Shanahan, SP Baker
News of a crash of a sightseeing helicopter flight in Hawaii caught Margaret Lamb‘s
attention. She was aware of a number of such helicopter crashes there, and she had
seen a terrifying video taken on an air tour as a chopper skimmed low over Hawaii‘s
scenic terrain. My appetite was whetted for doing this research, but never did I wish
to take such a flight. Then Wren Haaland, a Hopkins undergrad, sent me an email
out of the blue, wondering if I had a research position available. In addition to her
world- championship in jumping rope, she turned out to be an enthusiastic and
productive researcher, ferreting out the details for this paper.
Abstract: Introduction: Crashes of sightseeing
helicopter flights in Hawaii and the resulting
tourist deaths prompted the FAA to issue
regulations in 1994 specific to air tours in
Hawaii. Research was undertaken to examine the
effect of the 1994 Rule and to describe the
circumstances of such crashes. Method: From
National Transportation Safety Board data, 59
crashes of helicopter air tour flights in Hawaii
during 1981-2008 were identified; crash
investigation reports were read and coded.
Crashes in 1995-2008 were compared with those
in 1981-1994. Results: The 1994 Rule was
followed by a 47% decrease in the crash rate,
from 3.4 to 1.8/100,000 flight hours. The number
of crashes into the ocean decreased from eight
before the Rule to one afterwards. VFR-IMC
crashes increased from 5 to 32% of crashes.
There were 46 tourists and 9 pilots who died in
16 fatal crashes. Aircraft malfunctions, primarily
due to poor maintenance, precipitated 34 (58%)
of the crashes and persisted throughout the 28-yr
period. Pilot errors were apparent in 23 crashes
(39%). Flight from visual to instrument
conditions occurred in two cases before the Rule
and seven cases after. Terrain unsuitable for
landing was cited in 37 crashes (63%).
Conclusion: Decreases occurred in the overall
number and rate of crashes and in ocean crash
landings. The increase in VFR-IMC crashes may
be related to the requirement that tour helicopters
fly at least 1500 ft. above terrain. Attention is
still needed to maintenance, pilot training, and
restricting flights to operating areas and
conditions that enable safe emergency landings.
Citation: Haaland WI, Shanahan DF, Baker SP. Crashes of sightseeing helicopter tours in Hawaii.
Aviat Space Environ Med 80:637-642, 2009.
Link to Full-text: http://www.ncbi.nlm.nih.gov/pubmed/19601506
45
PREVENTING INJURIES BY UNDERSTANDING ENERGY DAMAGE
CW Runyan and SP Baker
It has always been fun to partner with Carol Runyan, whom I met when she was an
injury epidemiology student in Minnesota. At that time she impressed me with her
ability to conduct meaningful research using a single dime at a phone booth. Later
she came to Hopkins as a postdoctoral fellow. She went on to lead one of the nation‘s
most productive injury centers, at the University of North Carolina, Chapel Hill.
Later Hopkins honored her by inducting her into the Society of Scholars. We both
revered Bill Haddon, as is clear from the following article.
Abstract: It is more than 35 years since William
Haddon, as president of the Insurance Institute
for Highway Safety in Washington, DC,
published his now classic paper, ―Energy
damage and the ten countermeasure strategies‖,
in the Journal of Trauma. This paper further
developed ideas from his article published three
years earlier in the American Journal of Public
Health, ―On the escape of tigers: an ecologic
note.‖ Both papers have withstood the test of
more than 35 years as critical conceptual pieces
in the field of injury control. In them, Haddon
presents a conceptual framework that is not
limited as a tool for injury prevention, but can be
used successfully as a way to identify preventive
interventions for almost any public health
problem. In his classic paper, Haddon addressed
the notion that injury occurs through the transfer
of energy, of which there are several types:
kinetic, thermal, chemical, electrical and
ionizing radiation – and that damage to the body
results when energy is transferred in quantities or
at rates that the body cannot withstand. He
presents his analysis of how injuries occur in
parallel to the way the medical world has come
to understand the infectious process: through the
transfer of infectious agents to the human host.
Haddon stressed that this allows for a more
systematic approach to prevention through the
development of countermeasures that address
one or more elements of the injury process. We
encourage careful reading of this classic paper
and the use of Haddon‘s strategies in the
development of approaches to injury and
violence prevention worldwide. Resources are
too scarce and the lost lives too precious and
numerous for us to develop interventions without
the benefit of clear thinking of the type
Haddon‘s models stimulate. As we work to
create a trained cadre of professionals
responsible for the practice of injury control,
these concepts are central – much like teaching
Koch‘s postulates to bacteriologists or Newton‘s
laws of physics to engineers.
Citation: Runyan CW, Baker SP. Preventing injuries by understanding energy damage. Bull World
Health Organ. 2009 May;87(5):402-3.
Link to Full-Text: http://www.ncbi.nlm.nih.gov/pubmed/19551259
46
ALCOHOL IN FATAL CRASHES INVOLVING MEXICAN AND
CANADIAN DRIVERS IN THE UNITED STATES
SP Baker, JE Brady, GW Rebok, G Li
Controversy over allowing Mexican trucks into the US initially led me to investigate
differences between Mexican- and US-licensed truck drivers with regard to
characteristics of their crashes and, in particular, the extent to which alcohol was
involved. It turned out alcohol was rarely found in the crash-involved drivers of big
trucks—only about 2% of either Mexican or US drivers. Because there were huge
differences among countries in the proportion of vehicles that were large trucks
(about half of the Canadian vehicles that crashed in the US were big trucks
compared to a small percentage of US and Mexican trucks), we excluded the large
trucks from further analysis. To our surprise, differences between Mexican and US
drivers were generally minor, and were non-existent with respect to alcohol. The
Canadian drivers, in contrast, provided the major findings. Joanne Brady‘s hard
work on myriad analyses made possible this and many of our aviation papers
Abstract: Objective: To determine the
prevalence of alcohol involvement and
impairment in fatal crashes in the USA involving
Mexican and Canadian drivers. Methods:
Drivers in fatal crashes in the USA were
identified during 1998 to 2008 from the Fatality
Analysis Reporting System, and the prevalence
of alcohol involvement and impairment (defined
as blood alcohol concentrations ≥0.01 g/dl and
≥0.08 g/dl, respectively) was compared among
drivers licensed in Mexico (n=687), Canada
(n=598), and the USA (n=561,908). Results: The
prevalence of alcohol involvement was 27% for
US drivers, 27% for Mexican drivers, and 11%
for Canadian drivers. Alcohol impairment was
found in 23% of US drivers, 23% of Mexican
drivers, and 8% of Canadian drivers. With
adjustment for driver demographic
characteristics and survival status and for crash
circumstances, the prevalence of alcohol
involvement was significantly lower for
Canadian drivers (adjusted prevalence ratio (PR)
0.63, 95% CI 0.49 to 0.80) than for US drivers,
and was similar between Mexican and US
drivers (adjusted PR 0.91, 95% CI 0.81 to 1.02).
Conclusions: Alcohol involvement in fatal motor
vehicle crashes in the USA is similarly prevalent
in US and Mexican drivers, but is substantially
less common in Canadian drivers.
Citation: Baker SP, Brady J, Rebok GW, Li G. Alcohol in Fatal Crashes Involving Mexican and
Canadian Drivers in the United States. Inj Prev. 2011 Oct;17(5):304-8. Epub 2011 Mar 10.
Link to Full-text: http://www.ncbi.nlm.nih.gov/pubmed/21393413
47
INJURY STATISTICS, HIGH RISK GROUPS, AND INDIVIDUALS:
FALLING THROUGH THE CRACKS
SP Baker
―Falling through the cracks‖ aptly describes the injury problems that have attracted
me. Whether rare, as in the case of hot dog choking, or common, as with recreational
injuries in the military, my attention has been drawn to injuries that few people were
thinking about. Therefore this title of a talk I gave when Columbia School of Public
Health honored me, in my 80th year, with the Frank Calderone Prize. It was fun to
look back over a 40-plus-year career to find the common threads. Pulling them
brought memories of colleagues and the research, advocacy, challenges, and
rewards that we shared.
Abstract: The Frank A Calderone Prize in
Public Health, the pre-eminent award in the
field, is overseen by Columbia University's
Mailman School of Public Health and presented
to someone who has made ―a transformational
contribution in the field of public health.‖ The
Prize recognizes an individual who has achieved
extraordinary distinction in public health and/or
who has made a specific contribution which has
had long-term national or global implications.
On 6 May 2010, the prize was awarded to Susan
Baker. This is the first time the Prize has been
bestowed upon an injury control researcher.
Citation: Baker SP. Injury statistics, high risk groups, and individuals: Falling through the cracks.
Injury Prevention. 16(5):290-2, 2010. Epub 2010 Aug 30.
Link to Full-text: http://www.ncbi.nlm.nih.gov/pubmed/20805617
48
COMPARING ROAD TRAFFIC MORTALITY RATES
FROM POLICE-REPORTED DATA AND
DEATH REGISTRATION DATA IN CHINA
G Hu, SP Baker, and TD Baker
Forty years ago, in Rio de Janeiro, I found four times as many pedestrian deaths in
the records of the Instituto Medical Legal as police had reported. That kind of
discrepancy is still evident in many countries. In China, statistics on road deaths are
compiled by the police. But China also has a health data system built on a sample of
health departments, considered to be representative of the country. I had been told
the police kept two sets of data—one reflecting what really happened, the other,
typically supportive of government policy. Fortunately, Guoqing Hu was able to
access the health data and documented the discrepancy described in our paper.
Abstract: Objective: To compare death rates
from road traffic injuries in China in 2002-2007
when derived from police-reported data versus
death registration data. Methods: In China,
police-recorded data are obtained from police
records by means of a standardized, closed-
ended data collection form; these data are
published in the China statistical yearbook of
communication and transportation. Official death
registration data, on the other hand, are obtained
from death certificates completed by physicians
and are published in the China health statistics
yearbook. We searched both sources for data on
road traffic deaths in 2002-2007, used the χ(2)
test to compare the mortality rates obtained, and
performed linear regression to look for
statistically significant trends in road traffic
mortality over the period. Findings: For 2002-
2007, the rate of death from road traffic injuries
based on death registration data was about twice
as high as the rate reported by the police. Linear
regression showed a significant decrease of 27%
(95% confidence interval, CI: 35-19) in the death
rate over the period according to police sources
but no significant change according to death
registration data. Conclusion: The widely-cited
recent drop in road traffic mortality in China,
based on police-reported data, may not reflect a
genuine decrease. The quality of the data
obtained from police reports, which drives
decision-making by the Government of China
and international organizations, needs to be
investigated, monitored and improved.
Citation: Hu G, Baker SP, Baker, TD. Comparing road traffic mortality rates from police-reported
data and death registration data in China. Bulletin of the World Health Organization. 89;41-45, 2011.
Link to Full-text: http://www.ncbi.nlm.nih.gov/pubmed/21346889
49
TRAUMA IN THE RUSSIAN FEDERATION: THEN AND NOW
TD Baker, SP Baker, and S Haack
My husband Tim (Professor of International Health) and I have worked together on
many papers, but this one was unique because it began as a presentation by the two
of us for the Western Trauma Association at Steamboat Springs. A few years later,
when Sara Haack, a med student, was getting her MPH, she joined us and carried
the ball all the way to publication. Like a number of our papers, it was triggered by
recognition of a dramatic shift in injury mortality rates.
Abstract: Background: Russia has made
substantial, largely unrecognized contributions to
the field of trauma. These include the early
development of triage, improvement of blood
transfusions and blood bank networks, and
Mobile Emergency Medical Services. Despite
these advances, injury fatality rates in Russia are
alarmingly high (∼50% higher than other
Eastern European countries). They fluctuated
dramatically during 1980 to 2006, a period that
included the dissolution of the Union of Soviet
Socialist Republics. Suggested causes, including
inaccurate data, alcohol use, and economic
hardship, are investigated in this article.
Methods: Injury mortality rates for homicide,
suicide, accidental poisoning, and total injuries
(source: World Health Organization), alcohol
consumption (source: World Health Organi-
zation), and economic data (source: United
Nations Economic Commission for Europe) for
the Russian Federation from 1980 to 2006 were
examined and compared with the Baltic States,
Central Asian Republics, other Eastern European
nations, and the United States. Results: Injury
mortality rates declined in Russia from 1980 to
1987. The total injury mortality rate more than
doubled between 1987 and 1994, followed by a
40% decline from 1994 to 1998. The 1984 to
1994 mortality rates generally parallel alcohol
consumption trends. The 1991 to 1994 climb
coincides with the dissolution of the Union of
Soviet Socialist Republics. A smaller rise in
fatality rates occurred in the early 2000s.
Conclusions: Deaths caused by injuries in the
Russian Federation are related to multiple
factors. Some authors conclude that the data
accurately reflect injury mortality. Financial
concerns during these times may have led to
riskier behaviors resulting in more deaths from
injuries. Heavy alcohol consumption also likely
contributes to high injury mortality rates.
Excessive injury mortality calls for action by
Russian policy makers.
Citation: Baker TD, Baker SP, Haack SA. Trauma in the Russian Federation: then and now. J
Trauma. 2011 Apr;70(4):991-5.
Link to Full-text: http://www.ncbi.nlm.nih.gov/pubmed/21610401
50
HELICOPTER CRASHES RELATED TO
OIL AND GAS OPERATIONS IN THE GULF OF MEXICO
SP Baker, DF Shanahan, WI Haaland, JE Brady, G Li
The disastrous oil spill in the Gulf of Mexico in 2010 claimed 11 lives and resulted in
well-deserved media attention. During the 27 years encompassed by the following
study, an average of 5 deaths occurred each year, with many opportunities for
intervention but little press attention; this illustrates the fact that deaths that occur
one or two at a time receive little attention. The terrorist attacks on September 11,
2001 claimed about 3000 lives, but that is fewer than the number of deaths on US
highways every month, year in and year out. Injury researchers must find ways to
win attention to the great majority of deaths and injuries that occur one at a time.
Abstract: Introduction: The hazards inherent in
flight operations in the Gulf of Mexico prompted
investigation of the number and circumstances of
crashes related to oil and gas operations in the
region. Methods: The National Transportation
Safety Board (NTSB) database was queried for
helicopter crashes during 1983 through 2009
related to Gulf of Mexico oil or gas production.
The crashes were identified based on word
searches confirmed by a narrative statement
indicating that the flight was related to oil or gas
operations. Results: During 1983-2009, the
NTSB recorded a total of 178 helicopter crashes
related to oil and gas operations in the Gulf of
Mexico, with an average of 6.6 crashes per year
(5.6 annually during 1983-1999 vs. 8.2 during
2000-2009). The crashes resulted in a total of
139 fatalities, including 41 pilots. Mechanical
failure was the most common precipitating
factor, accounting for 68 crashes (38%). Bad
weather led to 29 crashes (16%), in which 40%
of the 139 deaths occurred. Pilot error was cited
by the NTSB in 83 crashes (47%). After crashes
or emergency landings on water, 15 helicopters
sank when flotation devices were not activated
automatically or by the pilots. Discussion:
Mechanical failure, non-activation of flotation,
and pilot error are major problems to be
addressed if crashes and deaths in this lethal
environment are to be reduced.
Citation: Baker SP, Shanahan DF, Haaland WI, Brady JE, Li G. Helicopter crashes related to oil and
gas operations in the Gulf of Mexico. Aviat Space Environ Med. 2011 Sep;82(9):885-9.
Link to Full-text: http://www.ncbi.nlm.nih.gov/pubmed/21888272
51
TRUCK DESIGN TESTIMONY Statement of Susan P. Baker, MPH
Public Meeting on Heavy Truck Safety
Sponsored by the National Highway Traffic Safety Administration
U.S. Department of Transportation
September 10, 1979
For many people, truck safety means being safe from big trucks, since in collisions
the occupants of smaller vehicles fare less well than the truck drivers. But I have also
been concerned about the safety of truck drivers, who have a very high rate of on-
the-job injury and death. During the following testimony I brandished the steering
wheel from an 18-wheeler, to make my point that its edge would focus crash forces
on the driver‘s abdomen.
At one time my research showed that some truck drivers in fatal crashes (albeit a
small percentage) were intoxicated, and perhaps it was this that prompted someone
in the trucking industry to hire a researcher to try to discredit my research.
Fortunately, he was unsuccessful. He told me about it, so I got a good story.
Miss Claybrook, members of the panel:
I am Susan P. Baker, Associate Professor at the Johns Hopkins School of Public Health, and a former
member of the Truck and Bus Subcommittee of the National Highway Safety Advisory Committee.
During the past few hours, 200 heavy truck cabs have rolled off the assembly lines. Chances are that
one of those 200 cabs will eventually be stained with the blood of a dead occupant. Many more will
inflict non-fatal injuries on their drivers.
We‘ve heard a lot about how hard it can be to squeeze in behind the wheel of some of today‘s trucks.
But whether it‘s a tight squeeze or a comfortable space between the driver and the steering wheel,
think what it would be like to hit the rim of that wheel with your belly at 55 mph.1
I‘ve never done it, but I‘ve seen the results, because my office is in the Baltimore City morgue.
That‘s where a truck driver is likely to be autopsied if he is killed near Baltimore. What do the
autopsies show? In particular, a lot more injuries to the abdominal organs than we see in other dead
drivers. Half of the fatally injured drivers of heavy trucks have serious abdominal injuries. Not just
one abdominal injury, but 3 or 4 different organs injured in a single driver. We see lots of ruptured
livers and spleens. We see ruptured diaphragms, which are rare in other drivers, and torn blood
vessels. In addition, three-quarters have fractured ribs and many have lethal injuries of the lungs,
aorta, or heart.
I‘ve never heard of crash tests in which a heavy truck with an 85th percentile truck driver dummy was
subjected to a 35 mph barrier crash. In my mind‘s eye, though, it‘s too easy to see the abdomen
hitting the rim of the wheel, the driver jackknifing over the wheel, his chest hitting the top of the
steering column.
1 As I spoke those words, I brandished a Volvo truck steering wheel.
52
Isn‘t it time we did some crash testing with trucks and dummies, rather than with drivers themselves?
And isn‘t it time that trucks were designed with the assumption that they‘ll be in crashes at or near
their maximum operating speeds? Unfortunately it‘s a reasonable assumption, and I think it carries an
obligation to provide automatic, built-in protection for these high risk workers when they are in a
crash.
I‘d like to challenge the truck manufacturers and designers—with input from owners and drivers—to
come up with something better than today‘s steering wheel, to turn it into something that protects
drivers in a crash rather than killing them.
I‘ve seen films of a tank truck, built to protect hazardous cargo, hitting a barrier at high speed. The
tank came through intact. The cab was a mess, to put it mildly, having served as an energy-
attenuating device to protect the cargo.
It‘s time now to give as much thought to protecting drivers as we‘ve given to protecting cargo. I‘ve
emphasized the steering wheel because that‘s the first thing the driver hits in a life-threatening frontal
collision. But attention must be given to the entire cab, until we no longer can look at 200 new trucks
with the realization that someone is going to die in one of them.
53
AIRBAG TESTIMONY
Statement of Susan P. Baker, MPH
on behalf of the American Public Health Association
at a Public Hearing on FMVSS 208, Passive Restraints
December 5, 1983
Year after year, Congress went back and forth over the passive restraint standard,
depending upon which political party was in power. After one hearing I asked Bill
Haddon, ―Do you think we will ever get airbags in cars?‖ ―Sue,‖ he replied, ―go
read the history of the battle over milk pasteurization.‖ I did so, and was amazed to
learn of the decades of delay – after we knew that thousands of people were being
sickened despite the availability and known benefits of life-saving pasteurization. It
gave me hope that eventually we would have airbags.
I am Susan Baker, an associate professor at The Johns Hopkins School of Hygiene and Public
Health and an epidemiologist specializing in injury prevention. I am here today to speak on behalf of
the American Public Health Association and its membership of 50,000 health professionals.
We are deeply concerned about the continued delay in implementing the passive restraint
standard. Today, motor vehicle crashes are the number one cause of death in this country from age 1
to age 34. This means that for almost half of the average life span, we are more likely to die on the
highway than from cancer or homicide or any other cause. The largest category of people killed by
motor vehicles are passenger car occupants in frontal and semi-frontal crashes.
The technology to protect them has long been available. Yet for more than a decade, the
Department of Transportation has repeatedly delayed its passive restraint standard that would require
cars to automatically protect occupants in frontal crashes at moderate speeds. Seven years ago
tomorrow, Secretary of Transportation William Coleman completed an extensive review of testimony
and data on passive restraints. He concluded that ―Air bags have gone through more laboratory
engineering analysis and testing than any other item of equipment required by Federal motor vehicle
safety standards…I am convinced, after a painstaking examination of the record, that passive
restraints are technologically feasible, would provide substantially increased protection to the public
in traffic accidents, and can be produced economically.‖
On the seventh anniversary of the Coleman decision, the Department of Transportation is
again holding hearings on the future of the passive restraint standard. Since the early 1970‘s, much of
the delay in implementing the standard has hinged on the argument that seat belt use can be increased
by education, incentives, or laws to a degree that will make automatic crash protection unnecessary.
There is absolutely no basis for that supposition. In Australia, Canada, Sweden, and other countries
with ―successful‖ belt use laws, tens of thousands of motor vehicle occupants are still dying
unnecessarily. Why? Because the people who are the most likely to be in crashes are the least likely
to be wearing seatbelts. Seatbelts are used less by people driving at night, when severe crashes are
more common. They are used much less by people who have been drinking. In illustration, a roadside
54
survey in Quebec Province (where there is a seat belt law) found that only 36% of the intoxicated
drivers were wearing seat belts, compared with 54% of the sober drivers.
Similarly, belt use laws have less effect on teenagers, who have the highest death rates in
crashes. In Ontario, teenagers paid little attention to the seat belt law, although it doubled belt use by
older people.
Belt use is also rare among residents of low income areas. These people too are at especially
great risk of being killed in crashes. Recent research shows that among people who live in low
income areas of the U.S., the motor vehicle occupant death rate is almost three times the rate in areas
where income is high.
The inescapable message is that unless you are willing to condemn to death teenagers and the
poor and everyone else who doesn‘t routinely buckle up, law or no law, we must have built-in,
automatic crash protection for the many people and the many moments when belts are not used.
Most people do not realize how long that kind of protection has been feasible. Thirteen and a
half years ago, in June of 1970, I was among almost 200 people at a meeting in Washington that was
sponsored by the Insurance Institute for Highway Safety. We were privileged to see the premiere of
the Institute‘s film called ―In the Crash.‖ Portions of that movie showed dummies being gently
cushioned by airbags instead of being smashed by potentially lethal crash forces. These airbag tests,
which had been filmed a year or so earlier by Eaton, Yale, and Towne, showed us technology that
was already so well developed that within a few years, General Motors would put airbags in a fleet of
1,000 Chevrolets to be used by its own employees. Despite their excellent performance, airbags have
never been made available to the public except in luxury cars; even those were not publicized by the
manufacturer and were hard to find or to order.
It is now 14½ years since Eaton, Yale, and Towne made that film showing the life-giving
potential of airbags. Since then, close to 400,000 front seat occupants of passenger cars have been
killed. Four hundred thousand! What does such a number mean? It is common to make comparisons
with deaths from wars or diseases, but it may be easier to comprehend the number by translating it
into living men, women, and children. Four hundred thousand is two-thirds of the population of
Washington, D.C.; it‘s more than all the people in Newark or Minneapolis, Portland or Honolulu.
Most of the people who died were young, and would still be alive today if they hadn‘t been killed in a
car crash.
In addition to the 400,000 who were killed during those years, about 4 million men, women,
and children were injured so severely as front seat occupants that they had to be hospitalized. That
roughly equals the population of Maryland. It‘s almost double the entire population of Kansas. If all 4
million people had been injured at the same time, there would have been 4 of them for every single
hospital bed in the United States.
As well as the pain, grief, and disability, the costs to society are enormous. Sometimes it‘s
too easy to forget that our resources are limited, that there are finite numbers of hospital beds and
ambulances and medical personnel. People who are injured tax these resources to the utmost, perhaps
most of all in the case of quadriplegics and paraplegics. Over the past 14 or 15 years, the total number
55
who have sustained irreparable damage to their spinal cords is so great that if you placed their
hospital beds head to foot they would stretch from Baltimore to Washington, D.C.
Airbags can‘t prevent every death, just as ejection seats and parachutes can‘t save every
military pilot whose plane crashes. But just like ejection seats, airbags can make huge reductions in
unnecessary deaths and injuries, and no one should be ―caught dead‖ without them.
The Department of Transportation will never address another issue that involves
sacrificing—or saving—the lives of so many citizens. Because the human losses are astronomical and
unacceptable; because automatic protection is humane, feasible, and effective; because the
technology is available but is not being applied, the Department of Transportation should end the
delays and make sure that effective crash protection is built into all cars at the earliest possible date.
Specifically, I urge the Department of Transportation to require driver-side airbags in all cars
at the earliest possible date, followed by a requirement for passive restraints on the passenger-side as
soon as possible. There would be some additional benefit of seat belt use laws, and these should be
strongly supported. But to back away from airbags—in spite of their 100% ‗usage‘ rate—in hopes of
achieving miraculously high seat belt use rates, would not be fair to the American public.
According to NHTSA‘s Preliminary Regulatory Impact Analysis for FMVSS 208 (October,
1983), even if airbags were only 30% effective, manual belts would have to be used by 60% of
people in potentially fatal crashes in order to save as many lives as airbags. According to the same
report, manual seat belts are used by about 3 percent of Americans in high-speed crashes. Nowhere in
the world, even in the countries with seat belt laws, are seatbelts used by even half of the occupants in
potentially fatal crashes.
The American Public Health Association would remind you that each year you delay, you are
sacrificing the lives of thousands of Americans. The sacrifice is unnecessary and should no longer be
tolerated.
Thank you.
56
THE INJURY FACT BOOK
Preface to the first edition, by William Haddon, Jr.
My earliest recollection of the years I labored over The Injury Fact Book was the
week I spent in our mountain cabin outlining the book in great detail. Colleagues at
the Insurance Institute for Highway Safety, especially Brian O‘Neill, contributed
generously of their time and ideas. I particularly liked the way the 50 maps turned
out – especially the dramatic map of general aviation death rates that inspired me to
become a pilot and fly in those high-risk mountain states. When finished, the book
won highest praise from Bill Haddon, so I will let him describe it.
Injuries are the leading cause of death in the United States from the first year of life to age
44. An incalculable cause of human suffering, injuries are also a major source of medical costs and
losses to the economy. Yet the subject is largely unknown territory, even to professionals concerned
with impairments to the health of the American people and ways in which the quality of life in the
United States can be improved. Only rarely do colleges or universities teach the scientific aspects of
injuries—except with respect to the treatment of the injured.
This is not because of lack of knowledge. Since about 1940, what is now termed ―injury
control‖ has evolved rapidly from the prescientific folklore that still dominates much popular
thinking about the causes, prevention, and amelioration of injuries to a mature scientific field with
sophisticated research methods, a practical theoretical base, an extensive body of empirical
knowledge, and increasing examples of the successful control of the human damage.
In these respects, injuries and their prevention are the last of the great human plagues to be
the subject of scientific inquiry and understanding. But, unlike the situation in the case of infectious,
cardiovascular, and neoplastic diseases, until the preparation of this book there has been no body of
truly competent, comprehensive information giving, so to speak, the statistical lay of the land in the
case of many kinds of injuries.
Most of the basic analyses had never even been done before the authors meticulously
performed them using a variety of governmental and other sources. Analyzed by cause, age, sex, race,
socioeconomic status, urbanization, geography, time, and other variables, the results of this book,
together with those the authors have drawn from other works, will constitute the indispensable
statistical reference on injuries for years to come. The book will also undoubtedly be the source to
which graduate students and others turn for injury research information, since the reasons for many of
the trauma distributions it documents are, as yet, only poorly understood.
Since in many respects the authors have broken entirely new ground, many of the results they
report will surprise, and in some cases shock, even specialists in the field. For example:
Death rates from drowning are higher at ages one and two than at any other age, and remain
high throughout the preschool period.
57
State death rates from motor vehicle crashes correlate closely with death rates in the same
states from other unintentional injuries.
The death rate per freight ton-mile varies a thousand-fold, depending on the transportation
mode employed. The lowest death rates are for freight moved by pipeline and maritime
transport, the highest for freight moved by highway.
Firearm suicide rates decrease and non-firearm suicide rates increase with increased
socioeconomic status.
Per capita, Asians have by far the lowest motor vehicle death rates; Native Americans have
by far the highest.
During World War II, more than 20,000 U.S. military personnel died in plane crashes in the
continental United States.
With only four known exceptions, all male injury death rates greatly exceed those of females.
The exceptions are deaths from falls on the same level (the rates for which are about equal),
deaths from barbiturates and psychotherapeutic drugs, and deaths from strangulation, which
show marked female excesses compared to males.
Although it was not the authors‘ intent to discuss injury theory, research, or prevention, their
statistics are laced with incisive comments about the wide variations in incidence, explanations of
many of the findings, and references to relevant work. In the process, they have also documented the
substantial success of several injury control efforts.
An example is provided by childhood poisonings: ―Since 1960, poisoning deaths among
children younger than 5 years have decreased dramatically. The rate for poisoning by solids and
liquids was 2.2 per 100,00 in 1960 and 0.5 in 1980…Between 1960 and 1980, the number of deaths
from lead poisoning dropped from 78 to 2. Deaths from kerosene and other petroleum products
dropped from 48 to 9, while those from aspirin dropped from 144 to 12…An especially steep decline
in childhood poisoning death rates occurred after childproof packaging was required on all drugs and
medications beginning in 1973. The 50 percent decrease in poisoning by all drugs and medications in
the first three years (1973-1976) was substantially greater than the decrease in poisonings by other
solids and liquids, most of which were not required to be packaged in childproof containers…During
1968-1979, the period analyzed for most causes of death in this book, the 80 percent decline in
poisoning death rates for children ages 1-4 exceeded that for any other major cause of childhood
injury death.‖
In 1930, 348 people died in elevator failures. With improved elevator designs and
government regulations and inspections, such deaths, despite huge increases in elevator use, have
become so rare that they are no longer recorded separately in the nation‘s vital statistics.
The dramatic change in injury deaths, whether inadvertent or deliberate, that can result from
correcting an environmental hazard is also illustrated by what happened when coal gas (which had a
higher carbon monoxide content) was replaced by natural gas. In 1947, domestic piped gas caused
about 1,000 unintentional deaths and was the agent in some 1,200 suicides. In 1980, after the change
58
to natural gas, the corresponding totals were only 61 and 23 deaths, a decrease of more than 90
percent.
Despite such examples, the injury picture presented in this book is generally grim. It
resembles the situation in the history of infectious diseases before the sanitary revolution and
subsequent preventive and therapeutic measures. In contrast, the magnitude and characteristics of the
injury problem documented in this book make it clear that the country and the relevant professions
have a huge amount of catching up to do to bring injury control to the level of success already
achieved with the infectious diseases and the level being approached with respect to malignancies and
afflictions of the cardiovascular system. The data in the book are a baseline against which that
objective will long be measured. Thorough familiarity with this book will long be necessary for
professional literacy in the fields with which it deals and in those to which it relates. In addition, the
data and commentary this book provides will long be invaluable resources for insurers, public health
workers, and, in fact, for everyone concerned with the occurrence, reduction, and cost of injuries of
all kinds.
William Haddon, Jr., M.D.
First edition: SP Baker, B O‘Neill, RS Karpf. Lexington MA, Lexington Press, 1984.
Second edition: SP Baker, B O‘Neill, MJ Ginsburg, G Li. New York, Oxford University Press, 1992.
59
ACRONYMS
AAAM Association for the Advancement of Automotive Medicine
AJPH American Journal of Public Health
APHA American Public Health Association
ASMA Aerospace Medical Association
ER emergency room
GDL Graduated Driver Licensing
IIHS Insurance Institute for Highway Safety
ISS Injury Severity Score
ME Medical Examiner
MPH Master of Public Health
NHTSA National Highway Traffic Safety Administration
NISS New Injury Severity Score
NTSB National Transportation Safety Board
OSHA Occupational Safety and Health Administration

60
INDEX OF AUTHORS
A
Abbey, H _____________________________________ 25
Aboutanos, MB ________________________________ 32
B
Baker, TD _________________________________ 48, 49
Biermann, PJ __________________________________ 39
Brady, JE __________________________________ 46, 50
Braver, ER ____________________________________ 36
C
Chang, D _____________________________________ 43
Chen, LH ____________________________ 36, 39, 40, 42
Cornwell III, EE _______________________________ 43
D
Dietz, PE ______________________________________ 8
Dodd, RS _____________________________________ 41
Doll, ET ______________________________________ 25
F
Fisher, RS _______________________________ 6, 15, 19
Freischlag, JA _________________________________ 43
G
German, PS ___________________________________ 22
Gertner Jr., HR__________________________________ 5
Gielen, AC ____________________________________ 35
Grabowski, JG ___________________________ 37, 38, 41
H
Haack, S ______________________________________ 50
Haaland, WI ________________________________ 44, 50
Haddon Jr., W _______________________________ 7, 56
Hanger, L _____________________________________ 22
Hargarten, S ___________________________________ 23
Hayden, MS ___________________________________ 40
Hu, G ________________________________________ 48
J
Johnson, JV ___________________________________ 34
K
Karlson, TA ___________________________________ 12
Karwacki Jr., JJ ________________________________ 13
Krentz, MJ ____________________________________ 30
L
Lamb, MW __________________________ 26, 27, 37, 41
Levenson, S ___________________________________ 25
Li, G _ 27, 28, 29, 30, 34, 35, 36, 37, 38, 41, 42, 46, 50, 58
Liang, K _____________________________________ 34
Lincoln, JM ___________________________________ 39
Long, WB __________________________________ 7, 33
M
MacKenzie, EJ ________________________________ 35
Mair, JS ______________________________________ 39
Makary, MA __________________________________ 43
Marchone, M __________________________________ 22
Masemore, WC _________________________________ 6
McCarthy, ML ________________________________ 38
McLoughlin, E ________________________________ 22
Mierley, MC __________________________________ 20
Millman, EA __________________________________ 43
Morton, BF ___________________________________ 12
Myers, AH _________________________________ 25, 34
O
Ogaitis, S _____________________________________ 35
O'Neill, B __________________________________ 7, 58
Osler, T ______________________________________ 33
P
Pronovost, PJ __________________________________ 43

61
Q
Qiang, Y _____________________________________ 38
R
Rebok, GW ________________________________ 37, 38
Reid, R _______________________________________ 21
Robertson, LS ________________________________ 4, 9
Robinson, EG _________________________________ 25
Runyan, CW __________________________________ 45
Rutherford, RB _________________________________ 5
S
Samkoff, JS ________________________________ 18, 19
Schwarz, DF __________________________________ 31
Shanahan, DF ________________________ 40, 41, 44, 50
Simpson, SG __________________________________ 21
Smith, G ______________________________________ 34
Sopher, IM _____________________________________ 6
Spitz, WU _______________________________ 2, 3, 4, 5
Syin, D ______________________________________ 43
T
Teret, SP __________________________________ 16, 21
Trinkoff, A ___________________________________ 24
V
VanBuren, CB _________________________________ 19
Vernick, JS ___________________________________ 35
W
Warner, M ____________________________________ 27
Weiss, ES ____________________________________ 43
Wiker, S _____________________________________ 34
Winston, FK __________________________________ 31

62
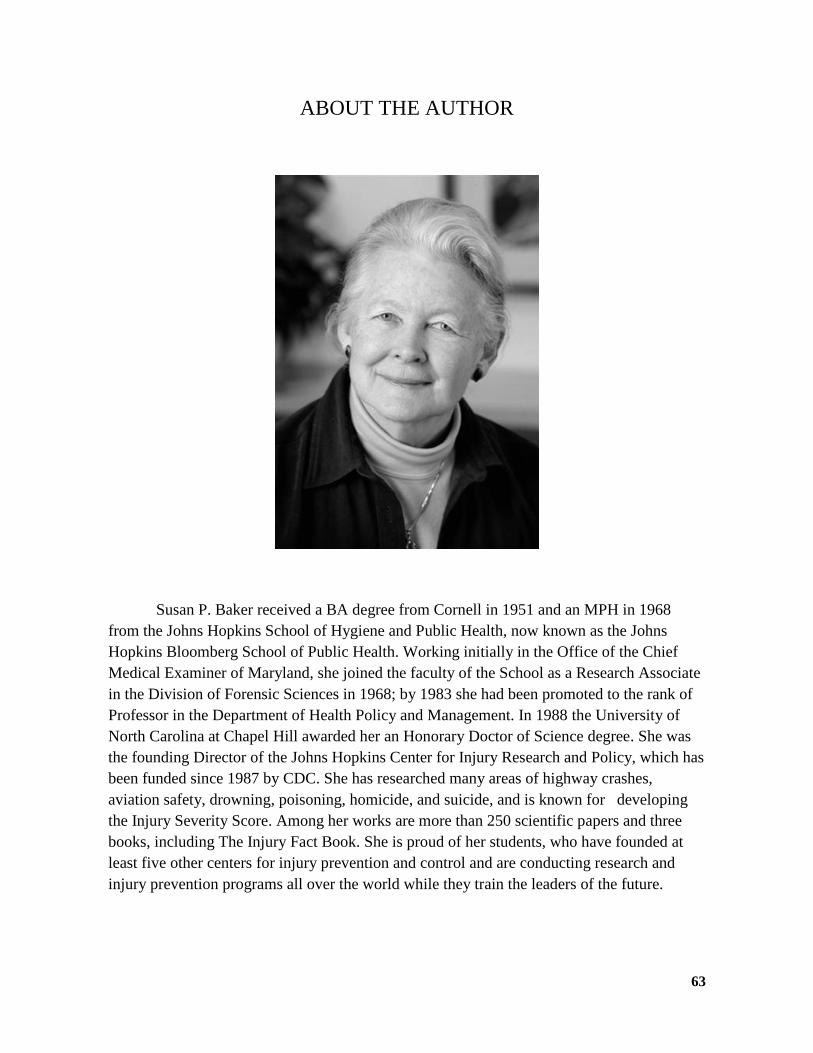
63
ABOUT THE AUTHOR
Susan P. Baker received a BA degree from Cornell in 1951 and an MPH in 1968
from the Johns Hopkins School of Hygiene and Public Health, now known as the Johns
Hopkins Bloomberg School of Public Health. Working initially in the Office of the Chief
Medical Examiner of Maryland, she joined the faculty of the School as a Research Associate
in the Division of Forensic Sciences in 1968; by 1983 she had been promoted to the rank of
Professor in the Department of Health Policy and Management. In 1988 the University of
North Carolina at Chapel Hill awarded her an Honorary Doctor of Science degree. She was
the founding Director of the Johns Hopkins Center for Injury Research and Policy, which has
been funded since 1987 by CDC. She has researched many areas of highway crashes,
aviation safety, drowning, poisoning, homicide, and suicide, and is known for developing
the Injury Severity Score. Among her works are more than 250 scientific papers and three
books, including The Injury Fact Book. She is proud of her students, who have founded at
least five other centers for injury prevention and control and are conducting research and
injury prevention programs all over the world while they train the leaders of the future.

Johns Hopkins Center for Injury Research and Policy
Hampton House, 5th floor · 624 North Broadway · Baltimore, MD 21205-1996 · 410 955 2221
www.jhsph.edu/InjuryCenter
Recommended