-LEYEL 40r
Leý RACC-TR-78-1 2ZPhase ReportMay 1978
SPEECH QUALITY MEASUREMENT
T. P. Barnwell, IIIA. M. BushR. M. MersereauR. W Schafer
Georgia Institute of Technology
(C)
LU2__i
Approved for public xeleaae, diSLIlbution unlimited.
rm-
ODO
VJUL uA -2 1~
ROME AIR DEVELOPMENT CENIER
Air Force Syserni Conrr~ond
Grtfiis$ Aur Force Baoe, Ntw York 13441
S•" 78 07 12 080
This rt;.ort has been revlcwed by the RUMG Information Office (01)
and is releasable to the National Techn~cal Information Service (NTIS).At NTIS it will be releasable to the general public, including foreign
nations.
RADC-TR-78-122 *ias been reviewed and is approved for publication.
APPROVED:
JACOB SCHERERProject Engineer
APPROVED.
JOSEPH J. NARESKYChief, Reliability & Compatibility Division
FOR THE~ COMM1ANDER:
JOHN P. IUSSActing Chief, Plans Office
If your addr:?bs has changed or 'f you wish to be remo1)ved from the RADCmailing list, or if the addre~s-ve is no longer employed by your organize-tion, please notify RADC (RBC) Griffiss AFB NY 13441. This will assistus in mrintain'ng a curre:iL maillr.g list.
Do not return this copy. Retain or destroy.
Jt
S ..."I• • . . :" '•. .. • • • • " -• • • -,.. ., ... • • " • • i •| 'i ' ..l' -" • • •• i ••

UNCLASSIFIEDSECURITY CýLASSFICATION OF THIS PAGE (Whlen Dlata EnIppectO
EPORT DOCUMENTATION PAGE URFOR COTRMPLT?40FOR"
RADC -74-1. GOVT ACCESSION NO.1. RECIP-IENT S CATALOG NUMUE
T. . CONTRACT ORf -GRANT NU-MSER(.)
A M . u s h F d 2 7 - ý 1 89. PRFV-AIMUURUNIZAION AMEAND DDRESIt. PROGRAM ELEMENT' PROJECT, TK
I4. CONTROLLING AGENCY NAME AN ADOR IES r~ il~ n rm C n~l l 0 1.) I. S C R T L S.(ttl e oe
Sae
. ,.CASSI PcATION/OOWN`GRAOING
0. 11TRU~TIO STATItM T (a this Report)
Apprved or pblicrelease; distribution unlimited.
17. OISTRISUTION STATEMENT (of the absttedf .ntd In Block 20, Itcdlff..'nt from Repo")
Same
Is, SUPPILEMENTARY NOTES_ _ _ _ l -r
~ ~~ qfvk1- ~SRADC Project Engineer: ''"'"
/Jacob Scherer ()BC) If 1 A: -,~C a'~C
19. KEY WORDS (Cotnue on, fewer&* side If necessary end identify by block rnminbe,)Speech Pitch Objective Quality Testing -Speech Digitization Quality Testing Subjective TestingIntelligibility PARM ComncbltLinear Predictive Coder Quart Acceptiability RtnVoicing DAM ~ Communications -20IASTRACT (Continue an ovevr&* side if necesara and Identify by block tnmb.,)1
Spech ualty easreent aAoAconsidered frmthreejpoints of view: subjectivetesting, objective testing, ,communicability testing. Speech quality isintterrreted Tiere in terms oft us er Icetblt. t is assumed =~~t goodIntelligibility is always presentesince otherwise a system is of uo interesthere.
C -.subjective testing is considered frorm the 'philoeophit-a- perspective of. iso-preference, relative preference, and absolute-preference, with isometricDD I JAN 73 14734 EDITION OF I NOV 65 IS OBSOLETE UNCLASSIFIED
4 y jS21U YC LAssmircAioN OPTHIS PAGE (Vi..., ata Eneved)
780712

UNCLASSIFIEDSZCUpAIV C%.AS2IpICATION OF THIS PAGC(WPhmn Vote EnIOMUJ
>Iand parametric test methodologies, with the results of' PARM and QUART as a
basis. It is felt that the beat approach for future subjective testing will
be a parametric approach using representative male and female talkers to
cover the expected range of pitch. An automated and refined version of
'Joiers Diagnostic AcceptabilltY-3;;sure (DAM) test Is an attractive option.
.ýObJective testing is considered as a possible alternative to subjective
testing. -Reputte+-hero-i-s)4 two part experimental study of the relationship
between a number of Mje'ctivr eqir- mnri qicubicct ive acceptability
measures available from the PARN e'i~~-i -~eir-J ato tesuycontrolled distortions were applied Ito sp.ei Q-fjs in order to measure
the resolving power of the candidate...WoTfctive measures on these types of
distortions. In the second part, 'the candidate objective measures were
applied to speech samples~from the same systems on which PARM tests were.
run,-and -the- statistIcail correlation between the objective and subjective
measures were studied. Objective measures examined include spectral distance
measures: several LPC based spectral distances, LPC error power ratio, and
c~epstral distance; as well as pitch comparison measures, and noise power
measures. Controlled distortions were formant bandwidth, frequency, pitch,
low-pass bandwidth, and a~Iditive noise. Correlations with subjective test
data range from '0.2 to, 0.8
In the cotmmunicability test,,,a somewhat different point of view is taken.
.Zeuser is expected to perform on the data some cognitive task which Is
measurable. The rationale~her*.)4s that the user will be better able to
perform if the quality Is high, than if his cognitive resource, assumed
fixed, is saturated due to pooror quality transmission.i\The test formatchosen for this study was a multiple digit recall test mlmilar to thatstudied at Bell Labe by Naghtani. In this format, sequences of random digitsare first recorded by trained speakers, and then these utterances areplayed through various distorting systemp. The resulting sequences arethen played to subjects whose task is to "~recall"~ the digits after a short
( - 1 second) wait. These tests prove to be rather unpleasant to take, andrequire larger numbers of subjects, but will differentiate among distortingsystems.
FUMAMOUNCEU 0JUSTIFICATION ...................
DISTRIBUTION/AVAILAIILIIY CODE
Dn. AVAIL. W.r0~L
UNCLASSIFIED
SICURITY CLASSIF'ICATION OF THIS PAOE(Whm., Data Xneta,.d)

PREFACE
This effort was conducted by the School of Electrical Engineering
under the sponsorship of the Rome Air Development Center Post-Doctoral
Program for the Defense Communications Agency. Dr. W. R. Belfield of
the Defense Communications Engineering Center was the task project
engineer and provided overall technical direction and guidance.
The RADC Post-Doctoral Program is a cooperative venture between
RADC and some sixty-five universities eligible to participate in the
program. Syracuse Uiaiversity (Department of Electrical and Computer
Engineering), Purdue University (School of Electrical Engineering),
Georgia Institute of Technology (School of Electrical Engineering), and
State University of New York at Buffalo (Department of Electrical / ,./. /
Engineering) act as prime contractor schools with other schools ,/- , ?
participating via sub-contracts with the prime schools. The U.S. /
Air Force Academy (Department of Electrical Engineering), Air Force ." -Op"/
Institute of Technology (Department of Electrical Engineering), and
the Naval Post Graduate School (Department of Electrical Engineering)
also participate in the program.
The Post-Doctoral Program provides an opportunity for faculty
at participating universities to spend up to one year full time on
exploratory development and problem-solving efforts with the post-
doctorals splitting their time between the customer location and theit
educational institutions. The program is totally customer-funded
with current projects being undertaken for Rome Air Development
Center (RADC), Space and Missile Systems Organization (SAMSO),
£
"Aeronautical Systems Division (ASD), Electronic Systems Division
(ESD), Air Force Avionics Laboratory (AFAL), Foreign Technology
Division (PrD), Air Force Weapons Laboratory (AFWL), Armament
Development and Test Center (ADmC), Air Force Communications Service
(AFCS), Aerospace Defense Command (ADC), Hq USAF, Defense Communications
Agency (DCA), Navy, Army, Aerospace Medical Division (AMD), and
Federal Aviation Administration (FAA).
Further information about the RADC Post-Doctoral Program can
be obtained from Jacob Scherer, RADC, tel. AV 587-2543, COMM (315) -
330-2543.
Ii

TABLE OF CO)NTENTS
Pate #
Foreward
Abstract ii
List of Figures ix -
List of Tables xii
I. INTRODUCTION 1
1.1 - Task History 1
1.2 - Speech DigitIzation Systems and TestingRequiremants 1
1.3 - Personnel, Procedures, and Facilities 2
1.4 - Technical Organization 2 1
1.5 - Organization of the Report 4 III. OBJECTIVE MEASURES FOR SPEECH QUALITY 5
2.1 - Introduction 5
2.2 - The Choice of Objective Measures 8
2.2.1 - The Speech Perception Process 8
2.2.2 - Specific Objective Quality Measures 11
2.2.2.1 - Spectral Distance Measures 11
2.2.2.1.1 - The L17C Spectral DistanceMeasures 13
2.2.2.1.2 - Cepstral Spectral DistanceMeasures 17
2.2.2.2 - Excitation Feature Extraction 19
2.2.2.3 - Noise.Pover Measures 21
-- iiil---l.-
I. . . - ::

2.3 - Initial Qualitative Studies and 24
Controlled Distortions
2.3.1 - Qualitative Studies 24
2.3.2 - The Controlled DistortionExperiment 37
2.3.2.1 - Bandwidth Diseortion 37
2.3.2.2 - Frequency Distortion 37
2.3.2.3 - Pitch Distortion 38
2.3.2.4 - Lcw Fass Filtec Distortion 38
2.3.2.5 - Additive White Noise DistovtiO*t 38
2.3.3 - The Experimental Results 38
2.3.3.1 - Results of the Vowel Teets 40
2.3.3.2 - Results of the Sentence Tests 49
2.4 - The PARM Correlation Study 49
2.4.1 - The PARM Data Base 58
2.4.2 - The Statistical Analysis 61
2.4.3 - The Experimental Results 67
2.5 - Summary and Areas for Future Research 71
References 73
I11. SUBJECTIVE PREDICTION OF USER PREFERENCE 76
3.1 - Introduction 76
3.2 - Subjective Testing Philosophies 77
3.3- Statistical Testing Procedures 79
3.3.1 - Distribution 80
3.3.2 - Estimation 83
iv

Page #
3.3.3 - Analysis of PAR4 Data 86
3.3.4 - Nonparametric Tests 88
3.4 - Conclusions and Recommendations 89
3.4.1 - Isometric Tests 89
3.4.2 - Tests of Features 90
3.4.3 - Implementation of Subjective Tests 91
3.4.4 - Size of the Test 91
3.4.5 - Speaker Selection 91
3.4.6 - Overall Recommendations forSubjective Tests 92
References )3
Selected Bibliography in Speech Quality Testing 94
IV. A SUBJECTIVE COMMUNICABILITY TEST 97
4.1 - iLtiroduction 97
4.2 - An Automated Speech Subjective QualityTesting Facility 99
4.3 - The Experimental Format 103
4.4 -The Data Analysis 104
4.5 - The Experimental Results 106
4.6 - Conclusions 109
APPENDIX A - SPEECH ACCEPTABILITY EVALUATION 114AT DYNASTAT: THE DIAGNOSTIC ACCEPTABILITYMEASURE (DAM)
APPENDIX B - DERIVATION OF THE PROBABILITY DENSITY 123FUNCTION FOR THE STUDENTIZED RANGESTATISTIC
APPENDIX C - MINICOMPUTER BASED DIGITAL SIGNAL 127PROCESSING LABORATORY
v

Page #
APPENDIX D - SOFTWARE SUMMARY 148
vi

LIST OF FIGURES
Page #
Chapter 1
Figure .i - The Basic System for the ResearchLaboratory 3
Chapter 2
Figure 2.1 - System to do LPC Spectrum Analysis 14
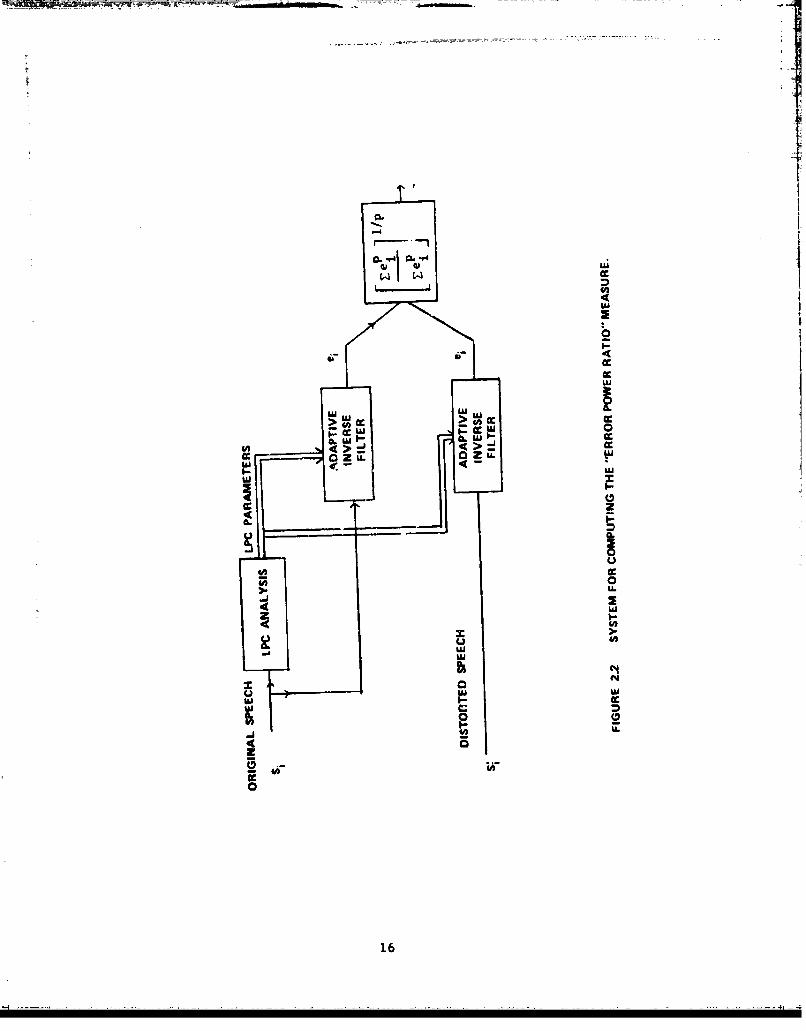
Figure 2.2 - System for Computing the "Error PowerRatio" Measure 16
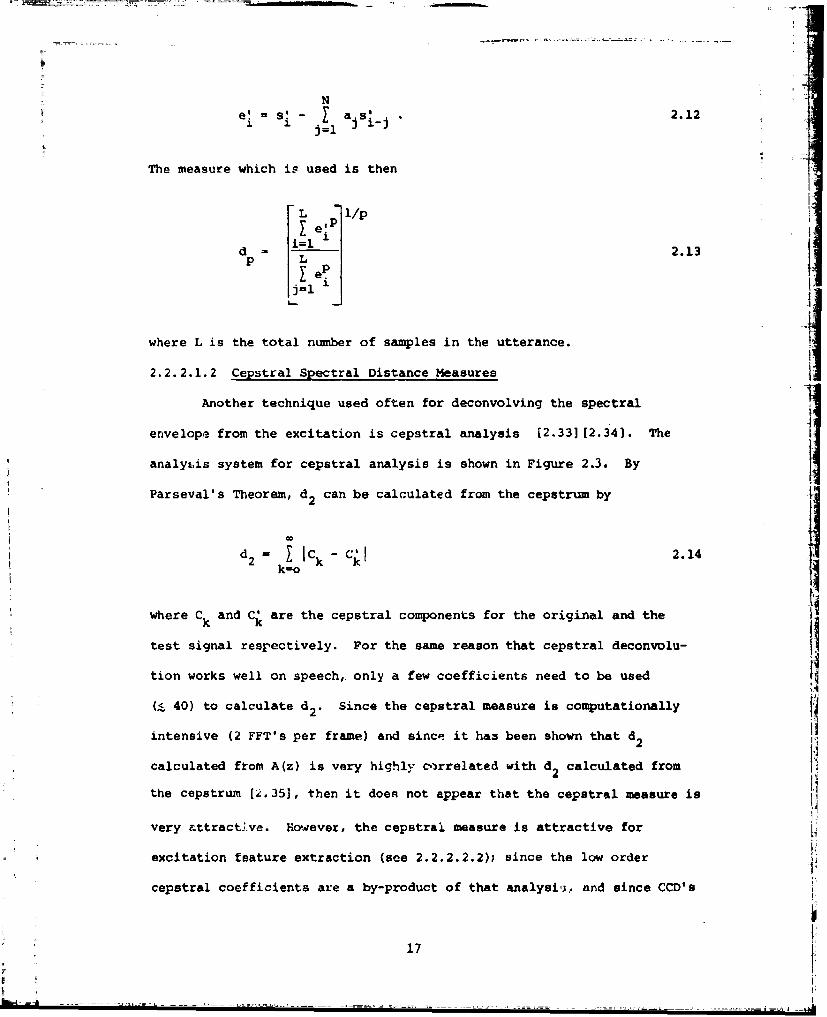
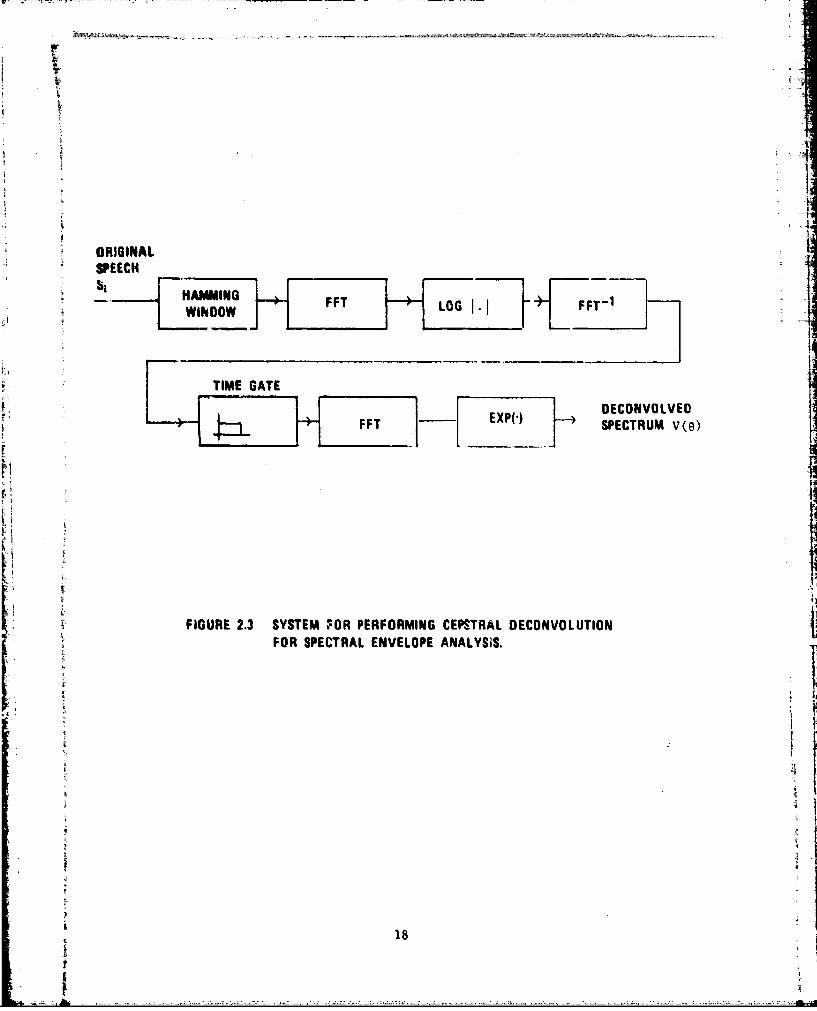
Figure 2.3 - System for Performing CepstralDeconvolution for Spectral EnvelopeAnalysis 18
Figure 2.4 - Calculation of the Cepstral
Pitch Metric 22
Figure 2.5 - LPC Spectrogram of Hianchor (LL1) 27
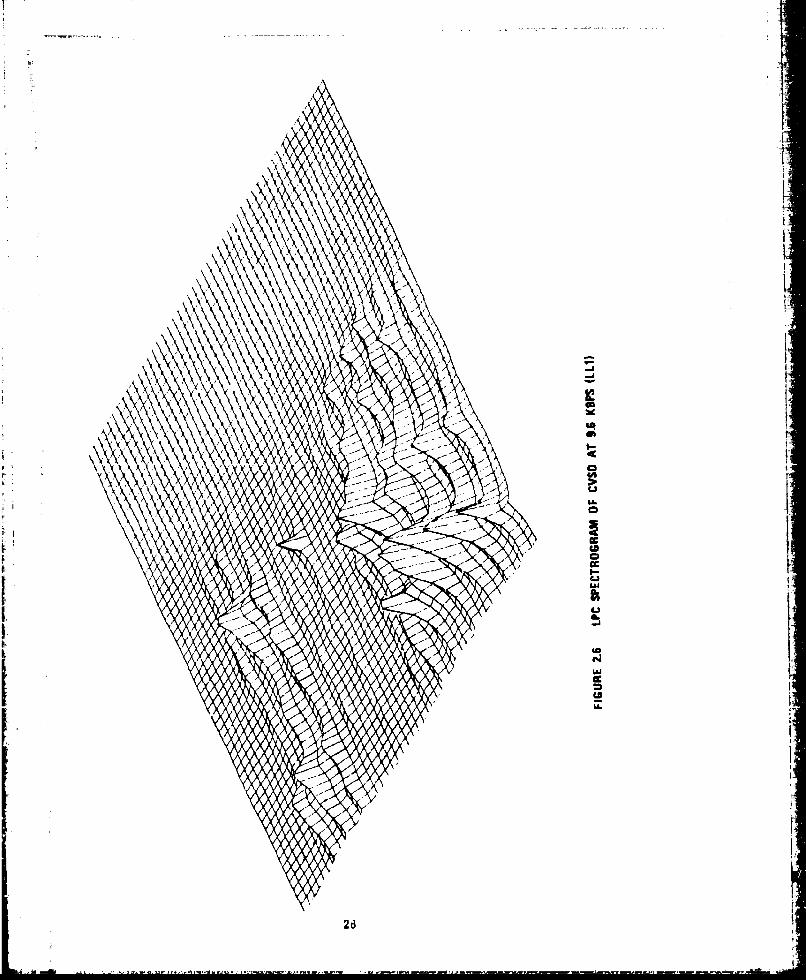
Figure 2.6 - LPC Spectrogram of CVSD at 9.6KBPS (LLl) 28
Figure 2.7 - LPC Spectrogram of CVSD at 16KBPS (LLI) 29
Figure 2.8 - Spectrogram of HY2 at 2.4 KBPS(LL1) 30
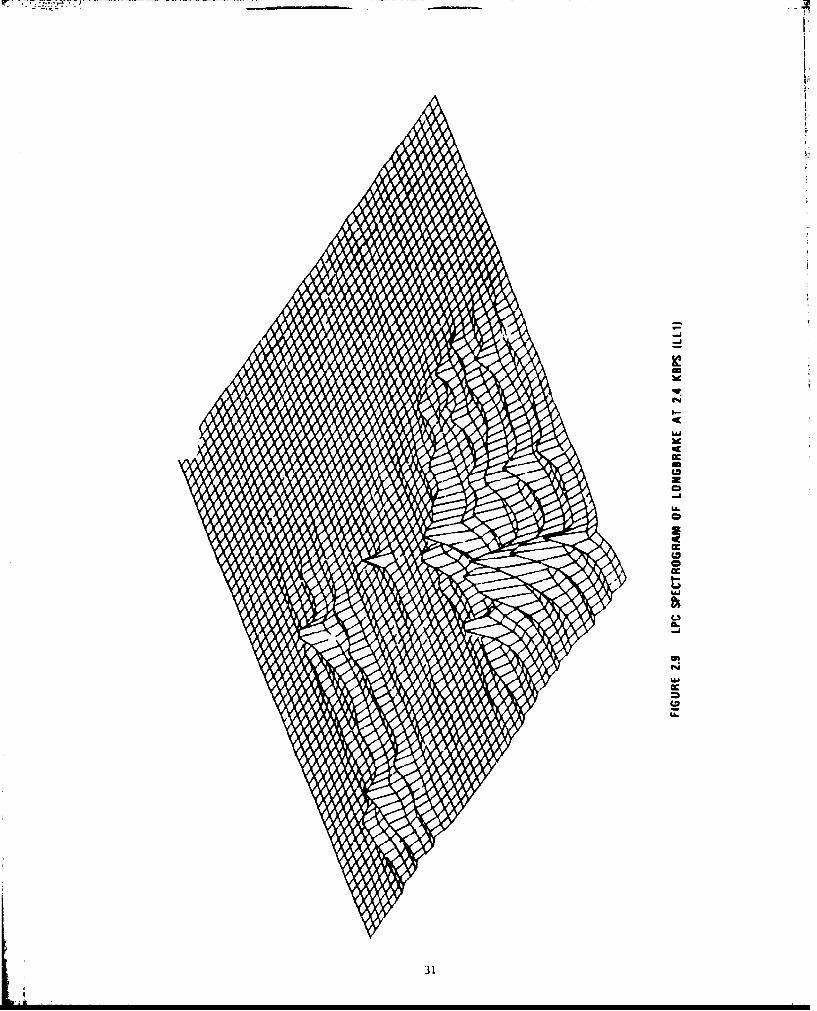
Figure 2.9 - LPC Spectrogram of Longbrake at2.4 KBPS (LLI) 31
Figure 2.10 - Cepstral Spectrogram of Hianchor(LL1) 32
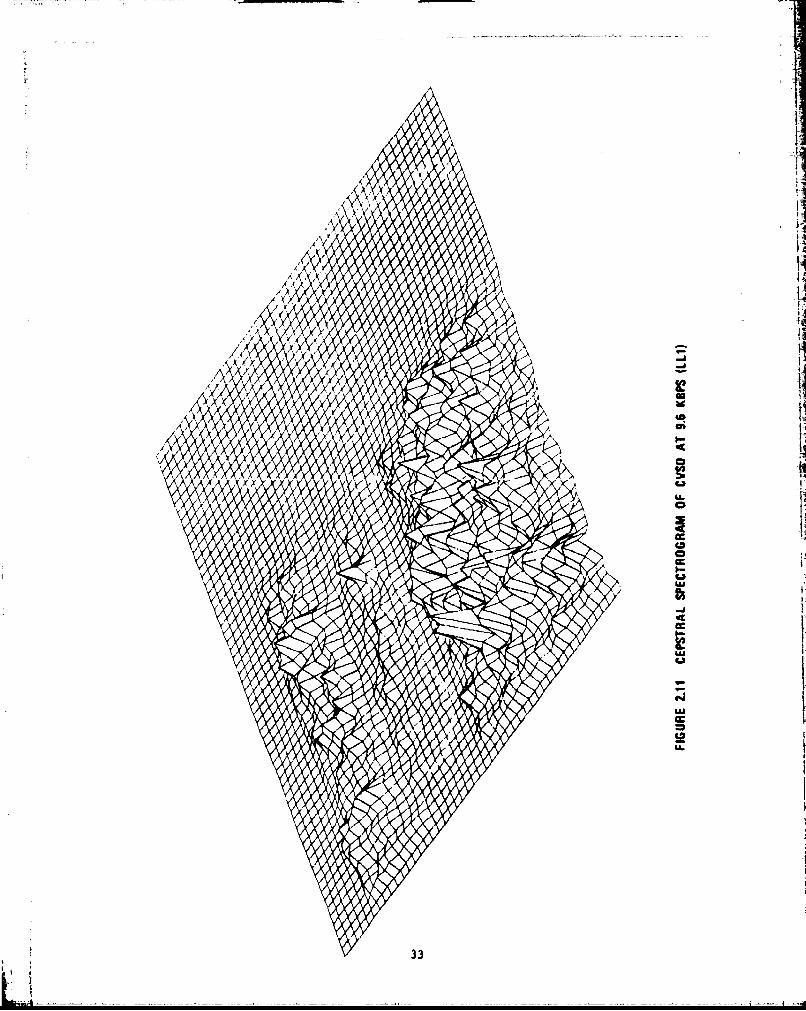
Figure 2.11 - Cepstral Spectrogram of CVSD at9.6 KBPS (LLl) 33
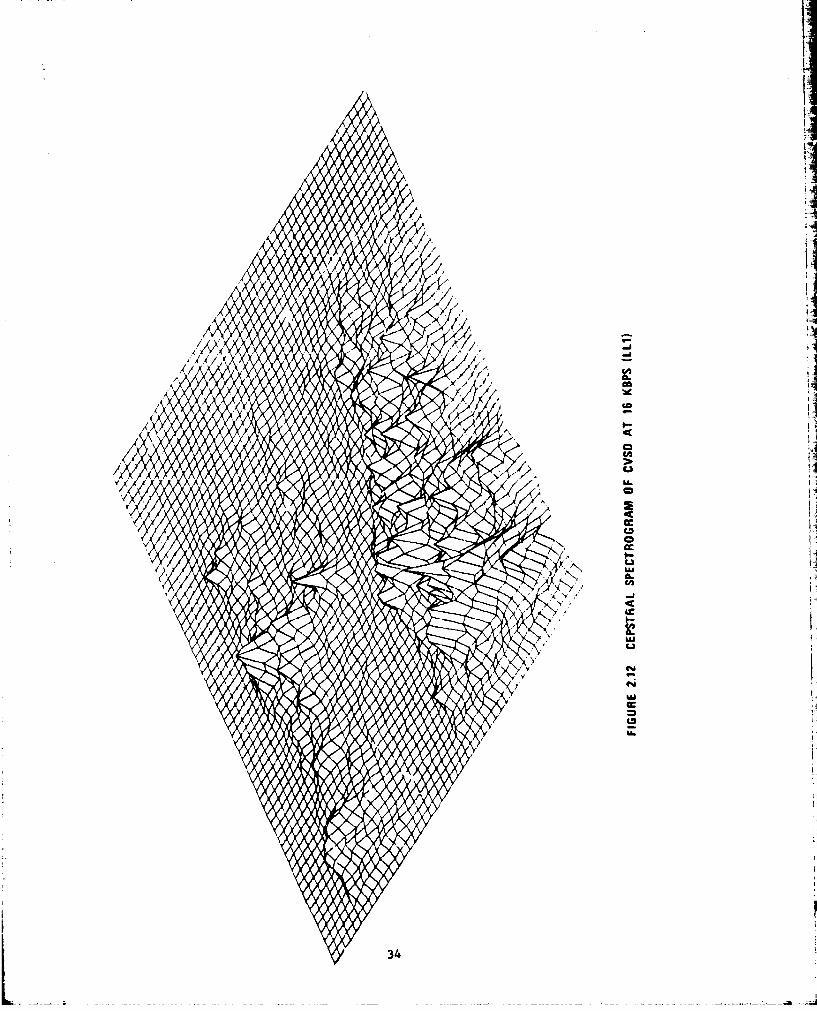
Figure 2 12 - Cepstral Spectrogram of CVSD at16 KBPS (LLI) 34
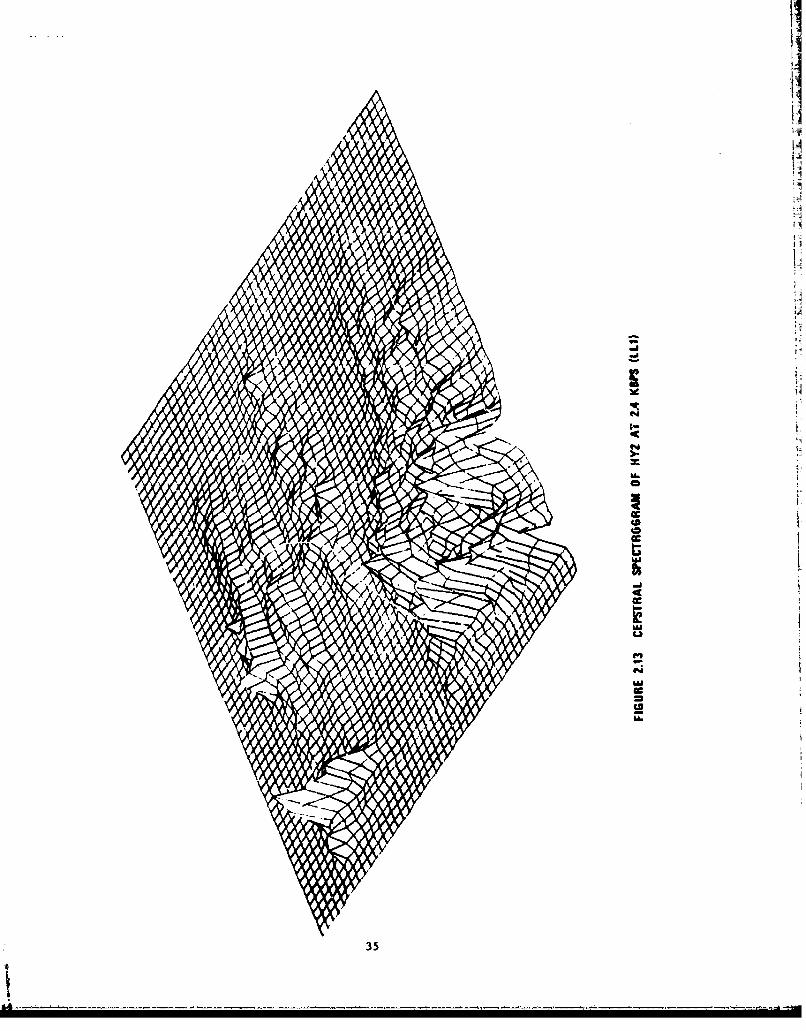
Figure 2.13 - Cepstral Spectrogram of HY2 at 2.4K1UPS (LIU) 35
Figure 2.14 - Cepstral Spectrogram oý Longbrake
at 2.4 KBPS (LLI) 36
Page #
Figure 2.15 - Plts of d2 log LPC SpectralDistance Measures for the SyntheticVowel for Various BandwidthDistortion Factors. The Distortionis Formed from aiEwai where v isOe Bandwidth Distortion Factor 44
Figure 2.16 - Plots of d2 Log LPC SpectralDistance Measures for the SyntheticVowel [a ! for Various FrequencyShift Distortion Ratios 45
Figure 2.17(a) - Plots of the d2 Log LPCSpectral Distance Measure onVowels for the Various DistortionsUsed in this Study 46
Figure 2.17(b) - Plots of the d? Log LPCSpectral Distance Measures onSentences for the VariousDistortions Used in this Study 47
Figure 2,18 - Cepstral Pitch Metric as aFunction of Time for Four DifferentPitch Distortions for Window No. 1(Figure 2.3). Window Length - 50
Figure 2.i9 - Cepstral Pitch Metric as a Functionof Time for Fcur Different PitchDistortions for Window No. 2 (Figure2.3). Window Length - 4 51
Figure 2.20 - Cepstral Pitch Metric as a Functionof Time for Four Different PitchDistortions tor Window No. 3 (Figuru2.3). Window Length = 10 52
Figure 2.21 - Cepstral Pitch Metric as a Functionof Time for Four Different Distortionsfor Window No. 4 (Figure 2.3).Window Length = 10 53
Figure 2.22 - Layout of PARM Access Data Used asPart of this Study. Each BoxRepresents a Digk File. The Datais Presorted in the Data Files toallow Easy Access of the PARM DataSets 60
viii
Pagn #
Chapter 3
Figure 3.1 - Generation of Studentized Range 84Statistic
Chapter 4
Figure 4.1 - Quality Station 100
Figure 4.2 - An Example 'QUALGOL" Program usedto Administer the ComnmunicabilityTests 102
Appendix A
Figure 1 - Specimen PrinLout of DAM Results 120
Appendix C
Figure 1 - The Basic System for the ResearchLabora tory 129
Figure 2 - The NOVA 830 Graphical Subsystem 132
Figure 3 - The Audio Subsystem on the NO',A 830 134
Figure 4 - The Speech Quality Testing Subsystem 136
Figure 5 - The Optical Data Procc,,sing Subsystem 137
Figure 6 - The Computer Network Subsystem 139
Figure 7 - The Universal Card Tester 140
Figure 8 - The NOVA 820 Basic ;.ystem 144
Figure 9 - The Micro-Processor Subsystem 147
ix

LIST OF TABLES
Page#
Chapter 2
Table 2.1 Statictics Calculated by "PCHECK"Pit.h Comparison Program 20
Table 2.2 Input Sentences Used in theInitial Qualitative Studies 25
Table 2.3 Results of the BandwidthDistortions and Frequency ShiftDistortions on Vowels. AllConfidence Intervals are at the.05 Level 41
Table 2.4 Results of the Bandlimit Distortionand Additive Noise Distortion onVowels. All Confidence Intervalt.are at the .05 Lev:el 42
Table 2.5 Results of the Pit.h Distortionson Vowels. Note that the Dlistortioi,sare Low, and Increase DistortionsCause No Increase in the Measures 48
Table 2.6 Results of the Bandwidtt: Distortionsand Frequency Shift Distortions onSentences. All Confidence Intervalsare at the .05 Levels 54
Table 2.7 Results of the Bandlimit Distortionsand Additive Noise Distortion onSentences. All Confidence Intervalsare at the .05 Significance Level 55
Table 2.8 Results of the Pitch Distortion Studyon Vowels. All Confidence Intervals areat •he .05 Significance Level 56
Table 2.9 Comparison of Gain Weighted D2 LogLPC Spectral Metrics to Non-Gain WeightedD2 Log LPC Spectral Metrics 57
Table 2.10 System Used in the PARM CorrelationStudy 59
x
- _ - ~ - - -

PaRe #
Table 2.11, Objective Measures Used in thePARM Correlation OStudy 62
Table 2.12 Results of Crrelatio.i Study forToLat Set of Systems 68
Table 2.13 Results of Correlation Study UsinrOnly Vocoders 69
Table 2.14 Results of Waveform Coder Using OnlyWaveform Coders 70
Chapter 4
Table 4.1 QUALGOL Language 101
Table 4.5.1 Retults of Urscreeneu FirstScoring Tests 107
Table 4.5.2 Distortion Levels fur the TestDigits on tht Three CommunicabilityTests 108
Table 4.5.3 Results of Screened First ScoringTes ts 110
Table 4.5.4 Resulta of the Screened Tests Usingthe Second Scoring Method 111
Table 4.5.5 Results of Screened Tests Using theThird Scoring Method 112
Appendix A
Table I System Charcteristics Evaluated by DAM 118
Appendix C
Table 1 1/0 Devices on the NOVA 830 I/0 Buss 130
Table 2 Standard PC Cards Used in the ModularConstruction System 142
Table 3 I/0 Devices on the NOVA 820 1/O Buss 145
xi

... . ;... ....
CHAPTER 1
INTRODUCTION
1.1 Task History
The engineering effort reported on here was performed at Georgia
Institute of Technology in the School of Electrical Engineering for t
the Defense Communications Agency through the Rome Air Development
Center Post-Doctoral Program. The Post-Doctoral Program is under the
direction of Mr. Jake Scherer. The monitoring officer at the Defense
Communications Engineering Center was Dr. William R. Belfield, at the
Defense Communications Engineering Center (DCEC).This task, on investigation of subjective speech quality testing,
objective speech quality testing, and communicability testing, was
undertaken following the development at DCEC of a large data base
associated with PARM and QUART (Paired Acceptability Rating Method and
Quality Acceptance Pating Test). The existence of this data base has
made possible the detailed analysis of subjective testing procedures,
objective testing methods, and communicability testing, with good
cross checking and validity referencing of results.
1.2 Speech Digitization Systems and Testing Requirements
Since it has for some years been clear that some form of end-
to-end speech digitization would be initiated in the Defense Communica-
tion SyRtems, a number of speech digitization systems have been developed
in various laboratories around the country. The job of selecting from
these candidate systems the features to be included in a final system
requires extensive evaluation and testing to be conducted. When a
"final" system is fielded, periodic field testing of all links for
continued operational quality will be a significant requirement. This
study attempts to further focus efficient means for developmental and
operational quality testing.
1.3 Personnel, Procedures, and Facilities
This task has been carried out principally by Dr. T. P.
Barnwell, with Dr. A. M. Bush, and with the active involvement
of Dr. R. W. Schafer and Dr. R. M. Mersereau. Student Assistants have
included Mr. Ashfaq Arastu, Mr. Bartow Willingham, and Mr. J. D. Marr
here at Georgia Tech. This group also consulted on two occasions with
Dr. W. D. Voiers of Dynastat, Inc., Austin, TX. The project was done
for and with the active help of Dr. William R. Belfield of the Defense
Cotiwunications Engineering Center.
Team leader was Dr. T. P. Barnwell. The project was initiated
in May 1976 and completed in May 1977. Although six months effort was
originally estimated, unavoidable delays in establishing the PARM data
base at Georgia Tech delayed its progress. This report was prepared
at Georgia Tech, tentatively approved in rough draft form at DCED, and
subsequently reproduced at Georgia Tech.
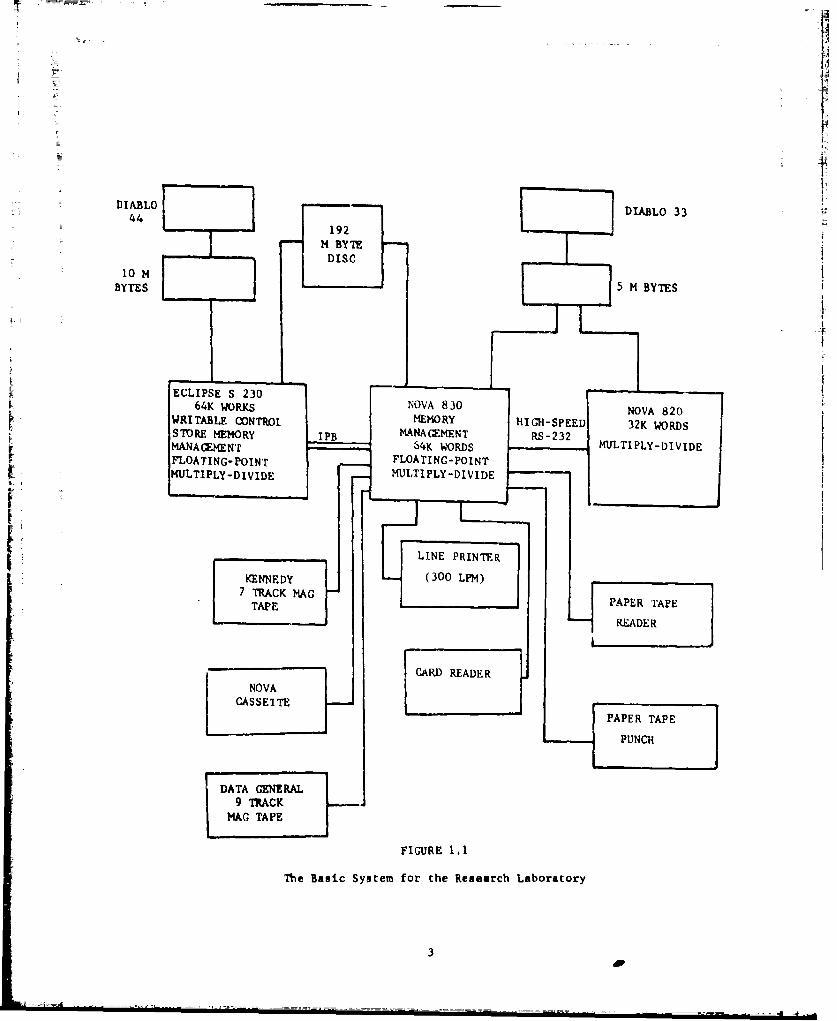
This work was carried out in the School of Electrical Engineering 5
Digital Signal Processing Facility. A block diagram is given as 11
Figure 1.1. A more detailed description of the facility is given in
Appendix C.
1.4 Technical Organization
The work reported here had as its ultimate goal the development
of efficient objective methods and tests for predicting user acceptance
"2
A
DIABLO DIABLO 3344
192H BYTE
DISC
BYTES 5 M BYTES
- -'
ECLIPSE S 23064K WORKS NOVA 830 NOVA 820WRITABLE CONTROL MEMORY HIGH-SPEED 32K WORDSST RE MEMORY IPB MANAGEMENT RS-232M.ANAGEMENT - " 34K WO)RDS MULTIPLY-DIVIDEFLOATING-POINT FLOATING-POINTMULTIPLY-DIVIDE MULTIPLY-DIVIDE
. LINE PRINTER
7 TRACK MAGJ
PAPER TAPE
READER
CASSETE IPAPER TAPE
S~PUNCH
SDATA GENERAL
S~9 TRACKMAG TAPE
FIGURE 1. 1
The Basic System for the Research Laboratory
3

of digital speech transmission systems. Three phases of the attack onI
this goal were established: (a) summary investigation of subjective
testing methodsi (b) development of a communicability test procedure;
(c) development of objective testing procedures.
The outputs of the study are recommendations for future
subjective test organization and implementation, specification of an
objective testing procedure with cross-validation against PARM sub-
jective testing results, specification of a communicability test
philosophy and implementation of the test with results analyzed
statistically. A secondary output is the PARM data base now organized
for efficient searches.
Work proqressed in all three phases in parallel, with some un-
expected delays due to the time required to obtain and organize the
data base from PARM (this is a large data base). A. M. Bush tookI A
principal responsibility for the subective testing portion, and T.
P. Barnwell was principally responsible for the objective test and the
communicability. R. W. Schafer and R. M. Mersereau also contributed
to all three phases of the effort.
1.5 Organization of the Report
The detailed aspects of each of the three phases of the effort
are presented in the report with the objective testing study in Chapter
2, the subjective testing study in Chapter 3, and the communicability
test in Chapter 4. Each chapter is headed by an introduction giving
the philosophy and rationale for that phase of the work and the
technical perspective required for that phase.
4

II. OPJECTIVE MEASURES FOR SPEECH QUALITY
2.1 Introduction
In recent years, considerable effort has eeen devoted to the
development And implementation of efficient algorithms for digitally
encoding speech signals. These algorithms, which are utilized
chiefly in digital comimunications systems and digital storage systems,
cover a wide range of techniques, and result in systems which vary
qreatly in cost, complexity, data rate, and quality. Generally
speaking, modcrn speech digitization systems can be divided into four
categoriesi high rat;e systems which operate from 1 100 KaPs tn
- 32 KBPs; intermediate rate systems which operate from - 32 KDPU to
- 8 KBPsj low rate systen4i which operate from - 8 KBPs to - 1 KBPs; and
very low rate systems which operate below - 1 KBPs. In the high rate
systems, PCM (2.1] and adaptive PCM (2.21 are of the predominant tech-
niques. In the intermediate rate systems, the techniques are more varied, 4
including DM (2.31, !ADM [2.41[2.5], "PCM (2.61, ADPCM r2.71, APC (2.81,
and adaptive transform coding (2.91. The low rate systems consist mostly
of the vocoder techniques, including LPC (2.. 131, channel vocoders
(2.141(2.151, phase vocoders [2.201 (2.21], and several other techniques
I 2.22]. Very low rate syst,.ob usually involve feature extraction on aperceptual gr linguistic Javel, and, thus far, very few systems of this
type have been implemented. As a eeneral rule, the higher data rate
systems are loss expensive to implement and lass sensitive to bit
errors, while the lower rate systems require more expensive terminal*,
and result in qrnater distortions in the presence of errors.
5
I.

The problem of rating e.nd comparing these systems from the
standpoint of user acceptance is a difficult one, particularly since
the candidate systems are usually highly intelligible. Hence, intelli-
gibility tests, such as the DRT (2.231, may not suffice to resolve small
differences in acceptability. Direct user preference tests such as
the PARM 12.241 have been found useful for this purpose but are not highly
cost effective. Moreover, they provide no diagnostic informa'i-.•n which
could be of value in xemedying the deficiencies of systems being tested. 1.
Objective measures which can be computed from sample speech
materials offer a possible alternative to subjective acceptability
measures. It should be noted, however, that the perception of speech
is a highly complex process involving not only the entire grammar and Fthe resulting syntactic structure of the language, but also such tdiverse factors as semantic content, the speaker's attitude and emotional
state, and the chizacteristics of the human auditory system. Hence, the
development of a generally applicable algorithm for the prediction of
user reactions to any speech distortion must await the results of I-future research. However, the effects of certain classes of distortion
are potentially predictable on the basis of present knowledge. In
particular, substantial progress has been made in quantifying the
importance of such acoustic features as pitch, intensity, spectral
fidelity, and speech/noise ratio to the intelligibility, speaker
recognizability as well as the overall acceptability of the received
speech signal. Thus far, little success has accompanied efforts to
predict the subjective consequences of other than relatively simple
forms of signal degradation, bus recent developments in di-ZItal signal
processing techniques (2.25](2.26), suggest a number of efficient objective
6
[
measures which could be highly correlated with user acceptability.
In a recent study corniuc-.ed by the Defense Department Consortiu
on speech quality, a large number of speech digitization systems were
subjectively tested using the Paired Acceptability Rating Method (PARM)
Test (2.24] developed at the Dynastat Corporation. The systems tested
included a representative cross-section of the intermediate rate and
low rate systems which had been implemented in hardware at the time of
the study, and, consequently, offered a large user acceptobility data
base covering most classes of distortion present in modern speech
digitizatior r )'ms. The existence of the PARM data base offered
a unique o. ".. ) measure the ability of objective measures tc
predict trut . e acceptability scores. Further, it allows the
development of precise methodologies for the utilizations of objective
measures in conjunction with subjective measures to possibly reduce the
* • cost of speech system quality testing.
This chapter describes a two part experimental study of the
relationship between a number of objective quality measures and the
subjective acceptability measures available from the PARM study. In
the first part of the study, controlled distortions were applied to
speech samples in order to measure tLe resolving power of the candidate
objective measures on these types of distortion. In the second part,
the candidate objective measures were applied to speech samples from the
same systems on which the PARM teets were run, and the statistical
correlation between the measures, objective and subjective, were studied.
This entire chapter consists of five sections. In Section 2.2,
the choice of objective measures is discussed. In Section 2.3, the
"controlled distortion" experiment is presented. In Section 2.4, the
7
[= objective-nubjective correlation experiment is described. Section 2.5
suwmarizes the results of this offort, and suggests directions for
future research.
2.2 The Choice of Objective Measures
2.2.1 The Speech Perception Process
Human speech perception is a complex process in which distortions
in the acoustic signal do not map simply onto perceived quality, in
this section, several aspects of speech perception which relate to
perceived speech quality will be discussed, and some general conclusions
will be drawn.
First, it should be noted that the syntactic structure of a
language has many comp)onents which impact speech perception. A sentence
in a language may be viewed as a concatenation of phonemes which are
hierarchically organized into syntactic and semantic units on a multi-
tude of levels. Phonemes are grouped into syllables, syllables into
words, and words into higher units (compounds, noun phrases, verb
phrases, clauses, sentences, etc.) based on the phras•n struk.ture of thp L:
sentence [2.271. Numerous modern linquists are tryinq to develolp a com-
prehensive grammatical theory for the generation of the syntactical
tree structures which represent the underlying sentence organization.
The point here is that a great deal more information than the identity
of the phonemes is being transmitted by the speech signal. Word
boundaries, phrase boundaries, and many other syntactic elements have
explicit correlates in the acoustics. It is these structural correlates
which allow the listener to understand the sentence structure, hence, to
use his great knowledge of the language to help him perceive the words
themselves. Researches in speech synthesis by 12.28 (2. 291 have found
L
8 1

that the need to correctly produce the accoustic cvrrelates of the eyntax
is at least equallY important to correctly producing tae avoustic
correlates of the phonemes.
There is yet another level of information transmitted in the
speech signal above the syntactic level. This levei is semantic in
nature, and incorporates the speaker's attitudes about the subject
matter of the utterance. Linguistically, this information lies in the
"intonation" and "enmhasis" of the sentence, and this is also enxltuitly
encoded in the acoustics.
When perceiving a sentence, a listener uses all these cues,
phonemic, syntactic, and semantic, to help him understAnd the utterance.
All these levels are highly redundant, and, in some cases, a great deal
of acoustic distortion can occur without effecting the intelligibility
or even the quality of the speech. However, in other cases, very
slight distortions, such as those which effect the perception of syntac-
tic structure, can cause complete loss of intelligibility. What is
important in understanding the effect of a particular distortion is in
understanding the way in which it intetacts with the entire complex
speech understanding process. At this point in time, even a simple
conplete enumeration of the information in a sentence is beyond the
scope of current theory. This is why the problem nf developing general
objective quality measures is so difficult.
This is not to say, however, that there is not considerable
knowledge about the acoustic correlates of the features of speech. It
is well established that the phonemic information .s primarkly found in
the acoustic filtering effect of the upper vocal tract, and hence, in
the short time spectral envelope of the speech. Likewise, it is well
..9
, - -
known that ph&se information, other than pitch, is not perceivable [2.22]
Also, it has been well demonstrated that a great deal of information
about consonantal identities are found in the formant behavior of the
adjacent vocalics. But there are other phonemic acoustic corrclates in
English besides the spectral envelope. For example, voicing information
in consonants is found in the durations cf adjacent vowels and in the
local pitch contour 12.301.
The ma-or acoustic, correlates cf syntactic structure, intonation,
and emphasis are pitch, vowel durations, and intensity. Of these cor-
relates, pitch is by far the strongest 12.311 12.321, to) lowed by duration,
and then intensity. There is also evidence that there 4re some effects
in. the spectral envelope which are involved in the perception of these
"superseglflntals," though these are small.
When developing objective quality measures for intermeeiiatp rate
and low rate digitization systems an important point is that, due to the
nature of the systems themselves, nly certain classes of distortions can
occur. For example, phoneme durations, which are very important in
perception of both phonemic and strictural information, are not altered
by coding. In vocoder systems, where the spectral envelope, pitch and
excitation, and gain .information are separated naturally as part of the
digitization process, the mapping of the various parameters onto the
perceptual domain is relatively easy to characterize. To detect
distortion related to phonermtic perception, spectral distance measures
seem most important. Since the pitch contour plays such an important
iole in perception, some sort of excitation comparison should also be
used. Since gain is relatively less important, it is expected that
only gross gain errors should be detected.
10

• I:
In the case of waveform coders, the distortions are not so easily
related to perception. Pitch information is not likely to be effected,
but simple signal/noise ratios are not obviously good candidates for
quality measures. A more likely candidate might be a measure based on
the noise spectrum at the receiver.
2.2.2 Specific Objective Quality Measures
In this section, all of the objective quality measures tested
in this study will be presented. All of the measures studied were not
necessarily metrics. In order to qualify as a true metric, a distortion
measure, D(X,Y), between two signals, X and Y, must meet the following
conditioss:
1. D(X,Y) 0 iff X-YD(MY) > 0 if XY'Y
2. D(X,Y) = D(YX)
3. D(XMY) • D(X,Z) + D(Z,Y).
Some of the distortion measures in this study meet these requirements,
while others do not.
2.2.2.1 Spectral Distance Measures
Spectral distance, in this context, refers to a distance measure
between a sampled envelope of the source or unprocessed speech signal
and a degraded form of the signal. Since there are many methods for
approximating the "short time spectrum" of a signal, there are corres-
pondingly many metrics which may be formed from a speech signal. A
good measure should have two 3haracteristics: it should consistently
reflect perceptually significant distortions of different types; and,
it should be highly correlated with subjective quality results.
A total of sixteen spectral distance measures and related
II

measures were studied in this project. Let V(e), -1YsOe1, be the short
time power spectral envelope for a frame of the original sentence and
let V' (8) be the power spectral envAlope for the corresponding frame of
distorted sentence. In this discussion, it is assumed that the proper
time synchronization has occured, and that V(8) and V' (8) are for the
same frame of speech. Due to the fact the gain variations are not of
interest here, the spectrums V(8) and V' (8) may be normalized to have
the same arithmetic mean either in a linear or a log form. A geometric
distance between the spectrums of the distorted and original spectrums
may be taken in several ways, including direct spectral distance
D(8) - V(e) - V'(8) , 2.1
the difference in the log spectrums
D(O) - 10 log 1 0v(8) - 0 log 2.2
the source normalized distance measure,
D(6) - IV(O) - V'(B)]/V() 2.3
and the ratio of power spectrums
D(8) - V(e)/V' (8) . 2.4
of tOse measures, 2.1 and 2.2 can form the basis for true metrics,
while 2.!a.•d 2.4 cannot. A large class of distance measures can be
defined as tke weighted Lp norm "d," by
12

r 4 .w 1/p
d (V,V',W) " W(VV .O)ID(e)IPdOp j-----------2.5
W(V,V' ,O)d6
IfI
where W(V,V1,G) is a weighting function which allows functional weight-
ing based on either of the power spectral envelopes or on frequency. In
this study, W(V,V',e) 1 1, and 2.5 reduces to
d(V,V')- 2•-J• ID(e)lPd"l'/p 2.6
Clearly, the higher the value of "p," the greater the emphasis on large
spectral distances. This measure may be digitally approximated by
sampling D(6), giving
IM ( 1/.') 2/pd P(V,V') ~i I• I )(,, 2.7Im-,l
2.2.2.1.1 The LPC Spectral Distance Measures
Since the output speech waveform is a convolution between a
spectral envelope "filter" and excitation signal, then a deconvolution
is necessary for spectral envelope comparisons. The LPC analysis is
itself a parametric spectral astimation process, and may be used to
extract an approximation of the a tral envelopp. The block diagram
for an LPC spectral analysis system is given in Figure 2.1. If the
LPC parameters are (al, I& . na) then the spectrum function V(O),
is given by
G2V(e) - 12 -n<esys 2.8
IA(e.)1
13- _ m-

u 4 44
0
z 0I
0 4C
V) zL--11 la 'z .,4
00
x0
CA
F' LU
00
141

where
NA (Z)a a az~ 2.9
This approximation can be used to calculate any of the measures suggested
above.
There are a number of additional measures which can be calculated
from Az). These are not true spectral distance metrics or measures,
but are related, and have the additional feature that they are easy to
calculate. Several of these measures are simply geometric distances in
the parameter domains, such as feedback coefficients, PARCOR coefficients,
area functions, and pole locations. In each of these cases, we can
define d as
pMa(E;F;- *• • 2 •,- •jp~lI/p 2.1o
where E is the mt parameter (PAR(OR coefficient, area function, etc.),m
and N is the number of parameters involved in the representation.
Another related approach is illustrated in Figure 2.2. The
original speech signal is analyzed using an LPC analysis, and the
inverse filtered waveform is formed by
Nei a -" ajei' 2.11
where a is the jth LPC coefflcient and si is the ith speech sample.
This optimal filter is then %tsed to inverse filter the distorted
waveform, resulting in
15
CL "
4)4wl w
0
PA
cc
W > ul z0 > ca z
(,C wE cc0LU uj U.
> 4c ca Z LL a Z k
LMn
w0
4A9>. LL
IL) U.
0~0
16
N
e! = -s a 2.12
The measure which is used is then
L /pep
[ 2.13p =
where L is the total number of samples in the utterance.
2.2.2.1.2 Cepstral Spectral Distance Measures
Another technique used often for deconvolving the spectral
envelope from the excitation is cepstral analysis (2.33] [2.341. The
analysis system for cepstral analysis is shown in Figure 2.3. By
Parseval's Theorem, d2 can be calculated from the cepstrum by
k=od 2 = k1oCk - CkI 2.14
where Ck and Cý are the cepstral components for the original and the
test signal resrectively. For the same reason that cepstral deconvolu-
tion works well on speech,. only a few coefficients need to be used
(4 40) to calculate d2 . Since the cepstral measure is computationally
intensive (2 FFT's per frame) and since it has been shown that d
calculated from A(z) is very highly correlated with d2 calculated from
the cepstrum [ý.35], then it does not appear that the cepstral measure is
very attractive. However, the cepstral measure is attractive for
excitation feature extraction (see 2.2.2.2.2); since the low order
cepstral coefficients are a by-product of that analysi.3, and since CCD's
17
AA
ORIGINALSPEECH -
HAMMIG FFTFFT- 1-- WINDOW LOG•!
i_
: ~TIME GATE
OECONVOLVEDFFEXP() SPECTRUM V(g)
Ii _ |,
(!
FIGURE 2.3 SYSTEM FOR PERFORMING CEPSTRAL DECONVOLUTIONI FOR SPECTRAL ENVELOPE ANALYSiS.
18
i _

offer potential for cheap FPT's using the CHIRP-Z Transform, then
copstral measures are worthy of consideration.
2.2.2.2 Excitation Featuro, Extraction
Pitch is a very important acoustic correlate of many supersegmen-
tal features, and distortions in the pitch contour are easily perceivable
Ind very detrimental to quality. Pitch estimation errors and voiced/
unvoictd errors may occur in any pitch excited vocoder system. Hence,
it is of interest to investigate objective measures for comparing
excitation features for those systems where it is applicable.
The ideal solution to this problem would be to generate high
quality pitch contours for the original utterances, and to compare
th. e to the values used by the vocoder synthesis algorithm. However,
since the excitation parameters are not explicitly available in vocoder
systems, and since the excitation data is not available for the systems
used in the PARM test, then this approach is unreasonable.
A second possibility is to apply a high quality pitch detector
to both the original and the distorted speech, and to compare these
results. A system which compares pitch excitation contours was developed
at Georgia Tech under a previous effort [2.361 along with several high
quality pitch detection programs. The statistics performed by the
pitch comparison program (PCHECK) are enumerated in Table 2.1. This
approach was studied experimentally using the Hard Limited Autocorrela-
tion Pitch D~tector (2.36) and the Multiband Pitch Detector (2.361.
I third possible approach involves developing a measure for
excitation differences which does not depend on any pitch detection
algorithm. The idea is to use a deconvolution technique which is aimed
at retrieving the excitation representation rather than the spectral
19

STATISTICS
I. Total number of pitch errors
2. The average errors per sample in voiced regions
3. The number of gross errors (greater than a threshold)
4. The average gross errors
5. The number of subtle errors (less than a threshold)
6. The average subtle errors
7. The number of voicing errors
8. Sample standard deviations from the above averages
2.1 Statistics Calculated by "PCHECK" Pitch Comparison Program
20
m ~ • _ • . .. . .. .. .. • . .. . . . .. . . • . . .. . .. .. . . . .-..-- _ • . . . . . .. . ... . . . .- -_
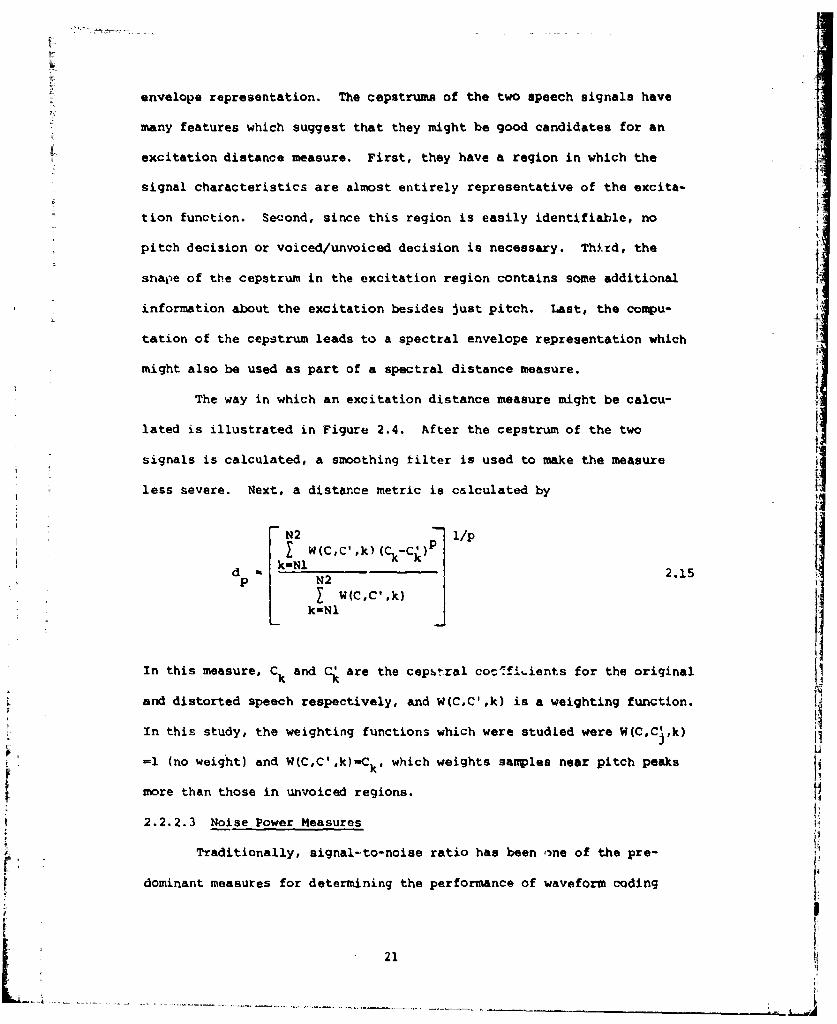
envelope representation. The cepstrums of the two speech signals have
many features which suggest that they might be good candidates for an
excitation distance measure. First, they have a region in which the
signal characteristics are almost entirely representative of the excita-
tion function. Second, since this region is easily identifiable, no
pitch decision or voiced/unvoiced decision is necessary. Third, the
snape of the cepstrum in the excitation region contains some additional
information about the excitation besides just pitch. Last, the compu-
tation of the cepstrum leads to a spectral envelope representation which
might also be used as part of a spectral distance measure.
The way in which an excitation distance measure might be calcu-
lated is illustrated in Figure 2.4. After the cepstrum of the two
signals is calculated, a smoothing tilter is used to make the measure
less severe. Next, a distance metric is c&lculated by
N2 1/p
Sw(cc',k) (Ck-C)pk-Nld N2 2.15
SW(C,C',k)kNl
In this measure Ck and ' are the cep4-ral coc •f.ients for the original
and distorted speech respectively, and W(C,C' ,k) is a weighting function.
In this study, the weighting functions which were studied were W(C,C;,k)
=1 (no weight) and W(C,C' ,k)-Ck# which weights samples near pitch peaks
more than those in unvoiced regions.
2.2.2.3 Noise Power Measures
Traditionally, signal-to-noise ratio has been ,'ne of the pre-
dominant measures for determining the performance of waveform coding
21L..:

CEPSTRAL EXCITATION METRIC
A B C D
EXCITATION INFORMATION
SPECTRALINFORMATION
D* ~ c m cS-c
El J=C
SI'~CEPSTRAL LOW
SPEECH ANALYSIS GATE
HIGH Cj!FIR cl
FIR WINDOW FUNCTIONS TIME GATE SMOOTHER.•(1) I
(2)
(3)
(4)
FIGURE 2.4 CALCULATION OF THE CEPSTRAL PITCH METRIC
22

systems. This measure is attractive since it is so eavily calculated
and since values for this measure are known for most appropriate
systems. It is unattractive since it is diffieult to evaluate in
light of what is known about speech perception.
A far more interesting approach might be to develop a measure
based on the coloration of the noise as well as its power. In short,
if noise is defined as
n- si - si. 2.16
where s. and s are samples of the original and distortr. speech
respectively, then the noise spectral envelope N(8) could be found
using LPC or cepstral techniques as before. A moasure could be
defined such that
JW(e)Np(e)de
2.17
and
d/p 2.18
This would be attractive since it would allow some measure of the
spectral characteristics of the noise, whi.ch is very likely to have
perceptual impact. If W(e)-l, then, by Parseval's Theorem, this meastire
becomes the sagnal-to-noise ratio for p-2.
Though this represented a very interesting area for study, very
23

little was done on noise measurements in this study. This is because
the data base associated with the PARM was not in a form to make the
necessary cocqutations reasonable.
2.3 Initial Qualitative Studies and Controlled Distortions
This section describes two phases of the experimental study. In
the first phase, example sentences from various systems were digitized
from analog magnetic tape, and various forms of gain measures and
spectral measures were applied and studied . In the second phase, the
measures presented in the previous section (2.2) were applied to
sentences which contained controlled distortions to test these measures
for consistency in measuring these distortions, to check the measure-
ment of combined distortions, and, by using the histograms of time be-
havior of the various measures, to determine a potential resolving
power for each measure.
2.3.1 Qualitative Studies
In the initial study, a total of 20 sentences from two speakers
and fi,' - items were digitized from analog tape (digital tape repre-
sentati re not available at that time), and stored on disk. (See
Table k )_ A subgroup of those sentences was then analyzed for energy
contours and for spectral representations and cepstral spectral analysis.
The energy was measured bý applying Kaiser windows [2.37] of
various lengths as FIR filters to the squared waveforms. The window
lengths were adjusted such that pitch periods were not obvious in the
enerTy representations. These energy plots we, ý then used to try to
synchronize the sentences with one another.
Several results came out of this study. First, not unexpectedly,
the energy plots for the wav'form coders (CVSD 16 and CVSD 9.6) were
24

TEST UTTERANCES
HI ANCHOR LLI1 LL2 CHI CH2
CVSD (16 KEPS) LLI.' LL2 CNI CH2
CVSD (9.6 KBPS) LUL* LL2 CHI CH2
LONGBRAKE (2.4 KBPS) LLl' LL2 CHI CH2
HY2 (2.4 KBPS) LLI' LL2 CHI CH2
Part of Subtest Group
Table 2.2 Inpuit Sentences Used in theInitial Qualitative Studies
25
very similar tn that of the high anchor (original). Second, the energy
plots for the vocoders (Longbrake 2.4 and Hy2 2.4) were very different
from the high anchor and very different from each other. Attempts to
synchronize the utterances using the gain waveforms result in different
synchronizations than if tht. waveforms are synchronized visually. The
point here is that since the local intensity of a speech waveform is
not a highly perceivable uiiantity, and vocoders take advantage of this
by doing relatively poor gain estimation, and points out that energy is 1iprobably not a good candidate for an objective quality measure.
Another point should be made here. The synchronization efforts
here point up clearly that the use of analog magnetic tape for recordinc
utterances is generally unacceptable. Effects which (we presume) are
due to the stretching of the analog tapes prevented synchronization from
being maintained for more than 1-2 seconds. Caretully synchronized
digital playback and recording systems must be used as a basis- for
reasonable objective measures.
In the second part of this study, 10 pole LPC spectral analysis
and 40 coefficient cepstral spcctral analysis was performed on the five
test sentences, and 3-D perspective plots were produced. These plots
are shown in Figures 2.5-2.14. Several points were observed from these
plots. First, the peaks in the LPC spectra were generally sharper
than those of the cepstral spectra. Second, however, the cepstral
spectra, on thA whole, had much more local variations than the LPC
Epectra. Third, the spectral variations caused by the waveform coders
were more noticable in the LPC case than in the cepstral case. On the
whole, no clear advantage for either of the two e ,alyses could be found
from these plots.
26

\ x,*11
cc
ca
zL
0.6
27
L16~
I0
26,

A'A
~U
Ay '\* \\A
~ \\ IA
~ ''''.
. .' -a
~ - mLa
29 .' \ j

Lo
30
IzI
Ii
- iY~
iLi=
300
4K.
-l
mU.
0
!m
IC
la
cc
31j

I
66F
LAOi
32
ii
322
LaIb.1
xx pLL,1
0I
taiC'
cc
L1
cc I
LAI:cc
333
Ixliiii
-J
In
4
4
1i
PP
cc
r4c
a
•4c
• 35

.P
I:
cat-
LLw
iC2
36

2.3.2 The Controlled Distortion Experiment
The purpose of the controlled distortion experiments was to test
thu candidate measures discussed in Section 2.2 as to their reslving
power for measuring certain classes of distortions. In all 'uases, the
"original" was taken to be the output of a 12 tap LPC s'ynthesis program
where the coefficients were unquantized and the pitch vas extracted by
hand. Two sets of signals were used. One set consJ.ted of four
synthetic vowels (/i/,/•/,/ui and /at/), the other of two sentences, one
spoken by a male speaker and one spoken by a fr~male speaker. In all
cases, five classes of distortions were applied: bandwidth distorticni
frequency distortion; pitc.h dIstortion; l'jw pass filtering distortion;
and additive noise.
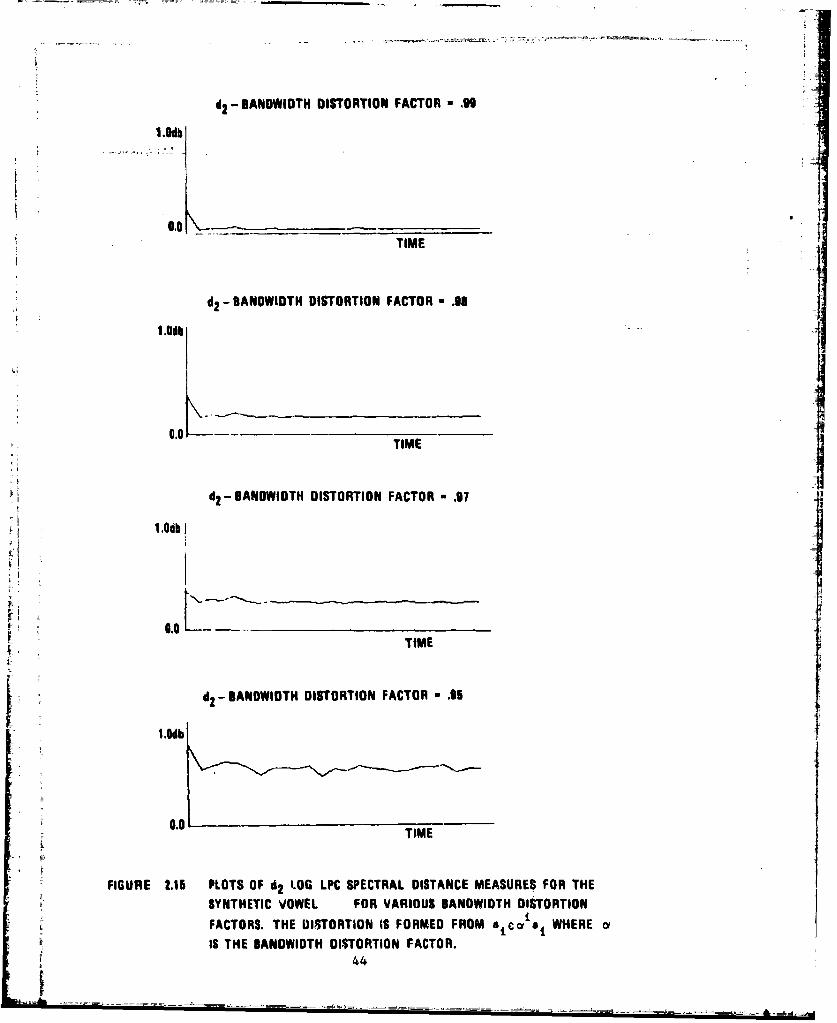
2.3.2.1 Bandwidth Distortion
Distortions in the bandwid*.• of formazts is a oomson occurrence
in vocoders. To test this type af distortion, the unit circle was
effectively expanded by transforming each LPC coefficient by
ai ÷ ai (a) 2.19
In this experiment, the four values of a which. were i•-4d were .99, .98,
.97, and .95. 7-ie first two values introduced no perceivable distortion.
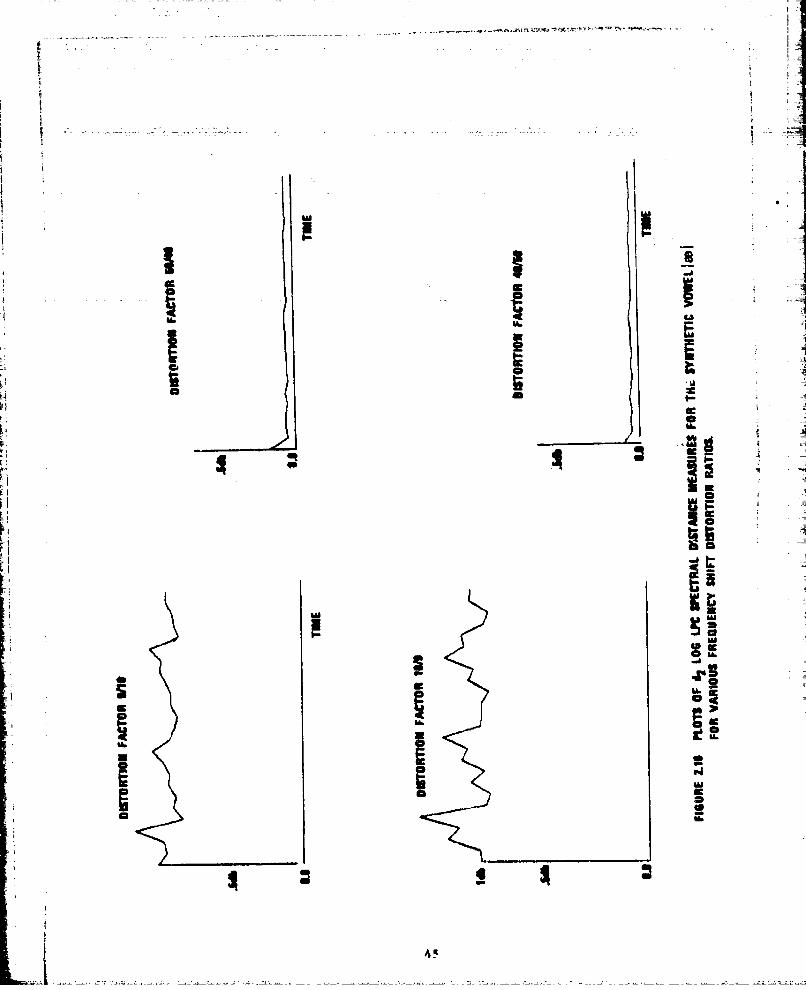
2.3.2.2 Frequency Distortion
The frequency distortion was carried out by up or downi sampling
the impulse response of the LPC synthesizer. Figure 2.15 shows the
procedure. First, a FIR (256 point) approximation for the I8 impulse
response was calculated. Then a zero padded interpolation was performed
using a 1000 point Kaiser window designed linear phiase low pass filter.
The resulting modifiad impulse response was used to synthesize the
37

speech samples. Sampling ratios of 49-50, 50-49, 9-10, and 10-9 were
used.
2.3.2.3 Pitch Distortion
Pitch distortion was applied by allowing the pitch period to
systematically increase over the voiced regions. This results in pitch
distortions which increased with time in each utterance. The rates at
%hich the periods were allowed to vary was +1 sample every 10 voiced
frames, +1 sample every 4 voiced frames, -1 sample every 10 voiced
frames, and -1 sample every 4 voiced Zrames.
2.3.2.4 Low Pass Filter Distortion
Bandlimiting distortions are very comor in speech communication
systems, and hence worthy )f study. The filters used were all 10th
order recursive digital eliptical filters with rejection bands at -60 DB,
In all, four filters were used with cutoffs at 1.4 kHz, 1.8 kHz, 2.2 kHz,
and 2.8 k•z.
2.3.2.5 Additive White Noise Distortion
White Gaussian noise was also added to the test signals. Four
noise levels were used which resulted in signal to noise ratios of
- 13 db, - 10 db. - 7 db, and - 3 db.
2.3.3 The E3orimental Result:
In all, six utterances, four vowels .768 seconds in length and
t.;. sentences 3.072 seconds in length, were used as originals. A total
"of four distortions for each of the five classes were applied to the six
speech samples, giving 120 distorted samples. T.e purpose c. the vowul
distortion study was to measure the effects of each measure in " "micro"
sense in order to compare resolving powers of the different measures.
The purpose of the full sentence distortions was to measure the "macro"
3

behavior of each objective measure. In all cases, the total sentence
metric was calculated from
Mm W'(m)dp#M
D p 2.19
I W'(m)m=l
In this expression, D is the total distortion for the entire sentencep
set, W' (m) is a weighting function, d is the "d p" measures definedp41m p
in Section 2.2.2 at the mth frame of the analysis, and M is the total
number of analysis frames. W' (m) was taken to be
W'(m) - 1, 2.20
and
W'(m) - G , 2.21
thwhere G is the LPC gain of the original sentence in the mh frame. Them
LPC analyses were always done with a Hamming windowed, autocorrelation
LPC with a frame interval of 256 samples and a window width of 256
samples. The gain weighting here was included to see how the overall
outcome would be effected as a matter of academic interest. The
hy-othesis is that, since the vocalics contain a large portion of the
information, and since the gain is always greater for vocalics, then a
gainweighted measure might be more highly correlated with perceptual
results. This experiment, cJ.eariy, gives no new information on this
hypothesis, but it does show to what extent gain weighting changes the
final objective quality estimate.
In all cases, D was taken to be the sum of M independent randomp
39
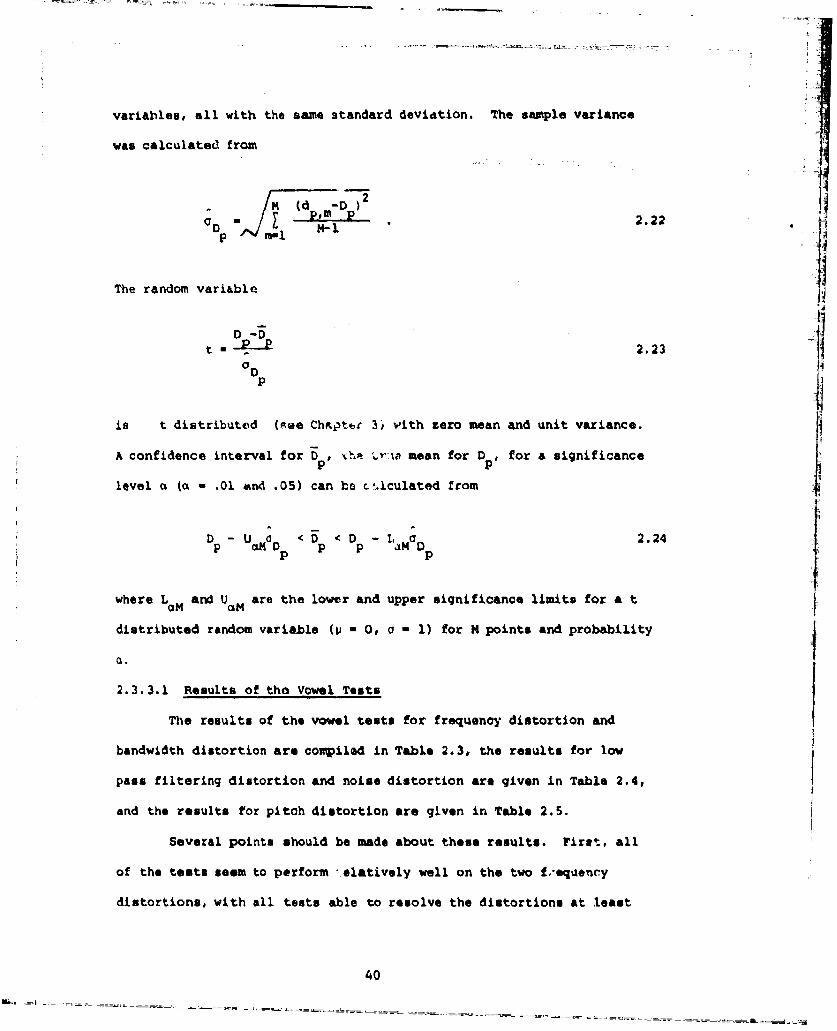
variables, all with the same standard deviation. The sample variance
was calculated from
m• (d -D )2
"" _ - p . 2.22JD M-1
The random variable
D -Dt - -2.23
p
is t distributed (ne Chptit 3 1 vith zero mean and unit variance. jiA confidence interval for Dp, •.'• tv:a mean for D for a significance
level a (a - .01 and .05) can be c.Iculated from
Dp- UM a D < D < Dp -. -,MoD 2.24p p
where L a and U m are the lower and upper significance limits for a t
distributed random variable (p a 0, a - 1) for N points and probability j
2.3.3.1 Results of the Vowel Tests
The results of the vowel tests for frequency distortion and
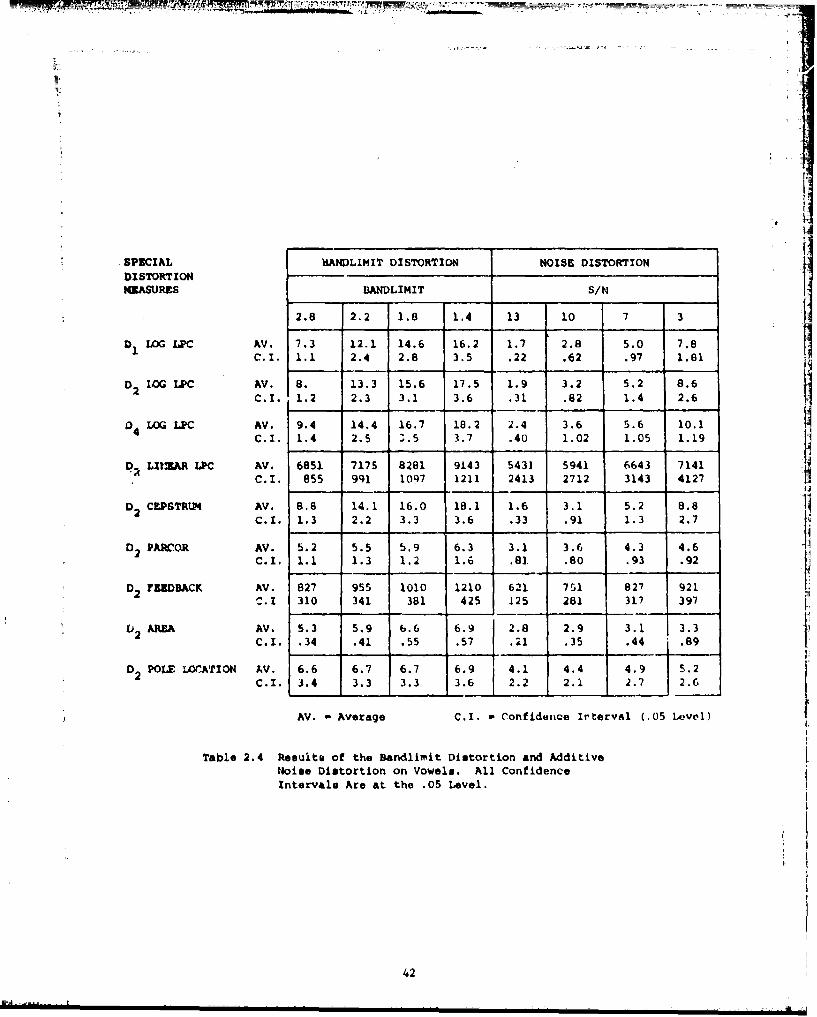
bandwidth distortion are compiled in Table 2.3, the results for low
pass filtering distortion and noise distortion are given in Table 2.4,
and the results for pitch distortion are given in Table 2.5.
Several points should be made about these results. First, all
of the tests seem to perform 'elatively well on the two ,'-equency
distortions, with all tests able to resolve the distortions at least
40

SPECIAL BANDWIDTH DISTORTIONS FRXQUENCY SHIT? DISTORTIONSDISTORTIONM1ASURS - L SHIFT RATIOS
.99 .98 .97 .95 50/49 49/50 10/9 9/10A LOG LP AV. .076 .13 .22 .37 .08 .07 .91 .83C.!. .03 .04 .06 .12 .03 .03 .11 .10
D2 LOG LPC AV. .081 .21 .24 .46 .11 .10 1.2 .90
C.!. .03 .05 .04 .12 .04 .02 .12 .10
D4 LOG LPC AV. .12 .26 .33 .61 .13 .15 1.6 1.3C.!. .05 .06 .09 .17 .05 .05 .14 .12
D2 LINER LPC AV. 1280 1541 3021 4077 2041 2112 4510 4910C.I. 825 1051 1121 1642 914 921 2013 2412
0 CKPS•RUN AV. .088 .22 .25 .42 .14 .12 1.3 .91C.I. .03 .05 .06 .13 .03 .03 .11 Ill
D2 PARCOR AV. 1.1 1.6 1.8 2.3 1.5 1.3 3.2 2.1C.!. .06 .05 .07 .08 .04 .02 1.2 .09
D EPEDACK AV. 113 191 215 421 104 127 411 402C.!. 61 75 112 18e 55 67 172 101
D AR&EA A'l. 1.1 2.2 3.1 5.7 1.4 1.2 3.7 3.22 C.!. 0.2 0.2 0.4 1.1 .31 .32 .62 .59
D2 POLE LOCATION AV. 2.3 2.7 2.9 4.1 2.1 1.9 4.2 3.8C.I. .93 1.6 1.9 2.2 .91 .80 2.1 2.3
AV. a Average C.!. - Confidence Interval (.05 Level)
Table 2.3 PRaults of the Bandwidth Diatortionsand Frequency Shift Distortions onVowel.. All Confidence Intervals areat the .05 Level.
41
t.
SPECIAL hANDLIMIT DISTORTION NOISE DISTORTIONDISTORTIONMEASURES DANDLIMIT S/N
2.8 2.2 1.8 1.4 13 10 7 3
D1 LOG LPC AV. 7.3 12.1 14.6 16.2 1.7 2.8 5.0 7.8C.I. 1.1 2.4 2.8 3.5 .22 .62 .97 1.81
D2 LOG LPC AV. 8. 13.3 15.6 17.5 1.9 3.2 5.2 8.6C.I. 1.2 2.3 3.1 3.6 .31 .82 1.4 2.6
0)4 LOG LPC AV. 9.4 14.4 16.7 18.2 ;.4 3.6 5.6 10.1C.I. 1.4 2.5 1.5 3.7 .40 1.02 1.05 1.19
[?;f LItIAR LPC AV. 6851 7175 8281 9143 5431 5941 6643 7141C.I. 855 991 1097 1211 2413 2712 3143 4127
D CEPSTRUP4 AV. 8.8 14.1 16.0 18.1 1.6 3.1 5.2 8.8C.I. 1.3 2.2 3.3 3.6 .33 .91 1.3 2.7
D2 PAR•OR AV. 5.2 5.5 5.9 6.3 3.1 3.6 4.3 4.6C.!. 1.1 1.3 1.2 1.6 .81. .80 .93 .92
D FEEDBACK AV. 827 955 1010 1210 621 751 827 921SC.•I 310 341 381 425 125 281 317 397
V 2 AREA AV. 5.3 5.9 6.6 6.9 2.8 2.9 3.1 3.3
C.I. .34 .41 .55 .57 .21 .35 .44 .89
D2 POLE LOrATION AV. 6.6 6.7 6.7 6.9 4.1 4.4 4.9 5.2C.I. 3.4 3.3 3.3 3.6 2.2 2.i 2.7 2.
AV. - Average C.I. - Confidence Irterval (.05 Level)
Table 2.4 Results of the Bandlimit Distortion and AdditiveNoise Distortion on Vowels. All ConfidenceIntervals Are at the .05 Level.
42

the .05 level. This point is also illustrated in Figures 2.15 and 2.16,
which show the time behavior of the d2 log LPC measure for the frequency
and bandwidth distortion. As judged by their confidence intervals,
the lg LPC medsures are the best, while the pole position and feedback
coefficienta are the worst for these two frequency distortions. Second,
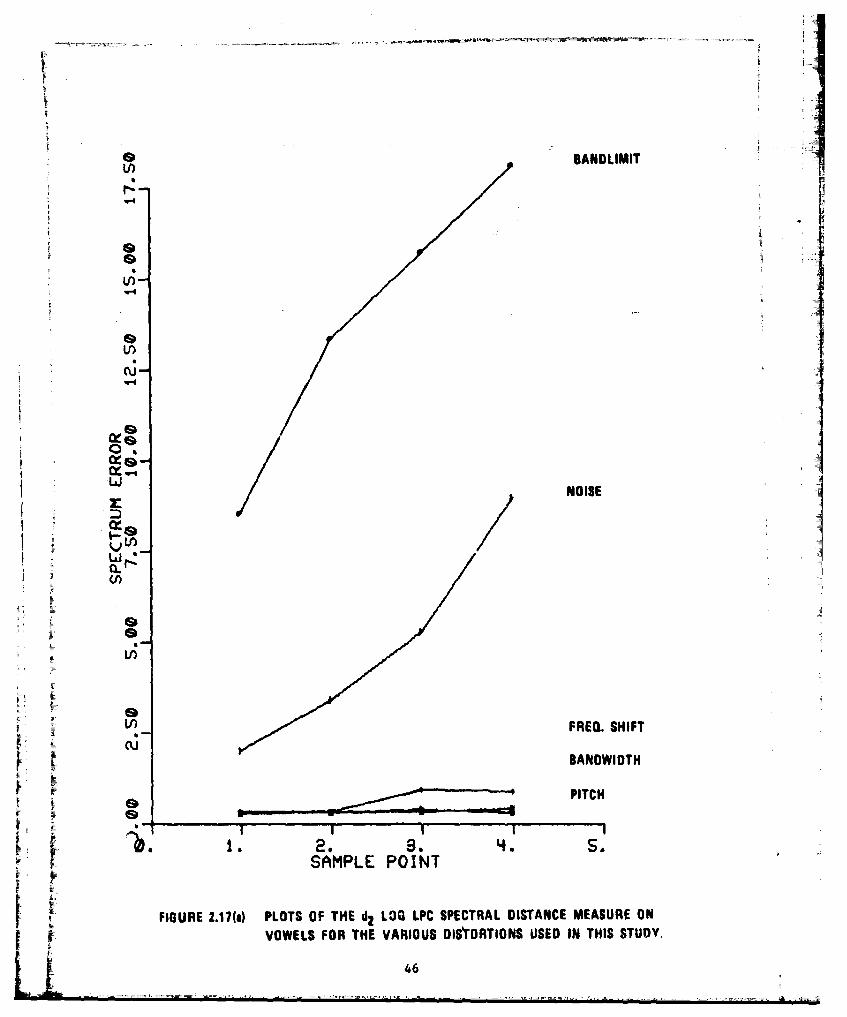
note that, for low pass filter distortion (Table 2.4), the results are
qualitatively the same as those above. But also note that quantitat.vely
they are very different, giving much greater spectral distances than the
bandwidth and frequency shift distortions. This can also be seen in
Figure 2.17. This brings up an important, if obvious, point.
That is that low pass filtering distortion swamps the more subtle forms
of frequency distortion. Hence, some bandwidth decision and control
is necessary in these objective tests if the more subtle distortions are
to be measured.
The noise results show some resolving power for the various noise
levels, buta general loss of resolution when compared to the frequency
and bandwidth results. Stated simply, this type of distortion is not
measured well by spectral distarce measures, and hence requires a large
sample of speech to detect it properly.
The results of the pitch variation studies presented in Table
2.5 show that essentially no s",ectral distance measure can detect pitch
errors with the number of samples used in this experiment. This, of
course, was an expected result, and was the reason that the special
pitch tests were included.
The cepstral pitch measure described in Section 2.2.2.2 was
applied to the four pitch distortions using each of the four smoothing
window function, shown in Figure 2.17.
43
d2 - BANDWIDTH DISTORTION FACTOR - .9
1.96
TIME
d2 - BANDWIDTH DISTORTION FACTOR - .98
1.0db
TIME
d - BANDWIDTH DISTORTION FACTOR = .97
1.0db
'1
S 0 L zTIME
.6 d2 - BANDWIDTH DISTORTION FACTOR* .95
TIME
"FIGURE 2.15 PLOTS OF d2 LOG LPC SPECTRAL DISTANCE MEASURES FOR THESYNTHETIC VOWEL FOR VARIOUS BANDWIDTH DISTORTIONFACTORS. THE DISTORTION IS FORMED FROM a ca al WHERE aIS THE BANDWIDTH DISTORTION FACTOR.
44
I IIII
CE
II I
* 4.iU
* BANDLIMITLI)
r..
NOS
c-.oB
U)w
CL
LaI. NOISE]
oh)
If)
LI) FREa. SHIFT
cuBANDWIDTH
~-----.PITCH
2. 3. S.SAMPLE POINT
S• FIGURE 2.17(|) PLOTS OF THE d2 LOG LPC SPECTRAL DISTANCE MEASURE ON
r •VOWELS FOR THE VARIOUS DISTORTIONS USED IN THIS STUDY.
46
•-•., 4.---- BANDLIMIT ' •iF.n
cyG-
Lai
, O0)4- NOISE
LA
CuC
0 *
SAMPLE POINT
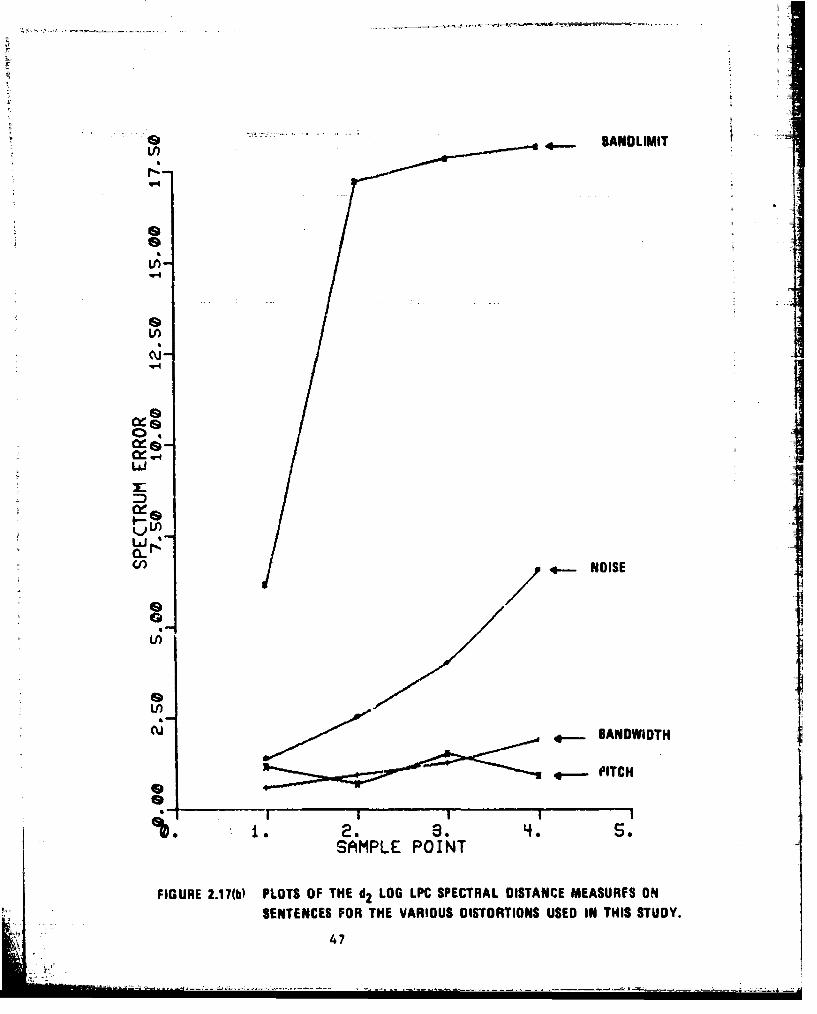
FIGURE 2.17(b) PLOTS OF THE d2 LOG LPK SPECTRAL DISTANCE MEASURFS ON
SENTENCES FOR THE VARIOUS DISTORTIONS USED IN THIS STUDY.1
~q47

SPECTRAL PITCH DIS'•RTIONDISTORTIONMEASURES 10,1 10,-i 4,1 4,-1
S1 LOG LPC AV. .071 .064 .073 .072C.. .03 .03 .04 .03
D2 LOG LPC AV. .079 .081 .076 .078C.I. .03 .03 .03 .03
D LOG LPC AV. .09 .092 .084 .0924
C.I. .04 .05 .04 .04
D 2 PARCOR AV. . 91 . 84 . 88 .G6•C.I. .06 .05 .06 .05
D 2 FEEDRACK AV. 82 87 83 89C.I. 48 51 530 465
CD2 AMRE AV. .91 .96 .01 8862!C.I. .21 .23 .20 .19
D2 POLE LOCATION AV. 2.1 2.0 2.2 2.3C.I. 1.10 1.02 1.05 .08
AV. - Average
C.I. - Confidence Interval (.05 Level)
Table 2.5 Results of thi Pitch Distortions on Vowels.Note that the Distortions are Low, and In-crease Distortions Cause No Increase in theMeasures.
48
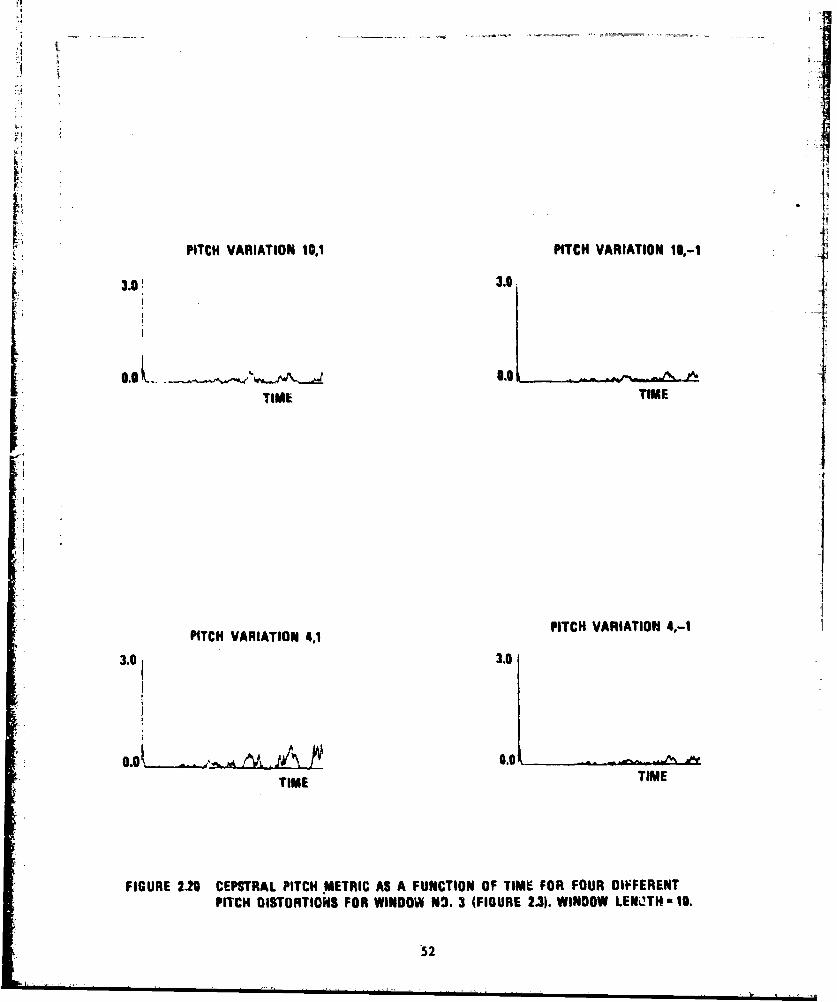
Si~1Since this was a time varying distortion, then the statistical
analy3is usei in the spectral distance tests is inappropriate. Figures
2.18-2.21 show the results for the four windows. The basic result
here is that this measure forms a high resolution measure of Fitch
errors. For short windows, the measure detects very small errors, but
saturates quickly, hence reporting the same result for all errors.
Longer windows do a better qualification of the pitch errors, but dc not
pick up small errors well. Probably, since most of the computation in
this measure is in the cepstrum calculation, a reasonable solution
would be to use several windows to better quantify the results.
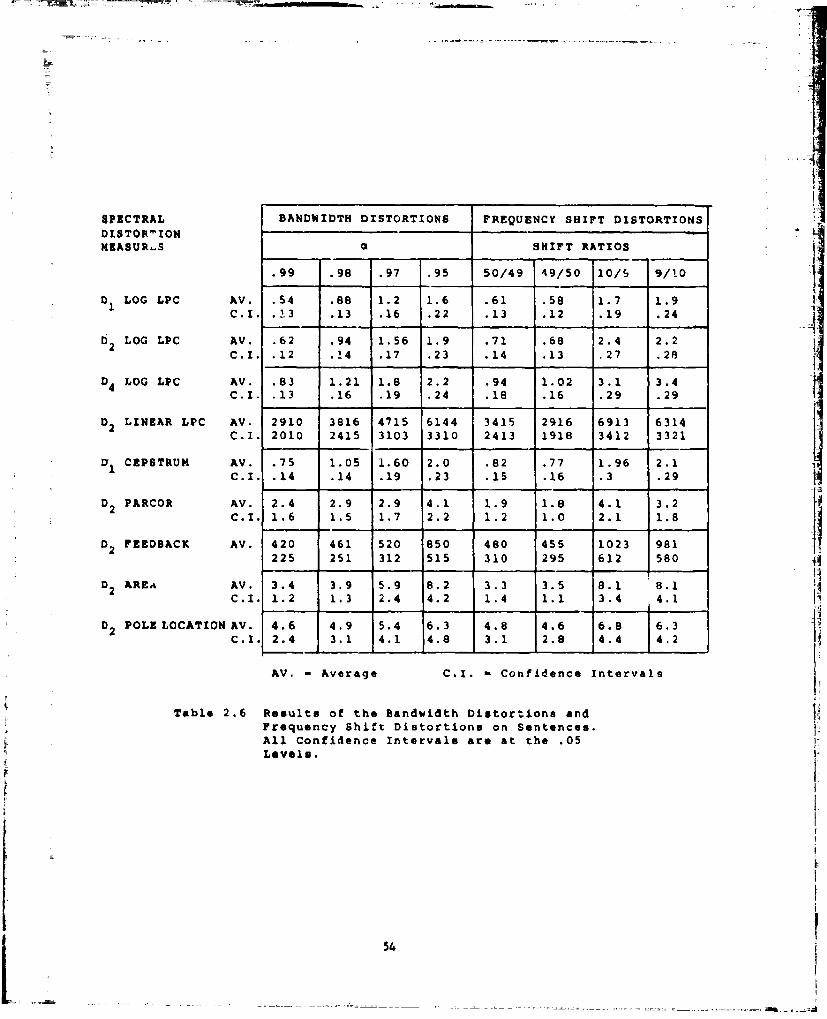
2.3.3.2 Results of the Sentence Tests
The results of the sentence tests are tabulated in Table 2.6,
2.7, and 2.8. Qualitatively, these results pretty well mirror the
results of the vowel tests. Quantitatively, however, the confidence
intervals are uniformly larger. The general result here, therefore, is
that larger sample sizes are necessary when dealing with real sentences.
An important result of the sentence tests can be seen from a
comparison of the gain weighted measures to the non gain weighted
measures, as shown in Table 2.9. In nearly every case, the gain
wuighting causes the measure tc decrease. This means the i-easure is
being inflated by the low power unvoiced regions which are perceptually
less important than the high vocalic regions. This means that gain
weighting probably will give better subjective correlation.
2.4 The PARM Correlation Study
As was stated in the introduction, the PARM subjective quality
data base offers a good chance to study the correlation between the
objective measures under consideration and the isometric stbjective
49

PITCH VAR'AT'ON 10)1 PITCH VARIATION 10,-i16.7
16.71
Q . - -A, Z O 9. - - - k'.',. .. 2 0zoo
TIME TIME
PITCH VARIATION 4,1 PITCH VARIATION 4,-I
116.7
10.7
TIME
FIGURE 1.13 CEPSTRAAL PITCH METRIC AS A FUJNCTION lIF TIME FOR FOUR
DIFFERENT PITCH DISTORTIONS FCR WINJOW NO. i (FIGURE
2.3). WINDOW LENGTH - I.
50

÷L
PITCH VARIATION 10,1 PITCH VARIATION 10,-1
3.0
0.0 2N8 0.0 2oTIME TIME.
PITCH VARIATION 4,-I
PITCH VARIATION 4,1
.- i I3.01I 3.0
0.01 203 O -201TIME TIME
FIGURE 2.10 CEPSTRAL PITCH METP.C AS A FUNCTION OF TIME FOR FOUR CIFFERENT
PITCH DISTORT40NS FOR WINDOW NO. 2 (FIGURE 2.3) WINDOW LENGTH - 4.
51
PITCH VARIATION 10.1 PITCH VARIATION 10,-1
3.0! 3.0
EIM T.IMEI I
TIME TIMEI
52
PITCH VARIATION 4,1 PITCH VARIATION 4,-I
3.0 3.0
TIME TIME
FIGURE 2.20 CEPITRAL PITCH METRIC AS A FUNCTION OF TIME FOR FOUR DIFFERENTPITCH DISTORTIONS FOR WINDOW N2. 3 (FIGURE 2.3). WINDOW LEN•2TH-10.
S~52

PITCH VARIATION 10,1 PITCH VARIATION 10,,1
3.01 3.0
TIME TIME
PITCH VARIATION 4,1 PITCH VARIATION 4,-i
3.0 3.0
TIME TIME
FIGURE 2.21 CEPSTRAL PITCH METRIC AS A FUNCTION OF TIME FOR FOUR DIFFERENT
DISTORTIONS FOR WINDOW NO. 4 (FIGURE 2.3). WINDOW LENGTH - 10.
53
SPECTRAL BANDWIDTH DISTORTIONS FREQUENCY SHIFT DISTORTIONSDISTORmIONMEASUR-S a SHIFT RATIOS
.99 .98 .97 .95 50/49 49/50 10/S 9/1O0
0 LOG LPC AV. .54 .88 1.2 1.6 .61 .58 1.7 1.9C.I. .13 .13 .16 .22 .13 .12 .19 .24
D2 LOG LPC AV. .62 .94 1.56 1.9 .71 .68 2.4 2.2C.I. .12 .14 .17 .23 .14 .13 .27 .28
O4 LOG LPC AV. .83 1.21 1.8 2.2 .94 1.02 3.1 3.4C.I. .13 .16 .19 .24 .18 .16 .29 .29
02 LINEAR LPC AV. 2910 3816 4715 6144 3415 2916 6913 6314C.I. 2010 2415 3103 3310 2413 1918 3412 3321
.1 CEPSTRUM AV. .75 1.05 1.60 2.0 .82 .77 1.96 2.1C.i. .14 .14 .19 .23 .15 .16 .3 .29
D 2 PARCOR AV. 2.4 2.9 2.9 4.1 1.9 1.8 4.1 3.2C.I. 1.6 1.5 1.7 2.2 1.2 1.0 2.1 1.8
D2 FEEDBACK AV. 420 461 520 850 480 455 1023 981225 251 312 515 310 295 612 580
D AREA AV. 3.4 3.9 5.9 8.2 3.3 3.5 8.1 8.1C.I. 1.2 1.3 2.4 4.2 1.4 1.1 3.4 4.1
D2 POLE LOCATION AV. 4.6 4.9 5.4 6.3 4.8 4.6 6.8 6.3C.I. 2.4 3.1 4.1 4.8 3.1 2.8 4.4 4.2
AV. - Average C.I. - Confidence Intervals
Table 2.6 Results of the Bandwidth Distortions andFrequency Shift Distortions on Sentences.All Confidence Intervals are at the .05Levels.
54

SPECTRAL BANDLIMIT DISTORTION NOISE DISTORTIONDISTORTIONMEASURES RANDLIMIT S/N
2.8 2.2 1.8 1.4 13 10 7 3
D I LOG LPC AV. 7.5 15.4 16.8 17.2 1.1 2.1 3.8 5.7C.I. 2.7 5.8 5.7 9.6 .51 1.2 1.7 2.6
D 2 LOG LPC AV. 6.1 16.3 16.9 17.5 1.2 2.4 4.1 6.6C.I. 1.3 7.2 7.1 9.2 .62 1.4 2.6 3.8
D4 LOG LPC AV. 8.4 16.2 16.8 17.5 1.6 2.9 4.7 6.3C.I. 1.5 6.8 7.5 8.2 .77 1.31 2.6 3.5
D2 LINEAR LPC AV. 8142 9317 9581 9721 4213 5176 6612 7123C.I. 2014 2713 2312 3140 2913 2310 3412 3731
D CEPSTRUM AV. 5.4 8.3 12.4 16.3 1.4 2.2 3.6 5.91 C.I. 1.3 2.2 3.1 4.4 .52 1.3 2.2 2.9
D 2 PARCOR AV. 7.1 8.3 8.9 9.2 6.2 6.7 7.7 9.-
C.I. 3.6 3.9 4.7 5.3 4.4 4.5 5.3 6.1
D 2 FEEDBACK AV. 1013 1314 1517 1712 823 941 1021 1313C.I. 712 692 851 1003 512 590 610 713
D2 AREA AV. 6.7 7.3 8.2 8.8 4.2 4.4 4.7 5.1C.I. 1.3 1.9 2.3 2.6 2.1 2.2 2.8 3.3
D POLE LOCATION AV. 7.2 7.7 7.5 7.8 6.3 6.7 6.8 7.22 C.I. 4.4 4.7 3.9 4.6 3.1 3.6 3.2 4.1
AV. - Average C.I. - Confidence Interval (.05)|ITable 2.7 Results of the Bandlimit Distortions and
Additive Noise Distortion on Sentences.All Confidence Intervals are at the .05Significance Level.
55 ii

SPECTRALDISTORTION PITCH DISTORTIONSMEASURES
10,1 10.-1 4.1 4,-l
D LOG LPC AV. 1.0 1.1 .90 .97C.I. .12 .31 .22 .24
D2 LOG LPC AV. 1.2 .63 1.5 .94C.I, .25 .11 .09 .10
D4 LOG LPC AV. 1.4 1.2 1.8 1.7C.I. .13 .15 .21 .19
D2 LINEAR LPC AV. 1041 981 1101 1315C.I. 512 412 520 640
D CEPSTRU1 AV. 1.3 1.4 1.5 1.4C.I. .04 .02 .03 .03
D2 PARCOR AV. 2.0 1.9 2.3 2.2C.I. .92 .82 1.1 1.4
D FEEDBACK AV. 310 412 391 3602 C.I. 240 270 210 170
DAREA AV. 2.6 2.4 2.8 2.7C.I. .62 .51 .83 .84
D POLE LOCATION AV. 3.8 3.9 4.2 4.02_
C.I. 1.8 1.9 2.4 2.6
AV. - Average
C.I. = Confidence Interval (.05)
Table 2.8 Results of the Pitch Distortion Study on Vowels.All Confidence Intervals are at the .05 Signifi-cance Level.
56I!
-. - 2 fU -~ - f

DISTORTION NON-GAIN WEIGHTED GAIN WEIGHTED
Bandwidth .99 .62 .38Bandwidth .98 .94 .67Bandwidth .97 1.56 1.64Bandwidth .95 1.9 1.51
Frequency Shift 50/49 .71 .37Frequency Shift 49/50 .68 .37Frequency Shift 10/9 2.4 1.92Frequency Shift 9/10 2.2 2.12
Bandlimit 2.8 kHz 6.1 4.3Pandlimit 2.2 kHz 16.3 12.4Bandlimit 1.8 kHz 16.9 14.7Bandlimit 1.4 kHz 17.5 16.8
Noise 13 db 1.2 .82Noise 10 db 2.4 1.81.Noise 7 db 4.1 3.6Noise 3 dB 6. 6 5.4
Iit!
Table 2.9 Comparison of Gain Weighted D2 Log LPC SpectralMetrics to Non-Gain Weighted D2 Log LPC SpectralMetrics.
57

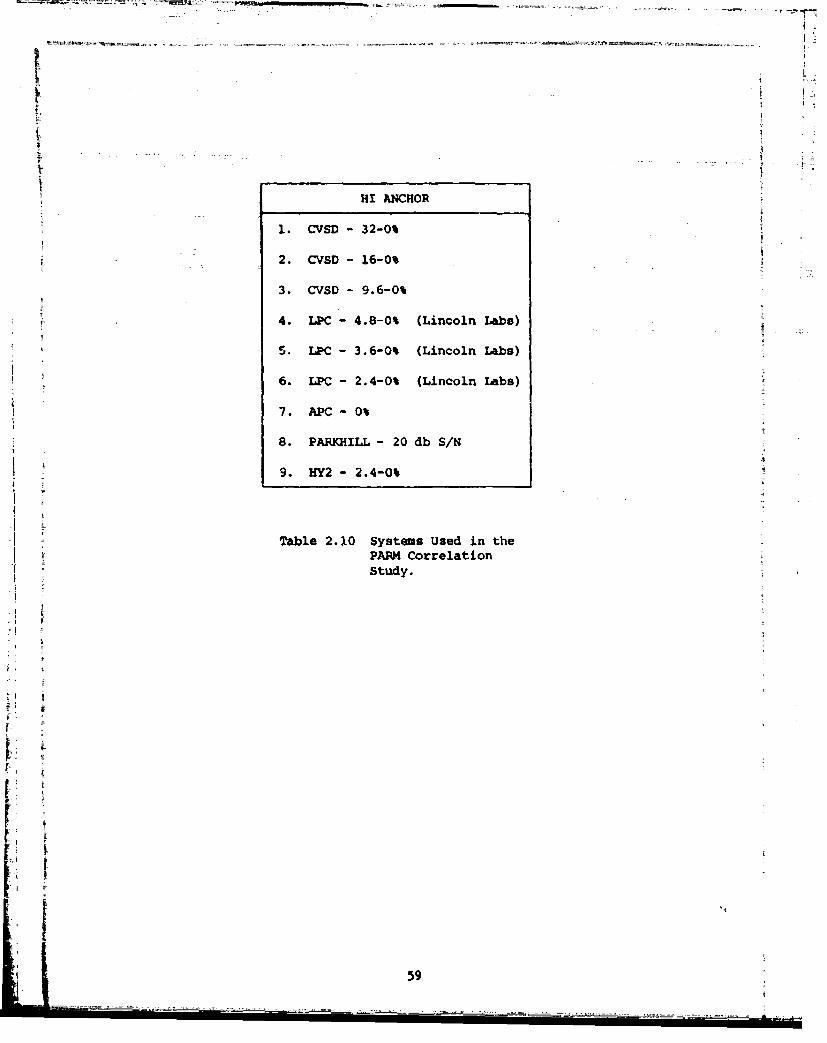
t results available from the PARM. Since many of the objective measures
Sunder study are computationally intensive, the computer time limited the
total number of speech digitization systems which could be used as part
of the study. In all, eight systems were studied, as shown in Table
: 2.10. These systems were chosen to (1) represent a cross-section of
speech digitization techniques, including waveform coders (CVSD), LPC's,
channel vocoders, and APC's, and (2) these systems overlapped with the
systems used in the development of a parametric quality test, called the
"QUART" Test (2.24]. This allows some minimal correlation studies between
th'. objective quality measures produced here and the parametric results
available from the QUART test.
2.4.1 The PARM Data Base
The PARM data base arrived at Georgia Tech as fourteen boxes of
cards, with control cards for processing under an IBM operating system.
Since correlation studies require many accesses of the data base, and
since the accesses are random, a linear data base such as that repre-
sented by the cards is unacceptable. An acceptable data base organiza-
tion must (1) be stored in numeric (two's complement) form rather than
character form, and (2) must be accessable by some coding scheme which
does not require the linear searching of the disk based data. To do
this, the system of Figure 2.22 was developed. In this system, a
"MAIN DATA FILE" was organized in which each set of responses for each
subject is allocated a direct accessable block of 64 sixteen bit words,
60 for the subject's responses and four for a label. To go with this
main file, four "POINTER FILES" wfre developed. The first pointer file,
the *PARM IDENTITY FILE," as an entry for each PARM giving basic PARM
data, such as systems involved, soeikers involved, and pointer to the
main data file. The second pointer file, the "SPEAKER FILE," has
58
[ 'I.
k1
HI ANCHOR
1. CVSD - 32-0%
2. CVSD - 16-0%
3. CVSD - 9.6-0%
4. LPC- 4.8-0% (Lincoln Labs)
5. LPC - 3.6-0% (Lincoln Labs)
6. LPC - 2.4-0% (Lincoln Labs)
7. APC - 0%
8. PARKHILL - 20 db S/N
9. HY2 - 2.4-0%
"Table 2.10 Systems Used in thePARM CorrelationStudy.
L5I,i-o•::•59

MAINPOINTERPARM
DATAFILE4
(S0 RESPONSESPER RECORD)
SUBJECT
IPOINTERIFILE
ACCESS Li SPEAKER ______
PO INTER
IL-LILFIL
60
information for each speaker as to where each PARM involving that speaker
is located. The third file, the "SUBJECT FILE" contains a list, by
subject, of where each of that subject's responses is located. The
last pointer file, the "SYSTEM ZILE" contains, for earh system, the
location of all that system's subjective data.
The idea behind this organization is that, by presorting on the
information of potential data subsets of interest, the average access
time for a particular statistical measure can be greatly reduced.
Hence, a statistical program need only search the much smaller pointer
fileR for information rather than searching the whole data base.
Further, since within each pointer file the data is ordered by increasing
PARM number, then only a minimum number of accesses of the main data
file are necessary on a particular run.
Two things should be noted about this data base organization.
First, the presorting of this data iu a non-trivial computational task,
involving many hours of computer sorting. This data base itself,
therefore, is an important output of this effort, and may be used in
the future for many classes of studies. Second, due to time constraints,
DCEC was unable to make available enough information concerning the
PARM data to take full advantage of this dasta base. Hence, the
statistical resolving power afforded by this data base is better than
that achieved by this study. Details of how the analysis could be
improved is given later in this section.
2.4.2 The Statistical Analysis
The objective measures used in this study are shown in Table
2.11. The measures involved are essentially all the spectral distance
measures used in the controlled distortion study (Section 2.3) plus
61

1. D1 LOG LPC
2. D1 LOG LPC GAIN WEIGHTED
3. D2 LOG LPC
4. D2 LOG LPC GAIN WEIGHTED
5. D4 LOG LPC
6. D LOG LPC GAIN4
7. D2 LINEAR
8. D2 LINEAR GAIN WEIGHTED
9. D1 CEPSTRUM
10. D1 CEPSTRUM GAIN WEIGHTED
11. D2 PARCOR
2
12. D2 FEEDBACK
214. D 2 POLE LOCATION
15. D2 ENERGY RATIO
Table 2.11 Objective Measures Used in thePARM Correlation Study.
62
one additional measure which has had some attention in the literature
12.38].
The speech data used for this study was twelve sentences for
each of two speakers (LL and CH) for each of the systems of Table 2.11.
After the measures were applied, the statistical analysis performed was 4identical to that done for the controlled distortion tests.
In the correlation study, the categories recognized were
"SUBJECT" and "SPEAKER." if the information had been available as to
exactly which sentence was involved in which PAPM, then "SENTENCE"
could have been a category, increasing the degrees of freedom by
approximately a factor of nix. The correlation coefficients calculated
were from
; subjects speakers systems
where
•!, ~ ~xa-XsDa
Ha -a 2.26
S D
where "a" is the condition including subject, speaker, and system, D
is the distortion measure for that system, D is the estimate of D, X? - a
is the subjects response to condition "a", X is the average response
for that subject over all systems, a is the sample standard deviation
for the subject "a," and OD is the sample suandard deviation for the
objective distortion measures.
In order to understand how these results are tabulated, it is
first necessary to understand how results from the objective measures
can be used to predict results from subjective tests.
L - 63

The most. straightforward way of deriving an k.stimate of the
subjective quality is now given. Since both the subjective and objec-
tive measures for quality are means of a large number of independent
estimates, then their marginal probability distribution functions are
asymptotically normal, and, by the Bivariate Central Limit theorem,
the joint probability distribution function is given by the aivariatte
normal distribution.
4f(X,D) exp 2p (X-X) (D-D) D 2
f(________ +x )(-) F1],
2v xoaD -p 2 21-p2) x X D D
2.27
where X is the subjective measure, 0 is the objective measure, a is the
variance of the subjective measure, oD is the variance of the objective
measure, and p is the correlation coefficient. For this case, the
minimum variance unbiased estimator of X from D is given by
X - X + (D-D) 2.28
where the variance of this measure is given by
E(X - E(XID))2 - o211 - p 2 2.29
If X, D, ax, , and p were known, this problem would be solved, since
this is enough information to calculate confidence intervals on X or to
do nu.l hypothesis testing between systems. However, estimates forr . ^A
these qu&ntitiez, called X, D, Ox, aD, arn p, must be used instead,
and these quantiti.e are random variables thamselves. Hence, the p.d.f.
(Probability Dietribution Function) is no longer normal, and is, in
61,

general, very difficult to calculate in closed form.
However, considering the problem from the point of view of
regression analysis theory offers additional information. The form of A
the linear regression escimation is given by
x 1 -0 B2D 2.30
From the Gauss-Markov Theorem (2. 401, the least squ..res estimate is the unbiased
minimum variance estimate for X, and for this case (this is really an
LPC analysis)
N N N
" j-1 Ja J- x2 .. 2.31
jL 2_ D Dj=l jul
and
N N PCXD 2.32"N 51 1 -x- i DJ1- 1 X.1 - X
Two points should be made here. First, these results show that the
minimum varianceunbiasedestimator of X from D is gotten by using the
minimum variance unbiased estimations for D, XP 0), 0D, and P in
Equation 2..28. Second, it should be noted that under a mild set cf
conditions easily met by the tests here, that tour conditions hold:
(1) a minimum variance unbiased estimate for Y2X, the variance in our
approximation of the subjective quality, is given by
;2 1 N A2X N-2 (X 0 - 2 D 2.32jl
65
&

(2) minimum variance unbiased estimates for the variance in 81 is
given by
"2a, a 2 + ) 1 2.33
X N N~i-i
2^
(3) a minimum variance unbiased estimate for the estimate for 82 is
given by
-2a
2 N. 34
S(X.-X)j21
and (4) the estimates for 81 and 8 (a and 8 are normal distributed,1 2 1 2
2 2o'2 2 2 2 2formed from a/a a- /Qa , and ? /ao are X distributed, and all five
estimates are independent. These four points qive all of the statisti-
cal power necessary to do all the hypothesis testing and confidence
interval estimation which is normally associated with statistical
testing and estimation. For example, if a confidence interval for 1
was desired, it is only necessary to note that (5I- 81 /a^) is t
distributed, and the confidence interval is given by
-1 UaI - L N 2.35U u(N-2) 1 1 (N-2)
where U N 2 and L are the upper and lower significance limits for
a t distributed (W - 0, a - 1) for N-2 degrees of freedom and probability
t Ca.
There axe really two questions which these tests seek to answer.
66
-- Sy

First, assuming that the estimates we have for correlations, means, and
variance are exactly correct, what would then be the confidence intervals
on our estimates of X? This question seeks to ascertain the potential
of the objective measures used here to predict subjective results.
Second, considering all the distorting factors in our aiialysis, especial-
ly our errors, in estimating 81 and 2S what then -s the resolving power
of our test? These questions addresc the usable resolving power of
subjective acceptability estimates based on the analysis performed so
far. The answer to the first question can be addressed by applyinj
equation 2.29 to the estimate of the correlations equation 2.25) of
the correlation coefficients. The answer to the second question can be
ohserved by applying equation 2.32 to the data.
2.4.3 The Experimental Results
The correlation studies described above were carried out cn
three sets of the data: all the systems; only the vocoder systems
(LPC and channel vocoders); and only the waveform coders. The restvIts
for the three studies are given in Tables 2.12, 2.13, and 2.14,
respectively. Several points should be made here. First, the correla-
tion coefficients for a number of measures are quite high, some as high
as .83. The "BEST" measures seem to be gain weighted spectral distance
measures, as expected. Second, however, note that the estimated
standard deviations are somewhat larger than desirable. This indicates
that more data should be used to better establish these results. Third,
note that m.ch better results are obtained for the small subclasses than
for the whole. This indicates that these measures work best if the
systems being tested are preclassified acclrding to the type of
distortion expected.
S67
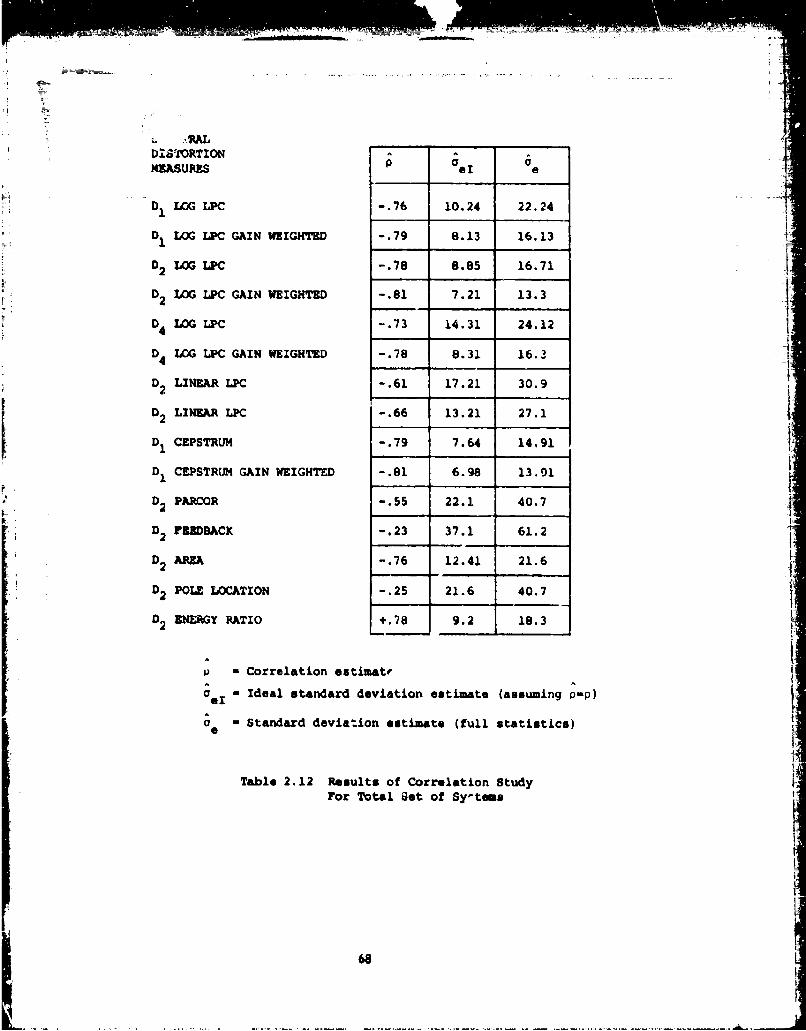
M.URES eI e
D LOG LPC -. 76 10.24 22.24
D LOG LPC GAIN WEIGHTED -. 79 8.13 16.13 '
02 LOG LPC -. 78 8.85 16.71
DLOG LPC GAIN WEIGHTED -. 1 7.21 13.32
D LOG LPC -. 73 14.31 24.124 _ _
D4 LOG LPC GAIN WEIGHTED -. 78 8.31 16.3
D LINEAR LPC -.61 17.21 30.92
DLINEAR LPC -.66 13.21 2
D1 CEPSTRUM -. 79 7.64 14.91
D1 CEPSTRtJN GAIN WEIGHTED -. 81 6.98 13.91
D PARCOR -. 55 22.1 40.7
D 2 FEEDBACKC -. 23 37.1 61.2
D2 AREA -. 76 12.41 21.6
D POLE LOCATION -. 25 21.6 40.72r
D2 ENERGY RATIO +.78 9.2 18.3
- Correlation estimate
e.1 - Ideal standard deviation estimate (assuming pap)
ae = Standard deviation estimate (full statistics)
Table 2.12 Results of Correlation StudyFor Total get of Sy-teme
68
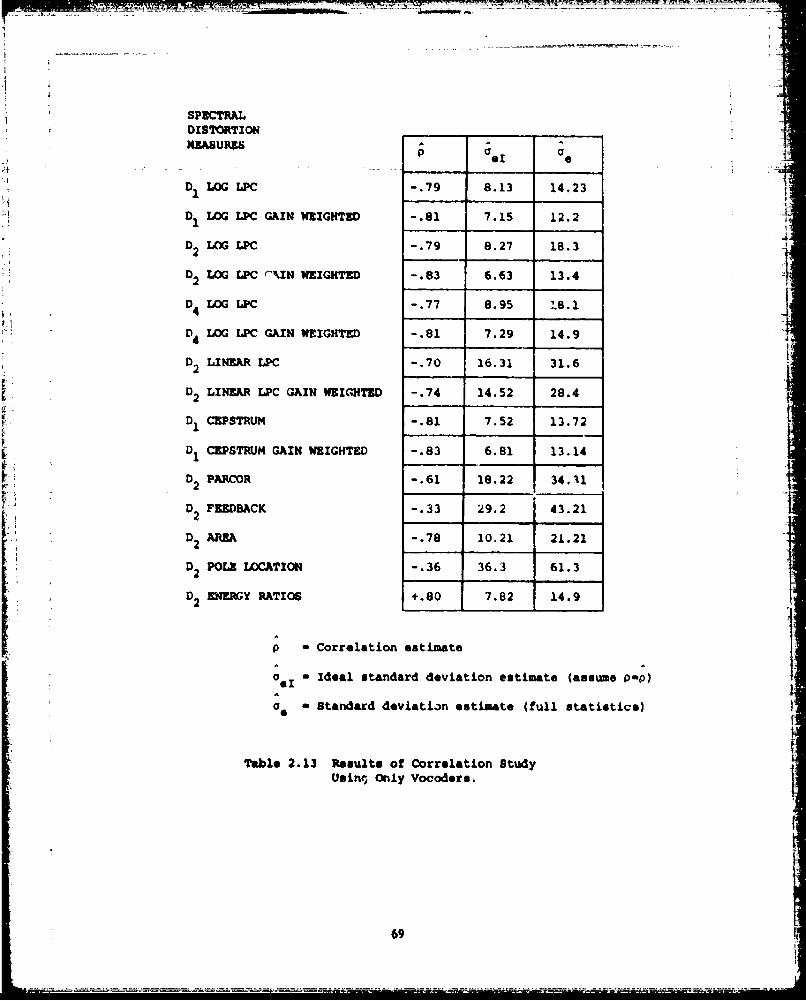
SPECTRALDISTORTION _
MEASURES pa
D1 LOG LPC -. 79 8.13 14.23 _
D1 LOG LPC GAIN WEIGHTED -. 81 7.15 12.2 1i
4•D2 LOG LPC -. 79 8.27 18.3 4
D2 LOG LPC rIN WEIGHTED -. 83 6.63 13.4
D LOG LPC -.77 8.95 ie1
D4 LOG LPC GAIN WEIGHTED -. 81 7.29 14.9
D2 LINEAR LPC -. 70 16.31 31.6
2 LINEAR LPC GAIN WEIGHTED -. 74 14.52 28.4V2
D CEPSTRUM -. 81 7.52 13.72
1 CEPSTRUM GAIN WEIGHTED -. 83 6.81 13.14
D PARCOR -. 61 18.22 34.41
D2 FEEDBACK -. 33 29.2 43.21
D2 AREA -. 78 10.21 21.21
D POLE LOCATION -. 36 36.3 61.3
D2 ENEMY RATIOS +.80 7.82 14.9
p - Correlation estimate
a - Ideal standard deviation estimate (assume P-p)
as - Standard deviation estimate (full statistics)
Table 2.13 Results of Correlation StudyUsinci only Vocoders.
69

SPECTRALDISTORTIONMEASURES
p .
D LOG LPC -. 79 8.23 14.12
D LOG LPC GAIN WEIGHED -. 80 7.91 13.98
D2 LOG LPC -. 78 9.41 18.91
0 D LOG LPC GAIN WEIGHTED -. 82 6.78 12.21 ••
D4 LOG LPC -. 76 12.2 24.31
D4 LOG LPC GAIN WEIGHTED -. 80 7.98 18.32
D2 LINEAR LPC -. 73 14.23 29.31
D2 LINEAR LPC GAIN WEIGHTED -. 75 12.9 76.21
D CEPSTRUM -. 79 9. 2?. 16.51 jDl CEPSTRUM GAIN WEIGHTED -. 81 6.91 12.91
D2 PARCOR -. 58 27.4 42.95
D2 FEEDBACK -. 21 40.2 51.2
D2 AREA -. 74 18.4 40.91
D2 POLE LOCATION -. 31 29.6 51.9
D2 ENERGY R.'IO +.76 16.3 33.6
p - Correlation estimate
0o - Ideal standard deviation estimate (assuming p"p)
as Standard deviation estimate (full atati3tics)
Table 2.14 Results of Waveform Coder UsingOnly Waveform Coders
70
• ' . ' --- •- i-,- - = I- i - -I -I I. I= I- I I r.- --- • - i -
These are certainly encouraging results. With measures as
highly correlated as these, there is good expectation of creating a
viable objective quality test. However, the relatively large estimated
standard deviations in the estimates which include all statistics
indicate more data must be processed to increase the resolving power
of these tests to a maximum.
2.5 Summary and Areas for Future Research
The major results of this study can be summarized as follows.
(1) A number of objective quality measures, particularly
spectral distance metrics, offer considerable promise in predicting
subjective quality results.
(2) Some of the measures tested are clearly better than the
others. The best are the gain weighted D2 log LPC spectral distance
measure and the gain weighted cepstral measure. These two measures
are highly correlated with each other (2.35).
(3) Several measures do consistently poorly. Two of these are
the D2 feedback coefficient measure and the D2 pole location measure.
The pole location measure would probably improve if some sort of formant
extraction wai attempted.
(4) The D 2 area measure did quite well. This is interesting
since it is so computationally compact.
(5) Gain weighting gave a slight, but consistent, improvement
in the subjective-objective correlations.
(6) Based on the values of p obtained in this rtudy, the
potential for using several of the measures for prodictinI subjective
scores is good. However, it should be noted that, even if p-p, the
resolving power of these tests falls short (by approximately a power
of 2-2.5) of the subjective tests themselves. However, subjective and
71
objective measures may be combined to improve resolution. This in
easily done so long as the number of subjective tests used warrants t•s
use of the Bivariate Normal Distribution.
(7) The resolving power of the actual tests which resulted from
this study are nowhere near as good as the "potential" resolving power.
This is because the resolving power of the tests in this study on p
was not good enough. This could be improved by doing a lower level
correlation between a subject's response and the objective measure for
the exact sentence used, and by using a larger protion of the PARM data
base as part of the study. It should be noted, however, that although
it is interesting to speculate on the improvement in the etimates of
p that further testing would accomplish, no results should be assumed
until the testing is complete.
The results of this study offer a number of areas fox futur "
rehearch. Some of these are listed below.
(1) An obvious extension to this study would be to t~nJ the 1portion of the PARM aita base used in this study. This might well
improve its esti%.,UAs for P.
(2) Statistically improved results may also obviously be
obtained by finding measures which are more highly correlated with sub-
jective results. One approach is to simultaneously attempt to better
understand the parametric factora involved in human quality acceptance.
as has been attempted in the "QUART" and "DAM" tests, and to develop
objective measures which are highly correlated with the important
parametric subjective measures.
(3) Improvements are possible in the particular objective miasures
used in the correlation studies. For example, Makhoul (2.131 suggests
several forms of frequency weighting in LPC spectral distance measures
which might be used to imorove subjective-objective correlation.72

REFERENCES
12.11 "The Philosophy of PCM," B. M. Oliver, J. R. Pierce, and C. E.Shannon, Proceedings of The IRE, 1948.
[2.2] "Adaptive Quantization with a One Work Memory," N. S. Jayant,Bell Sys. Tech. J., vol. 52, 1973.
[2.31 "Digital Coding of Speech Waveforms: PCM, DPCM, and DMQuantizers," N. S. Jayant (Proceedings of the IEEE, May 1974).
[2.41 "Design and Implementation of an Adaptive Delta Modulator,"N. S. Jayant, P. Cummiskey and J. L. Flanagan (ProceedingsIEEE Int. Conf. Speech Communication, Boston, MA, April 1972).
[2.5] "Adaptive Delta Modulator with a One-Bit Memory," N. S. Jayant,Bell Sys. Tech. .. , vol. 49, March 1970.
[2.61 "Minimum Mean-Squared-Error Quantization in Speech PCM andDPCM Systems," M. D. Paeb and T. H. Glisson (IEEE Transactionson Co•munications, April 1972).
[2.7] "Adaptive Differential PCM Speech Transmission," T. P. Barnwell,A. M. Bush, J. B. O'Neal, P. W. Stroh, RADC-TR-74-177. FinalReport, July 1974.
[2.8) "Adaptive Predictive Coding of Speech Signals," B. S. Atal andM. R. Schroeder (Bell System Technical Journal, October 1970).
(2.91 "Adaptive Transform Coding of Speech," Peter Nell, PersonalCommunication.
[2.10) "Adaptive Predir-tive Speech Coding Based on Pitch-ControlledInterruption/Reiteration Techniques," A. H. Frei, H. R. Schindler,and E. von Felten (Conference Record, 1973 IEEE InternationalConference on Comnmunications, June 1973).
(2.11] "Speechi Analysis and Synthesis by Linear Prediction of theSpeech Waveform,," B. S. Atal and S. L. Hanauer, J. Acoust.Soc. Amer., vol. 50, 1971.
12.12] "Analysis Synthesis Telephony Based on the Maximum LikelihoodMethod," F. Itakura and S. Saito, Proc. Sixth Int. Congr.Acoust., 1968.
(2.131 "Linear Prediction. A Tutorial Review," J. Makhoul, Proc.IEEE, vol. 63, 1975.
12.14] "Remaking Speech," H. Dudley, J. Acoust. Soc. Am., vol. 11, 1939a.
12.151 "Dynamic Encoding as Applied to a Channel Vocoder," IEEE Trans.Comm. Syat., vol. 11, 1943.
73t

(2.16] "Phase Vocoder," .. L. Flanagan ai.d R. M. Golden, Bell SystemTech. J., vol. 45, 1966.
[2.171 "Application of Digital Signal Processing to the Design of aPhase Vocoder," R. W. Schafer and L. R. Rapiner, 1972 Conf.on Speech Communication and Processing, 1972. ,
(2.181 "A Speech Analyzer and Synthesizer," W. A. Munson and H. C.-/ Montgomery, JAS_._A, Vcl. 22, 1950.
(2.191 "Computer Simulation of a Format-Vocoder Synthesizer," JASA,Vol. 35, 1962.
[2.20] "Speech Analysis-Synthesis System Based on Homomorphic Filtering,"A. V. Oppenheim, JASA, Vol. 45, 1969.
(2.21] "Homomorphic Analysis of Speech," A. V. Oppenheim and R. W.Schafer, IEEE Trans. Audio and Electro Acoust., AU-16, 1968.
[2.22] Speech Analysis, Synthesis, ar , rcettion, J. L. Flanagan,Springer-Verlag, 1972.
[2.23] "Research on Diagnostic Evaluation of Speech Intelligibility,"Final Report AFSC No. F19628-70-C-0182, 1973.
[2.24] "Methods of Predicting User Acceptance of Voice CommunicationsSystems,' W. D. Voiers, Final Report DCAl00-74-C-0056, July 1976.
[2.25] Digital Signal Processing, A. V. Oppenheim and k. W. S'-hafer,Prentice-Hall, 1975.
[2.261 Theory and Applications of Digital Signal P-.ocessing, L. R.Rabiner and B. Gold, Prentice-Hall, 1975.
[ 2.271 Sound Patterns of English, N. Chomsky and H. Halle, Haper zi Row,New York, 1968.
12.281 "Speech Synthesis by Rule," J. N. Holmes, I. G. Mattingly, andJ. N. Shearme, Language and Speech, vol. 7, 1964.
(2.291 "Speech Synthesis by Rule: A Acoustic Domain Approach," L. R.Rabiner, Bell System Tech. J., vol. 47, 1968.
(2.30] "On Vowel Durations in English," A. S. House, JASA, vol. 33,1961.U
[2.31] "Duration and Intensity ARS Physical Correlates of LinguisticsStress," JASA, '?ol. 27, 1955.
12.321 "Acoustical Correlates of Stress," J. Morton and W. Jassem,vol. 8, 1965.
[2.331 "The Quefrency Analysis of Time Series For Echos," B. P. Bogart,M. Healy, and J. W. Tukey, Proc. Symp- Time Series Analysis, 1963.
74
W;

(2.34) "Echo Removal by Generized Linear Filtering," R. W. Schafer,IEEE hLREM Record, 1967.
12.35 "Distance Measures for Speech Processing," A. H. Gray, Jr., andJ. D. Markel, IEEE Trans. ASSP, vol. 24, 1176.
(2.361 "Pitch and Voicing in Speech Digitization," T. P. Barnwell,J. E. Brown, A. H. Bush, and C. R. Patisaul, DCA Re3earchReport No. E-21-620-74-BU-l, August 1974.
[2.37] "Nonrecursive Digital Filter Design Using the .jO-SINH WindowFunction," J. F. Kaiser, Proc. 1974 IEEE Sym. Cir. and Sys., 1974.
(2.381 "Minimum Prediction Residual Principle Applied to SpeechRecognition," IEEE ASSP, vol. 23, February 1975.
(2.391 "Towards Perceptually Consistent Measures of Spectral Distance,"J. Makhoul and W. Russel, 1976 IEEE Int. Conf. on Acoust., ISpeech, and Signal Processing, 1976.
[2.40] Mathematical Statistics, Samule S. Wilks, John Wiley, 1962.
I
7
' 75
CHAPTER 3
SUBJECTIVE PREDICTION OF USER PREFERENCE
3.1 Introduction
A crucial issue in the design and implementation of a digital
voice communication system is the prediction of user acceptability.
Even if the many other system design criteria are resolved and a good
engineering solution found, the system will foil unless people use it.
People will use it only if they find it highly acceptable on the basis
of their current telecommunicaAons alternatives.
Speech testing has been categorized as quality testing or
intelligibility testing. The term preference testing or acceptability
testing really supercedes both terms, not as a replacement for either,
but as a combination of the essential features of each. That is,
preference is assumed to be based on a sufficient combination of quality
and intelligibility to determine reiative user acceptability. It must
be recognized here that 100% intelligibility may be yet of unacceptable
quality and hence of low preference, Just as pleasant but unintelligible
speech is of low preference.•Just as with qunlity and intelligibility testing, preference
testing can be implemented with a wide variety of strategies or
methodologies. The test may be subjective, objective, parametric,
isometric, based on absolute or relative scales, with an infinite
variety of organizations. Fortunately, much work has been done in the
testing of speech, so that we do not need to begin from scratch.
In this chapter we will consider subjective testing. Objective
__ __76
testing, another phase of this effort, is considered in Chapter 2.
3.2 Subjective Testing Philosophies
Subjective testing procedures are based on drawing from a
population of potential system users, i.e. subjects their reaction to
the speech produced by a digital speech transmission system. These A
reactions must be quantified somehow and are then averaged, or processed,
according to established statistical principles to arrive at a measure
of user acceptance or preference. The basic testing philosophies can
be listed as follows:
Iso-Preference Testing - involves the use of a known, agreed
upon reference signal condition for use as a comparison in judging an
unknown. The agreed upon conditioning must be parameterized so that
the unknown or test signal can be found equally acceptable to an
adjustment of the parameter set. This procedure then yields the
judgement that a given signal is as acceptable as some reference
condition.
Relative Preference Testing - involves comparisons, done inde-
pendently, with each of several reference conditions. The reference
conditions are used to establish a scale of preference, and an unknown
signal can then be ranked on this scale. The subjective scale of the
references must be agreed upon a priori.
Absolute Preference Testing - methods require the suhjects
performing the test to give an absolute numerical evaluation to the
properties described in the test format. Properties tested can be
selected to describe various features of interest.
77

Isometric Testing for user preference calls for a direct evalu..
tion of preference from the test subjects. Each subject makes his
evaluation aga.Lnst the background of his total experience and personal
biases, and including any local or instantaneous bias with fatigue or
icritability effects built into his response.
Parametric Testing ask3 the test subject to make judgements with
reapect to specific features of the speech signal under consideratio.n.
The test format has then the flexibility of later weightings cf feature
judgements to achieve a measure of acceptability which is mtre independent
of the individual subject's biases. The appropriate weightirags must be
agreed upon in the final resolution of test data however.
The most recent application of these philosophies has res Ited
in the PARM test and the QUART test (3.1] and more recently in the DAM
test (3.23.
* In the PARM test (Paired Acceptability Rating Method) an iso-
I - metric approach is used. However, since systems being tested are
. !presented to the subjects in a carefully chosen ordering, paired
comparisons can be abstracted from the test results or on a posteriori
basis. To reduce the effects of extremes of responses tipical in
isometric testingJ, the listerns are asked to judge: two reference or
anchor conditions, one "good" and one "bad" anchcor. Anchor responses
are then used to normalize other responses within and across listeners.
Details of the testing orghnization and exhaustive analysis of results
are found in (3.11.
In the QUART test (Quality Ac. )tanc- Rating Test) the parametric
philosophy is followed, with an isometric measure of overall acceptability
78
included as well. The listener is asked to score each systera under
test with respect to a family of features ana to give his overall reac- U
tion. Extensive analysis of this approach is also well documented [3.11.
An outurowth of the background of subjective testing of speech
in general and of experience with PARM and QUART in particular, after
substantial further requirement in the choice of a family of teatures to ti
use in direct response solicitation, is the DAM test (Diagnostic
Acceptability Measure).
The DAM test acquires ratings on perceptual features which have
been selected after extensive experience with QUART as those features
closely correlated with overall acceptability, nearly orthogonal to each
other, and directly relateu to specific system functions or to system
operating environment conditions. Tn addition, the feature set thus
extracted is small enough to a] low efficient and reesonable subjective
testing to be accomplished. The DAM test is still evolving, but is
nearing a final forn. Although it is not yet documented in the litera-
ture, the test has been the subject of substantial interaction between
the speech research group at Georgia Tech arid the group at Dynastat.
These discussions have been conducted in visits by A. M. Bush and T. P.
Barnwell to Dynastat and by W. D. Voiers to Ceorgia Tech. A detailed
description of the DAM test is included as Afpendix A of t .. sport.
3.3 Statistical Testing Procedures
In subjective testing, as mentioned earlier, an essential aspect
of the test implementation is the statistical processing of the data,
i.e. responses from listeners or subjects, to obtain an average rating
cf the system or system feature under test. Even though the field of
29
statistics is well documented, both in the scientific literature and in jtextbook and reference book formats, it is our feeling that sol'. expo-
sition here may be worthwhile. Our point of view (necessarilyi) is
that of the communications engineer with a background in probability,
random variables, and stochastic processes, who feels he should there-
fore know all about statistics until he reads a little in the area.
In order to apply statistics to the results of subjective testing,
one must either base the statistics on assumptions regarding the under-
lying distributions of the individual listener revponses, the parametric
approach, or assume that these underlying distributZlns are unknown and
work within, for example, ranking statistics, the nonparametric approach.
The parametric approach is treated from a theoretical approach in many
places: our favorites are Wilks [3.3 1, and Cramer ( 3.4]. The non-
parametric approach is also extensively treated, but our favorite here
is Hajek [ 3.5]. For applications with a minimum of theory, a good [
reference among a great many possible choices is Winer (3.6 1 or S.legel
(3.71 for parametric or nonparametric tests, respect-ively.
In the parametric approach, the most common assumption regarding
the distribution of the listener responses is that they are all
Gaussian. Hypotheses with respect to comn•on means and/or variances
under test conditions can then be set up and inferences drawn by
comparisons with standardized tables.
3.3.1 Distributions
The key distributions are summarized below for convenience.
t
80
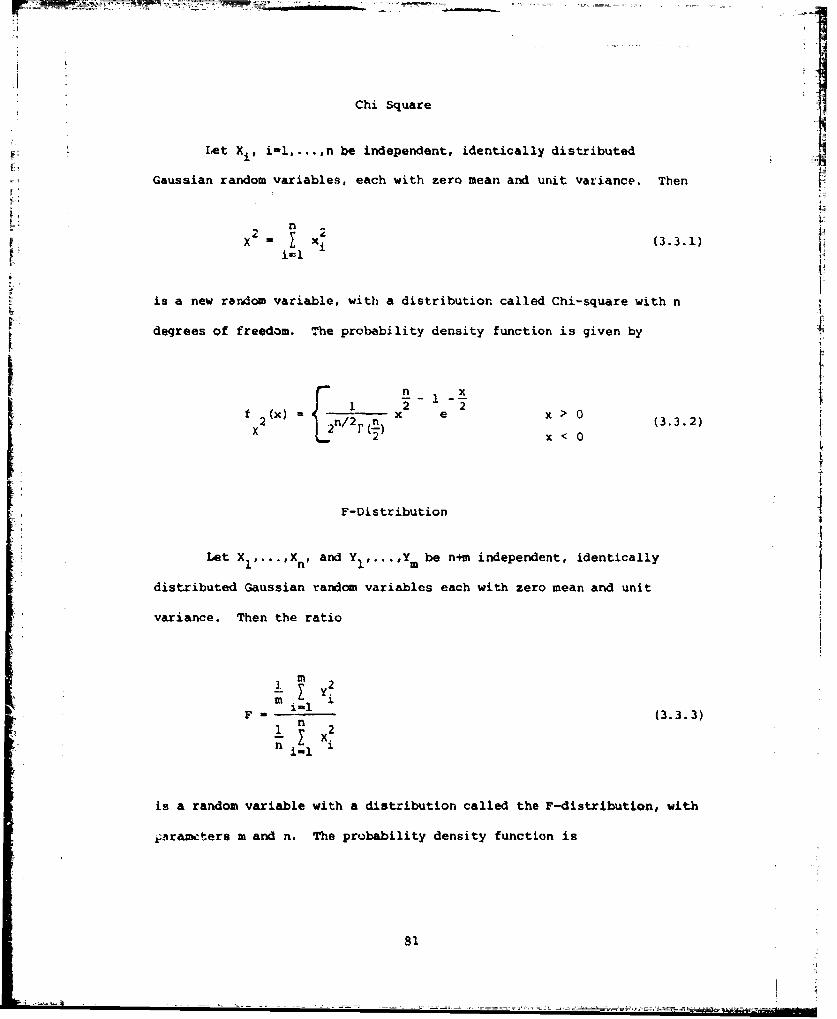
Chi Square
let X!, i i-.... ,n be independent, identically distributed
Gaussian random variables, each with zero mean and unit variance. Then
ntn x (3.3.1)
is a new random variable, with a distribution called Chi-square with n
degrees of freedom. The probability density function is given by
7Ff x e x ý
2 = n/2r0 (3.3.2)x x < 0
F-Distribution
Let Xt...rX and Y s:iy be n+m independent, identically
distributed Gaussian random variables each with zero mean and unit
variance. Then the ratio
i M1(3.3.3)1 n x2
-1
is a random variable with a distribution called the F-distribution, with
,parameters m and n. The probability density function is
81

_ 'Ir An m- I n m+n
2 () 2" ( mx 2
fF Ix) -,r~ 2 ~) <
0 x(<35
S~Student' a Distribution
Let Xs aXno ... i an be independent identically distributed Gauesian
random variables each with zero mean and unit variance. Let
t = (3.3.5)
r(n
_2n ix
Then t is a random variable which has a distribution called the Student's
distribution with parameter n. The probability density function is
2~ n+lft x 1 2 a•! + 2--
t r1-7 + R--n (3.3.6)
Studentized Range Statistic
Let Xl,... ,Xk be independent identically distributed Gaussian
random variables each with zero mean and unit variance. Define a
random variable Z as
82
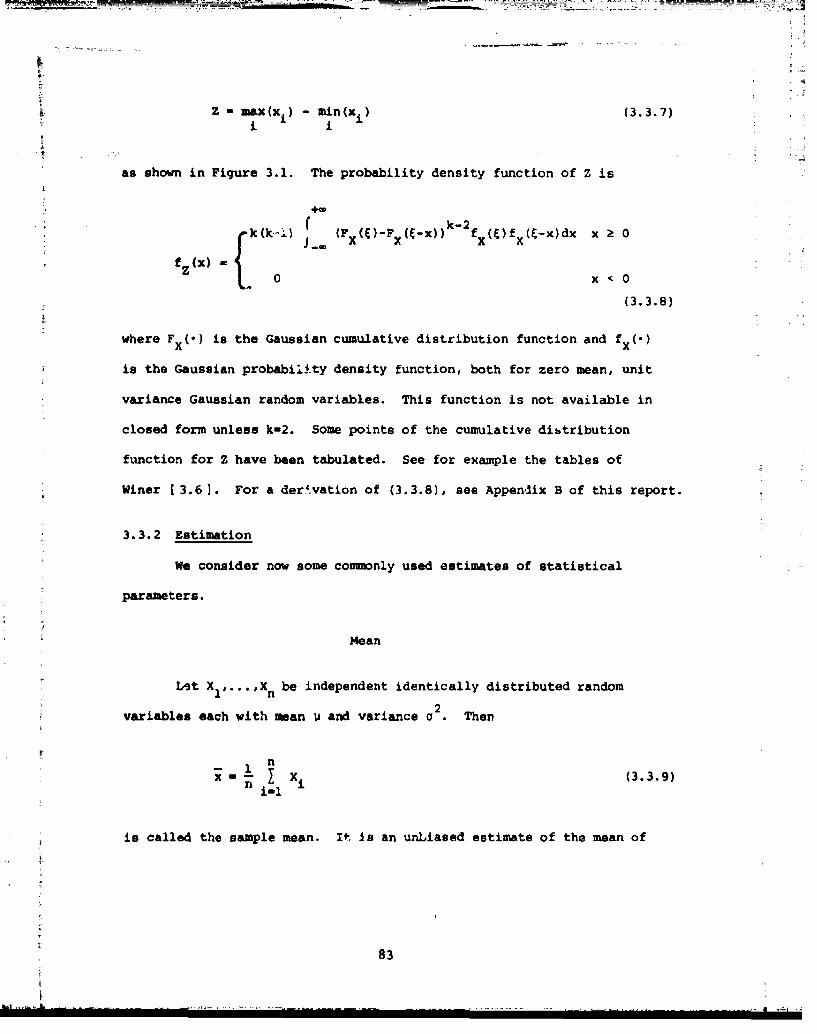
Z - max(xi) - min(xi) (3.3.7)
i i
as shown in Figure 3.1. The probability density function of Z is
I' k-2k(k*--)2 (Fx(0)-FP (-x)) f (E)f (E-x)dx x ? 0
fZ(X) 0 x 0
(3.3.8)
where F X(.) is the Gaussian cumulative distribution function and f x()
is the Gaussian probability density function, both for zero mean, unit
variance Gaussian random variables. This function is not available in
closed form unless k-2. Some points of the cumulative distribution
function for Z have been tabulated. See for example the tables of
Winer ( 3. 61. For a derivation of (3.3.8), see Appendix B of this report.
3.3.2 Estimation
We consider now some conumonly used estimates of statistical
parameters.
Mean
Lt X1 1.... ,Xn be independent identically distributed random
2variables each with mean P and variance a • Then
Sxl (3.3.9)nil
is called the sample mean. it Is an unLiased estimate of the mean of
83

lI-
I..
-I
XI mI " max
1 min
m 2 "~ XlnJ
* ~~Xk _ _
FIGURE 3.1
Generat 4 on of Studentized Range Statistic.
84 01

-• . - -- � - -* -=V m •r - .. ...- - ~
the x11sl
E[XJ - p (3.3.10)
2Varjx) a _ (3.3.11)
n
variance 1
For X1 ,...,Xn independent identically distributed random
2variables, each with mean 1 and variance o , the sample variance
S2 a1 n -)22 .i-l(xi - x) (3.3.12)
is an unbiased estimate of the variance of the x. 's, with
Ele - 02 (3.3.13)
2 n-3 4Varls I - nlU - - 4 (3.3.14)n 4 n-1
where o. denotes the fourth central moment. If the xits are Gaussian-- 2
as well, then x and 2 are beat moan square estimates and are independent
random vartables. Also, in this case,
La a random variable with the student's distribution with (n-i) degrees
of treedus.
85
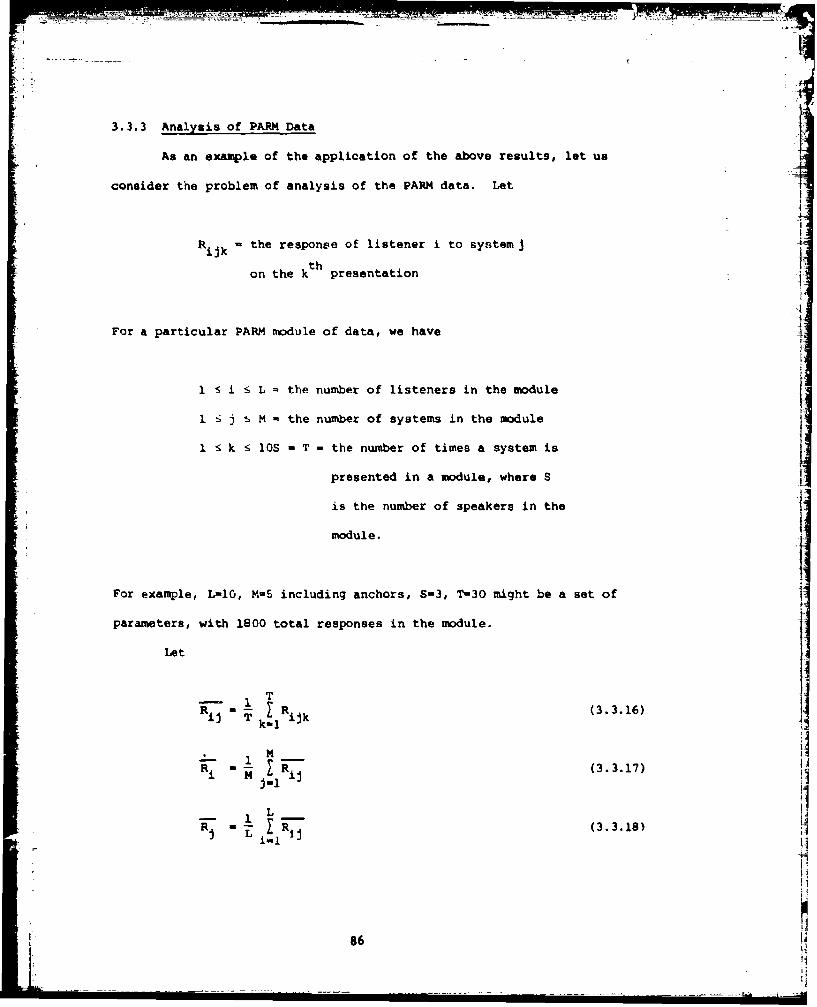
3.3.3 Analysis of PARM Data
As an example of the application of the above results, let us
consider the problem of analysis of the PARM data. Let
-IR ik=the response of listener i to systemj -
on the kth presentation
For a particular PARM module of data, we have A
1 i S L = the number of listeners in the module
1 S j s M - the number of systems in the module
1 S k • lOS - T - the number of times a system is Ipresented in a module, where S
is the number of speakers in the
module.
For example, L-10, M-5 including anchors, S-3, T-30 might be a set of
parameters, with 1800 total responses in the module.
Let
R-- V .i<Riii MT k-lRijk (3.3.16)
M
R . R(3.3.17)
R R (3.3.18)
iijI sI !i
86
WON7

11L M T
(3.3.19)i-i i -ll kI
SL M T
1? 1a (R -2 (3.3.20)o total - tLT-1 i (R. R)
i-i 1-i k-1
0 s I RI,) (3.3.21)
J-I
M L T2
Y( 1" L T -Y2 (3.3.24)error M(LT-) -! i-I k-i(R ijk .
Then, combining results, we have
2 4M-1 • M(IT-1) o (3.3.2$)
total MLT-l sys MLT-l error
Now, a 2 e r2 that is, if tha different systems themselvessys error
contribute no systematic differences to the variance, then
0o2 .002 2 (3.3.26)total Sys error
"1he F-test is used to test the hypothesis that 0 2 0 ̂? , by formingsys error
the ratio of these variables, assuming that the Gaussian assumptions hold,
and utilizing tabulations of the cumulative distribution of the F
variable under the hypothesis. If the ratio is outside predetermined
bounds, the test is said to hold, that is, the two variances are not
the same. Otherwise, there is no conclusion. From the point of view
of statistical hypothesis testing, we test the hypothesis {sysLteins
contribute no systematic difference). If F is too large, we reject the
87
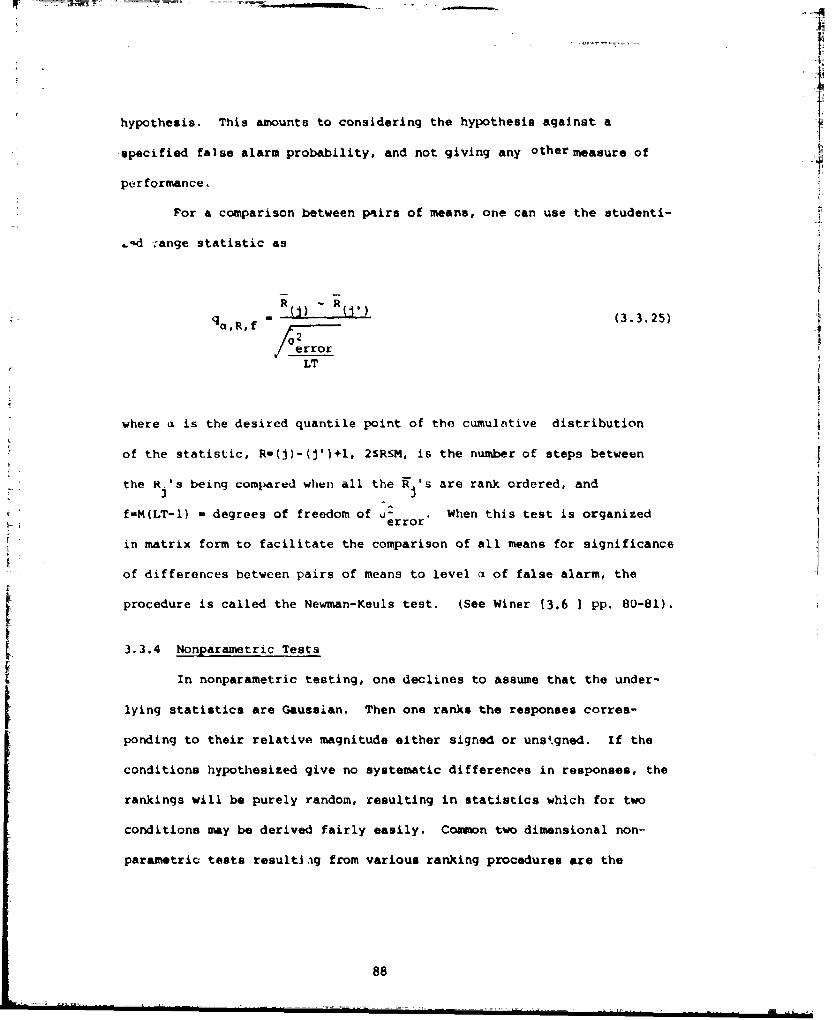
hypothesis. This amounts to considering the hypothesis against a {specified false alarm probability, and not giving any other measure of
performance. rFor a comparison between pAirs of means, one can use the studenti-
..d :ange statistic as
I
R U) RUIfq * -.Uj, (3.3.25)qca, R, f
errorLT
where a is the desired quantile point of the cumulative distribution
of the statistic, Rm(j)-(J')+l, 2SRSM, is the number of steps between
the R.'s being compared when all the R 's are rank ordered, and
f-M(LT-1) - degrees of freedom of eu or When this test is organizederror
in matrix form to facilitate the comparison of all means for significance
of differences between pairs of means to level a of false alarm, the
procedure is called the Newman-Keuls test. (See Winer [3.6 1 pp. 80-81).
3.3.4 Nonparametric Tests
In nonparametric testing, one declines to assume that the under-
lying statistics are Gaussian. Then one ranks the responses corres-
ponding to their relative magnitude either signed or uns.gned. If the
conditions hypothesized give no systematic differences in responses, the
rankings will be purely random, resulting in statistics which for two
conditions may be derived fairly easily. Common two dimensional non-
parametric tests resultiag from various ranking procedures are the
88
Wilcoxon test, the Median teot, the Van der Warden test, and the
Kolnmogorov-Smirnov test. Hajock [3.5 describes each of these tests
and gives underlying statistics for which each test is most powerful.
Unfortunately, no uniformly mo'it powerful test exists. In situations
where underlying distributions may reasonably be assumed to be Gaussian,
a parametric tost will in general be best.
Nonparametric tests comparing more than two conditions are more
difficult to compose than the comparisons of pairs of conditions as
all the rank statistics are in the higher order case derived from
multinomial as opposed to binomial type distributions. Although some
reference3 are made to such proceudres in Lohman 1 3.8 1, e.g. the
Kruskal-Wallis test, no convenient generally accepted multidimensional
nonparametric tests were found.
3.4 Conclusions and Recommendations
The following conclusions regarding subjective prediction of
user preference are drawn primarily on the basis of data available
from the analysis of the results of the PARM and QUART tests 1 3.1),
from the discussions at Georgia Tech and at Dynastat with W. D. Voiers,
and from the initial results of the DAN test.
3.4.1 Isometric Tests
In isometric tests such as PARM, the absolute rankings of system
conditions by individual listener& will have a high variance due to
individual listener idiosyncrasies and intralisteners variability, in
addition to interlisterner variability. Although these effects can be
89
balanced out by extremely careful post-test processing of responies to 1
establish common origins and scales within and across listeners. Such
Frocessing is, inevitably, subject to some criticism, as any smoothing of A
the data will also introduce some distortion of one kind as it reduces
other effects. Smoothing, centering, and scaling was accomplished in
the PARM tests based on the ratings and relative ratings of the anchors.
Although more efficient anchoring and normalisation procedures can
clearly be devised, such tests will always suffer from high variability
and hence require large groups of listeners and many trials and will
always be subject to criticism due to post test normalization procedures.
3.4.2 Tests of Features
In order to devise a&i effective, efficient and reliable subjective
test, it is necessary to narrow the scope of the question asked the
system. That is, a more specific response than "Do you like this?" must
be solicited. If the features of the speech which are perceptually most
important in determining the overall user acceptability can be identified
and quantified, than one can construct an acceptability ratinq with less
variability within and across listeners.
This then becomes a problem of feature extraction. Two fronts or
approaches to this problem can be found: (a) List all the conceivable
descriptions of features. Test. Analyze the data with correlation
analysis and try to find the features which are important empirically.
(b) Based on extensive experience with various systems, select the most
typical types of noises and degradations. Try to solicit responses
along these particular features. Include effects of the environment such
tg0

as background noises. Fuature selection using metlho (a) wit used in
QUART. Subsequent refinement using the ideas of (b) as well have led
to the parameter sets of DAM. It is our judgment, based on the eisult,.
of DAM, that the best available subjective preference testing procedure
available now is DAM. It should be pointed out that until the extensive,
expensive, detailed test results of PARM and QUART it wais not possible
to draw this conclusion; however, the detailed agreement of PARM and
QUART, and the subsequent development of DAM leave no other conclusioti.
3.4.3 Implementation of Subjective Tests
The monumental and time consuming tasks of conducting a subjective
listening test can effectively be imilemented for improved speed and
efficiency by using an interactive cop)uter to con,.rol the test, collect
the data, and subsequently to analyze the test data.
3.4.4 Size of the Test
The numbers of listeners which must be used in A subjc-tiv,
testing procedure can be determined only after sufficient data is
accumulated with a particular tes. methodology or algorithm to permit
good estimation of the error variances. Then the number of responses
must be selected to give an adequate resolution of the data to separate
systems under test. Note that the required resolution also will depend
on how different the systems to be resolved are on the scale of interest.
3.4.5 Speaker Selection
The number of speakers has been found in QUART and PARM to be
less significant than previously thought, from the point of view of
91
statistical resolving power. However, from the point of view of system
design, it is clear that some systems will be highly bised toward low
pitched speech or moderately pitched speech, and perform quite poorly
on high pitched speech or vice-versa. Hence, it is considered essential
to use at least two, preferably three, speakers chosen to cover the
expected range of -itches. This strategy will at least isolate quickly H
systems which will not, for example, respond to a female voice.
A3.4.6 Overall Recoumenditions for Subjective Tests
The overall recommendation to come from this examination of
subjective tests and test facilities is the development of an interactive
computer based hardware facility for conducting a refined version of the
DM test,
92

*AEFEI ,NCES
3.1 Voiers, W. D., "Mothods of Predicting User Ac-'eptance of VoiceCommunication Systems," Final Report, DCA Contract No. DCA-lO0-74-C-005b, July 15, 1976.
3.2 Voiers, W. D., "The Diagnostic Acceptability Measure Test," See
Appendix A of this report.
3.3 Wilks, Sammuel S., Mathematical Statistics, John Wiley & Sons,
1962.
3.4 Cramer, H., Mathematical Methods of Statistics, Princeton
University Press, 1946.
3.5 Ha-ek, Jaroslav, A• Course in Nonparametric Statistics, HIolden Day,1969.
3.6 Winer, B. J., Statistical Principle. in Experimental Design,
McGraw-Hill, 1962.
3.7 Siegel, S., Nonparametric Statistic, for the Bthaviorial
Sciences, McGraw-Hill, 1956.
3.8 Lehman, E. L., Non Parametrics: Statistical Methods Based on
Ranks, Holden Day, 1975.
93
?A
SELECTED BIBLIOGRAPHY IN SPEECH QUALITY TESTING
1. "IEEE Recommended Practice for Speech Quality Measurements," IEEE Trans.on Audio and Electroacoustics, Vol. AU-17, No. 3, Sept. 1969, pp. 225-246.
2. J. D. Ca'rol, J. J. Chang, "A New Method for Dealing with IndividualDifferences in Multidimensional Scaling," Bell Telephone Laboratories,Technical Memorandum, 69-1221-3, Jan 3, 1969.
3. J. D. Carroll, "Individual Differences and Multidimensional Scaling,"Preprint. Bell Telephone Laboratories.
4. L. H. Nakatani, "Confusion-Choice Model for MultidimensionalPsychophysics," Bell Telephone Laboratories, Technical Memorandum,70-1234-2, March 30, 1970.
5. J. B. Kruskal, "Nonmetric Multidimensional Scaling," Bell TelephoneLaboratories, Technical Publications, August, 1964.
6. M. R. Schroeder, "Reference Signal for Signal Quality Studies,"Bell Telephone Laboratories, Technical Memorandum, 68-123-3,July 18, 1968.
7. L. H. Nakatani, B. J. McDermott, "Effect of Pitch and Formant Manipulationson Speech Quality," Bell Telephone Laboratories, Technical Memorandum,72-1228-8; 72-1229-5, September 1, 1972
8. L. H. Nakatani, "Measuring the Ease of Comprehending Speech," BellTelephone Laboratories, Technical Memorandum, 71-1234-5, June 2, 1971.
9. P. D. Bricker, "Application of INDSCAL to the Dimensionalization ofSpeech Sound Perception," Bell Telephone Laboratories, TechnicalMemorandum, 70-1221-24, August 25, 1970.
10. J. D. Carroll, M. Wish, "Multidemsional Scaling of Individual Differencesin Perception and Judgment," Preprint, Bell Telephone Laboratories.
11. L. H. Nakatani, "Evaluation of Speech Quality Using Immediate Recallof Digit Strings," Bell Telephone Laboratories, Technical Memorandum,70-1234-I, January 29, 1970.
12. Michael H. L. Hecker, C. E. Williams, "Choice of Reference Conditionsfor Speech Preference Tests," The Journal of the Acoustical Society ofAmerica, Vol. 39, No. 5, Part 1, 196b, pp. 946-952.
13. E. H. Rothauser, G. E. Urbanek, W. P. Pachl, "A Comparison of PreferenceMeasuremenL Methods," The Journal of the Acoustical Society of America,Vol. 49, No. 4, Part 2, 1971, pp. 1297-1308.
94
14. B. E. Carpenter, S. H. Levington, "The Influence of Human Factora"on the Performance of a Real-Time Speech Recognition System," TheJournal of the Acoustical Society of America, Vol. 53, No. 1, 1973,pp. 42-45.
15. Michael H. L. Hecker, Newman Guttman, "Survey of Methods forMeasuring Speech Quality," Journal of the Audio Engineering Society,Vol. 15, No. 4, Oct. 1967, pp. 400-403.
16. W. D. Voters, "Perceptual Bases of Speaker Identify," The Journal ofthe Acoustical Society of America, Vol. 36, No. 6, June 1964,pp. 1065-1073.
17. W. A. Munson, J. E. Karlin, "Isopreference Method for EvaluatingSpeech-Transmission Circuits," The Journal of the Acoustical Societyof America, Vol. 34, No. 6, June 1962, pp. 762-774.
18. P. T. Brady, "A Statistical Basis for Objective Measurement of SpeechLevels," The Bell System Technical Journal, Sept. 1965, pp. 1453-1486.
19. P. T. Brady, "Objective Measures of Peak Clipping and ThresholdCrossings in Continuous Speech," The Bell System Technical Journal,April 1972, pp. 933-945.
20. W. D. Voiers, "The Present State of Digital Vocoding Technique:
A Diagnostic Evaluation," IEEE Trans. on Audio and Electroacoustics,Vol. AU-16, No. 2, June 1968, pp. 275-279.
21. J. Swaffield, D. L. Richards, "Rating of Speech Links and Performanceof Teler no Networks," The Proceedings of the IEEE, Vol. 106, Part B.,No. 26, March 1959, pp. 65-76.
22. D. L. Richards, J. Swaffield, "Assessment of Speech CommunicaticnLinks," IEEE, Paper No. 2605 R, April 1958, pp. 77-89.
23. L. H. Nekatani, K. D. Dukes, "A Sensitive Test of Speech CommunicationQuality," The Journal of Acoustical Society of America, Vol. 53, No. 4,1973, pp. 1083-1092.
24. B. J. McDermott, "Multidimensional Analyses of Circuit Quality Judgements,"The journal of the Acoustical Society of America, Vol. 45, No. 3, 1969,774-781.
25. E. H. Rothauser, "Isopreference Method for Speech Evaluation," TheJournal of the Acoustical Society of America, Vol. 44, No. 2, 1968,
pp. 408-418.
26. J. R. Duffy, T. G. Giolas, "Sentence Intelligibility as a Function ofKey Work Selection, University of Connecticut, Storrs, Connecticut,Feb. 1974.
95
iL

27. V, 3. McGee, "Semantic Components of the Quality of Processed Speech,"journal of Speech and Hearing LReearch, Ho. 6, pp. 310-323.
28. V. E. McGee, "Determining Perceptual Spaces for the Quality ofFiltered Speech," The Journal of Speech and Hearing Research, No. 8,pp. 23-38., 1965.
29. D. W. Bell, E. James Kreul, "Reliability of the Modified Rhyme Testfor Hearing," The journal of Speech and Hearing Ressctch, No. 15, 1972,pp. 287-295.
30. W. D. Voters, C. P. Smith, "Diagnostic Evaluation of Intelligibilityin Present-Day Digital Vocodprs," Conference Record, 1972 Conference
on Speech Communication and Pcocessing, April, 1972, pp. 170-174.
31. C. B. Grether, R. W. Stroh, "Subjective Evaluation of DifferentialPulse Code Modulation using the Speech 'Goodness' Rating Scale,"Conference. Record, 1972 Conference on Speech Communication andProcessing, April, 1972, pp. 175-178.
32. D. J. Goodman, B. J. McDermott, L. H. Nakatani, "Subjective Evaluationof PC0 Coded Speech," Conference Record, 1976 IEEE InternationalConference on Acoustics, Speech, and Signal Processing, April, 1976,pp. 266-270.
96

4. A SUBJECTIVE CO•*U•ICABILITY TEST
4.1 Introduction
When judging the performance of highly intelligible speech com-
munications systems, one approach is to apply an isometric subjective
user acceptability test, such as the PARM. The hypothesis in such
teuts is that subjects can judge, from listening to speech segments
played through the systems being tested, the overall expected accepta-
bility of a system. The problem with these tests is that the subjects'
responses represent a noisy measure of the actual acceptaoility of a
system. In this context, the "ACCEPTABILITY" of a system is defined as
the level to which complex comunication tasks can be accomplished
while using the system.
A model which states the problem more clearly is one which
postulates a fixed cognitive resource available to a user of a coummni-
cation system. As was discussed in Chapter 2, due to the multiplicity
of acoustic cues for segmental and supersegmental features in speech,
and due to a listener's immense knowledge of the phonemics. syntactics,
and semantics of his language, a listener may well be able to under-
stand speech which is very distorted. The problem is that to do no, he
must utilize a large portion ;f his cognitive resource to just under-
standing what is being said. For a low quality system, therefore, this
leaves him relatively less cognitive resource to apply to the communi-
cation task, making the com=unication task more difficult.
97

The definition of a "COMMUNICABILITY TEST," as used in this
chapter, is any test which trys to measure a user performance on a
comnunication task while using a communication system. The idea is to
design tests in which users are not asked to rate systems, but rather
are asked to perform some task in which the subjects' performance may
be measured objectively. In order to be an acceptable communicability
test, therefore, the test must meet several requirements. First, the
communication task must be difficult enough so that a subject is using
most of his cognitive resource in performing the task even with no
system distortion. Second, a subject's performance on the task must be
easy to measure. Third, the test must be inexpensive to administer
because it has enough inherent resolving power to differentiate among
the communications systems without eccessive subject costs. Last, the
test should not require the actual use of a communication system in the
test, so that simulated systems may also be tested.This chapter describes the deoign and testing of one such
communicability test. Section 4.2 describes the design of the automated
subjective data aoquisltion system used to administer the test. Section
4.3 describes the details of the test itself. Section 4.4 describes the
data analysis done in the test. Section 4.5 describes the test results.
98
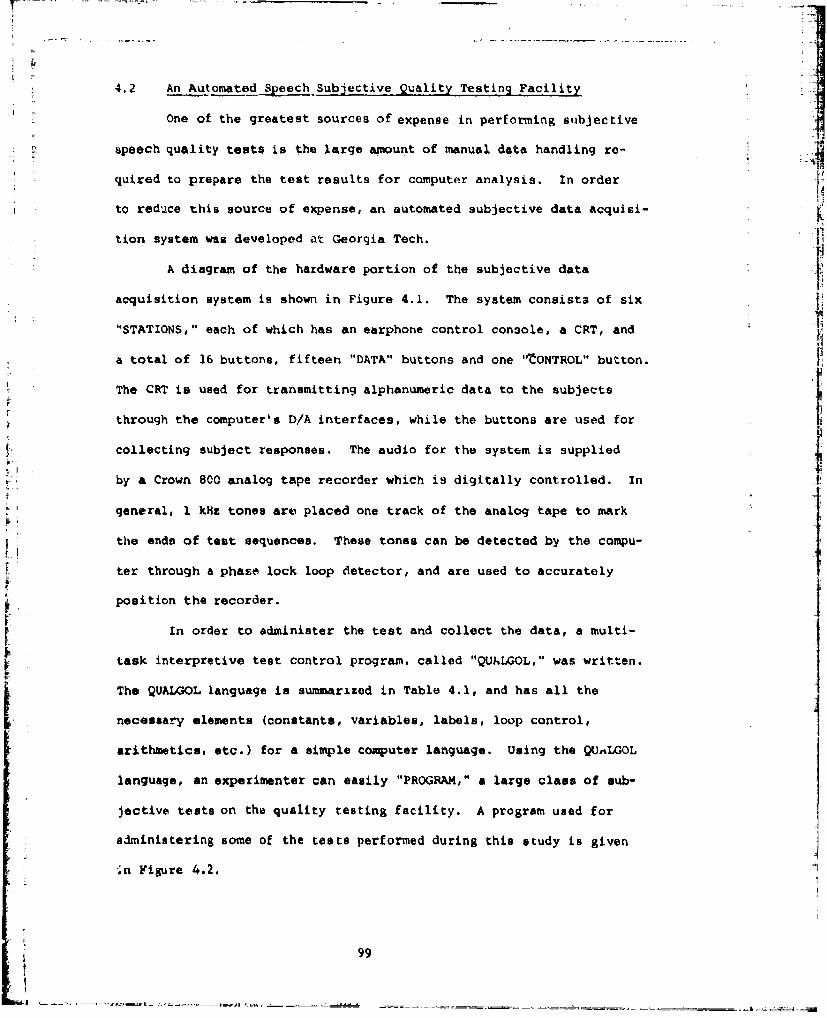
4.2 An Automated Speech Subjective Quality Testing Facility
One of the greatest sources of expense in performing subjective
speech quality tests is the large amount of manual data handling re-
quired to prepare the test results for computer analysis. In order
to reduce this source of expense, an automated subjective data acquisi- I
tion system was developed at Georgia Tech.
A diagram of the hardware portion of the subjective data facquisition system is shown in Figure 4.1. The system consista of six F"STATIONS," each of which has an earphone control console, a CRT, and
a total of 16 buttons, fifteen "DATA" buttons and one '"ONTROL" button. .
The CRT is used for transmitting alphanumeric data to the subjects
through the computer's D/A interfaces, while the buttons are used for Icollecting subject responses. The audio for the system is supplied
by a Crown 800 analog tape recorder which is digitally controlled. In
general, I kHz tones are placed one track of the analog tape to mark
the ends of test sequences. These tones can be detected by the compu-
[ 1ter through a phase lock loop detector, and are used to accurately
position the recorder.
In order to administer the test and collect the data, a multi-
task interpretive test control program, called "Q•JhLGOL," was written.
The QUALGOL language is summarized in Table 4.1, and has all the
necessary elements (constants, variables, labels, loop control,
arithmetics, etc.) for a simple computer language. Using the QUKLGOL
language, an experimenter can easily "PROGRAM," a large class of sub-
Jective tests on the quality testing facility. A program used for
administering some of the teats performed during this study is given
-n Figure 4.2.
99
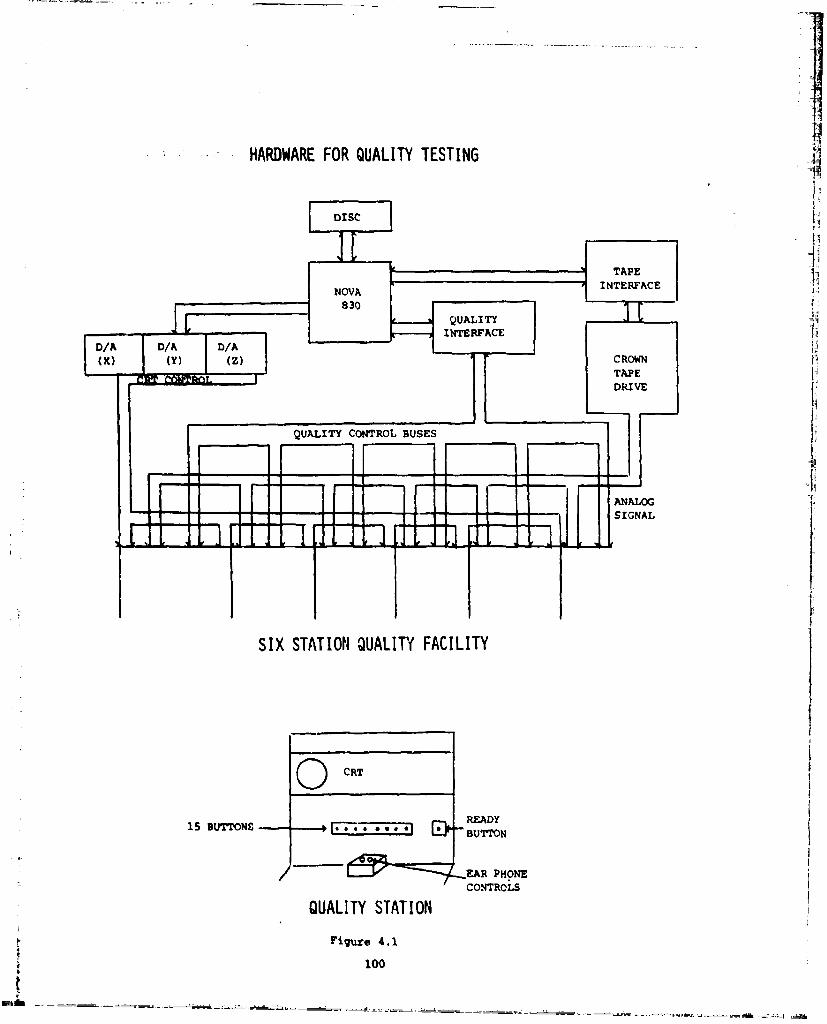
HARDWARE FOR QUALITY TESTING f
DISC
TAPE
:NOVA
I NTE RFAC E830
QUALITY ]['INTERFACECE
•I• I"q]r• TAPE i
[ , QUALITY CONTRL .BUSES,_____ __ l F ___ _ 7 7_1_
SIGNAI
LL
]ISIX STATION QUALITY FACILITY
O CRT
15 BUTTlONE READY
&-BUTTrON
EAR PHONECONTROLS
QUALITY STATIONFiture 4.1
100

TABLE 4.1
QUALGOL LANGUAGE
St lN V - VARIABLEN - CONSTANT
VA RABLE: A-Z
COHUANDSi
C CROWNC (V) RECEIVE FROM CROWN
1 - TONE0 - NO TONE
C (N) SEND TO CROWNI PAST FORWARD2 STOP3 PLAY4 RECORDS REWIND0,6,7 NO-OP
pD DELAYD(N) DELAY N(.1 SEC) UNITS
DI DISPLAYD(N) DISPLAY MESSAGE N
END
G GET RESPONSESG (V) GET V RESPONSES DECREMENT
V TO ZERO
I INCREMENTi (V) INCREMENT V BY ONE
J JUMPJ(V,LABRPL) JUMP TO LABEL IF V-0y(@ILABEL.) JUMP TO LABEL
M MESSAGE( .. DEFYNE MESSAGE
p PPRINTp (V) PRINT v
S(V,N) SrET V TO N
T TRACET TRACE SWITCH
W WAIISW(N) WAIT N UNITS
101

(1, LISTEN@ TO@SAMPLE)M(21M4(3, ?4AKE@CHOICE NOW)M(4,PLEASE@MAKE CHIOICE@ NOW)M(5,NOW STUPID)
S (E,-100)C (3) W(2) C(0)
LT C (B) J(B, Ll) J(@.L2)L.2 C(2)W(2)C(0)
LM1 I(EJ(E.EN)DI(1)C (3) W(3) C(0)
L.3 C (13)J(B, L4) J(@. L3)L.4 C (8) J (BW)J(@. LS)1.5 C(2)W(2)C(0)
DI(2)W(10)DI(3)S(C,1)G(C)W(30)J(C,LM)DI (4)5 (D,-10)
1.7 W(10)J(C,LM)I(D) (D,L8)J(@,L7)L.8 S(D,-10)DI(S)L9 J(C,LM)W(10)I'CD)J(D,L14)J@,L9)EN END
FIWJRE 4.2 AN4 EXAMPLE "QUALC!nL" P)ROOM
USED TO ADMINISTER THE COMMUJNICABILITY TESTS
102
4.3 The Experimental Format
The communicalility test format chosen for this study was a
"Multiple Digit Recall" test similar to that studied by Naghtani at
Bell Labs. In this format, sequences of random digits are first re-
corded by trained speakers, and then these utterances are played
through various distorting systems. The resulting sequences are then
played to subjects whose task is to "RECALL" the digits after a short
(- 1 sec.) wait. This test format meets all the basic criteria set
forth in the introduction, since the task does not require a quality
judgment on the part of the subjects, the test is simple to administer,
and the test does not require the communication system being tested to
be present.
The purpose of the study reported here was to study the useful-
ness of this test format for evaluating communication systems both
from a resolution and cost point of view. It should be noted that this
study was a relatively small portion of the total effort, and the
results obtained should be considered preliminary in nature. The
tests were performed as follows. First, strings of random digits
were generated by the computer by a program which rejected all strings
which had double digits, had more than two digits in ascending or
descending sequence, or had more than two digits in ascending or descen- 4ding alterate (2-4-6, etc.) sequence. Forty random sequences were
generated in 6,7,8,9, and 10 digit lengths. Second, the digit
strings were read into a high quality tape recording system by a
trained announcer from the student broadcast radio station. The digits were
read "as if there were a list," so that no internal groupings were
imposed on the numbers. Third, the number strings were low pass
103

filtered to 3.2 kHr and diqitised at 8 kHs to 12 bits resolution.
The results were stored on three 2400 ft. 800 BPI, 9 track digital
tapes.
In all, four sets of tests were performed. In the first
"preliminary" test* undistorted data was played to subjects to try •
to determine an appropriate number of digits for the final testa.
In all, the subjects listened to 200 sequences consisting of 40 each of
6,7,8,9, and 10 digit strings. As a result of this test, digit sequence
lengths of 7 and 8 were chosen.
In the remaining three tests, distortions were applied to the
number strings, and these were played to subjects. Each of these
three tests tested the undistorted strings against three levels of
casily perceivable distortionR. In the first test, the distortions
were white Gaussian noise at a SNR of 10 db, 8 db and 5 db. In the
second test, the distortions were low pass filtering at 2.4 kHI cut-
off frequency, 1.8 kHr cutoff frequency, and 1.2 kHz cutoff frequency.
In the third test, the distortions were ADPCM waveform coder distor-
tions at 24 kBPs, 16 kBPs, and 8 kBPs. Each set of distortions
was played to 18 subjects for a total of l8x3x2xSO-5400 responses.
4.4 The Data Analysis
The data analysis was done in three stages. First, the data is
entered into a general data base. Second, a program called "VERIFY'
examines the numbers for cases where the number of errors is greater
than three, or where the errors meet a set of special conditions
(reversals, dropped numbers, etc.). In each case, the experimenter
can choose to omit the subject data. Third, a program called "SCORE"
allowt. the analysis of the data base for the means and variances
104

necessary to use standard Student's-t analysis and analysis of
variance techniques, and allows the calculation of extensive
correlation sets.
In all, three types of scoring procedures were applied to the
data. In the first procedure, each response string was scored to be
either correct or not correct, and no note was made of the number of
errors in the string. The score statistic for this method was the
percentage of incorrect strings for each subject, for each distortion,
and for each test.
In the second scoring procedure, each response btring was matched
to the correct string, and the score was taken to be the total number
of incorrect digits. In this scoring procedure, all response strings
with missing digits or response strings with the wrong number of
digitn were given a score of 4.
The third type of scoring was derived by classifying the types
of digit erross in the response strings. it was found that che t
predominant type of error in the test was a two digit error obtained.t
from interchanging two digits. In the third scoring procedure, such
an inversion would be considered to be one error rather than two.
Rules were compiled to handle inversions of more than two numbers as
such cases appeared in the data.
For the following discussion, each scored result will be referred
to by the designation Xsd., where t is test number (t 1 1 for the
additive noise test, t - 2 for the low pass filter test, and t - 3
for W.te ADPQ4 coding test), s is the subject number (18 per test,
105

s $, where S- 18), d is the distortion level (four for each
test -three distortions and "clear" 1 i d I D, where D a 4), and In is the number of results per subject (1 it n t N, where N w 1 for
the first scoring, and N - 10 for the last two). For each teat, Ao
analysis of variance vas used to determine the significance of the
entirv test, while the Student's t statistic was used to determine t
statistical significance between distortions. In each test, the
first 10 responses were considered to be "training" responses, and
I were not included in the results. The analysis of variance was
performed by calculating the F statstic given by
1. s- ' t2
F(sN -- l) IS (S - (Xte Xt1
and testing for significance using the appropriate F distribution,i Iwhile the pairwise significance was tested by calculating the t
statistic
t Xtd; - Xtd2 (4.4.2)
1 1S+
t n n2
and finding the significance from the t distribution.
4.5 The Experimental Results
Table 4.5.1 shows the results of the first scoring procedure as
applied to the three tests. A summary of the distortions for each test
is given in Table 4.5.2. The overwhelming point is that there are
106
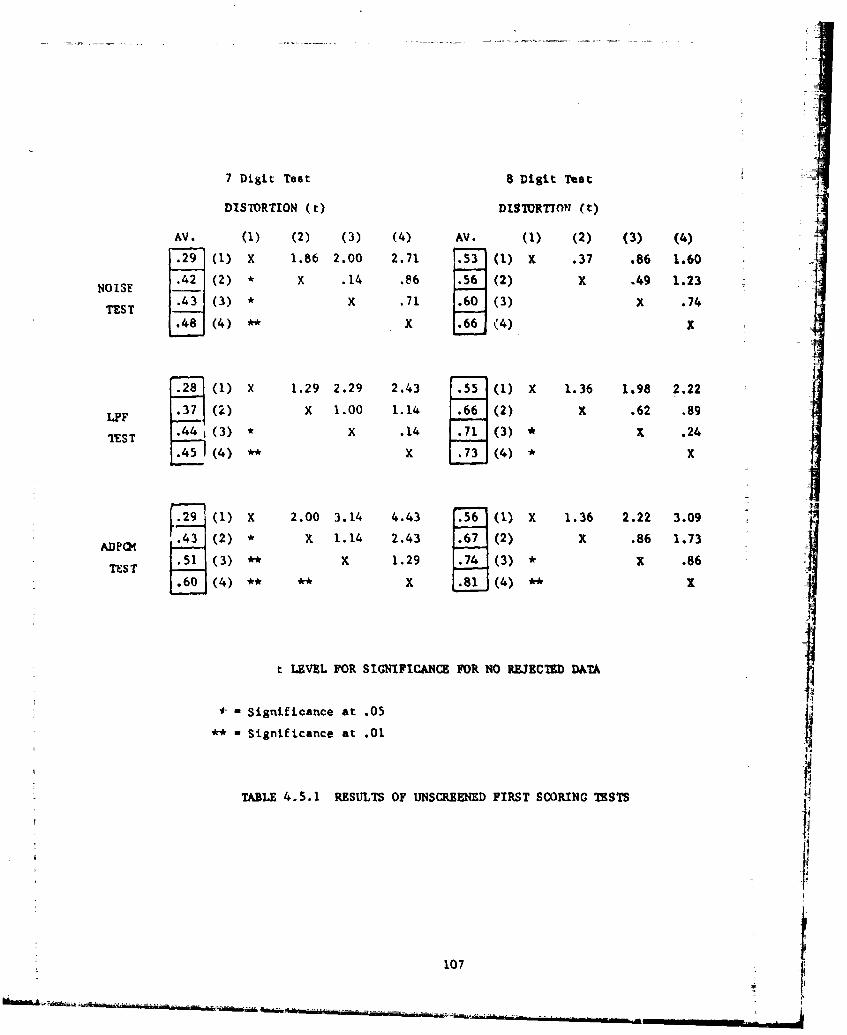
7 Digit Test 8 Digit Test
DISTORTION (M DISTORTION; (t)
AV. (1) (2) (3) (4) AV. (1) (2) (3) (4)
.9(1) X 1.86 2.00 2.71 . 5 (1.) X .37 .86 1.60
NOISE (2) * X .14 .86 .56 (2) X .49 1.23
TEST .43 (3) * x .71 .60 (3) X .74.48 (4) ** X 1.6J (4) x
82 (1) x 1.29 2.29 2.43 .5(1) X 1.36 1.98 2.22
LPF (2) x 1.00 1.14 . (2) x .62 .89
IST . (3) * x .14 .71 (3) * x .245 (4) ** x (4) * x
.29 (1) X 2.00 3.14 4.43 [6 (1) X 1.36 2.22 3.09
ADPC R3 (2) * x 1.14 2.43 .67 (2) X .86 1.73
TEST (3)** X 1.29 .74 (3) * x .86(4) ** * 1x ](4) * X
t LEVEL FOR SIGNIFICANCE FOR NO REJECTED DATA
- Significance at .05
• -=Significance at .01
TABLE 4.5.1 RESULTS OF UNSCREENED FIRST SCORING TESTS
+V
I107

TEST DISTORTION
(1) (2) (3) (4)
ADDITIVE -NONE 10db SNR 8db SNR 5db SNRNOISE
LOW PASS NONE 2.4 kHz 1.8 kHz 1.2 kHzFILTER
ADPCM NONE 24 KBPS 16 KBPS 8 KBPS
TABLE 4.5.2 DISTORTION LEVELS FOR THE TEST DIGITS
ON THE THREE COMMUNICABILITY TESTS
108

very few significant results using this scoring scheme. The major =
problem here turns out to be the subject variations. Some subjects
are so "bad" that they get practically no strings correct. Others
are so "good" that they never miss. It was hence decided to screen
out subjects whose average error rate was outside the range .3 < error
rate < .7. This left 10 subjects on the first test, 9 on the second,
and 10 on the third. The results for this scoring is shown in Table
4.5.3. Clearly, this screening .- proves the results, with a large
number of results significant at the .11 level. This same effect was
found to hold for the other two scoring procedures.
Tables 4.5.4 and 4.5.3 show the results from the second and third
scoring procedures. In these tests the subjects were screened exactly
as for the fist scoring procedure. Several results are clear from
these two tests. First, both scoring procedures represent a considerable
improvement over the first procedure, with the third procedure having
a slight edge in significance. Second, the noise tests seem to have
less overall effect (less significance) than either the low pass
filter test, or the ADPCM test. Third, the 7 digit test seems to be
generally more acceptable than the 8 digit test (higher significance
levels for the same number of subjects).
4.6 Conclusions
The purpose of this study was to acertain the usefulness and cost
of the digit •ecall test as a communicability test for speech digitization
systems. The overall results must be stated to be that:
1. For zhe rather severe variations in distortions used in this
test, it was easily possible •o differentiate between systems.
109
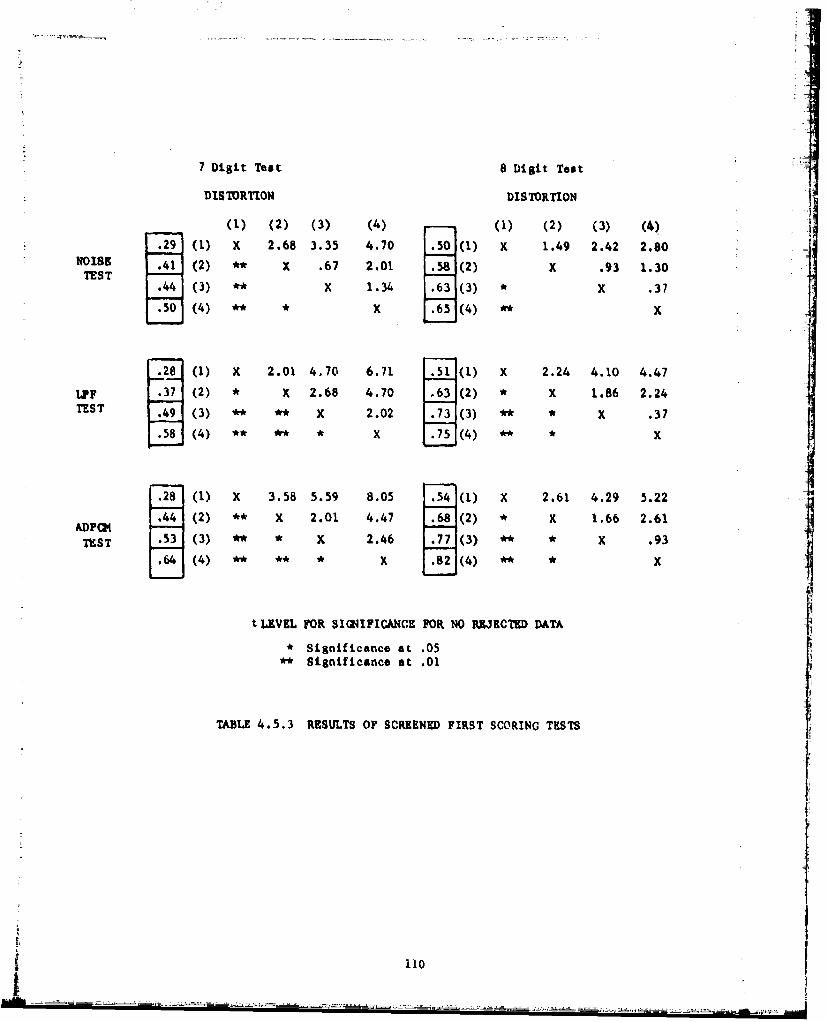
7 Digit Teat 8 Digit Teat
DISTORTION DISTORTION(1) (2) (3) (4) (1) (2) (3) (•
.29 (1) X 2.68 3.35 4.70 .50 (1) x 1.49 2.42 2.80NOISE .41 (2) * X .67 2.01 .58 (2) X .93 1.30
TEST -- ,TS (3) X 1.34 63 (3) * X .37
(4) ** * X .61(4) ,* x
2 (1) X 2.01 4,70 6.71 .51](1) X 2.24 4.10 4.47
LPF . (2) * X 2.68 4.70 .63 (2) * x 1.86 2.24TEST (3) ** ** X 2.02 .73 ** * X .37
58 (4) ** ** * x (4) * x
.28 (1) X 3.58 5.59 8.05 .54 (1) X 2.61 4.29 5.22
ADPCG .44 (2) ** X 2.01 4.47 .68 (2) * X 1.66 2.61
TST (3) ** ) x 2.46 .77 (3) ** * x .93
.64(4) ** ** * 2(4) ** . x
t LEVEL FOR SIGNIFICANCE FOR NO REJECTED DATA
* Significance at .05S* Significance at .01
TABLE 4.5.3 RESULTS OF SCREENED FIRST SCORING TESTS
110
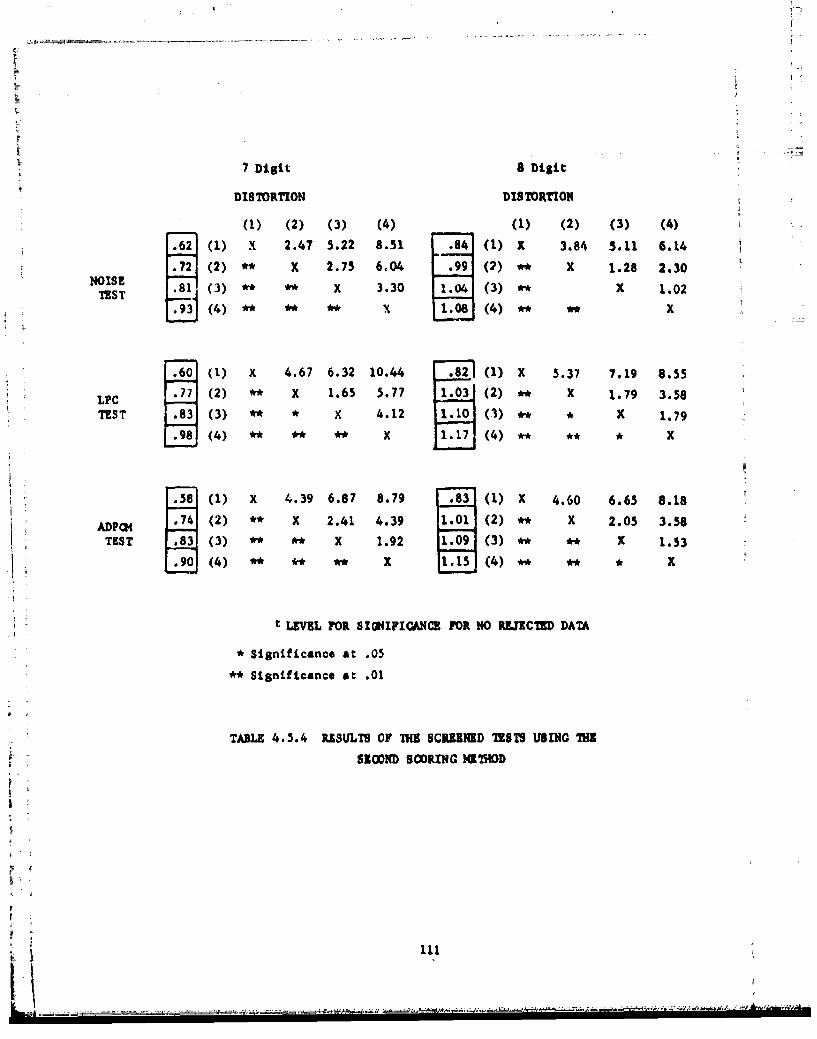
7 Digit a Digit
DISTORTION DISTORTION
(1) (2) (3) (4) (1) (2) (3) (4)
.62J (1) X 2.47 5.22 8.51 .84 (1) x 3.84 5.11 6.14
.72 (2) *, X 2.75 6.04 .99 (2) * X 1.28 2.30NOISE '~~*NOSE (3) ** X 3.30 j3o4 (3) ,- x 1.02
t.9 (4) ** ** ** x (4) ** ** x
. (1) X 4.67 6.32 10.44 .82 (1) X 5.37 7.19 8.55
L.C (2) *, x 1.65 5.77 1.03 (2) ** X 1.79 3.58
TEST .83 (3) *, , X 4.12 .0 (3) , X 1.79
(4) ** ** ** X 1 (4) ** ** * x
.i] (1) x 4.39 6.87 8.79 E.831 (1) X 4.60 6.65 8.18
ADPQ4 [74 (2) * X 2.41 4.39 1 (2) * X 2.05 3.58
TEST .83( 3) ** * X 1.92 09 (3 )) , X 1.53
.90(4) ** ** ** x 1.15 (4) ,. ** , X
t LEVEL FOR SIGNIFICANCE FOR NO RiJXCTED DATA
• Significance at .05
** Significance at .01
TABLE 4.5.4 RESULTS OF TME SCRUENED TESTS USING THE
SEOOND SCORING METHOD
.-
--~--A~' A '-A~

7 Digit 8 Digit
DIS70RTION DISTORTION
(1) (2) (3) (4) (.) (2) (3) (4) ,j.53. (1) X 3.85 7.42 10.44 .63 (1) X 4.86 7.67 9.46
.67 (2) 3.57 6.59 ,82 (2) ** x 2.81 4.60
.80 (3) ** ** X 3.02 .93 (3) '* ** X 1.79
.91(4) ** ** ** X 1.00 (4) ** ** * x
.51 (1) x 3.57 7.69 9.89 .61 (1) X 5.63 8.44 10.74
.64 (2) * x 4.12 6.32 .83 (2) ** X 2.81 5.11
.79(3) ** ** x 2.20 .94(3)** ** X 2.30 -
.87(4) *-k ** ** X (4) - * * X
.52 (1) X 4.94 7.69 9.61 .60 (1) x 5.63 8.6¶• 10.74 1
L (2 ** X 2.75 4.67 .82 (2) ** X 3.07 5.11
.80 (3) ** x 1.96 .94 (3) ** ** X 2.05
.87 (4) * ** * X 1.02 (4) ** ** ** x
t LEVEL FOR SIGNIFICANCE FOR NO REJECTED DATA
* Significance at .05
- Significance at .01
TABLE 4.5.5 RESULTS OF SCRKIEND TESTS USING THE THIRD SCORING METHOD
112
2. The cost of this test is quite high when compared to other
spee.h quality and speech intelligibility tests.
3. There ir great subject variability, indicating that results
might be improved substantially by using a trained, well
documented crew of listeners.
4. Fcr this Darticular group of subjects, 7 digits seemed about
right. Clearly, however, for some 7 was too many, while for
others, 8 was too few.
5. The test is a very unpleasant test in which to participate.
6. The ability of digit recall tests to differentiate between
systems which are closely matched for performance is limited,
and would require considerable cost.
In suaary, it may be said that, even though this type of
comunicability test can be argued to be more appropriate than
subjective preference testing, and even though it is possible, as shown
"in this study, to differentiate among distorting systems, still the
excessive cost of communicability testing required to obtain the
desired significance levels makes these tests unattractive.
113
i
I
APPENDIX A
SPEECH ACCEPTABILITY EVALUATION AT DYNASTAT:
THE DIAGNOSTIC ACCEPTABILITY MEASURE (DAM)
114

SPEECH ACCEPTABILITY EVALUATION AT DYNASTAT:
THE DIAGNOSTIC ACCEPTABILITY MEASURE (DAM)
BACKGROUNDJ
It is a matter of common observation that user v:cep-
tance of voice communicaticns equipment depends on factorsother than speech intelligibility. Althou,.h a high degree of
intelligibility is generally a necessary condition, it is not
a sufficient condition of user acceptance. But until recently,
no generally satisfactory methods of evaluating the overall
acceptability or "quality" of processed or transmitted speech
has been available. Among the proviously availe.ble methols,
some are applicable only for certain types of s?,.•ch signal
degradation. Others are of limited reliability. Virtuallynone permits reliable system evaluation in absolute terms for
the diversity of processing techniques and transmissions
encountered in modern digital voice communications.
Under contract with the Defense Communications Agency,Dynastat recently undertook to fill the need that existed
in the area of acceptability evaluation. The results of this
effort included the Paired Acceptability Rating Method (PARM)
and the Quality Acceptance Rating Test (QUART), both of which
provide improved reliability of measurement on an absolute scale
of acceptability. Having met the interim needs of the Narrow
Band Voice Consurtium, they also served &s valuable researchtools to clarify a number of crucial methodological issues and
to indicate possible means of further refining the technology
of speech evaluation.
Drawing on insights gained in the course of its con-
tractual activities with PARM and QUART, Dynastat continued underits own auspices co further advance the technology of communication
115

system evaluation from the standpoint of overall speech accept-ability. These efforts culminated in the Diagnostic Accept-
ability Measure (DAM). j
THE DIAGNOSTIC ACCEPTABILITY MEASURE
The Diagnostic Acceptability Measure combines direct(isometric) and indirect (parametric) approaches to accept- Iability evaluation by means of twenty-item system rating form.*
Ten of the items on the form are concerned with the accept-ability-related perceptual qualities of the speech signal,itself. Seven items are concerned with the perceptual qualitiesof the background. Three items are concerned with the perceivedintelligibility, pleasantness, and overall acceptability of thetotal effect. The descriptors used to define the various nercep-tual qualities are the end products of an extensive program ofresearch concerned with the nature of these qualities and withthe development of a precise vocabulary for characterizing them.
The results of further research have indicated thatlistener's perceptions of modern digital voice communicationsystems and diverse forms of laboratory degradation can beexhaustively characterized in terms of six elementary perceived
* The isometric approach requires the listener to provide adirect subjective assessment of the acceptability of a samplespeech transmission. The parametric approach requires thelistener to evaluate the sample transmission with respect tovarious perceived characteristics or qualities (e.g., noisiness)independently of his individual effective reactions to thesequalities. Hence, the parametric approach tends to minimizethe sampling error associated with individual differences in"taste.' The individual who does not personally place a highvaluation on a particular speech quality may tverthelessprovide information of use in predicting thkL vpical indi-vidual's acceptance of speech characterized by a given degreeof that perceptual quality.
116

qualities of the signal and three perceAved qualities of the
background. Measures of these elementary qualities are
obtained by various combinations of rating scale data.I
In accordance with the above research results, DAM
rating data are presently analyzed to yield system diagnoses
with respect to the nine perceptual qualities indicated in
Table 1. The contribution of each of these qualities to the
listener's acceptance reaction has been determined, so that eachdiagnostic score can be expressed in terms of the level of
acceptability a system would be accorded if it were deficient
with respect only to the single perceptual quality involved.
Expressed in this way, the pattern of diagnostic scores reflects
the relative contribution of each perceptual quality to the
acceptability of the system, and permits the system developerto concentrate on the perceived characteristics of his system
which are most detrimental to its acceptance.
The application of multiple, nonlinear regression tech-
niques to a set of diagnostic scores permits the derivation of
supplementary, parametric estimates of intelligibility, pleasant-ness, and acceptability, which can be combined with direct, or
isometric rating data to yield highly reliable and valid estimates
of all three of these properties. For practical purposes ofsystem evaluation, however, parametric predictions are presently
provided only for acceptability.
To permit comparisons with the results of tests pre-
viously conducted with PARM, DAM acceptability results are trans-
formed to their PARM equivalents. A transformation of judged
intelligibility results permits estimates of equivalent DRT totalscores.
117
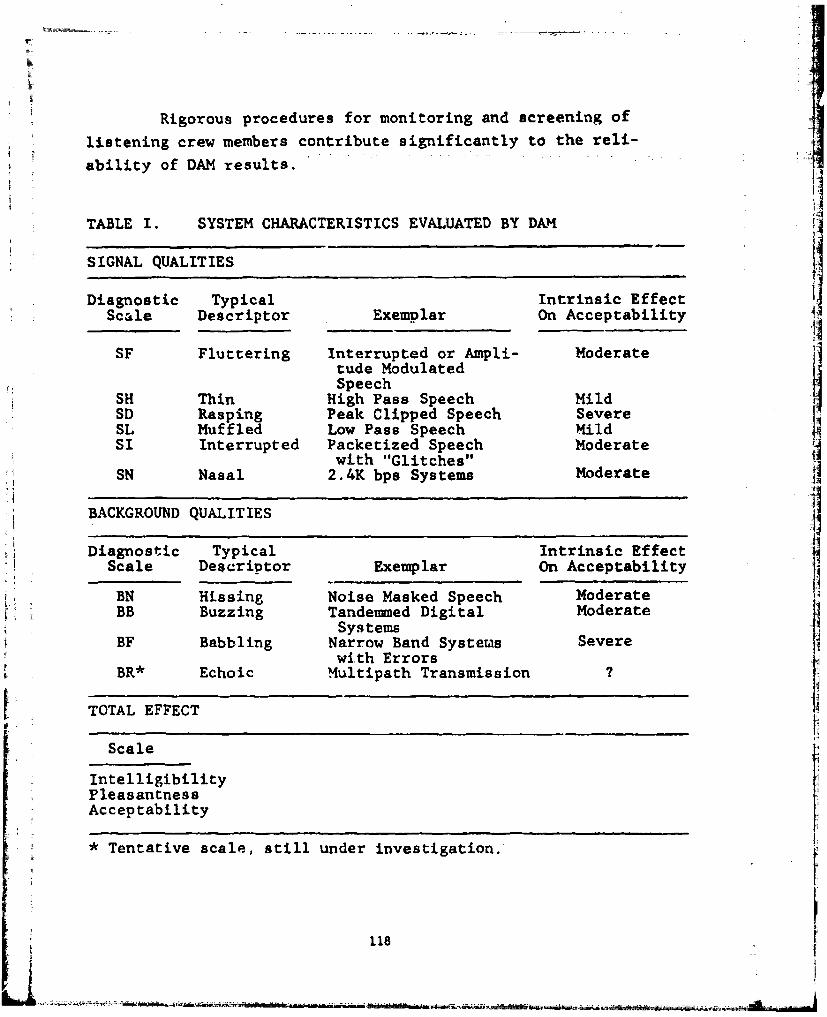
Rigorous procedures for monitoring and screening of
listening crew members contribute significantly to the reli-
ability of DAM results.
TABLE I. SYSTEM CHARACTERISTICS EVALUATED BY DAM
SIGNAL QUALITIES
Diagnostic Typical Intrinsic EffectScale Descriptor Exemplar On Acceptability
SF Fluttering Interrupted or Ampli- Moderatetude ModulatedSpeech
SH Thin High Pass Speech MildSD Rasping Peak Clipped Speech SevereSL Muffled Low Pass Speech MildSI Interrupted Packetized Speech Moderate
with "Glitches"SN Nasal 2.4K bps Systems Moderate
BACKGROUND QUALITIES
Diagnostic Typical Intrinsic EffectScale Deseriptor Exemplar On Acceptability
BN Hissing Noise Masked Speech ModerateV BB Buzzing Tandemned Digital Moderate
SystemsBF Babbling Narrow Band Systems Severe
with ErrorsBR* Echoic Multipath Transmission
TOTAL EFFECT
Scale
IntelligibilityPleasantnessAcceptability
* Tentative scale, still under investigation.
118
i
Speaker differences are relatively small with DAM,
particularly within sexes. Depending on the purposes of the
investigator, however, the use of more then one speaker may
be appropriate.
The speech materials used for purposes of DAM evalua-tions consist of 12 phonemically controlled sentences, spoken
by each of the desired number of speakers. Approximately one
minute total running time is required for each speaker.
Figure 1 shows the standard format in which DAM results
are reported. Presented first are the basic diagnostic scores
and their standard errors. Each diagnostic score represents
one estimate of the acceptability rating the system being eval-
iated would receive if it were deficient only with respect to
the corresponding perceptual quality. Summary scozes, repre-
senting the combined effects of signal qualities and background
qualities, respectively are also shown. Gross scores relating
to acceptability, judged pleasantness and judged intelligibilityare shown in the bottom half of the figure.
Isometric scores are based only on direct ratings ofthe respective characteristicj.
Prametric scores are based on predictions of accept-
ability from combined diagnostic scores for signal quality and
combined diagnostic scores for background quality.
Composite scores for acceptability are based onisometric scotes for acceptability, parametric scores for
acceptability, and on composite ratings of pleasantness and
intelligibility.
119

CL. IMCAA
t *1.Ehi';60
I- * P4
Val Ii n IC! It 0! 4
4v C% -4 . Ic lLa-LQ
II..
a'-
r C>
120~dt.
EEuivalent PAR! scores and Equivalent DRT scores are
currently obtained by simple linear regression techniques
applied to composite acceptabifity scores and isometric intel-
ligibility ratings, respectively. However, it is expected that
more precise estimates of DRT scores will be obtained in the
future through the application of multiple prediction techniques
to the DAM diagnostic scores. Fig. 2 shows the correlation
between DAM acceptability scores (composite) and PARM test
results for a sample of modern digital voice communication ]z
systems. Fig. 3 shows the correlation between isometric intel-
ligibtijlry ratings and DRT total scores.
DAMI evaluiations have been performed on an-extremely
broad sample of stace-of-the-art narrow band and broad band
digital voice communication systems. Norms for various condi-
tions of speech/noise ratio band restriction, and other simpleforms of signal degradation have also been established. These
normative data provide Dynastat witla truly unique capability pfor detailed, useful interpretation of RAH for future experi-
=qntal systems or conditions. Research, contemplated and in
progress, will serve to expand DAM's range of application and
provide norms for yet to-be-encountered processing techniques
and transmission conditions.
For further information regarding the technical aspects
of the DAM and on the evaluation services Dynascat offers with
it please contact:
Dr. William D. Voiers FDynastat, inc.2704 Rio Grande, Suite 4Austin, Texas 78705
Phone: (512) 476-4797
121
- J•

Administrative or contractual information relatingS" --to Dynastat's services with the DA14 may be obtained from
Mr. Ira L. Panzer at the same address and phone number.
122
- . . ._I
122
- . . . ---~-..

1
APPENDIX B
DERIVATION OF THE PROBABILITY DENSITY FUNCTIONFOR TAE STUDENTIZED RANGE STATISTIC
12
!I
123

APENDIX B
DEZRVbTION OF THE PROBABILITY DENSITY FUNCTION
FOR THE STUDENTIZED RANGE STATISTIC
From Fiqure 3.1, let
x max O XzJn - (8.1)
Then
Z= - 8 (B.2)
and
fz(Z) f , (B.3)
as shown in Papoulls (B.-I1.
Now the correlative dintribution of a and 0 is
F (Xy) a P(N X g, Y)
- P((x1 f x i)n(xj ! y for at least one J)
- P({Xi s x i}xi y il
• k
x x
124

Then the joint probability density of a and 0 is
•k-(fBx,y) - •- F ,~xy (B.5)]
(k-1)x(fxW-P(Yk 2 fx fxfx (Y) x > y i
Thus
+= [FX l~~k- 2X() (-
( . ((w)-FX(w-*z) k fx(x e)dw z : 0
f (z
i12
!12
Ii
REFERENCES
B.1 Papoulis, A., Probability, Random Variables, and StochasticProcesses, McGraw-Hill, 1965.
126.
Lii
126
APPENDIX C
MINICONPUTER BASEDDIGITAL SIGNAL PROCESSING LABORATORY
I.
127

A minicomputer-based Digital Signal Processing Laboratory has
been under construction at (jeorgia Tech since August 1973. It is now
an extensive hardware-software complex dedicated to research and
instruction in many digital signal processing and minicomputer related
areas. This appendix describes briefly the elements of this system. 2i
The system is based upon three minicomputers, an Eclipse 5230
with 64K of 16-bit memo.:, and a NOVA 830 with 64K of 16-bit memory in
the Research Lab, and a NOVA 820 with 32K of 16-bit memory in the
Student Lab. The uses of these computers are numerous and diverse.
Hence, the various hardware and software components of the system will
be presented separately.
THE RESEARCH COMPUTERS
A block diagram of the basic research computer facility is
shown in Figure 1. Included in this section are only those peripherals
which are used by many applications. A full set of peripherals are
listed in Table 1.
The computational power for the system is supplied by two
groups of the Eclipse 5230, which has 64K of 16-bit semiconductor
memory (+ CACHE), a floating-point processor, hardware multiply
divided, a memory management unit, and writable control storage
(for microprogramming the processor), and by one ground of the NOVA
830, which has a floating-point processor, hardware multiply-divide,
a memory management unit, and 64K of 1 .isec 16-bit memory. Bulk
storage is supplied by three discs. The main disc is a 192 M Byte
moving head drive shared gy the Eclipse and the NOVA 830. Each of the
128

...... ..
:i
DA - DIABLO 33
44192
M BYTEDISC
B10 S 5 BYTESS~~BY79E 6._
ECLIPSE S 230 NOVA 830 NOVA 82064K WORKS ME]MORY 32K WORDS
WRITABLE CONTRL MAXAGEMENT HIGH SPEDSTORE MEMOR•Y IPB 64 WORDS RS-232 MULTIPLY-DIVIDEMAAEMN FLOATING POINT ' -
* FLOATING-POINT MULTIPLY-DIVIDMULTIPLY-DIVID __
KENNEDY (300 .,,)7 TRACK AG IPAPER TAPE
TAPE READER
NOVACASSETT
PAPER TAPE
PUNCH
CX1
FIGUR E 1
The Basic System for the Research Laboratory
129
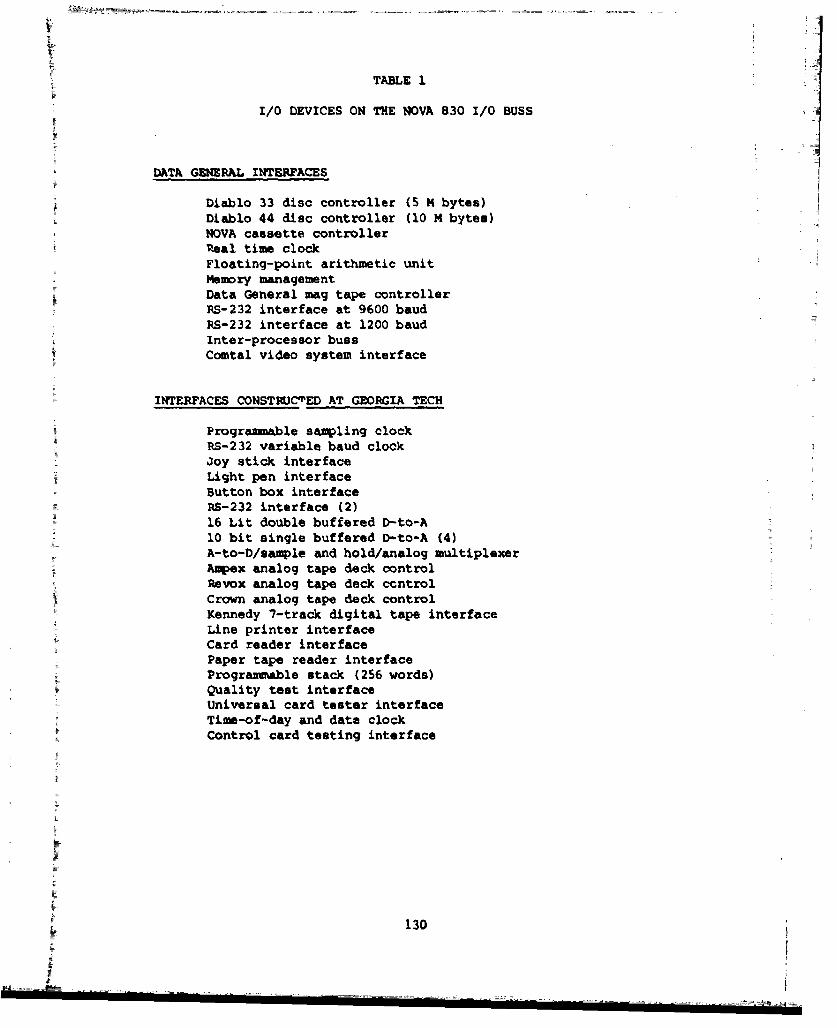
TABLE 1
I/0 DEVICES ON THE NOVA 830 I/O BUSS
DATA GENERAL INTERFACES
Diablo 33 disc controller (5 H bytes)Diablo 44 disc controller (10 M bytes)NOVA cassette controllerReal time clockFloating-point arithmetic unitMemory managementData General mag tape controllerRS-232 interface at 9600 baudRS-232 interface at 1200 baudInter-processor bussComtal video system interface
INTERFACES CONSTRUCTED AT GEORGIA TECH
Programmable samling clockRS-232 variable baud clockJoy stick interfaceLight pen interfaceButton box interfaceRS-232 interface (2)16 Lit double buffered D-to-A10 bit single buffered D-to-A (4)A-to-D/sample and hold/analog multiplexerAmpex analog tape deck controlRevox analog tape deck controlCrown analog tape deck controlKennedy 7-track digital tape interfaceLine printer interfaceCard reader interfacePaper tape reader interfaceProgrammable stack (256 words)Quality test interfaceUniversal card tester interfaceTime-of-day and date clockControl card testing interface
1
" ~130
other two disc units is of the moving head type,, and each has one
fixed and one removable pack. The Diablo model 44 disc has 10 M byte
capacity, and is used by the Ec-lipse alone. The Diablo model 33 has
* 5 M byte capacity, and is shared by the NOVA 830 and the NOVA 820
(instructional) computers. Additional bulk storage is supplied by.
two tape units, a NOVA cassette tape and a 7-track digital unit (a
9-track unit is on order from Data General). The cassette is standard
Data General peripheral, while the 7-track was interfaced at Georgia . 4Tech.
Additional general purpose devices include a card reader, a
line printer, a paper tape reader, and a paper tape punch. These
units were all interfaccd at Georgia Tech. -The foreground of the NOVA 830 is used a a general peripheral
control ground for sharing the scarce peripherals. Most all of the
general purpose and special purpose peripherals in the system are
interfaced to the NOVA 830 (see Table 1), and this ground accesses
all the other grounds on the other computers in the system to access
these peripherals.
THE GRAPHICS SUBSYSTEM
One of the major design criteria for this system was a high
level of high speed graphical interaction between the user and the
computer. Figure 2 shows the hardware associated with the graphical
subsystem.
K This system supports many types of graphical interaction.
First, it supports line printer graphics both in the axis-graph mode
and in the X-Y-Z mode for picture reproduction. Second, the Tektronix
131

AZTR C
OOFT UNI
DIA b/A D/
x y Z
CRT
5l2z5l~x~bit
CRT bTJLAY LIGHTPNN
PUNJU 2
The WVA 830 Grapbical gu&Ymtm132

4010 graphical unit gives storage type vector graphics at 9600 baud
and cross hair feedback interaction. Third, refresh graphics in
[ supplied by driving X-Y-Z CRT's directly from 3 of the D-to-Als. A
light pen (built at Georgia Tech), along with two joy sticks, 3 button
[ boxes, and two potentioiseters give interaction in the refresh mode.
Fourth, a CALCOMP incresental plotter (interfaced at Georgia Tech),
"gives hard copy capability in the vector and character mode%. Last,
a Costal video processor gi-ts X-Y-Z CRT support on % 512x512 display
with eight bits resolution.
THE AUDIO SURSYSTM4
A diagram of the audio subsystem is given in Figure 3. This
aubsystem was constructed as an aid to interactive speech processing.
The whole system is centered on a patch bay located with the
NOVA 830. This patch bay gives the user great flexibility in interccn-
necting the individual audio components.
Data acquisition is handled through a 12-bit (10 Asec) A-to-D
with an 8-channel analog multiplexer on its input. Data playback is
handled by i 16-bit double buffered D-to-A. The sampling rate on
these two units is controlled by a progranmable clock. Four additional
channels of 8 bit D-to-A's form single buffered analog outputs. The
entire data acquisition and playback system was built at Georgia Tech.
Four analog taoo drive. are available for use vitn the system.
Two of these, a Crown 800 and L Rvox tape drive, are interfaced so
they may be controlled by the computer. The Crown interface allows
the positioning of the tape to any desired position (within tape
stretch). Either of the two Ampex drives Pay be used under computer
133

NI0VA830
SDOUBLE - to-DBUFFERED-
D/ASL,••8. ~u'"'" rCHANNEL
S-.-.-...• •ANALOG
REVOXANALOG
"TKPEDRIVE
D/A DA / /
AUDIO PATCH BAY
AME (2) EATHKI T VARIABLE
ANALOG TAPE AMPLIFIER i'ILRS (4)DRIVE
F
,INTER-ROOM I FIECMUICA110 IXE
BOX FILTERS
800 D300 D600:• ANALOG -AUDI~O AUDIO•-TAPE DRIVE AMPLIFIER AMPLIFIER
SFIGUJRE 3
The Audio Subsystem on the NOVA 830134

control in place of the tevox.
Four variable filters and three audio amplifiers are also .7'
available for use with this system. -1SPEECH QUALITY TEST SUBSYSTEMI
The speech quality test subsystem depicted in Figure 4 is
designed for the automated control cf subjective quality tests. The
subsystem consists of six stations, located in a separate speech quality Ilaboratory and controlled by the NOVA 830 computer. Each of the Istations has a CRT, 15 response buttons, a "read" button, ear phones,
and a volume control for each ear. The computer interface can read the
buttons at any station, clear and set the ready flip flop, and, using a
software character generator, display messages to the subjects on the
CRT's.
This quality system has several distinct advantages over a
non-automated system. First, it eliminates much of the hand work on
data reduction. Second, it allows on-line statistical analysis. Last,
it allows the subjective test to reconfigure itself based on the subject
responses.
THE OPTICAL DATA PROCESSING SUBSYSTEM
A diagram of the optical data processing facility i3 given in
Figure 5. This subsystem has three components. The first component,
the "picture acquisition" component, consists of a Micro NOVA Micro-
computer (in Dr. William Rhodes' laboratory) wnich controls an
electro-mechanical scanner. This equipment is still under development.
Second, the Micro NOVA also controls an optical data digitizer for
picture acquisition. The third component in this system is the
135

NOVA
830
S~SIX LISTENING STATIONS
EACH STATION.: CRT
13 BUTTONS- t.FIwy BUTTON
(;.%R PHONES & VOLUME CONTROL
136

NOVA
830
MICRO NOVA X Y Z
- -CRT
(SmORAGS)
SCANNING-AND OPTICAL X Y Z
DATAP,.EDUC TION DIGITIZER --
CRT
(CAMERA)
FIGURE 5
Thu Optical Data Processing Subsystem
137

* :"picture playback" facility. This facility consists of 3 D-to-A's
and two CRT scopes. One CRT is of the storage type, and allows quick
viewing of the pictures being displayed. The second CRT is equipped
with a scope camera. The interchangeable backs on this camera allow
the production of either polaroid or 120 roll film pictures. The
Costal video system can also be used to produce pictures.
STHE COMPUTER NETWORK SUBSYSTEM
A "star" computer network is currently under development in the
digital signal processing laboratory. The basic hardware for this
* :system is shown in Figure 6. The NOVA 830 communicates with the
Eclipse through an interprocessor buss (IPD), and with several other
computers through high speed, variable baud rate, RS-232 standard, 4as~nchronous, serial interfaces. These RS-232 interfaces were designed
and built at Georgia Tech, and are capable of speeds up to 152K baud.
SThe hardware for this system exists and is tested. The software
is currently under development.
THE UNIVERSAL CARD TESTER AND THE HARDWARE PHILOSOPHY
One of the most iqportant subsystems of the digital signal pro-
cessing laboratory is the universal card tester. To understand how this
is used, it is important to understand the hardware philosophy of the
laboratory. Most of the hardware constructed in the laboratory is
constructed in prebuilt chassis. Each chassis contains 40 56-pin
connectors. The computer I/O buss enters each chassis and is split
2.nto 3 sub-busses, called the "data buss," the "control buss," and the
"address buss." If this is not the final chassis on the daisy chain,
the busses are regrouped, and extended to the next chassis.
138

•! IPB
ECLIPSE NOVA
S230 830
PROGAAHABLE BAUD: - -- RATE CONTROL •
'•'. 2152 KBPS
I I
Ii I,,[, I
MICRO NOVA HONEYWELL NOVA
NOVA 1200 316 820
FIGURE 6
The Computer Network Subsystem
139

• I -
NOVA NOVA CARD TESTER
830
SWITCH PANEL
PATCH PANEL
FIGURE 7
The Univeroal Card Tenter
140
| --- ____ ___ - ~ -
The hardware interfaces constructed in the chassis are mostly
constructed from pre-designed printed circuit boards. A list of the
'PC cards available for interface construction is given in Table 2.
Most interfaces consist of using some set of "standard" cards with,
perhaps, some additional construction.
The main problem in hardware construction, therefore, is in
building and testing the "standard" cards, often with semi-skilled
labor. This is the purpose of the universal card tester.
A diagram of the universal card tester is given in Figure 7.
The tester has a switch panel, a patch panel, and a single "standard"
56-pin connector as an "input," and "output," or as an "external."
Each pin has a parallel connection to the patch panel for external
connection. The computer can read or write individual bits to any pin
position. Hence, any dasired input/output sequence can be presented
to a card being tested, and the results can be read back by the
computer.
The software package associated with the card tester allows the
user to test and debug any of the standard cards. In addition, a
special card allows the testing of individual integrated circuit chips.
THE BASIC INSTRUCTIONAL COMPUTER (NOVA 820)
The NOVA 820 computer and its associated peripherals forms a
computer and signal processing facility dedicated to student activities.
These activities mainly include several laboratories associated with
course and student project work. The hardware is configured so as to
allow maximum utilization of the software developed in the research
laboratory.
141

TABLE 2
STANDARD PC CARDS USED IN THE MODULAR CONSTRUCTION SYSTEM
CARD NAME PURPOSE
Single Address Address decode
Dual Address Address decode
Control Interrupt control
Input buffer 16 bit input buffer
Output buffer 16 bit output buffer IDMA Direct memory access control
Counter 16 bit up/down counter
Memory 256x256 bit high speedmemory (43 msec)
SRS-232 (1) High speed serial converter
RS-232 (2) Medium speed serial converter
?16800 CPU Micro-processor CPU
M6800 Memory (1) Micro-processor memry (4K Ram)
M6800 Memory (2) Micro-processor memory (4K RAM,4K ERROR)
M6800 Buffer Micro-processor buffer
M6800 Control Micro-processor interruptcontrol
Kluge General purpose
4
L
142

Figure 8 shows the basic NOVA 820 computer system and Table 3
"gives a list of peripherals. The CPU has 32K of 800 nsec memory and a >4hardware multiply-divide unit. Bulk storage is formed by two moving-
head disc drives totaling 5 M bytes of storage. These discs are shared
with the NOVA 830, and coununication between the processors is
maintained on a high speed RS-232 port.
Many of the peripherals have been constructed so as to be
identical, from a conputer command viewpoint, to those on tC - search
facility. Hence, the D-to-A's, the double buffered D-to A's, thos
A-to-D, the A-to-D 8-channel analog multiplexer, and the programmable
clock all utilize the same commands as their counterparts on the NOVA
830. These peripherals givt the NOVA 820 a similar audio and refresh
graphics capability to the NOVA 830.
Interactive q., phics on the NOVA 820 is handled Ly a M6800
control plasma terminal designed to look like a Tektronixs 4010.
Hence, all the graphics packages developed for the NOVA 830 will run
on the NOVA 820.
THE MICRO-COMPUTER SUBSYSTEM (M6800)
One of the most important developments in modern control tech-
nology has been the development of the micro-processor. The micro-
processor subsystem of the student (NOVA 820) laboratory was developed
with three purposes:
1. To develop a micro-processor board set for use as
a general interfacing tool.
2. To develop a hardware interface between NOVA 820
143

DIABLO 33
5 MI BYTES
I3 K
DOUBLE BUFFERED
A/D D/A (16 BITS)
AKALOG KULTIpLEXER
The NOVA 820 Basic System
144

TABLE 3
I/0 DEVICES ON THE NOVA 820 I/0 BUSS - j
BATA GENERAL INTERFACES
Diablo 33 disc controller
35-232 interface at 1200 baudInter-processor buss
INTERFACES CONSTRUCTED AT GEORGIA TECH
Programmable sampling clockLight pen interface16 bit double buffered D-to-A10 bit single buffered D-to-A (4)A-to-D/samle and hold/analog multiplexerLine printer/M6800 input interface1M6800 Micro-computer CPU146800 4K memory module (2)146800 control and communication interfacePlasma display interface
L
145
=JI

and a micro-process.r and to develop software for
the NOVA 820 which %llow simple, interactive
software developmcnt for the microprocessor.
2. To develop software for the micro-processor to do
the graphics and character generation tasks related
to the plasma scope.
All three of these purposes have been accomplished. Future
goals for the subsystem include the addition of another 8 bit micro.-
processor board *8080A) and the development of a system based on the
new Data General 16 bit micro-processor.
A diagram of the hardware associated with the micro-processor
is shown in Figure 9. Through a general interface to the micro-
processor's buss, the NOVA 820 can completely control the micro-
processor and load and examine the micro-processor memory. Through a
3tandard interrupt interface, the NOVA 820 can communicate with the
micro-processor as it would any other peripheral. This environment
allows great flexibility in the use of the micro-processor.
The micro-processor itself has 8K of 8 bit, 1 msec memory, an
interrupt I/0 port, and a 16 bit I/0 buffer. Expansion of the hardware
and software for this subsystem is continuing.
146

NOVA
$20
FIDM1UTC9
Tha NIIO-FrceesoISNTERFACEr
M6847
APPfDIDTX D
SOFIVARE SIMMARY
148

PROGRAM NAME, ACUNrLANGUAGE. FORTCATEGORY: GENERAL
SWITCH TYPE PURPOSE
I G INPUT STARTING ADDRESS FROM TTY lR G DATA IS REAL(ASSUME INTEGER OTHERWISE)0 L OUTPUT (CONTIGUOUS) FILE -- MUST COME FIRST
PURPOSETO CONCAIENATE A SET OF CONTIGIOUS FILES INTO A SINGLE OUTPY
----
PROGRAM NAME. ACONTSLANGUAGE. FORTCATEGORY. GENERAL
SWITCIH TYPE PURPOSE
R G DATA IS REAL--ASSUMED INTEGER OTHERWISEO L CONTIGIOUS OUTPUT FILE
PURPOSETO CONCATENATE A SET OF CONTIGIOUS INPUT FILES OF INTEGRAL NOF CYLINDERS INTO A SINGLE OUTPUT FILE
PROGRAM NAME ADPCMLANGUAGE: FORTCATEGORY: SPEECH
SWITCH TYPE PURPOSE jP I.. PITCH FILE {jI L INPUT FILE (SPEECH)0 L OUTPUT FILE (SPEECH)C L FEEDBACK COEFFIENT FILEX L QUANTIZED ERROR OUTPUT FILEE L ERROR OUTPUT FILEM L MULTIPLIER OUTPUT FILED L DATA FILEL L LISTING FILE
149
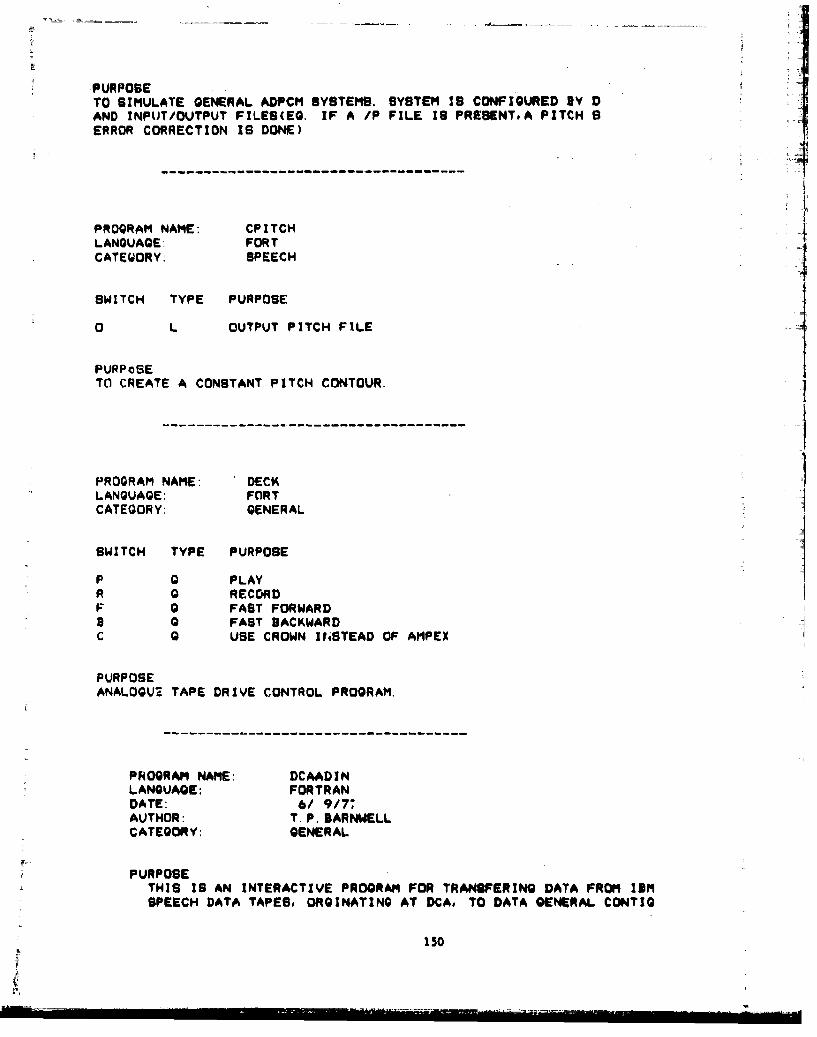
PURPOSETO SIMULATE GENERAL ADPCM SYSTEMS. SYSTEM IS CONFIGURED BY DAND INPUT/OUTPUT FILES(EG. IF A /P FILE IS PRESENT, A PITCH SERROR CORRECTION IS DONE)
------------------------------------
PROGRAM NAME: CPITCH 4LANGUAGE: FORTCATEQORY: SPEECH
SWITCH TYPE PURPOSE
0 L OUTPUT PITCH FILE
PURPOSE ITO CREATE A CONSTANT PITCH CONTOUR.
-PROGRAM NAME: DECKLANGUAGE: FORTCATEGORY: GENERAL
SWITCH TYPE PURPOSE
P 0 PLAY
R G RECORDF 0 FAST FORWARD9 G FAST BACKWARDC 0 USE CROWN IN;STEAD OF AMPEX
PURPOSEANALOGUV TAPE DRIVE CONTROL PROGRAM,
PROGRAM NAME: DCAADINLANGUAGE: FORTRANDATE: 6/ 9/77AUTHOR: T.P. BARNWELLCATEGORY: GENERAL
PURPOSETHIS IS AN INTERACTIVE PROGRAM FOR TRANSFERING DATA FROM IMSPEECH DATA TAPES, ORGINATING AT DCA, TO DATA GENERAL CONTIG
150

FILESTHE PROGRAM IS INTERACTIVE AND SELF EXPLANITORY
PROGRAM NAME: DCAAVLANGUAGE: FORTRANDATE: 6/ 9/77AUTHOR: T.P. BARNWELLCATEGORY: GENERAL
PURPOSE"rHIS PROGRAM COMPUTES THE AVERAGE OF MANY OBJECTIVEIVEASURES COMPUTED BY OBJETIVE AND 013,12. ITS PURPOSE IS TOGaT AN OVERALL MEASURE FROM MANY SIN(..L.E WINDOWED ERRORS
PROGRAM NAME: DCATAPEINLANGUAGE: FORTRANDATE: 6/ 1/77AUTHOR: T.P. BARNWELLCATEGORY: GENERAL
PURPOSETHIS I13 AN INTERACTIVE PROGRAM TO TPANSFER AN IBM 9 TRACKTAPE CODED IN EBCDIC TO AN ASCII FILE ON RDOS FILE STRUCTURE
PROGRAM NAME: DATAMAKE 11LANGUAGE: FORTCATEGORY: GENERAL
:7i
SWITCH TYPE PURPOSE
I L INPUT INSTRUCTION FILE0 L OUTPUT INSTRUCTION FILE
D L DATA FILE
PURPOSETO MAKE A NEW DAT 'VILE FOR THE SYSTEM'IC TESTING OFANY SYSTEM.
15ZI151

PROGRAM NAME: DATASTARTLANGUAGE:. FORTCATEGORY: GENERAL
PURPOSEINTERACTIVE PROGRAM FOR CREATING CONTROL FILE FOR DATAMAKE.
PROGRAM NAME: DFDPLANGUAGE: FORTCATEGORY: GENERAL
SWITCH TYPE PURPOSE
I R A INPUT DATA FILE (OPTIONAL.)0 R A OUTPUT FILTER COEFFICIENTSM R A MAGNITUDE SPECTRUM (OPTIONALP R A PHASE SPECTRUM (OPTIONAL)
PURPOSEDESIGNS DIGITAL FILTERS
PROGRAM NAME: DFDLANGUAGE: FORT
* CATEGORY: OENERAL
SWITCH TYPE PURPOSE
I R A INPUT DATA FILE (OPTIONAL)0 R A OUTPUT FILTER COEFFICIENTSM R A MAGNITUDE SPECTRUM (OPTIONALP R A PHASE SPECTRUM (OPTIONAL)
PURPOSEDESIGNS DIGITAL FILTERS
FROGRAM NAME: DOWNLANGUAGE: FORTCATEGORY: SPEECH 152

PURPOSETO DROP LOWER ORDER BITS, AND/OR DROP EVERY OTHER OR 2 OUT 0
-R ------ BITS TO REDUCE SAMPLING FREQUENCY.
--------------------------------
PROGRAM NAME: FILTERLANGUAGE: FORTCATEGORY:
SPEECH
SWITCH TYPE PURPOSE
I L INPUT FILE
R L RESULT FILED L DATA FILE
PURPOSEGENERAL CANOICAL FORM DIGITAL FILTER PROGRAM.
PROGRAM NAME: FNORMLANGUAGE: FORTCATEGORY: SPEECH
SWITCH TYPE PURPOSE
I L INPUT FILER L RESULT FILE
D L DATA FILE
PURPOSE
TO NOMALIZE A FLOATING POINT FILE.
------------------------------------------
PROGRAM NAME: FFILTERLANGUAGE: FORTCATEGORY: SPEECH
SWITCH TYPE PURPOSE
I L INPUT FILE
R L RESULT 153D L DATA FILE

PURPOSEFORGROUND VERSION OF FILTER.
PROGRAM NAME: FILMPYLANGUAGE: FORTCATEGORY: GENERAL
SWITCH TYPE PURPOSE
0 R A OUTPUT FILTER COEFFM A A MAGNITUDE SPECTRUM (OPTIONAL)P R A PHASE SPECTRUM (OPTIONAL)
PURPOSEPUTS TOGETHER ANY NUMBER OF DIGITAL FILTERS TO MAKEONE FILTER (CASCADE). INPUT FILTER FILES HAVE NO BWITHCES.
PROGRAM NAME: FILPLTLANGUAGE: FORTCATEGORY: GENERAL
PURPOSEF-SWAP PROGRAM FOR DFDP
SPROGRAM NAME: 00O0LANGUAGE: FORTCATEGORY: SPEECH
PURPOSETO INITIALIZE THE CLOCK AND A/D CHANNEL.
PROGRAM NAME: HEARSLANGUAGE: ASH
CATEGORY: SPEECH 154
- -~----~- - i

SWITCH TYPE PURPOSE
I-E
PURPOSETO SAMPLE INPUT ANALOGUE DATA
* SWITCH DETENMINES SIZE OF' SAMPLE INCYLINDERSA=I, B[2, ETC
PROGRAM NAME HLPDLANGUAGE: FORTCATEGORY: SPEECH
SWITCH TYPE PURPOSE
I L INPUT SPEECH DATAP L OUTPUT PITCH DATAD L DATA FILEL L LISTING FILE
PURPOSEHARD LIMITED AUTOCORRELATION PITCH DETECTOR.
PROGRAM NAME. HIRELANGUAGE: FORTCATEGORY: SPEECH
SWITCH TYPE PURPOSE
I I A INTEOER SPEECH INPUT FILE0 1 A INTEGER IMPULSE RESPONSE OUTPUTP R A DATA FILE (OPTIONAL)L L LISTING (OPTIONAL.)
PURPOSEHOMOMORPHIC IMPULSE RESPONSE EXTRACTOR.
155
PROGRAM NAME: LPC

LANGUAGE: FORTCATEGORY: SPEECH
SWITCH TYPE PURPOSE .. ..
I L INPUT SPEECH FILEC L COEF. FILEK L PARCOR COEF. FILER L AUTO. FILED L DATA FILEL L LISTING FILE
PURPOSEBASIC BI.OCK SYNCHRONOUS AUTOCORRELATION/TOEPLITZ VOCODER TRA
PROGRAM NAME: LPRLANGUAGE: FORTRANDATE: 6/ 9/77AUTHOR: T.P. BARNWELLCATEGORY: SPEECH
SWITCH TYPE PURPOSE
A LOCAL AREA FUNCTIONSK LOCAL PARCOR COEFFICIENTSC LOCAL FEEDBACK COEFFICIENTS0 LOCAL FEEDBAK COEFFICIENTSD LOCAL BATCH (DATA) CONTROL FILER LOCAL AUTOCORRELATION COEFFICIENTSP LOCAL PITCH FILEL LOCAL LISTING FILEX LOCAL EXCITATION OUTPUT FILE
PURPOSETHIS IS A GENERAL PURPOSE LPC RECEIVER PROGRAM. IT RECONFIGUITSELF DEPENDING ON WHAT FILES APPEAR IN ITS INPUT COMMANDLINE. IF ITS "X" LINES ARE COMPILIED, THE PROGRAM CAN ADDSEVERAL DISTORTIONS TO THE OUTPUT SPEECH, INCLUDING UNIFORMBANDWIDTH DISTORTION AND UNIFORM FREQUENCY DISTORTION. IT MATHUS BE USED TO CORRECT HELIUM SPEECH OR INSTALL CONTROLLEDDISTORTIONS ON THE OUTPUT.
PROGRAM NAME: LOOKLANGUAGE: FORTCATEGORY: GENERAL 156
-I -. - - - ~ -__- _-
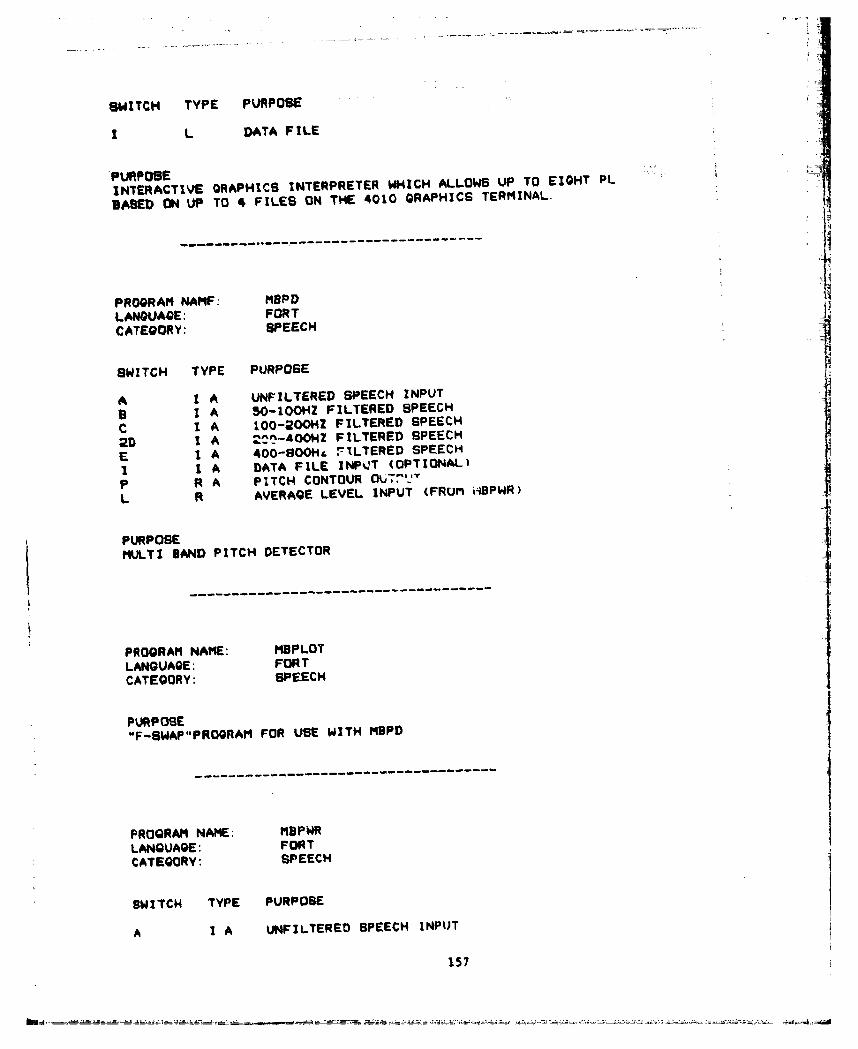
SWIITCH TYPE PUR POSE
I L DATA FILE
PURPOSEINTERACTIVE GRAPHICS INTERPRETER WHICH ALLOWS UP TO EIGHT PL
BASED ON UP TO 4 FILES ON THE 4010 GRAPHICS TERMINAL.
-- ---------------------------PROGRAM NAMF: MBPDLANGUAGE: FORTCATEGORY: SPEECH
SWITCH TYPE PURPOSE
A I A UNFILTERED SPEECH INPUT
9 1 A 50-100U Z FILTERED SPEECH
C I A 100-20OHZ FILTERED SPEECH
2D I A •..-•-400HZ FILTERED SPEECH
E I A 400-8004H- 7LTERED SPEECH
I A DATA FILE INPT (OPTIONAL)
p R A PITCH CONTOUR OU7r2T'
L R AVERAGE LEVEL INPUT (FRUM i-iBPWR)
PURPOSEMULTI BAND PITCH DETECTOR
-------------------------------------------------
PROGRAM NAME: MBPLOTLANGUAGE: FORTCATEGORY: SPEECH
PURlPOSE"F-SWAP"PROGRAM FOR USE WITH MBPD
PROGRAM NAME: MBPWRLANGUAGE: FOR TCATEGORY: SPEECH
SWITCH TYPE PURPOSE
A I A UNFILTERED SPEECH INPUT
157

B I A 50--IOOHZ FILTERED SPEECH INPUTC I A 100-200HZ FILTERED SPEECH INPUTD I A 200-400HZ FILTERED SPEECH INPUTE I A 400-800HZ FILTERED SFEECH INPUT0 1 A LEVEL OUTPUT FILE
PURPOSEAVERAGE MAGNITUDE LEVEL FOR MBPD
PROGRAM NAME: NORMLANGUAGE: FORTCATEGORY: SPEECH
SWITCH TYPE PURPOSE
I L INPUT FILER L RESULT FILED L DATA FILE
PURPOSE 2
TO NORMALIZE AN INTEGER FILE
CCC PROGRAM NAME: OBJECTIVEC LANGUAGE: FORTRANC DATE: 6/ 9/77C AUTHOR: T.P. BARNWELLC CATEGORY: SPEECH
&CC
C SWITCH TVPE PURPOSECC M LOCAL MASTER FILEC S LOCAL SLAVE FILE
C D LOCAL BATCH (DATA) FILEC L LOCAL LISTING FILE
* ccC PURPOSEC TO COMPUTE THE GAIN WEIGHTED AND NON GAIN WEIGHTED SPECTRALC DXSTANCE METRIC BETWEEN TWO SPECTRUM FILES THE SPECTRUMC FILES ARE NORMALLY GENERATED BY LPC ,PCEP, HIRE, OR SPCANA.C
* CL c
158

PROCRAM NAME: OBJ2LANQUAK: FORTRANDATE: 6/ 9/77AUTH R: T. PARNWELL-CATEGORY: SPEECH
SWITCH TYPE PURPOSE
I LOCAL MASTER FILES LOCAL SLAVE FILED LOCAL BATCH (DATA) FILEL LOCAL LISTING FILE
PURPOSETO COMPUTE THE "IN WEIGHTED AND NON GAIN WEIGHTED NON-SPECTRALDISTANCE METRIC BETWEEN TWO SPECTRUM FILES. THE NON-SPECTRUMFILES ARE NORMALLY GENERATED BY LPC ,PCEP. HIRE, OR SPCANA.
----------------------PROGRAM NAME: PCEPLANGUAGE: FORTRANDATE: 6/ 9/77AUTHOR: T.P. BARNWELLCATEGORY: SPEECH
SWITCH TYPE PURPOSE
D LOCAL BATCH (DATA) CONTROL FILEA LOCAL OUTPUT CEPSTRUM FROM AM LOCAL MASTER INPUTS LOCAL SLAVE INPUT(B)B LOCAL OUTPUT CEPSTRUM FROM BL LOCAL LISTING FILEW LOCAL INPUT (ASCII) WINDOW (FIR FILTER) FUNCTIONZ LOCAL BINARY POINT BY POINT METRIC
PURPOSETHIS I8 A GENERAL PURPOS CEPSTRAL COMPARE PROGRAM. IT ALLOWSUSER TO COMPARE ANY REGION OF THE OPOSING CEPSTRUMS AFTER AN
V WINDOW FUNCTION HAS BEEN APPLIED. THIS ALLOWS THE PROGRAM TOUSED FOR BOTH SPECTRAL ENVELOP AND EXCITATION COMPARISONS.
------------------------------------------------
PROGRAM NAME: PDISTORTLANGUAGE: FORTRANDATE: 6/ 9/77AUTHoR: T.P. BARNWELLCATEGORY: SPEECH
159

PURPOSETHIS PROGRAM 1S USED TO SYSTEMATICALLY DISTORT PITCH CONTOURTHE DISTORTION IS A CONSTANT RISE OR FALL IN THE PITCH PERIOTHE DISTORTION ONLY OCCURES IN VOICED SEGMENTS. AND THE PRO-IS INTERACTIVE.
PROGRAM NAME: PTGTCLANGUAGE- FORTCATEGORY: SPEECH
SWITCH TYPE PURPOSE
P L PITCH FILEI L INPUT SPEECHF L INPUT FILTERED SPEECH
PURPOSETO HAND PAINT A PITCH CONTOUR FOR TESTING.
PROGRAM NAME: PCHECHLANGUAGE: FORTCATEGORY: SPEECH
SWITCH TYPE PURPOSE
M L INPUT STATISTICS FILET L OUTPUT STATISTICS FILED L DATA FILEA L ADD ON HISTIGRAM :N0 L ADD ON HISTOGRAM OUTL L LISTING
PURPOSETO CHECK THE OUTPUT OF A PITCH PERIOD ESTIMATOR AGAINSTA HAN PAINTER PITCH CCNTOUR.
PROGRAM NAME: PRNTLANGUAGE: FORT 160CATEGORY: GENERAL

PURPOSETO PRINT A PROGRAM WITH FILE NAE AND DATE
-PROGRAM NAME: SCALELANGUAGE: FORTCATEGORY: SPEECH
SWITCH TYPE PURPOSE
I L INPUT FILER L RESULT FILE
PURPOSETO SCALE A DATA FILE FOR FILTER t
i
PROGRAM NAME: SFLANGUAGE: FORTCATEGORY: GENERAL
SWITCH TYPE PURPOSE
I L INPUT FILED L DATA FILER L RESULT FILEC L COEF. FILE
PURPOSETIME VARYING DIGITAL FILTER PROGRAM
PROGRAM NAME: SPCANALANGUAGE: FORTRANDATE: 6/ 9/77AUTHOR: T.P. BARNWELLCATEGORY: SPEECH
SWITCH TYPE PURPOSE
I LOCAL INPUT FILE 161
V _

LOCAL OUTPUT SPECTRUMD LOCAL BATCH (DATA) CONTROL FILE" • "L LOCAL ILCO SPECTRUM OUTPUT FILE
PURPOSETHIS IS A GENERAL PURPOSE SPECTRUM ANALYSIS PROGRAM DESIGNEDTO DO rEPSTRUM OR LPC DECONVOLVED SPECTRUM.
i
PROGRAM NAME: ZCPD .LANGUAGE: FORTCATEGORY: SPEECH
tiSWITCH TYPE PURPOSE
I L INPUT FILEP L OUTPUT PITCH CONTOURD L DATA FILE (OPTIONAL
PURPOSEZERO CROSSING PITCH DETECTOR
I
162
Recommended