40Ar/39Ar Geochronology Results for the Blind Lake,
Deer Creek Lake, Flat Top, Henrie Knolls, Tabbys Peak, Tabbys Peak SW, Wig Mountain, and Wig Mountain NE
Quadrangles, Utah
by
Utah Geological Survey and New Mexico Geochronology Research Laboratory
Bibliographic citation for this data report:
Utah Geological Survey and New Mexico Geochronology Research Laboratory, 2009, 40Ar/39Ar geochronology results for the Blind Lake, Deer Creek Lake, Flat Top, Henrie Knolls, Tabbys Peak, Tabbys Peak SW, Wig Mountain, and Wig Mountain NE quadrangles, Utah: Utah Geological Survey Open-File Report 547, variously paginated, also available online, <http://geology.utah.gov/online/ofr/ofr-547.pdf>.
OPEN-FILE REPORT 547 UTAH GEOLOGICAL SURVEY a division of Utah Department of Natural Resources 2009
INTRODUCTION
This open-file report makes available raw analytical data from laboratory procedures completed to determine the age of rock samples collected during geologic mapping funded or partially supported by the Utah Geological Survey (UGS). The references listed in table 1 report the age of the samples and generally provide additional informa-tion such as sample location, geologic setting, and significance or interpretation of the samples in the context of the area where they were collected. This report was prepared by the New Mexico Geochronology Research Laboratory (NMGRL) under contract to the UGS. These data are highly technical in nature and proper interpretation requires considerable training in the applicable geochronologic techniques.
Table 1. Sample numbers and locations. Sample # 7.5' quadrangle Latitude (N) Longitude (W) Reference HK092106-1 Henrie Knolls 37° 35' 24.9" 112° 39' 36.9" Biek and others (in prep.) BT091106-1 Blind Lake 38° 09' 34.3" 111° 29' 57.4" Doelling and Kuehne (in prep.) HK092006-3 Henrie Knolls 37° 36' 56.9" 112° 43' 40.8" Biek and others (in prep.) HH091406-1 Flat Top 38° 29' 06.7" 111° 28' 15.3" Doelling and Kuehne (in prep.) HL091206-2 Deer Creek Lake 38° 05' 07.6" 111° 27' 39.7" Doelling and Kuehne (in prep.) D-17 Tabbys Peak SW 40° 18' 39.6" 112° 56' 36.3" Clark and others (2008); Clark (2008) D-4 Tabbys Peak SW 40° 19' 17.9" 112° 54' 01.1" Clark and others (2008); Clark (2008) D-6 Wig Mountain 40° 20' 03.3" 113° 01' 42.2" Clark and others (2008); Clark (2008) D-40 Tabbys Peak 40° 27' 47.7" 112° 59' 13.8" Clark and others (2008); Clark (2008) D-42 Wig Mountain NE 40° 26' 55.3" 113° 01' 57.8" Clark and others (2008); Clark (2008) D-7 Wig Mountain 40° 21' 37.8" 113° 00' 04.0" Clark and others (2008); Clark (2008) D-47 Tabbys Peak 40° 26' 18.0" 112° 56' 57.2" Clark and others (2008); Clark (2008)
Location data based on NAD27.
DISCLAIMER This open-file release is intended as a data repository for information gathered in support of various UGS projects. The data are presented as received from the NMGRL and do not necessarily conform to UGS technical, editorial, or policy standards; this should be considered by an individual or group planning to take action based on the contents of this report. The Utah Department of Natural Resources, Utah Geological Survey, makes no warranty, expressed or implied, regarding the suitability of this product for a particular use. The Utah Department of Natural Resources, Utah Geological Survey, shall not be liable under any circumstances for any direct, indirect, special, incidental, or consequen-tial damages with respect to claims by users of this product.
1
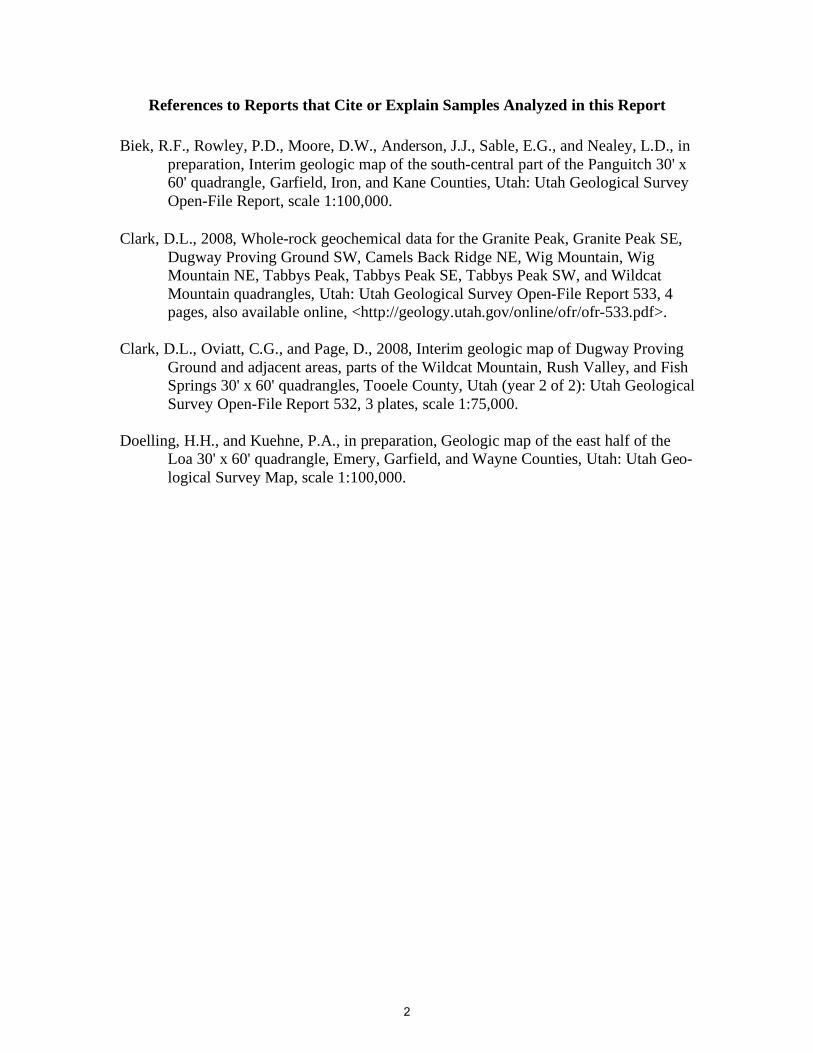
References to Reports that Cite or Explain Samples Analyzed in this Report Biek, R.F., Rowley, P.D., Moore, D.W., Anderson, J.J., Sable, E.G., and Nealey, L.D., in
preparation, Interim geologic map of the south-central part of the Panguitch 30' x 60' quadrangle, Garfield, Iron, and Kane Counties, Utah: Utah Geological Survey Open-File Report, scale 1:100,000.
Clark, D.L., 2008, Whole-rock geochemical data for the Granite Peak, Granite Peak SE,
Dugway Proving Ground SW, Camels Back Ridge NE, Wig Mountain, Wig Mountain NE, Tabbys Peak, Tabbys Peak SE, Tabbys Peak SW, and Wildcat Mountain quadrangles, Utah: Utah Geological Survey Open-File Report 533, 4 pages, also available online, <http://geology.utah.gov/online/ofr/ofr-533.pdf>.
Clark, D.L., Oviatt, C.G., and Page, D., 2008, Interim geologic map of Dugway Proving
Ground and adjacent areas, parts of the Wildcat Mountain, Rush Valley, and Fish Springs 30' x 60' quadrangles, Tooele County, Utah (year 2 of 2): Utah Geological Survey Open-File Report 532, 3 plates, scale 1:75,000.
Doelling, H.H., and Kuehne, P.A., in preparation, Geologic map of the east half of the
Loa 30' x 60' quadrangle, Emery, Garfield, and Wayne Counties, Utah: Utah Geo-logical Survey Map, scale 1:100,000.
2
40Ar/39Ar Geochronology Results
By
Lisa Peters
FEBRUARY 27, 2009
Prepared for
Utah Geological Survey 1594 West North Temple, Suite 3110
PO Box 146100 Salt Lake City, Utah 84114-6100
NEW MEXICO GEOCHRONOLOGY RESEARCH LABORATORY
(NMGRL)
CO-DIRECTORS LABORATORY TECHNICIAN DR. MATTHEW T. HEIZLER LISA PETERS DR. WILLIAM C. MCINTOSH
Internal Report # : NMGRL-IR-545 and 561
3
Introduction
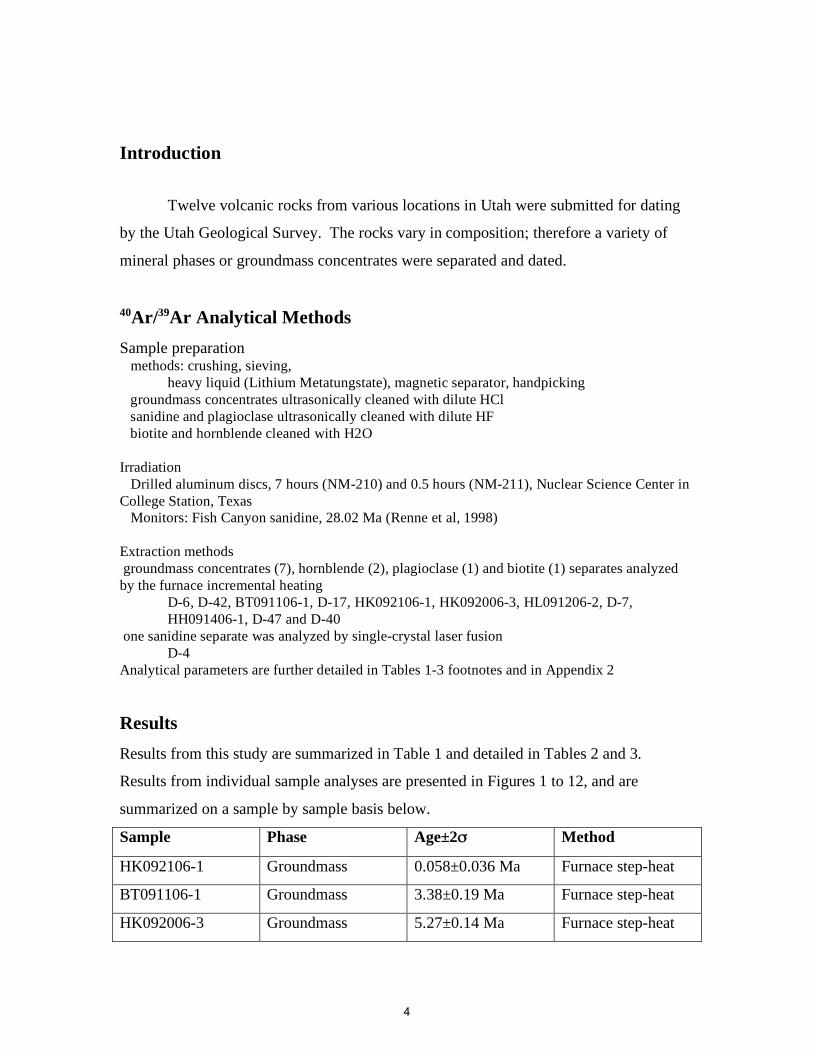
Twelve volcanic rocks from various locations in Utah were submitted for dating
by the Utah Geological Survey. The rocks vary in composition; therefore a variety of
mineral phases or groundmass concentrates were separated and dated.
40Ar/39Ar Analytical Methods Sample preparation methods: crushing, sieving,
heavy liquid (Lithium Metatungstate), magnetic separator, handpicking groundmass concentrates ultrasonically cleaned with dilute HCl sanidine and plagioclase ultrasonically cleaned with dilute HF biotite and hornblende cleaned with H2O Irradiation Drilled aluminum discs, 7 hours (NM-210) and 0.5 hours (NM-211), Nuclear Science Center in College Station, Texas Monitors: Fish Canyon sanidine, 28.02 Ma (Renne et al, 1998) Extraction methods groundmass concentrates (7), hornblende (2), plagioclase (1) and biotite (1) separates analyzed by the furnace incremental heating
D-6, D-42, BT091106-1, D-17, HK092106-1, HK092006-3, HL091206-2, D-7, HH091406-1, D-47 and D-40
one sanidine separate was analyzed by single-crystal laser fusion D-4 Analytical parameters are further detailed in Tables 1-3 footnotes and in Appendix 2
Results Results from this study are summarized in Table 1 and detailed in Tables 2 and 3.
Results from individual sample analyses are presented in Figures 1 to 12, and are
summarized on a sample by sample basis below.
Sample Phase Age±2σ Method
HK092106-1 Groundmass 0.058±0.036 Ma Furnace step-heat
BT091106-1 Groundmass 3.38±0.19 Ma Furnace step-heat
HK092006-3 Groundmass 5.27±0.14 Ma Furnace step-heat
4
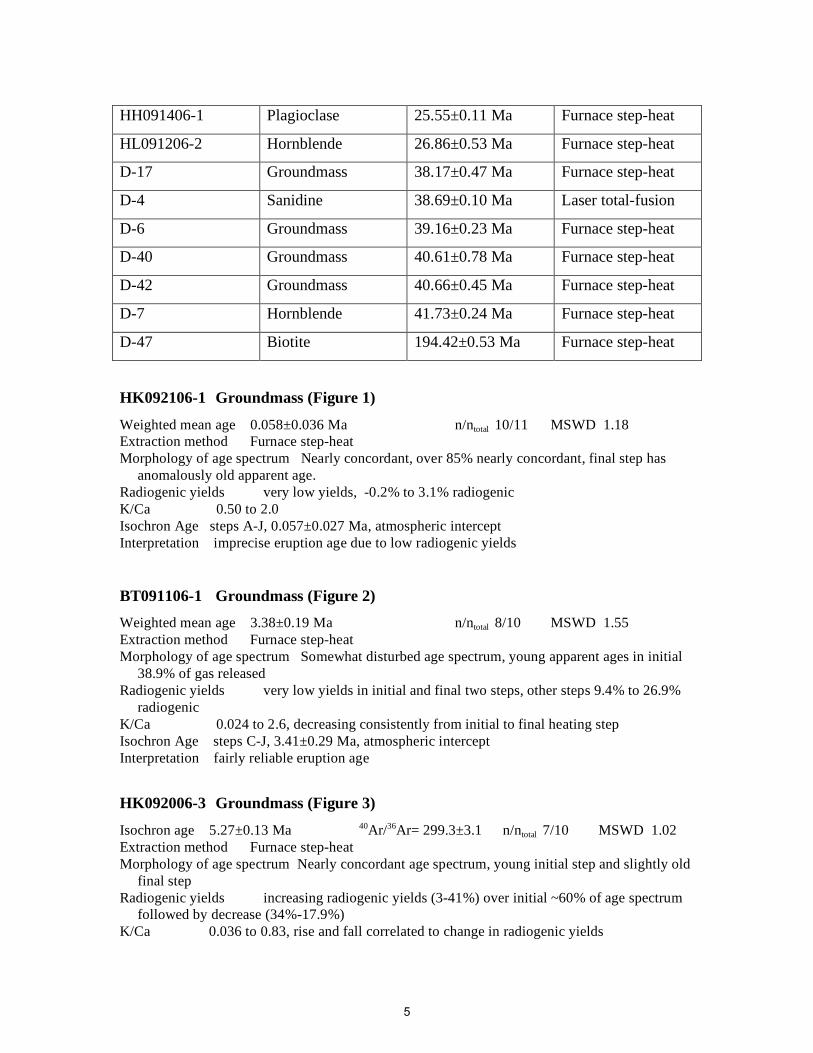
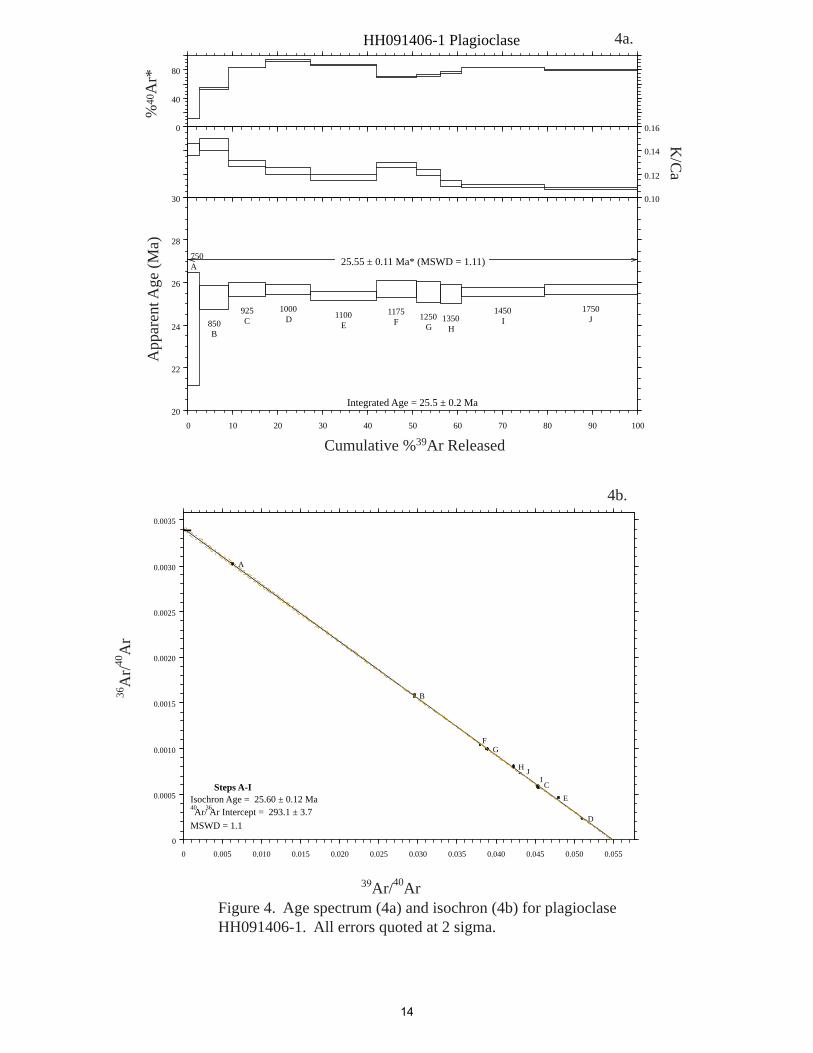
HH091406-1 Plagioclase 25.55±0.11 Ma Furnace step-heat
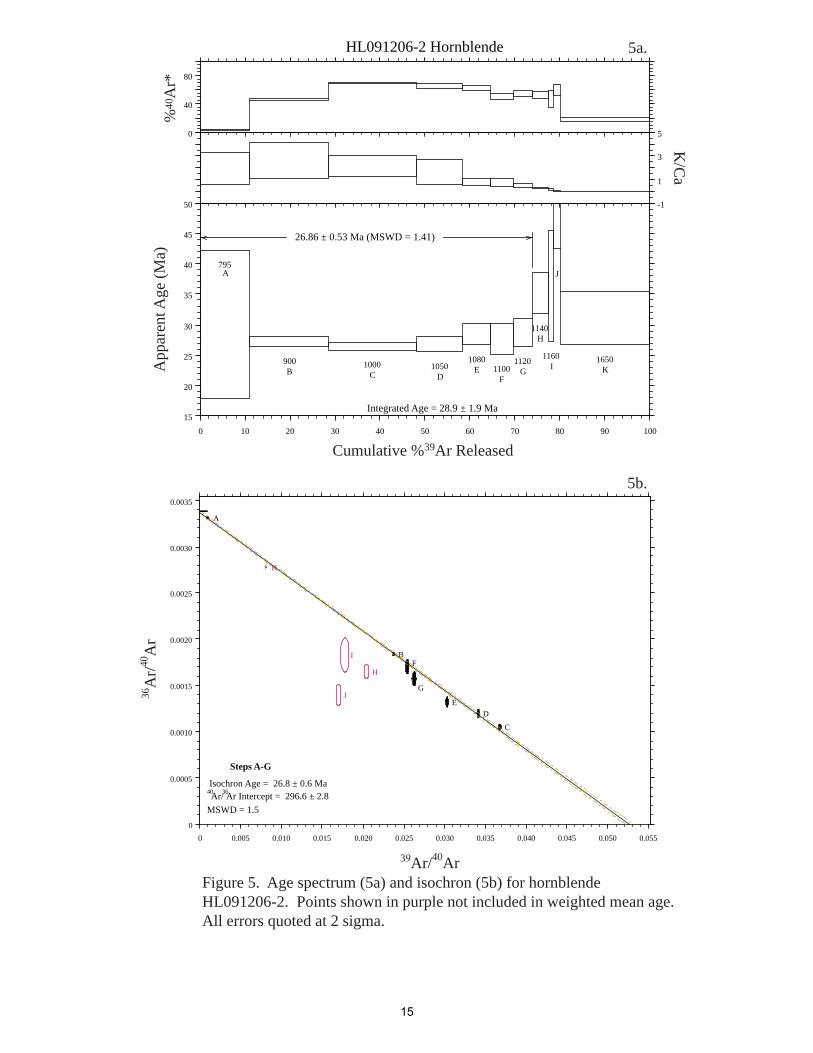
HL091206-2 Hornblende 26.86±0.53 Ma Furnace step-heat
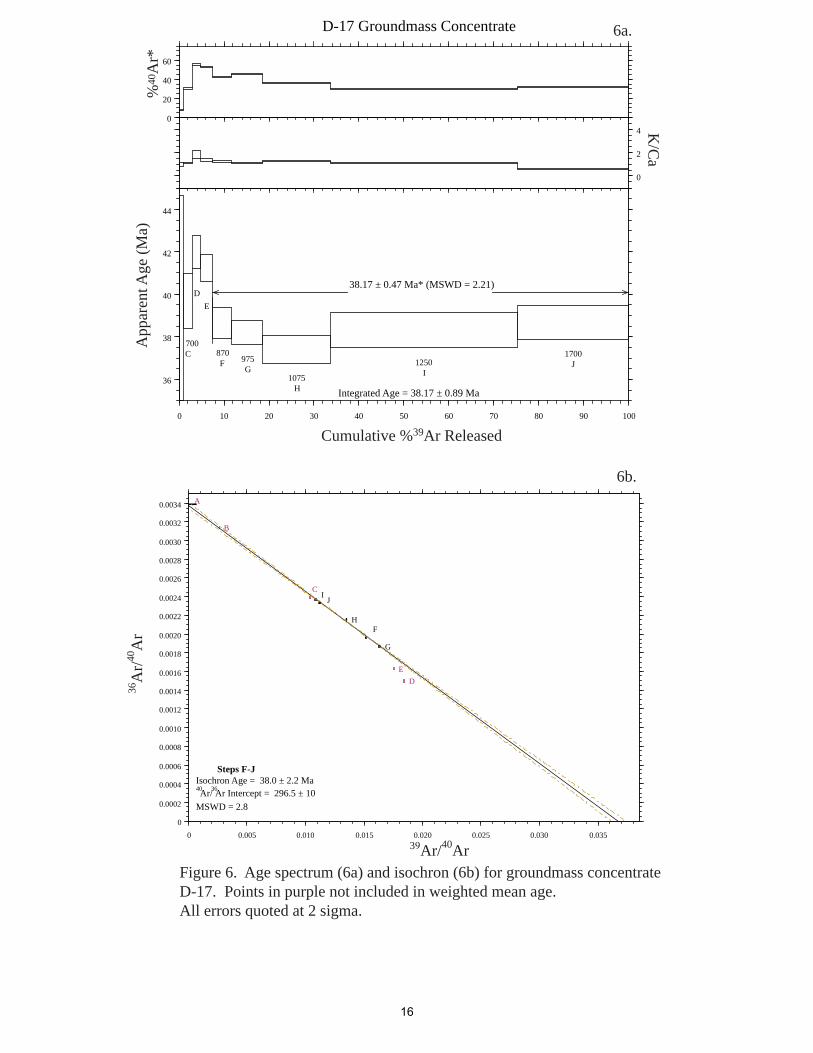
D-17 Groundmass 38.17±0.47 Ma Furnace step-heat
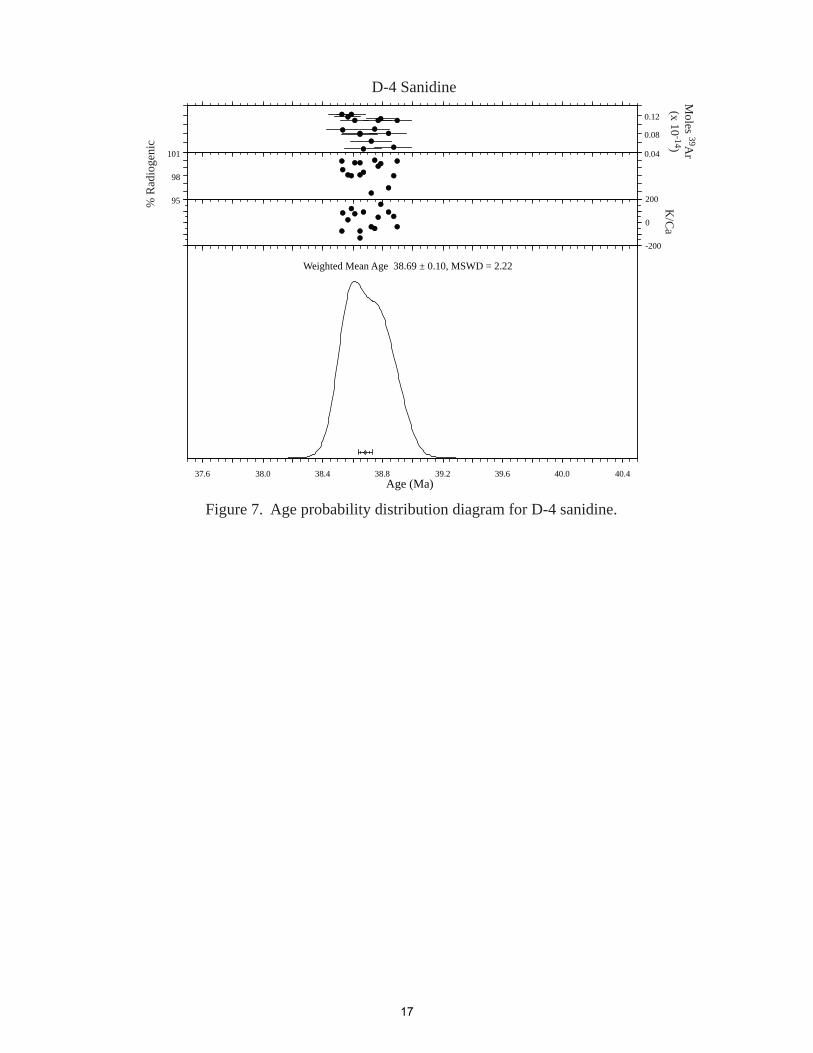
D-4 Sanidine 38.69±0.10 Ma Laser total-fusion
D-6 Groundmass 39.16±0.23 Ma Furnace step-heat
D-40 Groundmass 40.61±0.78 Ma Furnace step-heat
D-42 Groundmass 40.66±0.45 Ma Furnace step-heat
D-7 Hornblende 41.73±0.24 Ma Furnace step-heat
D-47 Biotite 194.42±0.53 Ma Furnace step-heat
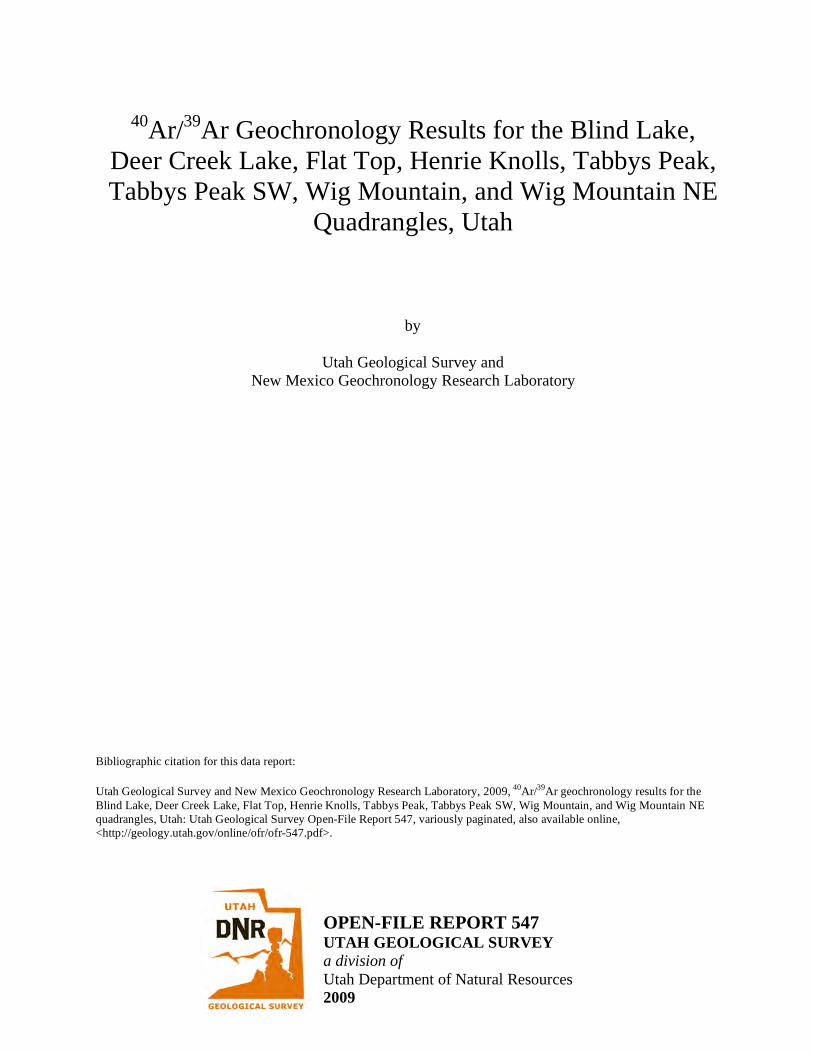
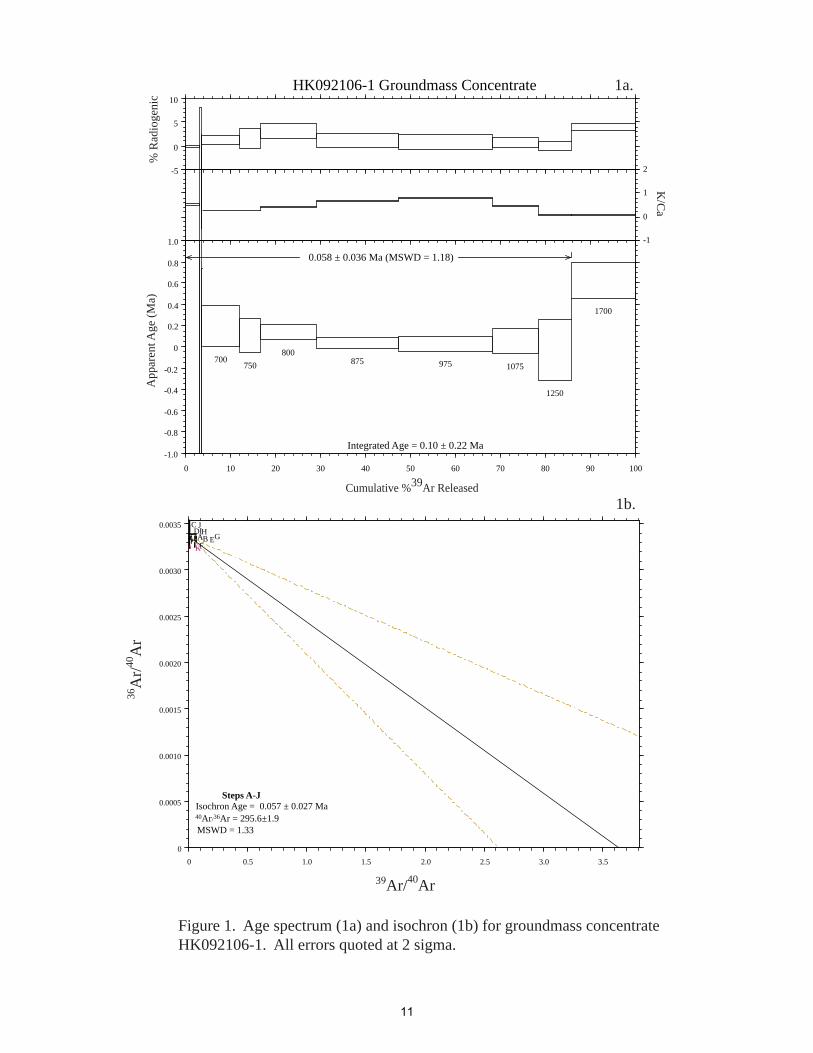
HK092106-1 Groundmass (Figure 1) Weighted mean age 0.058±0.036 Ma n/ntotal 10/11 MSWD 1.18 Extraction method Furnace step-heat Morphology of age spectrum Nearly concordant, over 85% nearly concordant, final step has
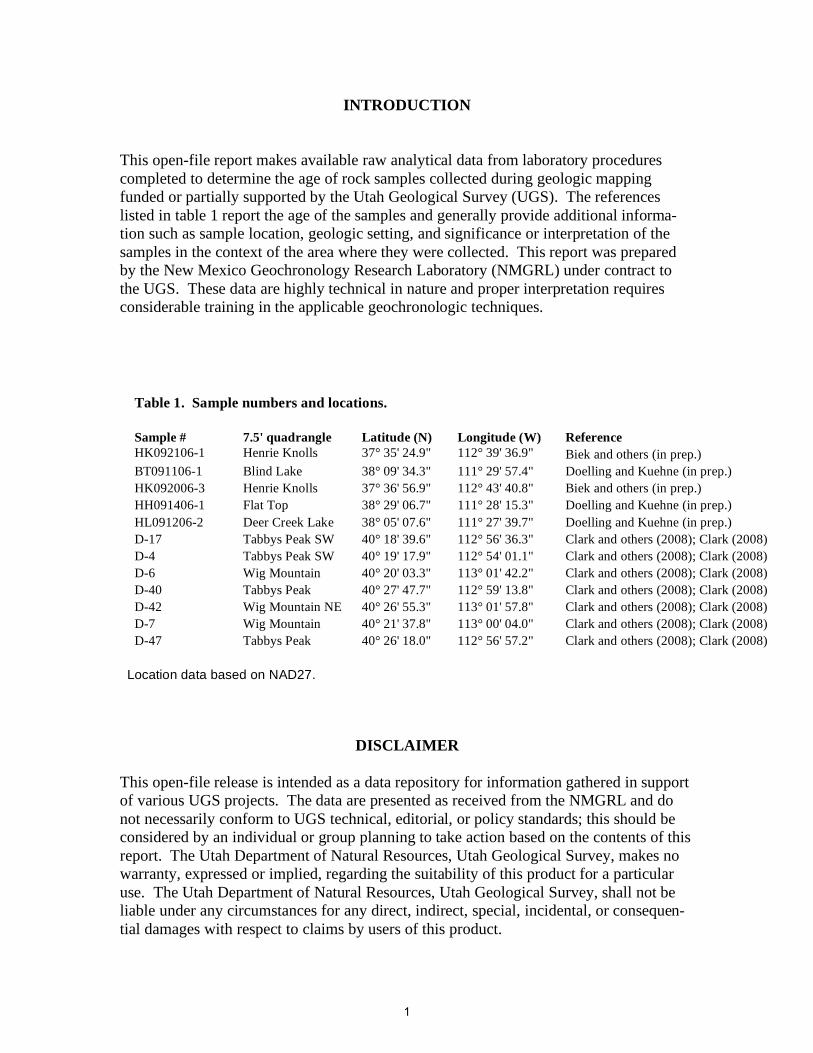
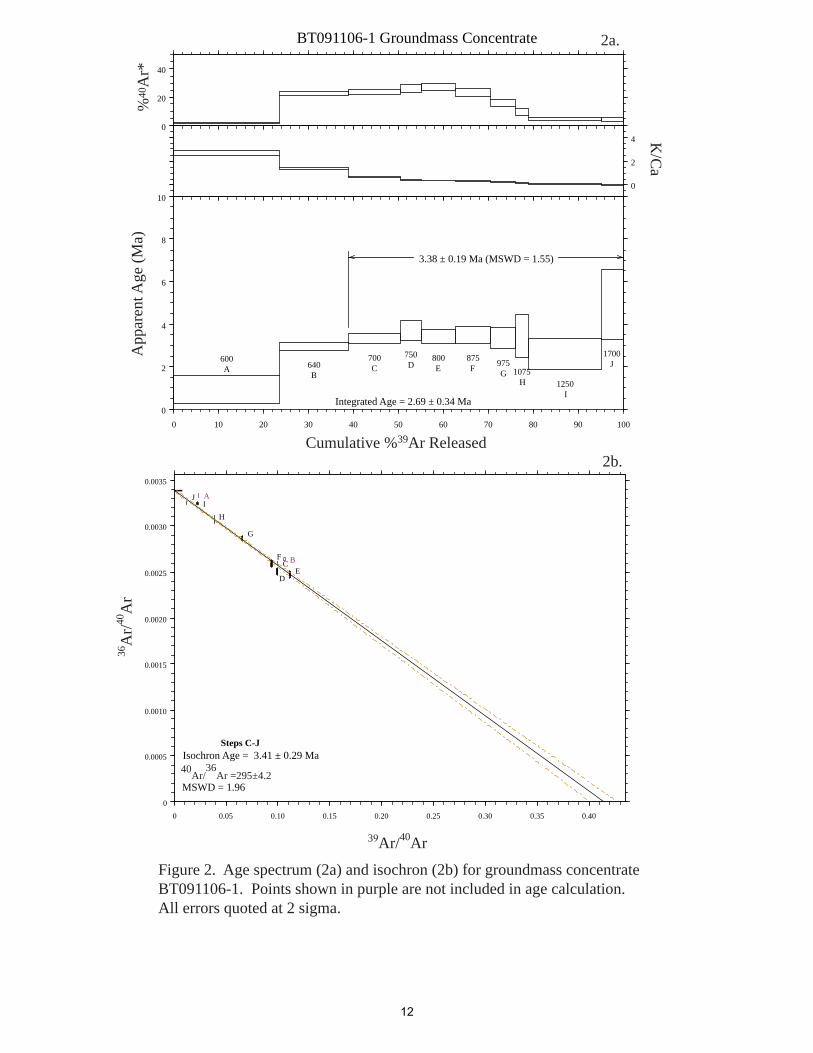
anomalously old apparent age. Radiogenic yields very low yields, -0.2% to 3.1% radiogenic K/Ca 0.50 to 2.0 Isochron Age steps A-J, 0.057±0.027 Ma, atmospheric intercept Interpretation imprecise eruption age due to low radiogenic yields BT091106-1 Groundmass (Figure 2) Weighted mean age 3.38±0.19 Ma n/ntotal 8/10 MSWD 1.55 Extraction method Furnace step-heat Morphology of age spectrum Somewhat disturbed age spectrum, young apparent ages in initial
38.9% of gas released Radiogenic yields very low yields in initial and final two steps, other steps 9.4% to 26.9%
radiogenic K/Ca 0.024 to 2.6, decreasing consistently from initial to final heating step Isochron Age steps C-J, 3.41±0.29 Ma, atmospheric intercept Interpretation fairly reliable eruption age
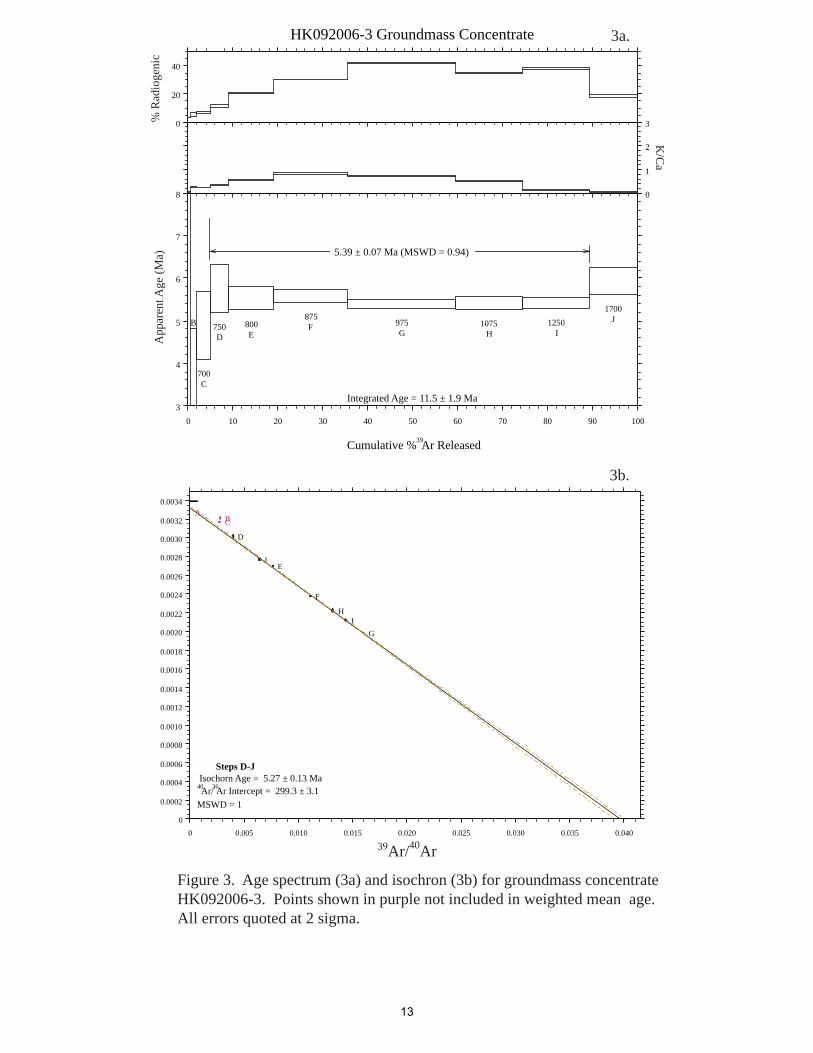
HK092006-3 Groundmass (Figure 3) Isochron age 5.27±0.13 Ma 40Ar/36Ar= 299.3±3.1 n/ntotal 7/10 MSWD 1.02 Extraction method Furnace step-heat Morphology of age spectrum Nearly concordant age spectrum, young initial step and slightly old
final step Radiogenic yields increasing radiogenic yields (3-41%) over initial ~60% of age spectrum
followed by decrease (34%-17.9%) K/Ca 0.036 to 0.83, rise and fall correlated to change in radiogenic yields
5
Isochron Age steps D-J, 5.27±0.13 Ma, slightly above atmospheric intercept (299.3±3.1) Interpretation reliable eruption age
HH091406-1 Plagioclase (Figure 4) Weighted mean age 25.55±0.11 Ma n/ntotal 10/10 MSWD 1.11 Extraction method Furnace step-heat Morphology of age spectrum Well-behaved age spectrum, 100% used in weighted mean age
calculation Radiogenic yields Initial increase from 10.9% to 93.2% radiogenic over first 27.55% of gas
released followed by oscillatory behavior K/Ca 0.11 to 0.14, overall decreasing but somewhat oscillatory, inversely correlated with rise and fall in radiogenic yield Isochron Age steps A-I, 25.60±0.12 Ma, atmospheric intercept Interpretation reliable eruption age
HL091206-2 Hornblende (Figure 5) Weighted mean age 26.86±0.53 Ma n/ntotal 7/11 MSWD 1.41 Extraction method Furnace step-heat Morphology of age spectrum Nearly concordant age spectrum, over initial ~74%, slightly older
apparent ages over remainder of age spectrum Radiogenic yields Increase from 2.2% to 68.9% over initial 48.2% of age spectrum
followed by overall decrease to 18% radiogenic K/Ca overall decrease from 1.9 to 0.011 Isochron Age steps A-G, 26.8±0.6 Ma, atmospheric intercept Interpretation reliable eruption age
D-17 Groundmass Concentrate (Figure 6) Weighted mean age 38.17±0.47 Ma n/ntotal 5/10 MSWD 2.21 Extraction method Furnace step-heat Morphology of age spectrum Somewhat disturbed age spectrum, saddle-shaped Radiogenic yields Increase from -1.2% to 55.8% radiogenic over initial 4.9% of spectrum
followed by decrease to 31.2% K/Ca correlated to rise and fall in radiogenic yields, with values ranging from 0 to 1.8 Isochron Age steps F-J, 38.0±2.2 Ma, atmospheric intercept Interpretation fairly reliable eruption age
D-4 sanidine (Figure 7) Weighted mean age 38.69±0.10 Ma n/ntotal 15/15 MSWD 2.18 Extraction method single-crystal laser fusion Distribution of ages Somewhat Gaussian Outliers none Radiogenic yields 95.7% to 99.8% K/Ca 34.1 to 1017.2 Interpretation accurate eruption age
6
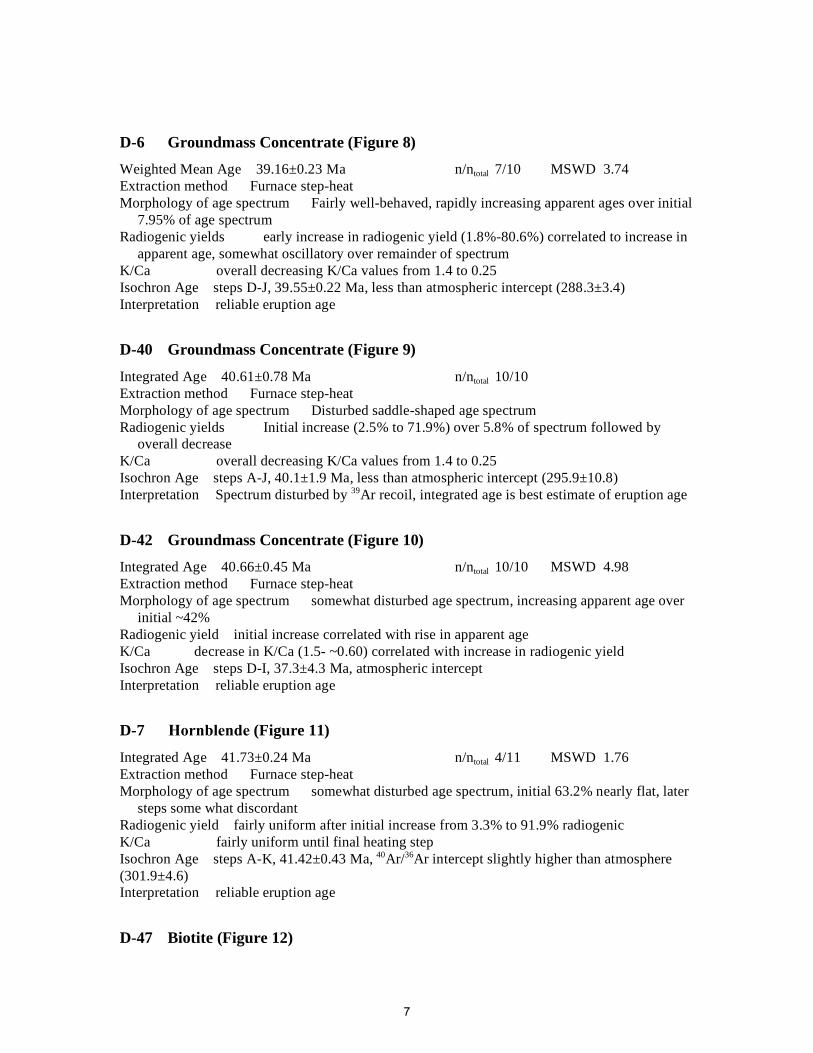
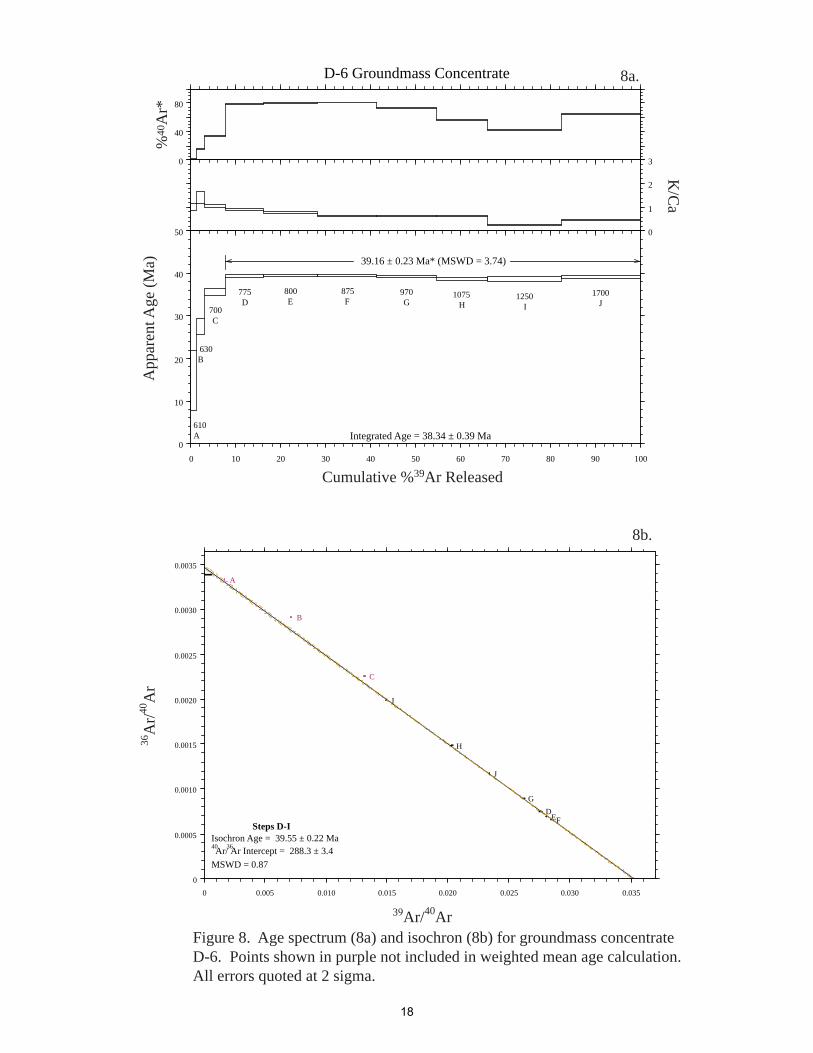
D-6 Groundmass Concentrate (Figure 8) Weighted Mean Age 39.16±0.23 Ma n/ntotal 7/10 MSWD 3.74 Extraction method Furnace step-heat Morphology of age spectrum Fairly well-behaved, rapidly increasing apparent ages over initial
7.95% of age spectrum Radiogenic yields early increase in radiogenic yield (1.8%-80.6%) correlated to increase in
apparent age, somewhat oscillatory over remainder of spectrum K/Ca overall decreasing K/Ca values from 1.4 to 0.25 Isochron Age steps D-J, 39.55±0.22 Ma, less than atmospheric intercept (288.3±3.4) Interpretation reliable eruption age
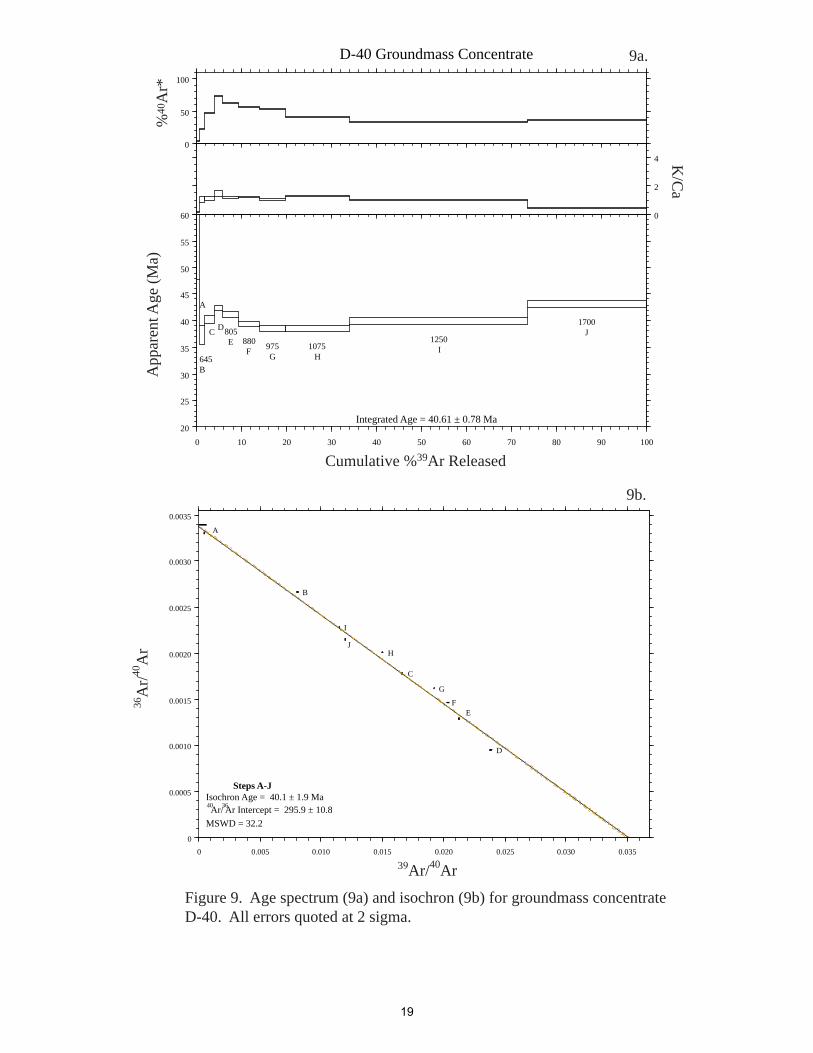
D-40 Groundmass Concentrate (Figure 9) Integrated Age 40.61±0.78 Ma n/ntotal 10/10 Extraction method Furnace step-heat Morphology of age spectrum Disturbed saddle-shaped age spectrum Radiogenic yields Initial increase (2.5% to 71.9%) over 5.8% of spectrum followed by
overall decrease K/Ca overall decreasing K/Ca values from 1.4 to 0.25 Isochron Age steps A-J, 40.1±1.9 Ma, less than atmospheric intercept (295.9±10.8) Interpretation Spectrum disturbed by 39Ar recoil, integrated age is best estimate of eruption age
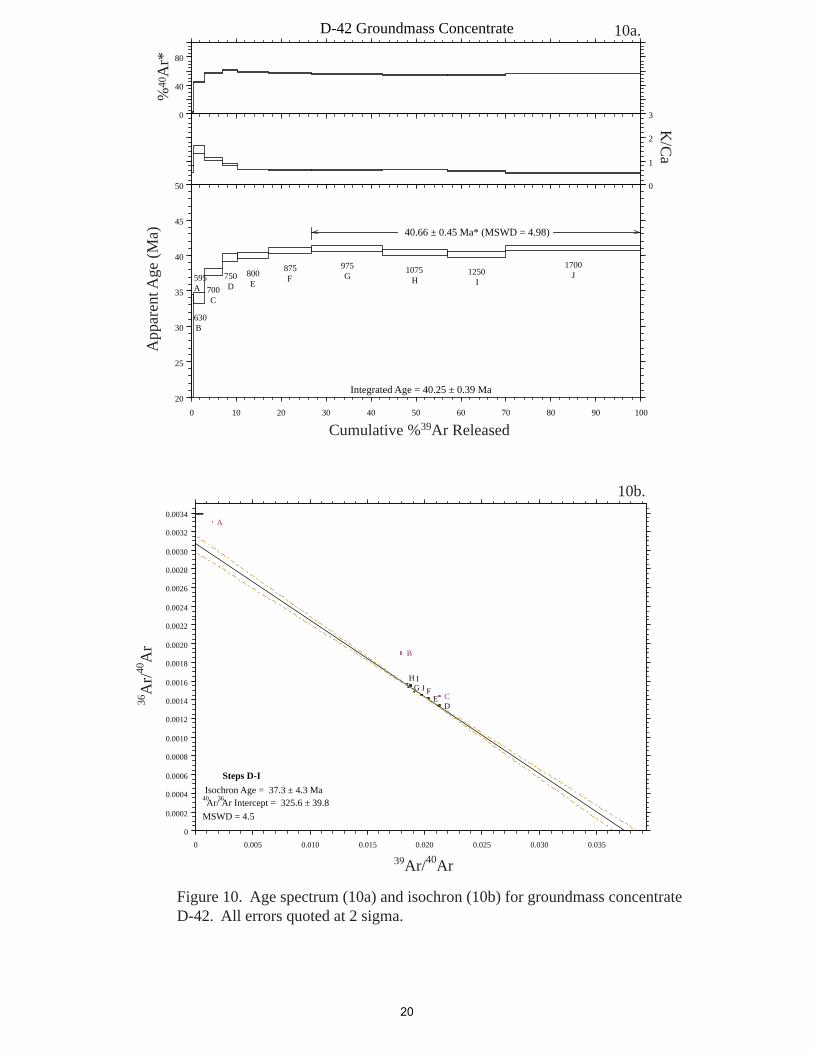
D-42 Groundmass Concentrate (Figure 10) Integrated Age 40.66±0.45 Ma n/ntotal 10/10 MSWD 4.98 Extraction method Furnace step-heat Morphology of age spectrum somewhat disturbed age spectrum, increasing apparent age over
initial ~42% Radiogenic yield initial increase correlated with rise in apparent age K/Ca decrease in K/Ca (1.5- ~0.60) correlated with increase in radiogenic yield Isochron Age steps D-I, 37.3±4.3 Ma, atmospheric intercept Interpretation reliable eruption age
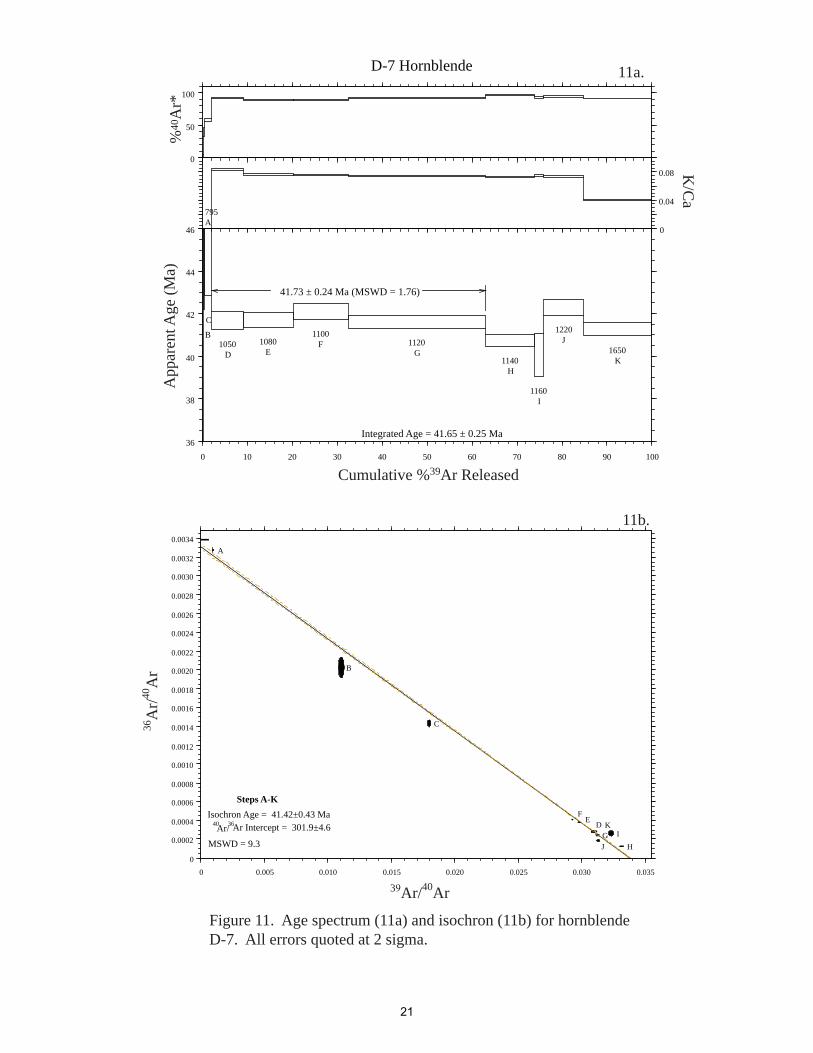
D-7 Hornblende (Figure 11) Integrated Age 41.73±0.24 Ma n/ntotal 4/11 MSWD 1.76 Extraction method Furnace step-heat Morphology of age spectrum somewhat disturbed age spectrum, initial 63.2% nearly flat, later
steps some what discordant Radiogenic yield fairly uniform after initial increase from 3.3% to 91.9% radiogenic K/Ca fairly uniform until final heating step Isochron Age steps A-K, 41.42±0.43 Ma, 40Ar/36Ar intercept slightly higher than atmosphere (301.9±4.6) Interpretation reliable eruption age
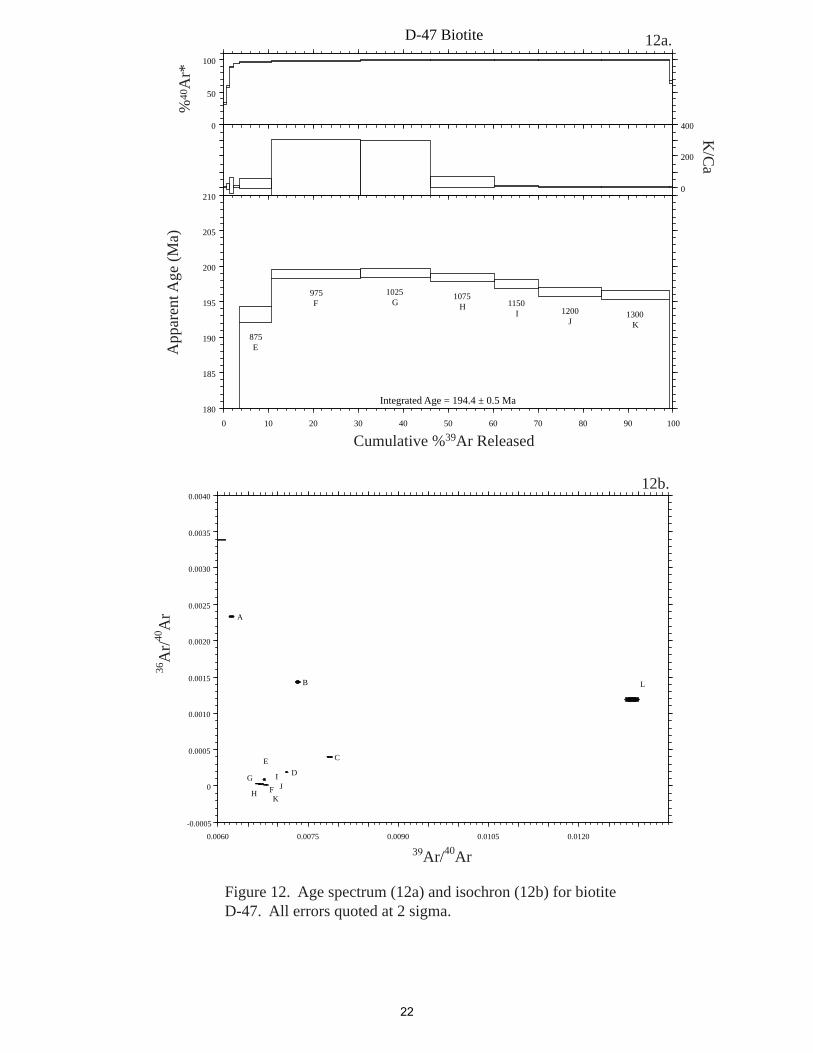
D-47 Biotite (Figure 12)
7
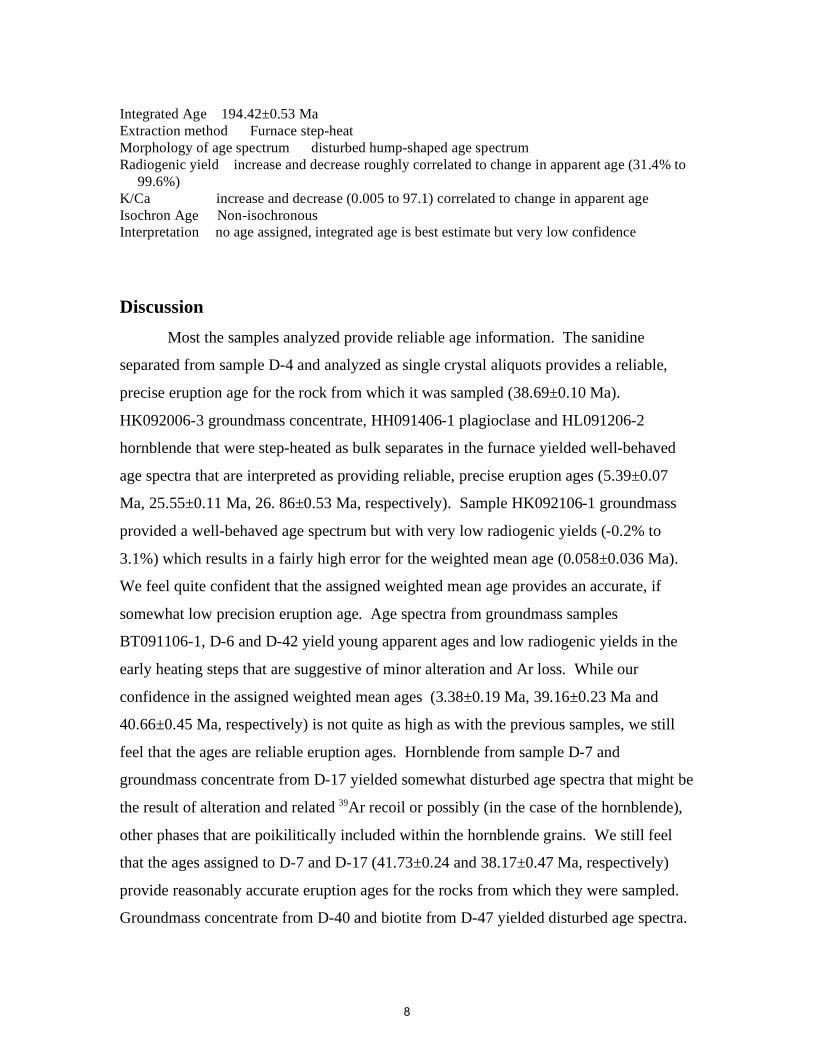
Integrated Age 194.42±0.53 Ma Extraction method Furnace step-heat Morphology of age spectrum disturbed hump-shaped age spectrum Radiogenic yield increase and decrease roughly correlated to change in apparent age (31.4% to
99.6%) K/Ca increase and decrease (0.005 to 97.1) correlated to change in apparent age Isochron Age Non-isochronous Interpretation no age assigned, integrated age is best estimate but very low confidence
Discussion Most the samples analyzed provide reliable age information. The sanidine
separated from sample D-4 and analyzed as single crystal aliquots provides a reliable,
precise eruption age for the rock from which it was sampled (38.69±0.10 Ma).
HK092006-3 groundmass concentrate, HH091406-1 plagioclase and HL091206-2
hornblende that were step-heated as bulk separates in the furnace yielded well-behaved
age spectra that are interpreted as providing reliable, precise eruption ages (5.39±0.07
Ma, 25.55±0.11 Ma, 26. 86±0.53 Ma, respectively). Sample HK092106-1 groundmass
provided a well-behaved age spectrum but with very low radiogenic yields (-0.2% to
3.1%) which results in a fairly high error for the weighted mean age (0.058±0.036 Ma).
We feel quite confident that the assigned weighted mean age provides an accurate, if
somewhat low precision eruption age. Age spectra from groundmass samples
BT091106-1, D-6 and D-42 yield young apparent ages and low radiogenic yields in the
early heating steps that are suggestive of minor alteration and Ar loss. While our
confidence in the assigned weighted mean ages (3.38±0.19 Ma, 39.16±0.23 Ma and
40.66±0.45 Ma, respectively) is not quite as high as with the previous samples, we still
feel that the ages are reliable eruption ages. Hornblende from sample D-7 and
groundmass concentrate from D-17 yielded somewhat disturbed age spectra that might be
the result of alteration and related 39Ar recoil or possibly (in the case of the hornblende),
other phases that are poikilitically included within the hornblende grains. We still feel
that the ages assigned to D-7 and D-17 (41.73±0.24 and 38.17±0.47 Ma, respectively)
provide reasonably accurate eruption ages for the rocks from which they were sampled.
Groundmass concentrate from D-40 and biotite from D-47 yielded disturbed age spectra.
8
Both the saddle-shaped age spectrum from D-40 and the hump-shaped one for D-47 are
thought to be the result of 39Ar recoil. Multi-phase samples, such as biotite containing
chlorite alteration or fine grained altered groundmass concentrate are especially
susceptible to recoil. Recoil shifts 39Ar from high K sites to low K sites, thus increasing
the apparent ages of the parts of the age spectra controlled by phases that have lost 39Ar
and decreasing the apparent ages of the parts of the age spectra controlled by phases that
have gained 39Ar. The integrated age can be considered the best estimate of a sample’s
age in cases where recoil is suspected, these are the ages we have assigned to samples D-
40 (40.61±0.78 Ma) and D-47 (194.42±0.53 Ma). We caution however, that our
confidence in these ages is not as high as our confidence in the other samples in this
group.
9
References Cited Renne, P.R., Owens, T.L., DePaolo, D.J., Swisher, C.C., Deino, A.L., and Darner, D.B.,
1998. Intercalibration of standards, absolute ages and uncertainties in 40Ar/39Ar
dating, Chemical Geology, 145, 117-152.
Steiger, R.H., and Jäger, E., 1977. Subcommission on geochronology: Convention on
the use of decay constants in geo- and cosmochronology. Earth and Planet. Sci.
Lett., 36, 359-362.
Taylor, J.R., 1982. An Introduction to Error Analysis: The Study of Uncertainties in
Physical Measurements, Univ. Sci. Books, Mill Valley, Calif., 270 p.
10
0 0.5 1.0 1.5 2.0 2.5 3.0 3.50
0.0005
0.0010
0.0015
0.0020
0.0025
0.0030
0.0035AB
CD
EF
GHIJ
K
Isochron Age = 0.057 ± 0.027 Ma40Ar/36Ar = 295.6±1.9MSWD = 1.33
HK092106-1 Groundmass Concentrate
-5
0
5
10
-1
0
1
2
0 10 20 30 40 50 60 70 80 90 100-1.0
-0.8
-0.6
-0.4
-0.2
0
0.2
0.4
0.6
0.8
1.0
700750
800875 975 1075
1250
1700
Integrated Age = 0.10 ± 0.22 Ma
0.058 ± 0.036 Ma (MSWD = 1.18)
App
aren
t Age
(Ma)
% R
adio
geni
cK
/Ca
Cumulative %39Ar Released
36A
r/40A
r
39Ar/40Ar
Figure 1. Age spectrum (1a) and isochron (1b) for groundmass concentrateHK092106-1. All errors quoted at 2 sigma.
1a.
1b.
Steps A-J
11
BT091106-1 Groundmass Concentrate
0
20
40
0
2
4
0 10 20 30 40 50 60 70 80 90 1000
2
4
6
8
10
A600
B640 C
700D
750E
800F
875
G975
H1075
I1250
J1700
Integrated Age = 2.69 ± 0.34 Ma
3.38 ± 0.19 Ma (MSWD = 1.55)
0 0.05 0.10 0.15 0.20 0.25 0.30 0.35 0.400
0.0005
0.0010
0.0015
0.0020
0.0025
0.0030
0.0035
A
BC
DE
F
G
HI
J
Isochron Age = 3.41 ± 0.29 Ma
MSWD = 1.96
Cumulative %39Ar Released
%40
Ar*
App
aren
t Age
(Ma)
K/C
a
36A
r/40A
r
39Ar/40Ar
40Ar/36
Ar =295±4.2
Figure 2. Age spectrum (2a) and isochron (2b) for groundmass concentrateBT091106-1. Points shown in purple are not included in age calculation. All errors quoted at 2 sigma.
2b.
2a.
Steps C-J
12
HK092006-3 Groundmass Concentrate
0
20
40
0
1
2
3
0 10 20 30 40 50 60 70 80 90 1003
4
5
6
7
8
B
C700
D750
E800 F
875
G975
H1075
I1250 J
1700
Integrated Age = 11.5 ± 1.9 Ma
5.39 ± 0.07 Ma (MSWD = 0.94)
Cumulative %39Ar Released
0 0.005 0.010 0.015 0.020 0.025 0.030 0.035 0.0400
0.0002
0.0004
0.0006
0.0008
0.0010
0.0012
0.0014
0.0016
0.0018
0.0020
0.0022
0.0024
0.0026
0.0028
0.0030
0.0032
0.0034A
BC
D
E
F
G
HI
J
Isochorn Age = 5.27 ± 0.13 Ma40Ar/36Ar Intercept = 299.3 ± 3.1MSWD = 1
Steps D-J
39Ar/40Ar
Figure 3. Age spectrum (3a) and isochron (3b) for groundmass concentrateHK092006-3. Points shown in purple not included in weighted mean age.All errors quoted at 2 sigma.
3a.
3b.
App
aren
t Age
(Ma)
% R
adio
geni
cK
/Ca
13
HH091406-1 Plagioclase
0
40
80
0.10
0.12
0.14
0.16
0 10 20 30 40 50 60 70 80 90 10020
22
24
26
28
30
A750
B850 C
925D
1000
E1100
F1175
G1250
H1350 I
1450J
1750
Integrated Age = 25.5 ± 0.2 Ma
25.55 ± 0.11 Ma* (MSWD = 1.11)
0 0.005 0.010 0.015 0.020 0.025 0.030 0.035 0.040 0.045 0.050 0.0550
0.0005
0.0010
0.0015
0.0020
0.0025
0.0030
0.0035
A
B
C
D
E
FG
HI
J
Isochron Age = 25.60 ± 0.12 Ma40Ar/36Ar Intercept = 293.1 ± 3.7MSWD = 1.1
Cumulative %39Ar Released
%40
Ar*
App
aren
t Age
(Ma)
K/C
a36
Ar/40
Ar
39Ar/40ArFigure 4. Age spectrum (4a) and isochron (4b) for plagioclaseHH091406-1. All errors quoted at 2 sigma.
4b.
4a.
Steps A-I
14
HL091206-2 Hornblende
0
40
80
-1
1
3
5
0 10 20 30 40 50 60 70 80 90 10015
20
25
30
35
40
45
50
A795
B900
C1000
D1050 E
1080
F1100 G
1120
H1140
I1160
J
K1650
Integrated Age = 28.9 ± 1.9 Ma
26.86 ± 0.53 Ma (MSWD = 1.41)
0 0.005 0.010 0.015 0.020 0.025 0.030 0.035 0.040 0.045 0.050 0.0550
0.0005
0.0010
0.0015
0.0020
0.0025
0.0030
0.0035
A
B
C
DE
F
G
H
I
J
K
Isochron Age = 26.8 ± 0.6 Ma40Ar/36Ar Intercept = 296.6 ± 2.8MSWD = 1.5
Cumulative %39Ar Released
%40
Ar*
App
aren
t Age
(Ma)
K/C
a36
Ar/40
Ar
39Ar/40ArFigure 5. Age spectrum (5a) and isochron (5b) for hornblendeHL091206-2. Points shown in purple not included in weighted mean age.All errors quoted at 2 sigma.
5b.
5a.
Steps A-G
15
D-17 Groundmass Concentrate
0
20
40
60
0
2
4
0 10 20 30 40 50 60 70 80 90 100
36
38
40
42
44
C700
DE
F870
G975
H1075 I
1250 J1700
Integrated Age = 38.17 ± 0.89 Ma
38.17 ± 0.47 Ma* (MSWD = 2.21)
%40
Ar*
App
aren
t Age
(Ma)
K/C
a
39Ar/40Ar0 0.005 0.010 0.015 0.020 0.025 0.030 0.035
0
0.0002
0.0004
0.0006
0.0008
0.0010
0.0012
0.0014
0.0016
0.0018
0.0020
0.0022
0.0024
0.0026
0.0028
0.0030
0.0032
0.0034 A
B
C
DE
F
G
H
IJ
Isochron Age = 38.0 ± 2.2 Ma40Ar/36Ar Intercept = 296.5 ± 10MSWD = 2.8
Steps F-J
Cumulative %39Ar Released
36A
r/40A
r
Figure 6. Age spectrum (6a) and isochron (6b) for groundmass concentrateD-17. Points in purple not included in weighted mean age.All errors quoted at 2 sigma.
6b.
6a.
16
0.04
0.08
0.12
95
98
101
-200
0
200
37.6 38.0 38.4 38.8 39.2 39.6 40.0 40.4
Weighted Mean Age 38.69 ± 0.10, MSWD = 2.22
Age (Ma)
Figure 7. Age probability distribution diagram for D-4 sanidine.
% R
adio
geni
cK
/Ca
Moles 39A
r(x 10 -14)
D-4 Sanidine
17
Cumulative %39Ar Released
%40
Ar*
App
aren
t Age
(Ma)
K/C
a36
Ar/40
Ar
39Ar/40Ar
D-6 Groundmass Concentrate
0
40
80
0
1
2
3
0 10 20 30 40 50 60 70 80 90 1000
10
20
30
40
50
A610
B630
C700
D775
E800
F875
G970
H1075
I1250
J1700
Integrated Age = 38.34 ± 0.39 Ma
39.16 ± 0.23 Ma* (MSWD = 3.74)
0 0.005 0.010 0.015 0.020 0.025 0.030 0.0350
0.0005
0.0010
0.0015
0.0020
0.0025
0.0030
0.0035
A
B
C
DEF
G
H
I
J
Isochron Age = 39.55 ± 0.22 Ma40Ar/36Ar Intercept = 288.3 ± 3.4MSWD = 0.87
Figure 8. Age spectrum (8a) and isochron (8b) for groundmass concentrateD-6. Points shown in purple not included in weighted mean age calculation.All errors quoted at 2 sigma.
Steps D-I
8a.
8b.
18
0
50
100
0
2
4
0 10 20 30 40 50 60 70 80 90 10020
25
30
35
40
45
50
55
60
A
B645
C D
E805
F880
G975
H1075 I
1250J
1700
Integrated Age = 40.61 ± 0.78 Ma
0 0.005 0.010 0.015 0.020 0.025 0.030 0.0350
0.0005
0.0010
0.0015
0.0020
0.0025
0.0030
0.0035
A
B
C
D
EF
G
H
I
J
Isochron Age = 40.1 ± 1.9 Ma40Ar/36Ar Intercept = 295.9 ± 10.8MSWD = 32.2
Figure 9. Age spectrum (9a) and isochron (9b) for groundmass concentrateD-40. All errors quoted at 2 sigma.
%40
Ar*
App
aren
t Age
(Ma)
K/C
a
Cumulative %39Ar Released
9a.
9b.
39Ar/40Ar
36A
r/40A
r
D-40 Groundmass Concentrate
Steps A-J
19
D-42 Groundmass Concentrate
0
40
80
0
1
2
3
0 10 20 30 40 50 60 70 80 90 10020
25
30
35
40
45
50
A595
B630
C700 D
750E
800 F875
G975
H1075
I1250 J
1700
Integrated Age = 40.25 ± 0.39 Ma
40.66 ± 0.45 Ma* (MSWD = 4.98)
0 0.005 0.010 0.015 0.020 0.025 0.030 0.0350
0.0002
0.0004
0.0006
0.0008
0.0010
0.0012
0.0014
0.0016
0.0018
0.0020
0.0022
0.0024
0.0026
0.0028
0.0030
0.0032
0.0034A
B
CD
EFG
H IJ
Isochron Age = 37.3 ± 4.3 Ma40Ar/36Ar Intercept = 325.6 ± 39.8MSWD = 4.5
Cumulative %39Ar Released
%40
Ar*
App
aren
t Age
(Ma)
K/C
a36
Ar/40
Ar
39Ar/40Ar
Figure 10. Age spectrum (10a) and isochron (10b) for groundmass concentrateD-42. All errors quoted at 2 sigma.
Steps D-I
10a.
10b.
20
D-7 Hornblende
0
50
100
0
0.04
0.08
0 10 20 30 40 50 60 70 80 90 10036
38
40
42
44
46A795
B
C
D1050
E1080 F
1100
G1120
H1140
I1160
J1220
K1650
Integrated Age = 41.65 ± 0.25 Ma
41.73 ± 0.24 Ma (MSWD = 1.76)
0 0.005 0.010 0.015 0.020 0.025 0.030 0.0350
0.0002
0.0004
0.0006
0.0008
0.0010
0.0012
0.0014
0.0016
0.0018
0.0020
0.0022
0.0024
0.0026
0.0028
0.0030
0.0032
0.0034A
B
C
DEF
GH
IJ
K
MSWD = 9.3
Cumulative %39Ar Released
%40
Ar*
App
aren
t Age
(Ma)
K/C
a36
Ar/40
Ar
39Ar/40Ar
Figure 11. Age spectrum (11a) and isochron (11b) for hornblendeD-7. All errors quoted at 2 sigma.
11b.
11a.
Steps A-K Isochron Age = 41.42±0.43 Ma
40Ar/36Ar Intercept = 301.9±4.6
21
D-47 Biotite
0
50
100
0
200
400
0 10 20 30 40 50 60 70 80 90 100180
185
190
195
200
205
210
E875
F975
G1025
H1075
I1150
J1200
K1300
Integrated Age = 194.4 ± 0.5 Ma
0.0060 0.0075 0.0090 0.0105 0.0120-0.0005
0
0.0005
0.0010
0.0015
0.0020
0.0025
0.0030
0.0035
0.0040
A
B
C
DE
FG
H
IJ
K
L
Cumulative %39Ar Released
%40
Ar*
App
aren
t Age
(Ma)
K/C
a
36A
r/40A
r
39Ar/40Ar
Figure 12. Age spectrum (12a) and isochron (12b) for biotiteD-47. All errors quoted at 2 sigma.
12b.
12a.
22
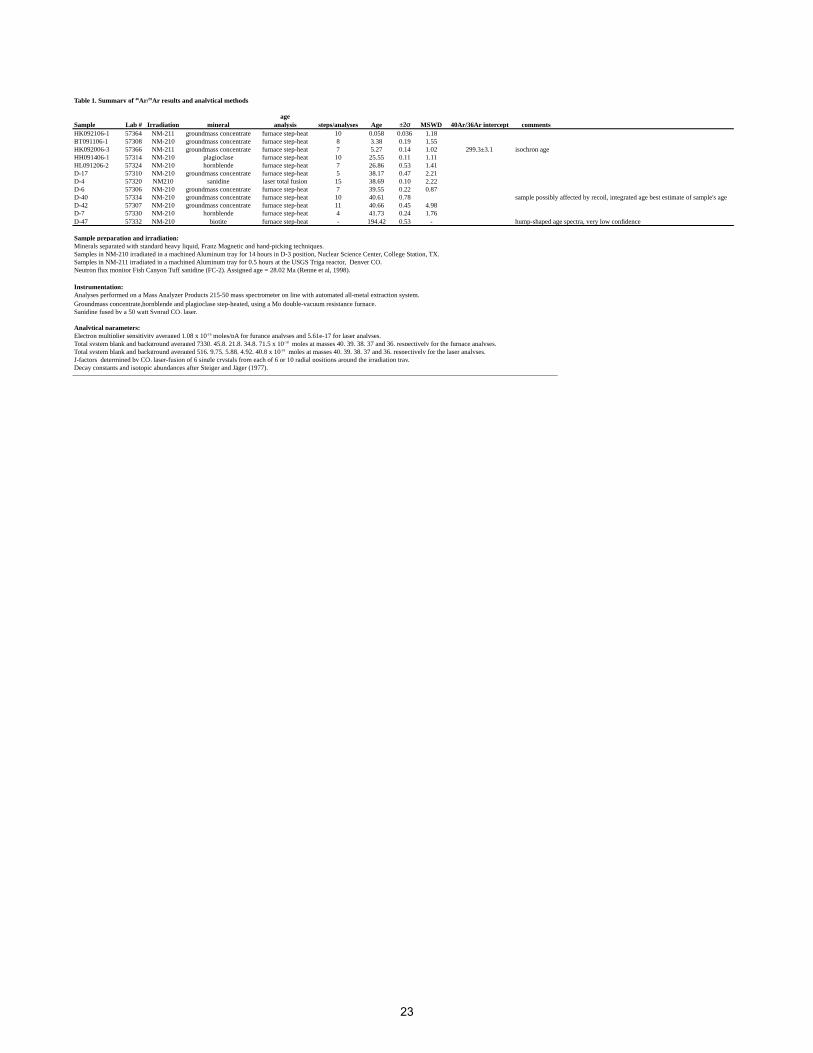
Table 1. Summary of 40Ar/39Ar results and analytical methods
ageSample Lab # Irradiation mineral analysis steps/analyses Age ±2σ MSWD 40Ar/36Ar intercept commentsHK092106-1 57364 NM-211 groundmass concentrate furnace step-heat q 10 0.058 0.036 1.18BT091106-1 57308 NM-210 groundmass concentrate furnace step-heat 8 3.38 0.19 1.55HK092006-3 57366 NM-211 groundmass concentrate furnace step-heat 7 5.27 0.14 1.02 299.3±3.1 isochron ageHH091406-1 57314 NM-210 plagioclase furnace step-heat 10 25.55 0.11 1.11HL091206-2 57324 NM-210 hornblende furnace step-heat 7 26.86 0.53 1.41D-17 57310 NM-210 groundmass concentrate furnace step-heat 5 38.17 0.47 2.21D-4 57320 NM210 sanidine laser total fusion 15 38.69 0.10 2.22D-6 57306 NM-210 groundmass concentrate furnace step-heat 7 39.55 0.22 0.87D-40 57334 NM-210 groundmass concentrate furnace step-heat 10 40.61 0.78 sample possibly affected by recoil, integrated age best estimate of sample's ageD-42 57307 NM-210 groundmass concentrate furnace step-heat 11 40.66 0.45 4.98D-7 57330 NM-210 hornblende furnace step-heat 4 41.73 0.24 1.76D-47 57332 NM-210 biotite furnace step-heat - 194.42 0.53 - hump-shaped age spectra, very low confidence
Sample preparation and irradiation: Minerals separated with standard heavy liquid, Franz Magnetic and hand-picking techniques.Samples in NM-210 irradiated in a machined Aluminum tray for 14 hours in D-3 position, Nuclear Science Center, College Station, TX. Samples in NM-211 irradiated in a machined Aluminum tray for 0.5 hours at the USGS Triga reactor, Denver CO.Neutron flux monitor Fish Canyon Tuff sanidine (FC-2). Assigned age = 28.02 Ma (Renne et al, 1998).
Instrumentation: Analyses performed on a Mass Analyzer Products 215-50 mass spectrometer on line with automated all-metal extraction system.Groundmass concentrate,hornblende and plagioclase step-heated, using a Mo double-vacuum resistance furnace.Sanidine fused by a 50 watt Synrad CO2 laser.
Analytical parameters: Electron multiplier sensitivity averaged 1.08 x 10⁻¹⁶ moles/pA for furance analyses and 5.61e-17 for laser analyses.Total system blank and background averaged 7330, 45.8, 21.8, 34.8, 71.5 x 10⁻¹⁸ moles at masses 40, 39, 38, 37 and 36, respectively for the furnace analyses.Total system blank and background averaged 516, 9.75, 5.88, 4.92, 40.8 x 10⁻¹⁸ moles at masses 40, 39, 38, 37 and 36, respectively for the laser analyses.J-factors determined by CO2 laser-fusion of 6 single crystals from each of 6 or 10 radial positions around the irradiation tray. Decay constants and isotopic abundances after Steiger and Jäger (1977).
23
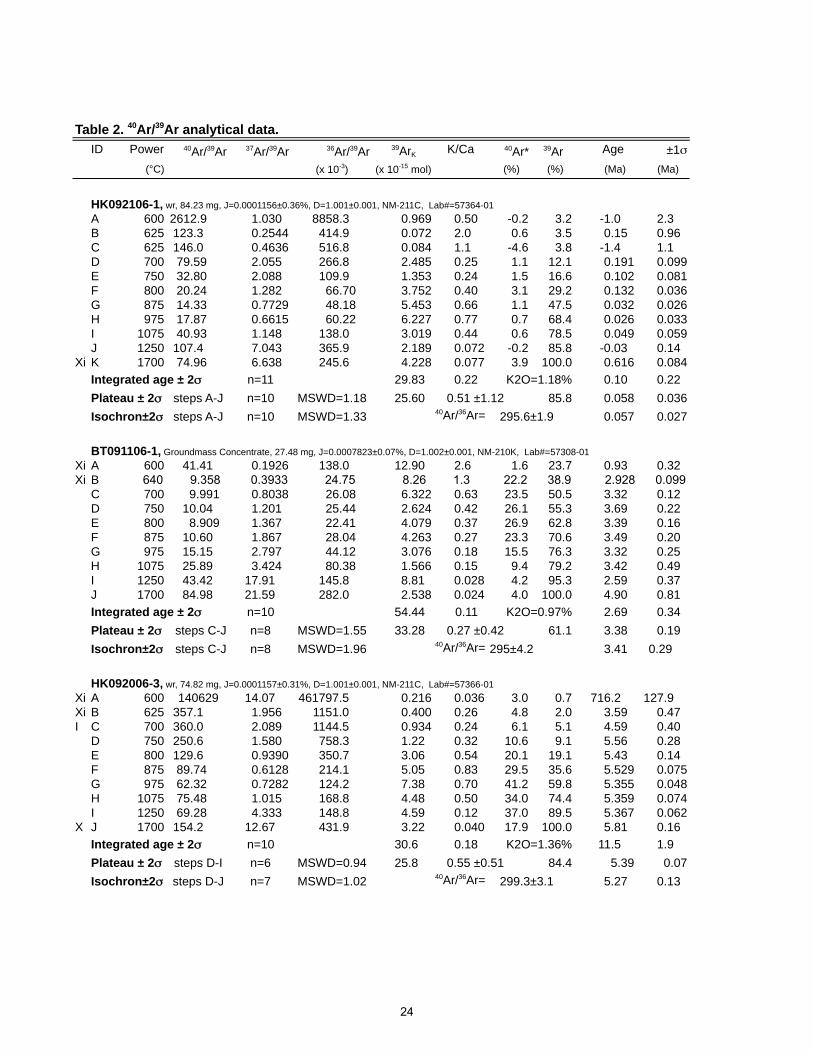
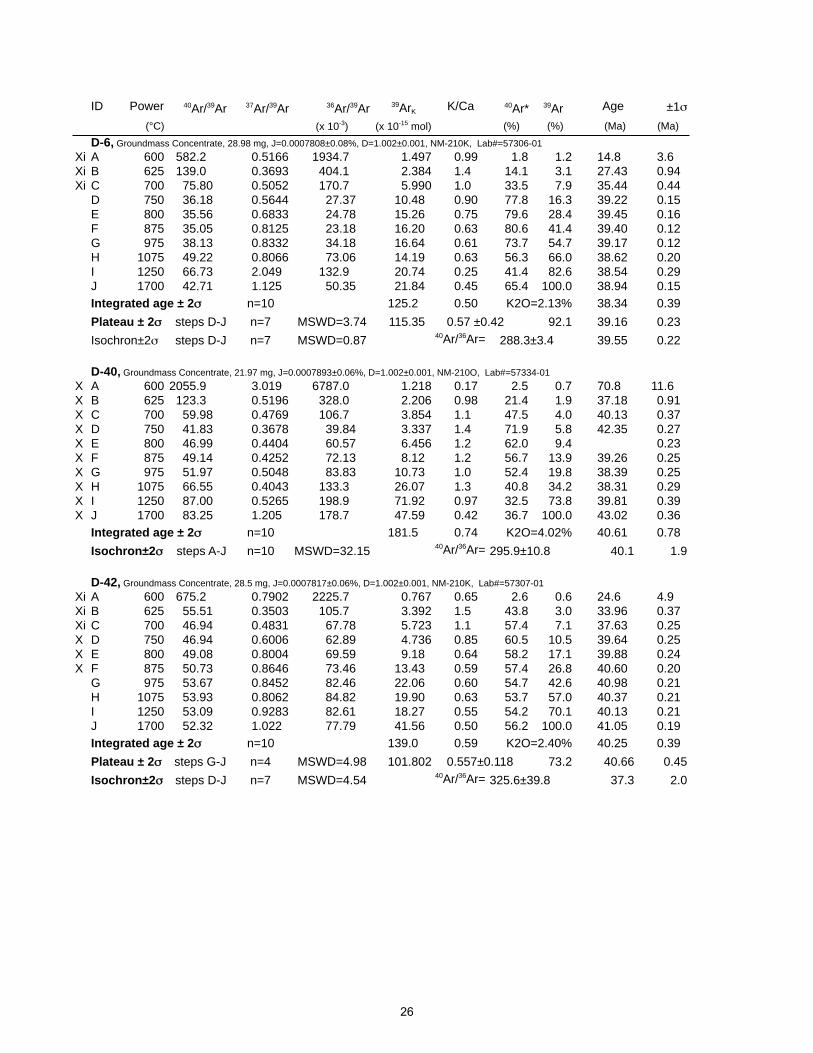
Table 2. 40Ar/39Ar analytical data.ID Power 40Ar/39Ar 37Ar/39Ar 36Ar/39Ar 39ArK K/Ca 40Ar* 39Ar Age ±1σ
(°C) (x 10-3) (x 10-15 mol) (%) (%) (Ma) (Ma)
HK092106-1, wr, 84.23 mg, J=0.0001156±0.36%, D=1.001±0.001, NM-211C, Lab#=57364-01A 600 2612.9 1.030 8858.3 0.969 0.50 -0.2 3.2 -1.0 2.3B 625 123.3 0.2544 414.9 0.072 2.0 0.6 3.5 0.15 0.96C 625 146.0 0.4636 516.8 0.084 1.1 -4.6 3.8 -1.4 1.1D 700 79.59 2.055 266.8 2.485 0.25 1.1 12.1 0.191 0.099E 750 32.80 2.088 109.9 1.353 0.24 1.5 16.6 0.102 0.081F 800 20.24 1.282 66.70 3.752 0.40 3.1 29.2 0.132 0.036G 875 14.33 0.7729 48.18 5.453 0.66 1.1 47.5 0.032 0.026H 975 17.87 0.6615 60.22 6.227 0.77 0.7 68.4 0.026 0.033I 1075 40.93 1.148 138.0 3.019 0.44 0.6 78.5 0.049 0.059J 1250 107.4 7.043 365.9 2.189 0.072 -0.2 85.8 -0.03 0.14
Xi K 1700 74.96 6.638 245.6 4.228 0.077 3.9 100.0 0.616 0.084Integrated age ± 2σ n=11 29.83 0.22 K2O=1.18% 0.10 0.22Plateau ± 2σ steps A-J n=10 MSWD=1.18 25.60 0.51 ±1.12 85.8 0.058 0.036Isochron±2σ steps A-J n=10 MSWD=1.33 40Ar/36Ar= 295.6±1.9 0.057 0.027
BT091106-1, Groundmass Concentrate, 27.48 mg, J=0.0007823±0.07%, D=1.002±0.001, NM-210K, Lab#=57308-01Xi A 600 41.41 0.1926 138.0 12.90 2.6 1.6 23.7 0.93 0.32Xi B 640 9.358 0.3933 24.75 8.26 1.3 22.2 38.9 2.928 0.099
C 700 9.991 0.8038 26.08 6.322 0.63 23.5 50.5 3.32 0.12D 750 10.04 1.201 25.44 2.624 0.42 26.1 55.3 3.69 0.22E 800 8.909 1.367 22.41 4.079 0.37 26.9 62.8 3.39 0.16F 875 10.60 1.867 28.04 4.263 0.27 23.3 70.6 3.49 0.20G 975 15.15 2.797 44.12 3.076 0.18 15.5 76.3 3.32 0.25H 1075 25.89 3.424 80.38 1.566 0.15 9.4 79.2 3.42 0.49I 1250 43.42 17.91 145.8 8.81 0.028 4.2 95.3 2.59 0.37J 1700 84.98 21.59 282.0 2.538 0.024 4.0 100.0 4.90 0.81Integrated age ± 2σ n=10 54.44 0.11 K2O=0.97% 2.69 0.34Plateau ± 2σ steps C-J n=8 MSWD=1.55 33.28 0.27 ±0.42 61.1 3.38 0.19Isochron±2σ steps C-J n=8 MSWD=1.96 40Ar/36Ar= 295±4.2 3.41 0.29
HK092006-3, wr, 74.82 mg, J=0.0001157±0.31%, D=1.001±0.001, NM-211C, Lab#=57366-01Xi A 600 140629 14.07 461797.5 0.216 0.036 3.0 0.7 716.2 127.9Xi B 625 357.1 1.956 1151.0 0.400 0.26 4.8 2.0 3.59 0.47I C 700 360.0 2.089 1144.5 0.934 0.24 6.1 5.1 4.59 0.40
D 750 250.6 1.580 758.3 1.22 0.32 10.6 9.1 5.56 0.28E 800 129.6 0.9390 350.7 3.06 0.54 20.1 19.1 5.43 0.14F 875 89.74 0.6128 214.1 5.05 0.83 29.5 35.6 5.529 0.075G 975 62.32 0.7282 124.2 7.38 0.70 41.2 59.8 5.355 0.048H 1075 75.48 1.015 168.8 4.48 0.50 34.0 74.4 5.359 0.074I 1250 69.28 4.333 148.8 4.59 0.12 37.0 89.5 5.367 0.062
X J 1700 154.2 12.67 431.9 3.22 0.040 17.9 100.0 5.81 0.16Integrated age ± 2σ n=10 30.6 0.18 K2O=1.36% 11.5 1.9Plateau ± 2σ steps D-I n=6 MSWD=0.94 25.8 0.55 ±0.51 84.4 5.39 0.07Isochron±2σ steps D-J n=7 MSWD=1.02 40Ar/36Ar= 299.3±3.1 5.27 0.13
24
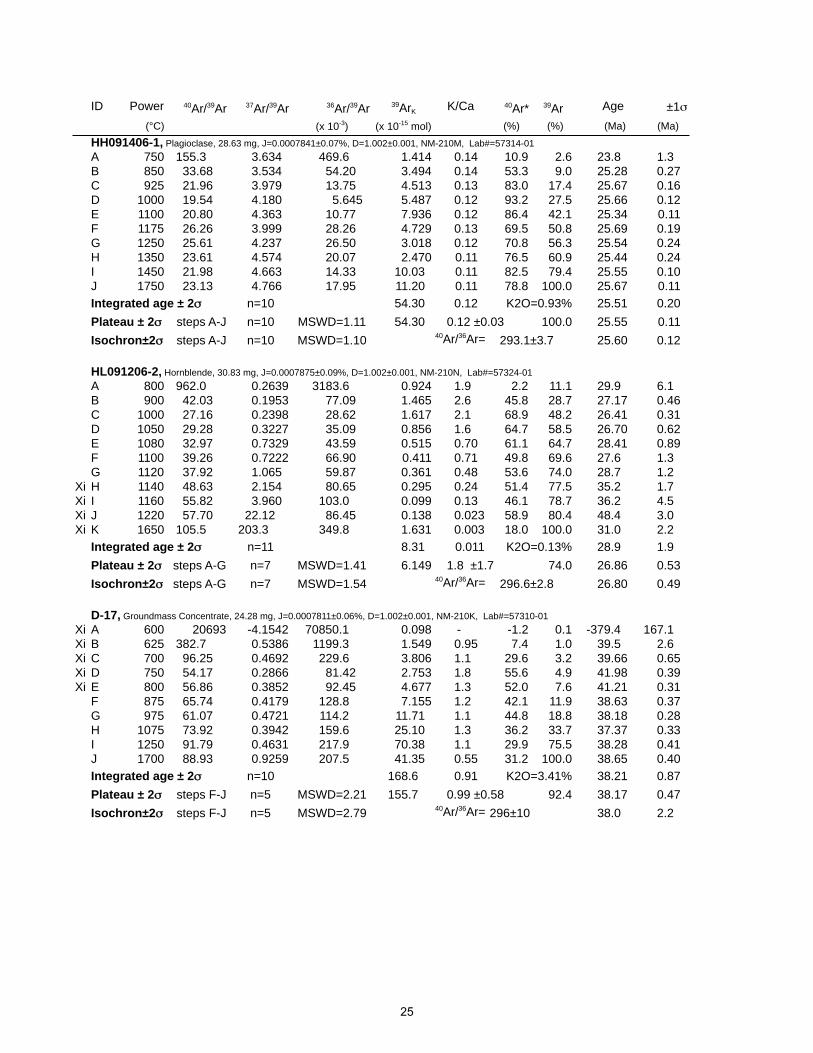
ID Power 40Ar/39Ar 37Ar/39Ar 36Ar/39Ar 39ArK K/Ca 40Ar* 39Ar Age ±1σ (°C) (x 10-3) (x 10-15 mol) (%) (%) (Ma) (Ma)
HH091406-1, Plagioclase, 28.63 mg, J=0.0007841±0.07%, D=1.002±0.001, NM-210M, Lab#=57314-01A 750 155.3 3.634 469.6 1.414 0.14 10.9 2.6 23.8 1.3B 850 33.68 3.534 54.20 3.494 0.14 53.3 9.0 25.28 0.27C 925 21.96 3.979 13.75 4.513 0.13 83.0 17.4 25.67 0.16D 1000 19.54 4.180 5.645 5.487 0.12 93.2 27.5 25.66 0.12E 1100 20.80 4.363 10.77 7.936 0.12 86.4 42.1 25.34 0.11F 1175 26.26 3.999 28.26 4.729 0.13 69.5 50.8 25.69 0.19G 1250 25.61 4.237 26.50 3.018 0.12 70.8 56.3 25.54 0.24H 1350 23.61 4.574 20.07 2.470 0.11 76.5 60.9 25.44 0.24I 1450 21.98 4.663 14.33 10.03 0.11 82.5 79.4 25.55 0.10J 1750 23.13 4.766 17.95 11.20 0.11 78.8 100.0 25.67 0.11Integrated age ± 2σ n=10 54.30 0.12 K2O=0.93% 25.51 0.20Plateau ± 2σ steps A-J n=10 MSWD=1.11 54.30 0.12 ±0.03 100.0 25.55 0.11Isochron±2σ steps A-J n=10 MSWD=1.10 40Ar/36Ar= 293.1±3.7 25.60 0.12
HL091206-2, Hornblende, 30.83 mg, J=0.0007875±0.09%, D=1.002±0.001, NM-210N, Lab#=57324-01A 800 962.0 0.2639 3183.6 0.924 1.9 2.2 11.1 29.9 6.1B 900 42.03 0.1953 77.09 1.465 2.6 45.8 28.7 27.17 0.46C 1000 27.16 0.2398 28.62 1.617 2.1 68.9 48.2 26.41 0.31D 1050 29.28 0.3227 35.09 0.856 1.6 64.7 58.5 26.70 0.62E 1080 32.97 0.7329 43.59 0.515 0.70 61.1 64.7 28.41 0.89F 1100 39.26 0.7222 66.90 0.411 0.71 49.8 69.6 27.6 1.3G 1120 37.92 1.065 59.87 0.361 0.48 53.6 74.0 28.7 1.2
Xi H 1140 48.63 2.154 80.65 0.295 0.24 51.4 77.5 35.2 1.7Xi I 1160 55.82 3.960 103.0 0.099 0.13 46.1 78.7 36.2 4.5Xi J 1220 57.70 22.12 86.45 0.138 0.023 58.9 80.4 48.4 3.0Xi K 1650 105.5 203.3 349.8 1.631 0.003 18.0 100.0 31.0 2.2
Integrated age ± 2σ n=11 8.31 0.011 K2O=0.13% 28.9 1.9Plateau ± 2σ steps A-G n=7 MSWD=1.41 6.149 1.8 ±1.7 74.0 26.86 0.53Isochron±2σ steps A-G n=7 MSWD=1.54 40Ar/36Ar= 296.6±2.8 26.80 0.49
D-17, Groundmass Concentrate, 24.28 mg, J=0.0007811±0.06%, D=1.002±0.001, NM-210K, Lab#=57310-01Xi A 600 20693 -4.1542 70850.1 0.098 - -1.2 0.1 -379.4 167.1Xi B 625 382.7 0.5386 1199.3 1.549 0.95 7.4 1.0 39.5 2.6Xi C 700 96.25 0.4692 229.6 3.806 1.1 29.6 3.2 39.66 0.65Xi D 750 54.17 0.2866 81.42 2.753 1.8 55.6 4.9 41.98 0.39Xi E 800 56.86 0.3852 92.45 4.677 1.3 52.0 7.6 41.21 0.31
F 875 65.74 0.4179 128.8 7.155 1.2 42.1 11.9 38.63 0.37G 975 61.07 0.4721 114.2 11.71 1.1 44.8 18.8 38.18 0.28H 1075 73.92 0.3942 159.6 25.10 1.3 36.2 33.7 37.37 0.33I 1250 91.79 0.4631 217.9 70.38 1.1 29.9 75.5 38.28 0.41J 1700 88.93 0.9259 207.5 41.35 0.55 31.2 100.0 38.65 0.40Integrated age ± 2σ n=10 168.6 0.91 K2O=3.41% 38.21 0.87Plateau ± 2σ steps F-J n=5 MSWD=2.21 155.7 0.99 ±0.58 92.4 38.17 0.47Isochron±2σ steps F-J n=5 MSWD=2.79 40Ar/36Ar= 296±10 38.0 2.2
25
ID Power 40Ar/39Ar 37Ar/39Ar 36Ar/39Ar 39ArK K/Ca 40Ar* 39Ar Age ±1σ (°C) (x 10-3) (x 10-15 mol) (%) (%) (Ma) (Ma)
D-6, Groundmass Concentrate, 28.98 mg, J=0.0007808±0.08%, D=1.002±0.001, NM-210K, Lab#=57306-01Xi A 600 582.2 0.5166 1934.7 1.497 0.99 1.8 1.2 14.8 3.6Xi B 625 139.0 0.3693 404.1 2.384 1.4 14.1 3.1 27.43 0.94Xi C 700 75.80 0.5052 170.7 5.990 1.0 33.5 7.9 35.44 0.44
D 750 36.18 0.5644 27.37 10.48 0.90 77.8 16.3 39.22 0.15E 800 35.56 0.6833 24.78 15.26 0.75 79.6 28.4 39.45 0.16F 875 35.05 0.8125 23.18 16.20 0.63 80.6 41.4 39.40 0.12G 975 38.13 0.8332 34.18 16.64 0.61 73.7 54.7 39.17 0.12H 1075 49.22 0.8066 73.06 14.19 0.63 56.3 66.0 38.62 0.20I 1250 66.73 2.049 132.9 20.74 0.25 41.4 82.6 38.54 0.29J 1700 42.71 1.125 50.35 21.84 0.45 65.4 100.0 38.94 0.15Integrated age ± 2σ n=10 125.2 0.50 K2O=2.13% 38.34 0.39Plateau ± 2σ steps D-J n=7 MSWD=3.74 115.35 0.57 ±0.42 92.1 39.16 0.23Isochron±2σ steps D-J n=7 MSWD=0.87 40Ar/36Ar= 288.3±3.4 39.55 0.22
D-40, Groundmass Concentrate, 21.97 mg, J=0.0007893±0.06%, D=1.002±0.001, NM-210O, Lab#=57334-01X A 600 2055.9 3.019 6787.0 1.218 0.17 2.5 0.7 70.8 11.6X B 625 123.3 0.5196 328.0 2.206 0.98 21.4 1.9 37.18 0.91X C 700 59.98 0.4769 106.7 3.854 1.1 47.5 4.0 40.13 0.37X D 750 41.83 0.3678 39.84 3.337 1.4 71.9 5.8 42.35 0.27X E 800 46.99 0.4404 60.57 6.456 1.2 62.0 9.4 0.23X F 875 49.14 0.4252 72.13 8.12 1.2 56.7 13.9 39.26 0.25X G 975 51.97 0.5048 83.83 10.73 1.0 52.4 19.8 38.39 0.25X H 1075 66.55 0.4043 133.3 26.07 1.3 40.8 34.2 38.31 0.29X I 1250 87.00 0.5265 198.9 71.92 0.97 32.5 73.8 39.81 0.39X J 1700 83.25 1.205 178.7 47.59 0.42 36.7 100.0 43.02 0.36
Integrated age ± 2σ n=10 181.5 0.74 K2O=4.02% 40.61 0.78Isochron±2σ steps A-J n=10 MSWD=32.15 40Ar/36Ar= 295.9±10.8 40.1 1.9
D-42, Groundmass Concentrate, 28.5 mg, J=0.0007817±0.06%, D=1.002±0.001, NM-210K, Lab#=57307-01Xi A 600 675.2 0.7902 2225.7 0.767 0.65 2.6 0.6 24.6 4.9Xi B 625 55.51 0.3503 105.7 3.392 1.5 43.8 3.0 33.96 0.37Xi C 700 46.94 0.4831 67.78 5.723 1.1 57.4 7.1 37.63 0.25X D 750 46.94 0.6006 62.89 4.736 0.85 60.5 10.5 39.64 0.25X E 800 49.08 0.8004 69.59 9.18 0.64 58.2 17.1 39.88 0.24X F 875 50.73 0.8646 73.46 13.43 0.59 57.4 26.8 40.60 0.20
G 975 53.67 0.8452 82.46 22.06 0.60 54.7 42.6 40.98 0.21H 1075 53.93 0.8062 84.82 19.90 0.63 53.7 57.0 40.37 0.21I 1250 53.09 0.9283 82.61 18.27 0.55 54.2 70.1 40.13 0.21J 1700 52.32 1.022 77.79 41.56 0.50 56.2 100.0 41.05 0.19Integrated age ± 2σ n=10 139.0 0.59 K2O=2.40% 40.25 0.39Plateau ± 2σ steps G-J n=4 MSWD=4.98 101.802 0.557±0.118 73.2 40.66 0.45Isochron±2σ steps D-J n=7 MSWD=4.54 40Ar/36Ar= 325.6±39.8 37.3 2.0
26
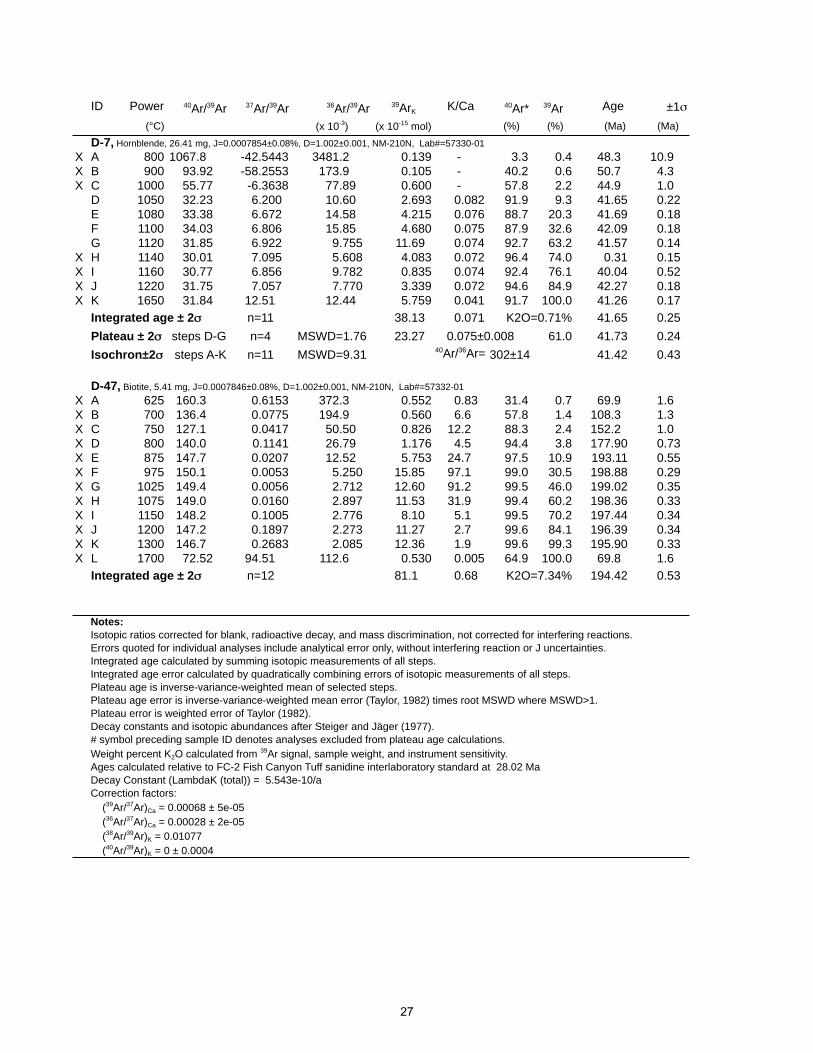
ID Power 40Ar/39Ar 37Ar/39Ar 36Ar/39Ar 39ArK K/Ca 40Ar* 39Ar Age ±1σ (°C) (x 10-3) (x 10-15 mol) (%) (%) (Ma) (Ma)
D-7, Hornblende, 26.41 mg, J=0.0007854±0.08%, D=1.002±0.001, NM-210N, Lab#=57330-01X A 800 1067.8 -42.5443 3481.2 0.139 - 3.3 0.4 48.3 10.9X B 900 93.92 -58.2553 173.9 0.105 - 40.2 0.6 50.7 4.3X C 1000 55.77 -6.3638 77.89 0.600 - 57.8 2.2 44.9 1.0
D 1050 32.23 6.200 10.60 2.693 0.082 91.9 9.3 41.65 0.22E 1080 33.38 6.672 14.58 4.215 0.076 88.7 20.3 41.69 0.18F 1100 34.03 6.806 15.85 4.680 0.075 87.9 32.6 42.09 0.18G 1120 31.85 6.922 9.755 11.69 0.074 92.7 63.2 41.57 0.14
X H 1140 30.01 7.095 5.608 4.083 0.072 96.4 74.0 0.31 0.15X I 1160 30.77 6.856 9.782 0.835 0.074 92.4 76.1 40.04 0.52X J 1220 31.75 7.057 7.770 3.339 0.072 94.6 84.9 42.27 0.18X K 1650 31.84 12.51 12.44 5.759 0.041 91.7 100.0 41.26 0.17
Integrated age ± 2σ n=11 38.13 0.071 K2O=0.71% 41.65 0.25Plateau ± 2σ steps D-G n=4 MSWD=1.76 23.27 0.075±0.008 61.0 41.73 0.24Isochron±2σ steps A-K n=11 MSWD=9.31 40Ar/36Ar= 302±14 41.42 0.43
D-47, Biotite, 5.41 mg, J=0.0007846±0.08%, D=1.002±0.001, NM-210N, Lab#=57332-01X A 625 160.3 0.6153 372.3 0.552 0.83 31.4 0.7 69.9 1.6X B 700 136.4 0.0775 194.9 0.560 6.6 57.8 1.4 108.3 1.3X C 750 127.1 0.0417 50.50 0.826 12.2 88.3 2.4 152.2 1.0X D 800 140.0 0.1141 26.79 1.176 4.5 94.4 3.8 177.90 0.73X E 875 147.7 0.0207 12.52 5.753 24.7 97.5 10.9 193.11 0.55X F 975 150.1 0.0053 5.250 15.85 97.1 99.0 30.5 198.88 0.29X G 1025 149.4 0.0056 2.712 12.60 91.2 99.5 46.0 199.02 0.35X H 1075 149.0 0.0160 2.897 11.53 31.9 99.4 60.2 198.36 0.33X I 1150 148.2 0.1005 2.776 8.10 5.1 99.5 70.2 197.44 0.34X J 1200 147.2 0.1897 2.273 11.27 2.7 99.6 84.1 196.39 0.34X K 1300 146.7 0.2683 2.085 12.36 1.9 99.6 99.3 195.90 0.33X L 1700 72.52 94.51 112.6 0.530 0.005 64.9 100.0 69.8 1.6
Integrated age ± 2σ n=12 81.1 0.68 K2O=7.34% 194.42 0.53
Notes:Isotopic ratios corrected for blank, radioactive decay, and mass discrimination, not corrected for interfering reactions.Errors quoted for individual analyses include analytical error only, without interfering reaction or J uncertainties.Integrated age calculated by summing isotopic measurements of all steps.Integrated age error calculated by quadratically combining errors of isotopic measurements of all steps.Plateau age is inverse-variance-weighted mean of selected steps.Plateau age error is inverse-variance-weighted mean error (Taylor, 1982) times root MSWD where MSWD>1.Plateau error is weighted error of Taylor (1982).Decay constants and isotopic abundances after Steiger and Jäger (1977).# symbol preceding sample ID denotes analyses excluded from plateau age calculations.Weight percent K2O calculated from 39Ar signal, sample weight, and instrument sensitivity.Ages calculated relative to FC-2 Fish Canyon Tuff sanidine interlaboratory standard at 28.02 Ma Decay Constant (LambdaK (total)) = 5.543e-10/aCorrection factors: (39Ar/37Ar)Ca = 0.00068 ± 5e-05 (36Ar/37Ar)Ca = 0.00028 ± 2e-05 (38Ar/39Ar)K = 0.01077 (40Ar/39Ar)K = 0 ± 0.0004
27
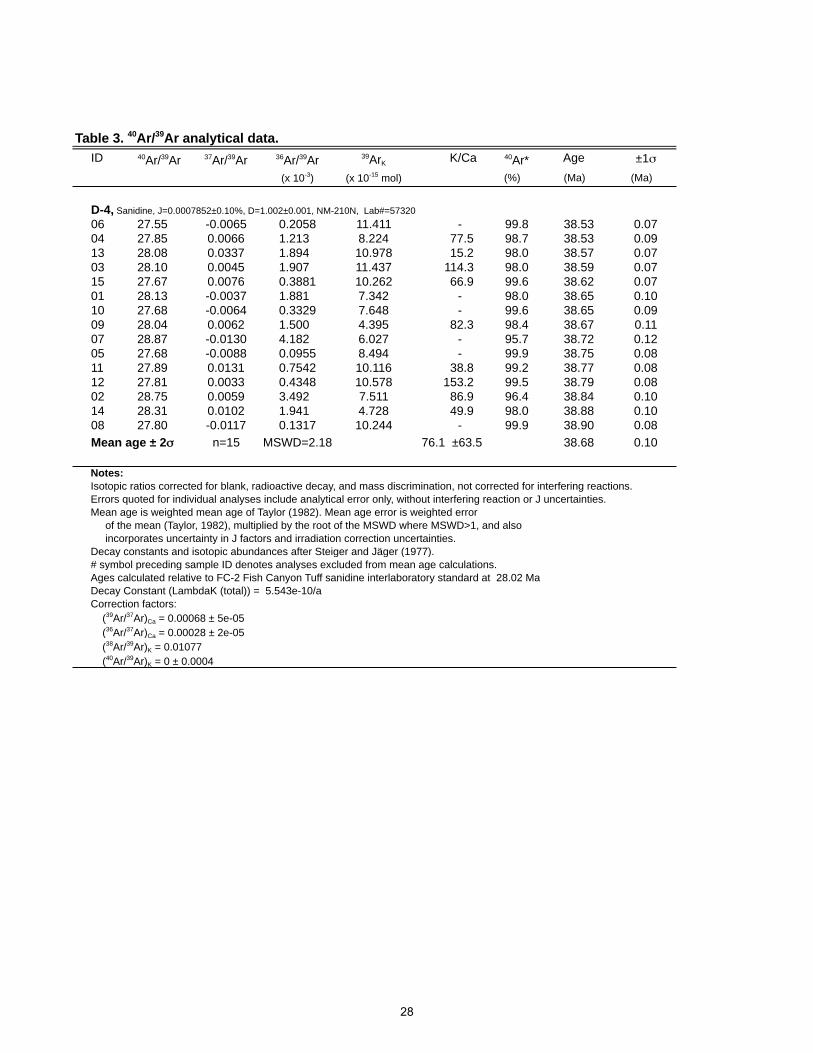
Table 3. 40Ar/39Ar analytical data.ID 40Ar/39Ar 37Ar/39Ar 36Ar/39Ar 39ArK K/Ca 40Ar* Age ±1σ
(x 10-3) (x 10-15 mol) (%) (Ma) (Ma)
D-4, Sanidine, J=0.0007852±0.10%, D=1.002±0.001, NM-210N, Lab#=5732006 27.55 -0.0065 0.2058 11.411 - 99.8 38.53 0.0704 27.85 0.0066 1.213 8.224 77.5 98.7 38.53 0.0913 28.08 0.0337 1.894 10.978 15.2 98.0 38.57 0.0703 28.10 0.0045 1.907 11.437 114.3 98.0 38.59 0.0715 27.67 0.0076 0.3881 10.262 66.9 99.6 38.62 0.0701 28.13 -0.0037 1.881 7.342 - 98.0 38.65 0.1010 27.68 -0.0064 0.3329 7.648 - 99.6 38.65 0.0909 28.04 0.0062 1.500 4.395 82.3 98.4 38.67 0.1107 28.87 -0.0130 4.182 6.027 - 95.7 38.72 0.1205 27.68 -0.0088 0.0955 8.494 - 99.9 38.75 0.0811 27.89 0.0131 0.7542 10.116 38.8 99.2 38.77 0.0812 27.81 0.0033 0.4348 10.578 153.2 99.5 38.79 0.0802 28.75 0.0059 3.492 7.511 86.9 96.4 38.84 0.1014 28.31 0.0102 1.941 4.728 49.9 98.0 38.88 0.1008 27.80 -0.0117 0.1317 10.244 - 99.9 38.90 0.08Mean age ± 2σ n=15 MSWD=2.18 76.1 ±63.5 38.68 0.10
Notes:Isotopic ratios corrected for blank, radioactive decay, and mass discrimination, not corrected for interfering reactions.Errors quoted for individual analyses include analytical error only, without interfering reaction or J uncertainties.Mean age is weighted mean age of Taylor (1982). Mean age error is weighted error of the mean (Taylor, 1982), multiplied by the root of the MSWD where MSWD>1, and also incorporates uncertainty in J factors and irradiation correction uncertainties.Decay constants and isotopic abundances after Steiger and Jäger (1977).# symbol preceding sample ID denotes analyses excluded from mean age calculations.Ages calculated relative to FC-2 Fish Canyon Tuff sanidine interlaboratory standard at 28.02 Ma Decay Constant (LambdaK (total)) = 5.543e-10/aCorrection factors: (39Ar/37Ar)Ca = 0.00068 ± 5e-05 (36Ar/37Ar)Ca = 0.00028 ± 2e-05 (38Ar/39Ar)K = 0.01077 (40Ar/39Ar)K = 0 ± 0.0004
28
New Mexico Bureau of Mines and Mineral Resources
Procedures of the New Mexico Geochronology Research Laboratory
For the Period June 1998 – present
Matthew HeizlerWilliam C. McIntoshRichard EsserLisa Peters
29
40Ar/39Ar and K-Ar dating
Often, large bulk samples (either minerals or whole rocks) are required for K-Ar dating
and even small amounts of xenocrystic, authigenic, or other non-ideal behavior can lead to
inaccuracy. The K-Ar technique is susceptible to sample inhomogeneity as separate aliquots are
required for the potassium and argon determinations. The need to determine absolute quantities
(i.e. moles of 40Ar* and 40K) limits the precision of the K-Ar method to approximately 1% and
also, the technique provides limited potential to evaluate underlying assumptions. In the 40Ar/39Ar
variant of the K-Ar technique, a sample is irradiated with fast neutrons thereby converting 39K to39Ar through a (n,p) reaction. Following irradiation, the sample is either fused or incrementally
heated and the gas analyzed in the same manner as in the conventional K-Ar procedure, with one
exception, no argon spike need be added.
Some of the advantages of the 40Ar/39Ar method over the conventional K-Ar technique are:
1. A single analysis is conducted on one aliquot of sample thereby reducing the sample sizeand eliminating sample inhomogeneity.
2. Analytical error incurred in determining absolute abundances is reduced by measuringonly isotopic ratios. This also eliminates the need to know the exact weight of the sample.
3. The addition of an argon spike is not necessary.4. The sample does not need to be completely fused, but rather can be incrementally heated.
The 40Ar/39Ar ratio (age) can be measured for each fraction of argon released and thisallows for the generation of an age spectrum.
The age of a sample as determined with the 40Ar/39Ar method requires comparison of the
measured 40Ar/39Ar ratio with that of a standard of known age. Also, several isotopes of other
elements (Ca, K, Cl, Ar) produce argon during the irradiation procedure and must be corrected
for. Far more in-depth details of the determination of an apparent age via the 40Ar/39Ar method
are given in Dalrymple et al. (1981) and McDougall and Harrison (1988).
30
Analytical techniques
Sample Preparation and irradiation details
Mineral separates are obtained in various fashions depending upon the mineral of
interest, rock type and grain size. In almost all cases the sample is crushed in a jaw crusher and
ground in a disc grinder and then sized. The size fraction used generally corresponds to the
largest size possible which will permit obtaining a pure mineral separate. Following sizing, the
sample is washed and dried. For plutonic and metamorphic rocks and lavas, crystals are
separated using standard heavy liquid, Franz magnetic and hand-picking techniques. For
volcanic sanidine and plagioclase, the sized sample is reacted with 15% HF acid to remove glass
and/or matrix and then thoroughly washed prior to heavy liquid and magnetic separation. For
groundmass concentrates, rock fragments are selected which do not contain any visible
phenocrysts.
The NMGRL uses either the Ford reactor at the University of Michigan or the Nuclear
Science Center reactor at Texas A&M University. At the Ford reactor, the L67 position is used
(unless otherwise noted) and the D-3 position is always used at the Texas A&M reactor. All of
the Michigan irradiations are carried out underwater without any shielding for thermal neutrons,
whereas the Texas irradiations are in a dry location which is shielded with B and Cd. Depending
upon the reactor used, the mineral separates are loaded into either holes drilled into Al discs or
into 6 mm I.D. quartz tubes. Various Al discs are used. For Michigan, either six hole or twelve
hole, 1 cm diameter discs are used and all holes are of equal size. Samples are placed in the 0,
120 and 240° locations and standards in the 60, 180 and 300° locations for the six hole disc. For
the twelve hole disc, samples are located at 30, 60, 120, 150, 210, 240, 300, and 330° and
standards at 0, 90, 180 and 270 degrees. If samples are loaded into the quartz tubes, they are
wrapped in Cu foil with standards interleaved at ~0.5 cm intervals. For Texas, 2.4 cm diameter
discs contain either sixteen or six sample holes with smaller holes used to hold the standards. For
the six hole disc, sample locations are 30, 90, 150, 210, 270 and 330° and standards are at 0, 60,
120, 180, 240 and 300°. Samples are located at 18, 36, 54, 72, 108, 126, 144, 162, 198, 216, 234,
252, 288, 306, 324, 342 degrees and standards at 0, 90, 180 and 270 degrees in the sixteen hole
disc. Following sample loading into the discs, the discs are stacked, screwed together and sealed
31
in vacuo in either quartz (Michigan) or Pyrex (Texas) tubes.
Extraction Line and Mass Spectrometer details
The NMGRL argon extraction line has both a double vacuum Mo resistance furnace and
a CO2 laser to heat samples. The Mo furnace crucible is heated with a W heating element and the
temperature is monitored with a W-Re thermocouple placed in a hole drilled into the bottom of
the crucible. A one inch long Mo liner is placed in the bottom of the crucible to collect the
melted samples. The furnace temperature is calibrated by either/or melting Cu foil or with an
additional thermocouple inserted in the top of the furnace down to the liner. The CO2 laser is a
Synrad 10W laser equipped with a He-Ne pointing laser. The laser chamber is constructed from a
3 3/8” stainless steel conflat and the window material is ZnS. The extraction line is a two stage
design. The first stage is equipped with a SAES GP-50 getter, whereas the second stage houses
two SAES GP-50 getters and a tungsten filament. The first stage getter is operated at 450°C as is
one of the second stage getters. The other second stage getter is operated at room temperature
and the tungsten filament is operated at ~2000°C. Gases evolved from samples heated in the
furnace are reacted with the first stage getter during heating. Following heating, the gas is
expanded into the second stage for two minutes and then isolated from the first stage. During
second stage cleaning, the first stage and furnace are pumped out. After gettering in the second
stage, the gas is expanded into the mass spectrometer. Gases evolved from samples heated in the
laser are expanded through a cold finger operated at -140°C and directly into the second stage.
Following cleanup, the gas in the second stage and laser chamber is expanded into the mass
spectrometer for analysis.
The NMGRL employs a MAP-215-50 mass spectrometer which is operated in static
mode. The mass spectrometer is operated with a resolution ranging between 450 to 600 at mass
40 and isotopes are detected on a Johnston electron multiplier operated at ~2.1 kV with an
overall gain of about 10,000 over the Faraday collector. Final isotopic intensities are determined
by linear regression to time zero of the peak height versus time following gas introduction for
each mass. Each mass intensity is corrected for mass spectrometer baseline and background and
the extraction system blank.
Blanks for the furnace are generally determined at the beginning of a run while the
furnace is cold and then between heating steps while the furnace is cooling. Typically, a blank is
32
run every three to six heating steps. Periodic furnace hot blank analysis reveals that the cold
blank is equivalent to the hot blank for temperatures less than about 1300°C. Laser system
blanks are generally determined between every four analyses. Mass discrimination is measured
using atmospheric argon which has been dried using a Ti-sublimation pump. Typically, 10 to 15
replicate air analyses are measured to determine a mean mass discrimination value. Air pipette
analyses are generally conducted 2-3 times per month, but more often when samples sensitive to
the mass discrimination value are analyzed. Correction factors for interfering nuclear reactions
on K and Ca are determined using K-glass and CaF2, respectively. Typically, 3-5 individual
pieces of the salt or glass are fused with the CO2 laser and the correction factors are calculated
from the weighted mean of the individual determinations.
Data acquisition, presentation and age calculation
Samples are either step-heated or fused in a single increment (total fusion). Bulk samples
are often step-heated and the data are generally displayed on an age spectrum or isochron
diagram. Single crystals are often analyzed by the total fusion method and the results are
typically displayed on probability distribution diagrams or isochron diagrams.
The Age Spectrum Diagram
Age spectra plot apparent age of each incrementally heated gas fraction versus the
cumulative % 39ArK released, with steps increasing in temperature from left to right. Each
apparent age is calculated assuming that the trapped argon (argon not produced by in situ decay
of 40K) has the modern day atmospheric 40Ar/36Ar value of 295.5. Additional parameters for
each heating step are often plotted versus the cumulative %39ArK released. These auxiliary
parameters can aid age spectra interpretation and may include radiogenic yield (percent of 40Ar
which is not atmospheric), K/Ca (determined from measured Ca-derived 37Ar and K-derived39Ar) and/or K/Cl (determined from measured Cl-derived 38Ar and K-derived 39Ar). Incremental
heating analysis is often effective at revealing complex argon systematics related to excess
argon, alteration, contamination, 39Ar recoil, argon loss, etc. Often low-temperature heating
steps have low radiogenic yields and apparent ages with relatively high errors due mainly to
33
loosely held, non-radiogenic argon residing on grain surfaces or along grain boundaries. An
entirely or partially flat spectrum, in which apparent ages are the same within analytical error,
may indicate that the sample is homogeneous with respect to K and Ar and has had a simple
thermal and geological history. A drawback to the age spectrum technique is encountered when
hydrous minerals such as micas and amphiboles are analyzed. These minerals are not stable in
the ultra-high vacuum extraction system and thus step-heating can homogenize important details
of the true 40Ar distribution. In other words, a flat age spectrum may result even if a hydrous
sample has a complex argon distribution.
The Isochron Diagram
Argon data can be plotted on isotope correlation diagrams to help assess the isotopic
composition of Ar trapped at the time of argon closure, thereby testing the assumption that
trapped argon isotopes have the composition of modern atmosphere which is implicit in age
spectra. To construct an “inverse isochron” the 36Ar/40Ar ratio is plotted versus the 39Ar/40Ar ratio.
A best fit line can be calculated for the data array which yields the value for the trapped argon
(Y-axis intercept) and the 40Ar*/39ArK value (age) from the X-axis intercept. Isochron analysis is
most useful for step-heated or total fusion data which have a significant spread in radiogenic
yield. For young or low K samples, the calculated apparent age can be very sensitive to the
composition of the trapped argon and therefore isochron analysis should be preformed routinely
on these samples (cf. Heizler and Harrison, 1988). For very old (>Mesozoic) samples or
relatively old sanidines (>mid-Cenozoic) the data are often highly radiogenic and cluster near the
X-axis thereby making isochron analysis of little value.
34
The Probability Distribution Diagram
The probability distribution diagram, which is sometimes referred to as an ideogram, is a
plot of apparent age versus the summation of the normal distribution of each individual analysis
(Deino and Potts, 1992). This diagram is most effective at displaying single crystal laser fusion
data to assess the distribution of the population. The K/Ca, radiogenic yield, and the moles of39Ar for each analysis are also often displayed for each sample as this allows for visual ease in
identifying apparent age correlations between, for instance, plagioclase contamination, signal
size and/or radiogenic concentrations. The error (1σ) for each age analysis is generally shown by
the horizontal lines in the moles of 39Ar section. Solid symbols represent the analyses used for
the weighted mean age calculation and the generation of the solid line on the ideogram, whereas
open symbols represent data omitted from the age calculation. If shown, a dashed line represents
the probability distribution of all of the displayed data. The diagram is most effective for
displaying the form of the age distribution (i.e. gaussian, skewed, etc.) and for identifying
xenocrystic or other grains which fall outside of the main population.
Error Calculations
For step-heated samples, a plateau for the age spectrum is defined by the steps indicated.
The plateau age is calculated by weighting each step on the plateau by the inverse of the variance
and the error is calculated by either the method of Samson and Alexander (1987) or Taylor
(1982). A mean sum weighted deviates (MSWD) value is determined by dividing the Chi-
squared value by n-1 degrees of freedom for the plateau ages. If the MSWD value is outside the
95% confidence window (cf. Mahon, 1996; Table 1), the plateau or preferred age error is
multiplied by the square root of the MSWD.
For single crystal fusion data, a weighted mean is calculated using the inverse of the
variance to weight each age determination (Taylor, 1982). Errors are calculated as described for
the plateau ages above.
Isochron ages, 40Ar/36Ari values and MSWD values are calculated from the regression
results obtained by the York (1969) method.
35
References cited
Dalrymple, G.B., Alexander, E.C., Jr., Lanphere, M.A., and Kraker, G.P., 1981. Irradiation of
samples for 40Ar/39Ar dating using the Geological Survey TRIGA reactor. U.S.G.S., Prof.
Paper, 1176.
Deino, A., and Potts, R., 1990. Single-Crystal 40Ar/39Ar dating of the Olorgesailie Formation,
Southern Kenya Rift, J. Geophys. Res., 95, 8453-8470.
Deino, A., and Potts, R., 1992. Age-probability spectra from examination of single-crystal40Ar/39Ar dating results: Examples from Olorgesailie, Southern Kenya Rift, Quat.
International, 13/14, 47-53.
Fleck, R.J., Sutter, J.F., and Elliot, D.H., 1977. Interpretation of discordant 40Ar/39Ar age-spectra
of Mesozoic tholieiites from Antarctica, Geochim. Cosmochim. Acta, 41, 15-32.
Heizler, M. T., and Harrison, T. M., 1988. Multiple trapped argon components revealed by40Ar/39Ar analysis, Geochim. Cosmochim. Acta, 52, 295-1303.
Mahon, K.I., 1996. The New “York” regression: Application of an improved statistical method
to geochemistry, International Geology Review, 38, 293-303.
McDougall, I., and Harrison, T.M., 1988. Geochronology and thermochronology by the 40Ar-39Ar method. Oxford University Press.
Samson, S.D., and, Alexander, E.C., Jr., 1987. Calibration of the interlaboratory 40Ar/39Ar dating
standard, Mmhb-1, Chem. Geol., 66, 27-34.
Steiger, R.H., and Jäger, E., 1977. Subcommission on geochronology: Convention on the use of
decay constants in geo- and cosmochronology. Earth and Planet. Sci. Lett., 36, 359-362.
Taylor, J.R., 1982. An Introduction to Error Analysis: The Study of Uncertainties in Physical
Measurements,. Univ. Sci. Books, Mill Valley, Calif., 270 p.
York, D., 1969. Least squares fitting of a straight line with correlated errors, Earth and Planet.
Sci. Lett.., 5, 320-324.
36
Recommended