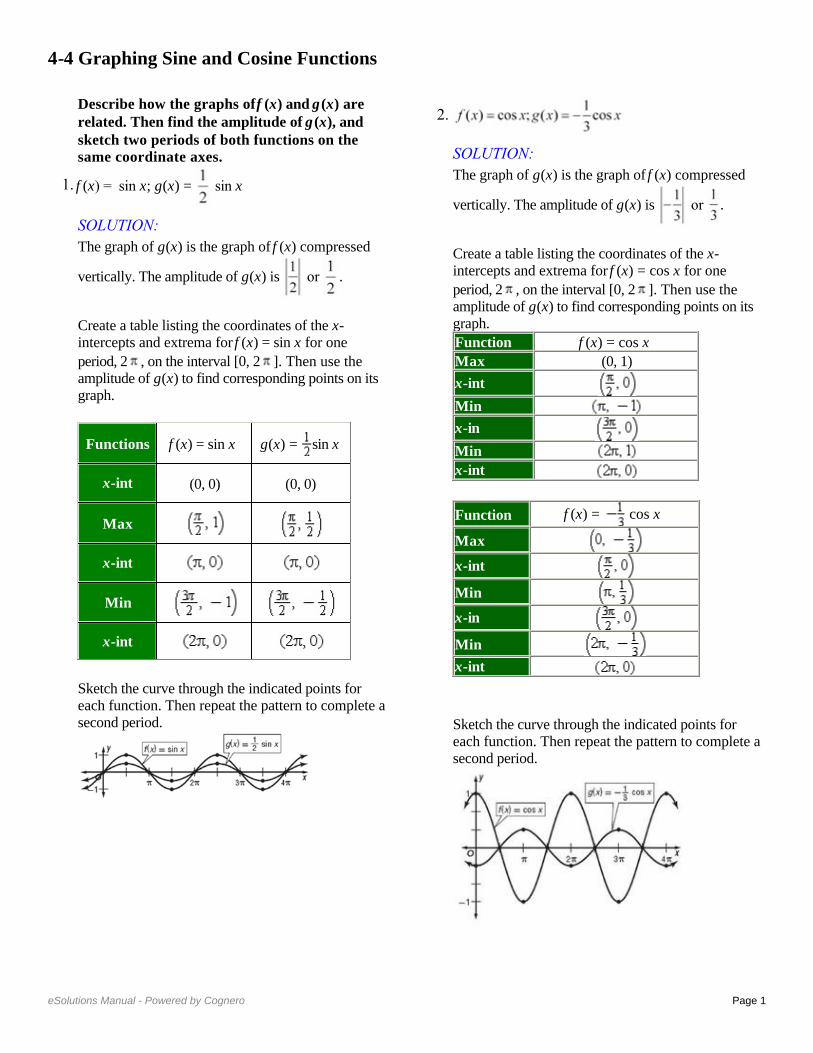
Describe how the graphs of f (x) and g (x) are related. Then find the amplitude of g (x), and sketch two periods of both functions on the same coordinate axes.
1. f (x) = sin x; g(x) = sin x
SOLUTION: The graph of g(x) is the graph of f (x) compressed
vertically. The amplitude of g(x) is or .
Create a table listing the coordinates of the x-intercepts and extrema for f (x) = sin x for one
period, 2 , on the interval [0, 2 ]. Then use the amplitude of g(x) to find corresponding points on its graph.
Sketch the curve through the indicated points for each function. Then repeat the pattern to complete asecond period.
Functions f (x) = sin x g(x) = sin x
x-int (0, 0) (0, 0)
Max
x-int
Min
x-int
2.
SOLUTION: The graph of g(x) is the graph of f (x) compressed
vertically. The amplitude of g(x) is or .
Create a table listing the coordinates of the x-intercepts and extrema for f (x) = cos x for one
period, 2 , on the interval [0, 2 ]. Then use the amplitude of g(x) to find corresponding points on its graph.
Sketch the curve through the indicated points for each function. Then repeat the pattern to complete asecond period.
Function f (x) = cos x
Max (0, 1)
x-int Min
x-in
Min
x-int
Function f (x) = cos x
Max x-int
Min
x-in
Min
x-int
3. f (x) = cos x; g(x) = 6 cos x
SOLUTION: The graph of g(x) is the graph of f (x) expanded
vertically. The amplitude of g(x) is or 6.
Create a table listing the coordinates of the x-intercepts and extrema for f (x) = cos x for one
period, 2 , on the interval [0, 2 ]. Then use the amplitude of g(x) to find corresponding points on its graph.
Sketch the curve through the indicated points for each function. Then repeat the pattern to complete asecond period.
Functions f (x) = cos x g(x) = 6 cos x
Max (0, 1) (0, 6)
x-int
Min
x-int
Max
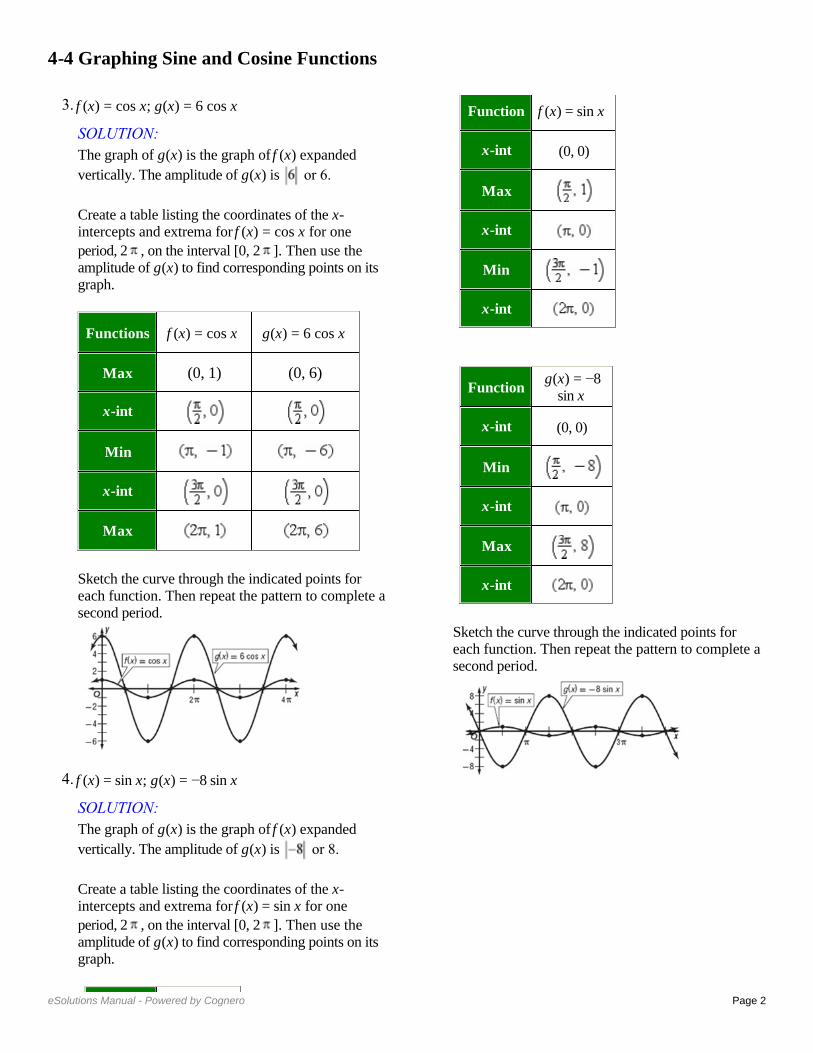
4. f (x) = sin x; g(x) = −8 sin x
SOLUTION: The graph of g(x) is the graph of f (x) expanded
vertically. The amplitude of g(x) is or 8.
Create a table listing the coordinates of the x-intercepts and extrema for f (x) = sin x for one
period, 2 , on the interval [0, 2 ]. Then use the amplitude of g(x) to find corresponding points on its graph.
Sketch the curve through the indicated points for each function. Then repeat the pattern to complete asecond period.
Function f (x) = sin x
x-int (0, 0)
Max
x-int
Min
x-int
Function g(x) = −8
sin x
x-int (0, 0)
Min
x-int
Max
x-int
Describe how the graphs of f (x) and g (x) are related. Then find the period of g (x), and sketch at least one period of both functions on the same coordinate axes.
5. f (x) = sin x; g(x) = sin 4x
SOLUTION: The graph of g(x) is the graph of f (x) compressed
horizontally. The period of g(x) is . To find
corresponding points on the graph of g(x), change the x-coordinates of those key points on f (x) so that
they range from 0 to , increasing by increments of
.
Sketch the curve through the indicated points for each function. Then repeat the pattern to complete asecond period.
Functions f (x) = sin x g(x) = sin
4x
x-int (0, 0) (0, 0)
Max
x-int
Min
x-int
6. f (x) = cos x; g(x) = cos 2x
SOLUTION: The graph of g(x) is the graph of f (x) compressed
horizontally. The period of g(x) is or . To find
corresponding points on the graph of g(x), change the x-coordinates of those key points on f (x) so that
they range from 0 to , increasing by increments of
.
Sketch the curve through the indicated points for each function. Then repeat the pattern to complete asecond period.
Functions f (x) = cos x g(x) = cos 2x
Max (0, 1) (0, 1)
x-int
Min
x-int
Max
7. f (x) = cos x;
SOLUTION: The graph of g(x) is the graph of f (x) expanded
horizontally. The period of g(x) is . To
find corresponding points on the graph of g(x), change the x-coordinates of those key points on f (x)
so that they range from 0 to , increasing by
increments of or .
Sketch the curve through the indicated points for each function. Then repeat the pattern to complete asecond period.
Functions f (x) = cos x
Max (0, 1) (0, 1)
x-int
Min
x-int
Max
8. f (x) = sin x;
SOLUTION: The graph of g(x) is the graph of f (x) expanded
horizontally. The period of g(x) is . To find corresponding points on the graph of g(x), change the x-coordinates of those key points on f (x) so that they range from 0 to , increasing by increments of
or .
Sketch the curve through the indicated points for each function. Then repeat the pattern to complete asecond period.
Functions f (x) = sin x
x-int (0, 0) (0, 0)
Max
x-int
Min
x-int
9. VOICES The contralto vocal type includes the deepest female singing voice. Some contraltos can sing as low as the E below middle C (E3), which hasa frequency of 165 hertz. Write an equation for a sine function that models the initial behavior of the sound wave associated with E3 having an amplitude of 0.15.
SOLUTION: The general form of the equation will be y = a sin bt,where t is the time in seconds. Because the
amplitude is 0.15, |a|= 0.15. This means that a = ±0.15. The period is the reciprocal of the frequency or
. Use this value to find b.
Sample answer: One sine function that models the
initial behavior is y = 0.15 sin 330 t.
Write a sine function that can be used to model the initial behavior of a sound wave with the frequency and amplitude given.
10. f = 440, a = 0.3
SOLUTION: The general form of the equation is y = a sin bt, where t is the time in seconds. Because the
amplitude is 0.3, = 0.3. This means that a = ±0.3.
The period is the reciprocal of the frequency or
. Use this value to find b.
Using the positive values of a and b, one sine function that models the initial behavior is y = 0.3 sin
880 t.
11. f = 932, a = 0.25
SOLUTION: The general form of the equation is y = a sin bt, where t is the time in seconds. Because the
amplitude is 0.25, = 0.25. This means that a =
±0.25. The period is the reciprocal of the frequency
or . Use this value to find b.
Using the positive values of a and b, one sine function that models the initial behavior is y = 0.25
sin 1864 t.
12. f = 1245, a = 0.12
SOLUTION: The general form of the equation is y = a sin bt, where t is the time in seconds. Because the
amplitude is 0.12, = 0.12. This means that a =
±0.12. The period is the reciprocal of the frequency or
. Use this value to find b.
Using the positive values of a and b, one sine function that models the initial behavior is y = 0.12
sin 2490 t.
13. f = 623, a = 0.2
SOLUTION: The general form of the equation is y = a sin bt, where t is the time in seconds. Because the
amplitude is 0.2, = 0.2. This means that a = ±0.2.
The period is the reciprocal of the frequency or
. Use this value to find b.
Using the positive values of a and b, one sine function that models the initial behavior is y = 0.2 sin
1246 t.
State the amplitude, period, frequency, phase shift, and vertical shift of each function. Then graph two periods of the function.
14.
SOLUTION:
In this function, a = 3, b = 1, c = − , and d = 0.
Because d = 0, there is no vertical shift.
Graph y = 3 sin x shifted units to the right.
15.
SOLUTION:
In this function, a = 1, b = , c = , and d = 0.
Because d = 0, there is no vertical shift.
16. y = 0.25 cos x + 3
SOLUTION:
In this function, a = , b = 1, c = 0, and d = 3.
Graph y = cos x shifted 3 units up.
17. y = sin 3x – 2
SOLUTION: In this function, a = 1, b = 3, c = 0, and d = –2.
Graph y = sin 3x shifted 2 units down.
18.
SOLUTION:
In this function, a = 1, b = 1, c = , and d = –1.
.
Graph y = cos x shifted units to the right and 1
unit down.
19.
SOLUTION:
In this function, a = 1, b = 1, c = , and d = 4.
.
Graph y = sin x shifted units to the left and 4 units up.
20. VACATIONS The average number of reservations R that a vacation resort has at the beginning of each month is shown.
a. Write an equation of a sinusoidal function that models the average number of reservations using x =1 to represent January. b. According to your model, approximately how many reservations can the resort anticipate in November?
SOLUTION: a. Make a scatter plot of the data and choose a model.
Sample answer: Use a sinusoidal function of the form y = a cos (bx + c) + d to model the data. First, find the maximum M and minimum m values of the data, and use these values to find a, b, c, and d. The maximum and minimum reservations are 200 and 87, respectively. The amplitude a is half of the distance between these values.
The vertical shift d is the average of the maximum and minimum data values.
There are 3 months between the maximum and minimum, so the period is 6.
The maximum data value occurs when x = 1. Since y = cos x attains its first maximum when x = 0, we must apply a phase shift of 1 unit. Use this value to find c.
Write a function using the values for a, b, c, and d.
Use b =
b. To find the number of reservations in November, evaluate the model for x = 11.
Therefore, the resort can anticipate about 115 reservations in November.
21. TIDES The table shown below provides data for the first high and low tides of the day for a certain bay during one day in June.
a. Determine the amplitude, period, phase shift, and vertical shift of a sinusoidal function that models the height of the tide. Let x represent the number of hours that the high or low tide occurred after midnight. b. Write a sinusoidal function that models the data. c. According to your model, what was the height of
the tide at 8:45 P.M. that night?
SOLUTION: a. Sample answer: Use a sinusoidal function of the form y = a cos (bx + c) + d to model the data. First, find the amplitude a, which is half of the distance between the heights of the high and low tides.
The vertical shift d is the average of the heights of the high and low tides.
A sinusoid completes half of a period in the time thatit takes to go from its maximum to its minimum value. One period is twice this time. The first high tide occurs 6.5 hours before the first low tide, so the period is 13.
The maximum data value occurs when x ≈ 4.417. Since y = cos x attains its first maximum when x = 0,we must apply a phase shift of 4.417 units. Use this value to find c.
b. Write a function using the values for a, b, c, and
d. Use b =
c. To find the height of the water at 8:45 P.M. that
night, evaluate the model for x = 20.75.
Therefore, the tide was about 7.28 feet high at 8:45
P.M. that night.
22. METEOROLOGY The average monthly temperatures for Boston, Massachusetts are shown.
a. Determine the amplitude, period, phase shift, and vertical shift of a sinusoidal function that models the monthly temperatures using x = 1 to represent January. b. Write an equation of a sinusoidal function that models the monthly temperatures. c. According to your model, what is Boston’s average temperature in August?
SOLUTION: a. The maximum and minimum are 74° and 29°, respectively. The amplitude a is half of the distance between these values.
The vertical shift d is the average of the maximum and minimum data values.
A sinusoid completes half of a period in the time thatit takes to go from its maximum to its minimum value. So, one period is twice this time. The
maximum function value occurs in July, so xmax is 7.
The minimum function value occurs in January, so
xmin is 1. The period is 2(6) = 12.
The maximum data value occurs when x = 7. Since y = cos x attains its first maximum when x = 0, we must apply a phase shift of 7 units. Use this value to find c.
b. Using the values for a, b, c, and d from part a, a sinusoidal function that models that monthly temperatures in Boston is
c. To find the average monthly temperature for Boston in August, evaluate the model for x = 8.
Therefore, the average monthly temperature for Boston in August is about 71°F.
GRAPHING CALCULATOR Find the values of x in the interval – < x < that make each equation or inequality true. (Hint: Use the intersection function.)
23. –sin x = cos x
SOLUTION:
Graph y = −sin x and y = cos x on the same graphing
calculator screen on (−π, π). Use the intersect feature under the CALC menu to determine where the two graphs intersect.
The graphs intersect at about −0.7854 or − and
about 2.356 or . Therefore, on –π < x < π, –sin x
= cos x when x = − and .
24. sin x − cos x = 1
SOLUTION:
Graph y = sin x − cos x and y = 1 on the same
graphing calculator screen on (− , ). Use the intersect feature under the CALC menu to determine where the two graphs intersect.
The graphs intersect at about 1.57 or . Therefore,
on – < x < , sin x − cos x = 1 when x = .
25. sin x + cos x = 0
SOLUTION:
Graph y = sin x + cos x on (−π, π). Use the zero feature under the CALC menu to determine the zeros of the function.
There are zeros at about −0.785 or − or and about
2.356 or . Therefore, on – < x < , sin x + cos
x = 0 when
26. cos x ≤ sin x
SOLUTION:
Graph y = cos x and y = sin x on (−π, π). Use the intersect feature under the CALC menu to determine on what interval(s) cos x ≤ sin x.
The graphs intersect at about –2.356 or – and
about 0.785 or . From the graph, it appears that
cos x ≤ sin x on – < x < – and < x < .
27. sin x cos x > 1
SOLUTION:
Graph y = sin x cos x and y = 1 on (− , ). Use the intersect feature under the CALC menu to determine on what interval(s) sin x cos x > 1.
The graphs do not intersect. Therefore, y = sin x cos
x is not greater than y = 1 for any values of x on –< x < .
28. sin x cos x ≤ 0
SOLUTION:
Graph y = sin x cos x on (−π, π). Use the zero feature under the CALC menu to determine on what interval(s) sin x cos x ≤ 0.
The zeros of y = sin x cos x are about –1.57 or ,
0, and about 1.57 or . From the graph, it appears
that sin x cos x ≤ 0 on < x < 0 and < x < .
29. CAROUSELS A wooden horse on a carousel moves up and down as the carousel spins. When the ride ends, the horse usually stops in a vertical position different from where it started. The position y of the horse after t seconds can be modeled by y =1.5 sin (2t + c), where the phase shift c must be continuously adjusted to compensate for the differentstarting positions. If during one ride the horse
reached a maximum height after seconds, find
the equation that models the horse’s position.
SOLUTION: First, find the period of y = 1.5 sin (2t + c).
Since the period is π, the function will reach a
maximum height at radians. The phase shift is the
difference between the horizontal position of the
function at and radians, which is radians.
Substitute and b into the phase shift formula to
find c.
Therefore, the equation is
30. AMUSEMENT PARKS The position y in feet of a passenger cart relative to the center of a Ferris wheel over t seconds is shown below.
a. Find the time t that it takes for the cart to return toy = 0 during its initial spin. b. Find the period of the Ferris wheel. c. Sketch the graph representing the position of the passenger cart over one period. d. Write a sinusoidal function that models the position of the passenger cart as a function of time t.
SOLUTION: a. From the diagram, the height of the cart is 0 ft when t = 0, and reaches a maximum height of 19 feet when t = 3.75 seconds. So, the cart will return to y = 0 after 2(3.75) or 7.5 seconds. b. The cart completes half of a cycle from t = 0 to t = 7.5. So, the period is 2(7.5) or 15 seconds. c.
d. The amplitude a is half of the maximum and
minimum values. So, a =
The vertical shift d is the average of the maximum
and minimum data values. So,
Because the period of a sinusoidal function is
you can write Therefore,
There is no phase shift because the height of the cartwhen t = 0 is 0 feet, and the sine function has a y-intercept of 0. Therefore, one equation that could be used to model
the position of the passenger cart is y = 19 sin t.
Write an equation that corresponds to each graph.
31.
SOLUTION: Sample answer: There is an x-intercept at 0, so one equation that corresponds to this graph is y = a sin (bx + c) + d. Half of the distance from the maximum to the minimum value of the function is 3. So, the amplitudeis 3. It appears that the function completes one period on
[0, π]. Find b.
The midline appears to be at y = 0, so there does not appear to be any vertical shift. Therefore, one equation that corresponds to this graph is y = 3 sin (2x).
32.
SOLUTION:
Sample answer: Because there is a y-intercept at ,
one equation that corresponds to this graph is y = a cos (bx + c) + d. Half of the distance from the maximum to the
minimum value of the function is . So, the
amplitude is .
It appears that the function completes one period on [0, 6π]. Find b.
The midline appears to be at y = 0, so there does not appear to be any vertical shift. Therefore, one
equation that corresponds to this graph is y = cos
.
33.
SOLUTION: Sample answer: Because there is a y-intercept at 3, one equation that corresponds to this graph is y = a cos (bx + c) + d. Half of the distance from the maximum to the
minimum value of the function is 4 ÷ 2 or 2. So, the amplitude is 2. It appears that the function completes one period on
Find b.
The midline appears to be at y = 1, so there is a vertical shift 1 unit up. Therefore, one equation that corresponds to this graph is y = 2 cos 4x + 1.
34.
SOLUTION: Sample answer: There is an x-intercept at 0, so one equation that corresponds to this graph is y = a sin (bx + c) + d. Half of the distance from the maximum to the
minimum value of the function is 8 ÷ 2 or 4. So, the amplitude is 4. It appears that the function completes one period on [0, 4π]. Find b.
The midline appears to be at y = −2, so there is a vertical shift of 2 units down. Therefore, one equation that corresponds to this graph is y = 4 sin
− 2.
Write a sinusoidal function with the given period and amplitude that passes through the given point.
35. period: ; amplitude: 5; point:
SOLUTION: Use the period to find b.
Sample answer: One sinusoidal function in which a =5 and b = 2 is y = 5 cos 2x. Evaluate the function for
The function passes through . Therefore, a
sinusoidal function with period π and amplitude 5 that
passes through the point is y = 5 cos 2x.
36. period: 4 ; amplitude: 2; point: ( , 2)
SOLUTION: Use the period to find b.
Sample answer: One sinusoidal function in which a =
2 and b = is y = 2 sin . Evaluate the function
for x = π.
The function passes through ( , 2). Therefore, a
sinusoidal function with period 4π and amplitude 2
that passes through the point ( , 2) is y = 2 sin .
37. period: ; amplitude: ; point:
SOLUTION: Use the period to find b.
Sample answer: One sinusoidal function in which a =1.5 and b = 4 is y = 1.5 cos 4x. Evaluate the function
for
The function passes through . Therefore, a
sinusoidal function with period and amplitude 1.5
that passes through the point is y = 1.5 cos
4x.
38. period: 3π; amplitude: ; point:
SOLUTION: Use the period to find b.
Sample answer: One sinusoidal function in which a =
0.5 and b = is y = sin x. Evaluate the
function for
The function passes through . Therefore, a
sinusoidal function with period 3π and amplitude 0.5
that passes through the point is y = sin
x.
39. MULTIPLE REPRESENTATIONS In this problem, you will investigate the change in the graph of a sinusoidal function of the form y = sin x or y = cos x when multiplied by a polynomial function. a. GRAPHICAL Use a graphing calculator to sketch the graphs of y = 2x, y = –2x, and y = 2x cos x on the same coordinate plane, on the interval [–20, 20]. b. VERBAL Describe the behavior of the graph of y = 2x cos x in relation to the graphs of y = 2x and y = –2x. c. GRAPHICAL Use a graphing calculator to
sketch the graphs of y = x2, y = –x
2, and y = x
2 sin x
on the same coordinate plane, on the interval [–20, 20]. d. VERBAL Describe the behavior of the graph of
y = x2 sin x in relation to the graphs of y = x
2 and y
= –x2.
e. ANALYTICAL Make a conjecture as to the behavior of the graph of a sinusoidal function of the form y = sin x or y = cos x when multiplied by polynomial function of the form y = f (x).
SOLUTION: a.
b. The graph of y = 2x cos x oscillates between the graphs of y = 2x and y = –2x. c.
d. The graph of y = x2 sin x oscillates between the
graphs of y = x2 and y = –x
2.
e . The graph of y = f (x) sin x or y = f (x) cos x will oscillate between the graphs of y = f (x) and y = –f(x).
40. CHALLENGE Without graphing, find the exact coordinates of the first maximum point to the right of
the y-axis for
SOLUTION:
First, find the phase shift for
Next, find the period of the function.
The first maximum for one period can be found by
finding So, incorporating the phase shift, the
first maximum to the right of the y-axis is
. Because the amplitude is |4| = 4,
the maximum point is
REASONING Determine whether each statement is true or false . Explain your reasoning.
41. Every sine function of the form y = a sin (bx + c) + d can be written as a cosine function of the form y =a cos (bx + c) + d.
SOLUTION: It is true that every sine function of the form y = a sin (bx + c) + d can be written as a cosine function of the form y = a cos (bx + c) + d. The graph of cosine is a horizontal translation of the sine graph. Therefore, a cosine function can be written from any sine function using the same amplitude and period by applying the necessary phase shift.
For example, consider and
. Phase shift by
to obtain .
42. The period of f (x) = cos 8x is equal to four times the period of g(x) = cos 2x.
SOLUTION: Find the period of f (x) = cos 8x.
Find the period of g(x) = cos 2x.
Four times the period of g(x) = cos 2x is 4 ⋅ or
4 . So, the period of f (x) is the period of g(x).
Therefore, the statement is false.
43. CHALLENGE How many zeros does y = cos
1500x have on the interval 0 ≤ x ≤ 2 ?
SOLUTION: Find the period of y = cos 1500x.
Graph y = cos 1500x on .
The graph of y = cos 1500x has two x-intercepts for one cycle, so the function has 2 zeros per cycle. Find
the number of cycles for y = cos 1500x on [0, 2 ].
So, the graph of y = cos 1500x will complete 1500
cycles on [0, 2 ]. Because there are two zeros per cycle, y = cos 1500x will have 1500(2) or 3000 zeros
on [0, 2 ].
44. PROOF Prove the phase shift formula.
SOLUTION:
Consider y = a sin (bx + c), where a , b, and c ≠ 0. To find a zero of the function, find the value of x for which a sin (bx + c) = 0. Since sin 0 = 0, solving bx + c = 0 will yield a zero of the function.
Therefore, y = 0 when . The value of is
the phase shift. When c > 0: The graph of y = a sin (bx + c) is the
graph of y = a sin x, shifted units to the left.
When c < 0: The graph of y = a sin (bx + c) is the
graph of y = a sin x, shifted units to the right.
Consider the graph of y = cos x below in blue. In this equation a = 1, b = 1 and c = 0. One zero of y = cos x is . The green graph is shifted to the
left. Thus c is – . Then the shifted equation will be
.
45. Writing in Math The Power Tower ride in Sandusky, Ohio, is shown below. Along the side of each tower is a string of lights that send a continuouspulse of light up and down each tower at a constant rate. Explain why the distance d of this light from theground over time t cannot be represented by a sinusoidal function.
SOLUTION: Sample answer: Although the pulse of light can be represented as a function with a period, it is not a sinusoidal function because the distance the pulse of light is from the ground changes at a constant rate. As a result, the graph of this function would resemble the graph below.
The given point lies on the terminal side of an angle θ in standard position. Find the values of
the six trigonometric functions of θ. 46. (−4, 4)
SOLUTION: Use the values of x and y to find r.
Use x = –4, y = 4, and r = to write the six trigonometric ratios.
47. (8, −2)
SOLUTION: Use the values of x and y to find r.
Use x = 8, y = –2, and r = to write the six trigonometric ratios.
48. (−5, −9)
SOLUTION: Use the values of x and y to find r.
Use x = –5, y = – 9, and r = to write the six trigonometric ratios.
49. (4, 5)
SOLUTION: Use the values of x and y to find r.
Use x = 4, y = 5, and r = to write the six trigonometric ratios.
Write each degree measure in radians as a multiple of π and each radian measure in degrees.
50. 25°
SOLUTION: To convert a degree measure to radians, multiply by
51. −420°
SOLUTION: To convert a degree measure to radians, multiply by
52.
SOLUTION: To convert a radian measure to degrees, multiply by
53.
SOLUTION: To convert a radian measure to degrees, multiply by
54. SCIENCE Radiocarbon dating is a method of estimating the age of an organic material by calculating the amount of carbon-14 present in the material. The age of a material can be calculated
using A = t , where A is the age of the
object in years, t is the half-life of carbon-14 or 5700 years, and R is the ratio of the amount of carbon-14 in the sample to the amount of carbon-14 in living tissue. a. A sample of organic material contains 0.000076 gram of carbon-14. A living sample of the same
Describe how the graphs of f (x) and g (x) are related. Then find the amplitude of g (x), and sketch two periods of both functions on the same coordinate axes.
1. f (x) = sin x; g(x) = sin x
SOLUTION: The graph of g(x) is the graph of f (x) compressed
vertically. The amplitude of g(x) is or .
Create a table listing the coordinates of the x-intercepts and extrema for f (x) = sin x for one
period, 2 , on the interval [0, 2 ]. Then use the amplitude of g(x) to find corresponding points on its graph.
Sketch the curve through the indicated points for each function. Then repeat the pattern to complete asecond period.
Functions f (x) = sin x g(x) = sin x
x-int (0, 0) (0, 0)
Max
x-int
Min
x-int
2.
SOLUTION: The graph of g(x) is the graph of f (x) compressed
vertically. The amplitude of g(x) is or .
Create a table listing the coordinates of the x-intercepts and extrema for f (x) = cos x for one
period, 2 , on the interval [0, 2 ]. Then use the amplitude of g(x) to find corresponding points on its graph.
Sketch the curve through the indicated points for each function. Then repeat the pattern to complete asecond period.
Function f (x) = cos x
Max (0, 1)
x-int Min
x-in
Min
x-int
Function f (x) = cos x
Max x-int
Min
x-in
Min
x-int
3. f (x) = cos x; g(x) = 6 cos x
SOLUTION: The graph of g(x) is the graph of f (x) expanded
vertically. The amplitude of g(x) is or 6.
Create a table listing the coordinates of the x-intercepts and extrema for f (x) = cos x for one
period, 2 , on the interval [0, 2 ]. Then use the amplitude of g(x) to find corresponding points on its graph.
Sketch the curve through the indicated points for each function. Then repeat the pattern to complete asecond period.
Functions f (x) = cos x g(x) = 6 cos x
Max (0, 1) (0, 6)
x-int
Min
x-int
Max
4. f (x) = sin x; g(x) = −8 sin x
SOLUTION: The graph of g(x) is the graph of f (x) expanded
vertically. The amplitude of g(x) is or 8.
Create a table listing the coordinates of the x-intercepts and extrema for f (x) = sin x for one
period, 2 , on the interval [0, 2 ]. Then use the amplitude of g(x) to find corresponding points on its graph.
Sketch the curve through the indicated points for each function. Then repeat the pattern to complete asecond period.
Function f (x) = sin x
x-int (0, 0)
Max
x-int
Min
x-int
Function g(x) = −8
sin x
x-int (0, 0)
Min
x-int
Max
x-int
Describe how the graphs of f (x) and g (x) are related. Then find the period of g (x), and sketch at least one period of both functions on the same coordinate axes.
5. f (x) = sin x; g(x) = sin 4x
SOLUTION: The graph of g(x) is the graph of f (x) compressed
horizontally. The period of g(x) is . To find
corresponding points on the graph of g(x), change the x-coordinates of those key points on f (x) so that
they range from 0 to , increasing by increments of
.
Sketch the curve through the indicated points for each function. Then repeat the pattern to complete asecond period.
Functions f (x) = sin x g(x) = sin
4x
x-int (0, 0) (0, 0)
Max
x-int
Min
x-int
6. f (x) = cos x; g(x) = cos 2x
SOLUTION: The graph of g(x) is the graph of f (x) compressed
horizontally. The period of g(x) is or . To find
corresponding points on the graph of g(x), change the x-coordinates of those key points on f (x) so that
they range from 0 to , increasing by increments of
.
Sketch the curve through the indicated points for each function. Then repeat the pattern to complete asecond period.
Functions f (x) = cos x g(x) = cos 2x
Max (0, 1) (0, 1)
x-int
Min
x-int
Max
7. f (x) = cos x;
SOLUTION: The graph of g(x) is the graph of f (x) expanded
horizontally. The period of g(x) is . To
find corresponding points on the graph of g(x), change the x-coordinates of those key points on f (x)
so that they range from 0 to , increasing by
increments of or .
Sketch the curve through the indicated points for each function. Then repeat the pattern to complete asecond period.
Functions f (x) = cos x
Max (0, 1) (0, 1)
x-int
Min
x-int
Max
8. f (x) = sin x;
SOLUTION: The graph of g(x) is the graph of f (x) expanded
horizontally. The period of g(x) is . To find corresponding points on the graph of g(x), change the x-coordinates of those key points on f (x) so that they range from 0 to , increasing by increments of
or .
Sketch the curve through the indicated points for each function. Then repeat the pattern to complete asecond period.
Functions f (x) = sin x
x-int (0, 0) (0, 0)
Max
x-int
Min
x-int
9. VOICES The contralto vocal type includes the deepest female singing voice. Some contraltos can sing as low as the E below middle C (E3), which hasa frequency of 165 hertz. Write an equation for a sine function that models the initial behavior of the sound wave associated with E3 having an amplitude of 0.15.
SOLUTION: The general form of the equation will be y = a sin bt,where t is the time in seconds. Because the
amplitude is 0.15, |a|= 0.15. This means that a = ±0.15. The period is the reciprocal of the frequency or
. Use this value to find b.
Sample answer: One sine function that models the
initial behavior is y = 0.15 sin 330 t.
Write a sine function that can be used to model the initial behavior of a sound wave with the frequency and amplitude given.
10. f = 440, a = 0.3
SOLUTION: The general form of the equation is y = a sin bt, where t is the time in seconds. Because the
amplitude is 0.3, = 0.3. This means that a = ±0.3.
The period is the reciprocal of the frequency or
. Use this value to find b.
Using the positive values of a and b, one sine function that models the initial behavior is y = 0.3 sin
880 t.
11. f = 932, a = 0.25
SOLUTION: The general form of the equation is y = a sin bt, where t is the time in seconds. Because the
amplitude is 0.25, = 0.25. This means that a =
±0.25. The period is the reciprocal of the frequency
or . Use this value to find b.
Using the positive values of a and b, one sine function that models the initial behavior is y = 0.25
sin 1864 t.
12. f = 1245, a = 0.12
SOLUTION: The general form of the equation is y = a sin bt, where t is the time in seconds. Because the
amplitude is 0.12, = 0.12. This means that a =
±0.12. The period is the reciprocal of the frequency or
. Use this value to find b.
Using the positive values of a and b, one sine function that models the initial behavior is y = 0.12
sin 2490 t.
13. f = 623, a = 0.2
SOLUTION: The general form of the equation is y = a sin bt, where t is the time in seconds. Because the
amplitude is 0.2, = 0.2. This means that a = ±0.2.
The period is the reciprocal of the frequency or
. Use this value to find b.
Using the positive values of a and b, one sine function that models the initial behavior is y = 0.2 sin
1246 t.
State the amplitude, period, frequency, phase shift, and vertical shift of each function. Then graph two periods of the function.
14.
SOLUTION:
In this function, a = 3, b = 1, c = − , and d = 0.
Because d = 0, there is no vertical shift.
Graph y = 3 sin x shifted units to the right.
15.
SOLUTION:
In this function, a = 1, b = , c = , and d = 0.
Because d = 0, there is no vertical shift.
16. y = 0.25 cos x + 3
SOLUTION:
In this function, a = , b = 1, c = 0, and d = 3.
Graph y = cos x shifted 3 units up.
17. y = sin 3x – 2
SOLUTION: In this function, a = 1, b = 3, c = 0, and d = –2.
Graph y = sin 3x shifted 2 units down.
18.
SOLUTION:
In this function, a = 1, b = 1, c = , and d = –1.
.
Graph y = cos x shifted units to the right and 1
unit down.
19.
SOLUTION:
In this function, a = 1, b = 1, c = , and d = 4.
.
Graph y = sin x shifted units to the left and 4 units up.
20. VACATIONS The average number of reservations R that a vacation resort has at the beginning of each month is shown.
a. Write an equation of a sinusoidal function that models the average number of reservations using x =1 to represent January. b. According to your model, approximately how many reservations can the resort anticipate in November?
SOLUTION: a. Make a scatter plot of the data and choose a model.
Sample answer: Use a sinusoidal function of the form y = a cos (bx + c) + d to model the data. First, find the maximum M and minimum m values of the data, and use these values to find a, b, c, and d. The maximum and minimum reservations are 200 and 87, respectively. The amplitude a is half of the distance between these values.
The vertical shift d is the average of the maximum and minimum data values.
There are 3 months between the maximum and minimum, so the period is 6.
The maximum data value occurs when x = 1. Since y = cos x attains its first maximum when x = 0, we must apply a phase shift of 1 unit. Use this value to find c.
Write a function using the values for a, b, c, and d.
Use b =
b. To find the number of reservations in November, evaluate the model for x = 11.
Therefore, the resort can anticipate about 115 reservations in November.
21. TIDES The table shown below provides data for the first high and low tides of the day for a certain bay during one day in June.
a. Determine the amplitude, period, phase shift, and vertical shift of a sinusoidal function that models the height of the tide. Let x represent the number of hours that the high or low tide occurred after midnight. b. Write a sinusoidal function that models the data. c. According to your model, what was the height of
the tide at 8:45 P.M. that night?
SOLUTION: a. Sample answer: Use a sinusoidal function of the form y = a cos (bx + c) + d to model the data. First, find the amplitude a, which is half of the distance between the heights of the high and low tides.
The vertical shift d is the average of the heights of the high and low tides.
A sinusoid completes half of a period in the time thatit takes to go from its maximum to its minimum value. One period is twice this time. The first high tide occurs 6.5 hours before the first low tide, so the period is 13.
The maximum data value occurs when x ≈ 4.417. Since y = cos x attains its first maximum when x = 0,we must apply a phase shift of 4.417 units. Use this value to find c.
b. Write a function using the values for a, b, c, and
d. Use b =
c. To find the height of the water at 8:45 P.M. that
night, evaluate the model for x = 20.75.
Therefore, the tide was about 7.28 feet high at 8:45
P.M. that night.
22. METEOROLOGY The average monthly temperatures for Boston, Massachusetts are shown.
a. Determine the amplitude, period, phase shift, and vertical shift of a sinusoidal function that models the monthly temperatures using x = 1 to represent January. b. Write an equation of a sinusoidal function that models the monthly temperatures. c. According to your model, what is Boston’s average temperature in August?
SOLUTION: a. The maximum and minimum are 74° and 29°, respectively. The amplitude a is half of the distance between these values.
The vertical shift d is the average of the maximum and minimum data values.
A sinusoid completes half of a period in the time thatit takes to go from its maximum to its minimum value. So, one period is twice this time. The
maximum function value occurs in July, so xmax is 7.
The minimum function value occurs in January, so
xmin is 1. The period is 2(6) = 12.
The maximum data value occurs when x = 7. Since y = cos x attains its first maximum when x = 0, we must apply a phase shift of 7 units. Use this value to find c.
b. Using the values for a, b, c, and d from part a, a sinusoidal function that models that monthly temperatures in Boston is
c. To find the average monthly temperature for Boston in August, evaluate the model for x = 8.
Therefore, the average monthly temperature for Boston in August is about 71°F.
GRAPHING CALCULATOR Find the values of x in the interval – < x < that make each equation or inequality true. (Hint: Use the intersection function.)
23. –sin x = cos x
SOLUTION:
Graph y = −sin x and y = cos x on the same graphing
calculator screen on (−π, π). Use the intersect feature under the CALC menu to determine where the two graphs intersect.
The graphs intersect at about −0.7854 or − and
about 2.356 or . Therefore, on –π < x < π, –sin x
= cos x when x = − and .
24. sin x − cos x = 1
SOLUTION:
Graph y = sin x − cos x and y = 1 on the same
graphing calculator screen on (− , ). Use the intersect feature under the CALC menu to determine where the two graphs intersect.
The graphs intersect at about 1.57 or . Therefore,
on – < x < , sin x − cos x = 1 when x = .
25. sin x + cos x = 0
SOLUTION:
Graph y = sin x + cos x on (−π, π). Use the zero feature under the CALC menu to determine the zeros of the function.
There are zeros at about −0.785 or − or and about
2.356 or . Therefore, on – < x < , sin x + cos
x = 0 when
26. cos x ≤ sin x
SOLUTION:
Graph y = cos x and y = sin x on (−π, π). Use the intersect feature under the CALC menu to determine on what interval(s) cos x ≤ sin x.
The graphs intersect at about –2.356 or – and
about 0.785 or . From the graph, it appears that
cos x ≤ sin x on – < x < – and < x < .
27. sin x cos x > 1
SOLUTION:
Graph y = sin x cos x and y = 1 on (− , ). Use the intersect feature under the CALC menu to determine on what interval(s) sin x cos x > 1.
The graphs do not intersect. Therefore, y = sin x cos
x is not greater than y = 1 for any values of x on –< x < .
28. sin x cos x ≤ 0
SOLUTION:
Graph y = sin x cos x on (−π, π). Use the zero feature under the CALC menu to determine on what interval(s) sin x cos x ≤ 0.
The zeros of y = sin x cos x are about –1.57 or ,
0, and about 1.57 or . From the graph, it appears
that sin x cos x ≤ 0 on < x < 0 and < x < .
29. CAROUSELS A wooden horse on a carousel moves up and down as the carousel spins. When the ride ends, the horse usually stops in a vertical position different from where it started. The position y of the horse after t seconds can be modeled by y =1.5 sin (2t + c), where the phase shift c must be continuously adjusted to compensate for the differentstarting positions. If during one ride the horse
reached a maximum height after seconds, find
the equation that models the horse’s position.
SOLUTION: First, find the period of y = 1.5 sin (2t + c).
Since the period is π, the function will reach a
maximum height at radians. The phase shift is the
difference between the horizontal position of the
function at and radians, which is radians.
Substitute and b into the phase shift formula to
find c.
Therefore, the equation is
30. AMUSEMENT PARKS The position y in feet of a passenger cart relative to the center of a Ferris wheel over t seconds is shown below.
a. Find the time t that it takes for the cart to return toy = 0 during its initial spin. b. Find the period of the Ferris wheel. c. Sketch the graph representing the position of the passenger cart over one period. d. Write a sinusoidal function that models the position of the passenger cart as a function of time t.
SOLUTION: a. From the diagram, the height of the cart is 0 ft when t = 0, and reaches a maximum height of 19 feet when t = 3.75 seconds. So, the cart will return to y = 0 after 2(3.75) or 7.5 seconds. b. The cart completes half of a cycle from t = 0 to t = 7.5. So, the period is 2(7.5) or 15 seconds. c.
d. The amplitude a is half of the maximum and
minimum values. So, a =
The vertical shift d is the average of the maximum
and minimum data values. So,
Because the period of a sinusoidal function is
you can write Therefore,
There is no phase shift because the height of the cartwhen t = 0 is 0 feet, and the sine function has a y-intercept of 0. Therefore, one equation that could be used to model
the position of the passenger cart is y = 19 sin t.
Write an equation that corresponds to each graph.
31.
SOLUTION: Sample answer: There is an x-intercept at 0, so one equation that corresponds to this graph is y = a sin (bx + c) + d. Half of the distance from the maximum to the minimum value of the function is 3. So, the amplitudeis 3. It appears that the function completes one period on
[0, π]. Find b.
The midline appears to be at y = 0, so there does not appear to be any vertical shift. Therefore, one equation that corresponds to this graph is y = 3 sin (2x).
32.
SOLUTION:
Sample answer: Because there is a y-intercept at ,
one equation that corresponds to this graph is y = a cos (bx + c) + d. Half of the distance from the maximum to the
minimum value of the function is . So, the
amplitude is .
It appears that the function completes one period on [0, 6π]. Find b.
The midline appears to be at y = 0, so there does not appear to be any vertical shift. Therefore, one
equation that corresponds to this graph is y = cos
.
33.
SOLUTION: Sample answer: Because there is a y-intercept at 3, one equation that corresponds to this graph is y = a cos (bx + c) + d. Half of the distance from the maximum to the
minimum value of the function is 4 ÷ 2 or 2. So, the amplitude is 2. It appears that the function completes one period on
Find b.
The midline appears to be at y = 1, so there is a vertical shift 1 unit up. Therefore, one equation that corresponds to this graph is y = 2 cos 4x + 1.
34.
SOLUTION: Sample answer: There is an x-intercept at 0, so one equation that corresponds to this graph is y = a sin (bx + c) + d. Half of the distance from the maximum to the
minimum value of the function is 8 ÷ 2 or 4. So, the amplitude is 4. It appears that the function completes one period on [0, 4π]. Find b.
The midline appears to be at y = −2, so there is a vertical shift of 2 units down. Therefore, one equation that corresponds to this graph is y = 4 sin
− 2.
Write a sinusoidal function with the given period and amplitude that passes through the given point.
35. period: ; amplitude: 5; point:
SOLUTION: Use the period to find b.
Sample answer: One sinusoidal function in which a =5 and b = 2 is y = 5 cos 2x. Evaluate the function for
The function passes through . Therefore, a
sinusoidal function with period π and amplitude 5 that
passes through the point is y = 5 cos 2x.
36. period: 4 ; amplitude: 2; point: ( , 2)
SOLUTION: Use the period to find b.
Sample answer: One sinusoidal function in which a =
2 and b = is y = 2 sin . Evaluate the function
for x = π.
The function passes through ( , 2). Therefore, a
sinusoidal function with period 4π and amplitude 2
that passes through the point ( , 2) is y = 2 sin .
37. period: ; amplitude: ; point:
SOLUTION: Use the period to find b.
Sample answer: One sinusoidal function in which a =1.5 and b = 4 is y = 1.5 cos 4x. Evaluate the function
for
The function passes through . Therefore, a
sinusoidal function with period and amplitude 1.5
that passes through the point is y = 1.5 cos
4x.
38. period: 3π; amplitude: ; point:
SOLUTION: Use the period to find b.
Sample answer: One sinusoidal function in which a =
0.5 and b = is y = sin x. Evaluate the
function for
The function passes through . Therefore, a
sinusoidal function with period 3π and amplitude 0.5
that passes through the point is y = sin
x.
39. MULTIPLE REPRESENTATIONS In this problem, you will investigate the change in the graph of a sinusoidal function of the form y = sin x or y = cos x when multiplied by a polynomial function. a. GRAPHICAL Use a graphing calculator to sketch the graphs of y = 2x, y = –2x, and y = 2x cos x on the same coordinate plane, on the interval [–20, 20]. b. VERBAL Describe the behavior of the graph of y = 2x cos x in relation to the graphs of y = 2x and y = –2x. c. GRAPHICAL Use a graphing calculator to
sketch the graphs of y = x2, y = –x
2, and y = x
2 sin x
on the same coordinate plane, on the interval [–20, 20]. d. VERBAL Describe the behavior of the graph of
y = x2 sin x in relation to the graphs of y = x
2 and y
= –x2.
e. ANALYTICAL Make a conjecture as to the behavior of the graph of a sinusoidal function of the form y = sin x or y = cos x when multiplied by polynomial function of the form y = f (x).
SOLUTION: a.
b. The graph of y = 2x cos x oscillates between the graphs of y = 2x and y = –2x. c.
d. The graph of y = x2 sin x oscillates between the
graphs of y = x2 and y = –x
2.
e . The graph of y = f (x) sin x or y = f (x) cos x will oscillate between the graphs of y = f (x) and y = –f(x).
40. CHALLENGE Without graphing, find the exact coordinates of the first maximum point to the right of
the y-axis for
SOLUTION:
First, find the phase shift for
Next, find the period of the function.
The first maximum for one period can be found by
finding So, incorporating the phase shift, the
first maximum to the right of the y-axis is
. Because the amplitude is |4| = 4,
the maximum point is
REASONING Determine whether each statement is true or false . Explain your reasoning.
41. Every sine function of the form y = a sin (bx + c) + d can be written as a cosine function of the form y =a cos (bx + c) + d.
SOLUTION: It is true that every sine function of the form y = a sin (bx + c) + d can be written as a cosine function of the form y = a cos (bx + c) + d. The graph of cosine is a horizontal translation of the sine graph. Therefore, a cosine function can be written from any sine function using the same amplitude and period by applying the necessary phase shift.
For example, consider and
. Phase shift by
to obtain .
42. The period of f (x) = cos 8x is equal to four times the period of g(x) = cos 2x.
SOLUTION: Find the period of f (x) = cos 8x.
Find the period of g(x) = cos 2x.
Four times the period of g(x) = cos 2x is 4 ⋅ or
4 . So, the period of f (x) is the period of g(x).
Therefore, the statement is false.
43. CHALLENGE How many zeros does y = cos
1500x have on the interval 0 ≤ x ≤ 2 ?
SOLUTION: Find the period of y = cos 1500x.
Graph y = cos 1500x on .
The graph of y = cos 1500x has two x-intercepts for one cycle, so the function has 2 zeros per cycle. Find
the number of cycles for y = cos 1500x on [0, 2 ].
So, the graph of y = cos 1500x will complete 1500
cycles on [0, 2 ]. Because there are two zeros per cycle, y = cos 1500x will have 1500(2) or 3000 zeros
on [0, 2 ].
44. PROOF Prove the phase shift formula.
SOLUTION:
Consider y = a sin (bx + c), where a , b, and c ≠ 0. To find a zero of the function, find the value of x for which a sin (bx + c) = 0. Since sin 0 = 0, solving bx + c = 0 will yield a zero of the function.
Therefore, y = 0 when . The value of is
the phase shift. When c > 0: The graph of y = a sin (bx + c) is the
graph of y = a sin x, shifted units to the left.
When c < 0: The graph of y = a sin (bx + c) is the
graph of y = a sin x, shifted units to the right.
Consider the graph of y = cos x below in blue. In this equation a = 1, b = 1 and c = 0. One zero of y = cos x is . The green graph is shifted to the
left. Thus c is – . Then the shifted equation will be
.
45. Writing in Math The Power Tower ride in Sandusky, Ohio, is shown below. Along the side of each tower is a string of lights that send a continuouspulse of light up and down each tower at a constant rate. Explain why the distance d of this light from theground over time t cannot be represented by a sinusoidal function.
SOLUTION: Sample answer: Although the pulse of light can be represented as a function with a period, it is not a sinusoidal function because the distance the pulse of light is from the ground changes at a constant rate. As a result, the graph of this function would resemble the graph below.
The given point lies on the terminal side of an angle θ in standard position. Find the values of
the six trigonometric functions of θ. 46. (−4, 4)
SOLUTION: Use the values of x and y to find r.
Use x = –4, y = 4, and r = to write the six trigonometric ratios.
47. (8, −2)
SOLUTION: Use the values of x and y to find r.
Use x = 8, y = –2, and r = to write the six trigonometric ratios.
48. (−5, −9)
SOLUTION: Use the values of x and y to find r.
Use x = –5, y = – 9, and r = to write the six trigonometric ratios.
49. (4, 5)
SOLUTION: Use the values of x and y to find r.
Use x = 4, y = 5, and r = to write the six trigonometric ratios.
Write each degree measure in radians as a multiple of π and each radian measure in degrees.
50. 25°
SOLUTION: To convert a degree measure to radians, multiply by
51. −420°
SOLUTION: To convert a degree measure to radians, multiply by
52.
SOLUTION: To convert a radian measure to degrees, multiply by
53.
SOLUTION: To convert a radian measure to degrees, multiply by
54. SCIENCE Radiocarbon dating is a method of estimating the age of an organic material by calculating the amount of carbon-14 present in the material. The age of a material can be calculated
using A = t , where A is the age of the
object in years, t is the half-life of carbon-14 or 5700 years, and R is the ratio of the amount of carbon-14 in the sample to the amount of carbon-14 in living tissue. a. A sample of organic material contains 0.000076 gram of carbon-14. A living sample of the same
eSolutions Manual - Powered by Cognero Page 1
4-4 Graphing Sine and Cosine Functions
Describe how the graphs of f (x) and g (x) are related. Then find the amplitude of g (x), and sketch two periods of both functions on the same coordinate axes.
1. f (x) = sin x; g(x) = sin x
SOLUTION: The graph of g(x) is the graph of f (x) compressed
vertically. The amplitude of g(x) is or .
Create a table listing the coordinates of the x-intercepts and extrema for f (x) = sin x for one
period, 2 , on the interval [0, 2 ]. Then use the amplitude of g(x) to find corresponding points on its graph.
Sketch the curve through the indicated points for each function. Then repeat the pattern to complete asecond period.
Functions f (x) = sin x g(x) = sin x
x-int (0, 0) (0, 0)
Max
x-int
Min
x-int
2.
SOLUTION: The graph of g(x) is the graph of f (x) compressed
vertically. The amplitude of g(x) is or .
Create a table listing the coordinates of the x-intercepts and extrema for f (x) = cos x for one
period, 2 , on the interval [0, 2 ]. Then use the amplitude of g(x) to find corresponding points on its graph.
Sketch the curve through the indicated points for each function. Then repeat the pattern to complete asecond period.
Function f (x) = cos x
Max (0, 1)
x-int Min
x-in
Min
x-int
Function f (x) = cos x
Max x-int
Min
x-in
Min
x-int
3. f (x) = cos x; g(x) = 6 cos x
SOLUTION: The graph of g(x) is the graph of f (x) expanded
vertically. The amplitude of g(x) is or 6.
Create a table listing the coordinates of the x-intercepts and extrema for f (x) = cos x for one
period, 2 , on the interval [0, 2 ]. Then use the amplitude of g(x) to find corresponding points on its graph.
Sketch the curve through the indicated points for each function. Then repeat the pattern to complete asecond period.
Functions f (x) = cos x g(x) = 6 cos x
Max (0, 1) (0, 6)
x-int
Min
x-int
Max
4. f (x) = sin x; g(x) = −8 sin x
SOLUTION: The graph of g(x) is the graph of f (x) expanded
vertically. The amplitude of g(x) is or 8.
Create a table listing the coordinates of the x-intercepts and extrema for f (x) = sin x for one
period, 2 , on the interval [0, 2 ]. Then use the amplitude of g(x) to find corresponding points on its graph.
Sketch the curve through the indicated points for each function. Then repeat the pattern to complete asecond period.
Function f (x) = sin x
x-int (0, 0)
Max
x-int
Min
x-int
Function g(x) = −8
sin x
x-int (0, 0)
Min
x-int
Max
x-int
Describe how the graphs of f (x) and g (x) are related. Then find the period of g (x), and sketch at least one period of both functions on the same coordinate axes.
5. f (x) = sin x; g(x) = sin 4x
SOLUTION: The graph of g(x) is the graph of f (x) compressed
horizontally. The period of g(x) is . To find
corresponding points on the graph of g(x), change the x-coordinates of those key points on f (x) so that
they range from 0 to , increasing by increments of
.
Sketch the curve through the indicated points for each function. Then repeat the pattern to complete asecond period.
Functions f (x) = sin x g(x) = sin
4x
x-int (0, 0) (0, 0)
Max
x-int
Min
x-int
6. f (x) = cos x; g(x) = cos 2x
SOLUTION: The graph of g(x) is the graph of f (x) compressed
horizontally. The period of g(x) is or . To find
corresponding points on the graph of g(x), change the x-coordinates of those key points on f (x) so that
they range from 0 to , increasing by increments of
.
Sketch the curve through the indicated points for each function. Then repeat the pattern to complete asecond period.
Functions f (x) = cos x g(x) = cos 2x
Max (0, 1) (0, 1)
x-int
Min
x-int
Max
7. f (x) = cos x;
SOLUTION: The graph of g(x) is the graph of f (x) expanded
horizontally. The period of g(x) is . To
find corresponding points on the graph of g(x), change the x-coordinates of those key points on f (x)
so that they range from 0 to , increasing by
increments of or .
Sketch the curve through the indicated points for each function. Then repeat the pattern to complete asecond period.
Functions f (x) = cos x
Max (0, 1) (0, 1)
x-int
Min
x-int
Max
8. f (x) = sin x;
SOLUTION: The graph of g(x) is the graph of f (x) expanded
horizontally. The period of g(x) is . To find corresponding points on the graph of g(x), change the x-coordinates of those key points on f (x) so that they range from 0 to , increasing by increments of
or .
Sketch the curve through the indicated points for each function. Then repeat the pattern to complete asecond period.
Functions f (x) = sin x
x-int (0, 0) (0, 0)
Max
x-int
Min
x-int
9. VOICES The contralto vocal type includes the deepest female singing voice. Some contraltos can sing as low as the E below middle C (E3), which hasa frequency of 165 hertz. Write an equation for a sine function that models the initial behavior of the sound wave associated with E3 having an amplitude of 0.15.
SOLUTION: The general form of the equation will be y = a sin bt,where t is the time in seconds. Because the
amplitude is 0.15, |a|= 0.15. This means that a = ±0.15. The period is the reciprocal of the frequency or
. Use this value to find b.
Sample answer: One sine function that models the
initial behavior is y = 0.15 sin 330 t.
Write a sine function that can be used to model the initial behavior of a sound wave with the frequency and amplitude given.
10. f = 440, a = 0.3
SOLUTION: The general form of the equation is y = a sin bt, where t is the time in seconds. Because the
amplitude is 0.3, = 0.3. This means that a = ±0.3.
The period is the reciprocal of the frequency or
. Use this value to find b.
Using the positive values of a and b, one sine function that models the initial behavior is y = 0.3 sin
880 t.
11. f = 932, a = 0.25
SOLUTION: The general form of the equation is y = a sin bt, where t is the time in seconds. Because the
amplitude is 0.25, = 0.25. This means that a =
±0.25. The period is the reciprocal of the frequency
or . Use this value to find b.
Using the positive values of a and b, one sine function that models the initial behavior is y = 0.25
sin 1864 t.
12. f = 1245, a = 0.12
SOLUTION: The general form of the equation is y = a sin bt, where t is the time in seconds. Because the
amplitude is 0.12, = 0.12. This means that a =
±0.12. The period is the reciprocal of the frequency or
. Use this value to find b.
Using the positive values of a and b, one sine function that models the initial behavior is y = 0.12
sin 2490 t.
13. f = 623, a = 0.2
SOLUTION: The general form of the equation is y = a sin bt, where t is the time in seconds. Because the
amplitude is 0.2, = 0.2. This means that a = ±0.2.
The period is the reciprocal of the frequency or
. Use this value to find b.
Using the positive values of a and b, one sine function that models the initial behavior is y = 0.2 sin
1246 t.
State the amplitude, period, frequency, phase shift, and vertical shift of each function. Then graph two periods of the function.
14.
SOLUTION:
In this function, a = 3, b = 1, c = − , and d = 0.
Because d = 0, there is no vertical shift.
Graph y = 3 sin x shifted units to the right.
15.
SOLUTION:
In this function, a = 1, b = , c = , and d = 0.
Because d = 0, there is no vertical shift.
16. y = 0.25 cos x + 3
SOLUTION:
In this function, a = , b = 1, c = 0, and d = 3.
Graph y = cos x shifted 3 units up.
17. y = sin 3x – 2
SOLUTION: In this function, a = 1, b = 3, c = 0, and d = –2.
Graph y = sin 3x shifted 2 units down.
18.
SOLUTION:
In this function, a = 1, b = 1, c = , and d = –1.
.
Graph y = cos x shifted units to the right and 1
unit down.
19.
SOLUTION:
In this function, a = 1, b = 1, c = , and d = 4.
.
Graph y = sin x shifted units to the left and 4 units up.
20. VACATIONS The average number of reservations R that a vacation resort has at the beginning of each month is shown.
a. Write an equation of a sinusoidal function that models the average number of reservations using x =1 to represent January. b. According to your model, approximately how many reservations can the resort anticipate in November?
SOLUTION: a. Make a scatter plot of the data and choose a model.
Sample answer: Use a sinusoidal function of the form y = a cos (bx + c) + d to model the data. First, find the maximum M and minimum m values of the data, and use these values to find a, b, c, and d. The maximum and minimum reservations are 200 and 87, respectively. The amplitude a is half of the distance between these values.
The vertical shift d is the average of the maximum and minimum data values.
There are 3 months between the maximum and minimum, so the period is 6.
The maximum data value occurs when x = 1. Since y = cos x attains its first maximum when x = 0, we must apply a phase shift of 1 unit. Use this value to find c.
Write a function using the values for a, b, c, and d.
Use b =
b. To find the number of reservations in November, evaluate the model for x = 11.
Therefore, the resort can anticipate about 115 reservations in November.
21. TIDES The table shown below provides data for the first high and low tides of the day for a certain bay during one day in June.
a. Determine the amplitude, period, phase shift, and vertical shift of a sinusoidal function that models the height of the tide. Let x represent the number of hours that the high or low tide occurred after midnight. b. Write a sinusoidal function that models the data. c. According to your model, what was the height of
the tide at 8:45 P.M. that night?
SOLUTION: a. Sample answer: Use a sinusoidal function of the form y = a cos (bx + c) + d to model the data. First, find the amplitude a, which is half of the distance between the heights of the high and low tides.
The vertical shift d is the average of the heights of the high and low tides.
A sinusoid completes half of a period in the time thatit takes to go from its maximum to its minimum value. One period is twice this time. The first high tide occurs 6.5 hours before the first low tide, so the period is 13.
The maximum data value occurs when x ≈ 4.417. Since y = cos x attains its first maximum when x = 0,we must apply a phase shift of 4.417 units. Use this value to find c.
b. Write a function using the values for a, b, c, and
d. Use b =
c. To find the height of the water at 8:45 P.M. that
night, evaluate the model for x = 20.75.
Therefore, the tide was about 7.28 feet high at 8:45
P.M. that night.
22. METEOROLOGY The average monthly temperatures for Boston, Massachusetts are shown.
a. Determine the amplitude, period, phase shift, and vertical shift of a sinusoidal function that models the monthly temperatures using x = 1 to represent January. b. Write an equation of a sinusoidal function that models the monthly temperatures. c. According to your model, what is Boston’s average temperature in August?
SOLUTION: a. The maximum and minimum are 74° and 29°, respectively. The amplitude a is half of the distance between these values.
The vertical shift d is the average of the maximum and minimum data values.
A sinusoid completes half of a period in the time thatit takes to go from its maximum to its minimum value. So, one period is twice this time. The
maximum function value occurs in July, so xmax is 7.
The minimum function value occurs in January, so
xmin is 1. The period is 2(6) = 12.
The maximum data value occurs when x = 7. Since y = cos x attains its first maximum when x = 0, we must apply a phase shift of 7 units. Use this value to find c.
b. Using the values for a, b, c, and d from part a, a sinusoidal function that models that monthly temperatures in Boston is
c. To find the average monthly temperature for Boston in August, evaluate the model for x = 8.
Therefore, the average monthly temperature for Boston in August is about 71°F.
GRAPHING CALCULATOR Find the values of x in the interval – < x < that make each equation or inequality true. (Hint: Use the intersection function.)
23. –sin x = cos x
SOLUTION:
Graph y = −sin x and y = cos x on the same graphing
calculator screen on (−π, π). Use the intersect feature under the CALC menu to determine where the two graphs intersect.
The graphs intersect at about −0.7854 or − and
about 2.356 or . Therefore, on –π < x < π, –sin x
= cos x when x = − and .
24. sin x − cos x = 1
SOLUTION:
Graph y = sin x − cos x and y = 1 on the same
graphing calculator screen on (− , ). Use the intersect feature under the CALC menu to determine where the two graphs intersect.
The graphs intersect at about 1.57 or . Therefore,
on – < x < , sin x − cos x = 1 when x = .
25. sin x + cos x = 0
SOLUTION:
Graph y = sin x + cos x on (−π, π). Use the zero feature under the CALC menu to determine the zeros of the function.
There are zeros at about −0.785 or − or and about
2.356 or . Therefore, on – < x < , sin x + cos
x = 0 when
26. cos x ≤ sin x
SOLUTION:
Graph y = cos x and y = sin x on (−π, π). Use the intersect feature under the CALC menu to determine on what interval(s) cos x ≤ sin x.
The graphs intersect at about –2.356 or – and
about 0.785 or . From the graph, it appears that
cos x ≤ sin x on – < x < – and < x < .
27. sin x cos x > 1
SOLUTION:
Graph y = sin x cos x and y = 1 on (− , ). Use the intersect feature under the CALC menu to determine on what interval(s) sin x cos x > 1.
The graphs do not intersect. Therefore, y = sin x cos
x is not greater than y = 1 for any values of x on –< x < .
28. sin x cos x ≤ 0
SOLUTION:
Graph y = sin x cos x on (−π, π). Use the zero feature under the CALC menu to determine on what interval(s) sin x cos x ≤ 0.
The zeros of y = sin x cos x are about –1.57 or ,
0, and about 1.57 or . From the graph, it appears
that sin x cos x ≤ 0 on < x < 0 and < x < .
29. CAROUSELS A wooden horse on a carousel moves up and down as the carousel spins. When the ride ends, the horse usually stops in a vertical position different from where it started. The position y of the horse after t seconds can be modeled by y =1.5 sin (2t + c), where the phase shift c must be continuously adjusted to compensate for the differentstarting positions. If during one ride the horse
reached a maximum height after seconds, find
the equation that models the horse’s position.
SOLUTION: First, find the period of y = 1.5 sin (2t + c).
Since the period is π, the function will reach a
maximum height at radians. The phase shift is the
difference between the horizontal position of the
function at and radians, which is radians.
Substitute and b into the phase shift formula to
find c.
Therefore, the equation is
30. AMUSEMENT PARKS The position y in feet of a passenger cart relative to the center of a Ferris wheel over t seconds is shown below.
a. Find the time t that it takes for the cart to return toy = 0 during its initial spin. b. Find the period of the Ferris wheel. c. Sketch the graph representing the position of the passenger cart over one period. d. Write a sinusoidal function that models the position of the passenger cart as a function of time t.
SOLUTION: a. From the diagram, the height of the cart is 0 ft when t = 0, and reaches a maximum height of 19 feet when t = 3.75 seconds. So, the cart will return to y = 0 after 2(3.75) or 7.5 seconds. b. The cart completes half of a cycle from t = 0 to t = 7.5. So, the period is 2(7.5) or 15 seconds. c.
d. The amplitude a is half of the maximum and
minimum values. So, a =
The vertical shift d is the average of the maximum
and minimum data values. So,
Because the period of a sinusoidal function is
you can write Therefore,
There is no phase shift because the height of the cartwhen t = 0 is 0 feet, and the sine function has a y-intercept of 0. Therefore, one equation that could be used to model
the position of the passenger cart is y = 19 sin t.
Write an equation that corresponds to each graph.
31.
SOLUTION: Sample answer: There is an x-intercept at 0, so one equation that corresponds to this graph is y = a sin (bx + c) + d. Half of the distance from the maximum to the minimum value of the function is 3. So, the amplitudeis 3. It appears that the function completes one period on
[0, π]. Find b.
The midline appears to be at y = 0, so there does not appear to be any vertical shift. Therefore, one equation that corresponds to this graph is y = 3 sin (2x).
32.
SOLUTION:
Sample answer: Because there is a y-intercept at ,
one equation that corresponds to this graph is y = a cos (bx + c) + d. Half of the distance from the maximum to the
minimum value of the function is . So, the
amplitude is .
It appears that the function completes one period on [0, 6π]. Find b.
The midline appears to be at y = 0, so there does not appear to be any vertical shift. Therefore, one
equation that corresponds to this graph is y = cos
.
33.
SOLUTION: Sample answer: Because there is a y-intercept at 3, one equation that corresponds to this graph is y = a cos (bx + c) + d. Half of the distance from the maximum to the
minimum value of the function is 4 ÷ 2 or 2. So, the amplitude is 2. It appears that the function completes one period on
Find b.
The midline appears to be at y = 1, so there is a vertical shift 1 unit up. Therefore, one equation that corresponds to this graph is y = 2 cos 4x + 1.
34.
SOLUTION: Sample answer: There is an x-intercept at 0, so one equation that corresponds to this graph is y = a sin (bx + c) + d. Half of the distance from the maximum to the
minimum value of the function is 8 ÷ 2 or 4. So, the amplitude is 4. It appears that the function completes one period on [0, 4π]. Find b.
The midline appears to be at y = −2, so there is a vertical shift of 2 units down. Therefore, one equation that corresponds to this graph is y = 4 sin
− 2.
Write a sinusoidal function with the given period and amplitude that passes through the given point.
35. period: ; amplitude: 5; point:
SOLUTION: Use the period to find b.
Sample answer: One sinusoidal function in which a =5 and b = 2 is y = 5 cos 2x. Evaluate the function for
The function passes through . Therefore, a
sinusoidal function with period π and amplitude 5 that
passes through the point is y = 5 cos 2x.
36. period: 4 ; amplitude: 2; point: ( , 2)
SOLUTION: Use the period to find b.
Sample answer: One sinusoidal function in which a =
2 and b = is y = 2 sin . Evaluate the function
for x = π.
The function passes through ( , 2). Therefore, a
sinusoidal function with period 4π and amplitude 2
that passes through the point ( , 2) is y = 2 sin .
37. period: ; amplitude: ; point:
SOLUTION: Use the period to find b.
Sample answer: One sinusoidal function in which a =1.5 and b = 4 is y = 1.5 cos 4x. Evaluate the function
for
The function passes through . Therefore, a
sinusoidal function with period and amplitude 1.5
that passes through the point is y = 1.5 cos
4x.
38. period: 3π; amplitude: ; point:
SOLUTION: Use the period to find b.
Sample answer: One sinusoidal function in which a =
0.5 and b = is y = sin x. Evaluate the
function for
The function passes through . Therefore, a
sinusoidal function with period 3π and amplitude 0.5
that passes through the point is y = sin
x.
39. MULTIPLE REPRESENTATIONS In this problem, you will investigate the change in the graph of a sinusoidal function of the form y = sin x or y = cos x when multiplied by a polynomial function. a. GRAPHICAL Use a graphing calculator to sketch the graphs of y = 2x, y = –2x, and y = 2x cos x on the same coordinate plane, on the interval [–20, 20]. b. VERBAL Describe the behavior of the graph of y = 2x cos x in relation to the graphs of y = 2x and y = –2x. c. GRAPHICAL Use a graphing calculator to
sketch the graphs of y = x2, y = –x
2, and y = x
2 sin x
on the same coordinate plane, on the interval [–20, 20]. d. VERBAL Describe the behavior of the graph of
y = x2 sin x in relation to the graphs of y = x
2 and y
= –x2.
e. ANALYTICAL Make a conjecture as to the behavior of the graph of a sinusoidal function of the form y = sin x or y = cos x when multiplied by polynomial function of the form y = f (x).
SOLUTION: a.
b. The graph of y = 2x cos x oscillates between the graphs of y = 2x and y = –2x. c.
d. The graph of y = x2 sin x oscillates between the
graphs of y = x2 and y = –x
2.
e . The graph of y = f (x) sin x or y = f (x) cos x will oscillate between the graphs of y = f (x) and y = –f(x).
40. CHALLENGE Without graphing, find the exact coordinates of the first maximum point to the right of
the y-axis for
SOLUTION:
First, find the phase shift for
Next, find the period of the function.
The first maximum for one period can be found by
finding So, incorporating the phase shift, the
first maximum to the right of the y-axis is
. Because the amplitude is |4| = 4,
the maximum point is
REASONING Determine whether each statement is true or false . Explain your reasoning.
41. Every sine function of the form y = a sin (bx + c) + d can be written as a cosine function of the form y =a cos (bx + c) + d.
SOLUTION: It is true that every sine function of the form y = a sin (bx + c) + d can be written as a cosine function of the form y = a cos (bx + c) + d. The graph of cosine is a horizontal translation of the sine graph. Therefore, a cosine function can be written from any sine function using the same amplitude and period by applying the necessary phase shift.
For example, consider and
. Phase shift by
to obtain .
42. The period of f (x) = cos 8x is equal to four times the period of g(x) = cos 2x.
SOLUTION: Find the period of f (x) = cos 8x.
Find the period of g(x) = cos 2x.
Four times the period of g(x) = cos 2x is 4 ⋅ or
4 . So, the period of f (x) is the period of g(x).
Therefore, the statement is false.
43. CHALLENGE How many zeros does y = cos
1500x have on the interval 0 ≤ x ≤ 2 ?
SOLUTION: Find the period of y = cos 1500x.
Graph y = cos 1500x on .
The graph of y = cos 1500x has two x-intercepts for one cycle, so the function has 2 zeros per cycle. Find
the number of cycles for y = cos 1500x on [0, 2 ].
So, the graph of y = cos 1500x will complete 1500
cycles on [0, 2 ]. Because there are two zeros per cycle, y = cos 1500x will have 1500(2) or 3000 zeros
on [0, 2 ].
44. PROOF Prove the phase shift formula.
SOLUTION:
Consider y = a sin (bx + c), where a , b, and c ≠ 0. To find a zero of the function, find the value of x for which a sin (bx + c) = 0. Since sin 0 = 0, solving bx + c = 0 will yield a zero of the function.
Therefore, y = 0 when . The value of is
the phase shift. When c > 0: The graph of y = a sin (bx + c) is the
graph of y = a sin x, shifted units to the left.
When c < 0: The graph of y = a sin (bx + c) is the
graph of y = a sin x, shifted units to the right.
Consider the graph of y = cos x below in blue. In this equation a = 1, b = 1 and c = 0. One zero of y = cos x is . The green graph is shifted to the
left. Thus c is – . Then the shifted equation will be
.
45. Writing in Math The Power Tower ride in Sandusky, Ohio, is shown below. Along the side of each tower is a string of lights that send a continuouspulse of light up and down each tower at a constant rate. Explain why the distance d of this light from theground over time t cannot be represented by a sinusoidal function.
SOLUTION: Sample answer: Although the pulse of light can be represented as a function with a period, it is not a sinusoidal function because the distance the pulse of light is from the ground changes at a constant rate. As a result, the graph of this function would resemble the graph below.
The given point lies on the terminal side of an angle θ in standard position. Find the values of
the six trigonometric functions of θ. 46. (−4, 4)
SOLUTION: Use the values of x and y to find r.
Use x = –4, y = 4, and r = to write the six trigonometric ratios.
47. (8, −2)
SOLUTION: Use the values of x and y to find r.
Use x = 8, y = –2, and r = to write the six trigonometric ratios.
48. (−5, −9)
SOLUTION: Use the values of x and y to find r.
Use x = –5, y = – 9, and r = to write the six trigonometric ratios.
49. (4, 5)
SOLUTION: Use the values of x and y to find r.
Use x = 4, y = 5, and r = to write the six trigonometric ratios.
Write each degree measure in radians as a multiple of π and each radian measure in degrees.
50. 25°
SOLUTION: To convert a degree measure to radians, multiply by
51. −420°
SOLUTION: To convert a degree measure to radians, multiply by
52.
SOLUTION: To convert a radian measure to degrees, multiply by
53.
SOLUTION: To convert a radian measure to degrees, multiply by
54. SCIENCE Radiocarbon dating is a method of estimating the age of an organic material by calculating the amount of carbon-14 present in the material. The age of a material can be calculated
using A = t , where A is the age of the
object in years, t is the half-life of carbon-14 or 5700 years, and R is the ratio of the amount of carbon-14 in the sample to the amount of carbon-14 in living tissue. a. A sample of organic material contains 0.000076 gram of carbon-14. A living sample of the same
eSolutions Manual - Powered by Cognero Page 2
4-4 Graphing Sine and Cosine Functions
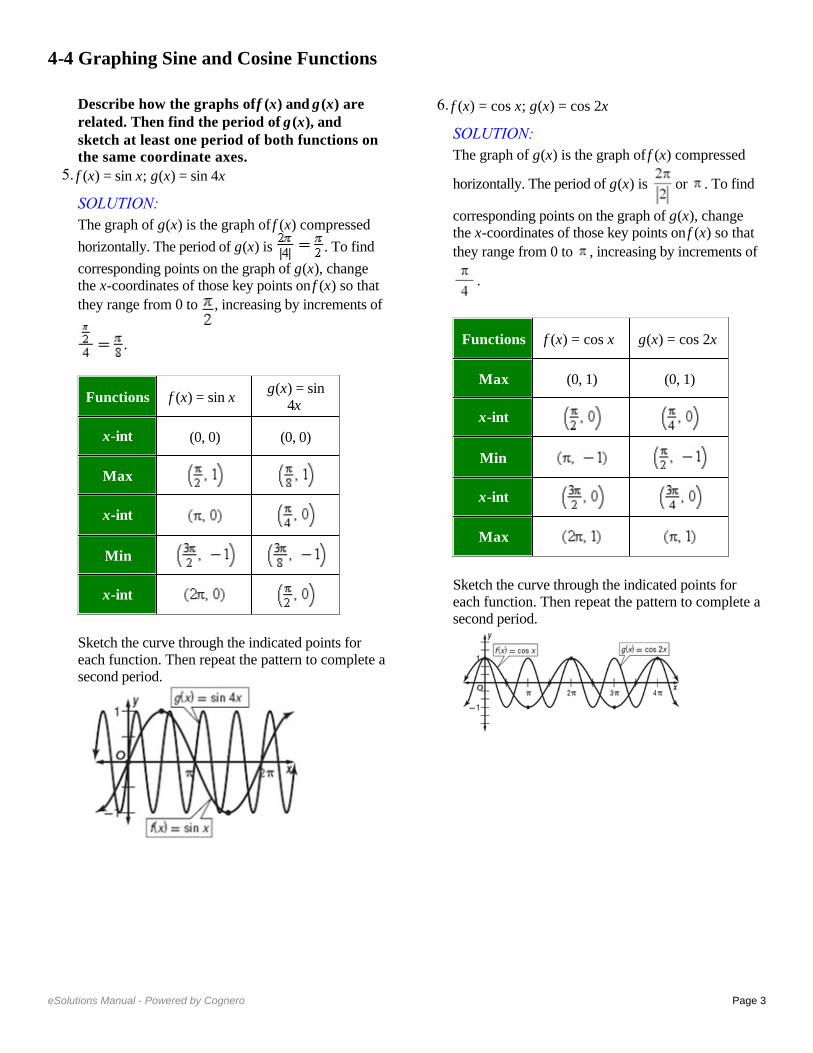
Describe how the graphs of f (x) and g (x) are related. Then find the amplitude of g (x), and sketch two periods of both functions on the same coordinate axes.
1. f (x) = sin x; g(x) = sin x
SOLUTION: The graph of g(x) is the graph of f (x) compressed
vertically. The amplitude of g(x) is or .
Create a table listing the coordinates of the x-intercepts and extrema for f (x) = sin x for one
period, 2 , on the interval [0, 2 ]. Then use the amplitude of g(x) to find corresponding points on its graph.
Sketch the curve through the indicated points for each function. Then repeat the pattern to complete asecond period.
Functions f (x) = sin x g(x) = sin x
x-int (0, 0) (0, 0)
Max
x-int
Min
x-int
2.
SOLUTION: The graph of g(x) is the graph of f (x) compressed
vertically. The amplitude of g(x) is or .
Create a table listing the coordinates of the x-intercepts and extrema for f (x) = cos x for one
period, 2 , on the interval [0, 2 ]. Then use the amplitude of g(x) to find corresponding points on its graph.
Sketch the curve through the indicated points for each function. Then repeat the pattern to complete asecond period.
Function f (x) = cos x
Max (0, 1)
x-int Min
x-in
Min
x-int
Function f (x) = cos x
Max x-int
Min
x-in
Min
x-int
3. f (x) = cos x; g(x) = 6 cos x
SOLUTION: The graph of g(x) is the graph of f (x) expanded
vertically. The amplitude of g(x) is or 6.
Create a table listing the coordinates of the x-intercepts and extrema for f (x) = cos x for one
period, 2 , on the interval [0, 2 ]. Then use the amplitude of g(x) to find corresponding points on its graph.
Sketch the curve through the indicated points for each function. Then repeat the pattern to complete asecond period.
Functions f (x) = cos x g(x) = 6 cos x
Max (0, 1) (0, 6)
x-int
Min
x-int
Max
4. f (x) = sin x; g(x) = −8 sin x
SOLUTION: The graph of g(x) is the graph of f (x) expanded
vertically. The amplitude of g(x) is or 8.
Create a table listing the coordinates of the x-intercepts and extrema for f (x) = sin x for one
period, 2 , on the interval [0, 2 ]. Then use the amplitude of g(x) to find corresponding points on its graph.
Sketch the curve through the indicated points for each function. Then repeat the pattern to complete asecond period.
Function f (x) = sin x
x-int (0, 0)
Max
x-int
Min
x-int
Function g(x) = −8
sin x
x-int (0, 0)
Min
x-int
Max
x-int
Describe how the graphs of f (x) and g (x) are related. Then find the period of g (x), and sketch at least one period of both functions on the same coordinate axes.
5. f (x) = sin x; g(x) = sin 4x
SOLUTION: The graph of g(x) is the graph of f (x) compressed
horizontally. The period of g(x) is . To find
corresponding points on the graph of g(x), change the x-coordinates of those key points on f (x) so that
they range from 0 to , increasing by increments of
.
Sketch the curve through the indicated points for each function. Then repeat the pattern to complete asecond period.
Functions f (x) = sin x g(x) = sin
4x
x-int (0, 0) (0, 0)
Max
x-int
Min
x-int
6. f (x) = cos x; g(x) = cos 2x
SOLUTION: The graph of g(x) is the graph of f (x) compressed
horizontally. The period of g(x) is or . To find
corresponding points on the graph of g(x), change the x-coordinates of those key points on f (x) so that
they range from 0 to , increasing by increments of
.
Sketch the curve through the indicated points for each function. Then repeat the pattern to complete asecond period.
Functions f (x) = cos x g(x) = cos 2x
Max (0, 1) (0, 1)
x-int
Min
x-int
Max
7. f (x) = cos x;
SOLUTION: The graph of g(x) is the graph of f (x) expanded
horizontally. The period of g(x) is . To
find corresponding points on the graph of g(x), change the x-coordinates of those key points on f (x)
so that they range from 0 to , increasing by
increments of or .
Sketch the curve through the indicated points for each function. Then repeat the pattern to complete asecond period.
Functions f (x) = cos x
Max (0, 1) (0, 1)
x-int
Min
x-int
Max
8. f (x) = sin x;
SOLUTION: The graph of g(x) is the graph of f (x) expanded
horizontally. The period of g(x) is . To find corresponding points on the graph of g(x), change the x-coordinates of those key points on f (x) so that they range from 0 to , increasing by increments of
or .
Sketch the curve through the indicated points for each function. Then repeat the pattern to complete asecond period.
Functions f (x) = sin x
x-int (0, 0) (0, 0)
Max
x-int
Min
x-int
9. VOICES The contralto vocal type includes the deepest female singing voice. Some contraltos can sing as low as the E below middle C (E3), which hasa frequency of 165 hertz. Write an equation for a sine function that models the initial behavior of the sound wave associated with E3 having an amplitude of 0.15.
SOLUTION: The general form of the equation will be y = a sin bt,where t is the time in seconds. Because the
amplitude is 0.15, |a|= 0.15. This means that a = ±0.15. The period is the reciprocal of the frequency or
. Use this value to find b.
Sample answer: One sine function that models the
initial behavior is y = 0.15 sin 330 t.
Write a sine function that can be used to model the initial behavior of a sound wave with the frequency and amplitude given.
10. f = 440, a = 0.3
SOLUTION: The general form of the equation is y = a sin bt, where t is the time in seconds. Because the
amplitude is 0.3, = 0.3. This means that a = ±0.3.
The period is the reciprocal of the frequency or
. Use this value to find b.
Using the positive values of a and b, one sine function that models the initial behavior is y = 0.3 sin
880 t.
11. f = 932, a = 0.25
SOLUTION: The general form of the equation is y = a sin bt, where t is the time in seconds. Because the
amplitude is 0.25, = 0.25. This means that a =
±0.25. The period is the reciprocal of the frequency
or . Use this value to find b.
Using the positive values of a and b, one sine function that models the initial behavior is y = 0.25
sin 1864 t.
12. f = 1245, a = 0.12
SOLUTION: The general form of the equation is y = a sin bt, where t is the time in seconds. Because the
amplitude is 0.12, = 0.12. This means that a =
±0.12. The period is the reciprocal of the frequency or
. Use this value to find b.
Using the positive values of a and b, one sine function that models the initial behavior is y = 0.12
sin 2490 t.
13. f = 623, a = 0.2
SOLUTION: The general form of the equation is y = a sin bt, where t is the time in seconds. Because the
amplitude is 0.2, = 0.2. This means that a = ±0.2.
The period is the reciprocal of the frequency or
. Use this value to find b.
Using the positive values of a and b, one sine function that models the initial behavior is y = 0.2 sin
1246 t.
State the amplitude, period, frequency, phase shift, and vertical shift of each function. Then graph two periods of the function.
14.
SOLUTION:
In this function, a = 3, b = 1, c = − , and d = 0.
Because d = 0, there is no vertical shift.
Graph y = 3 sin x shifted units to the right.
15.
SOLUTION:
In this function, a = 1, b = , c = , and d = 0.
Because d = 0, there is no vertical shift.
16. y = 0.25 cos x + 3
SOLUTION:
In this function, a = , b = 1, c = 0, and d = 3.
Graph y = cos x shifted 3 units up.
17. y = sin 3x – 2
SOLUTION: In this function, a = 1, b = 3, c = 0, and d = –2.
Graph y = sin 3x shifted 2 units down.
18.
SOLUTION:
In this function, a = 1, b = 1, c = , and d = –1.
.
Graph y = cos x shifted units to the right and 1
unit down.
19.
SOLUTION:
In this function, a = 1, b = 1, c = , and d = 4.
.
Graph y = sin x shifted units to the left and 4 units up.
20. VACATIONS The average number of reservations R that a vacation resort has at the beginning of each month is shown.
a. Write an equation of a sinusoidal function that models the average number of reservations using x =1 to represent January. b. According to your model, approximately how many reservations can the resort anticipate in November?
SOLUTION: a. Make a scatter plot of the data and choose a model.
Sample answer: Use a sinusoidal function of the form y = a cos (bx + c) + d to model the data. First, find the maximum M and minimum m values of the data, and use these values to find a, b, c, and d. The maximum and minimum reservations are 200 and 87, respectively. The amplitude a is half of the distance between these values.
The vertical shift d is the average of the maximum and minimum data values.
There are 3 months between the maximum and minimum, so the period is 6.
The maximum data value occurs when x = 1. Since y = cos x attains its first maximum when x = 0, we must apply a phase shift of 1 unit. Use this value to find c.
Write a function using the values for a, b, c, and d.
Use b =
b. To find the number of reservations in November, evaluate the model for x = 11.
Therefore, the resort can anticipate about 115 reservations in November.
21. TIDES The table shown below provides data for the first high and low tides of the day for a certain bay during one day in June.
a. Determine the amplitude, period, phase shift, and vertical shift of a sinusoidal function that models the height of the tide. Let x represent the number of hours that the high or low tide occurred after midnight. b. Write a sinusoidal function that models the data. c. According to your model, what was the height of
the tide at 8:45 P.M. that night?
SOLUTION: a. Sample answer: Use a sinusoidal function of the form y = a cos (bx + c) + d to model the data. First, find the amplitude a, which is half of the distance between the heights of the high and low tides.
The vertical shift d is the average of the heights of the high and low tides.
A sinusoid completes half of a period in the time thatit takes to go from its maximum to its minimum value. One period is twice this time. The first high tide occurs 6.5 hours before the first low tide, so the period is 13.
The maximum data value occurs when x ≈ 4.417. Since y = cos x attains its first maximum when x = 0,we must apply a phase shift of 4.417 units. Use this value to find c.
b. Write a function using the values for a, b, c, and
d. Use b =
c. To find the height of the water at 8:45 P.M. that
night, evaluate the model for x = 20.75.
Therefore, the tide was about 7.28 feet high at 8:45
P.M. that night.
22. METEOROLOGY The average monthly temperatures for Boston, Massachusetts are shown.
a. Determine the amplitude, period, phase shift, and vertical shift of a sinusoidal function that models the monthly temperatures using x = 1 to represent January. b. Write an equation of a sinusoidal function that models the monthly temperatures. c. According to your model, what is Boston’s average temperature in August?
SOLUTION: a. The maximum and minimum are 74° and 29°, respectively. The amplitude a is half of the distance between these values.
The vertical shift d is the average of the maximum and minimum data values.
A sinusoid completes half of a period in the time thatit takes to go from its maximum to its minimum value. So, one period is twice this time. The
maximum function value occurs in July, so xmax is 7.
The minimum function value occurs in January, so
xmin is 1. The period is 2(6) = 12.
The maximum data value occurs when x = 7. Since y = cos x attains its first maximum when x = 0, we must apply a phase shift of 7 units. Use this value to find c.
b. Using the values for a, b, c, and d from part a, a sinusoidal function that models that monthly temperatures in Boston is
c. To find the average monthly temperature for Boston in August, evaluate the model for x = 8.
Therefore, the average monthly temperature for Boston in August is about 71°F.
GRAPHING CALCULATOR Find the values of x in the interval – < x < that make each equation or inequality true. (Hint: Use the intersection function.)
23. –sin x = cos x
SOLUTION:
Graph y = −sin x and y = cos x on the same graphing
calculator screen on (−π, π). Use the intersect feature under the CALC menu to determine where the two graphs intersect.
The graphs intersect at about −0.7854 or − and
about 2.356 or . Therefore, on –π < x < π, –sin x
= cos x when x = − and .
24. sin x − cos x = 1
SOLUTION:
Graph y = sin x − cos x and y = 1 on the same
graphing calculator screen on (− , ). Use the intersect feature under the CALC menu to determine where the two graphs intersect.
The graphs intersect at about 1.57 or . Therefore,
on – < x < , sin x − cos x = 1 when x = .
25. sin x + cos x = 0
SOLUTION:
Graph y = sin x + cos x on (−π, π). Use the zero feature under the CALC menu to determine the zeros of the function.
There are zeros at about −0.785 or − or and about
2.356 or . Therefore, on – < x < , sin x + cos
x = 0 when
26. cos x ≤ sin x
SOLUTION:
Graph y = cos x and y = sin x on (−π, π). Use the intersect feature under the CALC menu to determine on what interval(s) cos x ≤ sin x.
The graphs intersect at about –2.356 or – and
about 0.785 or . From the graph, it appears that
cos x ≤ sin x on – < x < – and < x < .
27. sin x cos x > 1
SOLUTION:
Graph y = sin x cos x and y = 1 on (− , ). Use the intersect feature under the CALC menu to determine on what interval(s) sin x cos x > 1.
The graphs do not intersect. Therefore, y = sin x cos
x is not greater than y = 1 for any values of x on –< x < .
28. sin x cos x ≤ 0
SOLUTION:
Graph y = sin x cos x on (−π, π). Use the zero feature under the CALC menu to determine on what interval(s) sin x cos x ≤ 0.
The zeros of y = sin x cos x are about –1.57 or ,
0, and about 1.57 or . From the graph, it appears
that sin x cos x ≤ 0 on < x < 0 and < x < .
29. CAROUSELS A wooden horse on a carousel moves up and down as the carousel spins. When the ride ends, the horse usually stops in a vertical position different from where it started. The position y of the horse after t seconds can be modeled by y =1.5 sin (2t + c), where the phase shift c must be continuously adjusted to compensate for the differentstarting positions. If during one ride the horse
reached a maximum height after seconds, find
the equation that models the horse’s position.
SOLUTION: First, find the period of y = 1.5 sin (2t + c).
Since the period is π, the function will reach a
maximum height at radians. The phase shift is the
difference between the horizontal position of the
function at and radians, which is radians.
Substitute and b into the phase shift formula to
find c.
Therefore, the equation is
30. AMUSEMENT PARKS The position y in feet of a passenger cart relative to the center of a Ferris wheel over t seconds is shown below.
a. Find the time t that it takes for the cart to return toy = 0 during its initial spin. b. Find the period of the Ferris wheel. c. Sketch the graph representing the position of the passenger cart over one period. d. Write a sinusoidal function that models the position of the passenger cart as a function of time t.
SOLUTION: a. From the diagram, the height of the cart is 0 ft when t = 0, and reaches a maximum height of 19 feet when t = 3.75 seconds. So, the cart will return to y = 0 after 2(3.75) or 7.5 seconds. b. The cart completes half of a cycle from t = 0 to t = 7.5. So, the period is 2(7.5) or 15 seconds. c.
d. The amplitude a is half of the maximum and
minimum values. So, a =
The vertical shift d is the average of the maximum
and minimum data values. So,
Because the period of a sinusoidal function is
you can write Therefore,
There is no phase shift because the height of the cartwhen t = 0 is 0 feet, and the sine function has a y-intercept of 0. Therefore, one equation that could be used to model
the position of the passenger cart is y = 19 sin t.
Write an equation that corresponds to each graph.
31.
SOLUTION: Sample answer: There is an x-intercept at 0, so one equation that corresponds to this graph is y = a sin (bx + c) + d. Half of the distance from the maximum to the minimum value of the function is 3. So, the amplitudeis 3. It appears that the function completes one period on
[0, π]. Find b.
The midline appears to be at y = 0, so there does not appear to be any vertical shift. Therefore, one equation that corresponds to this graph is y = 3 sin (2x).
32.
SOLUTION:
Sample answer: Because there is a y-intercept at ,
one equation that corresponds to this graph is y = a cos (bx + c) + d. Half of the distance from the maximum to the
minimum value of the function is . So, the
amplitude is .
It appears that the function completes one period on [0, 6π]. Find b.
The midline appears to be at y = 0, so there does not appear to be any vertical shift. Therefore, one
equation that corresponds to this graph is y = cos
.
33.
SOLUTION: Sample answer: Because there is a y-intercept at 3, one equation that corresponds to this graph is y = a cos (bx + c) + d. Half of the distance from the maximum to the
minimum value of the function is 4 ÷ 2 or 2. So, the amplitude is 2. It appears that the function completes one period on
Find b.
The midline appears to be at y = 1, so there is a vertical shift 1 unit up. Therefore, one equation that corresponds to this graph is y = 2 cos 4x + 1.
34.
SOLUTION: Sample answer: There is an x-intercept at 0, so one equation that corresponds to this graph is y = a sin (bx + c) + d. Half of the distance from the maximum to the
minimum value of the function is 8 ÷ 2 or 4. So, the amplitude is 4. It appears that the function completes one period on [0, 4π]. Find b.
The midline appears to be at y = −2, so there is a vertical shift of 2 units down. Therefore, one equation that corresponds to this graph is y = 4 sin
− 2.
Write a sinusoidal function with the given period and amplitude that passes through the given point.
35. period: ; amplitude: 5; point:
SOLUTION: Use the period to find b.
Sample answer: One sinusoidal function in which a =5 and b = 2 is y = 5 cos 2x. Evaluate the function for
The function passes through . Therefore, a
sinusoidal function with period π and amplitude 5 that
passes through the point is y = 5 cos 2x.
36. period: 4 ; amplitude: 2; point: ( , 2)
SOLUTION: Use the period to find b.
Sample answer: One sinusoidal function in which a =
2 and b = is y = 2 sin . Evaluate the function
for x = π.
The function passes through ( , 2). Therefore, a
sinusoidal function with period 4π and amplitude 2
that passes through the point ( , 2) is y = 2 sin .
37. period: ; amplitude: ; point:
SOLUTION: Use the period to find b.
Sample answer: One sinusoidal function in which a =1.5 and b = 4 is y = 1.5 cos 4x. Evaluate the function
for
The function passes through . Therefore, a
sinusoidal function with period and amplitude 1.5
that passes through the point is y = 1.5 cos
4x.
38. period: 3π; amplitude: ; point:
SOLUTION: Use the period to find b.
Sample answer: One sinusoidal function in which a =
0.5 and b = is y = sin x. Evaluate the
function for
The function passes through . Therefore, a
sinusoidal function with period 3π and amplitude 0.5
that passes through the point is y = sin
x.
39. MULTIPLE REPRESENTATIONS In this problem, you will investigate the change in the graph of a sinusoidal function of the form y = sin x or y = cos x when multiplied by a polynomial function. a. GRAPHICAL Use a graphing calculator to sketch the graphs of y = 2x, y = –2x, and y = 2x cos x on the same coordinate plane, on the interval [–20, 20]. b. VERBAL Describe the behavior of the graph of y = 2x cos x in relation to the graphs of y = 2x and y = –2x. c. GRAPHICAL Use a graphing calculator to
sketch the graphs of y = x2, y = –x
2, and y = x
2 sin x
on the same coordinate plane, on the interval [–20, 20]. d. VERBAL Describe the behavior of the graph of
y = x2 sin x in relation to the graphs of y = x
2 and y
= –x2.
e. ANALYTICAL Make a conjecture as to the behavior of the graph of a sinusoidal function of the form y = sin x or y = cos x when multiplied by polynomial function of the form y = f (x).
SOLUTION: a.
b. The graph of y = 2x cos x oscillates between the graphs of y = 2x and y = –2x. c.
d. The graph of y = x2 sin x oscillates between the
graphs of y = x2 and y = –x
2.
e . The graph of y = f (x) sin x or y = f (x) cos x will oscillate between the graphs of y = f (x) and y = –f(x).
40. CHALLENGE Without graphing, find the exact coordinates of the first maximum point to the right of
the y-axis for
SOLUTION:
First, find the phase shift for
Next, find the period of the function.
The first maximum for one period can be found by
finding So, incorporating the phase shift, the
first maximum to the right of the y-axis is
. Because the amplitude is |4| = 4,
the maximum point is
REASONING Determine whether each statement is true or false . Explain your reasoning.
41. Every sine function of the form y = a sin (bx + c) + d can be written as a cosine function of the form y =a cos (bx + c) + d.
SOLUTION: It is true that every sine function of the form y = a sin (bx + c) + d can be written as a cosine function of the form y = a cos (bx + c) + d. The graph of cosine is a horizontal translation of the sine graph. Therefore, a cosine function can be written from any sine function using the same amplitude and period by applying the necessary phase shift.
For example, consider and
. Phase shift by
to obtain .
42. The period of f (x) = cos 8x is equal to four times the period of g(x) = cos 2x.
SOLUTION: Find the period of f (x) = cos 8x.
Find the period of g(x) = cos 2x.
Four times the period of g(x) = cos 2x is 4 ⋅ or
4 . So, the period of f (x) is the period of g(x).
Therefore, the statement is false.
43. CHALLENGE How many zeros does y = cos
1500x have on the interval 0 ≤ x ≤ 2 ?
SOLUTION: Find the period of y = cos 1500x.
Graph y = cos 1500x on .
The graph of y = cos 1500x has two x-intercepts for one cycle, so the function has 2 zeros per cycle. Find
the number of cycles for y = cos 1500x on [0, 2 ].
So, the graph of y = cos 1500x will complete 1500
cycles on [0, 2 ]. Because there are two zeros per cycle, y = cos 1500x will have 1500(2) or 3000 zeros
on [0, 2 ].
44. PROOF Prove the phase shift formula.
SOLUTION:
Consider y = a sin (bx + c), where a , b, and c ≠ 0. To find a zero of the function, find the value of x for which a sin (bx + c) = 0. Since sin 0 = 0, solving bx + c = 0 will yield a zero of the function.
Therefore, y = 0 when . The value of is
the phase shift. When c > 0: The graph of y = a sin (bx + c) is the
graph of y = a sin x, shifted units to the left.
When c < 0: The graph of y = a sin (bx + c) is the
graph of y = a sin x, shifted units to the right.
Consider the graph of y = cos x below in blue. In this equation a = 1, b = 1 and c = 0. One zero of y = cos x is . The green graph is shifted to the
left. Thus c is – . Then the shifted equation will be
.
45. Writing in Math The Power Tower ride in Sandusky, Ohio, is shown below. Along the side of each tower is a string of lights that send a continuouspulse of light up and down each tower at a constant rate. Explain why the distance d of this light from theground over time t cannot be represented by a sinusoidal function.
SOLUTION: Sample answer: Although the pulse of light can be represented as a function with a period, it is not a sinusoidal function because the distance the pulse of light is from the ground changes at a constant rate. As a result, the graph of this function would resemble the graph below.
The given point lies on the terminal side of an angle θ in standard position. Find the values of
the six trigonometric functions of θ. 46. (−4, 4)
SOLUTION: Use the values of x and y to find r.
Use x = –4, y = 4, and r = to write the six trigonometric ratios.
47. (8, −2)
SOLUTION: Use the values of x and y to find r.
Use x = 8, y = –2, and r = to write the six trigonometric ratios.
48. (−5, −9)
SOLUTION: Use the values of x and y to find r.
Use x = –5, y = – 9, and r = to write the six trigonometric ratios.
49. (4, 5)
SOLUTION: Use the values of x and y to find r.
Use x = 4, y = 5, and r = to write the six trigonometric ratios.
Write each degree measure in radians as a multiple of π and each radian measure in degrees.
50. 25°
SOLUTION: To convert a degree measure to radians, multiply by
51. −420°
SOLUTION: To convert a degree measure to radians, multiply by
52.
SOLUTION: To convert a radian measure to degrees, multiply by
53.
SOLUTION: To convert a radian measure to degrees, multiply by
54. SCIENCE Radiocarbon dating is a method of estimating the age of an organic material by calculating the amount of carbon-14 present in the material. The age of a material can be calculated
using A = t , where A is the age of the
object in years, t is the half-life of carbon-14 or 5700 years, and R is the ratio of the amount of carbon-14 in the sample to the amount of carbon-14 in living tissue. a. A sample of organic material contains 0.000076 gram of carbon-14. A living sample of the same
eSolutions Manual - Powered by Cognero Page 3
4-4 Graphing Sine and Cosine Functions
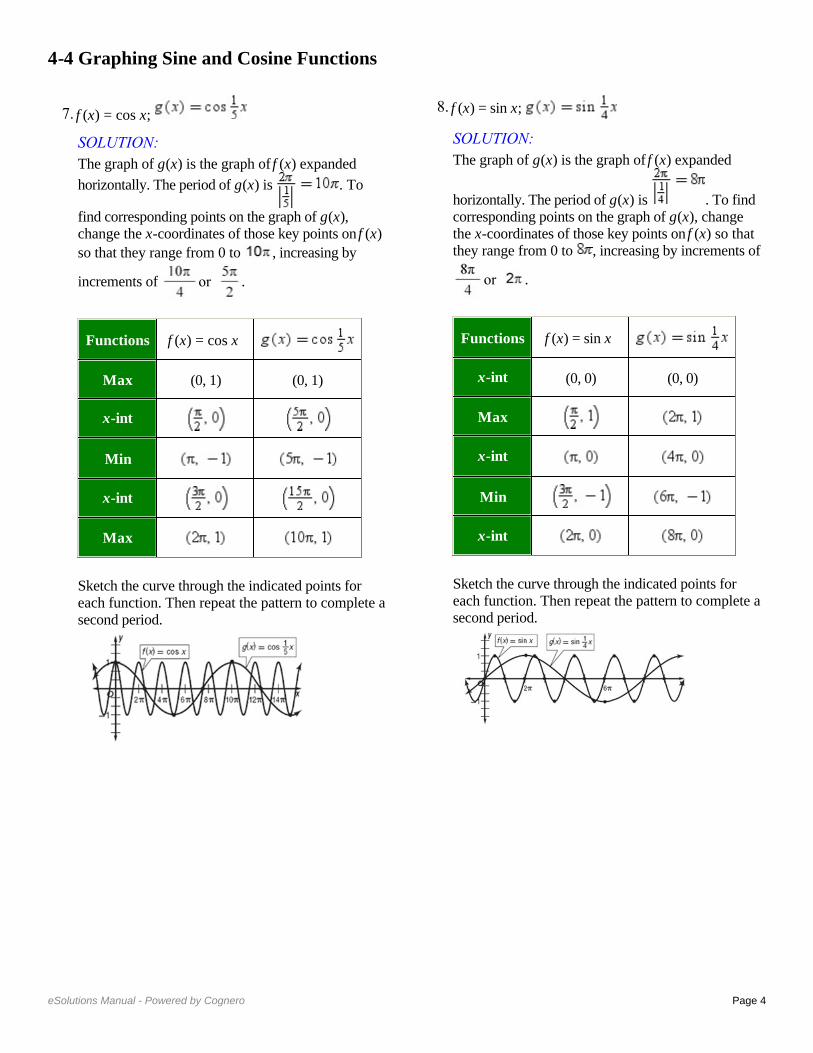
Describe how the graphs of f (x) and g (x) are related. Then find the amplitude of g (x), and sketch two periods of both functions on the same coordinate axes.
1. f (x) = sin x; g(x) = sin x
SOLUTION: The graph of g(x) is the graph of f (x) compressed
vertically. The amplitude of g(x) is or .
Create a table listing the coordinates of the x-intercepts and extrema for f (x) = sin x for one
period, 2 , on the interval [0, 2 ]. Then use the amplitude of g(x) to find corresponding points on its graph.
Sketch the curve through the indicated points for each function. Then repeat the pattern to complete asecond period.
Functions f (x) = sin x g(x) = sin x
x-int (0, 0) (0, 0)
Max
x-int
Min
x-int
2.
SOLUTION: The graph of g(x) is the graph of f (x) compressed
vertically. The amplitude of g(x) is or .
Create a table listing the coordinates of the x-intercepts and extrema for f (x) = cos x for one
period, 2 , on the interval [0, 2 ]. Then use the amplitude of g(x) to find corresponding points on its graph.
Sketch the curve through the indicated points for each function. Then repeat the pattern to complete asecond period.
Function f (x) = cos x
Max (0, 1)
x-int Min
x-in
Min
x-int
Function f (x) = cos x
Max x-int
Min
x-in
Min
x-int
3. f (x) = cos x; g(x) = 6 cos x
SOLUTION: The graph of g(x) is the graph of f (x) expanded
vertically. The amplitude of g(x) is or 6.
Create a table listing the coordinates of the x-intercepts and extrema for f (x) = cos x for one
period, 2 , on the interval [0, 2 ]. Then use the amplitude of g(x) to find corresponding points on its graph.
Sketch the curve through the indicated points for each function. Then repeat the pattern to complete asecond period.
Functions f (x) = cos x g(x) = 6 cos x
Max (0, 1) (0, 6)
x-int
Min
x-int
Max
4. f (x) = sin x; g(x) = −8 sin x
SOLUTION: The graph of g(x) is the graph of f (x) expanded
vertically. The amplitude of g(x) is or 8.
Create a table listing the coordinates of the x-intercepts and extrema for f (x) = sin x for one
period, 2 , on the interval [0, 2 ]. Then use the amplitude of g(x) to find corresponding points on its graph.
Sketch the curve through the indicated points for each function. Then repeat the pattern to complete asecond period.
Function f (x) = sin x
x-int (0, 0)
Max
x-int
Min
x-int
Function g(x) = −8
sin x
x-int (0, 0)
Min
x-int
Max
x-int
Describe how the graphs of f (x) and g (x) are related. Then find the period of g (x), and sketch at least one period of both functions on the same coordinate axes.
5. f (x) = sin x; g(x) = sin 4x
SOLUTION: The graph of g(x) is the graph of f (x) compressed
horizontally. The period of g(x) is . To find
corresponding points on the graph of g(x), change the x-coordinates of those key points on f (x) so that
they range from 0 to , increasing by increments of
.
Sketch the curve through the indicated points for each function. Then repeat the pattern to complete asecond period.
Functions f (x) = sin x g(x) = sin
4x
x-int (0, 0) (0, 0)
Max
x-int
Min
x-int
6. f (x) = cos x; g(x) = cos 2x
SOLUTION: The graph of g(x) is the graph of f (x) compressed
horizontally. The period of g(x) is or . To find
corresponding points on the graph of g(x), change the x-coordinates of those key points on f (x) so that
they range from 0 to , increasing by increments of
.
Sketch the curve through the indicated points for each function. Then repeat the pattern to complete asecond period.
Functions f (x) = cos x g(x) = cos 2x
Max (0, 1) (0, 1)
x-int
Min
x-int
Max
7. f (x) = cos x;
SOLUTION: The graph of g(x) is the graph of f (x) expanded
horizontally. The period of g(x) is . To
find corresponding points on the graph of g(x), change the x-coordinates of those key points on f (x)
so that they range from 0 to , increasing by
increments of or .
Sketch the curve through the indicated points for each function. Then repeat the pattern to complete asecond period.
Functions f (x) = cos x
Max (0, 1) (0, 1)
x-int
Min
x-int
Max
8. f (x) = sin x;
SOLUTION: The graph of g(x) is the graph of f (x) expanded
horizontally. The period of g(x) is . To find corresponding points on the graph of g(x), change the x-coordinates of those key points on f (x) so that they range from 0 to , increasing by increments of
or .
Sketch the curve through the indicated points for each function. Then repeat the pattern to complete asecond period.
Functions f (x) = sin x
x-int (0, 0) (0, 0)
Max
x-int
Min
x-int
9. VOICES The contralto vocal type includes the deepest female singing voice. Some contraltos can sing as low as the E below middle C (E3), which hasa frequency of 165 hertz. Write an equation for a sine function that models the initial behavior of the sound wave associated with E3 having an amplitude of 0.15.
SOLUTION: The general form of the equation will be y = a sin bt,where t is the time in seconds. Because the
amplitude is 0.15, |a|= 0.15. This means that a = ±0.15. The period is the reciprocal of the frequency or
. Use this value to find b.
Sample answer: One sine function that models the
initial behavior is y = 0.15 sin 330 t.
Write a sine function that can be used to model the initial behavior of a sound wave with the frequency and amplitude given.
10. f = 440, a = 0.3
SOLUTION: The general form of the equation is y = a sin bt, where t is the time in seconds. Because the
amplitude is 0.3, = 0.3. This means that a = ±0.3.
The period is the reciprocal of the frequency or
. Use this value to find b.
Using the positive values of a and b, one sine function that models the initial behavior is y = 0.3 sin
880 t.
11. f = 932, a = 0.25
SOLUTION: The general form of the equation is y = a sin bt, where t is the time in seconds. Because the
amplitude is 0.25, = 0.25. This means that a =
±0.25. The period is the reciprocal of the frequency
or . Use this value to find b.
Using the positive values of a and b, one sine function that models the initial behavior is y = 0.25
sin 1864 t.
12. f = 1245, a = 0.12
SOLUTION: The general form of the equation is y = a sin bt, where t is the time in seconds. Because the
amplitude is 0.12, = 0.12. This means that a =
±0.12. The period is the reciprocal of the frequency or
. Use this value to find b.
Using the positive values of a and b, one sine function that models the initial behavior is y = 0.12
sin 2490 t.
13. f = 623, a = 0.2
SOLUTION: The general form of the equation is y = a sin bt, where t is the time in seconds. Because the
amplitude is 0.2, = 0.2. This means that a = ±0.2.
The period is the reciprocal of the frequency or
. Use this value to find b.
Using the positive values of a and b, one sine function that models the initial behavior is y = 0.2 sin
1246 t.
State the amplitude, period, frequency, phase shift, and vertical shift of each function. Then graph two periods of the function.
14.
SOLUTION:
In this function, a = 3, b = 1, c = − , and d = 0.
Because d = 0, there is no vertical shift.
Graph y = 3 sin x shifted units to the right.
15.
SOLUTION:
In this function, a = 1, b = , c = , and d = 0.
Because d = 0, there is no vertical shift.
16. y = 0.25 cos x + 3
SOLUTION:
In this function, a = , b = 1, c = 0, and d = 3.
Graph y = cos x shifted 3 units up.
17. y = sin 3x – 2
SOLUTION: In this function, a = 1, b = 3, c = 0, and d = –2.
Graph y = sin 3x shifted 2 units down.
18.
SOLUTION:
In this function, a = 1, b = 1, c = , and d = –1.
.
Graph y = cos x shifted units to the right and 1
unit down.
19.
SOLUTION:
In this function, a = 1, b = 1, c = , and d = 4.
.
Graph y = sin x shifted units to the left and 4 units up.
20. VACATIONS The average number of reservations R that a vacation resort has at the beginning of each month is shown.
a. Write an equation of a sinusoidal function that models the average number of reservations using x =1 to represent January. b. According to your model, approximately how many reservations can the resort anticipate in November?
SOLUTION: a. Make a scatter plot of the data and choose a model.
Sample answer: Use a sinusoidal function of the form y = a cos (bx + c) + d to model the data. First, find the maximum M and minimum m values of the data, and use these values to find a, b, c, and d. The maximum and minimum reservations are 200 and 87, respectively. The amplitude a is half of the distance between these values.
The vertical shift d is the average of the maximum and minimum data values.
There are 3 months between the maximum and minimum, so the period is 6.
The maximum data value occurs when x = 1. Since y = cos x attains its first maximum when x = 0, we must apply a phase shift of 1 unit. Use this value to find c.
Write a function using the values for a, b, c, and d.
Use b =
b. To find the number of reservations in November, evaluate the model for x = 11.
Therefore, the resort can anticipate about 115 reservations in November.
21. TIDES The table shown below provides data for the first high and low tides of the day for a certain bay during one day in June.
a. Determine the amplitude, period, phase shift, and vertical shift of a sinusoidal function that models the height of the tide. Let x represent the number of hours that the high or low tide occurred after midnight. b. Write a sinusoidal function that models the data. c. According to your model, what was the height of
the tide at 8:45 P.M. that night?
SOLUTION: a. Sample answer: Use a sinusoidal function of the form y = a cos (bx + c) + d to model the data. First, find the amplitude a, which is half of the distance between the heights of the high and low tides.
The vertical shift d is the average of the heights of the high and low tides.
A sinusoid completes half of a period in the time thatit takes to go from its maximum to its minimum value. One period is twice this time. The first high tide occurs 6.5 hours before the first low tide, so the period is 13.
The maximum data value occurs when x ≈ 4.417. Since y = cos x attains its first maximum when x = 0,we must apply a phase shift of 4.417 units. Use this value to find c.
b. Write a function using the values for a, b, c, and
d. Use b =
c. To find the height of the water at 8:45 P.M. that
night, evaluate the model for x = 20.75.
Therefore, the tide was about 7.28 feet high at 8:45
P.M. that night.
22. METEOROLOGY The average monthly temperatures for Boston, Massachusetts are shown.
a. Determine the amplitude, period, phase shift, and vertical shift of a sinusoidal function that models the monthly temperatures using x = 1 to represent January. b. Write an equation of a sinusoidal function that models the monthly temperatures. c. According to your model, what is Boston’s average temperature in August?
SOLUTION: a. The maximum and minimum are 74° and 29°, respectively. The amplitude a is half of the distance between these values.
The vertical shift d is the average of the maximum and minimum data values.
A sinusoid completes half of a period in the time thatit takes to go from its maximum to its minimum value. So, one period is twice this time. The
maximum function value occurs in July, so xmax is 7.
The minimum function value occurs in January, so
xmin is 1. The period is 2(6) = 12.
The maximum data value occurs when x = 7. Since y = cos x attains its first maximum when x = 0, we must apply a phase shift of 7 units. Use this value to find c.
b. Using the values for a, b, c, and d from part a, a sinusoidal function that models that monthly temperatures in Boston is
c. To find the average monthly temperature for Boston in August, evaluate the model for x = 8.
Therefore, the average monthly temperature for Boston in August is about 71°F.
GRAPHING CALCULATOR Find the values of x in the interval – < x < that make each equation or inequality true. (Hint: Use the intersection function.)
23. –sin x = cos x
SOLUTION:
Graph y = −sin x and y = cos x on the same graphing
calculator screen on (−π, π). Use the intersect feature under the CALC menu to determine where the two graphs intersect.
The graphs intersect at about −0.7854 or − and
about 2.356 or . Therefore, on –π < x < π, –sin x
= cos x when x = − and .
24. sin x − cos x = 1
SOLUTION:
Graph y = sin x − cos x and y = 1 on the same
graphing calculator screen on (− , ). Use the intersect feature under the CALC menu to determine where the two graphs intersect.
The graphs intersect at about 1.57 or . Therefore,
on – < x < , sin x − cos x = 1 when x = .
25. sin x + cos x = 0
SOLUTION:
Graph y = sin x + cos x on (−π, π). Use the zero feature under the CALC menu to determine the zeros of the function.
There are zeros at about −0.785 or − or and about
2.356 or . Therefore, on – < x < , sin x + cos
x = 0 when
26. cos x ≤ sin x
SOLUTION:
Graph y = cos x and y = sin x on (−π, π). Use the intersect feature under the CALC menu to determine on what interval(s) cos x ≤ sin x.
The graphs intersect at about –2.356 or – and
about 0.785 or . From the graph, it appears that
cos x ≤ sin x on – < x < – and < x < .
27. sin x cos x > 1
SOLUTION:
Graph y = sin x cos x and y = 1 on (− , ). Use the intersect feature under the CALC menu to determine on what interval(s) sin x cos x > 1.
The graphs do not intersect. Therefore, y = sin x cos
x is not greater than y = 1 for any values of x on –< x < .
28. sin x cos x ≤ 0
SOLUTION:
Graph y = sin x cos x on (−π, π). Use the zero feature under the CALC menu to determine on what interval(s) sin x cos x ≤ 0.
The zeros of y = sin x cos x are about –1.57 or ,
0, and about 1.57 or . From the graph, it appears
that sin x cos x ≤ 0 on < x < 0 and < x < .
29. CAROUSELS A wooden horse on a carousel moves up and down as the carousel spins. When the ride ends, the horse usually stops in a vertical position different from where it started. The position y of the horse after t seconds can be modeled by y =1.5 sin (2t + c), where the phase shift c must be continuously adjusted to compensate for the differentstarting positions. If during one ride the horse
reached a maximum height after seconds, find
the equation that models the horse’s position.
SOLUTION: First, find the period of y = 1.5 sin (2t + c).
Since the period is π, the function will reach a
maximum height at radians. The phase shift is the
difference between the horizontal position of the
function at and radians, which is radians.
Substitute and b into the phase shift formula to
find c.
Therefore, the equation is
30. AMUSEMENT PARKS The position y in feet of a passenger cart relative to the center of a Ferris wheel over t seconds is shown below.
a. Find the time t that it takes for the cart to return toy = 0 during its initial spin. b. Find the period of the Ferris wheel. c. Sketch the graph representing the position of the passenger cart over one period. d. Write a sinusoidal function that models the position of the passenger cart as a function of time t.
SOLUTION: a. From the diagram, the height of the cart is 0 ft when t = 0, and reaches a maximum height of 19 feet when t = 3.75 seconds. So, the cart will return to y = 0 after 2(3.75) or 7.5 seconds. b. The cart completes half of a cycle from t = 0 to t = 7.5. So, the period is 2(7.5) or 15 seconds. c.
d. The amplitude a is half of the maximum and
minimum values. So, a =
The vertical shift d is the average of the maximum
and minimum data values. So,
Because the period of a sinusoidal function is
you can write Therefore,
There is no phase shift because the height of the cartwhen t = 0 is 0 feet, and the sine function has a y-intercept of 0. Therefore, one equation that could be used to model
the position of the passenger cart is y = 19 sin t.
Write an equation that corresponds to each graph.
31.
SOLUTION: Sample answer: There is an x-intercept at 0, so one equation that corresponds to this graph is y = a sin (bx + c) + d. Half of the distance from the maximum to the minimum value of the function is 3. So, the amplitudeis 3. It appears that the function completes one period on
[0, π]. Find b.
The midline appears to be at y = 0, so there does not appear to be any vertical shift. Therefore, one equation that corresponds to this graph is y = 3 sin (2x).
32.
SOLUTION:
Sample answer: Because there is a y-intercept at ,
one equation that corresponds to this graph is y = a cos (bx + c) + d. Half of the distance from the maximum to the
minimum value of the function is . So, the
amplitude is .
It appears that the function completes one period on [0, 6π]. Find b.
The midline appears to be at y = 0, so there does not appear to be any vertical shift. Therefore, one
equation that corresponds to this graph is y = cos
.
33.
SOLUTION: Sample answer: Because there is a y-intercept at 3, one equation that corresponds to this graph is y = a cos (bx + c) + d. Half of the distance from the maximum to the
minimum value of the function is 4 ÷ 2 or 2. So, the amplitude is 2. It appears that the function completes one period on
Find b.
The midline appears to be at y = 1, so there is a vertical shift 1 unit up. Therefore, one equation that corresponds to this graph is y = 2 cos 4x + 1.
34.
SOLUTION: Sample answer: There is an x-intercept at 0, so one equation that corresponds to this graph is y = a sin (bx + c) + d. Half of the distance from the maximum to the
minimum value of the function is 8 ÷ 2 or 4. So, the amplitude is 4. It appears that the function completes one period on [0, 4π]. Find b.
The midline appears to be at y = −2, so there is a vertical shift of 2 units down. Therefore, one equation that corresponds to this graph is y = 4 sin
− 2.
Write a sinusoidal function with the given period and amplitude that passes through the given point.
35. period: ; amplitude: 5; point:
SOLUTION: Use the period to find b.
Sample answer: One sinusoidal function in which a =5 and b = 2 is y = 5 cos 2x. Evaluate the function for
The function passes through . Therefore, a
sinusoidal function with period π and amplitude 5 that
passes through the point is y = 5 cos 2x.
36. period: 4 ; amplitude: 2; point: ( , 2)
SOLUTION: Use the period to find b.
Sample answer: One sinusoidal function in which a =
2 and b = is y = 2 sin . Evaluate the function
for x = π.
The function passes through ( , 2). Therefore, a
sinusoidal function with period 4π and amplitude 2
that passes through the point ( , 2) is y = 2 sin .
37. period: ; amplitude: ; point:
SOLUTION: Use the period to find b.
Sample answer: One sinusoidal function in which a =1.5 and b = 4 is y = 1.5 cos 4x. Evaluate the function
for
The function passes through . Therefore, a
sinusoidal function with period and amplitude 1.5
that passes through the point is y = 1.5 cos
4x.
38. period: 3π; amplitude: ; point:
SOLUTION: Use the period to find b.
Sample answer: One sinusoidal function in which a =
0.5 and b = is y = sin x. Evaluate the
function for
The function passes through . Therefore, a
sinusoidal function with period 3π and amplitude 0.5
that passes through the point is y = sin
x.
39. MULTIPLE REPRESENTATIONS In this problem, you will investigate the change in the graph of a sinusoidal function of the form y = sin x or y = cos x when multiplied by a polynomial function. a. GRAPHICAL Use a graphing calculator to sketch the graphs of y = 2x, y = –2x, and y = 2x cos x on the same coordinate plane, on the interval [–20, 20]. b. VERBAL Describe the behavior of the graph of y = 2x cos x in relation to the graphs of y = 2x and y = –2x. c. GRAPHICAL Use a graphing calculator to
sketch the graphs of y = x2, y = –x
2, and y = x
2 sin x
on the same coordinate plane, on the interval [–20, 20]. d. VERBAL Describe the behavior of the graph of
y = x2 sin x in relation to the graphs of y = x
2 and y
= –x2.
e. ANALYTICAL Make a conjecture as to the behavior of the graph of a sinusoidal function of the form y = sin x or y = cos x when multiplied by polynomial function of the form y = f (x).
SOLUTION: a.
b. The graph of y = 2x cos x oscillates between the graphs of y = 2x and y = –2x. c.
d. The graph of y = x2 sin x oscillates between the
graphs of y = x2 and y = –x
2.
e . The graph of y = f (x) sin x or y = f (x) cos x will oscillate between the graphs of y = f (x) and y = –f(x).
40. CHALLENGE Without graphing, find the exact coordinates of the first maximum point to the right of
the y-axis for
SOLUTION:
First, find the phase shift for
Next, find the period of the function.
The first maximum for one period can be found by
finding So, incorporating the phase shift, the
first maximum to the right of the y-axis is
. Because the amplitude is |4| = 4,
the maximum point is
REASONING Determine whether each statement is true or false . Explain your reasoning.
41. Every sine function of the form y = a sin (bx + c) + d can be written as a cosine function of the form y =a cos (bx + c) + d.
SOLUTION: It is true that every sine function of the form y = a sin (bx + c) + d can be written as a cosine function of the form y = a cos (bx + c) + d. The graph of cosine is a horizontal translation of the sine graph. Therefore, a cosine function can be written from any sine function using the same amplitude and period by applying the necessary phase shift.
For example, consider and
. Phase shift by
to obtain .
42. The period of f (x) = cos 8x is equal to four times the period of g(x) = cos 2x.
SOLUTION: Find the period of f (x) = cos 8x.
Find the period of g(x) = cos 2x.
Four times the period of g(x) = cos 2x is 4 ⋅ or
4 . So, the period of f (x) is the period of g(x).
Therefore, the statement is false.
43. CHALLENGE How many zeros does y = cos
1500x have on the interval 0 ≤ x ≤ 2 ?
SOLUTION: Find the period of y = cos 1500x.
Graph y = cos 1500x on .
The graph of y = cos 1500x has two x-intercepts for one cycle, so the function has 2 zeros per cycle. Find
the number of cycles for y = cos 1500x on [0, 2 ].
So, the graph of y = cos 1500x will complete 1500
cycles on [0, 2 ]. Because there are two zeros per cycle, y = cos 1500x will have 1500(2) or 3000 zeros
on [0, 2 ].
44. PROOF Prove the phase shift formula.
SOLUTION:
Consider y = a sin (bx + c), where a , b, and c ≠ 0. To find a zero of the function, find the value of x for which a sin (bx + c) = 0. Since sin 0 = 0, solving bx + c = 0 will yield a zero of the function.
Therefore, y = 0 when . The value of is
the phase shift. When c > 0: The graph of y = a sin (bx + c) is the
graph of y = a sin x, shifted units to the left.
When c < 0: The graph of y = a sin (bx + c) is the
graph of y = a sin x, shifted units to the right.
Consider the graph of y = cos x below in blue. In this equation a = 1, b = 1 and c = 0. One zero of y = cos x is . The green graph is shifted to the
left. Thus c is – . Then the shifted equation will be
.
45. Writing in Math The Power Tower ride in Sandusky, Ohio, is shown below. Along the side of each tower is a string of lights that send a continuouspulse of light up and down each tower at a constant rate. Explain why the distance d of this light from theground over time t cannot be represented by a sinusoidal function.
SOLUTION: Sample answer: Although the pulse of light can be represented as a function with a period, it is not a sinusoidal function because the distance the pulse of light is from the ground changes at a constant rate. As a result, the graph of this function would resemble the graph below.
The given point lies on the terminal side of an angle θ in standard position. Find the values of
the six trigonometric functions of θ. 46. (−4, 4)
SOLUTION: Use the values of x and y to find r.
Use x = –4, y = 4, and r = to write the six trigonometric ratios.
47. (8, −2)
SOLUTION: Use the values of x and y to find r.
Use x = 8, y = –2, and r = to write the six trigonometric ratios.
48. (−5, −9)
SOLUTION: Use the values of x and y to find r.
Use x = –5, y = – 9, and r = to write the six trigonometric ratios.
49. (4, 5)
SOLUTION: Use the values of x and y to find r.
Use x = 4, y = 5, and r = to write the six trigonometric ratios.
Write each degree measure in radians as a multiple of π and each radian measure in degrees.
50. 25°
SOLUTION: To convert a degree measure to radians, multiply by
51. −420°
SOLUTION: To convert a degree measure to radians, multiply by
52.
SOLUTION: To convert a radian measure to degrees, multiply by
53.
SOLUTION: To convert a radian measure to degrees, multiply by
54. SCIENCE Radiocarbon dating is a method of estimating the age of an organic material by calculating the amount of carbon-14 present in the material. The age of a material can be calculated
using A = t , where A is the age of the
object in years, t is the half-life of carbon-14 or 5700 years, and R is the ratio of the amount of carbon-14 in the sample to the amount of carbon-14 in living tissue. a. A sample of organic material contains 0.000076 gram of carbon-14. A living sample of the same
Describe how the graphs of f (x) and g (x) are related. Then find the amplitude of g (x), and sketch two periods of both functions on the same coordinate axes.
1. f (x) = sin x; g(x) = sin x
SOLUTION: The graph of g(x) is the graph of f (x) compressed
vertically. The amplitude of g(x) is or .
Create a table listing the coordinates of the x-intercepts and extrema for f (x) = sin x for one
period, 2 , on the interval [0, 2 ]. Then use the amplitude of g(x) to find corresponding points on its graph.
Sketch the curve through the indicated points for each function. Then repeat the pattern to complete asecond period.
Functions f (x) = sin x g(x) = sin x
x-int (0, 0) (0, 0)
Max
x-int
Min
x-int
2.
SOLUTION: The graph of g(x) is the graph of f (x) compressed
vertically. The amplitude of g(x) is or .
Create a table listing the coordinates of the x-intercepts and extrema for f (x) = cos x for one
period, 2 , on the interval [0, 2 ]. Then use the amplitude of g(x) to find corresponding points on its graph.
Sketch the curve through the indicated points for each function. Then repeat the pattern to complete asecond period.
Function f (x) = cos x
Max (0, 1)
x-int Min
x-in
Min
x-int
Function f (x) = cos x
Max x-int
Min
x-in
Min
x-int
3. f (x) = cos x; g(x) = 6 cos x
SOLUTION: The graph of g(x) is the graph of f (x) expanded
vertically. The amplitude of g(x) is or 6.
Create a table listing the coordinates of the x-intercepts and extrema for f (x) = cos x for one
period, 2 , on the interval [0, 2 ]. Then use the amplitude of g(x) to find corresponding points on its graph.
Sketch the curve through the indicated points for each function. Then repeat the pattern to complete asecond period.
Functions f (x) = cos x g(x) = 6 cos x
Max (0, 1) (0, 6)
x-int
Min
x-int
Max
4. f (x) = sin x; g(x) = −8 sin x
SOLUTION: The graph of g(x) is the graph of f (x) expanded
vertically. The amplitude of g(x) is or 8.
Create a table listing the coordinates of the x-intercepts and extrema for f (x) = sin x for one
period, 2 , on the interval [0, 2 ]. Then use the amplitude of g(x) to find corresponding points on its graph.
Sketch the curve through the indicated points for each function. Then repeat the pattern to complete asecond period.
Function f (x) = sin x
x-int (0, 0)
Max
x-int
Min
x-int
Function g(x) = −8
sin x
x-int (0, 0)
Min
x-int
Max
x-int
Describe how the graphs of f (x) and g (x) are related. Then find the period of g (x), and sketch at least one period of both functions on the same coordinate axes.
5. f (x) = sin x; g(x) = sin 4x
SOLUTION: The graph of g(x) is the graph of f (x) compressed
horizontally. The period of g(x) is . To find
corresponding points on the graph of g(x), change the x-coordinates of those key points on f (x) so that
they range from 0 to , increasing by increments of
.
Sketch the curve through the indicated points for each function. Then repeat the pattern to complete asecond period.
Functions f (x) = sin x g(x) = sin
4x
x-int (0, 0) (0, 0)
Max
x-int
Min
x-int
6. f (x) = cos x; g(x) = cos 2x
SOLUTION: The graph of g(x) is the graph of f (x) compressed
horizontally. The period of g(x) is or . To find
corresponding points on the graph of g(x), change the x-coordinates of those key points on f (x) so that
they range from 0 to , increasing by increments of
.
Sketch the curve through the indicated points for each function. Then repeat the pattern to complete asecond period.
Functions f (x) = cos x g(x) = cos 2x
Max (0, 1) (0, 1)
x-int
Min
x-int
Max
7. f (x) = cos x;
SOLUTION: The graph of g(x) is the graph of f (x) expanded
horizontally. The period of g(x) is . To
find corresponding points on the graph of g(x), change the x-coordinates of those key points on f (x)
so that they range from 0 to , increasing by
increments of or .
Sketch the curve through the indicated points for each function. Then repeat the pattern to complete asecond period.
Functions f (x) = cos x
Max (0, 1) (0, 1)
x-int
Min
x-int
Max
8. f (x) = sin x;
SOLUTION: The graph of g(x) is the graph of f (x) expanded
horizontally. The period of g(x) is . To find corresponding points on the graph of g(x), change the x-coordinates of those key points on f (x) so that they range from 0 to , increasing by increments of
or .
Sketch the curve through the indicated points for each function. Then repeat the pattern to complete asecond period.
Functions f (x) = sin x
x-int (0, 0) (0, 0)
Max
x-int
Min
x-int
9. VOICES The contralto vocal type includes the deepest female singing voice. Some contraltos can sing as low as the E below middle C (E3), which hasa frequency of 165 hertz. Write an equation for a sine function that models the initial behavior of the sound wave associated with E3 having an amplitude of 0.15.
SOLUTION: The general form of the equation will be y = a sin bt,where t is the time in seconds. Because the
amplitude is 0.15, |a|= 0.15. This means that a = ±0.15. The period is the reciprocal of the frequency or
. Use this value to find b.
Sample answer: One sine function that models the
initial behavior is y = 0.15 sin 330 t.
Write a sine function that can be used to model the initial behavior of a sound wave with the frequency and amplitude given.
10. f = 440, a = 0.3
SOLUTION: The general form of the equation is y = a sin bt, where t is the time in seconds. Because the
amplitude is 0.3, = 0.3. This means that a = ±0.3.
The period is the reciprocal of the frequency or
. Use this value to find b.
Using the positive values of a and b, one sine function that models the initial behavior is y = 0.3 sin
880 t.
11. f = 932, a = 0.25
SOLUTION: The general form of the equation is y = a sin bt, where t is the time in seconds. Because the
amplitude is 0.25, = 0.25. This means that a =
±0.25. The period is the reciprocal of the frequency
or . Use this value to find b.
Using the positive values of a and b, one sine function that models the initial behavior is y = 0.25
sin 1864 t.
12. f = 1245, a = 0.12
SOLUTION: The general form of the equation is y = a sin bt, where t is the time in seconds. Because the
amplitude is 0.12, = 0.12. This means that a =
±0.12. The period is the reciprocal of the frequency or
. Use this value to find b.
Using the positive values of a and b, one sine function that models the initial behavior is y = 0.12
sin 2490 t.
13. f = 623, a = 0.2
SOLUTION: The general form of the equation is y = a sin bt, where t is the time in seconds. Because the
amplitude is 0.2, = 0.2. This means that a = ±0.2.
The period is the reciprocal of the frequency or
. Use this value to find b.
Using the positive values of a and b, one sine function that models the initial behavior is y = 0.2 sin
1246 t.
State the amplitude, period, frequency, phase shift, and vertical shift of each function. Then graph two periods of the function.
14.
SOLUTION:
In this function, a = 3, b = 1, c = − , and d = 0.
Because d = 0, there is no vertical shift.
Graph y = 3 sin x shifted units to the right.
15.
SOLUTION:
In this function, a = 1, b = , c = , and d = 0.
Because d = 0, there is no vertical shift.
16. y = 0.25 cos x + 3
SOLUTION:
In this function, a = , b = 1, c = 0, and d = 3.
Graph y = cos x shifted 3 units up.
17. y = sin 3x – 2
SOLUTION: In this function, a = 1, b = 3, c = 0, and d = –2.
Graph y = sin 3x shifted 2 units down.
18.
SOLUTION:
In this function, a = 1, b = 1, c = , and d = –1.
.
Graph y = cos x shifted units to the right and 1
unit down.
19.
SOLUTION:
In this function, a = 1, b = 1, c = , and d = 4.
.
Graph y = sin x shifted units to the left and 4 units up.
20. VACATIONS The average number of reservations R that a vacation resort has at the beginning of each month is shown.
a. Write an equation of a sinusoidal function that models the average number of reservations using x =1 to represent January. b. According to your model, approximately how many reservations can the resort anticipate in November?
SOLUTION: a. Make a scatter plot of the data and choose a model.
Sample answer: Use a sinusoidal function of the form y = a cos (bx + c) + d to model the data. First, find the maximum M and minimum m values of the data, and use these values to find a, b, c, and d. The maximum and minimum reservations are 200 and 87, respectively. The amplitude a is half of the distance between these values.
The vertical shift d is the average of the maximum and minimum data values.
There are 3 months between the maximum and minimum, so the period is 6.
The maximum data value occurs when x = 1. Since y = cos x attains its first maximum when x = 0, we must apply a phase shift of 1 unit. Use this value to find c.
Write a function using the values for a, b, c, and d.
Use b =
b. To find the number of reservations in November, evaluate the model for x = 11.
Therefore, the resort can anticipate about 115 reservations in November.
21. TIDES The table shown below provides data for the first high and low tides of the day for a certain bay during one day in June.
a. Determine the amplitude, period, phase shift, and vertical shift of a sinusoidal function that models the height of the tide. Let x represent the number of hours that the high or low tide occurred after midnight. b. Write a sinusoidal function that models the data. c. According to your model, what was the height of
the tide at 8:45 P.M. that night?
SOLUTION: a. Sample answer: Use a sinusoidal function of the form y = a cos (bx + c) + d to model the data. First, find the amplitude a, which is half of the distance between the heights of the high and low tides.
The vertical shift d is the average of the heights of the high and low tides.
A sinusoid completes half of a period in the time thatit takes to go from its maximum to its minimum value. One period is twice this time. The first high tide occurs 6.5 hours before the first low tide, so the period is 13.
The maximum data value occurs when x ≈ 4.417. Since y = cos x attains its first maximum when x = 0,we must apply a phase shift of 4.417 units. Use this value to find c.
b. Write a function using the values for a, b, c, and
d. Use b =
c. To find the height of the water at 8:45 P.M. that
night, evaluate the model for x = 20.75.
Therefore, the tide was about 7.28 feet high at 8:45
P.M. that night.
22. METEOROLOGY The average monthly temperatures for Boston, Massachusetts are shown.
a. Determine the amplitude, period, phase shift, and vertical shift of a sinusoidal function that models the monthly temperatures using x = 1 to represent January. b. Write an equation of a sinusoidal function that models the monthly temperatures. c. According to your model, what is Boston’s average temperature in August?
SOLUTION: a. The maximum and minimum are 74° and 29°, respectively. The amplitude a is half of the distance between these values.
The vertical shift d is the average of the maximum and minimum data values.
A sinusoid completes half of a period in the time thatit takes to go from its maximum to its minimum value. So, one period is twice this time. The
maximum function value occurs in July, so xmax is 7.
The minimum function value occurs in January, so
xmin is 1. The period is 2(6) = 12.
The maximum data value occurs when x = 7. Since y = cos x attains its first maximum when x = 0, we must apply a phase shift of 7 units. Use this value to find c.
b. Using the values for a, b, c, and d from part a, a sinusoidal function that models that monthly temperatures in Boston is
c. To find the average monthly temperature for Boston in August, evaluate the model for x = 8.
Therefore, the average monthly temperature for Boston in August is about 71°F.
GRAPHING CALCULATOR Find the values of x in the interval – < x < that make each equation or inequality true. (Hint: Use the intersection function.)
23. –sin x = cos x
SOLUTION:
Graph y = −sin x and y = cos x on the same graphing
calculator screen on (−π, π). Use the intersect feature under the CALC menu to determine where the two graphs intersect.
The graphs intersect at about −0.7854 or − and
about 2.356 or . Therefore, on –π < x < π, –sin x
= cos x when x = − and .
24. sin x − cos x = 1
SOLUTION:
Graph y = sin x − cos x and y = 1 on the same
graphing calculator screen on (− , ). Use the intersect feature under the CALC menu to determine where the two graphs intersect.
The graphs intersect at about 1.57 or . Therefore,
on – < x < , sin x − cos x = 1 when x = .
25. sin x + cos x = 0
SOLUTION:
Graph y = sin x + cos x on (−π, π). Use the zero feature under the CALC menu to determine the zeros of the function.
There are zeros at about −0.785 or − or and about
2.356 or . Therefore, on – < x < , sin x + cos
x = 0 when
26. cos x ≤ sin x
SOLUTION:
Graph y = cos x and y = sin x on (−π, π). Use the intersect feature under the CALC menu to determine on what interval(s) cos x ≤ sin x.
The graphs intersect at about –2.356 or – and
about 0.785 or . From the graph, it appears that
cos x ≤ sin x on – < x < – and < x < .
27. sin x cos x > 1
SOLUTION:
Graph y = sin x cos x and y = 1 on (− , ). Use the intersect feature under the CALC menu to determine on what interval(s) sin x cos x > 1.
The graphs do not intersect. Therefore, y = sin x cos
x is not greater than y = 1 for any values of x on –< x < .
28. sin x cos x ≤ 0
SOLUTION:
Graph y = sin x cos x on (−π, π). Use the zero feature under the CALC menu to determine on what interval(s) sin x cos x ≤ 0.
The zeros of y = sin x cos x are about –1.57 or ,
0, and about 1.57 or . From the graph, it appears
that sin x cos x ≤ 0 on < x < 0 and < x < .
29. CAROUSELS A wooden horse on a carousel moves up and down as the carousel spins. When the ride ends, the horse usually stops in a vertical position different from where it started. The position y of the horse after t seconds can be modeled by y =1.5 sin (2t + c), where the phase shift c must be continuously adjusted to compensate for the differentstarting positions. If during one ride the horse
reached a maximum height after seconds, find
the equation that models the horse’s position.
SOLUTION: First, find the period of y = 1.5 sin (2t + c).
Since the period is π, the function will reach a
maximum height at radians. The phase shift is the
difference between the horizontal position of the
function at and radians, which is radians.
Substitute and b into the phase shift formula to
find c.
Therefore, the equation is
30. AMUSEMENT PARKS The position y in feet of a passenger cart relative to the center of a Ferris wheel over t seconds is shown below.
a. Find the time t that it takes for the cart to return toy = 0 during its initial spin. b. Find the period of the Ferris wheel. c. Sketch the graph representing the position of the passenger cart over one period. d. Write a sinusoidal function that models the position of the passenger cart as a function of time t.
SOLUTION: a. From the diagram, the height of the cart is 0 ft when t = 0, and reaches a maximum height of 19 feet when t = 3.75 seconds. So, the cart will return to y = 0 after 2(3.75) or 7.5 seconds. b. The cart completes half of a cycle from t = 0 to t = 7.5. So, the period is 2(7.5) or 15 seconds. c.
d. The amplitude a is half of the maximum and
minimum values. So, a =
The vertical shift d is the average of the maximum
and minimum data values. So,
Because the period of a sinusoidal function is
you can write Therefore,
There is no phase shift because the height of the cartwhen t = 0 is 0 feet, and the sine function has a y-intercept of 0. Therefore, one equation that could be used to model
the position of the passenger cart is y = 19 sin t.
Write an equation that corresponds to each graph.
31.
SOLUTION: Sample answer: There is an x-intercept at 0, so one equation that corresponds to this graph is y = a sin (bx + c) + d. Half of the distance from the maximum to the minimum value of the function is 3. So, the amplitudeis 3. It appears that the function completes one period on
[0, π]. Find b.
The midline appears to be at y = 0, so there does not appear to be any vertical shift. Therefore, one equation that corresponds to this graph is y = 3 sin (2x).
32.
SOLUTION:
Sample answer: Because there is a y-intercept at ,
one equation that corresponds to this graph is y = a cos (bx + c) + d. Half of the distance from the maximum to the
minimum value of the function is . So, the
amplitude is .
It appears that the function completes one period on [0, 6π]. Find b.
The midline appears to be at y = 0, so there does not appear to be any vertical shift. Therefore, one
equation that corresponds to this graph is y = cos
.
33.
SOLUTION: Sample answer: Because there is a y-intercept at 3, one equation that corresponds to this graph is y = a cos (bx + c) + d. Half of the distance from the maximum to the
minimum value of the function is 4 ÷ 2 or 2. So, the amplitude is 2. It appears that the function completes one period on
Find b.
The midline appears to be at y = 1, so there is a vertical shift 1 unit up. Therefore, one equation that corresponds to this graph is y = 2 cos 4x + 1.
34.
SOLUTION: Sample answer: There is an x-intercept at 0, so one equation that corresponds to this graph is y = a sin (bx + c) + d. Half of the distance from the maximum to the
minimum value of the function is 8 ÷ 2 or 4. So, the amplitude is 4. It appears that the function completes one period on [0, 4π]. Find b.
The midline appears to be at y = −2, so there is a vertical shift of 2 units down. Therefore, one equation that corresponds to this graph is y = 4 sin
− 2.
Write a sinusoidal function with the given period and amplitude that passes through the given point.
35. period: ; amplitude: 5; point:
SOLUTION: Use the period to find b.
Sample answer: One sinusoidal function in which a =5 and b = 2 is y = 5 cos 2x. Evaluate the function for
The function passes through . Therefore, a
sinusoidal function with period π and amplitude 5 that
passes through the point is y = 5 cos 2x.
36. period: 4 ; amplitude: 2; point: ( , 2)
SOLUTION: Use the period to find b.
Sample answer: One sinusoidal function in which a =
2 and b = is y = 2 sin . Evaluate the function
for x = π.
The function passes through ( , 2). Therefore, a
sinusoidal function with period 4π and amplitude 2
that passes through the point ( , 2) is y = 2 sin .
37. period: ; amplitude: ; point:
SOLUTION: Use the period to find b.
Sample answer: One sinusoidal function in which a =1.5 and b = 4 is y = 1.5 cos 4x. Evaluate the function
for
The function passes through . Therefore, a
sinusoidal function with period and amplitude 1.5
that passes through the point is y = 1.5 cos
4x.
38. period: 3π; amplitude: ; point:
SOLUTION: Use the period to find b.
Sample answer: One sinusoidal function in which a =
0.5 and b = is y = sin x. Evaluate the
function for
The function passes through . Therefore, a
sinusoidal function with period 3π and amplitude 0.5
that passes through the point is y = sin
x.
39. MULTIPLE REPRESENTATIONS In this problem, you will investigate the change in the graph of a sinusoidal function of the form y = sin x or y = cos x when multiplied by a polynomial function. a. GRAPHICAL Use a graphing calculator to sketch the graphs of y = 2x, y = –2x, and y = 2x cos x on the same coordinate plane, on the interval [–20, 20]. b. VERBAL Describe the behavior of the graph of y = 2x cos x in relation to the graphs of y = 2x and y = –2x. c. GRAPHICAL Use a graphing calculator to
sketch the graphs of y = x2, y = –x
2, and y = x
2 sin x
on the same coordinate plane, on the interval [–20, 20]. d. VERBAL Describe the behavior of the graph of
y = x2 sin x in relation to the graphs of y = x
2 and y
= –x2.
e. ANALYTICAL Make a conjecture as to the behavior of the graph of a sinusoidal function of the form y = sin x or y = cos x when multiplied by polynomial function of the form y = f (x).
SOLUTION: a.
b. The graph of y = 2x cos x oscillates between the graphs of y = 2x and y = –2x. c.
d. The graph of y = x2 sin x oscillates between the
graphs of y = x2 and y = –x
2.
e . The graph of y = f (x) sin x or y = f (x) cos x will oscillate between the graphs of y = f (x) and y = –f(x).
40. CHALLENGE Without graphing, find the exact coordinates of the first maximum point to the right of
the y-axis for
SOLUTION:
First, find the phase shift for
Next, find the period of the function.
The first maximum for one period can be found by
finding So, incorporating the phase shift, the
first maximum to the right of the y-axis is
. Because the amplitude is |4| = 4,
the maximum point is
REASONING Determine whether each statement is true or false . Explain your reasoning.
41. Every sine function of the form y = a sin (bx + c) + d can be written as a cosine function of the form y =a cos (bx + c) + d.
SOLUTION: It is true that every sine function of the form y = a sin (bx + c) + d can be written as a cosine function of the form y = a cos (bx + c) + d. The graph of cosine is a horizontal translation of the sine graph. Therefore, a cosine function can be written from any sine function using the same amplitude and period by applying the necessary phase shift.
For example, consider and
. Phase shift by
to obtain .
42. The period of f (x) = cos 8x is equal to four times the period of g(x) = cos 2x.
SOLUTION: Find the period of f (x) = cos 8x.
Find the period of g(x) = cos 2x.
Four times the period of g(x) = cos 2x is 4 ⋅ or
4 . So, the period of f (x) is the period of g(x).
Therefore, the statement is false.
43. CHALLENGE How many zeros does y = cos
1500x have on the interval 0 ≤ x ≤ 2 ?
SOLUTION: Find the period of y = cos 1500x.
Graph y = cos 1500x on .
The graph of y = cos 1500x has two x-intercepts for one cycle, so the function has 2 zeros per cycle. Find
the number of cycles for y = cos 1500x on [0, 2 ].
So, the graph of y = cos 1500x will complete 1500
cycles on [0, 2 ]. Because there are two zeros per cycle, y = cos 1500x will have 1500(2) or 3000 zeros
on [0, 2 ].
44. PROOF Prove the phase shift formula.
SOLUTION:
Consider y = a sin (bx + c), where a , b, and c ≠ 0. To find a zero of the function, find the value of x for which a sin (bx + c) = 0. Since sin 0 = 0, solving bx + c = 0 will yield a zero of the function.
Therefore, y = 0 when . The value of is
the phase shift. When c > 0: The graph of y = a sin (bx + c) is the
graph of y = a sin x, shifted units to the left.
When c < 0: The graph of y = a sin (bx + c) is the
graph of y = a sin x, shifted units to the right.
Consider the graph of y = cos x below in blue. In this equation a = 1, b = 1 and c = 0. One zero of y = cos x is . The green graph is shifted to the
left. Thus c is – . Then the shifted equation will be
.
45. Writing in Math The Power Tower ride in Sandusky, Ohio, is shown below. Along the side of each tower is a string of lights that send a continuouspulse of light up and down each tower at a constant rate. Explain why the distance d of this light from theground over time t cannot be represented by a sinusoidal function.
SOLUTION: Sample answer: Although the pulse of light can be represented as a function with a period, it is not a sinusoidal function because the distance the pulse of light is from the ground changes at a constant rate. As a result, the graph of this function would resemble the graph below.
The given point lies on the terminal side of an angle θ in standard position. Find the values of
the six trigonometric functions of θ. 46. (−4, 4)
SOLUTION: Use the values of x and y to find r.
Use x = –4, y = 4, and r = to write the six trigonometric ratios.
47. (8, −2)
SOLUTION: Use the values of x and y to find r.
Use x = 8, y = –2, and r = to write the six trigonometric ratios.
48. (−5, −9)
SOLUTION: Use the values of x and y to find r.
Use x = –5, y = – 9, and r = to write the six trigonometric ratios.
49. (4, 5)
SOLUTION: Use the values of x and y to find r.
Use x = 4, y = 5, and r = to write the six trigonometric ratios.
Write each degree measure in radians as a multiple of π and each radian measure in degrees.
50. 25°
SOLUTION: To convert a degree measure to radians, multiply by
51. −420°
SOLUTION: To convert a degree measure to radians, multiply by
52.
SOLUTION: To convert a radian measure to degrees, multiply by
53.
SOLUTION: To convert a radian measure to degrees, multiply by
54. SCIENCE Radiocarbon dating is a method of estimating the age of an organic material by calculating the amount of carbon-14 present in the material. The age of a material can be calculated
using A = t , where A is the age of the
object in years, t is the half-life of carbon-14 or 5700 years, and R is the ratio of the amount of carbon-14 in the sample to the amount of carbon-14 in living tissue. a. A sample of organic material contains 0.000076 gram of carbon-14. A living sample of the same
eSolutions Manual - Powered by Cognero Page 4
4-4 Graphing Sine and Cosine Functions
Describe how the graphs of f (x) and g (x) are related. Then find the amplitude of g (x), and sketch two periods of both functions on the same coordinate axes.
1. f (x) = sin x; g(x) = sin x
SOLUTION: The graph of g(x) is the graph of f (x) compressed
vertically. The amplitude of g(x) is or .
Create a table listing the coordinates of the x-intercepts and extrema for f (x) = sin x for one
period, 2 , on the interval [0, 2 ]. Then use the amplitude of g(x) to find corresponding points on its graph.
Sketch the curve through the indicated points for each function. Then repeat the pattern to complete asecond period.
Functions f (x) = sin x g(x) = sin x
x-int (0, 0) (0, 0)
Max
x-int
Min
x-int
2.
SOLUTION: The graph of g(x) is the graph of f (x) compressed
vertically. The amplitude of g(x) is or .
Create a table listing the coordinates of the x-intercepts and extrema for f (x) = cos x for one
period, 2 , on the interval [0, 2 ]. Then use the amplitude of g(x) to find corresponding points on its graph.
Sketch the curve through the indicated points for each function. Then repeat the pattern to complete asecond period.
Function f (x) = cos x
Max (0, 1)
x-int Min
x-in
Min
x-int
Function f (x) = cos x
Max x-int
Min
x-in
Min
x-int
3. f (x) = cos x; g(x) = 6 cos x
SOLUTION: The graph of g(x) is the graph of f (x) expanded
vertically. The amplitude of g(x) is or 6.
Create a table listing the coordinates of the x-intercepts and extrema for f (x) = cos x for one
period, 2 , on the interval [0, 2 ]. Then use the amplitude of g(x) to find corresponding points on its graph.
Sketch the curve through the indicated points for each function. Then repeat the pattern to complete asecond period.
Functions f (x) = cos x g(x) = 6 cos x
Max (0, 1) (0, 6)
x-int
Min
x-int
Max
4. f (x) = sin x; g(x) = −8 sin x
SOLUTION: The graph of g(x) is the graph of f (x) expanded
vertically. The amplitude of g(x) is or 8.
Create a table listing the coordinates of the x-intercepts and extrema for f (x) = sin x for one
period, 2 , on the interval [0, 2 ]. Then use the amplitude of g(x) to find corresponding points on its graph.
Sketch the curve through the indicated points for each function. Then repeat the pattern to complete asecond period.
Function f (x) = sin x
x-int (0, 0)
Max
x-int
Min
x-int
Function g(x) = −8
sin x
x-int (0, 0)
Min
x-int
Max
x-int
Describe how the graphs of f (x) and g (x) are related. Then find the period of g (x), and sketch at least one period of both functions on the same coordinate axes.
5. f (x) = sin x; g(x) = sin 4x
SOLUTION: The graph of g(x) is the graph of f (x) compressed
horizontally. The period of g(x) is . To find
corresponding points on the graph of g(x), change the x-coordinates of those key points on f (x) so that
they range from 0 to , increasing by increments of
.
Sketch the curve through the indicated points for each function. Then repeat the pattern to complete asecond period.
Functions f (x) = sin x g(x) = sin
4x
x-int (0, 0) (0, 0)
Max
x-int
Min
x-int
6. f (x) = cos x; g(x) = cos 2x
SOLUTION: The graph of g(x) is the graph of f (x) compressed
horizontally. The period of g(x) is or . To find
corresponding points on the graph of g(x), change the x-coordinates of those key points on f (x) so that
they range from 0 to , increasing by increments of
.
Sketch the curve through the indicated points for each function. Then repeat the pattern to complete asecond period.
Functions f (x) = cos x g(x) = cos 2x
Max (0, 1) (0, 1)
x-int
Min
x-int
Max
7. f (x) = cos x;
SOLUTION: The graph of g(x) is the graph of f (x) expanded
horizontally. The period of g(x) is . To
find corresponding points on the graph of g(x), change the x-coordinates of those key points on f (x)
so that they range from 0 to , increasing by
increments of or .
Sketch the curve through the indicated points for each function. Then repeat the pattern to complete asecond period.
Functions f (x) = cos x
Max (0, 1) (0, 1)
x-int
Min
x-int
Max
8. f (x) = sin x;
SOLUTION: The graph of g(x) is the graph of f (x) expanded
horizontally. The period of g(x) is . To find corresponding points on the graph of g(x), change the x-coordinates of those key points on f (x) so that they range from 0 to , increasing by increments of
or .
Sketch the curve through the indicated points for each function. Then repeat the pattern to complete asecond period.
Functions f (x) = sin x
x-int (0, 0) (0, 0)
Max
x-int
Min
x-int
9. VOICES The contralto vocal type includes the deepest female singing voice. Some contraltos can sing as low as the E below middle C (E3), which hasa frequency of 165 hertz. Write an equation for a sine function that models the initial behavior of the sound wave associated with E3 having an amplitude of 0.15.
SOLUTION: The general form of the equation will be y = a sin bt,where t is the time in seconds. Because the
amplitude is 0.15, |a|= 0.15. This means that a = ±0.15. The period is the reciprocal of the frequency or
. Use this value to find b.
Sample answer: One sine function that models the
initial behavior is y = 0.15 sin 330 t.
Write a sine function that can be used to model the initial behavior of a sound wave with the frequency and amplitude given.
10. f = 440, a = 0.3
SOLUTION: The general form of the equation is y = a sin bt, where t is the time in seconds. Because the
amplitude is 0.3, = 0.3. This means that a = ±0.3.
The period is the reciprocal of the frequency or
. Use this value to find b.
Using the positive values of a and b, one sine function that models the initial behavior is y = 0.3 sin
880 t.
11. f = 932, a = 0.25
SOLUTION: The general form of the equation is y = a sin bt, where t is the time in seconds. Because the
amplitude is 0.25, = 0.25. This means that a =
±0.25. The period is the reciprocal of the frequency
or . Use this value to find b.
Using the positive values of a and b, one sine function that models the initial behavior is y = 0.25
sin 1864 t.
12. f = 1245, a = 0.12
SOLUTION: The general form of the equation is y = a sin bt, where t is the time in seconds. Because the
amplitude is 0.12, = 0.12. This means that a =
±0.12. The period is the reciprocal of the frequency or
. Use this value to find b.
Using the positive values of a and b, one sine function that models the initial behavior is y = 0.12
sin 2490 t.
13. f = 623, a = 0.2
SOLUTION: The general form of the equation is y = a sin bt, where t is the time in seconds. Because the
amplitude is 0.2, = 0.2. This means that a = ±0.2.
The period is the reciprocal of the frequency or
. Use this value to find b.
Using the positive values of a and b, one sine function that models the initial behavior is y = 0.2 sin
1246 t.
State the amplitude, period, frequency, phase shift, and vertical shift of each function. Then graph two periods of the function.
14.
SOLUTION:
In this function, a = 3, b = 1, c = − , and d = 0.
Because d = 0, there is no vertical shift.
Graph y = 3 sin x shifted units to the right.
15.
SOLUTION:
In this function, a = 1, b = , c = , and d = 0.
Because d = 0, there is no vertical shift.
16. y = 0.25 cos x + 3
SOLUTION:
In this function, a = , b = 1, c = 0, and d = 3.
Graph y = cos x shifted 3 units up.
17. y = sin 3x – 2
SOLUTION: In this function, a = 1, b = 3, c = 0, and d = –2.
Graph y = sin 3x shifted 2 units down.
18.
SOLUTION:
In this function, a = 1, b = 1, c = , and d = –1.
.
Graph y = cos x shifted units to the right and 1
unit down.
19.
SOLUTION:
In this function, a = 1, b = 1, c = , and d = 4.
.
Graph y = sin x shifted units to the left and 4 units up.
20. VACATIONS The average number of reservations R that a vacation resort has at the beginning of each month is shown.
a. Write an equation of a sinusoidal function that models the average number of reservations using x =1 to represent January. b. According to your model, approximately how many reservations can the resort anticipate in November?
SOLUTION: a. Make a scatter plot of the data and choose a model.
Sample answer: Use a sinusoidal function of the form y = a cos (bx + c) + d to model the data. First, find the maximum M and minimum m values of the data, and use these values to find a, b, c, and d. The maximum and minimum reservations are 200 and 87, respectively. The amplitude a is half of the distance between these values.
The vertical shift d is the average of the maximum and minimum data values.
There are 3 months between the maximum and minimum, so the period is 6.
The maximum data value occurs when x = 1. Since y = cos x attains its first maximum when x = 0, we must apply a phase shift of 1 unit. Use this value to find c.
Write a function using the values for a, b, c, and d.
Use b =
b. To find the number of reservations in November, evaluate the model for x = 11.
Therefore, the resort can anticipate about 115 reservations in November.
21. TIDES The table shown below provides data for the first high and low tides of the day for a certain bay during one day in June.
a. Determine the amplitude, period, phase shift, and vertical shift of a sinusoidal function that models the height of the tide. Let x represent the number of hours that the high or low tide occurred after midnight. b. Write a sinusoidal function that models the data. c. According to your model, what was the height of
the tide at 8:45 P.M. that night?
SOLUTION: a. Sample answer: Use a sinusoidal function of the form y = a cos (bx + c) + d to model the data. First, find the amplitude a, which is half of the distance between the heights of the high and low tides.
The vertical shift d is the average of the heights of the high and low tides.
A sinusoid completes half of a period in the time thatit takes to go from its maximum to its minimum value. One period is twice this time. The first high tide occurs 6.5 hours before the first low tide, so the period is 13.
The maximum data value occurs when x ≈ 4.417. Since y = cos x attains its first maximum when x = 0,we must apply a phase shift of 4.417 units. Use this value to find c.
b. Write a function using the values for a, b, c, and
d. Use b =
c. To find the height of the water at 8:45 P.M. that
night, evaluate the model for x = 20.75.
Therefore, the tide was about 7.28 feet high at 8:45
P.M. that night.
22. METEOROLOGY The average monthly temperatures for Boston, Massachusetts are shown.
a. Determine the amplitude, period, phase shift, and vertical shift of a sinusoidal function that models the monthly temperatures using x = 1 to represent January. b. Write an equation of a sinusoidal function that models the monthly temperatures. c. According to your model, what is Boston’s average temperature in August?
SOLUTION: a. The maximum and minimum are 74° and 29°, respectively. The amplitude a is half of the distance between these values.
The vertical shift d is the average of the maximum and minimum data values.
A sinusoid completes half of a period in the time thatit takes to go from its maximum to its minimum value. So, one period is twice this time. The
maximum function value occurs in July, so xmax is 7.
The minimum function value occurs in January, so
xmin is 1. The period is 2(6) = 12.
The maximum data value occurs when x = 7. Since y = cos x attains its first maximum when x = 0, we must apply a phase shift of 7 units. Use this value to find c.
b. Using the values for a, b, c, and d from part a, a sinusoidal function that models that monthly temperatures in Boston is
c. To find the average monthly temperature for Boston in August, evaluate the model for x = 8.
Therefore, the average monthly temperature for Boston in August is about 71°F.
GRAPHING CALCULATOR Find the values of x in the interval – < x < that make each equation or inequality true. (Hint: Use the intersection function.)
23. –sin x = cos x
SOLUTION:
Graph y = −sin x and y = cos x on the same graphing
calculator screen on (−π, π). Use the intersect feature under the CALC menu to determine where the two graphs intersect.
The graphs intersect at about −0.7854 or − and
about 2.356 or . Therefore, on –π < x < π, –sin x
= cos x when x = − and .
24. sin x − cos x = 1
SOLUTION:
Graph y = sin x − cos x and y = 1 on the same
graphing calculator screen on (− , ). Use the intersect feature under the CALC menu to determine where the two graphs intersect.
The graphs intersect at about 1.57 or . Therefore,
on – < x < , sin x − cos x = 1 when x = .
25. sin x + cos x = 0
SOLUTION:
Graph y = sin x + cos x on (−π, π). Use the zero feature under the CALC menu to determine the zeros of the function.
There are zeros at about −0.785 or − or and about
2.356 or . Therefore, on – < x < , sin x + cos
x = 0 when
26. cos x ≤ sin x
SOLUTION:
Graph y = cos x and y = sin x on (−π, π). Use the intersect feature under the CALC menu to determine on what interval(s) cos x ≤ sin x.
The graphs intersect at about –2.356 or – and
about 0.785 or . From the graph, it appears that
cos x ≤ sin x on – < x < – and < x < .
27. sin x cos x > 1
SOLUTION:
Graph y = sin x cos x and y = 1 on (− , ). Use the intersect feature under the CALC menu to determine on what interval(s) sin x cos x > 1.
The graphs do not intersect. Therefore, y = sin x cos
x is not greater than y = 1 for any values of x on –< x < .
28. sin x cos x ≤ 0
SOLUTION:
Graph y = sin x cos x on (−π, π). Use the zero feature under the CALC menu to determine on what interval(s) sin x cos x ≤ 0.
The zeros of y = sin x cos x are about –1.57 or ,
0, and about 1.57 or . From the graph, it appears
that sin x cos x ≤ 0 on < x < 0 and < x < .
29. CAROUSELS A wooden horse on a carousel moves up and down as the carousel spins. When the ride ends, the horse usually stops in a vertical position different from where it started. The position y of the horse after t seconds can be modeled by y =1.5 sin (2t + c), where the phase shift c must be continuously adjusted to compensate for the differentstarting positions. If during one ride the horse
reached a maximum height after seconds, find
the equation that models the horse’s position.
SOLUTION: First, find the period of y = 1.5 sin (2t + c).
Since the period is π, the function will reach a
maximum height at radians. The phase shift is the
difference between the horizontal position of the
function at and radians, which is radians.
Substitute and b into the phase shift formula to
find c.
Therefore, the equation is
30. AMUSEMENT PARKS The position y in feet of a passenger cart relative to the center of a Ferris wheel over t seconds is shown below.
a. Find the time t that it takes for the cart to return toy = 0 during its initial spin. b. Find the period of the Ferris wheel. c. Sketch the graph representing the position of the passenger cart over one period. d. Write a sinusoidal function that models the position of the passenger cart as a function of time t.
SOLUTION: a. From the diagram, the height of the cart is 0 ft when t = 0, and reaches a maximum height of 19 feet when t = 3.75 seconds. So, the cart will return to y = 0 after 2(3.75) or 7.5 seconds. b. The cart completes half of a cycle from t = 0 to t = 7.5. So, the period is 2(7.5) or 15 seconds. c.
d. The amplitude a is half of the maximum and
minimum values. So, a =
The vertical shift d is the average of the maximum
and minimum data values. So,
Because the period of a sinusoidal function is
you can write Therefore,
There is no phase shift because the height of the cartwhen t = 0 is 0 feet, and the sine function has a y-intercept of 0. Therefore, one equation that could be used to model
the position of the passenger cart is y = 19 sin t.
Write an equation that corresponds to each graph.
31.
SOLUTION: Sample answer: There is an x-intercept at 0, so one equation that corresponds to this graph is y = a sin (bx + c) + d. Half of the distance from the maximum to the minimum value of the function is 3. So, the amplitudeis 3. It appears that the function completes one period on
[0, π]. Find b.
The midline appears to be at y = 0, so there does not appear to be any vertical shift. Therefore, one equation that corresponds to this graph is y = 3 sin (2x).
32.
SOLUTION:
Sample answer: Because there is a y-intercept at ,
one equation that corresponds to this graph is y = a cos (bx + c) + d. Half of the distance from the maximum to the
minimum value of the function is . So, the
amplitude is .
It appears that the function completes one period on [0, 6π]. Find b.
The midline appears to be at y = 0, so there does not appear to be any vertical shift. Therefore, one
equation that corresponds to this graph is y = cos
.
33.
SOLUTION: Sample answer: Because there is a y-intercept at 3, one equation that corresponds to this graph is y = a cos (bx + c) + d. Half of the distance from the maximum to the
minimum value of the function is 4 ÷ 2 or 2. So, the amplitude is 2. It appears that the function completes one period on
Find b.
The midline appears to be at y = 1, so there is a vertical shift 1 unit up. Therefore, one equation that corresponds to this graph is y = 2 cos 4x + 1.
34.
SOLUTION: Sample answer: There is an x-intercept at 0, so one equation that corresponds to this graph is y = a sin (bx + c) + d. Half of the distance from the maximum to the
minimum value of the function is 8 ÷ 2 or 4. So, the amplitude is 4. It appears that the function completes one period on [0, 4π]. Find b.
The midline appears to be at y = −2, so there is a vertical shift of 2 units down. Therefore, one equation that corresponds to this graph is y = 4 sin
− 2.
Write a sinusoidal function with the given period and amplitude that passes through the given point.
35. period: ; amplitude: 5; point:
SOLUTION: Use the period to find b.
Sample answer: One sinusoidal function in which a =5 and b = 2 is y = 5 cos 2x. Evaluate the function for
The function passes through . Therefore, a
sinusoidal function with period π and amplitude 5 that
passes through the point is y = 5 cos 2x.
36. period: 4 ; amplitude: 2; point: ( , 2)
SOLUTION: Use the period to find b.
Sample answer: One sinusoidal function in which a =
2 and b = is y = 2 sin . Evaluate the function
for x = π.
The function passes through ( , 2). Therefore, a
sinusoidal function with period 4π and amplitude 2
that passes through the point ( , 2) is y = 2 sin .
37. period: ; amplitude: ; point:
SOLUTION: Use the period to find b.
Sample answer: One sinusoidal function in which a =1.5 and b = 4 is y = 1.5 cos 4x. Evaluate the function
for
The function passes through . Therefore, a
sinusoidal function with period and amplitude 1.5
that passes through the point is y = 1.5 cos
4x.
38. period: 3π; amplitude: ; point:
SOLUTION: Use the period to find b.
Sample answer: One sinusoidal function in which a =
0.5 and b = is y = sin x. Evaluate the
function for
The function passes through . Therefore, a
sinusoidal function with period 3π and amplitude 0.5
that passes through the point is y = sin
x.
39. MULTIPLE REPRESENTATIONS In this problem, you will investigate the change in the graph of a sinusoidal function of the form y = sin x or y = cos x when multiplied by a polynomial function. a. GRAPHICAL Use a graphing calculator to sketch the graphs of y = 2x, y = –2x, and y = 2x cos x on the same coordinate plane, on the interval [–20, 20]. b. VERBAL Describe the behavior of the graph of y = 2x cos x in relation to the graphs of y = 2x and y = –2x. c. GRAPHICAL Use a graphing calculator to
sketch the graphs of y = x2, y = –x
2, and y = x
2 sin x
on the same coordinate plane, on the interval [–20, 20]. d. VERBAL Describe the behavior of the graph of
y = x2 sin x in relation to the graphs of y = x
2 and y
= –x2.
e. ANALYTICAL Make a conjecture as to the behavior of the graph of a sinusoidal function of the form y = sin x or y = cos x when multiplied by polynomial function of the form y = f (x).
SOLUTION: a.
b. The graph of y = 2x cos x oscillates between the graphs of y = 2x and y = –2x. c.
d. The graph of y = x2 sin x oscillates between the
graphs of y = x2 and y = –x
2.
e . The graph of y = f (x) sin x or y = f (x) cos x will oscillate between the graphs of y = f (x) and y = –f(x).
40. CHALLENGE Without graphing, find the exact coordinates of the first maximum point to the right of
the y-axis for
SOLUTION:
First, find the phase shift for
Next, find the period of the function.
The first maximum for one period can be found by
finding So, incorporating the phase shift, the
first maximum to the right of the y-axis is
. Because the amplitude is |4| = 4,
the maximum point is
REASONING Determine whether each statement is true or false . Explain your reasoning.
41. Every sine function of the form y = a sin (bx + c) + d can be written as a cosine function of the form y =a cos (bx + c) + d.
SOLUTION: It is true that every sine function of the form y = a sin (bx + c) + d can be written as a cosine function of the form y = a cos (bx + c) + d. The graph of cosine is a horizontal translation of the sine graph. Therefore, a cosine function can be written from any sine function using the same amplitude and period by applying the necessary phase shift.
For example, consider and
. Phase shift by
to obtain .
42. The period of f (x) = cos 8x is equal to four times the period of g(x) = cos 2x.
SOLUTION: Find the period of f (x) = cos 8x.
Find the period of g(x) = cos 2x.
Four times the period of g(x) = cos 2x is 4 ⋅ or
4 . So, the period of f (x) is the period of g(x).
Therefore, the statement is false.
43. CHALLENGE How many zeros does y = cos
1500x have on the interval 0 ≤ x ≤ 2 ?
SOLUTION: Find the period of y = cos 1500x.
Graph y = cos 1500x on .
The graph of y = cos 1500x has two x-intercepts for one cycle, so the function has 2 zeros per cycle. Find
the number of cycles for y = cos 1500x on [0, 2 ].
So, the graph of y = cos 1500x will complete 1500
cycles on [0, 2 ]. Because there are two zeros per cycle, y = cos 1500x will have 1500(2) or 3000 zeros
on [0, 2 ].
44. PROOF Prove the phase shift formula.
SOLUTION:
Consider y = a sin (bx + c), where a , b, and c ≠ 0. To find a zero of the function, find the value of x for which a sin (bx + c) = 0. Since sin 0 = 0, solving bx + c = 0 will yield a zero of the function.
Therefore, y = 0 when . The value of is
the phase shift. When c > 0: The graph of y = a sin (bx + c) is the
graph of y = a sin x, shifted units to the left.
When c < 0: The graph of y = a sin (bx + c) is the
graph of y = a sin x, shifted units to the right.
Consider the graph of y = cos x below in blue. In this equation a = 1, b = 1 and c = 0. One zero of y = cos x is . The green graph is shifted to the
left. Thus c is – . Then the shifted equation will be
.
45. Writing in Math The Power Tower ride in Sandusky, Ohio, is shown below. Along the side of each tower is a string of lights that send a continuouspulse of light up and down each tower at a constant rate. Explain why the distance d of this light from theground over time t cannot be represented by a sinusoidal function.
SOLUTION: Sample answer: Although the pulse of light can be represented as a function with a period, it is not a sinusoidal function because the distance the pulse of light is from the ground changes at a constant rate. As a result, the graph of this function would resemble the graph below.
The given point lies on the terminal side of an angle θ in standard position. Find the values of
the six trigonometric functions of θ. 46. (−4, 4)
SOLUTION: Use the values of x and y to find r.
Use x = –4, y = 4, and r = to write the six trigonometric ratios.
47. (8, −2)
SOLUTION: Use the values of x and y to find r.
Use x = 8, y = –2, and r = to write the six trigonometric ratios.
48. (−5, −9)
SOLUTION: Use the values of x and y to find r.
Use x = –5, y = – 9, and r = to write the six trigonometric ratios.
49. (4, 5)
SOLUTION: Use the values of x and y to find r.
Use x = 4, y = 5, and r = to write the six trigonometric ratios.
Write each degree measure in radians as a multiple of π and each radian measure in degrees.
50. 25°
SOLUTION: To convert a degree measure to radians, multiply by
51. −420°
SOLUTION: To convert a degree measure to radians, multiply by
52.
SOLUTION: To convert a radian measure to degrees, multiply by
53.
SOLUTION: To convert a radian measure to degrees, multiply by
54. SCIENCE Radiocarbon dating is a method of estimating the age of an organic material by calculating the amount of carbon-14 present in the material. The age of a material can be calculated
using A = t , where A is the age of the
object in years, t is the half-life of carbon-14 or 5700 years, and R is the ratio of the amount of carbon-14 in the sample to the amount of carbon-14 in living tissue. a. A sample of organic material contains 0.000076 gram of carbon-14. A living sample of the same
eSolutions Manual - Powered by Cognero Page 5
4-4 Graphing Sine and Cosine Functions
Describe how the graphs of f (x) and g (x) are related. Then find the amplitude of g (x), and sketch two periods of both functions on the same coordinate axes.
1. f (x) = sin x; g(x) = sin x
SOLUTION: The graph of g(x) is the graph of f (x) compressed
vertically. The amplitude of g(x) is or .
Create a table listing the coordinates of the x-intercepts and extrema for f (x) = sin x for one
period, 2 , on the interval [0, 2 ]. Then use the amplitude of g(x) to find corresponding points on its graph.
Sketch the curve through the indicated points for each function. Then repeat the pattern to complete asecond period.
Functions f (x) = sin x g(x) = sin x
x-int (0, 0) (0, 0)
Max
x-int
Min
x-int
2.
SOLUTION: The graph of g(x) is the graph of f (x) compressed
vertically. The amplitude of g(x) is or .
Create a table listing the coordinates of the x-intercepts and extrema for f (x) = cos x for one
period, 2 , on the interval [0, 2 ]. Then use the amplitude of g(x) to find corresponding points on its graph.
Sketch the curve through the indicated points for each function. Then repeat the pattern to complete asecond period.
Function f (x) = cos x
Max (0, 1)
x-int Min
x-in
Min
x-int
Function f (x) = cos x
Max x-int
Min
x-in
Min
x-int
3. f (x) = cos x; g(x) = 6 cos x
SOLUTION: The graph of g(x) is the graph of f (x) expanded
vertically. The amplitude of g(x) is or 6.
Create a table listing the coordinates of the x-intercepts and extrema for f (x) = cos x for one
period, 2 , on the interval [0, 2 ]. Then use the amplitude of g(x) to find corresponding points on its graph.
Sketch the curve through the indicated points for each function. Then repeat the pattern to complete asecond period.
Functions f (x) = cos x g(x) = 6 cos x
Max (0, 1) (0, 6)
x-int
Min
x-int
Max
4. f (x) = sin x; g(x) = −8 sin x
SOLUTION: The graph of g(x) is the graph of f (x) expanded
vertically. The amplitude of g(x) is or 8.
Create a table listing the coordinates of the x-intercepts and extrema for f (x) = sin x for one
period, 2 , on the interval [0, 2 ]. Then use the amplitude of g(x) to find corresponding points on its graph.
Sketch the curve through the indicated points for each function. Then repeat the pattern to complete asecond period.
Function f (x) = sin x
x-int (0, 0)
Max
x-int
Min
x-int
Function g(x) = −8
sin x
x-int (0, 0)
Min
x-int
Max
x-int
Describe how the graphs of f (x) and g (x) are related. Then find the period of g (x), and sketch at least one period of both functions on the same coordinate axes.
5. f (x) = sin x; g(x) = sin 4x
SOLUTION: The graph of g(x) is the graph of f (x) compressed
horizontally. The period of g(x) is . To find
corresponding points on the graph of g(x), change the x-coordinates of those key points on f (x) so that
they range from 0 to , increasing by increments of
.
Sketch the curve through the indicated points for each function. Then repeat the pattern to complete asecond period.
Functions f (x) = sin x g(x) = sin
4x
x-int (0, 0) (0, 0)
Max
x-int
Min
x-int
6. f (x) = cos x; g(x) = cos 2x
SOLUTION: The graph of g(x) is the graph of f (x) compressed
horizontally. The period of g(x) is or . To find
corresponding points on the graph of g(x), change the x-coordinates of those key points on f (x) so that
they range from 0 to , increasing by increments of
.
Sketch the curve through the indicated points for each function. Then repeat the pattern to complete asecond period.
Functions f (x) = cos x g(x) = cos 2x
Max (0, 1) (0, 1)
x-int
Min
x-int
Max
7. f (x) = cos x;
SOLUTION: The graph of g(x) is the graph of f (x) expanded
horizontally. The period of g(x) is . To
find corresponding points on the graph of g(x), change the x-coordinates of those key points on f (x)
so that they range from 0 to , increasing by
increments of or .
Sketch the curve through the indicated points for each function. Then repeat the pattern to complete asecond period.
Functions f (x) = cos x
Max (0, 1) (0, 1)
x-int
Min
x-int
Max
8. f (x) = sin x;
SOLUTION: The graph of g(x) is the graph of f (x) expanded
horizontally. The period of g(x) is . To find corresponding points on the graph of g(x), change the x-coordinates of those key points on f (x) so that they range from 0 to , increasing by increments of
or .
Sketch the curve through the indicated points for each function. Then repeat the pattern to complete asecond period.
Functions f (x) = sin x
x-int (0, 0) (0, 0)
Max
x-int
Min
x-int
9. VOICES The contralto vocal type includes the deepest female singing voice. Some contraltos can sing as low as the E below middle C (E3), which hasa frequency of 165 hertz. Write an equation for a sine function that models the initial behavior of the sound wave associated with E3 having an amplitude of 0.15.
SOLUTION: The general form of the equation will be y = a sin bt,where t is the time in seconds. Because the
amplitude is 0.15, |a|= 0.15. This means that a = ±0.15. The period is the reciprocal of the frequency or
. Use this value to find b.
Sample answer: One sine function that models the
initial behavior is y = 0.15 sin 330 t.
Write a sine function that can be used to model the initial behavior of a sound wave with the frequency and amplitude given.
10. f = 440, a = 0.3
SOLUTION: The general form of the equation is y = a sin bt, where t is the time in seconds. Because the
amplitude is 0.3, = 0.3. This means that a = ±0.3.
The period is the reciprocal of the frequency or
. Use this value to find b.
Using the positive values of a and b, one sine function that models the initial behavior is y = 0.3 sin
880 t.
11. f = 932, a = 0.25
SOLUTION: The general form of the equation is y = a sin bt, where t is the time in seconds. Because the
amplitude is 0.25, = 0.25. This means that a =
±0.25. The period is the reciprocal of the frequency
or . Use this value to find b.
Using the positive values of a and b, one sine function that models the initial behavior is y = 0.25
sin 1864 t.
12. f = 1245, a = 0.12
SOLUTION: The general form of the equation is y = a sin bt, where t is the time in seconds. Because the
amplitude is 0.12, = 0.12. This means that a =
±0.12. The period is the reciprocal of the frequency or
. Use this value to find b.
Using the positive values of a and b, one sine function that models the initial behavior is y = 0.12
sin 2490 t.
13. f = 623, a = 0.2
SOLUTION: The general form of the equation is y = a sin bt, where t is the time in seconds. Because the
amplitude is 0.2, = 0.2. This means that a = ±0.2.
The period is the reciprocal of the frequency or
. Use this value to find b.
Using the positive values of a and b, one sine function that models the initial behavior is y = 0.2 sin
1246 t.
State the amplitude, period, frequency, phase shift, and vertical shift of each function. Then graph two periods of the function.
14.
SOLUTION:
In this function, a = 3, b = 1, c = − , and d = 0.
Because d = 0, there is no vertical shift.
Graph y = 3 sin x shifted units to the right.
15.
SOLUTION:
In this function, a = 1, b = , c = , and d = 0.
Because d = 0, there is no vertical shift.
16. y = 0.25 cos x + 3
SOLUTION:
In this function, a = , b = 1, c = 0, and d = 3.
Graph y = cos x shifted 3 units up.
17. y = sin 3x – 2
SOLUTION: In this function, a = 1, b = 3, c = 0, and d = –2.
Graph y = sin 3x shifted 2 units down.
18.
SOLUTION:
In this function, a = 1, b = 1, c = , and d = –1.
.
Graph y = cos x shifted units to the right and 1
unit down.
19.
SOLUTION:
In this function, a = 1, b = 1, c = , and d = 4.
.
Graph y = sin x shifted units to the left and 4 units up.
20. VACATIONS The average number of reservations R that a vacation resort has at the beginning of each month is shown.
a. Write an equation of a sinusoidal function that models the average number of reservations using x =1 to represent January. b. According to your model, approximately how many reservations can the resort anticipate in November?
SOLUTION: a. Make a scatter plot of the data and choose a model.
Sample answer: Use a sinusoidal function of the form y = a cos (bx + c) + d to model the data. First, find the maximum M and minimum m values of the data, and use these values to find a, b, c, and d. The maximum and minimum reservations are 200 and 87, respectively. The amplitude a is half of the distance between these values.
The vertical shift d is the average of the maximum and minimum data values.
There are 3 months between the maximum and minimum, so the period is 6.
The maximum data value occurs when x = 1. Since y = cos x attains its first maximum when x = 0, we must apply a phase shift of 1 unit. Use this value to find c.
Write a function using the values for a, b, c, and d.
Use b =
b. To find the number of reservations in November, evaluate the model for x = 11.
Therefore, the resort can anticipate about 115 reservations in November.
21. TIDES The table shown below provides data for the first high and low tides of the day for a certain bay during one day in June.
a. Determine the amplitude, period, phase shift, and vertical shift of a sinusoidal function that models the height of the tide. Let x represent the number of hours that the high or low tide occurred after midnight. b. Write a sinusoidal function that models the data. c. According to your model, what was the height of
the tide at 8:45 P.M. that night?
SOLUTION: a. Sample answer: Use a sinusoidal function of the form y = a cos (bx + c) + d to model the data. First, find the amplitude a, which is half of the distance between the heights of the high and low tides.
The vertical shift d is the average of the heights of the high and low tides.
A sinusoid completes half of a period in the time thatit takes to go from its maximum to its minimum value. One period is twice this time. The first high tide occurs 6.5 hours before the first low tide, so the period is 13.
The maximum data value occurs when x ≈ 4.417. Since y = cos x attains its first maximum when x = 0,we must apply a phase shift of 4.417 units. Use this value to find c.
b. Write a function using the values for a, b, c, and
d. Use b =
c. To find the height of the water at 8:45 P.M. that
night, evaluate the model for x = 20.75.
Therefore, the tide was about 7.28 feet high at 8:45
P.M. that night.
22. METEOROLOGY The average monthly temperatures for Boston, Massachusetts are shown.
a. Determine the amplitude, period, phase shift, and vertical shift of a sinusoidal function that models the monthly temperatures using x = 1 to represent January. b. Write an equation of a sinusoidal function that models the monthly temperatures. c. According to your model, what is Boston’s average temperature in August?
SOLUTION: a. The maximum and minimum are 74° and 29°, respectively. The amplitude a is half of the distance between these values.
The vertical shift d is the average of the maximum and minimum data values.
A sinusoid completes half of a period in the time thatit takes to go from its maximum to its minimum value. So, one period is twice this time. The
maximum function value occurs in July, so xmax is 7.
The minimum function value occurs in January, so
xmin is 1. The period is 2(6) = 12.
The maximum data value occurs when x = 7. Since y = cos x attains its first maximum when x = 0, we must apply a phase shift of 7 units. Use this value to find c.
b. Using the values for a, b, c, and d from part a, a sinusoidal function that models that monthly temperatures in Boston is
c. To find the average monthly temperature for Boston in August, evaluate the model for x = 8.
Therefore, the average monthly temperature for Boston in August is about 71°F.
GRAPHING CALCULATOR Find the values of x in the interval – < x < that make each equation or inequality true. (Hint: Use the intersection function.)
23. –sin x = cos x
SOLUTION:
Graph y = −sin x and y = cos x on the same graphing
calculator screen on (−π, π). Use the intersect feature under the CALC menu to determine where the two graphs intersect.
The graphs intersect at about −0.7854 or − and
about 2.356 or . Therefore, on –π < x < π, –sin x
= cos x when x = − and .
24. sin x − cos x = 1
SOLUTION:
Graph y = sin x − cos x and y = 1 on the same
graphing calculator screen on (− , ). Use the intersect feature under the CALC menu to determine where the two graphs intersect.
The graphs intersect at about 1.57 or . Therefore,
on – < x < , sin x − cos x = 1 when x = .
25. sin x + cos x = 0
SOLUTION:
Graph y = sin x + cos x on (−π, π). Use the zero feature under the CALC menu to determine the zeros of the function.
There are zeros at about −0.785 or − or and about
2.356 or . Therefore, on – < x < , sin x + cos
x = 0 when
26. cos x ≤ sin x
SOLUTION:
Graph y = cos x and y = sin x on (−π, π). Use the intersect feature under the CALC menu to determine on what interval(s) cos x ≤ sin x.
The graphs intersect at about –2.356 or – and
about 0.785 or . From the graph, it appears that
cos x ≤ sin x on – < x < – and < x < .
27. sin x cos x > 1
SOLUTION:
Graph y = sin x cos x and y = 1 on (− , ). Use the intersect feature under the CALC menu to determine on what interval(s) sin x cos x > 1.
The graphs do not intersect. Therefore, y = sin x cos
x is not greater than y = 1 for any values of x on –< x < .
28. sin x cos x ≤ 0
SOLUTION:
Graph y = sin x cos x on (−π, π). Use the zero feature under the CALC menu to determine on what interval(s) sin x cos x ≤ 0.
The zeros of y = sin x cos x are about –1.57 or ,
0, and about 1.57 or . From the graph, it appears
that sin x cos x ≤ 0 on < x < 0 and < x < .
29. CAROUSELS A wooden horse on a carousel moves up and down as the carousel spins. When the ride ends, the horse usually stops in a vertical position different from where it started. The position y of the horse after t seconds can be modeled by y =1.5 sin (2t + c), where the phase shift c must be continuously adjusted to compensate for the differentstarting positions. If during one ride the horse
reached a maximum height after seconds, find
the equation that models the horse’s position.
SOLUTION: First, find the period of y = 1.5 sin (2t + c).
Since the period is π, the function will reach a
maximum height at radians. The phase shift is the
difference between the horizontal position of the
function at and radians, which is radians.
Substitute and b into the phase shift formula to
find c.
Therefore, the equation is
30. AMUSEMENT PARKS The position y in feet of a passenger cart relative to the center of a Ferris wheel over t seconds is shown below.
a. Find the time t that it takes for the cart to return toy = 0 during its initial spin. b. Find the period of the Ferris wheel. c. Sketch the graph representing the position of the passenger cart over one period. d. Write a sinusoidal function that models the position of the passenger cart as a function of time t.
SOLUTION: a. From the diagram, the height of the cart is 0 ft when t = 0, and reaches a maximum height of 19 feet when t = 3.75 seconds. So, the cart will return to y = 0 after 2(3.75) or 7.5 seconds. b. The cart completes half of a cycle from t = 0 to t = 7.5. So, the period is 2(7.5) or 15 seconds. c.
d. The amplitude a is half of the maximum and
minimum values. So, a =
The vertical shift d is the average of the maximum
and minimum data values. So,
Because the period of a sinusoidal function is
you can write Therefore,
There is no phase shift because the height of the cartwhen t = 0 is 0 feet, and the sine function has a y-intercept of 0. Therefore, one equation that could be used to model
the position of the passenger cart is y = 19 sin t.
Write an equation that corresponds to each graph.
31.
SOLUTION: Sample answer: There is an x-intercept at 0, so one equation that corresponds to this graph is y = a sin (bx + c) + d. Half of the distance from the maximum to the minimum value of the function is 3. So, the amplitudeis 3. It appears that the function completes one period on
[0, π]. Find b.
The midline appears to be at y = 0, so there does not appear to be any vertical shift. Therefore, one equation that corresponds to this graph is y = 3 sin (2x).
32.
SOLUTION:
Sample answer: Because there is a y-intercept at ,
one equation that corresponds to this graph is y = a cos (bx + c) + d. Half of the distance from the maximum to the
minimum value of the function is . So, the
amplitude is .
It appears that the function completes one period on [0, 6π]. Find b.
The midline appears to be at y = 0, so there does not appear to be any vertical shift. Therefore, one
equation that corresponds to this graph is y = cos
.
33.
SOLUTION: Sample answer: Because there is a y-intercept at 3, one equation that corresponds to this graph is y = a cos (bx + c) + d. Half of the distance from the maximum to the
minimum value of the function is 4 ÷ 2 or 2. So, the amplitude is 2. It appears that the function completes one period on
Find b.
The midline appears to be at y = 1, so there is a vertical shift 1 unit up. Therefore, one equation that corresponds to this graph is y = 2 cos 4x + 1.
34.
SOLUTION: Sample answer: There is an x-intercept at 0, so one equation that corresponds to this graph is y = a sin (bx + c) + d. Half of the distance from the maximum to the
minimum value of the function is 8 ÷ 2 or 4. So, the amplitude is 4. It appears that the function completes one period on [0, 4π]. Find b.
The midline appears to be at y = −2, so there is a vertical shift of 2 units down. Therefore, one equation that corresponds to this graph is y = 4 sin
− 2.
Write a sinusoidal function with the given period and amplitude that passes through the given point.
35. period: ; amplitude: 5; point:
SOLUTION: Use the period to find b.
Sample answer: One sinusoidal function in which a =5 and b = 2 is y = 5 cos 2x. Evaluate the function for
The function passes through . Therefore, a
sinusoidal function with period π and amplitude 5 that
passes through the point is y = 5 cos 2x.
36. period: 4 ; amplitude: 2; point: ( , 2)
SOLUTION: Use the period to find b.
Sample answer: One sinusoidal function in which a =
2 and b = is y = 2 sin . Evaluate the function
for x = π.
The function passes through ( , 2). Therefore, a
sinusoidal function with period 4π and amplitude 2
that passes through the point ( , 2) is y = 2 sin .
37. period: ; amplitude: ; point:
SOLUTION: Use the period to find b.
Sample answer: One sinusoidal function in which a =1.5 and b = 4 is y = 1.5 cos 4x. Evaluate the function
for
The function passes through . Therefore, a
sinusoidal function with period and amplitude 1.5
that passes through the point is y = 1.5 cos
4x.
38. period: 3π; amplitude: ; point:
SOLUTION: Use the period to find b.
Sample answer: One sinusoidal function in which a =
0.5 and b = is y = sin x. Evaluate the
function for
The function passes through . Therefore, a
sinusoidal function with period 3π and amplitude 0.5
that passes through the point is y = sin
x.
39. MULTIPLE REPRESENTATIONS In this problem, you will investigate the change in the graph of a sinusoidal function of the form y = sin x or y = cos x when multiplied by a polynomial function. a. GRAPHICAL Use a graphing calculator to sketch the graphs of y = 2x, y = –2x, and y = 2x cos x on the same coordinate plane, on the interval [–20, 20]. b. VERBAL Describe the behavior of the graph of y = 2x cos x in relation to the graphs of y = 2x and y = –2x. c. GRAPHICAL Use a graphing calculator to
sketch the graphs of y = x2, y = –x
2, and y = x
2 sin x
on the same coordinate plane, on the interval [–20, 20]. d. VERBAL Describe the behavior of the graph of
y = x2 sin x in relation to the graphs of y = x
2 and y
= –x2.
e. ANALYTICAL Make a conjecture as to the behavior of the graph of a sinusoidal function of the form y = sin x or y = cos x when multiplied by polynomial function of the form y = f (x).
SOLUTION: a.
b. The graph of y = 2x cos x oscillates between the graphs of y = 2x and y = –2x. c.
d. The graph of y = x2 sin x oscillates between the
graphs of y = x2 and y = –x
2.
e . The graph of y = f (x) sin x or y = f (x) cos x will oscillate between the graphs of y = f (x) and y = –f(x).
40. CHALLENGE Without graphing, find the exact coordinates of the first maximum point to the right of
the y-axis for
SOLUTION:
First, find the phase shift for
Next, find the period of the function.
The first maximum for one period can be found by
finding So, incorporating the phase shift, the
first maximum to the right of the y-axis is
. Because the amplitude is |4| = 4,
the maximum point is
REASONING Determine whether each statement is true or false . Explain your reasoning.
41. Every sine function of the form y = a sin (bx + c) + d can be written as a cosine function of the form y =a cos (bx + c) + d.
SOLUTION: It is true that every sine function of the form y = a sin (bx + c) + d can be written as a cosine function of the form y = a cos (bx + c) + d. The graph of cosine is a horizontal translation of the sine graph. Therefore, a cosine function can be written from any sine function using the same amplitude and period by applying the necessary phase shift.
For example, consider and
. Phase shift by
to obtain .
42. The period of f (x) = cos 8x is equal to four times the period of g(x) = cos 2x.
SOLUTION: Find the period of f (x) = cos 8x.
Find the period of g(x) = cos 2x.
Four times the period of g(x) = cos 2x is 4 ⋅ or
4 . So, the period of f (x) is the period of g(x).
Therefore, the statement is false.
43. CHALLENGE How many zeros does y = cos
1500x have on the interval 0 ≤ x ≤ 2 ?
SOLUTION: Find the period of y = cos 1500x.
Graph y = cos 1500x on .
The graph of y = cos 1500x has two x-intercepts for one cycle, so the function has 2 zeros per cycle. Find
the number of cycles for y = cos 1500x on [0, 2 ].
So, the graph of y = cos 1500x will complete 1500
cycles on [0, 2 ]. Because there are two zeros per cycle, y = cos 1500x will have 1500(2) or 3000 zeros
on [0, 2 ].
44. PROOF Prove the phase shift formula.
SOLUTION:
Consider y = a sin (bx + c), where a , b, and c ≠ 0. To find a zero of the function, find the value of x for which a sin (bx + c) = 0. Since sin 0 = 0, solving bx + c = 0 will yield a zero of the function.
Therefore, y = 0 when . The value of is
the phase shift. When c > 0: The graph of y = a sin (bx + c) is the
graph of y = a sin x, shifted units to the left.
When c < 0: The graph of y = a sin (bx + c) is the
graph of y = a sin x, shifted units to the right.
Consider the graph of y = cos x below in blue. In this equation a = 1, b = 1 and c = 0. One zero of y = cos x is . The green graph is shifted to the
left. Thus c is – . Then the shifted equation will be
.
45. Writing in Math The Power Tower ride in Sandusky, Ohio, is shown below. Along the side of each tower is a string of lights that send a continuouspulse of light up and down each tower at a constant rate. Explain why the distance d of this light from theground over time t cannot be represented by a sinusoidal function.
SOLUTION: Sample answer: Although the pulse of light can be represented as a function with a period, it is not a sinusoidal function because the distance the pulse of light is from the ground changes at a constant rate. As a result, the graph of this function would resemble the graph below.
The given point lies on the terminal side of an angle θ in standard position. Find the values of
the six trigonometric functions of θ. 46. (−4, 4)
SOLUTION: Use the values of x and y to find r.
Use x = –4, y = 4, and r = to write the six trigonometric ratios.
47. (8, −2)
SOLUTION: Use the values of x and y to find r.
Use x = 8, y = –2, and r = to write the six trigonometric ratios.
48. (−5, −9)
SOLUTION: Use the values of x and y to find r.
Use x = –5, y = – 9, and r = to write the six trigonometric ratios.
49. (4, 5)
SOLUTION: Use the values of x and y to find r.
Use x = 4, y = 5, and r = to write the six trigonometric ratios.
Write each degree measure in radians as a multiple of π and each radian measure in degrees.
50. 25°
SOLUTION: To convert a degree measure to radians, multiply by
51. −420°
SOLUTION: To convert a degree measure to radians, multiply by
52.
SOLUTION: To convert a radian measure to degrees, multiply by
53.
SOLUTION: To convert a radian measure to degrees, multiply by
54. SCIENCE Radiocarbon dating is a method of estimating the age of an organic material by calculating the amount of carbon-14 present in the material. The age of a material can be calculated
using A = t , where A is the age of the
object in years, t is the half-life of carbon-14 or 5700 years, and R is the ratio of the amount of carbon-14 in the sample to the amount of carbon-14 in living tissue. a. A sample of organic material contains 0.000076 gram of carbon-14. A living sample of the same
Describe how the graphs of f (x) and g (x) are related. Then find the amplitude of g (x), and sketch two periods of both functions on the same coordinate axes.
1. f (x) = sin x; g(x) = sin x
SOLUTION: The graph of g(x) is the graph of f (x) compressed
vertically. The amplitude of g(x) is or .
Create a table listing the coordinates of the x-intercepts and extrema for f (x) = sin x for one
period, 2 , on the interval [0, 2 ]. Then use the amplitude of g(x) to find corresponding points on its graph.
Sketch the curve through the indicated points for each function. Then repeat the pattern to complete asecond period.
Functions f (x) = sin x g(x) = sin x
x-int (0, 0) (0, 0)
Max
x-int
Min
x-int
2.
SOLUTION: The graph of g(x) is the graph of f (x) compressed
vertically. The amplitude of g(x) is or .
Create a table listing the coordinates of the x-intercepts and extrema for f (x) = cos x for one
period, 2 , on the interval [0, 2 ]. Then use the amplitude of g(x) to find corresponding points on its graph.
Sketch the curve through the indicated points for each function. Then repeat the pattern to complete asecond period.
Function f (x) = cos x
Max (0, 1)
x-int Min
x-in
Min
x-int
Function f (x) = cos x
Max x-int
Min
x-in
Min
x-int
3. f (x) = cos x; g(x) = 6 cos x
SOLUTION: The graph of g(x) is the graph of f (x) expanded
vertically. The amplitude of g(x) is or 6.
Create a table listing the coordinates of the x-intercepts and extrema for f (x) = cos x for one
period, 2 , on the interval [0, 2 ]. Then use the amplitude of g(x) to find corresponding points on its graph.
Sketch the curve through the indicated points for each function. Then repeat the pattern to complete asecond period.
Functions f (x) = cos x g(x) = 6 cos x
Max (0, 1) (0, 6)
x-int
Min
x-int
Max
4. f (x) = sin x; g(x) = −8 sin x
SOLUTION: The graph of g(x) is the graph of f (x) expanded
vertically. The amplitude of g(x) is or 8.
Create a table listing the coordinates of the x-intercepts and extrema for f (x) = sin x for one
period, 2 , on the interval [0, 2 ]. Then use the amplitude of g(x) to find corresponding points on its graph.
Sketch the curve through the indicated points for each function. Then repeat the pattern to complete asecond period.
Function f (x) = sin x
x-int (0, 0)
Max
x-int
Min
x-int
Function g(x) = −8
sin x
x-int (0, 0)
Min
x-int
Max
x-int
Describe how the graphs of f (x) and g (x) are related. Then find the period of g (x), and sketch at least one period of both functions on the same coordinate axes.
5. f (x) = sin x; g(x) = sin 4x
SOLUTION: The graph of g(x) is the graph of f (x) compressed
horizontally. The period of g(x) is . To find
corresponding points on the graph of g(x), change the x-coordinates of those key points on f (x) so that
they range from 0 to , increasing by increments of
.
Sketch the curve through the indicated points for each function. Then repeat the pattern to complete asecond period.
Functions f (x) = sin x g(x) = sin
4x
x-int (0, 0) (0, 0)
Max
x-int
Min
x-int
6. f (x) = cos x; g(x) = cos 2x
SOLUTION: The graph of g(x) is the graph of f (x) compressed
horizontally. The period of g(x) is or . To find
corresponding points on the graph of g(x), change the x-coordinates of those key points on f (x) so that
they range from 0 to , increasing by increments of
.
Sketch the curve through the indicated points for each function. Then repeat the pattern to complete asecond period.
Functions f (x) = cos x g(x) = cos 2x
Max (0, 1) (0, 1)
x-int
Min
x-int
Max
7. f (x) = cos x;
SOLUTION: The graph of g(x) is the graph of f (x) expanded
horizontally. The period of g(x) is . To
find corresponding points on the graph of g(x), change the x-coordinates of those key points on f (x)
so that they range from 0 to , increasing by
increments of or .
Sketch the curve through the indicated points for each function. Then repeat the pattern to complete asecond period.
Functions f (x) = cos x
Max (0, 1) (0, 1)
x-int
Min
x-int
Max
8. f (x) = sin x;
SOLUTION: The graph of g(x) is the graph of f (x) expanded
horizontally. The period of g(x) is . To find corresponding points on the graph of g(x), change the x-coordinates of those key points on f (x) so that they range from 0 to , increasing by increments of
or .
Sketch the curve through the indicated points for each function. Then repeat the pattern to complete asecond period.
Functions f (x) = sin x
x-int (0, 0) (0, 0)
Max
x-int
Min
x-int
9. VOICES The contralto vocal type includes the deepest female singing voice. Some contraltos can sing as low as the E below middle C (E3), which hasa frequency of 165 hertz. Write an equation for a sine function that models the initial behavior of the sound wave associated with E3 having an amplitude of 0.15.
SOLUTION: The general form of the equation will be y = a sin bt,where t is the time in seconds. Because the
amplitude is 0.15, |a|= 0.15. This means that a = ±0.15. The period is the reciprocal of the frequency or
. Use this value to find b.
Sample answer: One sine function that models the
initial behavior is y = 0.15 sin 330 t.
Write a sine function that can be used to model the initial behavior of a sound wave with the frequency and amplitude given.
10. f = 440, a = 0.3
SOLUTION: The general form of the equation is y = a sin bt, where t is the time in seconds. Because the
amplitude is 0.3, = 0.3. This means that a = ±0.3.
The period is the reciprocal of the frequency or
. Use this value to find b.
Using the positive values of a and b, one sine function that models the initial behavior is y = 0.3 sin
880 t.
11. f = 932, a = 0.25
SOLUTION: The general form of the equation is y = a sin bt, where t is the time in seconds. Because the
amplitude is 0.25, = 0.25. This means that a =
±0.25. The period is the reciprocal of the frequency
or . Use this value to find b.
Using the positive values of a and b, one sine function that models the initial behavior is y = 0.25
sin 1864 t.
12. f = 1245, a = 0.12
SOLUTION: The general form of the equation is y = a sin bt, where t is the time in seconds. Because the
amplitude is 0.12, = 0.12. This means that a =
±0.12. The period is the reciprocal of the frequency or
. Use this value to find b.
Using the positive values of a and b, one sine function that models the initial behavior is y = 0.12
sin 2490 t.
13. f = 623, a = 0.2
SOLUTION: The general form of the equation is y = a sin bt, where t is the time in seconds. Because the
amplitude is 0.2, = 0.2. This means that a = ±0.2.
The period is the reciprocal of the frequency or
. Use this value to find b.
Using the positive values of a and b, one sine function that models the initial behavior is y = 0.2 sin
1246 t.
State the amplitude, period, frequency, phase shift, and vertical shift of each function. Then graph two periods of the function.
14.
SOLUTION:
In this function, a = 3, b = 1, c = − , and d = 0.
Because d = 0, there is no vertical shift.
Graph y = 3 sin x shifted units to the right.
15.
SOLUTION:
In this function, a = 1, b = , c = , and d = 0.
Because d = 0, there is no vertical shift.
16. y = 0.25 cos x + 3
SOLUTION:
In this function, a = , b = 1, c = 0, and d = 3.
Graph y = cos x shifted 3 units up.
17. y = sin 3x – 2
SOLUTION: In this function, a = 1, b = 3, c = 0, and d = –2.
Graph y = sin 3x shifted 2 units down.
18.
SOLUTION:
In this function, a = 1, b = 1, c = , and d = –1.
.
Graph y = cos x shifted units to the right and 1
unit down.
19.
SOLUTION:
In this function, a = 1, b = 1, c = , and d = 4.
.
Graph y = sin x shifted units to the left and 4 units up.
20. VACATIONS The average number of reservations R that a vacation resort has at the beginning of each month is shown.
a. Write an equation of a sinusoidal function that models the average number of reservations using x =1 to represent January. b. According to your model, approximately how many reservations can the resort anticipate in November?
SOLUTION: a. Make a scatter plot of the data and choose a model.
Sample answer: Use a sinusoidal function of the form y = a cos (bx + c) + d to model the data. First, find the maximum M and minimum m values of the data, and use these values to find a, b, c, and d. The maximum and minimum reservations are 200 and 87, respectively. The amplitude a is half of the distance between these values.
The vertical shift d is the average of the maximum and minimum data values.
There are 3 months between the maximum and minimum, so the period is 6.
The maximum data value occurs when x = 1. Since y = cos x attains its first maximum when x = 0, we must apply a phase shift of 1 unit. Use this value to find c.
Write a function using the values for a, b, c, and d.
Use b =
b. To find the number of reservations in November, evaluate the model for x = 11.
Therefore, the resort can anticipate about 115 reservations in November.
21. TIDES The table shown below provides data for the first high and low tides of the day for a certain bay during one day in June.
a. Determine the amplitude, period, phase shift, and vertical shift of a sinusoidal function that models the height of the tide. Let x represent the number of hours that the high or low tide occurred after midnight. b. Write a sinusoidal function that models the data. c. According to your model, what was the height of
the tide at 8:45 P.M. that night?
SOLUTION: a. Sample answer: Use a sinusoidal function of the form y = a cos (bx + c) + d to model the data. First, find the amplitude a, which is half of the distance between the heights of the high and low tides.
The vertical shift d is the average of the heights of the high and low tides.
A sinusoid completes half of a period in the time thatit takes to go from its maximum to its minimum value. One period is twice this time. The first high tide occurs 6.5 hours before the first low tide, so the period is 13.
The maximum data value occurs when x ≈ 4.417. Since y = cos x attains its first maximum when x = 0,we must apply a phase shift of 4.417 units. Use this value to find c.
b. Write a function using the values for a, b, c, and
d. Use b =
c. To find the height of the water at 8:45 P.M. that
night, evaluate the model for x = 20.75.
Therefore, the tide was about 7.28 feet high at 8:45
P.M. that night.
22. METEOROLOGY The average monthly temperatures for Boston, Massachusetts are shown.
a. Determine the amplitude, period, phase shift, and vertical shift of a sinusoidal function that models the monthly temperatures using x = 1 to represent January. b. Write an equation of a sinusoidal function that models the monthly temperatures. c. According to your model, what is Boston’s average temperature in August?
SOLUTION: a. The maximum and minimum are 74° and 29°, respectively. The amplitude a is half of the distance between these values.
The vertical shift d is the average of the maximum and minimum data values.
A sinusoid completes half of a period in the time thatit takes to go from its maximum to its minimum value. So, one period is twice this time. The
maximum function value occurs in July, so xmax is 7.
The minimum function value occurs in January, so
xmin is 1. The period is 2(6) = 12.
The maximum data value occurs when x = 7. Since y = cos x attains its first maximum when x = 0, we must apply a phase shift of 7 units. Use this value to find c.
b. Using the values for a, b, c, and d from part a, a sinusoidal function that models that monthly temperatures in Boston is
c. To find the average monthly temperature for Boston in August, evaluate the model for x = 8.
Therefore, the average monthly temperature for Boston in August is about 71°F.
GRAPHING CALCULATOR Find the values of x in the interval – < x < that make each equation or inequality true. (Hint: Use the intersection function.)
23. –sin x = cos x
SOLUTION:
Graph y = −sin x and y = cos x on the same graphing
calculator screen on (−π, π). Use the intersect feature under the CALC menu to determine where the two graphs intersect.
The graphs intersect at about −0.7854 or − and
about 2.356 or . Therefore, on –π < x < π, –sin x
= cos x when x = − and .
24. sin x − cos x = 1
SOLUTION:
Graph y = sin x − cos x and y = 1 on the same
graphing calculator screen on (− , ). Use the intersect feature under the CALC menu to determine where the two graphs intersect.
The graphs intersect at about 1.57 or . Therefore,
on – < x < , sin x − cos x = 1 when x = .
25. sin x + cos x = 0
SOLUTION:
Graph y = sin x + cos x on (−π, π). Use the zero feature under the CALC menu to determine the zeros of the function.
There are zeros at about −0.785 or − or and about
2.356 or . Therefore, on – < x < , sin x + cos
x = 0 when
26. cos x ≤ sin x
SOLUTION:
Graph y = cos x and y = sin x on (−π, π). Use the intersect feature under the CALC menu to determine on what interval(s) cos x ≤ sin x.
The graphs intersect at about –2.356 or – and
about 0.785 or . From the graph, it appears that
cos x ≤ sin x on – < x < – and < x < .
27. sin x cos x > 1
SOLUTION:
Graph y = sin x cos x and y = 1 on (− , ). Use the intersect feature under the CALC menu to determine on what interval(s) sin x cos x > 1.
The graphs do not intersect. Therefore, y = sin x cos
x is not greater than y = 1 for any values of x on –< x < .
28. sin x cos x ≤ 0
SOLUTION:
Graph y = sin x cos x on (−π, π). Use the zero feature under the CALC menu to determine on what interval(s) sin x cos x ≤ 0.
The zeros of y = sin x cos x are about –1.57 or ,
0, and about 1.57 or . From the graph, it appears
that sin x cos x ≤ 0 on < x < 0 and < x < .
29. CAROUSELS A wooden horse on a carousel moves up and down as the carousel spins. When the ride ends, the horse usually stops in a vertical position different from where it started. The position y of the horse after t seconds can be modeled by y =1.5 sin (2t + c), where the phase shift c must be continuously adjusted to compensate for the differentstarting positions. If during one ride the horse
reached a maximum height after seconds, find
the equation that models the horse’s position.
SOLUTION: First, find the period of y = 1.5 sin (2t + c).
Since the period is π, the function will reach a
maximum height at radians. The phase shift is the
difference between the horizontal position of the
function at and radians, which is radians.
Substitute and b into the phase shift formula to
find c.
Therefore, the equation is
30. AMUSEMENT PARKS The position y in feet of a passenger cart relative to the center of a Ferris wheel over t seconds is shown below.
a. Find the time t that it takes for the cart to return toy = 0 during its initial spin. b. Find the period of the Ferris wheel. c. Sketch the graph representing the position of the passenger cart over one period. d. Write a sinusoidal function that models the position of the passenger cart as a function of time t.
SOLUTION: a. From the diagram, the height of the cart is 0 ft when t = 0, and reaches a maximum height of 19 feet when t = 3.75 seconds. So, the cart will return to y = 0 after 2(3.75) or 7.5 seconds. b. The cart completes half of a cycle from t = 0 to t = 7.5. So, the period is 2(7.5) or 15 seconds. c.
d. The amplitude a is half of the maximum and
minimum values. So, a =
The vertical shift d is the average of the maximum
and minimum data values. So,
Because the period of a sinusoidal function is
you can write Therefore,
There is no phase shift because the height of the cartwhen t = 0 is 0 feet, and the sine function has a y-intercept of 0. Therefore, one equation that could be used to model
the position of the passenger cart is y = 19 sin t.
Write an equation that corresponds to each graph.
31.
SOLUTION: Sample answer: There is an x-intercept at 0, so one equation that corresponds to this graph is y = a sin (bx + c) + d. Half of the distance from the maximum to the minimum value of the function is 3. So, the amplitudeis 3. It appears that the function completes one period on
[0, π]. Find b.
The midline appears to be at y = 0, so there does not appear to be any vertical shift. Therefore, one equation that corresponds to this graph is y = 3 sin (2x).
32.
SOLUTION:
Sample answer: Because there is a y-intercept at ,
one equation that corresponds to this graph is y = a cos (bx + c) + d. Half of the distance from the maximum to the
minimum value of the function is . So, the
amplitude is .
It appears that the function completes one period on [0, 6π]. Find b.
The midline appears to be at y = 0, so there does not appear to be any vertical shift. Therefore, one
equation that corresponds to this graph is y = cos
.
33.
SOLUTION: Sample answer: Because there is a y-intercept at 3, one equation that corresponds to this graph is y = a cos (bx + c) + d. Half of the distance from the maximum to the
minimum value of the function is 4 ÷ 2 or 2. So, the amplitude is 2. It appears that the function completes one period on
Find b.
The midline appears to be at y = 1, so there is a vertical shift 1 unit up. Therefore, one equation that corresponds to this graph is y = 2 cos 4x + 1.
34.
SOLUTION: Sample answer: There is an x-intercept at 0, so one equation that corresponds to this graph is y = a sin (bx + c) + d. Half of the distance from the maximum to the
minimum value of the function is 8 ÷ 2 or 4. So, the amplitude is 4. It appears that the function completes one period on [0, 4π]. Find b.
The midline appears to be at y = −2, so there is a vertical shift of 2 units down. Therefore, one equation that corresponds to this graph is y = 4 sin
− 2.
Write a sinusoidal function with the given period and amplitude that passes through the given point.
35. period: ; amplitude: 5; point:
SOLUTION: Use the period to find b.
Sample answer: One sinusoidal function in which a =5 and b = 2 is y = 5 cos 2x. Evaluate the function for
The function passes through . Therefore, a
sinusoidal function with period π and amplitude 5 that
passes through the point is y = 5 cos 2x.
36. period: 4 ; amplitude: 2; point: ( , 2)
SOLUTION: Use the period to find b.
Sample answer: One sinusoidal function in which a =
2 and b = is y = 2 sin . Evaluate the function
for x = π.
The function passes through ( , 2). Therefore, a
sinusoidal function with period 4π and amplitude 2
that passes through the point ( , 2) is y = 2 sin .
37. period: ; amplitude: ; point:
SOLUTION: Use the period to find b.
Sample answer: One sinusoidal function in which a =1.5 and b = 4 is y = 1.5 cos 4x. Evaluate the function
for
The function passes through . Therefore, a
sinusoidal function with period and amplitude 1.5
that passes through the point is y = 1.5 cos
4x.
38. period: 3π; amplitude: ; point:
SOLUTION: Use the period to find b.
Sample answer: One sinusoidal function in which a =
0.5 and b = is y = sin x. Evaluate the
function for
The function passes through . Therefore, a
sinusoidal function with period 3π and amplitude 0.5
that passes through the point is y = sin
x.
39. MULTIPLE REPRESENTATIONS In this problem, you will investigate the change in the graph of a sinusoidal function of the form y = sin x or y = cos x when multiplied by a polynomial function. a. GRAPHICAL Use a graphing calculator to sketch the graphs of y = 2x, y = –2x, and y = 2x cos x on the same coordinate plane, on the interval [–20, 20]. b. VERBAL Describe the behavior of the graph of y = 2x cos x in relation to the graphs of y = 2x and y = –2x. c. GRAPHICAL Use a graphing calculator to
sketch the graphs of y = x2, y = –x
2, and y = x
2 sin x
on the same coordinate plane, on the interval [–20, 20]. d. VERBAL Describe the behavior of the graph of
y = x2 sin x in relation to the graphs of y = x
2 and y
= –x2.
e. ANALYTICAL Make a conjecture as to the behavior of the graph of a sinusoidal function of the form y = sin x or y = cos x when multiplied by polynomial function of the form y = f (x).
SOLUTION: a.
b. The graph of y = 2x cos x oscillates between the graphs of y = 2x and y = –2x. c.
d. The graph of y = x2 sin x oscillates between the
graphs of y = x2 and y = –x
2.
e . The graph of y = f (x) sin x or y = f (x) cos x will oscillate between the graphs of y = f (x) and y = –f(x).
40. CHALLENGE Without graphing, find the exact coordinates of the first maximum point to the right of
the y-axis for
SOLUTION:
First, find the phase shift for
Next, find the period of the function.
The first maximum for one period can be found by
finding So, incorporating the phase shift, the
first maximum to the right of the y-axis is
. Because the amplitude is |4| = 4,
the maximum point is
REASONING Determine whether each statement is true or false . Explain your reasoning.
41. Every sine function of the form y = a sin (bx + c) + d can be written as a cosine function of the form y =a cos (bx + c) + d.
SOLUTION: It is true that every sine function of the form y = a sin (bx + c) + d can be written as a cosine function of the form y = a cos (bx + c) + d. The graph of cosine is a horizontal translation of the sine graph. Therefore, a cosine function can be written from any sine function using the same amplitude and period by applying the necessary phase shift.
For example, consider and
. Phase shift by
to obtain .
42. The period of f (x) = cos 8x is equal to four times the period of g(x) = cos 2x.
SOLUTION: Find the period of f (x) = cos 8x.
Find the period of g(x) = cos 2x.
Four times the period of g(x) = cos 2x is 4 ⋅ or
4 . So, the period of f (x) is the period of g(x).
Therefore, the statement is false.
43. CHALLENGE How many zeros does y = cos
1500x have on the interval 0 ≤ x ≤ 2 ?
SOLUTION: Find the period of y = cos 1500x.
Graph y = cos 1500x on .
The graph of y = cos 1500x has two x-intercepts for one cycle, so the function has 2 zeros per cycle. Find
the number of cycles for y = cos 1500x on [0, 2 ].
So, the graph of y = cos 1500x will complete 1500
cycles on [0, 2 ]. Because there are two zeros per cycle, y = cos 1500x will have 1500(2) or 3000 zeros
on [0, 2 ].
44. PROOF Prove the phase shift formula.
SOLUTION:
Consider y = a sin (bx + c), where a , b, and c ≠ 0. To find a zero of the function, find the value of x for which a sin (bx + c) = 0. Since sin 0 = 0, solving bx + c = 0 will yield a zero of the function.
Therefore, y = 0 when . The value of is
the phase shift. When c > 0: The graph of y = a sin (bx + c) is the
graph of y = a sin x, shifted units to the left.
When c < 0: The graph of y = a sin (bx + c) is the
graph of y = a sin x, shifted units to the right.
Consider the graph of y = cos x below in blue. In this equation a = 1, b = 1 and c = 0. One zero of y = cos x is . The green graph is shifted to the
left. Thus c is – . Then the shifted equation will be
.
45. Writing in Math The Power Tower ride in Sandusky, Ohio, is shown below. Along the side of each tower is a string of lights that send a continuouspulse of light up and down each tower at a constant rate. Explain why the distance d of this light from theground over time t cannot be represented by a sinusoidal function.
SOLUTION: Sample answer: Although the pulse of light can be represented as a function with a period, it is not a sinusoidal function because the distance the pulse of light is from the ground changes at a constant rate. As a result, the graph of this function would resemble the graph below.
The given point lies on the terminal side of an angle θ in standard position. Find the values of
the six trigonometric functions of θ. 46. (−4, 4)
SOLUTION: Use the values of x and y to find r.
Use x = –4, y = 4, and r = to write the six trigonometric ratios.
47. (8, −2)
SOLUTION: Use the values of x and y to find r.
Use x = 8, y = –2, and r = to write the six trigonometric ratios.
48. (−5, −9)
SOLUTION: Use the values of x and y to find r.
Use x = –5, y = – 9, and r = to write the six trigonometric ratios.
49. (4, 5)
SOLUTION: Use the values of x and y to find r.
Use x = 4, y = 5, and r = to write the six trigonometric ratios.
Write each degree measure in radians as a multiple of π and each radian measure in degrees.
50. 25°
SOLUTION: To convert a degree measure to radians, multiply by
51. −420°
SOLUTION: To convert a degree measure to radians, multiply by
52.
SOLUTION: To convert a radian measure to degrees, multiply by
53.
SOLUTION: To convert a radian measure to degrees, multiply by
54. SCIENCE Radiocarbon dating is a method of estimating the age of an organic material by calculating the amount of carbon-14 present in the material. The age of a material can be calculated
using A = t , where A is the age of the
object in years, t is the half-life of carbon-14 or 5700 years, and R is the ratio of the amount of carbon-14 in the sample to the amount of carbon-14 in living tissue. a. A sample of organic material contains 0.000076 gram of carbon-14. A living sample of the same
eSolutions Manual - Powered by Cognero Page 6
4-4 Graphing Sine and Cosine Functions
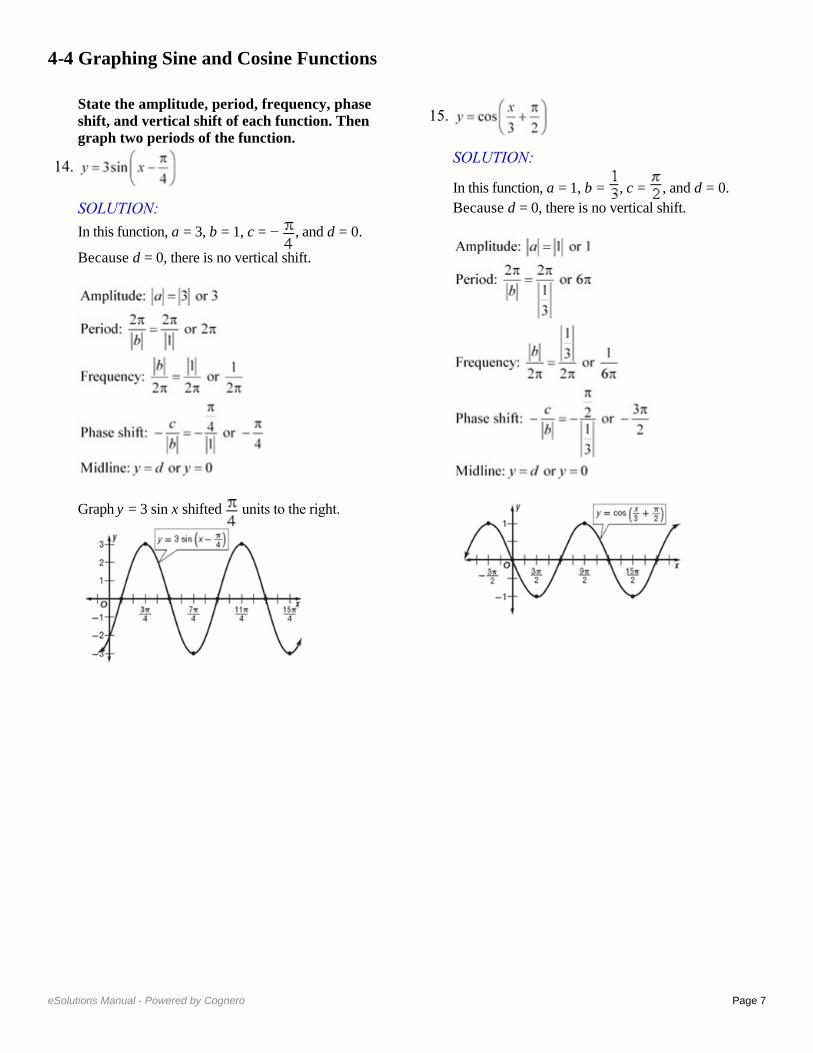
Describe how the graphs of f (x) and g (x) are related. Then find the amplitude of g (x), and sketch two periods of both functions on the same coordinate axes.
1. f (x) = sin x; g(x) = sin x
SOLUTION: The graph of g(x) is the graph of f (x) compressed
vertically. The amplitude of g(x) is or .
Create a table listing the coordinates of the x-intercepts and extrema for f (x) = sin x for one
period, 2 , on the interval [0, 2 ]. Then use the amplitude of g(x) to find corresponding points on its graph.
Sketch the curve through the indicated points for each function. Then repeat the pattern to complete asecond period.
Functions f (x) = sin x g(x) = sin x
x-int (0, 0) (0, 0)
Max
x-int
Min
x-int
2.
SOLUTION: The graph of g(x) is the graph of f (x) compressed
vertically. The amplitude of g(x) is or .
Create a table listing the coordinates of the x-intercepts and extrema for f (x) = cos x for one
period, 2 , on the interval [0, 2 ]. Then use the amplitude of g(x) to find corresponding points on its graph.
Sketch the curve through the indicated points for each function. Then repeat the pattern to complete asecond period.
Function f (x) = cos x
Max (0, 1)
x-int Min
x-in
Min
x-int
Function f (x) = cos x
Max x-int
Min
x-in
Min
x-int
3. f (x) = cos x; g(x) = 6 cos x
SOLUTION: The graph of g(x) is the graph of f (x) expanded
vertically. The amplitude of g(x) is or 6.
Create a table listing the coordinates of the x-intercepts and extrema for f (x) = cos x for one
period, 2 , on the interval [0, 2 ]. Then use the amplitude of g(x) to find corresponding points on its graph.
Sketch the curve through the indicated points for each function. Then repeat the pattern to complete asecond period.
Functions f (x) = cos x g(x) = 6 cos x
Max (0, 1) (0, 6)
x-int
Min
x-int
Max
4. f (x) = sin x; g(x) = −8 sin x
SOLUTION: The graph of g(x) is the graph of f (x) expanded
vertically. The amplitude of g(x) is or 8.
Create a table listing the coordinates of the x-intercepts and extrema for f (x) = sin x for one
period, 2 , on the interval [0, 2 ]. Then use the amplitude of g(x) to find corresponding points on its graph.
Sketch the curve through the indicated points for each function. Then repeat the pattern to complete asecond period.
Function f (x) = sin x
x-int (0, 0)
Max
x-int
Min
x-int
Function g(x) = −8
sin x
x-int (0, 0)
Min
x-int
Max
x-int
Describe how the graphs of f (x) and g (x) are related. Then find the period of g (x), and sketch at least one period of both functions on the same coordinate axes.
5. f (x) = sin x; g(x) = sin 4x
SOLUTION: The graph of g(x) is the graph of f (x) compressed
horizontally. The period of g(x) is . To find
corresponding points on the graph of g(x), change the x-coordinates of those key points on f (x) so that
they range from 0 to , increasing by increments of
.
Sketch the curve through the indicated points for each function. Then repeat the pattern to complete asecond period.
Functions f (x) = sin x g(x) = sin
4x
x-int (0, 0) (0, 0)
Max
x-int
Min
x-int
6. f (x) = cos x; g(x) = cos 2x
SOLUTION: The graph of g(x) is the graph of f (x) compressed
horizontally. The period of g(x) is or . To find
corresponding points on the graph of g(x), change the x-coordinates of those key points on f (x) so that
they range from 0 to , increasing by increments of
.
Sketch the curve through the indicated points for each function. Then repeat the pattern to complete asecond period.
Functions f (x) = cos x g(x) = cos 2x
Max (0, 1) (0, 1)
x-int
Min
x-int
Max
7. f (x) = cos x;
SOLUTION: The graph of g(x) is the graph of f (x) expanded
horizontally. The period of g(x) is . To
find corresponding points on the graph of g(x), change the x-coordinates of those key points on f (x)
so that they range from 0 to , increasing by
increments of or .
Sketch the curve through the indicated points for each function. Then repeat the pattern to complete asecond period.
Functions f (x) = cos x
Max (0, 1) (0, 1)
x-int
Min
x-int
Max
8. f (x) = sin x;
SOLUTION: The graph of g(x) is the graph of f (x) expanded
horizontally. The period of g(x) is . To find corresponding points on the graph of g(x), change the x-coordinates of those key points on f (x) so that they range from 0 to , increasing by increments of
or .
Sketch the curve through the indicated points for each function. Then repeat the pattern to complete asecond period.
Functions f (x) = sin x
x-int (0, 0) (0, 0)
Max
x-int
Min
x-int
9. VOICES The contralto vocal type includes the deepest female singing voice. Some contraltos can sing as low as the E below middle C (E3), which hasa frequency of 165 hertz. Write an equation for a sine function that models the initial behavior of the sound wave associated with E3 having an amplitude of 0.15.
SOLUTION: The general form of the equation will be y = a sin bt,where t is the time in seconds. Because the
amplitude is 0.15, |a|= 0.15. This means that a = ±0.15. The period is the reciprocal of the frequency or
. Use this value to find b.
Sample answer: One sine function that models the
initial behavior is y = 0.15 sin 330 t.
Write a sine function that can be used to model the initial behavior of a sound wave with the frequency and amplitude given.
10. f = 440, a = 0.3
SOLUTION: The general form of the equation is y = a sin bt, where t is the time in seconds. Because the
amplitude is 0.3, = 0.3. This means that a = ±0.3.
The period is the reciprocal of the frequency or
. Use this value to find b.
Using the positive values of a and b, one sine function that models the initial behavior is y = 0.3 sin
880 t.
11. f = 932, a = 0.25
SOLUTION: The general form of the equation is y = a sin bt, where t is the time in seconds. Because the
amplitude is 0.25, = 0.25. This means that a =
±0.25. The period is the reciprocal of the frequency
or . Use this value to find b.
Using the positive values of a and b, one sine function that models the initial behavior is y = 0.25
sin 1864 t.
12. f = 1245, a = 0.12
SOLUTION: The general form of the equation is y = a sin bt, where t is the time in seconds. Because the
amplitude is 0.12, = 0.12. This means that a =
±0.12. The period is the reciprocal of the frequency or
. Use this value to find b.
Using the positive values of a and b, one sine function that models the initial behavior is y = 0.12
sin 2490 t.
13. f = 623, a = 0.2
SOLUTION: The general form of the equation is y = a sin bt, where t is the time in seconds. Because the
amplitude is 0.2, = 0.2. This means that a = ±0.2.
The period is the reciprocal of the frequency or
. Use this value to find b.
Using the positive values of a and b, one sine function that models the initial behavior is y = 0.2 sin
1246 t.
State the amplitude, period, frequency, phase shift, and vertical shift of each function. Then graph two periods of the function.
14.
SOLUTION:
In this function, a = 3, b = 1, c = − , and d = 0.
Because d = 0, there is no vertical shift.
Graph y = 3 sin x shifted units to the right.
15.
SOLUTION:
In this function, a = 1, b = , c = , and d = 0.
Because d = 0, there is no vertical shift.
16. y = 0.25 cos x + 3
SOLUTION:
In this function, a = , b = 1, c = 0, and d = 3.
Graph y = cos x shifted 3 units up.
17. y = sin 3x – 2
SOLUTION: In this function, a = 1, b = 3, c = 0, and d = –2.
Graph y = sin 3x shifted 2 units down.
18.
SOLUTION:
In this function, a = 1, b = 1, c = , and d = –1.
.
Graph y = cos x shifted units to the right and 1
unit down.
19.
SOLUTION:
In this function, a = 1, b = 1, c = , and d = 4.
.
Graph y = sin x shifted units to the left and 4 units up.
20. VACATIONS The average number of reservations R that a vacation resort has at the beginning of each month is shown.
a. Write an equation of a sinusoidal function that models the average number of reservations using x =1 to represent January. b. According to your model, approximately how many reservations can the resort anticipate in November?
SOLUTION: a. Make a scatter plot of the data and choose a model.
Sample answer: Use a sinusoidal function of the form y = a cos (bx + c) + d to model the data. First, find the maximum M and minimum m values of the data, and use these values to find a, b, c, and d. The maximum and minimum reservations are 200 and 87, respectively. The amplitude a is half of the distance between these values.
The vertical shift d is the average of the maximum and minimum data values.
There are 3 months between the maximum and minimum, so the period is 6.
The maximum data value occurs when x = 1. Since y = cos x attains its first maximum when x = 0, we must apply a phase shift of 1 unit. Use this value to find c.
Write a function using the values for a, b, c, and d.
Use b =
b. To find the number of reservations in November, evaluate the model for x = 11.
Therefore, the resort can anticipate about 115 reservations in November.
21. TIDES The table shown below provides data for the first high and low tides of the day for a certain bay during one day in June.
a. Determine the amplitude, period, phase shift, and vertical shift of a sinusoidal function that models the height of the tide. Let x represent the number of hours that the high or low tide occurred after midnight. b. Write a sinusoidal function that models the data. c. According to your model, what was the height of
the tide at 8:45 P.M. that night?
SOLUTION: a. Sample answer: Use a sinusoidal function of the form y = a cos (bx + c) + d to model the data. First, find the amplitude a, which is half of the distance between the heights of the high and low tides.
The vertical shift d is the average of the heights of the high and low tides.
A sinusoid completes half of a period in the time thatit takes to go from its maximum to its minimum value. One period is twice this time. The first high tide occurs 6.5 hours before the first low tide, so the period is 13.
The maximum data value occurs when x ≈ 4.417. Since y = cos x attains its first maximum when x = 0,we must apply a phase shift of 4.417 units. Use this value to find c.
b. Write a function using the values for a, b, c, and
d. Use b =
c. To find the height of the water at 8:45 P.M. that
night, evaluate the model for x = 20.75.
Therefore, the tide was about 7.28 feet high at 8:45
P.M. that night.
22. METEOROLOGY The average monthly temperatures for Boston, Massachusetts are shown.
a. Determine the amplitude, period, phase shift, and vertical shift of a sinusoidal function that models the monthly temperatures using x = 1 to represent January. b. Write an equation of a sinusoidal function that models the monthly temperatures. c. According to your model, what is Boston’s average temperature in August?
SOLUTION: a. The maximum and minimum are 74° and 29°, respectively. The amplitude a is half of the distance between these values.
The vertical shift d is the average of the maximum and minimum data values.
A sinusoid completes half of a period in the time thatit takes to go from its maximum to its minimum value. So, one period is twice this time. The
maximum function value occurs in July, so xmax is 7.
The minimum function value occurs in January, so
xmin is 1. The period is 2(6) = 12.
The maximum data value occurs when x = 7. Since y = cos x attains its first maximum when x = 0, we must apply a phase shift of 7 units. Use this value to find c.
b. Using the values for a, b, c, and d from part a, a sinusoidal function that models that monthly temperatures in Boston is
c. To find the average monthly temperature for Boston in August, evaluate the model for x = 8.
Therefore, the average monthly temperature for Boston in August is about 71°F.
GRAPHING CALCULATOR Find the values of x in the interval – < x < that make each equation or inequality true. (Hint: Use the intersection function.)
23. –sin x = cos x
SOLUTION:
Graph y = −sin x and y = cos x on the same graphing
calculator screen on (−π, π). Use the intersect feature under the CALC menu to determine where the two graphs intersect.
The graphs intersect at about −0.7854 or − and
about 2.356 or . Therefore, on –π < x < π, –sin x
= cos x when x = − and .
24. sin x − cos x = 1
SOLUTION:
Graph y = sin x − cos x and y = 1 on the same
graphing calculator screen on (− , ). Use the intersect feature under the CALC menu to determine where the two graphs intersect.
The graphs intersect at about 1.57 or . Therefore,
on – < x < , sin x − cos x = 1 when x = .
25. sin x + cos x = 0
SOLUTION:
Graph y = sin x + cos x on (−π, π). Use the zero feature under the CALC menu to determine the zeros of the function.
There are zeros at about −0.785 or − or and about
2.356 or . Therefore, on – < x < , sin x + cos
x = 0 when
26. cos x ≤ sin x
SOLUTION:
Graph y = cos x and y = sin x on (−π, π). Use the intersect feature under the CALC menu to determine on what interval(s) cos x ≤ sin x.
The graphs intersect at about –2.356 or – and
about 0.785 or . From the graph, it appears that
cos x ≤ sin x on – < x < – and < x < .
27. sin x cos x > 1
SOLUTION:
Graph y = sin x cos x and y = 1 on (− , ). Use the intersect feature under the CALC menu to determine on what interval(s) sin x cos x > 1.
The graphs do not intersect. Therefore, y = sin x cos
x is not greater than y = 1 for any values of x on –< x < .
28. sin x cos x ≤ 0
SOLUTION:
Graph y = sin x cos x on (−π, π). Use the zero feature under the CALC menu to determine on what interval(s) sin x cos x ≤ 0.
The zeros of y = sin x cos x are about –1.57 or ,
0, and about 1.57 or . From the graph, it appears
that sin x cos x ≤ 0 on < x < 0 and < x < .
29. CAROUSELS A wooden horse on a carousel moves up and down as the carousel spins. When the ride ends, the horse usually stops in a vertical position different from where it started. The position y of the horse after t seconds can be modeled by y =1.5 sin (2t + c), where the phase shift c must be continuously adjusted to compensate for the differentstarting positions. If during one ride the horse
reached a maximum height after seconds, find
the equation that models the horse’s position.
SOLUTION: First, find the period of y = 1.5 sin (2t + c).
Since the period is π, the function will reach a
maximum height at radians. The phase shift is the
difference between the horizontal position of the
function at and radians, which is radians.
Substitute and b into the phase shift formula to
find c.
Therefore, the equation is
30. AMUSEMENT PARKS The position y in feet of a passenger cart relative to the center of a Ferris wheel over t seconds is shown below.
a. Find the time t that it takes for the cart to return toy = 0 during its initial spin. b. Find the period of the Ferris wheel. c. Sketch the graph representing the position of the passenger cart over one period. d. Write a sinusoidal function that models the position of the passenger cart as a function of time t.
SOLUTION: a. From the diagram, the height of the cart is 0 ft when t = 0, and reaches a maximum height of 19 feet when t = 3.75 seconds. So, the cart will return to y = 0 after 2(3.75) or 7.5 seconds. b. The cart completes half of a cycle from t = 0 to t = 7.5. So, the period is 2(7.5) or 15 seconds. c.
d. The amplitude a is half of the maximum and
minimum values. So, a =
The vertical shift d is the average of the maximum
and minimum data values. So,
Because the period of a sinusoidal function is
you can write Therefore,
There is no phase shift because the height of the cartwhen t = 0 is 0 feet, and the sine function has a y-intercept of 0. Therefore, one equation that could be used to model
the position of the passenger cart is y = 19 sin t.
Write an equation that corresponds to each graph.
31.
SOLUTION: Sample answer: There is an x-intercept at 0, so one equation that corresponds to this graph is y = a sin (bx + c) + d. Half of the distance from the maximum to the minimum value of the function is 3. So, the amplitudeis 3. It appears that the function completes one period on
[0, π]. Find b.
The midline appears to be at y = 0, so there does not appear to be any vertical shift. Therefore, one equation that corresponds to this graph is y = 3 sin (2x).
32.
SOLUTION:
Sample answer: Because there is a y-intercept at ,
one equation that corresponds to this graph is y = a cos (bx + c) + d. Half of the distance from the maximum to the
minimum value of the function is . So, the
amplitude is .
It appears that the function completes one period on [0, 6π]. Find b.
The midline appears to be at y = 0, so there does not appear to be any vertical shift. Therefore, one
equation that corresponds to this graph is y = cos
.
33.
SOLUTION: Sample answer: Because there is a y-intercept at 3, one equation that corresponds to this graph is y = a cos (bx + c) + d. Half of the distance from the maximum to the
minimum value of the function is 4 ÷ 2 or 2. So, the amplitude is 2. It appears that the function completes one period on
Find b.
The midline appears to be at y = 1, so there is a vertical shift 1 unit up. Therefore, one equation that corresponds to this graph is y = 2 cos 4x + 1.
34.
SOLUTION: Sample answer: There is an x-intercept at 0, so one equation that corresponds to this graph is y = a sin (bx + c) + d. Half of the distance from the maximum to the
minimum value of the function is 8 ÷ 2 or 4. So, the amplitude is 4. It appears that the function completes one period on [0, 4π]. Find b.
The midline appears to be at y = −2, so there is a vertical shift of 2 units down. Therefore, one equation that corresponds to this graph is y = 4 sin
− 2.
Write a sinusoidal function with the given period and amplitude that passes through the given point.
35. period: ; amplitude: 5; point:
SOLUTION: Use the period to find b.
Sample answer: One sinusoidal function in which a =5 and b = 2 is y = 5 cos 2x. Evaluate the function for
The function passes through . Therefore, a
sinusoidal function with period π and amplitude 5 that
passes through the point is y = 5 cos 2x.
36. period: 4 ; amplitude: 2; point: ( , 2)
SOLUTION: Use the period to find b.
Sample answer: One sinusoidal function in which a =
2 and b = is y = 2 sin . Evaluate the function
for x = π.
The function passes through ( , 2). Therefore, a
sinusoidal function with period 4π and amplitude 2
that passes through the point ( , 2) is y = 2 sin .
37. period: ; amplitude: ; point:
SOLUTION: Use the period to find b.
Sample answer: One sinusoidal function in which a =1.5 and b = 4 is y = 1.5 cos 4x. Evaluate the function
for
The function passes through . Therefore, a
sinusoidal function with period and amplitude 1.5
that passes through the point is y = 1.5 cos
4x.
38. period: 3π; amplitude: ; point:
SOLUTION: Use the period to find b.
Sample answer: One sinusoidal function in which a =
0.5 and b = is y = sin x. Evaluate the
function for
The function passes through . Therefore, a
sinusoidal function with period 3π and amplitude 0.5
that passes through the point is y = sin
x.
39. MULTIPLE REPRESENTATIONS In this problem, you will investigate the change in the graph of a sinusoidal function of the form y = sin x or y = cos x when multiplied by a polynomial function. a. GRAPHICAL Use a graphing calculator to sketch the graphs of y = 2x, y = –2x, and y = 2x cos x on the same coordinate plane, on the interval [–20, 20]. b. VERBAL Describe the behavior of the graph of y = 2x cos x in relation to the graphs of y = 2x and y = –2x. c. GRAPHICAL Use a graphing calculator to
sketch the graphs of y = x2, y = –x
2, and y = x
2 sin x
on the same coordinate plane, on the interval [–20, 20]. d. VERBAL Describe the behavior of the graph of
y = x2 sin x in relation to the graphs of y = x
2 and y
= –x2.
e. ANALYTICAL Make a conjecture as to the behavior of the graph of a sinusoidal function of the form y = sin x or y = cos x when multiplied by polynomial function of the form y = f (x).
SOLUTION: a.
b. The graph of y = 2x cos x oscillates between the graphs of y = 2x and y = –2x. c.
d. The graph of y = x2 sin x oscillates between the
graphs of y = x2 and y = –x
2.
e . The graph of y = f (x) sin x or y = f (x) cos x will oscillate between the graphs of y = f (x) and y = –f(x).
40. CHALLENGE Without graphing, find the exact coordinates of the first maximum point to the right of
the y-axis for
SOLUTION:
First, find the phase shift for
Next, find the period of the function.
The first maximum for one period can be found by
finding So, incorporating the phase shift, the
first maximum to the right of the y-axis is
. Because the amplitude is |4| = 4,
the maximum point is
REASONING Determine whether each statement is true or false . Explain your reasoning.
41. Every sine function of the form y = a sin (bx + c) + d can be written as a cosine function of the form y =a cos (bx + c) + d.
SOLUTION: It is true that every sine function of the form y = a sin (bx + c) + d can be written as a cosine function of the form y = a cos (bx + c) + d. The graph of cosine is a horizontal translation of the sine graph. Therefore, a cosine function can be written from any sine function using the same amplitude and period by applying the necessary phase shift.
For example, consider and
. Phase shift by
to obtain .
42. The period of f (x) = cos 8x is equal to four times the period of g(x) = cos 2x.
SOLUTION: Find the period of f (x) = cos 8x.
Find the period of g(x) = cos 2x.
Four times the period of g(x) = cos 2x is 4 ⋅ or
4 . So, the period of f (x) is the period of g(x).
Therefore, the statement is false.
43. CHALLENGE How many zeros does y = cos
1500x have on the interval 0 ≤ x ≤ 2 ?
SOLUTION: Find the period of y = cos 1500x.
Graph y = cos 1500x on .
The graph of y = cos 1500x has two x-intercepts for one cycle, so the function has 2 zeros per cycle. Find
the number of cycles for y = cos 1500x on [0, 2 ].
So, the graph of y = cos 1500x will complete 1500
cycles on [0, 2 ]. Because there are two zeros per cycle, y = cos 1500x will have 1500(2) or 3000 zeros
on [0, 2 ].
44. PROOF Prove the phase shift formula.
SOLUTION:
Consider y = a sin (bx + c), where a , b, and c ≠ 0. To find a zero of the function, find the value of x for which a sin (bx + c) = 0. Since sin 0 = 0, solving bx + c = 0 will yield a zero of the function.
Therefore, y = 0 when . The value of is
the phase shift. When c > 0: The graph of y = a sin (bx + c) is the
graph of y = a sin x, shifted units to the left.
When c < 0: The graph of y = a sin (bx + c) is the
graph of y = a sin x, shifted units to the right.
Consider the graph of y = cos x below in blue. In this equation a = 1, b = 1 and c = 0. One zero of y = cos x is . The green graph is shifted to the
left. Thus c is – . Then the shifted equation will be
.
45. Writing in Math The Power Tower ride in Sandusky, Ohio, is shown below. Along the side of each tower is a string of lights that send a continuouspulse of light up and down each tower at a constant rate. Explain why the distance d of this light from theground over time t cannot be represented by a sinusoidal function.
SOLUTION: Sample answer: Although the pulse of light can be represented as a function with a period, it is not a sinusoidal function because the distance the pulse of light is from the ground changes at a constant rate. As a result, the graph of this function would resemble the graph below.
The given point lies on the terminal side of an angle θ in standard position. Find the values of
the six trigonometric functions of θ. 46. (−4, 4)
SOLUTION: Use the values of x and y to find r.
Use x = –4, y = 4, and r = to write the six trigonometric ratios.
47. (8, −2)
SOLUTION: Use the values of x and y to find r.
Use x = 8, y = –2, and r = to write the six trigonometric ratios.
48. (−5, −9)
SOLUTION: Use the values of x and y to find r.
Use x = –5, y = – 9, and r = to write the six trigonometric ratios.
49. (4, 5)
SOLUTION: Use the values of x and y to find r.
Use x = 4, y = 5, and r = to write the six trigonometric ratios.
Write each degree measure in radians as a multiple of π and each radian measure in degrees.
50. 25°
SOLUTION: To convert a degree measure to radians, multiply by
51. −420°
SOLUTION: To convert a degree measure to radians, multiply by
52.
SOLUTION: To convert a radian measure to degrees, multiply by
53.
SOLUTION: To convert a radian measure to degrees, multiply by
54. SCIENCE Radiocarbon dating is a method of estimating the age of an organic material by calculating the amount of carbon-14 present in the material. The age of a material can be calculated
using A = t , where A is the age of the
object in years, t is the half-life of carbon-14 or 5700 years, and R is the ratio of the amount of carbon-14 in the sample to the amount of carbon-14 in living tissue. a. A sample of organic material contains 0.000076 gram of carbon-14. A living sample of the same
eSolutions Manual - Powered by Cognero Page 7
4-4 Graphing Sine and Cosine Functions
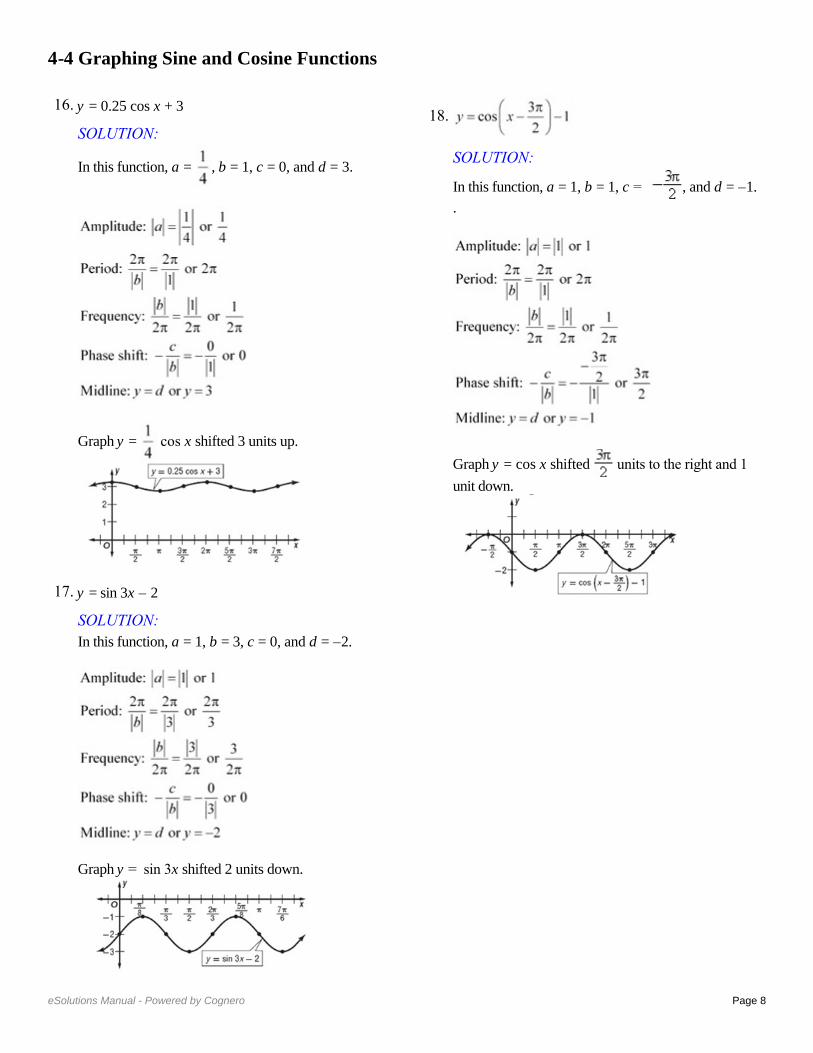
Describe how the graphs of f (x) and g (x) are related. Then find the amplitude of g (x), and sketch two periods of both functions on the same coordinate axes.
1. f (x) = sin x; g(x) = sin x
SOLUTION: The graph of g(x) is the graph of f (x) compressed
vertically. The amplitude of g(x) is or .
Create a table listing the coordinates of the x-intercepts and extrema for f (x) = sin x for one
period, 2 , on the interval [0, 2 ]. Then use the amplitude of g(x) to find corresponding points on its graph.
Sketch the curve through the indicated points for each function. Then repeat the pattern to complete asecond period.
Functions f (x) = sin x g(x) = sin x
x-int (0, 0) (0, 0)
Max
x-int
Min
x-int
2.
SOLUTION: The graph of g(x) is the graph of f (x) compressed
vertically. The amplitude of g(x) is or .
Create a table listing the coordinates of the x-intercepts and extrema for f (x) = cos x for one
period, 2 , on the interval [0, 2 ]. Then use the amplitude of g(x) to find corresponding points on its graph.
Sketch the curve through the indicated points for each function. Then repeat the pattern to complete asecond period.
Function f (x) = cos x
Max (0, 1)
x-int Min
x-in
Min
x-int
Function f (x) = cos x
Max x-int
Min
x-in
Min
x-int
3. f (x) = cos x; g(x) = 6 cos x
SOLUTION: The graph of g(x) is the graph of f (x) expanded
vertically. The amplitude of g(x) is or 6.
Create a table listing the coordinates of the x-intercepts and extrema for f (x) = cos x for one
period, 2 , on the interval [0, 2 ]. Then use the amplitude of g(x) to find corresponding points on its graph.
Sketch the curve through the indicated points for each function. Then repeat the pattern to complete asecond period.
Functions f (x) = cos x g(x) = 6 cos x
Max (0, 1) (0, 6)
x-int
Min
x-int
Max
4. f (x) = sin x; g(x) = −8 sin x
SOLUTION: The graph of g(x) is the graph of f (x) expanded
vertically. The amplitude of g(x) is or 8.
Create a table listing the coordinates of the x-intercepts and extrema for f (x) = sin x for one
period, 2 , on the interval [0, 2 ]. Then use the amplitude of g(x) to find corresponding points on its graph.
Sketch the curve through the indicated points for each function. Then repeat the pattern to complete asecond period.
Function f (x) = sin x
x-int (0, 0)
Max
x-int
Min
x-int
Function g(x) = −8
sin x
x-int (0, 0)
Min
x-int
Max
x-int
Describe how the graphs of f (x) and g (x) are related. Then find the period of g (x), and sketch at least one period of both functions on the same coordinate axes.
5. f (x) = sin x; g(x) = sin 4x
SOLUTION: The graph of g(x) is the graph of f (x) compressed
horizontally. The period of g(x) is . To find
corresponding points on the graph of g(x), change the x-coordinates of those key points on f (x) so that
they range from 0 to , increasing by increments of
.
Sketch the curve through the indicated points for each function. Then repeat the pattern to complete asecond period.
Functions f (x) = sin x g(x) = sin
4x
x-int (0, 0) (0, 0)
Max
x-int
Min
x-int
6. f (x) = cos x; g(x) = cos 2x
SOLUTION: The graph of g(x) is the graph of f (x) compressed
horizontally. The period of g(x) is or . To find
corresponding points on the graph of g(x), change the x-coordinates of those key points on f (x) so that
they range from 0 to , increasing by increments of
.
Sketch the curve through the indicated points for each function. Then repeat the pattern to complete asecond period.
Functions f (x) = cos x g(x) = cos 2x
Max (0, 1) (0, 1)
x-int
Min
x-int
Max
7. f (x) = cos x;
SOLUTION: The graph of g(x) is the graph of f (x) expanded
horizontally. The period of g(x) is . To
find corresponding points on the graph of g(x), change the x-coordinates of those key points on f (x)
so that they range from 0 to , increasing by
increments of or .
Sketch the curve through the indicated points for each function. Then repeat the pattern to complete asecond period.
Functions f (x) = cos x
Max (0, 1) (0, 1)
x-int
Min
x-int
Max
8. f (x) = sin x;
SOLUTION: The graph of g(x) is the graph of f (x) expanded
horizontally. The period of g(x) is . To find corresponding points on the graph of g(x), change the x-coordinates of those key points on f (x) so that they range from 0 to , increasing by increments of
or .
Sketch the curve through the indicated points for each function. Then repeat the pattern to complete asecond period.
Functions f (x) = sin x
x-int (0, 0) (0, 0)
Max
x-int
Min
x-int
9. VOICES The contralto vocal type includes the deepest female singing voice. Some contraltos can sing as low as the E below middle C (E3), which hasa frequency of 165 hertz. Write an equation for a sine function that models the initial behavior of the sound wave associated with E3 having an amplitude of 0.15.
SOLUTION: The general form of the equation will be y = a sin bt,where t is the time in seconds. Because the
amplitude is 0.15, |a|= 0.15. This means that a = ±0.15. The period is the reciprocal of the frequency or
. Use this value to find b.
Sample answer: One sine function that models the
initial behavior is y = 0.15 sin 330 t.
Write a sine function that can be used to model the initial behavior of a sound wave with the frequency and amplitude given.
10. f = 440, a = 0.3
SOLUTION: The general form of the equation is y = a sin bt, where t is the time in seconds. Because the
amplitude is 0.3, = 0.3. This means that a = ±0.3.
The period is the reciprocal of the frequency or
. Use this value to find b.
Using the positive values of a and b, one sine function that models the initial behavior is y = 0.3 sin
880 t.
11. f = 932, a = 0.25
SOLUTION: The general form of the equation is y = a sin bt, where t is the time in seconds. Because the
amplitude is 0.25, = 0.25. This means that a =
±0.25. The period is the reciprocal of the frequency
or . Use this value to find b.
Using the positive values of a and b, one sine function that models the initial behavior is y = 0.25
sin 1864 t.
12. f = 1245, a = 0.12
SOLUTION: The general form of the equation is y = a sin bt, where t is the time in seconds. Because the
amplitude is 0.12, = 0.12. This means that a =
±0.12. The period is the reciprocal of the frequency or
. Use this value to find b.
Using the positive values of a and b, one sine function that models the initial behavior is y = 0.12
sin 2490 t.
13. f = 623, a = 0.2
SOLUTION: The general form of the equation is y = a sin bt, where t is the time in seconds. Because the
amplitude is 0.2, = 0.2. This means that a = ±0.2.
The period is the reciprocal of the frequency or
. Use this value to find b.
Using the positive values of a and b, one sine function that models the initial behavior is y = 0.2 sin
1246 t.
State the amplitude, period, frequency, phase shift, and vertical shift of each function. Then graph two periods of the function.
14.
SOLUTION:
In this function, a = 3, b = 1, c = − , and d = 0.
Because d = 0, there is no vertical shift.
Graph y = 3 sin x shifted units to the right.
15.
SOLUTION:
In this function, a = 1, b = , c = , and d = 0.
Because d = 0, there is no vertical shift.
16. y = 0.25 cos x + 3
SOLUTION:
In this function, a = , b = 1, c = 0, and d = 3.
Graph y = cos x shifted 3 units up.
17. y = sin 3x – 2
SOLUTION: In this function, a = 1, b = 3, c = 0, and d = –2.
Graph y = sin 3x shifted 2 units down.
18.
SOLUTION:
In this function, a = 1, b = 1, c = , and d = –1.
.
Graph y = cos x shifted units to the right and 1
unit down.
19.
SOLUTION:
In this function, a = 1, b = 1, c = , and d = 4.
.
Graph y = sin x shifted units to the left and 4 units up.
20. VACATIONS The average number of reservations R that a vacation resort has at the beginning of each month is shown.
a. Write an equation of a sinusoidal function that models the average number of reservations using x =1 to represent January. b. According to your model, approximately how many reservations can the resort anticipate in November?
SOLUTION: a. Make a scatter plot of the data and choose a model.
Sample answer: Use a sinusoidal function of the form y = a cos (bx + c) + d to model the data. First, find the maximum M and minimum m values of the data, and use these values to find a, b, c, and d. The maximum and minimum reservations are 200 and 87, respectively. The amplitude a is half of the distance between these values.
The vertical shift d is the average of the maximum and minimum data values.
There are 3 months between the maximum and minimum, so the period is 6.
The maximum data value occurs when x = 1. Since y = cos x attains its first maximum when x = 0, we must apply a phase shift of 1 unit. Use this value to find c.
Write a function using the values for a, b, c, and d.
Use b =
b. To find the number of reservations in November, evaluate the model for x = 11.
Therefore, the resort can anticipate about 115 reservations in November.
21. TIDES The table shown below provides data for the first high and low tides of the day for a certain bay during one day in June.
a. Determine the amplitude, period, phase shift, and vertical shift of a sinusoidal function that models the height of the tide. Let x represent the number of hours that the high or low tide occurred after midnight. b. Write a sinusoidal function that models the data. c. According to your model, what was the height of
the tide at 8:45 P.M. that night?
SOLUTION: a. Sample answer: Use a sinusoidal function of the form y = a cos (bx + c) + d to model the data. First, find the amplitude a, which is half of the distance between the heights of the high and low tides.
The vertical shift d is the average of the heights of the high and low tides.
A sinusoid completes half of a period in the time thatit takes to go from its maximum to its minimum value. One period is twice this time. The first high tide occurs 6.5 hours before the first low tide, so the period is 13.
The maximum data value occurs when x ≈ 4.417. Since y = cos x attains its first maximum when x = 0,we must apply a phase shift of 4.417 units. Use this value to find c.
b. Write a function using the values for a, b, c, and
d. Use b =
c. To find the height of the water at 8:45 P.M. that
night, evaluate the model for x = 20.75.
Therefore, the tide was about 7.28 feet high at 8:45
P.M. that night.
22. METEOROLOGY The average monthly temperatures for Boston, Massachusetts are shown.
a. Determine the amplitude, period, phase shift, and vertical shift of a sinusoidal function that models the monthly temperatures using x = 1 to represent January. b. Write an equation of a sinusoidal function that models the monthly temperatures. c. According to your model, what is Boston’s average temperature in August?
SOLUTION: a. The maximum and minimum are 74° and 29°, respectively. The amplitude a is half of the distance between these values.
The vertical shift d is the average of the maximum and minimum data values.
A sinusoid completes half of a period in the time thatit takes to go from its maximum to its minimum value. So, one period is twice this time. The
maximum function value occurs in July, so xmax is 7.
The minimum function value occurs in January, so
xmin is 1. The period is 2(6) = 12.
The maximum data value occurs when x = 7. Since y = cos x attains its first maximum when x = 0, we must apply a phase shift of 7 units. Use this value to find c.
b. Using the values for a, b, c, and d from part a, a sinusoidal function that models that monthly temperatures in Boston is
c. To find the average monthly temperature for Boston in August, evaluate the model for x = 8.
Therefore, the average monthly temperature for Boston in August is about 71°F.
GRAPHING CALCULATOR Find the values of x in the interval – < x < that make each equation or inequality true. (Hint: Use the intersection function.)
23. –sin x = cos x
SOLUTION:
Graph y = −sin x and y = cos x on the same graphing
calculator screen on (−π, π). Use the intersect feature under the CALC menu to determine where the two graphs intersect.
The graphs intersect at about −0.7854 or − and
about 2.356 or . Therefore, on –π < x < π, –sin x
= cos x when x = − and .
24. sin x − cos x = 1
SOLUTION:
Graph y = sin x − cos x and y = 1 on the same
graphing calculator screen on (− , ). Use the intersect feature under the CALC menu to determine where the two graphs intersect.
The graphs intersect at about 1.57 or . Therefore,
on – < x < , sin x − cos x = 1 when x = .
25. sin x + cos x = 0
SOLUTION:
Graph y = sin x + cos x on (−π, π). Use the zero feature under the CALC menu to determine the zeros of the function.
There are zeros at about −0.785 or − or and about
2.356 or . Therefore, on – < x < , sin x + cos
x = 0 when
26. cos x ≤ sin x
SOLUTION:
Graph y = cos x and y = sin x on (−π, π). Use the intersect feature under the CALC menu to determine on what interval(s) cos x ≤ sin x.
The graphs intersect at about –2.356 or – and
about 0.785 or . From the graph, it appears that
cos x ≤ sin x on – < x < – and < x < .
27. sin x cos x > 1
SOLUTION:
Graph y = sin x cos x and y = 1 on (− , ). Use the intersect feature under the CALC menu to determine on what interval(s) sin x cos x > 1.
The graphs do not intersect. Therefore, y = sin x cos
x is not greater than y = 1 for any values of x on –< x < .
28. sin x cos x ≤ 0
SOLUTION:
Graph y = sin x cos x on (−π, π). Use the zero feature under the CALC menu to determine on what interval(s) sin x cos x ≤ 0.
The zeros of y = sin x cos x are about –1.57 or ,
0, and about 1.57 or . From the graph, it appears
that sin x cos x ≤ 0 on < x < 0 and < x < .
29. CAROUSELS A wooden horse on a carousel moves up and down as the carousel spins. When the ride ends, the horse usually stops in a vertical position different from where it started. The position y of the horse after t seconds can be modeled by y =1.5 sin (2t + c), where the phase shift c must be continuously adjusted to compensate for the differentstarting positions. If during one ride the horse
reached a maximum height after seconds, find
the equation that models the horse’s position.
SOLUTION: First, find the period of y = 1.5 sin (2t + c).
Since the period is π, the function will reach a
maximum height at radians. The phase shift is the
difference between the horizontal position of the
function at and radians, which is radians.
Substitute and b into the phase shift formula to
find c.
Therefore, the equation is
30. AMUSEMENT PARKS The position y in feet of a passenger cart relative to the center of a Ferris wheel over t seconds is shown below.
a. Find the time t that it takes for the cart to return toy = 0 during its initial spin. b. Find the period of the Ferris wheel. c. Sketch the graph representing the position of the passenger cart over one period. d. Write a sinusoidal function that models the position of the passenger cart as a function of time t.
SOLUTION: a. From the diagram, the height of the cart is 0 ft when t = 0, and reaches a maximum height of 19 feet when t = 3.75 seconds. So, the cart will return to y = 0 after 2(3.75) or 7.5 seconds. b. The cart completes half of a cycle from t = 0 to t = 7.5. So, the period is 2(7.5) or 15 seconds. c.
d. The amplitude a is half of the maximum and
minimum values. So, a =
The vertical shift d is the average of the maximum
and minimum data values. So,
Because the period of a sinusoidal function is
you can write Therefore,
There is no phase shift because the height of the cartwhen t = 0 is 0 feet, and the sine function has a y-intercept of 0. Therefore, one equation that could be used to model
the position of the passenger cart is y = 19 sin t.
Write an equation that corresponds to each graph.
31.
SOLUTION: Sample answer: There is an x-intercept at 0, so one equation that corresponds to this graph is y = a sin (bx + c) + d. Half of the distance from the maximum to the minimum value of the function is 3. So, the amplitudeis 3. It appears that the function completes one period on
[0, π]. Find b.
The midline appears to be at y = 0, so there does not appear to be any vertical shift. Therefore, one equation that corresponds to this graph is y = 3 sin (2x).
32.
SOLUTION:
Sample answer: Because there is a y-intercept at ,
one equation that corresponds to this graph is y = a cos (bx + c) + d. Half of the distance from the maximum to the
minimum value of the function is . So, the
amplitude is .
It appears that the function completes one period on [0, 6π]. Find b.
The midline appears to be at y = 0, so there does not appear to be any vertical shift. Therefore, one
equation that corresponds to this graph is y = cos
.
33.
SOLUTION: Sample answer: Because there is a y-intercept at 3, one equation that corresponds to this graph is y = a cos (bx + c) + d. Half of the distance from the maximum to the
minimum value of the function is 4 ÷ 2 or 2. So, the amplitude is 2. It appears that the function completes one period on
Find b.
The midline appears to be at y = 1, so there is a vertical shift 1 unit up. Therefore, one equation that corresponds to this graph is y = 2 cos 4x + 1.
34.
SOLUTION: Sample answer: There is an x-intercept at 0, so one equation that corresponds to this graph is y = a sin (bx + c) + d. Half of the distance from the maximum to the
minimum value of the function is 8 ÷ 2 or 4. So, the amplitude is 4. It appears that the function completes one period on [0, 4π]. Find b.
The midline appears to be at y = −2, so there is a vertical shift of 2 units down. Therefore, one equation that corresponds to this graph is y = 4 sin
− 2.
Write a sinusoidal function with the given period and amplitude that passes through the given point.
35. period: ; amplitude: 5; point:
SOLUTION: Use the period to find b.
Sample answer: One sinusoidal function in which a =5 and b = 2 is y = 5 cos 2x. Evaluate the function for
The function passes through . Therefore, a
sinusoidal function with period π and amplitude 5 that
passes through the point is y = 5 cos 2x.
36. period: 4 ; amplitude: 2; point: ( , 2)
SOLUTION: Use the period to find b.
Sample answer: One sinusoidal function in which a =
2 and b = is y = 2 sin . Evaluate the function
for x = π.
The function passes through ( , 2). Therefore, a
sinusoidal function with period 4π and amplitude 2
that passes through the point ( , 2) is y = 2 sin .
37. period: ; amplitude: ; point:
SOLUTION: Use the period to find b.
Sample answer: One sinusoidal function in which a =1.5 and b = 4 is y = 1.5 cos 4x. Evaluate the function
for
The function passes through . Therefore, a
sinusoidal function with period and amplitude 1.5
that passes through the point is y = 1.5 cos
4x.
38. period: 3π; amplitude: ; point:
SOLUTION: Use the period to find b.
Sample answer: One sinusoidal function in which a =
0.5 and b = is y = sin x. Evaluate the
function for
The function passes through . Therefore, a
sinusoidal function with period 3π and amplitude 0.5
that passes through the point is y = sin
x.
39. MULTIPLE REPRESENTATIONS In this problem, you will investigate the change in the graph of a sinusoidal function of the form y = sin x or y = cos x when multiplied by a polynomial function. a. GRAPHICAL Use a graphing calculator to sketch the graphs of y = 2x, y = –2x, and y = 2x cos x on the same coordinate plane, on the interval [–20, 20]. b. VERBAL Describe the behavior of the graph of y = 2x cos x in relation to the graphs of y = 2x and y = –2x. c. GRAPHICAL Use a graphing calculator to
sketch the graphs of y = x2, y = –x
2, and y = x
2 sin x
on the same coordinate plane, on the interval [–20, 20]. d. VERBAL Describe the behavior of the graph of
y = x2 sin x in relation to the graphs of y = x
2 and y
= –x2.
e. ANALYTICAL Make a conjecture as to the behavior of the graph of a sinusoidal function of the form y = sin x or y = cos x when multiplied by polynomial function of the form y = f (x).
SOLUTION: a.
b. The graph of y = 2x cos x oscillates between the graphs of y = 2x and y = –2x. c.
d. The graph of y = x2 sin x oscillates between the
graphs of y = x2 and y = –x
2.
e . The graph of y = f (x) sin x or y = f (x) cos x will oscillate between the graphs of y = f (x) and y = –f(x).
40. CHALLENGE Without graphing, find the exact coordinates of the first maximum point to the right of
the y-axis for
SOLUTION:
First, find the phase shift for
Next, find the period of the function.
The first maximum for one period can be found by
finding So, incorporating the phase shift, the
first maximum to the right of the y-axis is
. Because the amplitude is |4| = 4,
the maximum point is
REASONING Determine whether each statement is true or false . Explain your reasoning.
41. Every sine function of the form y = a sin (bx + c) + d can be written as a cosine function of the form y =a cos (bx + c) + d.
SOLUTION: It is true that every sine function of the form y = a sin (bx + c) + d can be written as a cosine function of the form y = a cos (bx + c) + d. The graph of cosine is a horizontal translation of the sine graph. Therefore, a cosine function can be written from any sine function using the same amplitude and period by applying the necessary phase shift.
For example, consider and
. Phase shift by
to obtain .
42. The period of f (x) = cos 8x is equal to four times the period of g(x) = cos 2x.
SOLUTION: Find the period of f (x) = cos 8x.
Find the period of g(x) = cos 2x.
Four times the period of g(x) = cos 2x is 4 ⋅ or
4 . So, the period of f (x) is the period of g(x).
Therefore, the statement is false.
43. CHALLENGE How many zeros does y = cos
1500x have on the interval 0 ≤ x ≤ 2 ?
SOLUTION: Find the period of y = cos 1500x.
Graph y = cos 1500x on .
The graph of y = cos 1500x has two x-intercepts for one cycle, so the function has 2 zeros per cycle. Find
the number of cycles for y = cos 1500x on [0, 2 ].
So, the graph of y = cos 1500x will complete 1500
cycles on [0, 2 ]. Because there are two zeros per cycle, y = cos 1500x will have 1500(2) or 3000 zeros
on [0, 2 ].
44. PROOF Prove the phase shift formula.
SOLUTION:
Consider y = a sin (bx + c), where a , b, and c ≠ 0. To find a zero of the function, find the value of x for which a sin (bx + c) = 0. Since sin 0 = 0, solving bx + c = 0 will yield a zero of the function.
Therefore, y = 0 when . The value of is
the phase shift. When c > 0: The graph of y = a sin (bx + c) is the
graph of y = a sin x, shifted units to the left.
When c < 0: The graph of y = a sin (bx + c) is the
graph of y = a sin x, shifted units to the right.
Consider the graph of y = cos x below in blue. In this equation a = 1, b = 1 and c = 0. One zero of y = cos x is . The green graph is shifted to the
left. Thus c is – . Then the shifted equation will be
.
45. Writing in Math The Power Tower ride in Sandusky, Ohio, is shown below. Along the side of each tower is a string of lights that send a continuouspulse of light up and down each tower at a constant rate. Explain why the distance d of this light from theground over time t cannot be represented by a sinusoidal function.
SOLUTION: Sample answer: Although the pulse of light can be represented as a function with a period, it is not a sinusoidal function because the distance the pulse of light is from the ground changes at a constant rate. As a result, the graph of this function would resemble the graph below.
The given point lies on the terminal side of an angle θ in standard position. Find the values of
the six trigonometric functions of θ. 46. (−4, 4)
SOLUTION: Use the values of x and y to find r.
Use x = –4, y = 4, and r = to write the six trigonometric ratios.
47. (8, −2)
SOLUTION: Use the values of x and y to find r.
Use x = 8, y = –2, and r = to write the six trigonometric ratios.
48. (−5, −9)
SOLUTION: Use the values of x and y to find r.
Use x = –5, y = – 9, and r = to write the six trigonometric ratios.
49. (4, 5)
SOLUTION: Use the values of x and y to find r.
Use x = 4, y = 5, and r = to write the six trigonometric ratios.
Write each degree measure in radians as a multiple of π and each radian measure in degrees.
50. 25°
SOLUTION: To convert a degree measure to radians, multiply by
51. −420°
SOLUTION: To convert a degree measure to radians, multiply by
52.
SOLUTION: To convert a radian measure to degrees, multiply by
53.
SOLUTION: To convert a radian measure to degrees, multiply by
54. SCIENCE Radiocarbon dating is a method of estimating the age of an organic material by calculating the amount of carbon-14 present in the material. The age of a material can be calculated
using A = t , where A is the age of the
object in years, t is the half-life of carbon-14 or 5700 years, and R is the ratio of the amount of carbon-14 in the sample to the amount of carbon-14 in living tissue. a. A sample of organic material contains 0.000076 gram of carbon-14. A living sample of the same
Describe how the graphs of f (x) and g (x) are related. Then find the amplitude of g (x), and sketch two periods of both functions on the same coordinate axes.
1. f (x) = sin x; g(x) = sin x
SOLUTION: The graph of g(x) is the graph of f (x) compressed
vertically. The amplitude of g(x) is or .
Create a table listing the coordinates of the x-intercepts and extrema for f (x) = sin x for one
period, 2 , on the interval [0, 2 ]. Then use the amplitude of g(x) to find corresponding points on its graph.
Sketch the curve through the indicated points for each function. Then repeat the pattern to complete asecond period.
Functions f (x) = sin x g(x) = sin x
x-int (0, 0) (0, 0)
Max
x-int
Min
x-int
2.
SOLUTION: The graph of g(x) is the graph of f (x) compressed
vertically. The amplitude of g(x) is or .
Create a table listing the coordinates of the x-intercepts and extrema for f (x) = cos x for one
period, 2 , on the interval [0, 2 ]. Then use the amplitude of g(x) to find corresponding points on its graph.
Sketch the curve through the indicated points for each function. Then repeat the pattern to complete asecond period.
Function f (x) = cos x
Max (0, 1)
x-int Min
x-in
Min
x-int
Function f (x) = cos x
Max x-int
Min
x-in
Min
x-int
3. f (x) = cos x; g(x) = 6 cos x
SOLUTION: The graph of g(x) is the graph of f (x) expanded
vertically. The amplitude of g(x) is or 6.
Create a table listing the coordinates of the x-intercepts and extrema for f (x) = cos x for one
period, 2 , on the interval [0, 2 ]. Then use the amplitude of g(x) to find corresponding points on its graph.
Sketch the curve through the indicated points for each function. Then repeat the pattern to complete asecond period.
Functions f (x) = cos x g(x) = 6 cos x
Max (0, 1) (0, 6)
x-int
Min
x-int
Max
4. f (x) = sin x; g(x) = −8 sin x
SOLUTION: The graph of g(x) is the graph of f (x) expanded
vertically. The amplitude of g(x) is or 8.
Create a table listing the coordinates of the x-intercepts and extrema for f (x) = sin x for one
period, 2 , on the interval [0, 2 ]. Then use the amplitude of g(x) to find corresponding points on its graph.
Sketch the curve through the indicated points for each function. Then repeat the pattern to complete asecond period.
Function f (x) = sin x
x-int (0, 0)
Max
x-int
Min
x-int
Function g(x) = −8
sin x
x-int (0, 0)
Min
x-int
Max
x-int
Describe how the graphs of f (x) and g (x) are related. Then find the period of g (x), and sketch at least one period of both functions on the same coordinate axes.
5. f (x) = sin x; g(x) = sin 4x
SOLUTION: The graph of g(x) is the graph of f (x) compressed
horizontally. The period of g(x) is . To find
corresponding points on the graph of g(x), change the x-coordinates of those key points on f (x) so that
they range from 0 to , increasing by increments of
.
Sketch the curve through the indicated points for each function. Then repeat the pattern to complete asecond period.
Functions f (x) = sin x g(x) = sin
4x
x-int (0, 0) (0, 0)
Max
x-int
Min
x-int
6. f (x) = cos x; g(x) = cos 2x
SOLUTION: The graph of g(x) is the graph of f (x) compressed
horizontally. The period of g(x) is or . To find
corresponding points on the graph of g(x), change the x-coordinates of those key points on f (x) so that
they range from 0 to , increasing by increments of
.
Sketch the curve through the indicated points for each function. Then repeat the pattern to complete asecond period.
Functions f (x) = cos x g(x) = cos 2x
Max (0, 1) (0, 1)
x-int
Min
x-int
Max
7. f (x) = cos x;
SOLUTION: The graph of g(x) is the graph of f (x) expanded
horizontally. The period of g(x) is . To
find corresponding points on the graph of g(x), change the x-coordinates of those key points on f (x)
so that they range from 0 to , increasing by
increments of or .
Sketch the curve through the indicated points for each function. Then repeat the pattern to complete asecond period.
Functions f (x) = cos x
Max (0, 1) (0, 1)
x-int
Min
x-int
Max
8. f (x) = sin x;
SOLUTION: The graph of g(x) is the graph of f (x) expanded
horizontally. The period of g(x) is . To find corresponding points on the graph of g(x), change the x-coordinates of those key points on f (x) so that they range from 0 to , increasing by increments of
or .
Sketch the curve through the indicated points for each function. Then repeat the pattern to complete asecond period.
Functions f (x) = sin x
x-int (0, 0) (0, 0)
Max
x-int
Min
x-int
9. VOICES The contralto vocal type includes the deepest female singing voice. Some contraltos can sing as low as the E below middle C (E3), which hasa frequency of 165 hertz. Write an equation for a sine function that models the initial behavior of the sound wave associated with E3 having an amplitude of 0.15.
SOLUTION: The general form of the equation will be y = a sin bt,where t is the time in seconds. Because the
amplitude is 0.15, |a|= 0.15. This means that a = ±0.15. The period is the reciprocal of the frequency or
. Use this value to find b.
Sample answer: One sine function that models the
initial behavior is y = 0.15 sin 330 t.
Write a sine function that can be used to model the initial behavior of a sound wave with the frequency and amplitude given.
10. f = 440, a = 0.3
SOLUTION: The general form of the equation is y = a sin bt, where t is the time in seconds. Because the
amplitude is 0.3, = 0.3. This means that a = ±0.3.
The period is the reciprocal of the frequency or
. Use this value to find b.
Using the positive values of a and b, one sine function that models the initial behavior is y = 0.3 sin
880 t.
11. f = 932, a = 0.25
SOLUTION: The general form of the equation is y = a sin bt, where t is the time in seconds. Because the
amplitude is 0.25, = 0.25. This means that a =
±0.25. The period is the reciprocal of the frequency
or . Use this value to find b.
Using the positive values of a and b, one sine function that models the initial behavior is y = 0.25
sin 1864 t.
12. f = 1245, a = 0.12
SOLUTION: The general form of the equation is y = a sin bt, where t is the time in seconds. Because the
amplitude is 0.12, = 0.12. This means that a =
±0.12. The period is the reciprocal of the frequency or
. Use this value to find b.
Using the positive values of a and b, one sine function that models the initial behavior is y = 0.12
sin 2490 t.
13. f = 623, a = 0.2
SOLUTION: The general form of the equation is y = a sin bt, where t is the time in seconds. Because the
amplitude is 0.2, = 0.2. This means that a = ±0.2.
The period is the reciprocal of the frequency or
. Use this value to find b.
Using the positive values of a and b, one sine function that models the initial behavior is y = 0.2 sin
1246 t.
State the amplitude, period, frequency, phase shift, and vertical shift of each function. Then graph two periods of the function.
14.
SOLUTION:
In this function, a = 3, b = 1, c = − , and d = 0.
Because d = 0, there is no vertical shift.
Graph y = 3 sin x shifted units to the right.
15.
SOLUTION:
In this function, a = 1, b = , c = , and d = 0.
Because d = 0, there is no vertical shift.
16. y = 0.25 cos x + 3
SOLUTION:
In this function, a = , b = 1, c = 0, and d = 3.
Graph y = cos x shifted 3 units up.
17. y = sin 3x – 2
SOLUTION: In this function, a = 1, b = 3, c = 0, and d = –2.
Graph y = sin 3x shifted 2 units down.
18.
SOLUTION:
In this function, a = 1, b = 1, c = , and d = –1.
.
Graph y = cos x shifted units to the right and 1
unit down.
19.
SOLUTION:
In this function, a = 1, b = 1, c = , and d = 4.
.
Graph y = sin x shifted units to the left and 4 units up.
20. VACATIONS The average number of reservations R that a vacation resort has at the beginning of each month is shown.
a. Write an equation of a sinusoidal function that models the average number of reservations using x =1 to represent January. b. According to your model, approximately how many reservations can the resort anticipate in November?
SOLUTION: a. Make a scatter plot of the data and choose a model.
Sample answer: Use a sinusoidal function of the form y = a cos (bx + c) + d to model the data. First, find the maximum M and minimum m values of the data, and use these values to find a, b, c, and d. The maximum and minimum reservations are 200 and 87, respectively. The amplitude a is half of the distance between these values.
The vertical shift d is the average of the maximum and minimum data values.
There are 3 months between the maximum and minimum, so the period is 6.
The maximum data value occurs when x = 1. Since y = cos x attains its first maximum when x = 0, we must apply a phase shift of 1 unit. Use this value to find c.
Write a function using the values for a, b, c, and d.
Use b =
b. To find the number of reservations in November, evaluate the model for x = 11.
Therefore, the resort can anticipate about 115 reservations in November.
21. TIDES The table shown below provides data for the first high and low tides of the day for a certain bay during one day in June.
a. Determine the amplitude, period, phase shift, and vertical shift of a sinusoidal function that models the height of the tide. Let x represent the number of hours that the high or low tide occurred after midnight. b. Write a sinusoidal function that models the data. c. According to your model, what was the height of
the tide at 8:45 P.M. that night?
SOLUTION: a. Sample answer: Use a sinusoidal function of the form y = a cos (bx + c) + d to model the data. First, find the amplitude a, which is half of the distance between the heights of the high and low tides.
The vertical shift d is the average of the heights of the high and low tides.
A sinusoid completes half of a period in the time thatit takes to go from its maximum to its minimum value. One period is twice this time. The first high tide occurs 6.5 hours before the first low tide, so the period is 13.
The maximum data value occurs when x ≈ 4.417. Since y = cos x attains its first maximum when x = 0,we must apply a phase shift of 4.417 units. Use this value to find c.
b. Write a function using the values for a, b, c, and
d. Use b =
c. To find the height of the water at 8:45 P.M. that
night, evaluate the model for x = 20.75.
Therefore, the tide was about 7.28 feet high at 8:45
P.M. that night.
22. METEOROLOGY The average monthly temperatures for Boston, Massachusetts are shown.
a. Determine the amplitude, period, phase shift, and vertical shift of a sinusoidal function that models the monthly temperatures using x = 1 to represent January. b. Write an equation of a sinusoidal function that models the monthly temperatures. c. According to your model, what is Boston’s average temperature in August?
SOLUTION: a. The maximum and minimum are 74° and 29°, respectively. The amplitude a is half of the distance between these values.
The vertical shift d is the average of the maximum and minimum data values.
A sinusoid completes half of a period in the time thatit takes to go from its maximum to its minimum value. So, one period is twice this time. The
maximum function value occurs in July, so xmax is 7.
The minimum function value occurs in January, so
xmin is 1. The period is 2(6) = 12.
The maximum data value occurs when x = 7. Since y = cos x attains its first maximum when x = 0, we must apply a phase shift of 7 units. Use this value to find c.
b. Using the values for a, b, c, and d from part a, a sinusoidal function that models that monthly temperatures in Boston is
c. To find the average monthly temperature for Boston in August, evaluate the model for x = 8.
Therefore, the average monthly temperature for Boston in August is about 71°F.
GRAPHING CALCULATOR Find the values of x in the interval – < x < that make each equation or inequality true. (Hint: Use the intersection function.)
23. –sin x = cos x
SOLUTION:
Graph y = −sin x and y = cos x on the same graphing
calculator screen on (−π, π). Use the intersect feature under the CALC menu to determine where the two graphs intersect.
The graphs intersect at about −0.7854 or − and
about 2.356 or . Therefore, on –π < x < π, –sin x
= cos x when x = − and .
24. sin x − cos x = 1
SOLUTION:
Graph y = sin x − cos x and y = 1 on the same
graphing calculator screen on (− , ). Use the intersect feature under the CALC menu to determine where the two graphs intersect.
The graphs intersect at about 1.57 or . Therefore,
on – < x < , sin x − cos x = 1 when x = .
25. sin x + cos x = 0
SOLUTION:
Graph y = sin x + cos x on (−π, π). Use the zero feature under the CALC menu to determine the zeros of the function.
There are zeros at about −0.785 or − or and about
2.356 or . Therefore, on – < x < , sin x + cos
x = 0 when
26. cos x ≤ sin x
SOLUTION:
Graph y = cos x and y = sin x on (−π, π). Use the intersect feature under the CALC menu to determine on what interval(s) cos x ≤ sin x.
The graphs intersect at about –2.356 or – and
about 0.785 or . From the graph, it appears that
cos x ≤ sin x on – < x < – and < x < .
27. sin x cos x > 1
SOLUTION:
Graph y = sin x cos x and y = 1 on (− , ). Use the intersect feature under the CALC menu to determine on what interval(s) sin x cos x > 1.
The graphs do not intersect. Therefore, y = sin x cos
x is not greater than y = 1 for any values of x on –< x < .
28. sin x cos x ≤ 0
SOLUTION:
Graph y = sin x cos x on (−π, π). Use the zero feature under the CALC menu to determine on what interval(s) sin x cos x ≤ 0.
The zeros of y = sin x cos x are about –1.57 or ,
0, and about 1.57 or . From the graph, it appears
that sin x cos x ≤ 0 on < x < 0 and < x < .
29. CAROUSELS A wooden horse on a carousel moves up and down as the carousel spins. When the ride ends, the horse usually stops in a vertical position different from where it started. The position y of the horse after t seconds can be modeled by y =1.5 sin (2t + c), where the phase shift c must be continuously adjusted to compensate for the differentstarting positions. If during one ride the horse
reached a maximum height after seconds, find
the equation that models the horse’s position.
SOLUTION: First, find the period of y = 1.5 sin (2t + c).
Since the period is π, the function will reach a
maximum height at radians. The phase shift is the
difference between the horizontal position of the
function at and radians, which is radians.
Substitute and b into the phase shift formula to
find c.
Therefore, the equation is
30. AMUSEMENT PARKS The position y in feet of a passenger cart relative to the center of a Ferris wheel over t seconds is shown below.
a. Find the time t that it takes for the cart to return toy = 0 during its initial spin. b. Find the period of the Ferris wheel. c. Sketch the graph representing the position of the passenger cart over one period. d. Write a sinusoidal function that models the position of the passenger cart as a function of time t.
SOLUTION: a. From the diagram, the height of the cart is 0 ft when t = 0, and reaches a maximum height of 19 feet when t = 3.75 seconds. So, the cart will return to y = 0 after 2(3.75) or 7.5 seconds. b. The cart completes half of a cycle from t = 0 to t = 7.5. So, the period is 2(7.5) or 15 seconds. c.
d. The amplitude a is half of the maximum and
minimum values. So, a =
The vertical shift d is the average of the maximum
and minimum data values. So,
Because the period of a sinusoidal function is
you can write Therefore,
There is no phase shift because the height of the cartwhen t = 0 is 0 feet, and the sine function has a y-intercept of 0. Therefore, one equation that could be used to model
the position of the passenger cart is y = 19 sin t.
Write an equation that corresponds to each graph.
31.
SOLUTION: Sample answer: There is an x-intercept at 0, so one equation that corresponds to this graph is y = a sin (bx + c) + d. Half of the distance from the maximum to the minimum value of the function is 3. So, the amplitudeis 3. It appears that the function completes one period on
[0, π]. Find b.
The midline appears to be at y = 0, so there does not appear to be any vertical shift. Therefore, one equation that corresponds to this graph is y = 3 sin (2x).
32.
SOLUTION:
Sample answer: Because there is a y-intercept at ,
one equation that corresponds to this graph is y = a cos (bx + c) + d. Half of the distance from the maximum to the
minimum value of the function is . So, the
amplitude is .
It appears that the function completes one period on [0, 6π]. Find b.
The midline appears to be at y = 0, so there does not appear to be any vertical shift. Therefore, one
equation that corresponds to this graph is y = cos
.
33.
SOLUTION: Sample answer: Because there is a y-intercept at 3, one equation that corresponds to this graph is y = a cos (bx + c) + d. Half of the distance from the maximum to the
minimum value of the function is 4 ÷ 2 or 2. So, the amplitude is 2. It appears that the function completes one period on
Find b.
The midline appears to be at y = 1, so there is a vertical shift 1 unit up. Therefore, one equation that corresponds to this graph is y = 2 cos 4x + 1.
34.
SOLUTION: Sample answer: There is an x-intercept at 0, so one equation that corresponds to this graph is y = a sin (bx + c) + d. Half of the distance from the maximum to the
minimum value of the function is 8 ÷ 2 or 4. So, the amplitude is 4. It appears that the function completes one period on [0, 4π]. Find b.
The midline appears to be at y = −2, so there is a vertical shift of 2 units down. Therefore, one equation that corresponds to this graph is y = 4 sin
− 2.
Write a sinusoidal function with the given period and amplitude that passes through the given point.
35. period: ; amplitude: 5; point:
SOLUTION: Use the period to find b.
Sample answer: One sinusoidal function in which a =5 and b = 2 is y = 5 cos 2x. Evaluate the function for
The function passes through . Therefore, a
sinusoidal function with period π and amplitude 5 that
passes through the point is y = 5 cos 2x.
36. period: 4 ; amplitude: 2; point: ( , 2)
SOLUTION: Use the period to find b.
Sample answer: One sinusoidal function in which a =
2 and b = is y = 2 sin . Evaluate the function
for x = π.
The function passes through ( , 2). Therefore, a
sinusoidal function with period 4π and amplitude 2
that passes through the point ( , 2) is y = 2 sin .
37. period: ; amplitude: ; point:
SOLUTION: Use the period to find b.
Sample answer: One sinusoidal function in which a =1.5 and b = 4 is y = 1.5 cos 4x. Evaluate the function
for
The function passes through . Therefore, a
sinusoidal function with period and amplitude 1.5
that passes through the point is y = 1.5 cos
4x.
38. period: 3π; amplitude: ; point:
SOLUTION: Use the period to find b.
Sample answer: One sinusoidal function in which a =
0.5 and b = is y = sin x. Evaluate the
function for
The function passes through . Therefore, a
sinusoidal function with period 3π and amplitude 0.5
that passes through the point is y = sin
x.
39. MULTIPLE REPRESENTATIONS In this problem, you will investigate the change in the graph of a sinusoidal function of the form y = sin x or y = cos x when multiplied by a polynomial function. a. GRAPHICAL Use a graphing calculator to sketch the graphs of y = 2x, y = –2x, and y = 2x cos x on the same coordinate plane, on the interval [–20, 20]. b. VERBAL Describe the behavior of the graph of y = 2x cos x in relation to the graphs of y = 2x and y = –2x. c. GRAPHICAL Use a graphing calculator to
sketch the graphs of y = x2, y = –x
2, and y = x
2 sin x
on the same coordinate plane, on the interval [–20, 20]. d. VERBAL Describe the behavior of the graph of
y = x2 sin x in relation to the graphs of y = x
2 and y
= –x2.
e. ANALYTICAL Make a conjecture as to the behavior of the graph of a sinusoidal function of the form y = sin x or y = cos x when multiplied by polynomial function of the form y = f (x).
SOLUTION: a.
b. The graph of y = 2x cos x oscillates between the graphs of y = 2x and y = –2x. c.
d. The graph of y = x2 sin x oscillates between the
graphs of y = x2 and y = –x
2.
e . The graph of y = f (x) sin x or y = f (x) cos x will oscillate between the graphs of y = f (x) and y = –f(x).
40. CHALLENGE Without graphing, find the exact coordinates of the first maximum point to the right of
the y-axis for
SOLUTION:
First, find the phase shift for
Next, find the period of the function.
The first maximum for one period can be found by
finding So, incorporating the phase shift, the
first maximum to the right of the y-axis is
. Because the amplitude is |4| = 4,
the maximum point is
REASONING Determine whether each statement is true or false . Explain your reasoning.
41. Every sine function of the form y = a sin (bx + c) + d can be written as a cosine function of the form y =a cos (bx + c) + d.
SOLUTION: It is true that every sine function of the form y = a sin (bx + c) + d can be written as a cosine function of the form y = a cos (bx + c) + d. The graph of cosine is a horizontal translation of the sine graph. Therefore, a cosine function can be written from any sine function using the same amplitude and period by applying the necessary phase shift.
For example, consider and
. Phase shift by
to obtain .
42. The period of f (x) = cos 8x is equal to four times the period of g(x) = cos 2x.
SOLUTION: Find the period of f (x) = cos 8x.
Find the period of g(x) = cos 2x.
Four times the period of g(x) = cos 2x is 4 ⋅ or
4 . So, the period of f (x) is the period of g(x).
Therefore, the statement is false.
43. CHALLENGE How many zeros does y = cos
1500x have on the interval 0 ≤ x ≤ 2 ?
SOLUTION: Find the period of y = cos 1500x.
Graph y = cos 1500x on .
The graph of y = cos 1500x has two x-intercepts for one cycle, so the function has 2 zeros per cycle. Find
the number of cycles for y = cos 1500x on [0, 2 ].
So, the graph of y = cos 1500x will complete 1500
cycles on [0, 2 ]. Because there are two zeros per cycle, y = cos 1500x will have 1500(2) or 3000 zeros
on [0, 2 ].
44. PROOF Prove the phase shift formula.
SOLUTION:
Consider y = a sin (bx + c), where a , b, and c ≠ 0. To find a zero of the function, find the value of x for which a sin (bx + c) = 0. Since sin 0 = 0, solving bx + c = 0 will yield a zero of the function.
Therefore, y = 0 when . The value of is
the phase shift. When c > 0: The graph of y = a sin (bx + c) is the
graph of y = a sin x, shifted units to the left.
When c < 0: The graph of y = a sin (bx + c) is the
graph of y = a sin x, shifted units to the right.
Consider the graph of y = cos x below in blue. In this equation a = 1, b = 1 and c = 0. One zero of y = cos x is . The green graph is shifted to the
left. Thus c is – . Then the shifted equation will be
.
45. Writing in Math The Power Tower ride in Sandusky, Ohio, is shown below. Along the side of each tower is a string of lights that send a continuouspulse of light up and down each tower at a constant rate. Explain why the distance d of this light from theground over time t cannot be represented by a sinusoidal function.
SOLUTION: Sample answer: Although the pulse of light can be represented as a function with a period, it is not a sinusoidal function because the distance the pulse of light is from the ground changes at a constant rate. As a result, the graph of this function would resemble the graph below.
The given point lies on the terminal side of an angle θ in standard position. Find the values of
the six trigonometric functions of θ. 46. (−4, 4)
SOLUTION: Use the values of x and y to find r.
Use x = –4, y = 4, and r = to write the six trigonometric ratios.
47. (8, −2)
SOLUTION: Use the values of x and y to find r.
Use x = 8, y = –2, and r = to write the six trigonometric ratios.
48. (−5, −9)
SOLUTION: Use the values of x and y to find r.
Use x = –5, y = – 9, and r = to write the six trigonometric ratios.
49. (4, 5)
SOLUTION: Use the values of x and y to find r.
Use x = 4, y = 5, and r = to write the six trigonometric ratios.
Write each degree measure in radians as a multiple of π and each radian measure in degrees.
50. 25°
SOLUTION: To convert a degree measure to radians, multiply by
51. −420°
SOLUTION: To convert a degree measure to radians, multiply by
52.
SOLUTION: To convert a radian measure to degrees, multiply by
53.
SOLUTION: To convert a radian measure to degrees, multiply by
54. SCIENCE Radiocarbon dating is a method of estimating the age of an organic material by calculating the amount of carbon-14 present in the material. The age of a material can be calculated
using A = t , where A is the age of the
object in years, t is the half-life of carbon-14 or 5700 years, and R is the ratio of the amount of carbon-14 in the sample to the amount of carbon-14 in living tissue. a. A sample of organic material contains 0.000076 gram of carbon-14. A living sample of the same
eSolutions Manual - Powered by Cognero Page 8
4-4 Graphing Sine and Cosine Functions
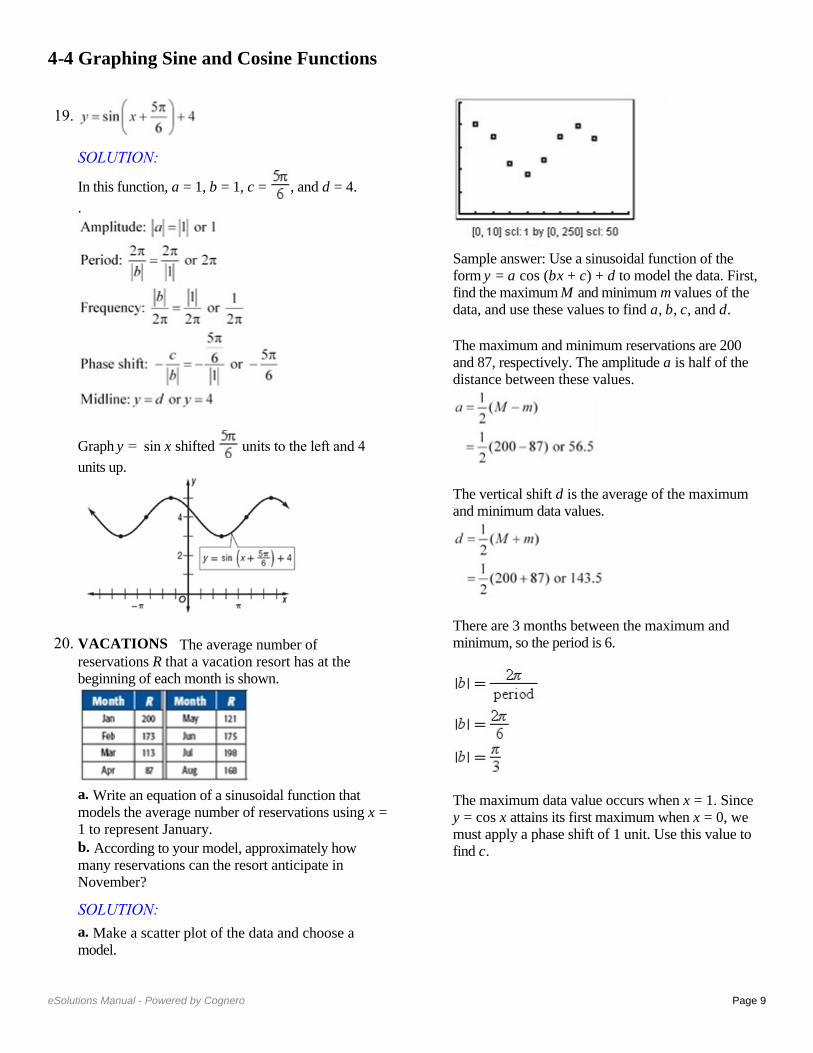
Describe how the graphs of f (x) and g (x) are related. Then find the amplitude of g (x), and sketch two periods of both functions on the same coordinate axes.
1. f (x) = sin x; g(x) = sin x
SOLUTION: The graph of g(x) is the graph of f (x) compressed
vertically. The amplitude of g(x) is or .
Create a table listing the coordinates of the x-intercepts and extrema for f (x) = sin x for one
period, 2 , on the interval [0, 2 ]. Then use the amplitude of g(x) to find corresponding points on its graph.
Sketch the curve through the indicated points for each function. Then repeat the pattern to complete asecond period.
Functions f (x) = sin x g(x) = sin x
x-int (0, 0) (0, 0)
Max
x-int
Min
x-int
2.
SOLUTION: The graph of g(x) is the graph of f (x) compressed
vertically. The amplitude of g(x) is or .
Create a table listing the coordinates of the x-intercepts and extrema for f (x) = cos x for one
period, 2 , on the interval [0, 2 ]. Then use the amplitude of g(x) to find corresponding points on its graph.
Sketch the curve through the indicated points for each function. Then repeat the pattern to complete asecond period.
Function f (x) = cos x
Max (0, 1)
x-int Min
x-in
Min
x-int
Function f (x) = cos x
Max x-int
Min
x-in
Min
x-int
3. f (x) = cos x; g(x) = 6 cos x
SOLUTION: The graph of g(x) is the graph of f (x) expanded
vertically. The amplitude of g(x) is or 6.
Create a table listing the coordinates of the x-intercepts and extrema for f (x) = cos x for one
period, 2 , on the interval [0, 2 ]. Then use the amplitude of g(x) to find corresponding points on its graph.
Sketch the curve through the indicated points for each function. Then repeat the pattern to complete asecond period.
Functions f (x) = cos x g(x) = 6 cos x
Max (0, 1) (0, 6)
x-int
Min
x-int
Max
4. f (x) = sin x; g(x) = −8 sin x
SOLUTION: The graph of g(x) is the graph of f (x) expanded
vertically. The amplitude of g(x) is or 8.
Create a table listing the coordinates of the x-intercepts and extrema for f (x) = sin x for one
period, 2 , on the interval [0, 2 ]. Then use the amplitude of g(x) to find corresponding points on its graph.
Sketch the curve through the indicated points for each function. Then repeat the pattern to complete asecond period.
Function f (x) = sin x
x-int (0, 0)
Max
x-int
Min
x-int
Function g(x) = −8
sin x
x-int (0, 0)
Min
x-int
Max
x-int
Describe how the graphs of f (x) and g (x) are related. Then find the period of g (x), and sketch at least one period of both functions on the same coordinate axes.
5. f (x) = sin x; g(x) = sin 4x
SOLUTION: The graph of g(x) is the graph of f (x) compressed
horizontally. The period of g(x) is . To find
corresponding points on the graph of g(x), change the x-coordinates of those key points on f (x) so that
they range from 0 to , increasing by increments of
.
Sketch the curve through the indicated points for each function. Then repeat the pattern to complete asecond period.
Functions f (x) = sin x g(x) = sin
4x
x-int (0, 0) (0, 0)
Max
x-int
Min
x-int
6. f (x) = cos x; g(x) = cos 2x
SOLUTION: The graph of g(x) is the graph of f (x) compressed
horizontally. The period of g(x) is or . To find
corresponding points on the graph of g(x), change the x-coordinates of those key points on f (x) so that
they range from 0 to , increasing by increments of
.
Sketch the curve through the indicated points for each function. Then repeat the pattern to complete asecond period.
Functions f (x) = cos x g(x) = cos 2x
Max (0, 1) (0, 1)
x-int
Min
x-int
Max
7. f (x) = cos x;
SOLUTION: The graph of g(x) is the graph of f (x) expanded
horizontally. The period of g(x) is . To
find corresponding points on the graph of g(x), change the x-coordinates of those key points on f (x)
so that they range from 0 to , increasing by
increments of or .
Sketch the curve through the indicated points for each function. Then repeat the pattern to complete asecond period.
Functions f (x) = cos x
Max (0, 1) (0, 1)
x-int
Min
x-int
Max
8. f (x) = sin x;
SOLUTION: The graph of g(x) is the graph of f (x) expanded
horizontally. The period of g(x) is . To find corresponding points on the graph of g(x), change the x-coordinates of those key points on f (x) so that they range from 0 to , increasing by increments of
or .
Sketch the curve through the indicated points for each function. Then repeat the pattern to complete asecond period.
Functions f (x) = sin x
x-int (0, 0) (0, 0)
Max
x-int
Min
x-int
9. VOICES The contralto vocal type includes the deepest female singing voice. Some contraltos can sing as low as the E below middle C (E3), which hasa frequency of 165 hertz. Write an equation for a sine function that models the initial behavior of the sound wave associated with E3 having an amplitude of 0.15.
SOLUTION: The general form of the equation will be y = a sin bt,where t is the time in seconds. Because the
amplitude is 0.15, |a|= 0.15. This means that a = ±0.15. The period is the reciprocal of the frequency or
. Use this value to find b.
Sample answer: One sine function that models the
initial behavior is y = 0.15 sin 330 t.
Write a sine function that can be used to model the initial behavior of a sound wave with the frequency and amplitude given.
10. f = 440, a = 0.3
SOLUTION: The general form of the equation is y = a sin bt, where t is the time in seconds. Because the
amplitude is 0.3, = 0.3. This means that a = ±0.3.
The period is the reciprocal of the frequency or
. Use this value to find b.
Using the positive values of a and b, one sine function that models the initial behavior is y = 0.3 sin
880 t.
11. f = 932, a = 0.25
SOLUTION: The general form of the equation is y = a sin bt, where t is the time in seconds. Because the
amplitude is 0.25, = 0.25. This means that a =
±0.25. The period is the reciprocal of the frequency
or . Use this value to find b.
Using the positive values of a and b, one sine function that models the initial behavior is y = 0.25
sin 1864 t.
12. f = 1245, a = 0.12
SOLUTION: The general form of the equation is y = a sin bt, where t is the time in seconds. Because the
amplitude is 0.12, = 0.12. This means that a =
±0.12. The period is the reciprocal of the frequency or
. Use this value to find b.
Using the positive values of a and b, one sine function that models the initial behavior is y = 0.12
sin 2490 t.
13. f = 623, a = 0.2
SOLUTION: The general form of the equation is y = a sin bt, where t is the time in seconds. Because the
amplitude is 0.2, = 0.2. This means that a = ±0.2.
The period is the reciprocal of the frequency or
. Use this value to find b.
Using the positive values of a and b, one sine function that models the initial behavior is y = 0.2 sin
1246 t.
State the amplitude, period, frequency, phase shift, and vertical shift of each function. Then graph two periods of the function.
14.
SOLUTION:
In this function, a = 3, b = 1, c = − , and d = 0.
Because d = 0, there is no vertical shift.
Graph y = 3 sin x shifted units to the right.
15.
SOLUTION:
In this function, a = 1, b = , c = , and d = 0.
Because d = 0, there is no vertical shift.
16. y = 0.25 cos x + 3
SOLUTION:
In this function, a = , b = 1, c = 0, and d = 3.
Graph y = cos x shifted 3 units up.
17. y = sin 3x – 2
SOLUTION: In this function, a = 1, b = 3, c = 0, and d = –2.
Graph y = sin 3x shifted 2 units down.
18.
SOLUTION:
In this function, a = 1, b = 1, c = , and d = –1.
.
Graph y = cos x shifted units to the right and 1
unit down.
19.
SOLUTION:
In this function, a = 1, b = 1, c = , and d = 4.
.
Graph y = sin x shifted units to the left and 4 units up.
20. VACATIONS The average number of reservations R that a vacation resort has at the beginning of each month is shown.
a. Write an equation of a sinusoidal function that models the average number of reservations using x =1 to represent January. b. According to your model, approximately how many reservations can the resort anticipate in November?
SOLUTION: a. Make a scatter plot of the data and choose a model.
Sample answer: Use a sinusoidal function of the form y = a cos (bx + c) + d to model the data. First, find the maximum M and minimum m values of the data, and use these values to find a, b, c, and d. The maximum and minimum reservations are 200 and 87, respectively. The amplitude a is half of the distance between these values.
The vertical shift d is the average of the maximum and minimum data values.
There are 3 months between the maximum and minimum, so the period is 6.
The maximum data value occurs when x = 1. Since y = cos x attains its first maximum when x = 0, we must apply a phase shift of 1 unit. Use this value to find c.
Write a function using the values for a, b, c, and d.
Use b =
b. To find the number of reservations in November, evaluate the model for x = 11.
Therefore, the resort can anticipate about 115 reservations in November.
21. TIDES The table shown below provides data for the first high and low tides of the day for a certain bay during one day in June.
a. Determine the amplitude, period, phase shift, and vertical shift of a sinusoidal function that models the height of the tide. Let x represent the number of hours that the high or low tide occurred after midnight. b. Write a sinusoidal function that models the data. c. According to your model, what was the height of
the tide at 8:45 P.M. that night?
SOLUTION: a. Sample answer: Use a sinusoidal function of the form y = a cos (bx + c) + d to model the data. First, find the amplitude a, which is half of the distance between the heights of the high and low tides.
The vertical shift d is the average of the heights of the high and low tides.
A sinusoid completes half of a period in the time thatit takes to go from its maximum to its minimum value. One period is twice this time. The first high tide occurs 6.5 hours before the first low tide, so the period is 13.
The maximum data value occurs when x ≈ 4.417. Since y = cos x attains its first maximum when x = 0,we must apply a phase shift of 4.417 units. Use this value to find c.
b. Write a function using the values for a, b, c, and
d. Use b =
c. To find the height of the water at 8:45 P.M. that
night, evaluate the model for x = 20.75.
Therefore, the tide was about 7.28 feet high at 8:45
P.M. that night.
22. METEOROLOGY The average monthly temperatures for Boston, Massachusetts are shown.
a. Determine the amplitude, period, phase shift, and vertical shift of a sinusoidal function that models the monthly temperatures using x = 1 to represent January. b. Write an equation of a sinusoidal function that models the monthly temperatures. c. According to your model, what is Boston’s average temperature in August?
SOLUTION: a. The maximum and minimum are 74° and 29°, respectively. The amplitude a is half of the distance between these values.
The vertical shift d is the average of the maximum and minimum data values.
A sinusoid completes half of a period in the time thatit takes to go from its maximum to its minimum value. So, one period is twice this time. The
maximum function value occurs in July, so xmax is 7.
The minimum function value occurs in January, so
xmin is 1. The period is 2(6) = 12.
The maximum data value occurs when x = 7. Since y = cos x attains its first maximum when x = 0, we must apply a phase shift of 7 units. Use this value to find c.
b. Using the values for a, b, c, and d from part a, a sinusoidal function that models that monthly temperatures in Boston is
c. To find the average monthly temperature for Boston in August, evaluate the model for x = 8.
Therefore, the average monthly temperature for Boston in August is about 71°F.
GRAPHING CALCULATOR Find the values of x in the interval – < x < that make each equation or inequality true. (Hint: Use the intersection function.)
23. –sin x = cos x
SOLUTION:
Graph y = −sin x and y = cos x on the same graphing
calculator screen on (−π, π). Use the intersect feature under the CALC menu to determine where the two graphs intersect.
The graphs intersect at about −0.7854 or − and
about 2.356 or . Therefore, on –π < x < π, –sin x
= cos x when x = − and .
24. sin x − cos x = 1
SOLUTION:
Graph y = sin x − cos x and y = 1 on the same
graphing calculator screen on (− , ). Use the intersect feature under the CALC menu to determine where the two graphs intersect.
The graphs intersect at about 1.57 or . Therefore,
on – < x < , sin x − cos x = 1 when x = .
25. sin x + cos x = 0
SOLUTION:
Graph y = sin x + cos x on (−π, π). Use the zero feature under the CALC menu to determine the zeros of the function.
There are zeros at about −0.785 or − or and about
2.356 or . Therefore, on – < x < , sin x + cos
x = 0 when
26. cos x ≤ sin x
SOLUTION:
Graph y = cos x and y = sin x on (−π, π). Use the intersect feature under the CALC menu to determine on what interval(s) cos x ≤ sin x.
The graphs intersect at about –2.356 or – and
about 0.785 or . From the graph, it appears that
cos x ≤ sin x on – < x < – and < x < .
27. sin x cos x > 1
SOLUTION:
Graph y = sin x cos x and y = 1 on (− , ). Use the intersect feature under the CALC menu to determine on what interval(s) sin x cos x > 1.
The graphs do not intersect. Therefore, y = sin x cos
x is not greater than y = 1 for any values of x on –< x < .
28. sin x cos x ≤ 0
SOLUTION:
Graph y = sin x cos x on (−π, π). Use the zero feature under the CALC menu to determine on what interval(s) sin x cos x ≤ 0.
The zeros of y = sin x cos x are about –1.57 or ,
0, and about 1.57 or . From the graph, it appears
that sin x cos x ≤ 0 on < x < 0 and < x < .
29. CAROUSELS A wooden horse on a carousel moves up and down as the carousel spins. When the ride ends, the horse usually stops in a vertical position different from where it started. The position y of the horse after t seconds can be modeled by y =1.5 sin (2t + c), where the phase shift c must be continuously adjusted to compensate for the differentstarting positions. If during one ride the horse
reached a maximum height after seconds, find
the equation that models the horse’s position.
SOLUTION: First, find the period of y = 1.5 sin (2t + c).
Since the period is π, the function will reach a
maximum height at radians. The phase shift is the
difference between the horizontal position of the
function at and radians, which is radians.
Substitute and b into the phase shift formula to
find c.
Therefore, the equation is
30. AMUSEMENT PARKS The position y in feet of a passenger cart relative to the center of a Ferris wheel over t seconds is shown below.
a. Find the time t that it takes for the cart to return toy = 0 during its initial spin. b. Find the period of the Ferris wheel. c. Sketch the graph representing the position of the passenger cart over one period. d. Write a sinusoidal function that models the position of the passenger cart as a function of time t.
SOLUTION: a. From the diagram, the height of the cart is 0 ft when t = 0, and reaches a maximum height of 19 feet when t = 3.75 seconds. So, the cart will return to y = 0 after 2(3.75) or 7.5 seconds. b. The cart completes half of a cycle from t = 0 to t = 7.5. So, the period is 2(7.5) or 15 seconds. c.
d. The amplitude a is half of the maximum and
minimum values. So, a =
The vertical shift d is the average of the maximum
and minimum data values. So,
Because the period of a sinusoidal function is
you can write Therefore,
There is no phase shift because the height of the cartwhen t = 0 is 0 feet, and the sine function has a y-intercept of 0. Therefore, one equation that could be used to model
the position of the passenger cart is y = 19 sin t.
Write an equation that corresponds to each graph.
31.
SOLUTION: Sample answer: There is an x-intercept at 0, so one equation that corresponds to this graph is y = a sin (bx + c) + d. Half of the distance from the maximum to the minimum value of the function is 3. So, the amplitudeis 3. It appears that the function completes one period on
[0, π]. Find b.
The midline appears to be at y = 0, so there does not appear to be any vertical shift. Therefore, one equation that corresponds to this graph is y = 3 sin (2x).
32.
SOLUTION:
Sample answer: Because there is a y-intercept at ,
one equation that corresponds to this graph is y = a cos (bx + c) + d. Half of the distance from the maximum to the
minimum value of the function is . So, the
amplitude is .
It appears that the function completes one period on [0, 6π]. Find b.
The midline appears to be at y = 0, so there does not appear to be any vertical shift. Therefore, one
equation that corresponds to this graph is y = cos
.
33.
SOLUTION: Sample answer: Because there is a y-intercept at 3, one equation that corresponds to this graph is y = a cos (bx + c) + d. Half of the distance from the maximum to the
minimum value of the function is 4 ÷ 2 or 2. So, the amplitude is 2. It appears that the function completes one period on
Find b.
The midline appears to be at y = 1, so there is a vertical shift 1 unit up. Therefore, one equation that corresponds to this graph is y = 2 cos 4x + 1.
34.
SOLUTION: Sample answer: There is an x-intercept at 0, so one equation that corresponds to this graph is y = a sin (bx + c) + d. Half of the distance from the maximum to the
minimum value of the function is 8 ÷ 2 or 4. So, the amplitude is 4. It appears that the function completes one period on [0, 4π]. Find b.
The midline appears to be at y = −2, so there is a vertical shift of 2 units down. Therefore, one equation that corresponds to this graph is y = 4 sin
− 2.
Write a sinusoidal function with the given period and amplitude that passes through the given point.
35. period: ; amplitude: 5; point:
SOLUTION: Use the period to find b.
Sample answer: One sinusoidal function in which a =5 and b = 2 is y = 5 cos 2x. Evaluate the function for
The function passes through . Therefore, a
sinusoidal function with period π and amplitude 5 that
passes through the point is y = 5 cos 2x.
36. period: 4 ; amplitude: 2; point: ( , 2)
SOLUTION: Use the period to find b.
Sample answer: One sinusoidal function in which a =
2 and b = is y = 2 sin . Evaluate the function
for x = π.
The function passes through ( , 2). Therefore, a
sinusoidal function with period 4π and amplitude 2
that passes through the point ( , 2) is y = 2 sin .
37. period: ; amplitude: ; point:
SOLUTION: Use the period to find b.
Sample answer: One sinusoidal function in which a =1.5 and b = 4 is y = 1.5 cos 4x. Evaluate the function
for
The function passes through . Therefore, a
sinusoidal function with period and amplitude 1.5
that passes through the point is y = 1.5 cos
4x.
38. period: 3π; amplitude: ; point:
SOLUTION: Use the period to find b.
Sample answer: One sinusoidal function in which a =
0.5 and b = is y = sin x. Evaluate the
function for
The function passes through . Therefore, a
sinusoidal function with period 3π and amplitude 0.5
that passes through the point is y = sin
x.
39. MULTIPLE REPRESENTATIONS In this problem, you will investigate the change in the graph of a sinusoidal function of the form y = sin x or y = cos x when multiplied by a polynomial function. a. GRAPHICAL Use a graphing calculator to sketch the graphs of y = 2x, y = –2x, and y = 2x cos x on the same coordinate plane, on the interval [–20, 20]. b. VERBAL Describe the behavior of the graph of y = 2x cos x in relation to the graphs of y = 2x and y = –2x. c. GRAPHICAL Use a graphing calculator to
sketch the graphs of y = x2, y = –x
2, and y = x
2 sin x
on the same coordinate plane, on the interval [–20, 20]. d. VERBAL Describe the behavior of the graph of
y = x2 sin x in relation to the graphs of y = x
2 and y
= –x2.
e. ANALYTICAL Make a conjecture as to the behavior of the graph of a sinusoidal function of the form y = sin x or y = cos x when multiplied by polynomial function of the form y = f (x).
SOLUTION: a.
b. The graph of y = 2x cos x oscillates between the graphs of y = 2x and y = –2x. c.
d. The graph of y = x2 sin x oscillates between the
graphs of y = x2 and y = –x
2.
e . The graph of y = f (x) sin x or y = f (x) cos x will oscillate between the graphs of y = f (x) and y = –f(x).
40. CHALLENGE Without graphing, find the exact coordinates of the first maximum point to the right of
the y-axis for
SOLUTION:
First, find the phase shift for
Next, find the period of the function.
The first maximum for one period can be found by
finding So, incorporating the phase shift, the
first maximum to the right of the y-axis is
. Because the amplitude is |4| = 4,
the maximum point is
REASONING Determine whether each statement is true or false . Explain your reasoning.
41. Every sine function of the form y = a sin (bx + c) + d can be written as a cosine function of the form y =a cos (bx + c) + d.
SOLUTION: It is true that every sine function of the form y = a sin (bx + c) + d can be written as a cosine function of the form y = a cos (bx + c) + d. The graph of cosine is a horizontal translation of the sine graph. Therefore, a cosine function can be written from any sine function using the same amplitude and period by applying the necessary phase shift.
For example, consider and
. Phase shift by
to obtain .
42. The period of f (x) = cos 8x is equal to four times the period of g(x) = cos 2x.
SOLUTION: Find the period of f (x) = cos 8x.
Find the period of g(x) = cos 2x.
Four times the period of g(x) = cos 2x is 4 ⋅ or
4 . So, the period of f (x) is the period of g(x).
Therefore, the statement is false.
43. CHALLENGE How many zeros does y = cos
1500x have on the interval 0 ≤ x ≤ 2 ?
SOLUTION: Find the period of y = cos 1500x.
Graph y = cos 1500x on .
The graph of y = cos 1500x has two x-intercepts for one cycle, so the function has 2 zeros per cycle. Find
the number of cycles for y = cos 1500x on [0, 2 ].
So, the graph of y = cos 1500x will complete 1500
cycles on [0, 2 ]. Because there are two zeros per cycle, y = cos 1500x will have 1500(2) or 3000 zeros
on [0, 2 ].
44. PROOF Prove the phase shift formula.
SOLUTION:
Consider y = a sin (bx + c), where a , b, and c ≠ 0. To find a zero of the function, find the value of x for which a sin (bx + c) = 0. Since sin 0 = 0, solving bx + c = 0 will yield a zero of the function.
Therefore, y = 0 when . The value of is
the phase shift. When c > 0: The graph of y = a sin (bx + c) is the
graph of y = a sin x, shifted units to the left.
When c < 0: The graph of y = a sin (bx + c) is the
graph of y = a sin x, shifted units to the right.
Consider the graph of y = cos x below in blue. In this equation a = 1, b = 1 and c = 0. One zero of y = cos x is . The green graph is shifted to the
left. Thus c is – . Then the shifted equation will be
.
45. Writing in Math The Power Tower ride in Sandusky, Ohio, is shown below. Along the side of each tower is a string of lights that send a continuouspulse of light up and down each tower at a constant rate. Explain why the distance d of this light from theground over time t cannot be represented by a sinusoidal function.
SOLUTION: Sample answer: Although the pulse of light can be represented as a function with a period, it is not a sinusoidal function because the distance the pulse of light is from the ground changes at a constant rate. As a result, the graph of this function would resemble the graph below.
The given point lies on the terminal side of an angle θ in standard position. Find the values of
the six trigonometric functions of θ. 46. (−4, 4)
SOLUTION: Use the values of x and y to find r.
Use x = –4, y = 4, and r = to write the six trigonometric ratios.
47. (8, −2)
SOLUTION: Use the values of x and y to find r.
Use x = 8, y = –2, and r = to write the six trigonometric ratios.
48. (−5, −9)
SOLUTION: Use the values of x and y to find r.
Use x = –5, y = – 9, and r = to write the six trigonometric ratios.
49. (4, 5)
SOLUTION: Use the values of x and y to find r.
Use x = 4, y = 5, and r = to write the six trigonometric ratios.
Write each degree measure in radians as a multiple of π and each radian measure in degrees.
50. 25°
SOLUTION: To convert a degree measure to radians, multiply by
51. −420°
SOLUTION: To convert a degree measure to radians, multiply by
52.
SOLUTION: To convert a radian measure to degrees, multiply by
53.
SOLUTION: To convert a radian measure to degrees, multiply by
54. SCIENCE Radiocarbon dating is a method of estimating the age of an organic material by calculating the amount of carbon-14 present in the material. The age of a material can be calculated
using A = t , where A is the age of the
object in years, t is the half-life of carbon-14 or 5700 years, and R is the ratio of the amount of carbon-14 in the sample to the amount of carbon-14 in living tissue. a. A sample of organic material contains 0.000076 gram of carbon-14. A living sample of the same
Describe how the graphs of f (x) and g (x) are related. Then find the amplitude of g (x), and sketch two periods of both functions on the same coordinate axes.
1. f (x) = sin x; g(x) = sin x
SOLUTION: The graph of g(x) is the graph of f (x) compressed
vertically. The amplitude of g(x) is or .
Create a table listing the coordinates of the x-intercepts and extrema for f (x) = sin x for one
period, 2 , on the interval [0, 2 ]. Then use the amplitude of g(x) to find corresponding points on its graph.
Sketch the curve through the indicated points for each function. Then repeat the pattern to complete asecond period.
Functions f (x) = sin x g(x) = sin x
x-int (0, 0) (0, 0)
Max
x-int
Min
x-int
2.
SOLUTION: The graph of g(x) is the graph of f (x) compressed
vertically. The amplitude of g(x) is or .
Create a table listing the coordinates of the x-intercepts and extrema for f (x) = cos x for one
period, 2 , on the interval [0, 2 ]. Then use the amplitude of g(x) to find corresponding points on its graph.
Sketch the curve through the indicated points for each function. Then repeat the pattern to complete asecond period.
Function f (x) = cos x
Max (0, 1)
x-int Min
x-in
Min
x-int
Function f (x) = cos x
Max x-int
Min
x-in
Min
x-int
3. f (x) = cos x; g(x) = 6 cos x
SOLUTION: The graph of g(x) is the graph of f (x) expanded
vertically. The amplitude of g(x) is or 6.
Create a table listing the coordinates of the x-intercepts and extrema for f (x) = cos x for one
period, 2 , on the interval [0, 2 ]. Then use the amplitude of g(x) to find corresponding points on its graph.
Sketch the curve through the indicated points for each function. Then repeat the pattern to complete asecond period.
Functions f (x) = cos x g(x) = 6 cos x
Max (0, 1) (0, 6)
x-int
Min
x-int
Max
4. f (x) = sin x; g(x) = −8 sin x
SOLUTION: The graph of g(x) is the graph of f (x) expanded
vertically. The amplitude of g(x) is or 8.
Create a table listing the coordinates of the x-intercepts and extrema for f (x) = sin x for one
period, 2 , on the interval [0, 2 ]. Then use the amplitude of g(x) to find corresponding points on its graph.
Sketch the curve through the indicated points for each function. Then repeat the pattern to complete asecond period.
Function f (x) = sin x
x-int (0, 0)
Max
x-int
Min
x-int
Function g(x) = −8
sin x
x-int (0, 0)
Min
x-int
Max
x-int
Describe how the graphs of f (x) and g (x) are related. Then find the period of g (x), and sketch at least one period of both functions on the same coordinate axes.
5. f (x) = sin x; g(x) = sin 4x
SOLUTION: The graph of g(x) is the graph of f (x) compressed
horizontally. The period of g(x) is . To find
corresponding points on the graph of g(x), change the x-coordinates of those key points on f (x) so that
they range from 0 to , increasing by increments of
.
Sketch the curve through the indicated points for each function. Then repeat the pattern to complete asecond period.
Functions f (x) = sin x g(x) = sin
4x
x-int (0, 0) (0, 0)
Max
x-int
Min
x-int
6. f (x) = cos x; g(x) = cos 2x
SOLUTION: The graph of g(x) is the graph of f (x) compressed
horizontally. The period of g(x) is or . To find
corresponding points on the graph of g(x), change the x-coordinates of those key points on f (x) so that
they range from 0 to , increasing by increments of
.
Sketch the curve through the indicated points for each function. Then repeat the pattern to complete asecond period.
Functions f (x) = cos x g(x) = cos 2x
Max (0, 1) (0, 1)
x-int
Min
x-int
Max
7. f (x) = cos x;
SOLUTION: The graph of g(x) is the graph of f (x) expanded
horizontally. The period of g(x) is . To
find corresponding points on the graph of g(x), change the x-coordinates of those key points on f (x)
so that they range from 0 to , increasing by
increments of or .
Sketch the curve through the indicated points for each function. Then repeat the pattern to complete asecond period.
Functions f (x) = cos x
Max (0, 1) (0, 1)
x-int
Min
x-int
Max
8. f (x) = sin x;
SOLUTION: The graph of g(x) is the graph of f (x) expanded
horizontally. The period of g(x) is . To find corresponding points on the graph of g(x), change the x-coordinates of those key points on f (x) so that they range from 0 to , increasing by increments of
or .
Sketch the curve through the indicated points for each function. Then repeat the pattern to complete asecond period.
Functions f (x) = sin x
x-int (0, 0) (0, 0)
Max
x-int
Min
x-int
9. VOICES The contralto vocal type includes the deepest female singing voice. Some contraltos can sing as low as the E below middle C (E3), which hasa frequency of 165 hertz. Write an equation for a sine function that models the initial behavior of the sound wave associated with E3 having an amplitude of 0.15.
SOLUTION: The general form of the equation will be y = a sin bt,where t is the time in seconds. Because the
amplitude is 0.15, |a|= 0.15. This means that a = ±0.15. The period is the reciprocal of the frequency or
. Use this value to find b.
Sample answer: One sine function that models the
initial behavior is y = 0.15 sin 330 t.
Write a sine function that can be used to model the initial behavior of a sound wave with the frequency and amplitude given.
10. f = 440, a = 0.3
SOLUTION: The general form of the equation is y = a sin bt, where t is the time in seconds. Because the
amplitude is 0.3, = 0.3. This means that a = ±0.3.
The period is the reciprocal of the frequency or
. Use this value to find b.
Using the positive values of a and b, one sine function that models the initial behavior is y = 0.3 sin
880 t.
11. f = 932, a = 0.25
SOLUTION: The general form of the equation is y = a sin bt, where t is the time in seconds. Because the
amplitude is 0.25, = 0.25. This means that a =
±0.25. The period is the reciprocal of the frequency
or . Use this value to find b.
Using the positive values of a and b, one sine function that models the initial behavior is y = 0.25
sin 1864 t.
12. f = 1245, a = 0.12
SOLUTION: The general form of the equation is y = a sin bt, where t is the time in seconds. Because the
amplitude is 0.12, = 0.12. This means that a =
±0.12. The period is the reciprocal of the frequency or
. Use this value to find b.
Using the positive values of a and b, one sine function that models the initial behavior is y = 0.12
sin 2490 t.
13. f = 623, a = 0.2
SOLUTION: The general form of the equation is y = a sin bt, where t is the time in seconds. Because the
amplitude is 0.2, = 0.2. This means that a = ±0.2.
The period is the reciprocal of the frequency or
. Use this value to find b.
Using the positive values of a and b, one sine function that models the initial behavior is y = 0.2 sin
1246 t.
State the amplitude, period, frequency, phase shift, and vertical shift of each function. Then graph two periods of the function.
14.
SOLUTION:
In this function, a = 3, b = 1, c = − , and d = 0.
Because d = 0, there is no vertical shift.
Graph y = 3 sin x shifted units to the right.
15.
SOLUTION:
In this function, a = 1, b = , c = , and d = 0.
Because d = 0, there is no vertical shift.
16. y = 0.25 cos x + 3
SOLUTION:
In this function, a = , b = 1, c = 0, and d = 3.
Graph y = cos x shifted 3 units up.
17. y = sin 3x – 2
SOLUTION: In this function, a = 1, b = 3, c = 0, and d = –2.
Graph y = sin 3x shifted 2 units down.
18.
SOLUTION:
In this function, a = 1, b = 1, c = , and d = –1.
.
Graph y = cos x shifted units to the right and 1
unit down.
19.
SOLUTION:
In this function, a = 1, b = 1, c = , and d = 4.
.
Graph y = sin x shifted units to the left and 4 units up.
20. VACATIONS The average number of reservations R that a vacation resort has at the beginning of each month is shown.
a. Write an equation of a sinusoidal function that models the average number of reservations using x =1 to represent January. b. According to your model, approximately how many reservations can the resort anticipate in November?
SOLUTION: a. Make a scatter plot of the data and choose a model.
Sample answer: Use a sinusoidal function of the form y = a cos (bx + c) + d to model the data. First, find the maximum M and minimum m values of the data, and use these values to find a, b, c, and d. The maximum and minimum reservations are 200 and 87, respectively. The amplitude a is half of the distance between these values.
The vertical shift d is the average of the maximum and minimum data values.
There are 3 months between the maximum and minimum, so the period is 6.
The maximum data value occurs when x = 1. Since y = cos x attains its first maximum when x = 0, we must apply a phase shift of 1 unit. Use this value to find c.
Write a function using the values for a, b, c, and d.
Use b =
b. To find the number of reservations in November, evaluate the model for x = 11.
Therefore, the resort can anticipate about 115 reservations in November.
21. TIDES The table shown below provides data for the first high and low tides of the day for a certain bay during one day in June.
a. Determine the amplitude, period, phase shift, and vertical shift of a sinusoidal function that models the height of the tide. Let x represent the number of hours that the high or low tide occurred after midnight. b. Write a sinusoidal function that models the data. c. According to your model, what was the height of
the tide at 8:45 P.M. that night?
SOLUTION: a. Sample answer: Use a sinusoidal function of the form y = a cos (bx + c) + d to model the data. First, find the amplitude a, which is half of the distance between the heights of the high and low tides.
The vertical shift d is the average of the heights of the high and low tides.
A sinusoid completes half of a period in the time thatit takes to go from its maximum to its minimum value. One period is twice this time. The first high tide occurs 6.5 hours before the first low tide, so the period is 13.
The maximum data value occurs when x ≈ 4.417. Since y = cos x attains its first maximum when x = 0,we must apply a phase shift of 4.417 units. Use this value to find c.
b. Write a function using the values for a, b, c, and
d. Use b =
c. To find the height of the water at 8:45 P.M. that
night, evaluate the model for x = 20.75.
Therefore, the tide was about 7.28 feet high at 8:45
P.M. that night.
22. METEOROLOGY The average monthly temperatures for Boston, Massachusetts are shown.
a. Determine the amplitude, period, phase shift, and vertical shift of a sinusoidal function that models the monthly temperatures using x = 1 to represent January. b. Write an equation of a sinusoidal function that models the monthly temperatures. c. According to your model, what is Boston’s average temperature in August?
SOLUTION: a. The maximum and minimum are 74° and 29°, respectively. The amplitude a is half of the distance between these values.
The vertical shift d is the average of the maximum and minimum data values.
A sinusoid completes half of a period in the time thatit takes to go from its maximum to its minimum value. So, one period is twice this time. The
maximum function value occurs in July, so xmax is 7.
The minimum function value occurs in January, so
xmin is 1. The period is 2(6) = 12.
The maximum data value occurs when x = 7. Since y = cos x attains its first maximum when x = 0, we must apply a phase shift of 7 units. Use this value to find c.
b. Using the values for a, b, c, and d from part a, a sinusoidal function that models that monthly temperatures in Boston is
c. To find the average monthly temperature for Boston in August, evaluate the model for x = 8.
Therefore, the average monthly temperature for Boston in August is about 71°F.
GRAPHING CALCULATOR Find the values of x in the interval – < x < that make each equation or inequality true. (Hint: Use the intersection function.)
23. –sin x = cos x
SOLUTION:
Graph y = −sin x and y = cos x on the same graphing
calculator screen on (−π, π). Use the intersect feature under the CALC menu to determine where the two graphs intersect.
The graphs intersect at about −0.7854 or − and
about 2.356 or . Therefore, on –π < x < π, –sin x
= cos x when x = − and .
24. sin x − cos x = 1
SOLUTION:
Graph y = sin x − cos x and y = 1 on the same
graphing calculator screen on (− , ). Use the intersect feature under the CALC menu to determine where the two graphs intersect.
The graphs intersect at about 1.57 or . Therefore,
on – < x < , sin x − cos x = 1 when x = .
25. sin x + cos x = 0
SOLUTION:
Graph y = sin x + cos x on (−π, π). Use the zero feature under the CALC menu to determine the zeros of the function.
There are zeros at about −0.785 or − or and about
2.356 or . Therefore, on – < x < , sin x + cos
x = 0 when
26. cos x ≤ sin x
SOLUTION:
Graph y = cos x and y = sin x on (−π, π). Use the intersect feature under the CALC menu to determine on what interval(s) cos x ≤ sin x.
The graphs intersect at about –2.356 or – and
about 0.785 or . From the graph, it appears that
cos x ≤ sin x on – < x < – and < x < .
27. sin x cos x > 1
SOLUTION:
Graph y = sin x cos x and y = 1 on (− , ). Use the intersect feature under the CALC menu to determine on what interval(s) sin x cos x > 1.
The graphs do not intersect. Therefore, y = sin x cos
x is not greater than y = 1 for any values of x on –< x < .
28. sin x cos x ≤ 0
SOLUTION:
Graph y = sin x cos x on (−π, π). Use the zero feature under the CALC menu to determine on what interval(s) sin x cos x ≤ 0.
The zeros of y = sin x cos x are about –1.57 or ,
0, and about 1.57 or . From the graph, it appears
that sin x cos x ≤ 0 on < x < 0 and < x < .
29. CAROUSELS A wooden horse on a carousel moves up and down as the carousel spins. When the ride ends, the horse usually stops in a vertical position different from where it started. The position y of the horse after t seconds can be modeled by y =1.5 sin (2t + c), where the phase shift c must be continuously adjusted to compensate for the differentstarting positions. If during one ride the horse
reached a maximum height after seconds, find
the equation that models the horse’s position.
SOLUTION: First, find the period of y = 1.5 sin (2t + c).
Since the period is π, the function will reach a
maximum height at radians. The phase shift is the
difference between the horizontal position of the
function at and radians, which is radians.
Substitute and b into the phase shift formula to
find c.
Therefore, the equation is
30. AMUSEMENT PARKS The position y in feet of a passenger cart relative to the center of a Ferris wheel over t seconds is shown below.
a. Find the time t that it takes for the cart to return toy = 0 during its initial spin. b. Find the period of the Ferris wheel. c. Sketch the graph representing the position of the passenger cart over one period. d. Write a sinusoidal function that models the position of the passenger cart as a function of time t.
SOLUTION: a. From the diagram, the height of the cart is 0 ft when t = 0, and reaches a maximum height of 19 feet when t = 3.75 seconds. So, the cart will return to y = 0 after 2(3.75) or 7.5 seconds. b. The cart completes half of a cycle from t = 0 to t = 7.5. So, the period is 2(7.5) or 15 seconds. c.
d. The amplitude a is half of the maximum and
minimum values. So, a =
The vertical shift d is the average of the maximum
and minimum data values. So,
Because the period of a sinusoidal function is
you can write Therefore,
There is no phase shift because the height of the cartwhen t = 0 is 0 feet, and the sine function has a y-intercept of 0. Therefore, one equation that could be used to model
the position of the passenger cart is y = 19 sin t.
Write an equation that corresponds to each graph.
31.
SOLUTION: Sample answer: There is an x-intercept at 0, so one equation that corresponds to this graph is y = a sin (bx + c) + d. Half of the distance from the maximum to the minimum value of the function is 3. So, the amplitudeis 3. It appears that the function completes one period on
[0, π]. Find b.
The midline appears to be at y = 0, so there does not appear to be any vertical shift. Therefore, one equation that corresponds to this graph is y = 3 sin (2x).
32.
SOLUTION:
Sample answer: Because there is a y-intercept at ,
one equation that corresponds to this graph is y = a cos (bx + c) + d. Half of the distance from the maximum to the
minimum value of the function is . So, the
amplitude is .
It appears that the function completes one period on [0, 6π]. Find b.
The midline appears to be at y = 0, so there does not appear to be any vertical shift. Therefore, one
equation that corresponds to this graph is y = cos
.
33.
SOLUTION: Sample answer: Because there is a y-intercept at 3, one equation that corresponds to this graph is y = a cos (bx + c) + d. Half of the distance from the maximum to the
minimum value of the function is 4 ÷ 2 or 2. So, the amplitude is 2. It appears that the function completes one period on
Find b.
The midline appears to be at y = 1, so there is a vertical shift 1 unit up. Therefore, one equation that corresponds to this graph is y = 2 cos 4x + 1.
34.
SOLUTION: Sample answer: There is an x-intercept at 0, so one equation that corresponds to this graph is y = a sin (bx + c) + d. Half of the distance from the maximum to the
minimum value of the function is 8 ÷ 2 or 4. So, the amplitude is 4. It appears that the function completes one period on [0, 4π]. Find b.
The midline appears to be at y = −2, so there is a vertical shift of 2 units down. Therefore, one equation that corresponds to this graph is y = 4 sin
− 2.
Write a sinusoidal function with the given period and amplitude that passes through the given point.
35. period: ; amplitude: 5; point:
SOLUTION: Use the period to find b.
Sample answer: One sinusoidal function in which a =5 and b = 2 is y = 5 cos 2x. Evaluate the function for
The function passes through . Therefore, a
sinusoidal function with period π and amplitude 5 that
passes through the point is y = 5 cos 2x.
36. period: 4 ; amplitude: 2; point: ( , 2)
SOLUTION: Use the period to find b.
Sample answer: One sinusoidal function in which a =
2 and b = is y = 2 sin . Evaluate the function
for x = π.
The function passes through ( , 2). Therefore, a
sinusoidal function with period 4π and amplitude 2
that passes through the point ( , 2) is y = 2 sin .
37. period: ; amplitude: ; point:
SOLUTION: Use the period to find b.
Sample answer: One sinusoidal function in which a =1.5 and b = 4 is y = 1.5 cos 4x. Evaluate the function
for
The function passes through . Therefore, a
sinusoidal function with period and amplitude 1.5
that passes through the point is y = 1.5 cos
4x.
38. period: 3π; amplitude: ; point:
SOLUTION: Use the period to find b.
Sample answer: One sinusoidal function in which a =
0.5 and b = is y = sin x. Evaluate the
function for
The function passes through . Therefore, a
sinusoidal function with period 3π and amplitude 0.5
that passes through the point is y = sin
x.
39. MULTIPLE REPRESENTATIONS In this problem, you will investigate the change in the graph of a sinusoidal function of the form y = sin x or y = cos x when multiplied by a polynomial function. a. GRAPHICAL Use a graphing calculator to sketch the graphs of y = 2x, y = –2x, and y = 2x cos x on the same coordinate plane, on the interval [–20, 20]. b. VERBAL Describe the behavior of the graph of y = 2x cos x in relation to the graphs of y = 2x and y = –2x. c. GRAPHICAL Use a graphing calculator to
sketch the graphs of y = x2, y = –x
2, and y = x
2 sin x
on the same coordinate plane, on the interval [–20, 20]. d. VERBAL Describe the behavior of the graph of
y = x2 sin x in relation to the graphs of y = x
2 and y
= –x2.
e. ANALYTICAL Make a conjecture as to the behavior of the graph of a sinusoidal function of the form y = sin x or y = cos x when multiplied by polynomial function of the form y = f (x).
SOLUTION: a.
b. The graph of y = 2x cos x oscillates between the graphs of y = 2x and y = –2x. c.
d. The graph of y = x2 sin x oscillates between the
graphs of y = x2 and y = –x
2.
e . The graph of y = f (x) sin x or y = f (x) cos x will oscillate between the graphs of y = f (x) and y = –f(x).
40. CHALLENGE Without graphing, find the exact coordinates of the first maximum point to the right of
the y-axis for
SOLUTION:
First, find the phase shift for
Next, find the period of the function.
The first maximum for one period can be found by
finding So, incorporating the phase shift, the
first maximum to the right of the y-axis is
. Because the amplitude is |4| = 4,
the maximum point is
REASONING Determine whether each statement is true or false . Explain your reasoning.
41. Every sine function of the form y = a sin (bx + c) + d can be written as a cosine function of the form y =a cos (bx + c) + d.
SOLUTION: It is true that every sine function of the form y = a sin (bx + c) + d can be written as a cosine function of the form y = a cos (bx + c) + d. The graph of cosine is a horizontal translation of the sine graph. Therefore, a cosine function can be written from any sine function using the same amplitude and period by applying the necessary phase shift.
For example, consider and
. Phase shift by
to obtain .
42. The period of f (x) = cos 8x is equal to four times the period of g(x) = cos 2x.
SOLUTION: Find the period of f (x) = cos 8x.
Find the period of g(x) = cos 2x.
Four times the period of g(x) = cos 2x is 4 ⋅ or
4 . So, the period of f (x) is the period of g(x).
Therefore, the statement is false.
43. CHALLENGE How many zeros does y = cos
1500x have on the interval 0 ≤ x ≤ 2 ?
SOLUTION: Find the period of y = cos 1500x.
Graph y = cos 1500x on .
The graph of y = cos 1500x has two x-intercepts for one cycle, so the function has 2 zeros per cycle. Find
the number of cycles for y = cos 1500x on [0, 2 ].
So, the graph of y = cos 1500x will complete 1500
cycles on [0, 2 ]. Because there are two zeros per cycle, y = cos 1500x will have 1500(2) or 3000 zeros
on [0, 2 ].
44. PROOF Prove the phase shift formula.
SOLUTION:
Consider y = a sin (bx + c), where a , b, and c ≠ 0. To find a zero of the function, find the value of x for which a sin (bx + c) = 0. Since sin 0 = 0, solving bx + c = 0 will yield a zero of the function.
Therefore, y = 0 when . The value of is
the phase shift. When c > 0: The graph of y = a sin (bx + c) is the
graph of y = a sin x, shifted units to the left.
When c < 0: The graph of y = a sin (bx + c) is the
graph of y = a sin x, shifted units to the right.
Consider the graph of y = cos x below in blue. In this equation a = 1, b = 1 and c = 0. One zero of y = cos x is . The green graph is shifted to the
left. Thus c is – . Then the shifted equation will be
.
45. Writing in Math The Power Tower ride in Sandusky, Ohio, is shown below. Along the side of each tower is a string of lights that send a continuouspulse of light up and down each tower at a constant rate. Explain why the distance d of this light from theground over time t cannot be represented by a sinusoidal function.
SOLUTION: Sample answer: Although the pulse of light can be represented as a function with a period, it is not a sinusoidal function because the distance the pulse of light is from the ground changes at a constant rate. As a result, the graph of this function would resemble the graph below.
The given point lies on the terminal side of an angle θ in standard position. Find the values of
the six trigonometric functions of θ. 46. (−4, 4)
SOLUTION: Use the values of x and y to find r.
Use x = –4, y = 4, and r = to write the six trigonometric ratios.
47. (8, −2)
SOLUTION: Use the values of x and y to find r.
Use x = 8, y = –2, and r = to write the six trigonometric ratios.
48. (−5, −9)
SOLUTION: Use the values of x and y to find r.
Use x = –5, y = – 9, and r = to write the six trigonometric ratios.
49. (4, 5)
SOLUTION: Use the values of x and y to find r.
Use x = 4, y = 5, and r = to write the six trigonometric ratios.
Write each degree measure in radians as a multiple of π and each radian measure in degrees.
50. 25°
SOLUTION: To convert a degree measure to radians, multiply by
51. −420°
SOLUTION: To convert a degree measure to radians, multiply by
52.
SOLUTION: To convert a radian measure to degrees, multiply by
53.
SOLUTION: To convert a radian measure to degrees, multiply by
54. SCIENCE Radiocarbon dating is a method of estimating the age of an organic material by calculating the amount of carbon-14 present in the material. The age of a material can be calculated
using A = t , where A is the age of the
object in years, t is the half-life of carbon-14 or 5700 years, and R is the ratio of the amount of carbon-14 in the sample to the amount of carbon-14 in living tissue. a. A sample of organic material contains 0.000076 gram of carbon-14. A living sample of the same
eSolutions Manual - Powered by Cognero Page 9
4-4 Graphing Sine and Cosine Functions
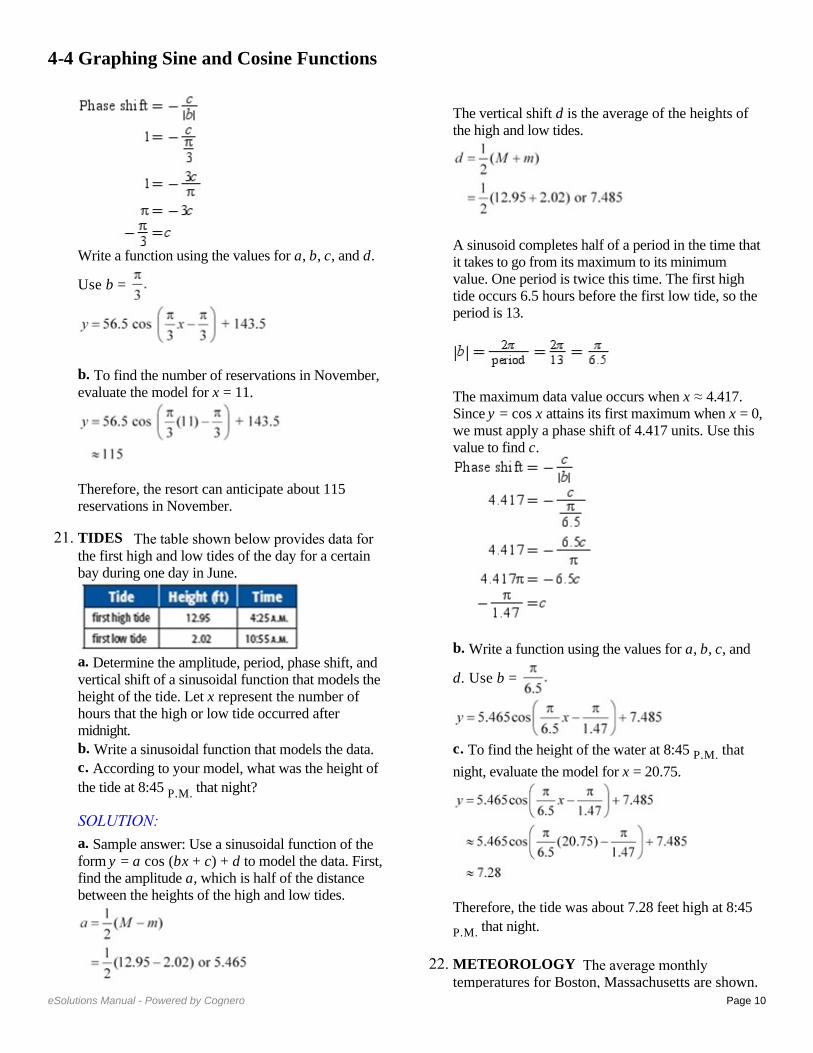
Describe how the graphs of f (x) and g (x) are related. Then find the amplitude of g (x), and sketch two periods of both functions on the same coordinate axes.
1. f (x) = sin x; g(x) = sin x
SOLUTION: The graph of g(x) is the graph of f (x) compressed
vertically. The amplitude of g(x) is or .
Create a table listing the coordinates of the x-intercepts and extrema for f (x) = sin x for one
period, 2 , on the interval [0, 2 ]. Then use the amplitude of g(x) to find corresponding points on its graph.
Sketch the curve through the indicated points for each function. Then repeat the pattern to complete asecond period.
Functions f (x) = sin x g(x) = sin x
x-int (0, 0) (0, 0)
Max
x-int
Min
x-int
2.
SOLUTION: The graph of g(x) is the graph of f (x) compressed
vertically. The amplitude of g(x) is or .
Create a table listing the coordinates of the x-intercepts and extrema for f (x) = cos x for one
period, 2 , on the interval [0, 2 ]. Then use the amplitude of g(x) to find corresponding points on its graph.
Sketch the curve through the indicated points for each function. Then repeat the pattern to complete asecond period.
Function f (x) = cos x
Max (0, 1)
x-int Min
x-in
Min
x-int
Function f (x) = cos x
Max x-int
Min
x-in
Min
x-int
3. f (x) = cos x; g(x) = 6 cos x
SOLUTION: The graph of g(x) is the graph of f (x) expanded
vertically. The amplitude of g(x) is or 6.
Create a table listing the coordinates of the x-intercepts and extrema for f (x) = cos x for one
period, 2 , on the interval [0, 2 ]. Then use the amplitude of g(x) to find corresponding points on its graph.
Sketch the curve through the indicated points for each function. Then repeat the pattern to complete asecond period.
Functions f (x) = cos x g(x) = 6 cos x
Max (0, 1) (0, 6)
x-int
Min
x-int
Max
4. f (x) = sin x; g(x) = −8 sin x
SOLUTION: The graph of g(x) is the graph of f (x) expanded
vertically. The amplitude of g(x) is or 8.
Create a table listing the coordinates of the x-intercepts and extrema for f (x) = sin x for one
period, 2 , on the interval [0, 2 ]. Then use the amplitude of g(x) to find corresponding points on its graph.
Sketch the curve through the indicated points for each function. Then repeat the pattern to complete asecond period.
Function f (x) = sin x
x-int (0, 0)
Max
x-int
Min
x-int
Function g(x) = −8
sin x
x-int (0, 0)
Min
x-int
Max
x-int
Describe how the graphs of f (x) and g (x) are related. Then find the period of g (x), and sketch at least one period of both functions on the same coordinate axes.
5. f (x) = sin x; g(x) = sin 4x
SOLUTION: The graph of g(x) is the graph of f (x) compressed
horizontally. The period of g(x) is . To find
corresponding points on the graph of g(x), change the x-coordinates of those key points on f (x) so that
they range from 0 to , increasing by increments of
.
Sketch the curve through the indicated points for each function. Then repeat the pattern to complete asecond period.
Functions f (x) = sin x g(x) = sin
4x
x-int (0, 0) (0, 0)
Max
x-int
Min
x-int
6. f (x) = cos x; g(x) = cos 2x
SOLUTION: The graph of g(x) is the graph of f (x) compressed
horizontally. The period of g(x) is or . To find
corresponding points on the graph of g(x), change the x-coordinates of those key points on f (x) so that
they range from 0 to , increasing by increments of
.
Sketch the curve through the indicated points for each function. Then repeat the pattern to complete asecond period.
Functions f (x) = cos x g(x) = cos 2x
Max (0, 1) (0, 1)
x-int
Min
x-int
Max
7. f (x) = cos x;
SOLUTION: The graph of g(x) is the graph of f (x) expanded
horizontally. The period of g(x) is . To
find corresponding points on the graph of g(x), change the x-coordinates of those key points on f (x)
so that they range from 0 to , increasing by
increments of or .
Sketch the curve through the indicated points for each function. Then repeat the pattern to complete asecond period.
Functions f (x) = cos x
Max (0, 1) (0, 1)
x-int
Min
x-int
Max
8. f (x) = sin x;
SOLUTION: The graph of g(x) is the graph of f (x) expanded
horizontally. The period of g(x) is . To find corresponding points on the graph of g(x), change the x-coordinates of those key points on f (x) so that they range from 0 to , increasing by increments of
or .
Sketch the curve through the indicated points for each function. Then repeat the pattern to complete asecond period.
Functions f (x) = sin x
x-int (0, 0) (0, 0)
Max
x-int
Min
x-int
9. VOICES The contralto vocal type includes the deepest female singing voice. Some contraltos can sing as low as the E below middle C (E3), which hasa frequency of 165 hertz. Write an equation for a sine function that models the initial behavior of the sound wave associated with E3 having an amplitude of 0.15.
SOLUTION: The general form of the equation will be y = a sin bt,where t is the time in seconds. Because the
amplitude is 0.15, |a|= 0.15. This means that a = ±0.15. The period is the reciprocal of the frequency or
. Use this value to find b.
Sample answer: One sine function that models the
initial behavior is y = 0.15 sin 330 t.
Write a sine function that can be used to model the initial behavior of a sound wave with the frequency and amplitude given.
10. f = 440, a = 0.3
SOLUTION: The general form of the equation is y = a sin bt, where t is the time in seconds. Because the
amplitude is 0.3, = 0.3. This means that a = ±0.3.
The period is the reciprocal of the frequency or
. Use this value to find b.
Using the positive values of a and b, one sine function that models the initial behavior is y = 0.3 sin
880 t.
11. f = 932, a = 0.25
SOLUTION: The general form of the equation is y = a sin bt, where t is the time in seconds. Because the
amplitude is 0.25, = 0.25. This means that a =
±0.25. The period is the reciprocal of the frequency
or . Use this value to find b.
Using the positive values of a and b, one sine function that models the initial behavior is y = 0.25
sin 1864 t.
12. f = 1245, a = 0.12
SOLUTION: The general form of the equation is y = a sin bt, where t is the time in seconds. Because the
amplitude is 0.12, = 0.12. This means that a =
±0.12. The period is the reciprocal of the frequency or
. Use this value to find b.
Using the positive values of a and b, one sine function that models the initial behavior is y = 0.12
sin 2490 t.
13. f = 623, a = 0.2
SOLUTION: The general form of the equation is y = a sin bt, where t is the time in seconds. Because the
amplitude is 0.2, = 0.2. This means that a = ±0.2.
The period is the reciprocal of the frequency or
. Use this value to find b.
Using the positive values of a and b, one sine function that models the initial behavior is y = 0.2 sin
1246 t.
State the amplitude, period, frequency, phase shift, and vertical shift of each function. Then graph two periods of the function.
14.
SOLUTION:
In this function, a = 3, b = 1, c = − , and d = 0.
Because d = 0, there is no vertical shift.
Graph y = 3 sin x shifted units to the right.
15.
SOLUTION:
In this function, a = 1, b = , c = , and d = 0.
Because d = 0, there is no vertical shift.
16. y = 0.25 cos x + 3
SOLUTION:
In this function, a = , b = 1, c = 0, and d = 3.
Graph y = cos x shifted 3 units up.
17. y = sin 3x – 2
SOLUTION: In this function, a = 1, b = 3, c = 0, and d = –2.
Graph y = sin 3x shifted 2 units down.
18.
SOLUTION:
In this function, a = 1, b = 1, c = , and d = –1.
.
Graph y = cos x shifted units to the right and 1
unit down.
19.
SOLUTION:
In this function, a = 1, b = 1, c = , and d = 4.
.
Graph y = sin x shifted units to the left and 4 units up.
20. VACATIONS The average number of reservations R that a vacation resort has at the beginning of each month is shown.
a. Write an equation of a sinusoidal function that models the average number of reservations using x =1 to represent January. b. According to your model, approximately how many reservations can the resort anticipate in November?
SOLUTION: a. Make a scatter plot of the data and choose a model.
Sample answer: Use a sinusoidal function of the form y = a cos (bx + c) + d to model the data. First, find the maximum M and minimum m values of the data, and use these values to find a, b, c, and d. The maximum and minimum reservations are 200 and 87, respectively. The amplitude a is half of the distance between these values.
The vertical shift d is the average of the maximum and minimum data values.
There are 3 months between the maximum and minimum, so the period is 6.
The maximum data value occurs when x = 1. Since y = cos x attains its first maximum when x = 0, we must apply a phase shift of 1 unit. Use this value to find c.
Write a function using the values for a, b, c, and d.
Use b =
b. To find the number of reservations in November, evaluate the model for x = 11.
Therefore, the resort can anticipate about 115 reservations in November.
21. TIDES The table shown below provides data for the first high and low tides of the day for a certain bay during one day in June.
a. Determine the amplitude, period, phase shift, and vertical shift of a sinusoidal function that models the height of the tide. Let x represent the number of hours that the high or low tide occurred after midnight. b. Write a sinusoidal function that models the data. c. According to your model, what was the height of
the tide at 8:45 P.M. that night?
SOLUTION: a. Sample answer: Use a sinusoidal function of the form y = a cos (bx + c) + d to model the data. First, find the amplitude a, which is half of the distance between the heights of the high and low tides.
The vertical shift d is the average of the heights of the high and low tides.
A sinusoid completes half of a period in the time thatit takes to go from its maximum to its minimum value. One period is twice this time. The first high tide occurs 6.5 hours before the first low tide, so the period is 13.
The maximum data value occurs when x ≈ 4.417. Since y = cos x attains its first maximum when x = 0,we must apply a phase shift of 4.417 units. Use this value to find c.
b. Write a function using the values for a, b, c, and
d. Use b =
c. To find the height of the water at 8:45 P.M. that
night, evaluate the model for x = 20.75.
Therefore, the tide was about 7.28 feet high at 8:45
P.M. that night.
22. METEOROLOGY The average monthly temperatures for Boston, Massachusetts are shown.
a. Determine the amplitude, period, phase shift, and vertical shift of a sinusoidal function that models the monthly temperatures using x = 1 to represent January. b. Write an equation of a sinusoidal function that models the monthly temperatures. c. According to your model, what is Boston’s average temperature in August?
SOLUTION: a. The maximum and minimum are 74° and 29°, respectively. The amplitude a is half of the distance between these values.
The vertical shift d is the average of the maximum and minimum data values.
A sinusoid completes half of a period in the time thatit takes to go from its maximum to its minimum value. So, one period is twice this time. The
maximum function value occurs in July, so xmax is 7.
The minimum function value occurs in January, so
xmin is 1. The period is 2(6) = 12.
The maximum data value occurs when x = 7. Since y = cos x attains its first maximum when x = 0, we must apply a phase shift of 7 units. Use this value to find c.
b. Using the values for a, b, c, and d from part a, a sinusoidal function that models that monthly temperatures in Boston is
c. To find the average monthly temperature for Boston in August, evaluate the model for x = 8.
Therefore, the average monthly temperature for Boston in August is about 71°F.
GRAPHING CALCULATOR Find the values of x in the interval – < x < that make each equation or inequality true. (Hint: Use the intersection function.)
23. –sin x = cos x
SOLUTION:
Graph y = −sin x and y = cos x on the same graphing
calculator screen on (−π, π). Use the intersect feature under the CALC menu to determine where the two graphs intersect.
The graphs intersect at about −0.7854 or − and
about 2.356 or . Therefore, on –π < x < π, –sin x
= cos x when x = − and .
24. sin x − cos x = 1
SOLUTION:
Graph y = sin x − cos x and y = 1 on the same
graphing calculator screen on (− , ). Use the intersect feature under the CALC menu to determine where the two graphs intersect.
The graphs intersect at about 1.57 or . Therefore,
on – < x < , sin x − cos x = 1 when x = .
25. sin x + cos x = 0
SOLUTION:
Graph y = sin x + cos x on (−π, π). Use the zero feature under the CALC menu to determine the zeros of the function.
There are zeros at about −0.785 or − or and about
2.356 or . Therefore, on – < x < , sin x + cos
x = 0 when
26. cos x ≤ sin x
SOLUTION:
Graph y = cos x and y = sin x on (−π, π). Use the intersect feature under the CALC menu to determine on what interval(s) cos x ≤ sin x.
The graphs intersect at about –2.356 or – and
about 0.785 or . From the graph, it appears that
cos x ≤ sin x on – < x < – and < x < .
27. sin x cos x > 1
SOLUTION:
Graph y = sin x cos x and y = 1 on (− , ). Use the intersect feature under the CALC menu to determine on what interval(s) sin x cos x > 1.
The graphs do not intersect. Therefore, y = sin x cos
x is not greater than y = 1 for any values of x on –< x < .
28. sin x cos x ≤ 0
SOLUTION:
Graph y = sin x cos x on (−π, π). Use the zero feature under the CALC menu to determine on what interval(s) sin x cos x ≤ 0.
The zeros of y = sin x cos x are about –1.57 or ,
0, and about 1.57 or . From the graph, it appears
that sin x cos x ≤ 0 on < x < 0 and < x < .
29. CAROUSELS A wooden horse on a carousel moves up and down as the carousel spins. When the ride ends, the horse usually stops in a vertical position different from where it started. The position y of the horse after t seconds can be modeled by y =1.5 sin (2t + c), where the phase shift c must be continuously adjusted to compensate for the differentstarting positions. If during one ride the horse
reached a maximum height after seconds, find
the equation that models the horse’s position.
SOLUTION: First, find the period of y = 1.5 sin (2t + c).
Since the period is π, the function will reach a
maximum height at radians. The phase shift is the
difference between the horizontal position of the
function at and radians, which is radians.
Substitute and b into the phase shift formula to
find c.
Therefore, the equation is
30. AMUSEMENT PARKS The position y in feet of a passenger cart relative to the center of a Ferris wheel over t seconds is shown below.
a. Find the time t that it takes for the cart to return toy = 0 during its initial spin. b. Find the period of the Ferris wheel. c. Sketch the graph representing the position of the passenger cart over one period. d. Write a sinusoidal function that models the position of the passenger cart as a function of time t.
SOLUTION: a. From the diagram, the height of the cart is 0 ft when t = 0, and reaches a maximum height of 19 feet when t = 3.75 seconds. So, the cart will return to y = 0 after 2(3.75) or 7.5 seconds. b. The cart completes half of a cycle from t = 0 to t = 7.5. So, the period is 2(7.5) or 15 seconds. c.
d. The amplitude a is half of the maximum and
minimum values. So, a =
The vertical shift d is the average of the maximum
and minimum data values. So,
Because the period of a sinusoidal function is
you can write Therefore,
There is no phase shift because the height of the cartwhen t = 0 is 0 feet, and the sine function has a y-intercept of 0. Therefore, one equation that could be used to model
the position of the passenger cart is y = 19 sin t.
Write an equation that corresponds to each graph.
31.
SOLUTION: Sample answer: There is an x-intercept at 0, so one equation that corresponds to this graph is y = a sin (bx + c) + d. Half of the distance from the maximum to the minimum value of the function is 3. So, the amplitudeis 3. It appears that the function completes one period on
[0, π]. Find b.
The midline appears to be at y = 0, so there does not appear to be any vertical shift. Therefore, one equation that corresponds to this graph is y = 3 sin (2x).
32.
SOLUTION:
Sample answer: Because there is a y-intercept at ,
one equation that corresponds to this graph is y = a cos (bx + c) + d. Half of the distance from the maximum to the
minimum value of the function is . So, the
amplitude is .
It appears that the function completes one period on [0, 6π]. Find b.
The midline appears to be at y = 0, so there does not appear to be any vertical shift. Therefore, one
equation that corresponds to this graph is y = cos
.
33.
SOLUTION: Sample answer: Because there is a y-intercept at 3, one equation that corresponds to this graph is y = a cos (bx + c) + d. Half of the distance from the maximum to the
minimum value of the function is 4 ÷ 2 or 2. So, the amplitude is 2. It appears that the function completes one period on
Find b.
The midline appears to be at y = 1, so there is a vertical shift 1 unit up. Therefore, one equation that corresponds to this graph is y = 2 cos 4x + 1.
34.
SOLUTION: Sample answer: There is an x-intercept at 0, so one equation that corresponds to this graph is y = a sin (bx + c) + d. Half of the distance from the maximum to the
minimum value of the function is 8 ÷ 2 or 4. So, the amplitude is 4. It appears that the function completes one period on [0, 4π]. Find b.
The midline appears to be at y = −2, so there is a vertical shift of 2 units down. Therefore, one equation that corresponds to this graph is y = 4 sin
− 2.
Write a sinusoidal function with the given period and amplitude that passes through the given point.
35. period: ; amplitude: 5; point:
SOLUTION: Use the period to find b.
Sample answer: One sinusoidal function in which a =5 and b = 2 is y = 5 cos 2x. Evaluate the function for
The function passes through . Therefore, a
sinusoidal function with period π and amplitude 5 that
passes through the point is y = 5 cos 2x.
36. period: 4 ; amplitude: 2; point: ( , 2)
SOLUTION: Use the period to find b.
Sample answer: One sinusoidal function in which a =
2 and b = is y = 2 sin . Evaluate the function
for x = π.
The function passes through ( , 2). Therefore, a
sinusoidal function with period 4π and amplitude 2
that passes through the point ( , 2) is y = 2 sin .
37. period: ; amplitude: ; point:
SOLUTION: Use the period to find b.
Sample answer: One sinusoidal function in which a =1.5 and b = 4 is y = 1.5 cos 4x. Evaluate the function
for
The function passes through . Therefore, a
sinusoidal function with period and amplitude 1.5
that passes through the point is y = 1.5 cos
4x.
38. period: 3π; amplitude: ; point:
SOLUTION: Use the period to find b.
Sample answer: One sinusoidal function in which a =
0.5 and b = is y = sin x. Evaluate the
function for
The function passes through . Therefore, a
sinusoidal function with period 3π and amplitude 0.5
that passes through the point is y = sin
x.
39. MULTIPLE REPRESENTATIONS In this problem, you will investigate the change in the graph of a sinusoidal function of the form y = sin x or y = cos x when multiplied by a polynomial function. a. GRAPHICAL Use a graphing calculator to sketch the graphs of y = 2x, y = –2x, and y = 2x cos x on the same coordinate plane, on the interval [–20, 20]. b. VERBAL Describe the behavior of the graph of y = 2x cos x in relation to the graphs of y = 2x and y = –2x. c. GRAPHICAL Use a graphing calculator to
sketch the graphs of y = x2, y = –x
2, and y = x
2 sin x
on the same coordinate plane, on the interval [–20, 20]. d. VERBAL Describe the behavior of the graph of
y = x2 sin x in relation to the graphs of y = x
2 and y
= –x2.
e. ANALYTICAL Make a conjecture as to the behavior of the graph of a sinusoidal function of the form y = sin x or y = cos x when multiplied by polynomial function of the form y = f (x).
SOLUTION: a.
b. The graph of y = 2x cos x oscillates between the graphs of y = 2x and y = –2x. c.
d. The graph of y = x2 sin x oscillates between the
graphs of y = x2 and y = –x
2.
e . The graph of y = f (x) sin x or y = f (x) cos x will oscillate between the graphs of y = f (x) and y = –f(x).
40. CHALLENGE Without graphing, find the exact coordinates of the first maximum point to the right of
the y-axis for
SOLUTION:
First, find the phase shift for
Next, find the period of the function.
The first maximum for one period can be found by
finding So, incorporating the phase shift, the
first maximum to the right of the y-axis is
. Because the amplitude is |4| = 4,
the maximum point is
REASONING Determine whether each statement is true or false . Explain your reasoning.
41. Every sine function of the form y = a sin (bx + c) + d can be written as a cosine function of the form y =a cos (bx + c) + d.
SOLUTION: It is true that every sine function of the form y = a sin (bx + c) + d can be written as a cosine function of the form y = a cos (bx + c) + d. The graph of cosine is a horizontal translation of the sine graph. Therefore, a cosine function can be written from any sine function using the same amplitude and period by applying the necessary phase shift.
For example, consider and
. Phase shift by
to obtain .
42. The period of f (x) = cos 8x is equal to four times the period of g(x) = cos 2x.
SOLUTION: Find the period of f (x) = cos 8x.
Find the period of g(x) = cos 2x.
Four times the period of g(x) = cos 2x is 4 ⋅ or
4 . So, the period of f (x) is the period of g(x).
Therefore, the statement is false.
43. CHALLENGE How many zeros does y = cos
1500x have on the interval 0 ≤ x ≤ 2 ?
SOLUTION: Find the period of y = cos 1500x.
Graph y = cos 1500x on .
The graph of y = cos 1500x has two x-intercepts for one cycle, so the function has 2 zeros per cycle. Find
the number of cycles for y = cos 1500x on [0, 2 ].
So, the graph of y = cos 1500x will complete 1500
cycles on [0, 2 ]. Because there are two zeros per cycle, y = cos 1500x will have 1500(2) or 3000 zeros
on [0, 2 ].
44. PROOF Prove the phase shift formula.
SOLUTION:
Consider y = a sin (bx + c), where a , b, and c ≠ 0. To find a zero of the function, find the value of x for which a sin (bx + c) = 0. Since sin 0 = 0, solving bx + c = 0 will yield a zero of the function.
Therefore, y = 0 when . The value of is
the phase shift. When c > 0: The graph of y = a sin (bx + c) is the
graph of y = a sin x, shifted units to the left.
When c < 0: The graph of y = a sin (bx + c) is the
graph of y = a sin x, shifted units to the right.
Consider the graph of y = cos x below in blue. In this equation a = 1, b = 1 and c = 0. One zero of y = cos x is . The green graph is shifted to the
left. Thus c is – . Then the shifted equation will be
.
45. Writing in Math The Power Tower ride in Sandusky, Ohio, is shown below. Along the side of each tower is a string of lights that send a continuouspulse of light up and down each tower at a constant rate. Explain why the distance d of this light from theground over time t cannot be represented by a sinusoidal function.
SOLUTION: Sample answer: Although the pulse of light can be represented as a function with a period, it is not a sinusoidal function because the distance the pulse of light is from the ground changes at a constant rate. As a result, the graph of this function would resemble the graph below.
The given point lies on the terminal side of an angle θ in standard position. Find the values of
the six trigonometric functions of θ. 46. (−4, 4)
SOLUTION: Use the values of x and y to find r.
Use x = –4, y = 4, and r = to write the six trigonometric ratios.
47. (8, −2)
SOLUTION: Use the values of x and y to find r.
Use x = 8, y = –2, and r = to write the six trigonometric ratios.
48. (−5, −9)
SOLUTION: Use the values of x and y to find r.
Use x = –5, y = – 9, and r = to write the six trigonometric ratios.
49. (4, 5)
SOLUTION: Use the values of x and y to find r.
Use x = 4, y = 5, and r = to write the six trigonometric ratios.
Write each degree measure in radians as a multiple of π and each radian measure in degrees.
50. 25°
SOLUTION: To convert a degree measure to radians, multiply by
51. −420°
SOLUTION: To convert a degree measure to radians, multiply by
52.
SOLUTION: To convert a radian measure to degrees, multiply by
53.
SOLUTION: To convert a radian measure to degrees, multiply by
54. SCIENCE Radiocarbon dating is a method of estimating the age of an organic material by calculating the amount of carbon-14 present in the material. The age of a material can be calculated
using A = t , where A is the age of the
object in years, t is the half-life of carbon-14 or 5700 years, and R is the ratio of the amount of carbon-14 in the sample to the amount of carbon-14 in living tissue. a. A sample of organic material contains 0.000076 gram of carbon-14. A living sample of the same
Describe how the graphs of f (x) and g (x) are related. Then find the amplitude of g (x), and sketch two periods of both functions on the same coordinate axes.
1. f (x) = sin x; g(x) = sin x
SOLUTION: The graph of g(x) is the graph of f (x) compressed
vertically. The amplitude of g(x) is or .
Create a table listing the coordinates of the x-intercepts and extrema for f (x) = sin x for one
period, 2 , on the interval [0, 2 ]. Then use the amplitude of g(x) to find corresponding points on its graph.
Sketch the curve through the indicated points for each function. Then repeat the pattern to complete asecond period.
Functions f (x) = sin x g(x) = sin x
x-int (0, 0) (0, 0)
Max
x-int
Min
x-int
2.
SOLUTION: The graph of g(x) is the graph of f (x) compressed
vertically. The amplitude of g(x) is or .
Create a table listing the coordinates of the x-intercepts and extrema for f (x) = cos x for one
period, 2 , on the interval [0, 2 ]. Then use the amplitude of g(x) to find corresponding points on its graph.
Sketch the curve through the indicated points for each function. Then repeat the pattern to complete asecond period.
Function f (x) = cos x
Max (0, 1)
x-int Min
x-in
Min
x-int
Function f (x) = cos x
Max x-int
Min
x-in
Min
x-int
3. f (x) = cos x; g(x) = 6 cos x
SOLUTION: The graph of g(x) is the graph of f (x) expanded
vertically. The amplitude of g(x) is or 6.
Create a table listing the coordinates of the x-intercepts and extrema for f (x) = cos x for one
period, 2 , on the interval [0, 2 ]. Then use the amplitude of g(x) to find corresponding points on its graph.
Sketch the curve through the indicated points for each function. Then repeat the pattern to complete asecond period.
Functions f (x) = cos x g(x) = 6 cos x
Max (0, 1) (0, 6)
x-int
Min
x-int
Max
4. f (x) = sin x; g(x) = −8 sin x
SOLUTION: The graph of g(x) is the graph of f (x) expanded
vertically. The amplitude of g(x) is or 8.
Create a table listing the coordinates of the x-intercepts and extrema for f (x) = sin x for one
period, 2 , on the interval [0, 2 ]. Then use the amplitude of g(x) to find corresponding points on its graph.
Sketch the curve through the indicated points for each function. Then repeat the pattern to complete asecond period.
Function f (x) = sin x
x-int (0, 0)
Max
x-int
Min
x-int
Function g(x) = −8
sin x
x-int (0, 0)
Min
x-int
Max
x-int
Describe how the graphs of f (x) and g (x) are related. Then find the period of g (x), and sketch at least one period of both functions on the same coordinate axes.
5. f (x) = sin x; g(x) = sin 4x
SOLUTION: The graph of g(x) is the graph of f (x) compressed
horizontally. The period of g(x) is . To find
corresponding points on the graph of g(x), change the x-coordinates of those key points on f (x) so that
they range from 0 to , increasing by increments of
.
Sketch the curve through the indicated points for each function. Then repeat the pattern to complete asecond period.
Functions f (x) = sin x g(x) = sin
4x
x-int (0, 0) (0, 0)
Max
x-int
Min
x-int
6. f (x) = cos x; g(x) = cos 2x
SOLUTION: The graph of g(x) is the graph of f (x) compressed
horizontally. The period of g(x) is or . To find
corresponding points on the graph of g(x), change the x-coordinates of those key points on f (x) so that
they range from 0 to , increasing by increments of
.
Sketch the curve through the indicated points for each function. Then repeat the pattern to complete asecond period.
Functions f (x) = cos x g(x) = cos 2x
Max (0, 1) (0, 1)
x-int
Min
x-int
Max
7. f (x) = cos x;
SOLUTION: The graph of g(x) is the graph of f (x) expanded
horizontally. The period of g(x) is . To
find corresponding points on the graph of g(x), change the x-coordinates of those key points on f (x)
so that they range from 0 to , increasing by
increments of or .
Sketch the curve through the indicated points for each function. Then repeat the pattern to complete asecond period.
Functions f (x) = cos x
Max (0, 1) (0, 1)
x-int
Min
x-int
Max
8. f (x) = sin x;
SOLUTION: The graph of g(x) is the graph of f (x) expanded
horizontally. The period of g(x) is . To find corresponding points on the graph of g(x), change the x-coordinates of those key points on f (x) so that they range from 0 to , increasing by increments of
or .
Sketch the curve through the indicated points for each function. Then repeat the pattern to complete asecond period.
Functions f (x) = sin x
x-int (0, 0) (0, 0)
Max
x-int
Min
x-int
9. VOICES The contralto vocal type includes the deepest female singing voice. Some contraltos can sing as low as the E below middle C (E3), which hasa frequency of 165 hertz. Write an equation for a sine function that models the initial behavior of the sound wave associated with E3 having an amplitude of 0.15.
SOLUTION: The general form of the equation will be y = a sin bt,where t is the time in seconds. Because the
amplitude is 0.15, |a|= 0.15. This means that a = ±0.15. The period is the reciprocal of the frequency or
. Use this value to find b.
Sample answer: One sine function that models the
initial behavior is y = 0.15 sin 330 t.
Write a sine function that can be used to model the initial behavior of a sound wave with the frequency and amplitude given.
10. f = 440, a = 0.3
SOLUTION: The general form of the equation is y = a sin bt, where t is the time in seconds. Because the
amplitude is 0.3, = 0.3. This means that a = ±0.3.
The period is the reciprocal of the frequency or
. Use this value to find b.
Using the positive values of a and b, one sine function that models the initial behavior is y = 0.3 sin
880 t.
11. f = 932, a = 0.25
SOLUTION: The general form of the equation is y = a sin bt, where t is the time in seconds. Because the
amplitude is 0.25, = 0.25. This means that a =
±0.25. The period is the reciprocal of the frequency
or . Use this value to find b.
Using the positive values of a and b, one sine function that models the initial behavior is y = 0.25
sin 1864 t.
12. f = 1245, a = 0.12
SOLUTION: The general form of the equation is y = a sin bt, where t is the time in seconds. Because the
amplitude is 0.12, = 0.12. This means that a =
±0.12. The period is the reciprocal of the frequency or
. Use this value to find b.
Using the positive values of a and b, one sine function that models the initial behavior is y = 0.12
sin 2490 t.
13. f = 623, a = 0.2
SOLUTION: The general form of the equation is y = a sin bt, where t is the time in seconds. Because the
amplitude is 0.2, = 0.2. This means that a = ±0.2.
The period is the reciprocal of the frequency or
. Use this value to find b.
Using the positive values of a and b, one sine function that models the initial behavior is y = 0.2 sin
1246 t.
State the amplitude, period, frequency, phase shift, and vertical shift of each function. Then graph two periods of the function.
14.
SOLUTION:
In this function, a = 3, b = 1, c = − , and d = 0.
Because d = 0, there is no vertical shift.
Graph y = 3 sin x shifted units to the right.
15.
SOLUTION:
In this function, a = 1, b = , c = , and d = 0.
Because d = 0, there is no vertical shift.
16. y = 0.25 cos x + 3
SOLUTION:
In this function, a = , b = 1, c = 0, and d = 3.
Graph y = cos x shifted 3 units up.
17. y = sin 3x – 2
SOLUTION: In this function, a = 1, b = 3, c = 0, and d = –2.
Graph y = sin 3x shifted 2 units down.
18.
SOLUTION:
In this function, a = 1, b = 1, c = , and d = –1.
.
Graph y = cos x shifted units to the right and 1
unit down.
19.
SOLUTION:
In this function, a = 1, b = 1, c = , and d = 4.
.
Graph y = sin x shifted units to the left and 4 units up.
20. VACATIONS The average number of reservations R that a vacation resort has at the beginning of each month is shown.
a. Write an equation of a sinusoidal function that models the average number of reservations using x =1 to represent January. b. According to your model, approximately how many reservations can the resort anticipate in November?
SOLUTION: a. Make a scatter plot of the data and choose a model.
Sample answer: Use a sinusoidal function of the form y = a cos (bx + c) + d to model the data. First, find the maximum M and minimum m values of the data, and use these values to find a, b, c, and d. The maximum and minimum reservations are 200 and 87, respectively. The amplitude a is half of the distance between these values.
The vertical shift d is the average of the maximum and minimum data values.
There are 3 months between the maximum and minimum, so the period is 6.
The maximum data value occurs when x = 1. Since y = cos x attains its first maximum when x = 0, we must apply a phase shift of 1 unit. Use this value to find c.
Write a function using the values for a, b, c, and d.
Use b =
b. To find the number of reservations in November, evaluate the model for x = 11.
Therefore, the resort can anticipate about 115 reservations in November.
21. TIDES The table shown below provides data for the first high and low tides of the day for a certain bay during one day in June.
a. Determine the amplitude, period, phase shift, and vertical shift of a sinusoidal function that models the height of the tide. Let x represent the number of hours that the high or low tide occurred after midnight. b. Write a sinusoidal function that models the data. c. According to your model, what was the height of
the tide at 8:45 P.M. that night?
SOLUTION: a. Sample answer: Use a sinusoidal function of the form y = a cos (bx + c) + d to model the data. First, find the amplitude a, which is half of the distance between the heights of the high and low tides.
The vertical shift d is the average of the heights of the high and low tides.
A sinusoid completes half of a period in the time thatit takes to go from its maximum to its minimum value. One period is twice this time. The first high tide occurs 6.5 hours before the first low tide, so the period is 13.
The maximum data value occurs when x ≈ 4.417. Since y = cos x attains its first maximum when x = 0,we must apply a phase shift of 4.417 units. Use this value to find c.
b. Write a function using the values for a, b, c, and
d. Use b =
c. To find the height of the water at 8:45 P.M. that
night, evaluate the model for x = 20.75.
Therefore, the tide was about 7.28 feet high at 8:45
P.M. that night.
22. METEOROLOGY The average monthly temperatures for Boston, Massachusetts are shown.
a. Determine the amplitude, period, phase shift, and vertical shift of a sinusoidal function that models the monthly temperatures using x = 1 to represent January. b. Write an equation of a sinusoidal function that models the monthly temperatures. c. According to your model, what is Boston’s average temperature in August?
SOLUTION: a. The maximum and minimum are 74° and 29°, respectively. The amplitude a is half of the distance between these values.
The vertical shift d is the average of the maximum and minimum data values.
A sinusoid completes half of a period in the time thatit takes to go from its maximum to its minimum value. So, one period is twice this time. The
maximum function value occurs in July, so xmax is 7.
The minimum function value occurs in January, so
xmin is 1. The period is 2(6) = 12.
The maximum data value occurs when x = 7. Since y = cos x attains its first maximum when x = 0, we must apply a phase shift of 7 units. Use this value to find c.
b. Using the values for a, b, c, and d from part a, a sinusoidal function that models that monthly temperatures in Boston is
c. To find the average monthly temperature for Boston in August, evaluate the model for x = 8.
Therefore, the average monthly temperature for Boston in August is about 71°F.
GRAPHING CALCULATOR Find the values of x in the interval – < x < that make each equation or inequality true. (Hint: Use the intersection function.)
23. –sin x = cos x
SOLUTION:
Graph y = −sin x and y = cos x on the same graphing
calculator screen on (−π, π). Use the intersect feature under the CALC menu to determine where the two graphs intersect.
The graphs intersect at about −0.7854 or − and
about 2.356 or . Therefore, on –π < x < π, –sin x
= cos x when x = − and .
24. sin x − cos x = 1
SOLUTION:
Graph y = sin x − cos x and y = 1 on the same
graphing calculator screen on (− , ). Use the intersect feature under the CALC menu to determine where the two graphs intersect.
The graphs intersect at about 1.57 or . Therefore,
on – < x < , sin x − cos x = 1 when x = .
25. sin x + cos x = 0
SOLUTION:
Graph y = sin x + cos x on (−π, π). Use the zero feature under the CALC menu to determine the zeros of the function.
There are zeros at about −0.785 or − or and about
2.356 or . Therefore, on – < x < , sin x + cos
x = 0 when
26. cos x ≤ sin x
SOLUTION:
Graph y = cos x and y = sin x on (−π, π). Use the intersect feature under the CALC menu to determine on what interval(s) cos x ≤ sin x.
The graphs intersect at about –2.356 or – and
about 0.785 or . From the graph, it appears that
cos x ≤ sin x on – < x < – and < x < .
27. sin x cos x > 1
SOLUTION:
Graph y = sin x cos x and y = 1 on (− , ). Use the intersect feature under the CALC menu to determine on what interval(s) sin x cos x > 1.
The graphs do not intersect. Therefore, y = sin x cos
x is not greater than y = 1 for any values of x on –< x < .
28. sin x cos x ≤ 0
SOLUTION:
Graph y = sin x cos x on (−π, π). Use the zero feature under the CALC menu to determine on what interval(s) sin x cos x ≤ 0.
The zeros of y = sin x cos x are about –1.57 or ,
0, and about 1.57 or . From the graph, it appears
that sin x cos x ≤ 0 on < x < 0 and < x < .
29. CAROUSELS A wooden horse on a carousel moves up and down as the carousel spins. When the ride ends, the horse usually stops in a vertical position different from where it started. The position y of the horse after t seconds can be modeled by y =1.5 sin (2t + c), where the phase shift c must be continuously adjusted to compensate for the differentstarting positions. If during one ride the horse
reached a maximum height after seconds, find
the equation that models the horse’s position.
SOLUTION: First, find the period of y = 1.5 sin (2t + c).
Since the period is π, the function will reach a
maximum height at radians. The phase shift is the
difference between the horizontal position of the
function at and radians, which is radians.
Substitute and b into the phase shift formula to
find c.
Therefore, the equation is
30. AMUSEMENT PARKS The position y in feet of a passenger cart relative to the center of a Ferris wheel over t seconds is shown below.
a. Find the time t that it takes for the cart to return toy = 0 during its initial spin. b. Find the period of the Ferris wheel. c. Sketch the graph representing the position of the passenger cart over one period. d. Write a sinusoidal function that models the position of the passenger cart as a function of time t.
SOLUTION: a. From the diagram, the height of the cart is 0 ft when t = 0, and reaches a maximum height of 19 feet when t = 3.75 seconds. So, the cart will return to y = 0 after 2(3.75) or 7.5 seconds. b. The cart completes half of a cycle from t = 0 to t = 7.5. So, the period is 2(7.5) or 15 seconds. c.
d. The amplitude a is half of the maximum and
minimum values. So, a =
The vertical shift d is the average of the maximum
and minimum data values. So,
Because the period of a sinusoidal function is
you can write Therefore,
There is no phase shift because the height of the cartwhen t = 0 is 0 feet, and the sine function has a y-intercept of 0. Therefore, one equation that could be used to model
the position of the passenger cart is y = 19 sin t.
Write an equation that corresponds to each graph.
31.
SOLUTION: Sample answer: There is an x-intercept at 0, so one equation that corresponds to this graph is y = a sin (bx + c) + d. Half of the distance from the maximum to the minimum value of the function is 3. So, the amplitudeis 3. It appears that the function completes one period on
[0, π]. Find b.
The midline appears to be at y = 0, so there does not appear to be any vertical shift. Therefore, one equation that corresponds to this graph is y = 3 sin (2x).
32.
SOLUTION:
Sample answer: Because there is a y-intercept at ,
one equation that corresponds to this graph is y = a cos (bx + c) + d. Half of the distance from the maximum to the
minimum value of the function is . So, the
amplitude is .
It appears that the function completes one period on [0, 6π]. Find b.
The midline appears to be at y = 0, so there does not appear to be any vertical shift. Therefore, one
equation that corresponds to this graph is y = cos
.
33.
SOLUTION: Sample answer: Because there is a y-intercept at 3, one equation that corresponds to this graph is y = a cos (bx + c) + d. Half of the distance from the maximum to the
minimum value of the function is 4 ÷ 2 or 2. So, the amplitude is 2. It appears that the function completes one period on
Find b.
The midline appears to be at y = 1, so there is a vertical shift 1 unit up. Therefore, one equation that corresponds to this graph is y = 2 cos 4x + 1.
34.
SOLUTION: Sample answer: There is an x-intercept at 0, so one equation that corresponds to this graph is y = a sin (bx + c) + d. Half of the distance from the maximum to the
minimum value of the function is 8 ÷ 2 or 4. So, the amplitude is 4. It appears that the function completes one period on [0, 4π]. Find b.
The midline appears to be at y = −2, so there is a vertical shift of 2 units down. Therefore, one equation that corresponds to this graph is y = 4 sin
− 2.
Write a sinusoidal function with the given period and amplitude that passes through the given point.
35. period: ; amplitude: 5; point:
SOLUTION: Use the period to find b.
Sample answer: One sinusoidal function in which a =5 and b = 2 is y = 5 cos 2x. Evaluate the function for
The function passes through . Therefore, a
sinusoidal function with period π and amplitude 5 that
passes through the point is y = 5 cos 2x.
36. period: 4 ; amplitude: 2; point: ( , 2)
SOLUTION: Use the period to find b.
Sample answer: One sinusoidal function in which a =
2 and b = is y = 2 sin . Evaluate the function
for x = π.
The function passes through ( , 2). Therefore, a
sinusoidal function with period 4π and amplitude 2
that passes through the point ( , 2) is y = 2 sin .
37. period: ; amplitude: ; point:
SOLUTION: Use the period to find b.
Sample answer: One sinusoidal function in which a =1.5 and b = 4 is y = 1.5 cos 4x. Evaluate the function
for
The function passes through . Therefore, a
sinusoidal function with period and amplitude 1.5
that passes through the point is y = 1.5 cos
4x.
38. period: 3π; amplitude: ; point:
SOLUTION: Use the period to find b.
Sample answer: One sinusoidal function in which a =
0.5 and b = is y = sin x. Evaluate the
function for
The function passes through . Therefore, a
sinusoidal function with period 3π and amplitude 0.5
that passes through the point is y = sin
x.
39. MULTIPLE REPRESENTATIONS In this problem, you will investigate the change in the graph of a sinusoidal function of the form y = sin x or y = cos x when multiplied by a polynomial function. a. GRAPHICAL Use a graphing calculator to sketch the graphs of y = 2x, y = –2x, and y = 2x cos x on the same coordinate plane, on the interval [–20, 20]. b. VERBAL Describe the behavior of the graph of y = 2x cos x in relation to the graphs of y = 2x and y = –2x. c. GRAPHICAL Use a graphing calculator to
sketch the graphs of y = x2, y = –x
2, and y = x
2 sin x
on the same coordinate plane, on the interval [–20, 20]. d. VERBAL Describe the behavior of the graph of
y = x2 sin x in relation to the graphs of y = x
2 and y
= –x2.
e. ANALYTICAL Make a conjecture as to the behavior of the graph of a sinusoidal function of the form y = sin x or y = cos x when multiplied by polynomial function of the form y = f (x).
SOLUTION: a.
b. The graph of y = 2x cos x oscillates between the graphs of y = 2x and y = –2x. c.
d. The graph of y = x2 sin x oscillates between the
graphs of y = x2 and y = –x
2.
e . The graph of y = f (x) sin x or y = f (x) cos x will oscillate between the graphs of y = f (x) and y = –f(x).
40. CHALLENGE Without graphing, find the exact coordinates of the first maximum point to the right of
the y-axis for
SOLUTION:
First, find the phase shift for
Next, find the period of the function.
The first maximum for one period can be found by
finding So, incorporating the phase shift, the
first maximum to the right of the y-axis is
. Because the amplitude is |4| = 4,
the maximum point is
REASONING Determine whether each statement is true or false . Explain your reasoning.
41. Every sine function of the form y = a sin (bx + c) + d can be written as a cosine function of the form y =a cos (bx + c) + d.
SOLUTION: It is true that every sine function of the form y = a sin (bx + c) + d can be written as a cosine function of the form y = a cos (bx + c) + d. The graph of cosine is a horizontal translation of the sine graph. Therefore, a cosine function can be written from any sine function using the same amplitude and period by applying the necessary phase shift.
For example, consider and
. Phase shift by
to obtain .
42. The period of f (x) = cos 8x is equal to four times the period of g(x) = cos 2x.
SOLUTION: Find the period of f (x) = cos 8x.
Find the period of g(x) = cos 2x.
Four times the period of g(x) = cos 2x is 4 ⋅ or
4 . So, the period of f (x) is the period of g(x).
Therefore, the statement is false.
43. CHALLENGE How many zeros does y = cos
1500x have on the interval 0 ≤ x ≤ 2 ?
SOLUTION: Find the period of y = cos 1500x.
Graph y = cos 1500x on .
The graph of y = cos 1500x has two x-intercepts for one cycle, so the function has 2 zeros per cycle. Find
the number of cycles for y = cos 1500x on [0, 2 ].
So, the graph of y = cos 1500x will complete 1500
cycles on [0, 2 ]. Because there are two zeros per cycle, y = cos 1500x will have 1500(2) or 3000 zeros
on [0, 2 ].
44. PROOF Prove the phase shift formula.
SOLUTION:
Consider y = a sin (bx + c), where a , b, and c ≠ 0. To find a zero of the function, find the value of x for which a sin (bx + c) = 0. Since sin 0 = 0, solving bx + c = 0 will yield a zero of the function.
Therefore, y = 0 when . The value of is
the phase shift. When c > 0: The graph of y = a sin (bx + c) is the
graph of y = a sin x, shifted units to the left.
When c < 0: The graph of y = a sin (bx + c) is the
graph of y = a sin x, shifted units to the right.
Consider the graph of y = cos x below in blue. In this equation a = 1, b = 1 and c = 0. One zero of y = cos x is . The green graph is shifted to the
left. Thus c is – . Then the shifted equation will be
.
45. Writing in Math The Power Tower ride in Sandusky, Ohio, is shown below. Along the side of each tower is a string of lights that send a continuouspulse of light up and down each tower at a constant rate. Explain why the distance d of this light from theground over time t cannot be represented by a sinusoidal function.
SOLUTION: Sample answer: Although the pulse of light can be represented as a function with a period, it is not a sinusoidal function because the distance the pulse of light is from the ground changes at a constant rate. As a result, the graph of this function would resemble the graph below.
The given point lies on the terminal side of an angle θ in standard position. Find the values of
the six trigonometric functions of θ. 46. (−4, 4)
SOLUTION: Use the values of x and y to find r.
Use x = –4, y = 4, and r = to write the six trigonometric ratios.
47. (8, −2)
SOLUTION: Use the values of x and y to find r.
Use x = 8, y = –2, and r = to write the six trigonometric ratios.
48. (−5, −9)
SOLUTION: Use the values of x and y to find r.
Use x = –5, y = – 9, and r = to write the six trigonometric ratios.
49. (4, 5)
SOLUTION: Use the values of x and y to find r.
Use x = 4, y = 5, and r = to write the six trigonometric ratios.
Write each degree measure in radians as a multiple of π and each radian measure in degrees.
50. 25°
SOLUTION: To convert a degree measure to radians, multiply by
51. −420°
SOLUTION: To convert a degree measure to radians, multiply by
52.
SOLUTION: To convert a radian measure to degrees, multiply by
53.
SOLUTION: To convert a radian measure to degrees, multiply by
54. SCIENCE Radiocarbon dating is a method of estimating the age of an organic material by calculating the amount of carbon-14 present in the material. The age of a material can be calculated
using A = t , where A is the age of the
object in years, t is the half-life of carbon-14 or 5700 years, and R is the ratio of the amount of carbon-14 in the sample to the amount of carbon-14 in living tissue. a. A sample of organic material contains 0.000076 gram of carbon-14. A living sample of the same
eSolutions Manual - Powered by Cognero Page 10
4-4 Graphing Sine and Cosine Functions
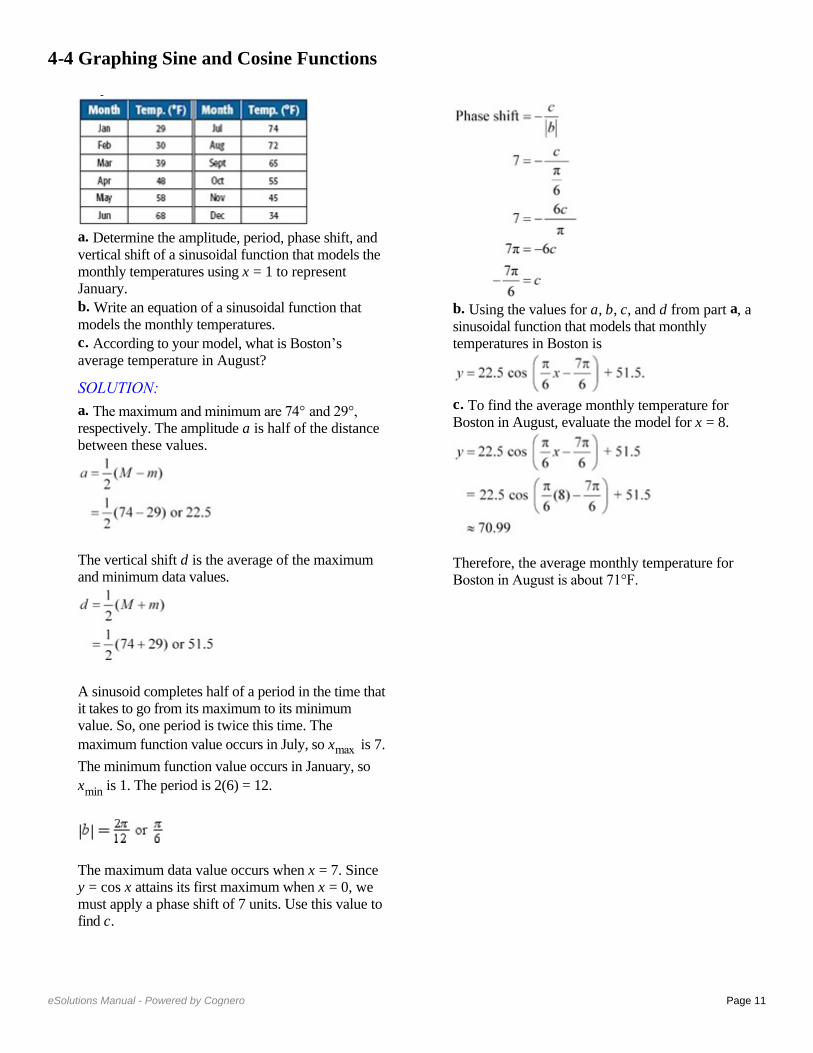
Describe how the graphs of f (x) and g (x) are related. Then find the amplitude of g (x), and sketch two periods of both functions on the same coordinate axes.
1. f (x) = sin x; g(x) = sin x
SOLUTION: The graph of g(x) is the graph of f (x) compressed
vertically. The amplitude of g(x) is or .
Create a table listing the coordinates of the x-intercepts and extrema for f (x) = sin x for one
period, 2 , on the interval [0, 2 ]. Then use the amplitude of g(x) to find corresponding points on its graph.
Sketch the curve through the indicated points for each function. Then repeat the pattern to complete asecond period.
Functions f (x) = sin x g(x) = sin x
x-int (0, 0) (0, 0)
Max
x-int
Min
x-int
2.
SOLUTION: The graph of g(x) is the graph of f (x) compressed
vertically. The amplitude of g(x) is or .
Create a table listing the coordinates of the x-intercepts and extrema for f (x) = cos x for one
period, 2 , on the interval [0, 2 ]. Then use the amplitude of g(x) to find corresponding points on its graph.
Sketch the curve through the indicated points for each function. Then repeat the pattern to complete asecond period.
Function f (x) = cos x
Max (0, 1)
x-int Min
x-in
Min
x-int
Function f (x) = cos x
Max x-int
Min
x-in
Min
x-int
3. f (x) = cos x; g(x) = 6 cos x
SOLUTION: The graph of g(x) is the graph of f (x) expanded
vertically. The amplitude of g(x) is or 6.
Create a table listing the coordinates of the x-intercepts and extrema for f (x) = cos x for one
period, 2 , on the interval [0, 2 ]. Then use the amplitude of g(x) to find corresponding points on its graph.
Sketch the curve through the indicated points for each function. Then repeat the pattern to complete asecond period.
Functions f (x) = cos x g(x) = 6 cos x
Max (0, 1) (0, 6)
x-int
Min
x-int
Max
4. f (x) = sin x; g(x) = −8 sin x
SOLUTION: The graph of g(x) is the graph of f (x) expanded
vertically. The amplitude of g(x) is or 8.
Create a table listing the coordinates of the x-intercepts and extrema for f (x) = sin x for one
period, 2 , on the interval [0, 2 ]. Then use the amplitude of g(x) to find corresponding points on its graph.
Sketch the curve through the indicated points for each function. Then repeat the pattern to complete asecond period.
Function f (x) = sin x
x-int (0, 0)
Max
x-int
Min
x-int
Function g(x) = −8
sin x
x-int (0, 0)
Min
x-int
Max
x-int
Describe how the graphs of f (x) and g (x) are related. Then find the period of g (x), and sketch at least one period of both functions on the same coordinate axes.
5. f (x) = sin x; g(x) = sin 4x
SOLUTION: The graph of g(x) is the graph of f (x) compressed
horizontally. The period of g(x) is . To find
corresponding points on the graph of g(x), change the x-coordinates of those key points on f (x) so that
they range from 0 to , increasing by increments of
.
Sketch the curve through the indicated points for each function. Then repeat the pattern to complete asecond period.
Functions f (x) = sin x g(x) = sin
4x
x-int (0, 0) (0, 0)
Max
x-int
Min
x-int
6. f (x) = cos x; g(x) = cos 2x
SOLUTION: The graph of g(x) is the graph of f (x) compressed
horizontally. The period of g(x) is or . To find
corresponding points on the graph of g(x), change the x-coordinates of those key points on f (x) so that
they range from 0 to , increasing by increments of
.
Sketch the curve through the indicated points for each function. Then repeat the pattern to complete asecond period.
Functions f (x) = cos x g(x) = cos 2x
Max (0, 1) (0, 1)
x-int
Min
x-int
Max
7. f (x) = cos x;
SOLUTION: The graph of g(x) is the graph of f (x) expanded
horizontally. The period of g(x) is . To
find corresponding points on the graph of g(x), change the x-coordinates of those key points on f (x)
so that they range from 0 to , increasing by
increments of or .
Sketch the curve through the indicated points for each function. Then repeat the pattern to complete asecond period.
Functions f (x) = cos x
Max (0, 1) (0, 1)
x-int
Min
x-int
Max
8. f (x) = sin x;
SOLUTION: The graph of g(x) is the graph of f (x) expanded
horizontally. The period of g(x) is . To find corresponding points on the graph of g(x), change the x-coordinates of those key points on f (x) so that they range from 0 to , increasing by increments of
or .
Sketch the curve through the indicated points for each function. Then repeat the pattern to complete asecond period.
Functions f (x) = sin x
x-int (0, 0) (0, 0)
Max
x-int
Min
x-int
9. VOICES The contralto vocal type includes the deepest female singing voice. Some contraltos can sing as low as the E below middle C (E3), which hasa frequency of 165 hertz. Write an equation for a sine function that models the initial behavior of the sound wave associated with E3 having an amplitude of 0.15.
SOLUTION: The general form of the equation will be y = a sin bt,where t is the time in seconds. Because the
amplitude is 0.15, |a|= 0.15. This means that a = ±0.15. The period is the reciprocal of the frequency or
. Use this value to find b.
Sample answer: One sine function that models the
initial behavior is y = 0.15 sin 330 t.
Write a sine function that can be used to model the initial behavior of a sound wave with the frequency and amplitude given.
10. f = 440, a = 0.3
SOLUTION: The general form of the equation is y = a sin bt, where t is the time in seconds. Because the
amplitude is 0.3, = 0.3. This means that a = ±0.3.
The period is the reciprocal of the frequency or
. Use this value to find b.
Using the positive values of a and b, one sine function that models the initial behavior is y = 0.3 sin
880 t.
11. f = 932, a = 0.25
SOLUTION: The general form of the equation is y = a sin bt, where t is the time in seconds. Because the
amplitude is 0.25, = 0.25. This means that a =
±0.25. The period is the reciprocal of the frequency
or . Use this value to find b.
Using the positive values of a and b, one sine function that models the initial behavior is y = 0.25
sin 1864 t.
12. f = 1245, a = 0.12
SOLUTION: The general form of the equation is y = a sin bt, where t is the time in seconds. Because the
amplitude is 0.12, = 0.12. This means that a =
±0.12. The period is the reciprocal of the frequency or
. Use this value to find b.
Using the positive values of a and b, one sine function that models the initial behavior is y = 0.12
sin 2490 t.
13. f = 623, a = 0.2
SOLUTION: The general form of the equation is y = a sin bt, where t is the time in seconds. Because the
amplitude is 0.2, = 0.2. This means that a = ±0.2.
The period is the reciprocal of the frequency or
. Use this value to find b.
Using the positive values of a and b, one sine function that models the initial behavior is y = 0.2 sin
1246 t.
State the amplitude, period, frequency, phase shift, and vertical shift of each function. Then graph two periods of the function.
14.
SOLUTION:
In this function, a = 3, b = 1, c = − , and d = 0.
Because d = 0, there is no vertical shift.
Graph y = 3 sin x shifted units to the right.
15.
SOLUTION:
In this function, a = 1, b = , c = , and d = 0.
Because d = 0, there is no vertical shift.
16. y = 0.25 cos x + 3
SOLUTION:
In this function, a = , b = 1, c = 0, and d = 3.
Graph y = cos x shifted 3 units up.
17. y = sin 3x – 2
SOLUTION: In this function, a = 1, b = 3, c = 0, and d = –2.
Graph y = sin 3x shifted 2 units down.
18.
SOLUTION:
In this function, a = 1, b = 1, c = , and d = –1.
.
Graph y = cos x shifted units to the right and 1
unit down.
19.
SOLUTION:
In this function, a = 1, b = 1, c = , and d = 4.
.
Graph y = sin x shifted units to the left and 4 units up.
20. VACATIONS The average number of reservations R that a vacation resort has at the beginning of each month is shown.
a. Write an equation of a sinusoidal function that models the average number of reservations using x =1 to represent January. b. According to your model, approximately how many reservations can the resort anticipate in November?
SOLUTION: a. Make a scatter plot of the data and choose a model.
Sample answer: Use a sinusoidal function of the form y = a cos (bx + c) + d to model the data. First, find the maximum M and minimum m values of the data, and use these values to find a, b, c, and d. The maximum and minimum reservations are 200 and 87, respectively. The amplitude a is half of the distance between these values.
The vertical shift d is the average of the maximum and minimum data values.
There are 3 months between the maximum and minimum, so the period is 6.
The maximum data value occurs when x = 1. Since y = cos x attains its first maximum when x = 0, we must apply a phase shift of 1 unit. Use this value to find c.
Write a function using the values for a, b, c, and d.
Use b =
b. To find the number of reservations in November, evaluate the model for x = 11.
Therefore, the resort can anticipate about 115 reservations in November.
21. TIDES The table shown below provides data for the first high and low tides of the day for a certain bay during one day in June.
a. Determine the amplitude, period, phase shift, and vertical shift of a sinusoidal function that models the height of the tide. Let x represent the number of hours that the high or low tide occurred after midnight. b. Write a sinusoidal function that models the data. c. According to your model, what was the height of
the tide at 8:45 P.M. that night?
SOLUTION: a. Sample answer: Use a sinusoidal function of the form y = a cos (bx + c) + d to model the data. First, find the amplitude a, which is half of the distance between the heights of the high and low tides.
The vertical shift d is the average of the heights of the high and low tides.
A sinusoid completes half of a period in the time thatit takes to go from its maximum to its minimum value. One period is twice this time. The first high tide occurs 6.5 hours before the first low tide, so the period is 13.
The maximum data value occurs when x ≈ 4.417. Since y = cos x attains its first maximum when x = 0,we must apply a phase shift of 4.417 units. Use this value to find c.
b. Write a function using the values for a, b, c, and
d. Use b =
c. To find the height of the water at 8:45 P.M. that
night, evaluate the model for x = 20.75.
Therefore, the tide was about 7.28 feet high at 8:45
P.M. that night.
22. METEOROLOGY The average monthly temperatures for Boston, Massachusetts are shown.
a. Determine the amplitude, period, phase shift, and vertical shift of a sinusoidal function that models the monthly temperatures using x = 1 to represent January. b. Write an equation of a sinusoidal function that models the monthly temperatures. c. According to your model, what is Boston’s average temperature in August?
SOLUTION: a. The maximum and minimum are 74° and 29°, respectively. The amplitude a is half of the distance between these values.
The vertical shift d is the average of the maximum and minimum data values.
A sinusoid completes half of a period in the time thatit takes to go from its maximum to its minimum value. So, one period is twice this time. The
maximum function value occurs in July, so xmax is 7.
The minimum function value occurs in January, so
xmin is 1. The period is 2(6) = 12.
The maximum data value occurs when x = 7. Since y = cos x attains its first maximum when x = 0, we must apply a phase shift of 7 units. Use this value to find c.
b. Using the values for a, b, c, and d from part a, a sinusoidal function that models that monthly temperatures in Boston is
c. To find the average monthly temperature for Boston in August, evaluate the model for x = 8.
Therefore, the average monthly temperature for Boston in August is about 71°F.
GRAPHING CALCULATOR Find the values of x in the interval – < x < that make each equation or inequality true. (Hint: Use the intersection function.)
23. –sin x = cos x
SOLUTION:
Graph y = −sin x and y = cos x on the same graphing
calculator screen on (−π, π). Use the intersect feature under the CALC menu to determine where the two graphs intersect.
The graphs intersect at about −0.7854 or − and
about 2.356 or . Therefore, on –π < x < π, –sin x
= cos x when x = − and .
24. sin x − cos x = 1
SOLUTION:
Graph y = sin x − cos x and y = 1 on the same
graphing calculator screen on (− , ). Use the intersect feature under the CALC menu to determine where the two graphs intersect.
The graphs intersect at about 1.57 or . Therefore,
on – < x < , sin x − cos x = 1 when x = .
25. sin x + cos x = 0
SOLUTION:
Graph y = sin x + cos x on (−π, π). Use the zero feature under the CALC menu to determine the zeros of the function.
There are zeros at about −0.785 or − or and about
2.356 or . Therefore, on – < x < , sin x + cos
x = 0 when
26. cos x ≤ sin x
SOLUTION:
Graph y = cos x and y = sin x on (−π, π). Use the intersect feature under the CALC menu to determine on what interval(s) cos x ≤ sin x.
The graphs intersect at about –2.356 or – and
about 0.785 or . From the graph, it appears that
cos x ≤ sin x on – < x < – and < x < .
27. sin x cos x > 1
SOLUTION:
Graph y = sin x cos x and y = 1 on (− , ). Use the intersect feature under the CALC menu to determine on what interval(s) sin x cos x > 1.
The graphs do not intersect. Therefore, y = sin x cos
x is not greater than y = 1 for any values of x on –< x < .
28. sin x cos x ≤ 0
SOLUTION:
Graph y = sin x cos x on (−π, π). Use the zero feature under the CALC menu to determine on what interval(s) sin x cos x ≤ 0.
The zeros of y = sin x cos x are about –1.57 or ,
0, and about 1.57 or . From the graph, it appears
that sin x cos x ≤ 0 on < x < 0 and < x < .
29. CAROUSELS A wooden horse on a carousel moves up and down as the carousel spins. When the ride ends, the horse usually stops in a vertical position different from where it started. The position y of the horse after t seconds can be modeled by y =1.5 sin (2t + c), where the phase shift c must be continuously adjusted to compensate for the differentstarting positions. If during one ride the horse
reached a maximum height after seconds, find
the equation that models the horse’s position.
SOLUTION: First, find the period of y = 1.5 sin (2t + c).
Since the period is π, the function will reach a
maximum height at radians. The phase shift is the
difference between the horizontal position of the
function at and radians, which is radians.
Substitute and b into the phase shift formula to
find c.
Therefore, the equation is
30. AMUSEMENT PARKS The position y in feet of a passenger cart relative to the center of a Ferris wheel over t seconds is shown below.
a. Find the time t that it takes for the cart to return toy = 0 during its initial spin. b. Find the period of the Ferris wheel. c. Sketch the graph representing the position of the passenger cart over one period. d. Write a sinusoidal function that models the position of the passenger cart as a function of time t.
SOLUTION: a. From the diagram, the height of the cart is 0 ft when t = 0, and reaches a maximum height of 19 feet when t = 3.75 seconds. So, the cart will return to y = 0 after 2(3.75) or 7.5 seconds. b. The cart completes half of a cycle from t = 0 to t = 7.5. So, the period is 2(7.5) or 15 seconds. c.
d. The amplitude a is half of the maximum and
minimum values. So, a =
The vertical shift d is the average of the maximum
and minimum data values. So,
Because the period of a sinusoidal function is
you can write Therefore,
There is no phase shift because the height of the cartwhen t = 0 is 0 feet, and the sine function has a y-intercept of 0. Therefore, one equation that could be used to model
the position of the passenger cart is y = 19 sin t.
Write an equation that corresponds to each graph.
31.
SOLUTION: Sample answer: There is an x-intercept at 0, so one equation that corresponds to this graph is y = a sin (bx + c) + d. Half of the distance from the maximum to the minimum value of the function is 3. So, the amplitudeis 3. It appears that the function completes one period on
[0, π]. Find b.
The midline appears to be at y = 0, so there does not appear to be any vertical shift. Therefore, one equation that corresponds to this graph is y = 3 sin (2x).
32.
SOLUTION:
Sample answer: Because there is a y-intercept at ,
one equation that corresponds to this graph is y = a cos (bx + c) + d. Half of the distance from the maximum to the
minimum value of the function is . So, the
amplitude is .
It appears that the function completes one period on [0, 6π]. Find b.
The midline appears to be at y = 0, so there does not appear to be any vertical shift. Therefore, one
equation that corresponds to this graph is y = cos
.
33.
SOLUTION: Sample answer: Because there is a y-intercept at 3, one equation that corresponds to this graph is y = a cos (bx + c) + d. Half of the distance from the maximum to the
minimum value of the function is 4 ÷ 2 or 2. So, the amplitude is 2. It appears that the function completes one period on
Find b.
The midline appears to be at y = 1, so there is a vertical shift 1 unit up. Therefore, one equation that corresponds to this graph is y = 2 cos 4x + 1.
34.
SOLUTION: Sample answer: There is an x-intercept at 0, so one equation that corresponds to this graph is y = a sin (bx + c) + d. Half of the distance from the maximum to the
minimum value of the function is 8 ÷ 2 or 4. So, the amplitude is 4. It appears that the function completes one period on [0, 4π]. Find b.
The midline appears to be at y = −2, so there is a vertical shift of 2 units down. Therefore, one equation that corresponds to this graph is y = 4 sin
− 2.
Write a sinusoidal function with the given period and amplitude that passes through the given point.
35. period: ; amplitude: 5; point:
SOLUTION: Use the period to find b.
Sample answer: One sinusoidal function in which a =5 and b = 2 is y = 5 cos 2x. Evaluate the function for
The function passes through . Therefore, a
sinusoidal function with period π and amplitude 5 that
passes through the point is y = 5 cos 2x.
36. period: 4 ; amplitude: 2; point: ( , 2)
SOLUTION: Use the period to find b.
Sample answer: One sinusoidal function in which a =
2 and b = is y = 2 sin . Evaluate the function
for x = π.
The function passes through ( , 2). Therefore, a
sinusoidal function with period 4π and amplitude 2
that passes through the point ( , 2) is y = 2 sin .
37. period: ; amplitude: ; point:
SOLUTION: Use the period to find b.
Sample answer: One sinusoidal function in which a =1.5 and b = 4 is y = 1.5 cos 4x. Evaluate the function
for
The function passes through . Therefore, a
sinusoidal function with period and amplitude 1.5
that passes through the point is y = 1.5 cos
4x.
38. period: 3π; amplitude: ; point:
SOLUTION: Use the period to find b.
Sample answer: One sinusoidal function in which a =
0.5 and b = is y = sin x. Evaluate the
function for
The function passes through . Therefore, a
sinusoidal function with period 3π and amplitude 0.5
that passes through the point is y = sin
x.
39. MULTIPLE REPRESENTATIONS In this problem, you will investigate the change in the graph of a sinusoidal function of the form y = sin x or y = cos x when multiplied by a polynomial function. a. GRAPHICAL Use a graphing calculator to sketch the graphs of y = 2x, y = –2x, and y = 2x cos x on the same coordinate plane, on the interval [–20, 20]. b. VERBAL Describe the behavior of the graph of y = 2x cos x in relation to the graphs of y = 2x and y = –2x. c. GRAPHICAL Use a graphing calculator to
sketch the graphs of y = x2, y = –x
2, and y = x
2 sin x
on the same coordinate plane, on the interval [–20, 20]. d. VERBAL Describe the behavior of the graph of
y = x2 sin x in relation to the graphs of y = x
2 and y
= –x2.
e. ANALYTICAL Make a conjecture as to the behavior of the graph of a sinusoidal function of the form y = sin x or y = cos x when multiplied by polynomial function of the form y = f (x).
SOLUTION: a.
b. The graph of y = 2x cos x oscillates between the graphs of y = 2x and y = –2x. c.
d. The graph of y = x2 sin x oscillates between the
graphs of y = x2 and y = –x
2.
e . The graph of y = f (x) sin x or y = f (x) cos x will oscillate between the graphs of y = f (x) and y = –f(x).
40. CHALLENGE Without graphing, find the exact coordinates of the first maximum point to the right of
the y-axis for
SOLUTION:
First, find the phase shift for
Next, find the period of the function.
The first maximum for one period can be found by
finding So, incorporating the phase shift, the
first maximum to the right of the y-axis is
. Because the amplitude is |4| = 4,
the maximum point is
REASONING Determine whether each statement is true or false . Explain your reasoning.
41. Every sine function of the form y = a sin (bx + c) + d can be written as a cosine function of the form y =a cos (bx + c) + d.
SOLUTION: It is true that every sine function of the form y = a sin (bx + c) + d can be written as a cosine function of the form y = a cos (bx + c) + d. The graph of cosine is a horizontal translation of the sine graph. Therefore, a cosine function can be written from any sine function using the same amplitude and period by applying the necessary phase shift.
For example, consider and
. Phase shift by
to obtain .
42. The period of f (x) = cos 8x is equal to four times the period of g(x) = cos 2x.
SOLUTION: Find the period of f (x) = cos 8x.
Find the period of g(x) = cos 2x.
Four times the period of g(x) = cos 2x is 4 ⋅ or
4 . So, the period of f (x) is the period of g(x).
Therefore, the statement is false.
43. CHALLENGE How many zeros does y = cos
1500x have on the interval 0 ≤ x ≤ 2 ?
SOLUTION: Find the period of y = cos 1500x.
Graph y = cos 1500x on .
The graph of y = cos 1500x has two x-intercepts for one cycle, so the function has 2 zeros per cycle. Find
the number of cycles for y = cos 1500x on [0, 2 ].
So, the graph of y = cos 1500x will complete 1500
cycles on [0, 2 ]. Because there are two zeros per cycle, y = cos 1500x will have 1500(2) or 3000 zeros
on [0, 2 ].
44. PROOF Prove the phase shift formula.
SOLUTION:
Consider y = a sin (bx + c), where a , b, and c ≠ 0. To find a zero of the function, find the value of x for which a sin (bx + c) = 0. Since sin 0 = 0, solving bx + c = 0 will yield a zero of the function.
Therefore, y = 0 when . The value of is
the phase shift. When c > 0: The graph of y = a sin (bx + c) is the
graph of y = a sin x, shifted units to the left.
When c < 0: The graph of y = a sin (bx + c) is the
graph of y = a sin x, shifted units to the right.
Consider the graph of y = cos x below in blue. In this equation a = 1, b = 1 and c = 0. One zero of y = cos x is . The green graph is shifted to the
left. Thus c is – . Then the shifted equation will be
.
45. Writing in Math The Power Tower ride in Sandusky, Ohio, is shown below. Along the side of each tower is a string of lights that send a continuouspulse of light up and down each tower at a constant rate. Explain why the distance d of this light from theground over time t cannot be represented by a sinusoidal function.
SOLUTION: Sample answer: Although the pulse of light can be represented as a function with a period, it is not a sinusoidal function because the distance the pulse of light is from the ground changes at a constant rate. As a result, the graph of this function would resemble the graph below.
The given point lies on the terminal side of an angle θ in standard position. Find the values of
the six trigonometric functions of θ. 46. (−4, 4)
SOLUTION: Use the values of x and y to find r.
Use x = –4, y = 4, and r = to write the six trigonometric ratios.
47. (8, −2)
SOLUTION: Use the values of x and y to find r.
Use x = 8, y = –2, and r = to write the six trigonometric ratios.
48. (−5, −9)
SOLUTION: Use the values of x and y to find r.
Use x = –5, y = – 9, and r = to write the six trigonometric ratios.
49. (4, 5)
SOLUTION: Use the values of x and y to find r.
Use x = 4, y = 5, and r = to write the six trigonometric ratios.
Write each degree measure in radians as a multiple of π and each radian measure in degrees.
50. 25°
SOLUTION: To convert a degree measure to radians, multiply by
51. −420°
SOLUTION: To convert a degree measure to radians, multiply by
52.
SOLUTION: To convert a radian measure to degrees, multiply by
53.
SOLUTION: To convert a radian measure to degrees, multiply by
54. SCIENCE Radiocarbon dating is a method of estimating the age of an organic material by calculating the amount of carbon-14 present in the material. The age of a material can be calculated
using A = t , where A is the age of the
object in years, t is the half-life of carbon-14 or 5700 years, and R is the ratio of the amount of carbon-14 in the sample to the amount of carbon-14 in living tissue. a. A sample of organic material contains 0.000076 gram of carbon-14. A living sample of the same
Describe how the graphs of f (x) and g (x) are related. Then find the amplitude of g (x), and sketch two periods of both functions on the same coordinate axes.
1. f (x) = sin x; g(x) = sin x
SOLUTION: The graph of g(x) is the graph of f (x) compressed
vertically. The amplitude of g(x) is or .
Create a table listing the coordinates of the x-intercepts and extrema for f (x) = sin x for one
period, 2 , on the interval [0, 2 ]. Then use the amplitude of g(x) to find corresponding points on its graph.
Sketch the curve through the indicated points for each function. Then repeat the pattern to complete asecond period.
Functions f (x) = sin x g(x) = sin x
x-int (0, 0) (0, 0)
Max
x-int
Min
x-int
2.
SOLUTION: The graph of g(x) is the graph of f (x) compressed
vertically. The amplitude of g(x) is or .
Create a table listing the coordinates of the x-intercepts and extrema for f (x) = cos x for one
period, 2 , on the interval [0, 2 ]. Then use the amplitude of g(x) to find corresponding points on its graph.
Sketch the curve through the indicated points for each function. Then repeat the pattern to complete asecond period.
Function f (x) = cos x
Max (0, 1)
x-int Min
x-in
Min
x-int
Function f (x) = cos x
Max x-int
Min
x-in
Min
x-int
3. f (x) = cos x; g(x) = 6 cos x
SOLUTION: The graph of g(x) is the graph of f (x) expanded
vertically. The amplitude of g(x) is or 6.
Create a table listing the coordinates of the x-intercepts and extrema for f (x) = cos x for one
period, 2 , on the interval [0, 2 ]. Then use the amplitude of g(x) to find corresponding points on its graph.
Sketch the curve through the indicated points for each function. Then repeat the pattern to complete asecond period.
Functions f (x) = cos x g(x) = 6 cos x
Max (0, 1) (0, 6)
x-int
Min
x-int
Max
4. f (x) = sin x; g(x) = −8 sin x
SOLUTION: The graph of g(x) is the graph of f (x) expanded
vertically. The amplitude of g(x) is or 8.
Create a table listing the coordinates of the x-intercepts and extrema for f (x) = sin x for one
period, 2 , on the interval [0, 2 ]. Then use the amplitude of g(x) to find corresponding points on its graph.
Sketch the curve through the indicated points for each function. Then repeat the pattern to complete asecond period.
Function f (x) = sin x
x-int (0, 0)
Max
x-int
Min
x-int
Function g(x) = −8
sin x
x-int (0, 0)
Min
x-int
Max
x-int
Describe how the graphs of f (x) and g (x) are related. Then find the period of g (x), and sketch at least one period of both functions on the same coordinate axes.
5. f (x) = sin x; g(x) = sin 4x
SOLUTION: The graph of g(x) is the graph of f (x) compressed
horizontally. The period of g(x) is . To find
corresponding points on the graph of g(x), change the x-coordinates of those key points on f (x) so that
they range from 0 to , increasing by increments of
.
Sketch the curve through the indicated points for each function. Then repeat the pattern to complete asecond period.
Functions f (x) = sin x g(x) = sin
4x
x-int (0, 0) (0, 0)
Max
x-int
Min
x-int
6. f (x) = cos x; g(x) = cos 2x
SOLUTION: The graph of g(x) is the graph of f (x) compressed
horizontally. The period of g(x) is or . To find
corresponding points on the graph of g(x), change the x-coordinates of those key points on f (x) so that
they range from 0 to , increasing by increments of
.
Sketch the curve through the indicated points for each function. Then repeat the pattern to complete asecond period.
Functions f (x) = cos x g(x) = cos 2x
Max (0, 1) (0, 1)
x-int
Min
x-int
Max
7. f (x) = cos x;
SOLUTION: The graph of g(x) is the graph of f (x) expanded
horizontally. The period of g(x) is . To
find corresponding points on the graph of g(x), change the x-coordinates of those key points on f (x)
so that they range from 0 to , increasing by
increments of or .
Sketch the curve through the indicated points for each function. Then repeat the pattern to complete asecond period.
Functions f (x) = cos x
Max (0, 1) (0, 1)
x-int
Min
x-int
Max
8. f (x) = sin x;
SOLUTION: The graph of g(x) is the graph of f (x) expanded
horizontally. The period of g(x) is . To find corresponding points on the graph of g(x), change the x-coordinates of those key points on f (x) so that they range from 0 to , increasing by increments of
or .
Sketch the curve through the indicated points for each function. Then repeat the pattern to complete asecond period.
Functions f (x) = sin x
x-int (0, 0) (0, 0)
Max
x-int
Min
x-int
9. VOICES The contralto vocal type includes the deepest female singing voice. Some contraltos can sing as low as the E below middle C (E3), which hasa frequency of 165 hertz. Write an equation for a sine function that models the initial behavior of the sound wave associated with E3 having an amplitude of 0.15.
SOLUTION: The general form of the equation will be y = a sin bt,where t is the time in seconds. Because the
amplitude is 0.15, |a|= 0.15. This means that a = ±0.15. The period is the reciprocal of the frequency or
. Use this value to find b.
Sample answer: One sine function that models the
initial behavior is y = 0.15 sin 330 t.
Write a sine function that can be used to model the initial behavior of a sound wave with the frequency and amplitude given.
10. f = 440, a = 0.3
SOLUTION: The general form of the equation is y = a sin bt, where t is the time in seconds. Because the
amplitude is 0.3, = 0.3. This means that a = ±0.3.
The period is the reciprocal of the frequency or
. Use this value to find b.
Using the positive values of a and b, one sine function that models the initial behavior is y = 0.3 sin
880 t.
11. f = 932, a = 0.25
SOLUTION: The general form of the equation is y = a sin bt, where t is the time in seconds. Because the
amplitude is 0.25, = 0.25. This means that a =
±0.25. The period is the reciprocal of the frequency
or . Use this value to find b.
Using the positive values of a and b, one sine function that models the initial behavior is y = 0.25
sin 1864 t.
12. f = 1245, a = 0.12
SOLUTION: The general form of the equation is y = a sin bt, where t is the time in seconds. Because the
amplitude is 0.12, = 0.12. This means that a =
±0.12. The period is the reciprocal of the frequency or
. Use this value to find b.
Using the positive values of a and b, one sine function that models the initial behavior is y = 0.12
sin 2490 t.
13. f = 623, a = 0.2
SOLUTION: The general form of the equation is y = a sin bt, where t is the time in seconds. Because the
amplitude is 0.2, = 0.2. This means that a = ±0.2.
The period is the reciprocal of the frequency or
. Use this value to find b.
Using the positive values of a and b, one sine function that models the initial behavior is y = 0.2 sin
1246 t.
State the amplitude, period, frequency, phase shift, and vertical shift of each function. Then graph two periods of the function.
14.
SOLUTION:
In this function, a = 3, b = 1, c = − , and d = 0.
Because d = 0, there is no vertical shift.
Graph y = 3 sin x shifted units to the right.
15.
SOLUTION:
In this function, a = 1, b = , c = , and d = 0.
Because d = 0, there is no vertical shift.
16. y = 0.25 cos x + 3
SOLUTION:
In this function, a = , b = 1, c = 0, and d = 3.
Graph y = cos x shifted 3 units up.
17. y = sin 3x – 2
SOLUTION: In this function, a = 1, b = 3, c = 0, and d = –2.
Graph y = sin 3x shifted 2 units down.
18.
SOLUTION:
In this function, a = 1, b = 1, c = , and d = –1.
.
Graph y = cos x shifted units to the right and 1
unit down.
19.
SOLUTION:
In this function, a = 1, b = 1, c = , and d = 4.
.
Graph y = sin x shifted units to the left and 4 units up.
20. VACATIONS The average number of reservations R that a vacation resort has at the beginning of each month is shown.
a. Write an equation of a sinusoidal function that models the average number of reservations using x =1 to represent January. b. According to your model, approximately how many reservations can the resort anticipate in November?
SOLUTION: a. Make a scatter plot of the data and choose a model.
Sample answer: Use a sinusoidal function of the form y = a cos (bx + c) + d to model the data. First, find the maximum M and minimum m values of the data, and use these values to find a, b, c, and d. The maximum and minimum reservations are 200 and 87, respectively. The amplitude a is half of the distance between these values.
The vertical shift d is the average of the maximum and minimum data values.
There are 3 months between the maximum and minimum, so the period is 6.
The maximum data value occurs when x = 1. Since y = cos x attains its first maximum when x = 0, we must apply a phase shift of 1 unit. Use this value to find c.
Write a function using the values for a, b, c, and d.
Use b =
b. To find the number of reservations in November, evaluate the model for x = 11.
Therefore, the resort can anticipate about 115 reservations in November.
21. TIDES The table shown below provides data for the first high and low tides of the day for a certain bay during one day in June.
a. Determine the amplitude, period, phase shift, and vertical shift of a sinusoidal function that models the height of the tide. Let x represent the number of hours that the high or low tide occurred after midnight. b. Write a sinusoidal function that models the data. c. According to your model, what was the height of
the tide at 8:45 P.M. that night?
SOLUTION: a. Sample answer: Use a sinusoidal function of the form y = a cos (bx + c) + d to model the data. First, find the amplitude a, which is half of the distance between the heights of the high and low tides.
The vertical shift d is the average of the heights of the high and low tides.
A sinusoid completes half of a period in the time thatit takes to go from its maximum to its minimum value. One period is twice this time. The first high tide occurs 6.5 hours before the first low tide, so the period is 13.
The maximum data value occurs when x ≈ 4.417. Since y = cos x attains its first maximum when x = 0,we must apply a phase shift of 4.417 units. Use this value to find c.
b. Write a function using the values for a, b, c, and
d. Use b =
c. To find the height of the water at 8:45 P.M. that
night, evaluate the model for x = 20.75.
Therefore, the tide was about 7.28 feet high at 8:45
P.M. that night.
22. METEOROLOGY The average monthly temperatures for Boston, Massachusetts are shown.
a. Determine the amplitude, period, phase shift, and vertical shift of a sinusoidal function that models the monthly temperatures using x = 1 to represent January. b. Write an equation of a sinusoidal function that models the monthly temperatures. c. According to your model, what is Boston’s average temperature in August?
SOLUTION: a. The maximum and minimum are 74° and 29°, respectively. The amplitude a is half of the distance between these values.
The vertical shift d is the average of the maximum and minimum data values.
A sinusoid completes half of a period in the time thatit takes to go from its maximum to its minimum value. So, one period is twice this time. The
maximum function value occurs in July, so xmax is 7.
The minimum function value occurs in January, so
xmin is 1. The period is 2(6) = 12.
The maximum data value occurs when x = 7. Since y = cos x attains its first maximum when x = 0, we must apply a phase shift of 7 units. Use this value to find c.
b. Using the values for a, b, c, and d from part a, a sinusoidal function that models that monthly temperatures in Boston is
c. To find the average monthly temperature for Boston in August, evaluate the model for x = 8.
Therefore, the average monthly temperature for Boston in August is about 71°F.
GRAPHING CALCULATOR Find the values of x in the interval – < x < that make each equation or inequality true. (Hint: Use the intersection function.)
23. –sin x = cos x
SOLUTION:
Graph y = −sin x and y = cos x on the same graphing
calculator screen on (−π, π). Use the intersect feature under the CALC menu to determine where the two graphs intersect.
The graphs intersect at about −0.7854 or − and
about 2.356 or . Therefore, on –π < x < π, –sin x
= cos x when x = − and .
24. sin x − cos x = 1
SOLUTION:
Graph y = sin x − cos x and y = 1 on the same
graphing calculator screen on (− , ). Use the intersect feature under the CALC menu to determine where the two graphs intersect.
The graphs intersect at about 1.57 or . Therefore,
on – < x < , sin x − cos x = 1 when x = .
25. sin x + cos x = 0
SOLUTION:
Graph y = sin x + cos x on (−π, π). Use the zero feature under the CALC menu to determine the zeros of the function.
There are zeros at about −0.785 or − or and about
2.356 or . Therefore, on – < x < , sin x + cos
x = 0 when
26. cos x ≤ sin x
SOLUTION:
Graph y = cos x and y = sin x on (−π, π). Use the intersect feature under the CALC menu to determine on what interval(s) cos x ≤ sin x.
The graphs intersect at about –2.356 or – and
about 0.785 or . From the graph, it appears that
cos x ≤ sin x on – < x < – and < x < .
27. sin x cos x > 1
SOLUTION:
Graph y = sin x cos x and y = 1 on (− , ). Use the intersect feature under the CALC menu to determine on what interval(s) sin x cos x > 1.
The graphs do not intersect. Therefore, y = sin x cos
x is not greater than y = 1 for any values of x on –< x < .
28. sin x cos x ≤ 0
SOLUTION:
Graph y = sin x cos x on (−π, π). Use the zero feature under the CALC menu to determine on what interval(s) sin x cos x ≤ 0.
The zeros of y = sin x cos x are about –1.57 or ,
0, and about 1.57 or . From the graph, it appears
that sin x cos x ≤ 0 on < x < 0 and < x < .
29. CAROUSELS A wooden horse on a carousel moves up and down as the carousel spins. When the ride ends, the horse usually stops in a vertical position different from where it started. The position y of the horse after t seconds can be modeled by y =1.5 sin (2t + c), where the phase shift c must be continuously adjusted to compensate for the differentstarting positions. If during one ride the horse
reached a maximum height after seconds, find
the equation that models the horse’s position.
SOLUTION: First, find the period of y = 1.5 sin (2t + c).
Since the period is π, the function will reach a
maximum height at radians. The phase shift is the
difference between the horizontal position of the
function at and radians, which is radians.
Substitute and b into the phase shift formula to
find c.
Therefore, the equation is
30. AMUSEMENT PARKS The position y in feet of a passenger cart relative to the center of a Ferris wheel over t seconds is shown below.
a. Find the time t that it takes for the cart to return toy = 0 during its initial spin. b. Find the period of the Ferris wheel. c. Sketch the graph representing the position of the passenger cart over one period. d. Write a sinusoidal function that models the position of the passenger cart as a function of time t.
SOLUTION: a. From the diagram, the height of the cart is 0 ft when t = 0, and reaches a maximum height of 19 feet when t = 3.75 seconds. So, the cart will return to y = 0 after 2(3.75) or 7.5 seconds. b. The cart completes half of a cycle from t = 0 to t = 7.5. So, the period is 2(7.5) or 15 seconds. c.
d. The amplitude a is half of the maximum and
minimum values. So, a =
The vertical shift d is the average of the maximum
and minimum data values. So,
Because the period of a sinusoidal function is
you can write Therefore,
There is no phase shift because the height of the cartwhen t = 0 is 0 feet, and the sine function has a y-intercept of 0. Therefore, one equation that could be used to model
the position of the passenger cart is y = 19 sin t.
Write an equation that corresponds to each graph.
31.
SOLUTION: Sample answer: There is an x-intercept at 0, so one equation that corresponds to this graph is y = a sin (bx + c) + d. Half of the distance from the maximum to the minimum value of the function is 3. So, the amplitudeis 3. It appears that the function completes one period on
[0, π]. Find b.
The midline appears to be at y = 0, so there does not appear to be any vertical shift. Therefore, one equation that corresponds to this graph is y = 3 sin (2x).
32.
SOLUTION:
Sample answer: Because there is a y-intercept at ,
one equation that corresponds to this graph is y = a cos (bx + c) + d. Half of the distance from the maximum to the
minimum value of the function is . So, the
amplitude is .
It appears that the function completes one period on [0, 6π]. Find b.
The midline appears to be at y = 0, so there does not appear to be any vertical shift. Therefore, one
equation that corresponds to this graph is y = cos
.
33.
SOLUTION: Sample answer: Because there is a y-intercept at 3, one equation that corresponds to this graph is y = a cos (bx + c) + d. Half of the distance from the maximum to the
minimum value of the function is 4 ÷ 2 or 2. So, the amplitude is 2. It appears that the function completes one period on
Find b.
The midline appears to be at y = 1, so there is a vertical shift 1 unit up. Therefore, one equation that corresponds to this graph is y = 2 cos 4x + 1.
34.
SOLUTION: Sample answer: There is an x-intercept at 0, so one equation that corresponds to this graph is y = a sin (bx + c) + d. Half of the distance from the maximum to the
minimum value of the function is 8 ÷ 2 or 4. So, the amplitude is 4. It appears that the function completes one period on [0, 4π]. Find b.
The midline appears to be at y = −2, so there is a vertical shift of 2 units down. Therefore, one equation that corresponds to this graph is y = 4 sin
− 2.
Write a sinusoidal function with the given period and amplitude that passes through the given point.
35. period: ; amplitude: 5; point:
SOLUTION: Use the period to find b.
Sample answer: One sinusoidal function in which a =5 and b = 2 is y = 5 cos 2x. Evaluate the function for
The function passes through . Therefore, a
sinusoidal function with period π and amplitude 5 that
passes through the point is y = 5 cos 2x.
36. period: 4 ; amplitude: 2; point: ( , 2)
SOLUTION: Use the period to find b.
Sample answer: One sinusoidal function in which a =
2 and b = is y = 2 sin . Evaluate the function
for x = π.
The function passes through ( , 2). Therefore, a
sinusoidal function with period 4π and amplitude 2
that passes through the point ( , 2) is y = 2 sin .
37. period: ; amplitude: ; point:
SOLUTION: Use the period to find b.
Sample answer: One sinusoidal function in which a =1.5 and b = 4 is y = 1.5 cos 4x. Evaluate the function
for
The function passes through . Therefore, a
sinusoidal function with period and amplitude 1.5
that passes through the point is y = 1.5 cos
4x.
38. period: 3π; amplitude: ; point:
SOLUTION: Use the period to find b.
Sample answer: One sinusoidal function in which a =
0.5 and b = is y = sin x. Evaluate the
function for
The function passes through . Therefore, a
sinusoidal function with period 3π and amplitude 0.5
that passes through the point is y = sin
x.
39. MULTIPLE REPRESENTATIONS In this problem, you will investigate the change in the graph of a sinusoidal function of the form y = sin x or y = cos x when multiplied by a polynomial function. a. GRAPHICAL Use a graphing calculator to sketch the graphs of y = 2x, y = –2x, and y = 2x cos x on the same coordinate plane, on the interval [–20, 20]. b. VERBAL Describe the behavior of the graph of y = 2x cos x in relation to the graphs of y = 2x and y = –2x. c. GRAPHICAL Use a graphing calculator to
sketch the graphs of y = x2, y = –x
2, and y = x
2 sin x
on the same coordinate plane, on the interval [–20, 20]. d. VERBAL Describe the behavior of the graph of
y = x2 sin x in relation to the graphs of y = x
2 and y
= –x2.
e. ANALYTICAL Make a conjecture as to the behavior of the graph of a sinusoidal function of the form y = sin x or y = cos x when multiplied by polynomial function of the form y = f (x).
SOLUTION: a.
b. The graph of y = 2x cos x oscillates between the graphs of y = 2x and y = –2x. c.
d. The graph of y = x2 sin x oscillates between the
graphs of y = x2 and y = –x
2.
e . The graph of y = f (x) sin x or y = f (x) cos x will oscillate between the graphs of y = f (x) and y = –f(x).
40. CHALLENGE Without graphing, find the exact coordinates of the first maximum point to the right of
the y-axis for
SOLUTION:
First, find the phase shift for
Next, find the period of the function.
The first maximum for one period can be found by
finding So, incorporating the phase shift, the
first maximum to the right of the y-axis is
. Because the amplitude is |4| = 4,
the maximum point is
REASONING Determine whether each statement is true or false . Explain your reasoning.
41. Every sine function of the form y = a sin (bx + c) + d can be written as a cosine function of the form y =a cos (bx + c) + d.
SOLUTION: It is true that every sine function of the form y = a sin (bx + c) + d can be written as a cosine function of the form y = a cos (bx + c) + d. The graph of cosine is a horizontal translation of the sine graph. Therefore, a cosine function can be written from any sine function using the same amplitude and period by applying the necessary phase shift.
For example, consider and
. Phase shift by
to obtain .
42. The period of f (x) = cos 8x is equal to four times the period of g(x) = cos 2x.
SOLUTION: Find the period of f (x) = cos 8x.
Find the period of g(x) = cos 2x.
Four times the period of g(x) = cos 2x is 4 ⋅ or
4 . So, the period of f (x) is the period of g(x).
Therefore, the statement is false.
43. CHALLENGE How many zeros does y = cos
1500x have on the interval 0 ≤ x ≤ 2 ?
SOLUTION: Find the period of y = cos 1500x.
Graph y = cos 1500x on .
The graph of y = cos 1500x has two x-intercepts for one cycle, so the function has 2 zeros per cycle. Find
the number of cycles for y = cos 1500x on [0, 2 ].
So, the graph of y = cos 1500x will complete 1500
cycles on [0, 2 ]. Because there are two zeros per cycle, y = cos 1500x will have 1500(2) or 3000 zeros
on [0, 2 ].
44. PROOF Prove the phase shift formula.
SOLUTION:
Consider y = a sin (bx + c), where a , b, and c ≠ 0. To find a zero of the function, find the value of x for which a sin (bx + c) = 0. Since sin 0 = 0, solving bx + c = 0 will yield a zero of the function.
Therefore, y = 0 when . The value of is
the phase shift. When c > 0: The graph of y = a sin (bx + c) is the
graph of y = a sin x, shifted units to the left.
When c < 0: The graph of y = a sin (bx + c) is the
graph of y = a sin x, shifted units to the right.
Consider the graph of y = cos x below in blue. In this equation a = 1, b = 1 and c = 0. One zero of y = cos x is . The green graph is shifted to the
left. Thus c is – . Then the shifted equation will be
.
45. Writing in Math The Power Tower ride in Sandusky, Ohio, is shown below. Along the side of each tower is a string of lights that send a continuouspulse of light up and down each tower at a constant rate. Explain why the distance d of this light from theground over time t cannot be represented by a sinusoidal function.
SOLUTION: Sample answer: Although the pulse of light can be represented as a function with a period, it is not a sinusoidal function because the distance the pulse of light is from the ground changes at a constant rate. As a result, the graph of this function would resemble the graph below.
The given point lies on the terminal side of an angle θ in standard position. Find the values of
the six trigonometric functions of θ. 46. (−4, 4)
SOLUTION: Use the values of x and y to find r.
Use x = –4, y = 4, and r = to write the six trigonometric ratios.
47. (8, −2)
SOLUTION: Use the values of x and y to find r.
Use x = 8, y = –2, and r = to write the six trigonometric ratios.
48. (−5, −9)
SOLUTION: Use the values of x and y to find r.
Use x = –5, y = – 9, and r = to write the six trigonometric ratios.
49. (4, 5)
SOLUTION: Use the values of x and y to find r.
Use x = 4, y = 5, and r = to write the six trigonometric ratios.
Write each degree measure in radians as a multiple of π and each radian measure in degrees.
50. 25°
SOLUTION: To convert a degree measure to radians, multiply by
51. −420°
SOLUTION: To convert a degree measure to radians, multiply by
52.
SOLUTION: To convert a radian measure to degrees, multiply by
53.
SOLUTION: To convert a radian measure to degrees, multiply by
54. SCIENCE Radiocarbon dating is a method of estimating the age of an organic material by calculating the amount of carbon-14 present in the material. The age of a material can be calculated
using A = t , where A is the age of the
object in years, t is the half-life of carbon-14 or 5700 years, and R is the ratio of the amount of carbon-14 in the sample to the amount of carbon-14 in living tissue. a. A sample of organic material contains 0.000076 gram of carbon-14. A living sample of the same
eSolutions Manual - Powered by Cognero Page 11
4-4 Graphing Sine and Cosine Functions
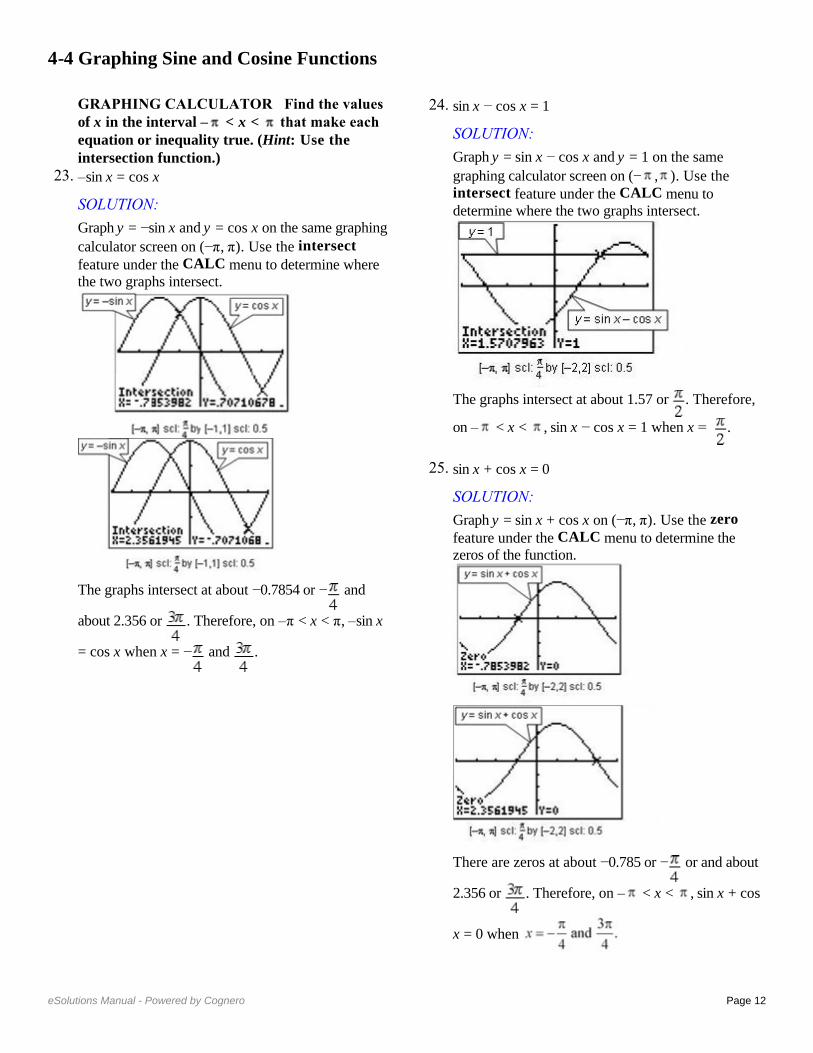
Describe how the graphs of f (x) and g (x) are related. Then find the amplitude of g (x), and sketch two periods of both functions on the same coordinate axes.
1. f (x) = sin x; g(x) = sin x
SOLUTION: The graph of g(x) is the graph of f (x) compressed
vertically. The amplitude of g(x) is or .
Create a table listing the coordinates of the x-intercepts and extrema for f (x) = sin x for one
period, 2 , on the interval [0, 2 ]. Then use the amplitude of g(x) to find corresponding points on its graph.
Sketch the curve through the indicated points for each function. Then repeat the pattern to complete asecond period.
Functions f (x) = sin x g(x) = sin x
x-int (0, 0) (0, 0)
Max
x-int
Min
x-int
2.
SOLUTION: The graph of g(x) is the graph of f (x) compressed
vertically. The amplitude of g(x) is or .
Create a table listing the coordinates of the x-intercepts and extrema for f (x) = cos x for one
period, 2 , on the interval [0, 2 ]. Then use the amplitude of g(x) to find corresponding points on its graph.
Sketch the curve through the indicated points for each function. Then repeat the pattern to complete asecond period.
Function f (x) = cos x
Max (0, 1)
x-int Min
x-in
Min
x-int
Function f (x) = cos x
Max x-int
Min
x-in
Min
x-int
3. f (x) = cos x; g(x) = 6 cos x
SOLUTION: The graph of g(x) is the graph of f (x) expanded
vertically. The amplitude of g(x) is or 6.
Create a table listing the coordinates of the x-intercepts and extrema for f (x) = cos x for one
period, 2 , on the interval [0, 2 ]. Then use the amplitude of g(x) to find corresponding points on its graph.
Sketch the curve through the indicated points for each function. Then repeat the pattern to complete asecond period.
Functions f (x) = cos x g(x) = 6 cos x
Max (0, 1) (0, 6)
x-int
Min
x-int
Max
4. f (x) = sin x; g(x) = −8 sin x
SOLUTION: The graph of g(x) is the graph of f (x) expanded
vertically. The amplitude of g(x) is or 8.
Create a table listing the coordinates of the x-intercepts and extrema for f (x) = sin x for one
period, 2 , on the interval [0, 2 ]. Then use the amplitude of g(x) to find corresponding points on its graph.
Sketch the curve through the indicated points for each function. Then repeat the pattern to complete asecond period.
Function f (x) = sin x
x-int (0, 0)
Max
x-int
Min
x-int
Function g(x) = −8
sin x
x-int (0, 0)
Min
x-int
Max
x-int
Describe how the graphs of f (x) and g (x) are related. Then find the period of g (x), and sketch at least one period of both functions on the same coordinate axes.
5. f (x) = sin x; g(x) = sin 4x
SOLUTION: The graph of g(x) is the graph of f (x) compressed
horizontally. The period of g(x) is . To find
corresponding points on the graph of g(x), change the x-coordinates of those key points on f (x) so that
they range from 0 to , increasing by increments of
.
Sketch the curve through the indicated points for each function. Then repeat the pattern to complete asecond period.
Functions f (x) = sin x g(x) = sin
4x
x-int (0, 0) (0, 0)
Max
x-int
Min
x-int
6. f (x) = cos x; g(x) = cos 2x
SOLUTION: The graph of g(x) is the graph of f (x) compressed
horizontally. The period of g(x) is or . To find
corresponding points on the graph of g(x), change the x-coordinates of those key points on f (x) so that
they range from 0 to , increasing by increments of
.
Sketch the curve through the indicated points for each function. Then repeat the pattern to complete asecond period.
Functions f (x) = cos x g(x) = cos 2x
Max (0, 1) (0, 1)
x-int
Min
x-int
Max
7. f (x) = cos x;
SOLUTION: The graph of g(x) is the graph of f (x) expanded
horizontally. The period of g(x) is . To
find corresponding points on the graph of g(x), change the x-coordinates of those key points on f (x)
so that they range from 0 to , increasing by
increments of or .
Sketch the curve through the indicated points for each function. Then repeat the pattern to complete asecond period.
Functions f (x) = cos x
Max (0, 1) (0, 1)
x-int
Min
x-int
Max
8. f (x) = sin x;
SOLUTION: The graph of g(x) is the graph of f (x) expanded
horizontally. The period of g(x) is . To find corresponding points on the graph of g(x), change the x-coordinates of those key points on f (x) so that they range from 0 to , increasing by increments of
or .
Sketch the curve through the indicated points for each function. Then repeat the pattern to complete asecond period.
Functions f (x) = sin x
x-int (0, 0) (0, 0)
Max
x-int
Min
x-int
9. VOICES The contralto vocal type includes the deepest female singing voice. Some contraltos can sing as low as the E below middle C (E3), which hasa frequency of 165 hertz. Write an equation for a sine function that models the initial behavior of the sound wave associated with E3 having an amplitude of 0.15.
SOLUTION: The general form of the equation will be y = a sin bt,where t is the time in seconds. Because the
amplitude is 0.15, |a|= 0.15. This means that a = ±0.15. The period is the reciprocal of the frequency or
. Use this value to find b.
Sample answer: One sine function that models the
initial behavior is y = 0.15 sin 330 t.
Write a sine function that can be used to model the initial behavior of a sound wave with the frequency and amplitude given.
10. f = 440, a = 0.3
SOLUTION: The general form of the equation is y = a sin bt, where t is the time in seconds. Because the
amplitude is 0.3, = 0.3. This means that a = ±0.3.
The period is the reciprocal of the frequency or
. Use this value to find b.
Using the positive values of a and b, one sine function that models the initial behavior is y = 0.3 sin
880 t.
11. f = 932, a = 0.25
SOLUTION: The general form of the equation is y = a sin bt, where t is the time in seconds. Because the
amplitude is 0.25, = 0.25. This means that a =
±0.25. The period is the reciprocal of the frequency
or . Use this value to find b.
Using the positive values of a and b, one sine function that models the initial behavior is y = 0.25
sin 1864 t.
12. f = 1245, a = 0.12
SOLUTION: The general form of the equation is y = a sin bt, where t is the time in seconds. Because the
amplitude is 0.12, = 0.12. This means that a =
±0.12. The period is the reciprocal of the frequency or
. Use this value to find b.
Using the positive values of a and b, one sine function that models the initial behavior is y = 0.12
sin 2490 t.
13. f = 623, a = 0.2
SOLUTION: The general form of the equation is y = a sin bt, where t is the time in seconds. Because the
amplitude is 0.2, = 0.2. This means that a = ±0.2.
The period is the reciprocal of the frequency or
. Use this value to find b.
Using the positive values of a and b, one sine function that models the initial behavior is y = 0.2 sin
1246 t.
State the amplitude, period, frequency, phase shift, and vertical shift of each function. Then graph two periods of the function.
14.
SOLUTION:
In this function, a = 3, b = 1, c = − , and d = 0.
Because d = 0, there is no vertical shift.
Graph y = 3 sin x shifted units to the right.
15.
SOLUTION:
In this function, a = 1, b = , c = , and d = 0.
Because d = 0, there is no vertical shift.
16. y = 0.25 cos x + 3
SOLUTION:
In this function, a = , b = 1, c = 0, and d = 3.
Graph y = cos x shifted 3 units up.
17. y = sin 3x – 2
SOLUTION: In this function, a = 1, b = 3, c = 0, and d = –2.
Graph y = sin 3x shifted 2 units down.
18.
SOLUTION:
In this function, a = 1, b = 1, c = , and d = –1.
.
Graph y = cos x shifted units to the right and 1
unit down.
19.
SOLUTION:
In this function, a = 1, b = 1, c = , and d = 4.
.
Graph y = sin x shifted units to the left and 4 units up.
20. VACATIONS The average number of reservations R that a vacation resort has at the beginning of each month is shown.
a. Write an equation of a sinusoidal function that models the average number of reservations using x =1 to represent January. b. According to your model, approximately how many reservations can the resort anticipate in November?
SOLUTION: a. Make a scatter plot of the data and choose a model.
Sample answer: Use a sinusoidal function of the form y = a cos (bx + c) + d to model the data. First, find the maximum M and minimum m values of the data, and use these values to find a, b, c, and d. The maximum and minimum reservations are 200 and 87, respectively. The amplitude a is half of the distance between these values.
The vertical shift d is the average of the maximum and minimum data values.
There are 3 months between the maximum and minimum, so the period is 6.
The maximum data value occurs when x = 1. Since y = cos x attains its first maximum when x = 0, we must apply a phase shift of 1 unit. Use this value to find c.
Write a function using the values for a, b, c, and d.
Use b =
b. To find the number of reservations in November, evaluate the model for x = 11.
Therefore, the resort can anticipate about 115 reservations in November.
21. TIDES The table shown below provides data for the first high and low tides of the day for a certain bay during one day in June.
a. Determine the amplitude, period, phase shift, and vertical shift of a sinusoidal function that models the height of the tide. Let x represent the number of hours that the high or low tide occurred after midnight. b. Write a sinusoidal function that models the data. c. According to your model, what was the height of
the tide at 8:45 P.M. that night?
SOLUTION: a. Sample answer: Use a sinusoidal function of the form y = a cos (bx + c) + d to model the data. First, find the amplitude a, which is half of the distance between the heights of the high and low tides.
The vertical shift d is the average of the heights of the high and low tides.
A sinusoid completes half of a period in the time thatit takes to go from its maximum to its minimum value. One period is twice this time. The first high tide occurs 6.5 hours before the first low tide, so the period is 13.
The maximum data value occurs when x ≈ 4.417. Since y = cos x attains its first maximum when x = 0,we must apply a phase shift of 4.417 units. Use this value to find c.
b. Write a function using the values for a, b, c, and
d. Use b =
c. To find the height of the water at 8:45 P.M. that
night, evaluate the model for x = 20.75.
Therefore, the tide was about 7.28 feet high at 8:45
P.M. that night.
22. METEOROLOGY The average monthly temperatures for Boston, Massachusetts are shown.
a. Determine the amplitude, period, phase shift, and vertical shift of a sinusoidal function that models the monthly temperatures using x = 1 to represent January. b. Write an equation of a sinusoidal function that models the monthly temperatures. c. According to your model, what is Boston’s average temperature in August?
SOLUTION: a. The maximum and minimum are 74° and 29°, respectively. The amplitude a is half of the distance between these values.
The vertical shift d is the average of the maximum and minimum data values.
A sinusoid completes half of a period in the time thatit takes to go from its maximum to its minimum value. So, one period is twice this time. The
maximum function value occurs in July, so xmax is 7.
The minimum function value occurs in January, so
xmin is 1. The period is 2(6) = 12.
The maximum data value occurs when x = 7. Since y = cos x attains its first maximum when x = 0, we must apply a phase shift of 7 units. Use this value to find c.
b. Using the values for a, b, c, and d from part a, a sinusoidal function that models that monthly temperatures in Boston is
c. To find the average monthly temperature for Boston in August, evaluate the model for x = 8.
Therefore, the average monthly temperature for Boston in August is about 71°F.
GRAPHING CALCULATOR Find the values of x in the interval – < x < that make each equation or inequality true. (Hint: Use the intersection function.)
23. –sin x = cos x
SOLUTION:
Graph y = −sin x and y = cos x on the same graphing
calculator screen on (−π, π). Use the intersect feature under the CALC menu to determine where the two graphs intersect.
The graphs intersect at about −0.7854 or − and
about 2.356 or . Therefore, on –π < x < π, –sin x
= cos x when x = − and .
24. sin x − cos x = 1
SOLUTION:
Graph y = sin x − cos x and y = 1 on the same
graphing calculator screen on (− , ). Use the intersect feature under the CALC menu to determine where the two graphs intersect.
The graphs intersect at about 1.57 or . Therefore,
on – < x < , sin x − cos x = 1 when x = .
25. sin x + cos x = 0
SOLUTION:
Graph y = sin x + cos x on (−π, π). Use the zero feature under the CALC menu to determine the zeros of the function.
There are zeros at about −0.785 or − or and about
2.356 or . Therefore, on – < x < , sin x + cos
x = 0 when
26. cos x ≤ sin x
SOLUTION:
Graph y = cos x and y = sin x on (−π, π). Use the intersect feature under the CALC menu to determine on what interval(s) cos x ≤ sin x.
The graphs intersect at about –2.356 or – and
about 0.785 or . From the graph, it appears that
cos x ≤ sin x on – < x < – and < x < .
27. sin x cos x > 1
SOLUTION:
Graph y = sin x cos x and y = 1 on (− , ). Use the intersect feature under the CALC menu to determine on what interval(s) sin x cos x > 1.
The graphs do not intersect. Therefore, y = sin x cos
x is not greater than y = 1 for any values of x on –< x < .
28. sin x cos x ≤ 0
SOLUTION:
Graph y = sin x cos x on (−π, π). Use the zero feature under the CALC menu to determine on what interval(s) sin x cos x ≤ 0.
The zeros of y = sin x cos x are about –1.57 or ,
0, and about 1.57 or . From the graph, it appears
that sin x cos x ≤ 0 on < x < 0 and < x < .
29. CAROUSELS A wooden horse on a carousel moves up and down as the carousel spins. When the ride ends, the horse usually stops in a vertical position different from where it started. The position y of the horse after t seconds can be modeled by y =1.5 sin (2t + c), where the phase shift c must be continuously adjusted to compensate for the differentstarting positions. If during one ride the horse
reached a maximum height after seconds, find
the equation that models the horse’s position.
SOLUTION: First, find the period of y = 1.5 sin (2t + c).
Since the period is π, the function will reach a
maximum height at radians. The phase shift is the
difference between the horizontal position of the
function at and radians, which is radians.
Substitute and b into the phase shift formula to
find c.
Therefore, the equation is
30. AMUSEMENT PARKS The position y in feet of a passenger cart relative to the center of a Ferris wheel over t seconds is shown below.
a. Find the time t that it takes for the cart to return toy = 0 during its initial spin. b. Find the period of the Ferris wheel. c. Sketch the graph representing the position of the passenger cart over one period. d. Write a sinusoidal function that models the position of the passenger cart as a function of time t.
SOLUTION: a. From the diagram, the height of the cart is 0 ft when t = 0, and reaches a maximum height of 19 feet when t = 3.75 seconds. So, the cart will return to y = 0 after 2(3.75) or 7.5 seconds. b. The cart completes half of a cycle from t = 0 to t = 7.5. So, the period is 2(7.5) or 15 seconds. c.
d. The amplitude a is half of the maximum and
minimum values. So, a =
The vertical shift d is the average of the maximum
and minimum data values. So,
Because the period of a sinusoidal function is
you can write Therefore,
There is no phase shift because the height of the cartwhen t = 0 is 0 feet, and the sine function has a y-intercept of 0. Therefore, one equation that could be used to model
the position of the passenger cart is y = 19 sin t.
Write an equation that corresponds to each graph.
31.
SOLUTION: Sample answer: There is an x-intercept at 0, so one equation that corresponds to this graph is y = a sin (bx + c) + d. Half of the distance from the maximum to the minimum value of the function is 3. So, the amplitudeis 3. It appears that the function completes one period on
[0, π]. Find b.
The midline appears to be at y = 0, so there does not appear to be any vertical shift. Therefore, one equation that corresponds to this graph is y = 3 sin (2x).
32.
SOLUTION:
Sample answer: Because there is a y-intercept at ,
one equation that corresponds to this graph is y = a cos (bx + c) + d. Half of the distance from the maximum to the
minimum value of the function is . So, the
amplitude is .
It appears that the function completes one period on [0, 6π]. Find b.
The midline appears to be at y = 0, so there does not appear to be any vertical shift. Therefore, one
equation that corresponds to this graph is y = cos
.
33.
SOLUTION: Sample answer: Because there is a y-intercept at 3, one equation that corresponds to this graph is y = a cos (bx + c) + d. Half of the distance from the maximum to the
minimum value of the function is 4 ÷ 2 or 2. So, the amplitude is 2. It appears that the function completes one period on
Find b.
The midline appears to be at y = 1, so there is a vertical shift 1 unit up. Therefore, one equation that corresponds to this graph is y = 2 cos 4x + 1.
34.
SOLUTION: Sample answer: There is an x-intercept at 0, so one equation that corresponds to this graph is y = a sin (bx + c) + d. Half of the distance from the maximum to the
minimum value of the function is 8 ÷ 2 or 4. So, the amplitude is 4. It appears that the function completes one period on [0, 4π]. Find b.
The midline appears to be at y = −2, so there is a vertical shift of 2 units down. Therefore, one equation that corresponds to this graph is y = 4 sin
− 2.
Write a sinusoidal function with the given period and amplitude that passes through the given point.
35. period: ; amplitude: 5; point:
SOLUTION: Use the period to find b.
Sample answer: One sinusoidal function in which a =5 and b = 2 is y = 5 cos 2x. Evaluate the function for
The function passes through . Therefore, a
sinusoidal function with period π and amplitude 5 that
passes through the point is y = 5 cos 2x.
36. period: 4 ; amplitude: 2; point: ( , 2)
SOLUTION: Use the period to find b.
Sample answer: One sinusoidal function in which a =
2 and b = is y = 2 sin . Evaluate the function
for x = π.
The function passes through ( , 2). Therefore, a
sinusoidal function with period 4π and amplitude 2
that passes through the point ( , 2) is y = 2 sin .
37. period: ; amplitude: ; point:
SOLUTION: Use the period to find b.
Sample answer: One sinusoidal function in which a =1.5 and b = 4 is y = 1.5 cos 4x. Evaluate the function
for
The function passes through . Therefore, a
sinusoidal function with period and amplitude 1.5
that passes through the point is y = 1.5 cos
4x.
38. period: 3π; amplitude: ; point:
SOLUTION: Use the period to find b.
Sample answer: One sinusoidal function in which a =
0.5 and b = is y = sin x. Evaluate the
function for
The function passes through . Therefore, a
sinusoidal function with period 3π and amplitude 0.5
that passes through the point is y = sin
x.
39. MULTIPLE REPRESENTATIONS In this problem, you will investigate the change in the graph of a sinusoidal function of the form y = sin x or y = cos x when multiplied by a polynomial function. a. GRAPHICAL Use a graphing calculator to sketch the graphs of y = 2x, y = –2x, and y = 2x cos x on the same coordinate plane, on the interval [–20, 20]. b. VERBAL Describe the behavior of the graph of y = 2x cos x in relation to the graphs of y = 2x and y = –2x. c. GRAPHICAL Use a graphing calculator to
sketch the graphs of y = x2, y = –x
2, and y = x
2 sin x
on the same coordinate plane, on the interval [–20, 20]. d. VERBAL Describe the behavior of the graph of
y = x2 sin x in relation to the graphs of y = x
2 and y
= –x2.
e. ANALYTICAL Make a conjecture as to the behavior of the graph of a sinusoidal function of the form y = sin x or y = cos x when multiplied by polynomial function of the form y = f (x).
SOLUTION: a.
b. The graph of y = 2x cos x oscillates between the graphs of y = 2x and y = –2x. c.
d. The graph of y = x2 sin x oscillates between the
graphs of y = x2 and y = –x
2.
e . The graph of y = f (x) sin x or y = f (x) cos x will oscillate between the graphs of y = f (x) and y = –f(x).
40. CHALLENGE Without graphing, find the exact coordinates of the first maximum point to the right of
the y-axis for
SOLUTION:
First, find the phase shift for
Next, find the period of the function.
The first maximum for one period can be found by
finding So, incorporating the phase shift, the
first maximum to the right of the y-axis is
. Because the amplitude is |4| = 4,
the maximum point is
REASONING Determine whether each statement is true or false . Explain your reasoning.
41. Every sine function of the form y = a sin (bx + c) + d can be written as a cosine function of the form y =a cos (bx + c) + d.
SOLUTION: It is true that every sine function of the form y = a sin (bx + c) + d can be written as a cosine function of the form y = a cos (bx + c) + d. The graph of cosine is a horizontal translation of the sine graph. Therefore, a cosine function can be written from any sine function using the same amplitude and period by applying the necessary phase shift.
For example, consider and
. Phase shift by
to obtain .
42. The period of f (x) = cos 8x is equal to four times the period of g(x) = cos 2x.
SOLUTION: Find the period of f (x) = cos 8x.
Find the period of g(x) = cos 2x.
Four times the period of g(x) = cos 2x is 4 ⋅ or
4 . So, the period of f (x) is the period of g(x).
Therefore, the statement is false.
43. CHALLENGE How many zeros does y = cos
1500x have on the interval 0 ≤ x ≤ 2 ?
SOLUTION: Find the period of y = cos 1500x.
Graph y = cos 1500x on .
The graph of y = cos 1500x has two x-intercepts for one cycle, so the function has 2 zeros per cycle. Find
the number of cycles for y = cos 1500x on [0, 2 ].
So, the graph of y = cos 1500x will complete 1500
cycles on [0, 2 ]. Because there are two zeros per cycle, y = cos 1500x will have 1500(2) or 3000 zeros
on [0, 2 ].
44. PROOF Prove the phase shift formula.
SOLUTION:
Consider y = a sin (bx + c), where a , b, and c ≠ 0. To find a zero of the function, find the value of x for which a sin (bx + c) = 0. Since sin 0 = 0, solving bx + c = 0 will yield a zero of the function.
Therefore, y = 0 when . The value of is
the phase shift. When c > 0: The graph of y = a sin (bx + c) is the
graph of y = a sin x, shifted units to the left.
When c < 0: The graph of y = a sin (bx + c) is the
graph of y = a sin x, shifted units to the right.
Consider the graph of y = cos x below in blue. In this equation a = 1, b = 1 and c = 0. One zero of y = cos x is . The green graph is shifted to the
left. Thus c is – . Then the shifted equation will be
.
45. Writing in Math The Power Tower ride in Sandusky, Ohio, is shown below. Along the side of each tower is a string of lights that send a continuouspulse of light up and down each tower at a constant rate. Explain why the distance d of this light from theground over time t cannot be represented by a sinusoidal function.
SOLUTION: Sample answer: Although the pulse of light can be represented as a function with a period, it is not a sinusoidal function because the distance the pulse of light is from the ground changes at a constant rate. As a result, the graph of this function would resemble the graph below.
The given point lies on the terminal side of an angle θ in standard position. Find the values of
the six trigonometric functions of θ. 46. (−4, 4)
SOLUTION: Use the values of x and y to find r.
Use x = –4, y = 4, and r = to write the six trigonometric ratios.
47. (8, −2)
SOLUTION: Use the values of x and y to find r.
Use x = 8, y = –2, and r = to write the six trigonometric ratios.
48. (−5, −9)
SOLUTION: Use the values of x and y to find r.
Use x = –5, y = – 9, and r = to write the six trigonometric ratios.
49. (4, 5)
SOLUTION: Use the values of x and y to find r.
Use x = 4, y = 5, and r = to write the six trigonometric ratios.
Write each degree measure in radians as a multiple of π and each radian measure in degrees.
50. 25°
SOLUTION: To convert a degree measure to radians, multiply by
51. −420°
SOLUTION: To convert a degree measure to radians, multiply by
52.
SOLUTION: To convert a radian measure to degrees, multiply by
53.
SOLUTION: To convert a radian measure to degrees, multiply by
54. SCIENCE Radiocarbon dating is a method of estimating the age of an organic material by calculating the amount of carbon-14 present in the material. The age of a material can be calculated
using A = t , where A is the age of the
object in years, t is the half-life of carbon-14 or 5700 years, and R is the ratio of the amount of carbon-14 in the sample to the amount of carbon-14 in living tissue. a. A sample of organic material contains 0.000076 gram of carbon-14. A living sample of the same
Describe how the graphs of f (x) and g (x) are related. Then find the amplitude of g (x), and sketch two periods of both functions on the same coordinate axes.
1. f (x) = sin x; g(x) = sin x
SOLUTION: The graph of g(x) is the graph of f (x) compressed
vertically. The amplitude of g(x) is or .
Create a table listing the coordinates of the x-intercepts and extrema for f (x) = sin x for one
period, 2 , on the interval [0, 2 ]. Then use the amplitude of g(x) to find corresponding points on its graph.
Sketch the curve through the indicated points for each function. Then repeat the pattern to complete asecond period.
Functions f (x) = sin x g(x) = sin x
x-int (0, 0) (0, 0)
Max
x-int
Min
x-int
2.
SOLUTION: The graph of g(x) is the graph of f (x) compressed
vertically. The amplitude of g(x) is or .
Create a table listing the coordinates of the x-intercepts and extrema for f (x) = cos x for one
period, 2 , on the interval [0, 2 ]. Then use the amplitude of g(x) to find corresponding points on its graph.
Sketch the curve through the indicated points for each function. Then repeat the pattern to complete asecond period.
Function f (x) = cos x
Max (0, 1)
x-int Min
x-in
Min
x-int
Function f (x) = cos x
Max x-int
Min
x-in
Min
x-int
3. f (x) = cos x; g(x) = 6 cos x
SOLUTION: The graph of g(x) is the graph of f (x) expanded
vertically. The amplitude of g(x) is or 6.
Create a table listing the coordinates of the x-intercepts and extrema for f (x) = cos x for one
period, 2 , on the interval [0, 2 ]. Then use the amplitude of g(x) to find corresponding points on its graph.
Sketch the curve through the indicated points for each function. Then repeat the pattern to complete asecond period.
Functions f (x) = cos x g(x) = 6 cos x
Max (0, 1) (0, 6)
x-int
Min
x-int
Max
4. f (x) = sin x; g(x) = −8 sin x
SOLUTION: The graph of g(x) is the graph of f (x) expanded
vertically. The amplitude of g(x) is or 8.
Create a table listing the coordinates of the x-intercepts and extrema for f (x) = sin x for one
period, 2 , on the interval [0, 2 ]. Then use the amplitude of g(x) to find corresponding points on its graph.
Sketch the curve through the indicated points for each function. Then repeat the pattern to complete asecond period.
Function f (x) = sin x
x-int (0, 0)
Max
x-int
Min
x-int
Function g(x) = −8
sin x
x-int (0, 0)
Min
x-int
Max
x-int
Describe how the graphs of f (x) and g (x) are related. Then find the period of g (x), and sketch at least one period of both functions on the same coordinate axes.
5. f (x) = sin x; g(x) = sin 4x
SOLUTION: The graph of g(x) is the graph of f (x) compressed
horizontally. The period of g(x) is . To find
corresponding points on the graph of g(x), change the x-coordinates of those key points on f (x) so that
they range from 0 to , increasing by increments of
.
Sketch the curve through the indicated points for each function. Then repeat the pattern to complete asecond period.
Functions f (x) = sin x g(x) = sin
4x
x-int (0, 0) (0, 0)
Max
x-int
Min
x-int
6. f (x) = cos x; g(x) = cos 2x
SOLUTION: The graph of g(x) is the graph of f (x) compressed
horizontally. The period of g(x) is or . To find
corresponding points on the graph of g(x), change the x-coordinates of those key points on f (x) so that
they range from 0 to , increasing by increments of
.
Sketch the curve through the indicated points for each function. Then repeat the pattern to complete asecond period.
Functions f (x) = cos x g(x) = cos 2x
Max (0, 1) (0, 1)
x-int
Min
x-int
Max
7. f (x) = cos x;
SOLUTION: The graph of g(x) is the graph of f (x) expanded
horizontally. The period of g(x) is . To
find corresponding points on the graph of g(x), change the x-coordinates of those key points on f (x)
so that they range from 0 to , increasing by
increments of or .
Sketch the curve through the indicated points for each function. Then repeat the pattern to complete asecond period.
Functions f (x) = cos x
Max (0, 1) (0, 1)
x-int
Min
x-int
Max
8. f (x) = sin x;
SOLUTION: The graph of g(x) is the graph of f (x) expanded
horizontally. The period of g(x) is . To find corresponding points on the graph of g(x), change the x-coordinates of those key points on f (x) so that they range from 0 to , increasing by increments of
or .
Sketch the curve through the indicated points for each function. Then repeat the pattern to complete asecond period.
Functions f (x) = sin x
x-int (0, 0) (0, 0)
Max
x-int
Min
x-int
9. VOICES The contralto vocal type includes the deepest female singing voice. Some contraltos can sing as low as the E below middle C (E3), which hasa frequency of 165 hertz. Write an equation for a sine function that models the initial behavior of the sound wave associated with E3 having an amplitude of 0.15.
SOLUTION: The general form of the equation will be y = a sin bt,where t is the time in seconds. Because the
amplitude is 0.15, |a|= 0.15. This means that a = ±0.15. The period is the reciprocal of the frequency or
. Use this value to find b.
Sample answer: One sine function that models the
initial behavior is y = 0.15 sin 330 t.
Write a sine function that can be used to model the initial behavior of a sound wave with the frequency and amplitude given.
10. f = 440, a = 0.3
SOLUTION: The general form of the equation is y = a sin bt, where t is the time in seconds. Because the
amplitude is 0.3, = 0.3. This means that a = ±0.3.
The period is the reciprocal of the frequency or
. Use this value to find b.
Using the positive values of a and b, one sine function that models the initial behavior is y = 0.3 sin
880 t.
11. f = 932, a = 0.25
SOLUTION: The general form of the equation is y = a sin bt, where t is the time in seconds. Because the
amplitude is 0.25, = 0.25. This means that a =
±0.25. The period is the reciprocal of the frequency
or . Use this value to find b.
Using the positive values of a and b, one sine function that models the initial behavior is y = 0.25
sin 1864 t.
12. f = 1245, a = 0.12
SOLUTION: The general form of the equation is y = a sin bt, where t is the time in seconds. Because the
amplitude is 0.12, = 0.12. This means that a =
±0.12. The period is the reciprocal of the frequency or
. Use this value to find b.
Using the positive values of a and b, one sine function that models the initial behavior is y = 0.12
sin 2490 t.
13. f = 623, a = 0.2
SOLUTION: The general form of the equation is y = a sin bt, where t is the time in seconds. Because the
amplitude is 0.2, = 0.2. This means that a = ±0.2.
The period is the reciprocal of the frequency or
. Use this value to find b.
Using the positive values of a and b, one sine function that models the initial behavior is y = 0.2 sin
1246 t.
State the amplitude, period, frequency, phase shift, and vertical shift of each function. Then graph two periods of the function.
14.
SOLUTION:
In this function, a = 3, b = 1, c = − , and d = 0.
Because d = 0, there is no vertical shift.
Graph y = 3 sin x shifted units to the right.
15.
SOLUTION:
In this function, a = 1, b = , c = , and d = 0.
Because d = 0, there is no vertical shift.
16. y = 0.25 cos x + 3
SOLUTION:
In this function, a = , b = 1, c = 0, and d = 3.
Graph y = cos x shifted 3 units up.
17. y = sin 3x – 2
SOLUTION: In this function, a = 1, b = 3, c = 0, and d = –2.
Graph y = sin 3x shifted 2 units down.
18.
SOLUTION:
In this function, a = 1, b = 1, c = , and d = –1.
.
Graph y = cos x shifted units to the right and 1
unit down.
19.
SOLUTION:
In this function, a = 1, b = 1, c = , and d = 4.
.
Graph y = sin x shifted units to the left and 4 units up.
20. VACATIONS The average number of reservations R that a vacation resort has at the beginning of each month is shown.
a. Write an equation of a sinusoidal function that models the average number of reservations using x =1 to represent January. b. According to your model, approximately how many reservations can the resort anticipate in November?
SOLUTION: a. Make a scatter plot of the data and choose a model.
Sample answer: Use a sinusoidal function of the form y = a cos (bx + c) + d to model the data. First, find the maximum M and minimum m values of the data, and use these values to find a, b, c, and d. The maximum and minimum reservations are 200 and 87, respectively. The amplitude a is half of the distance between these values.
The vertical shift d is the average of the maximum and minimum data values.
There are 3 months between the maximum and minimum, so the period is 6.
The maximum data value occurs when x = 1. Since y = cos x attains its first maximum when x = 0, we must apply a phase shift of 1 unit. Use this value to find c.
Write a function using the values for a, b, c, and d.
Use b =
b. To find the number of reservations in November, evaluate the model for x = 11.
Therefore, the resort can anticipate about 115 reservations in November.
21. TIDES The table shown below provides data for the first high and low tides of the day for a certain bay during one day in June.
a. Determine the amplitude, period, phase shift, and vertical shift of a sinusoidal function that models the height of the tide. Let x represent the number of hours that the high or low tide occurred after midnight. b. Write a sinusoidal function that models the data. c. According to your model, what was the height of
the tide at 8:45 P.M. that night?
SOLUTION: a. Sample answer: Use a sinusoidal function of the form y = a cos (bx + c) + d to model the data. First, find the amplitude a, which is half of the distance between the heights of the high and low tides.
The vertical shift d is the average of the heights of the high and low tides.
A sinusoid completes half of a period in the time thatit takes to go from its maximum to its minimum value. One period is twice this time. The first high tide occurs 6.5 hours before the first low tide, so the period is 13.
The maximum data value occurs when x ≈ 4.417. Since y = cos x attains its first maximum when x = 0,we must apply a phase shift of 4.417 units. Use this value to find c.
b. Write a function using the values for a, b, c, and
d. Use b =
c. To find the height of the water at 8:45 P.M. that
night, evaluate the model for x = 20.75.
Therefore, the tide was about 7.28 feet high at 8:45
P.M. that night.
22. METEOROLOGY The average monthly temperatures for Boston, Massachusetts are shown.
a. Determine the amplitude, period, phase shift, and vertical shift of a sinusoidal function that models the monthly temperatures using x = 1 to represent January. b. Write an equation of a sinusoidal function that models the monthly temperatures. c. According to your model, what is Boston’s average temperature in August?
SOLUTION: a. The maximum and minimum are 74° and 29°, respectively. The amplitude a is half of the distance between these values.
The vertical shift d is the average of the maximum and minimum data values.
A sinusoid completes half of a period in the time thatit takes to go from its maximum to its minimum value. So, one period is twice this time. The
maximum function value occurs in July, so xmax is 7.
The minimum function value occurs in January, so
xmin is 1. The period is 2(6) = 12.
The maximum data value occurs when x = 7. Since y = cos x attains its first maximum when x = 0, we must apply a phase shift of 7 units. Use this value to find c.
b. Using the values for a, b, c, and d from part a, a sinusoidal function that models that monthly temperatures in Boston is
c. To find the average monthly temperature for Boston in August, evaluate the model for x = 8.
Therefore, the average monthly temperature for Boston in August is about 71°F.
GRAPHING CALCULATOR Find the values of x in the interval – < x < that make each equation or inequality true. (Hint: Use the intersection function.)
23. –sin x = cos x
SOLUTION:
Graph y = −sin x and y = cos x on the same graphing
calculator screen on (−π, π). Use the intersect feature under the CALC menu to determine where the two graphs intersect.
The graphs intersect at about −0.7854 or − and
about 2.356 or . Therefore, on –π < x < π, –sin x
= cos x when x = − and .
24. sin x − cos x = 1
SOLUTION:
Graph y = sin x − cos x and y = 1 on the same
graphing calculator screen on (− , ). Use the intersect feature under the CALC menu to determine where the two graphs intersect.
The graphs intersect at about 1.57 or . Therefore,
on – < x < , sin x − cos x = 1 when x = .
25. sin x + cos x = 0
SOLUTION:
Graph y = sin x + cos x on (−π, π). Use the zero feature under the CALC menu to determine the zeros of the function.
There are zeros at about −0.785 or − or and about
2.356 or . Therefore, on – < x < , sin x + cos
x = 0 when
26. cos x ≤ sin x
SOLUTION:
Graph y = cos x and y = sin x on (−π, π). Use the intersect feature under the CALC menu to determine on what interval(s) cos x ≤ sin x.
The graphs intersect at about –2.356 or – and
about 0.785 or . From the graph, it appears that
cos x ≤ sin x on – < x < – and < x < .
27. sin x cos x > 1
SOLUTION:
Graph y = sin x cos x and y = 1 on (− , ). Use the intersect feature under the CALC menu to determine on what interval(s) sin x cos x > 1.
The graphs do not intersect. Therefore, y = sin x cos
x is not greater than y = 1 for any values of x on –< x < .
28. sin x cos x ≤ 0
SOLUTION:
Graph y = sin x cos x on (−π, π). Use the zero feature under the CALC menu to determine on what interval(s) sin x cos x ≤ 0.
The zeros of y = sin x cos x are about –1.57 or ,
0, and about 1.57 or . From the graph, it appears
that sin x cos x ≤ 0 on < x < 0 and < x < .
29. CAROUSELS A wooden horse on a carousel moves up and down as the carousel spins. When the ride ends, the horse usually stops in a vertical position different from where it started. The position y of the horse after t seconds can be modeled by y =1.5 sin (2t + c), where the phase shift c must be continuously adjusted to compensate for the differentstarting positions. If during one ride the horse
reached a maximum height after seconds, find
the equation that models the horse’s position.
SOLUTION: First, find the period of y = 1.5 sin (2t + c).
Since the period is π, the function will reach a
maximum height at radians. The phase shift is the
difference between the horizontal position of the
function at and radians, which is radians.
Substitute and b into the phase shift formula to
find c.
Therefore, the equation is
30. AMUSEMENT PARKS The position y in feet of a passenger cart relative to the center of a Ferris wheel over t seconds is shown below.
a. Find the time t that it takes for the cart to return toy = 0 during its initial spin. b. Find the period of the Ferris wheel. c. Sketch the graph representing the position of the passenger cart over one period. d. Write a sinusoidal function that models the position of the passenger cart as a function of time t.
SOLUTION: a. From the diagram, the height of the cart is 0 ft when t = 0, and reaches a maximum height of 19 feet when t = 3.75 seconds. So, the cart will return to y = 0 after 2(3.75) or 7.5 seconds. b. The cart completes half of a cycle from t = 0 to t = 7.5. So, the period is 2(7.5) or 15 seconds. c.
d. The amplitude a is half of the maximum and
minimum values. So, a =
The vertical shift d is the average of the maximum
and minimum data values. So,
Because the period of a sinusoidal function is
you can write Therefore,
There is no phase shift because the height of the cartwhen t = 0 is 0 feet, and the sine function has a y-intercept of 0. Therefore, one equation that could be used to model
the position of the passenger cart is y = 19 sin t.
Write an equation that corresponds to each graph.
31.
SOLUTION: Sample answer: There is an x-intercept at 0, so one equation that corresponds to this graph is y = a sin (bx + c) + d. Half of the distance from the maximum to the minimum value of the function is 3. So, the amplitudeis 3. It appears that the function completes one period on
[0, π]. Find b.
The midline appears to be at y = 0, so there does not appear to be any vertical shift. Therefore, one equation that corresponds to this graph is y = 3 sin (2x).
32.
SOLUTION:
Sample answer: Because there is a y-intercept at ,
one equation that corresponds to this graph is y = a cos (bx + c) + d. Half of the distance from the maximum to the
minimum value of the function is . So, the
amplitude is .
It appears that the function completes one period on [0, 6π]. Find b.
The midline appears to be at y = 0, so there does not appear to be any vertical shift. Therefore, one
equation that corresponds to this graph is y = cos
.
33.
SOLUTION: Sample answer: Because there is a y-intercept at 3, one equation that corresponds to this graph is y = a cos (bx + c) + d. Half of the distance from the maximum to the
minimum value of the function is 4 ÷ 2 or 2. So, the amplitude is 2. It appears that the function completes one period on
Find b.
The midline appears to be at y = 1, so there is a vertical shift 1 unit up. Therefore, one equation that corresponds to this graph is y = 2 cos 4x + 1.
34.
SOLUTION: Sample answer: There is an x-intercept at 0, so one equation that corresponds to this graph is y = a sin (bx + c) + d. Half of the distance from the maximum to the
minimum value of the function is 8 ÷ 2 or 4. So, the amplitude is 4. It appears that the function completes one period on [0, 4π]. Find b.
The midline appears to be at y = −2, so there is a vertical shift of 2 units down. Therefore, one equation that corresponds to this graph is y = 4 sin
− 2.
Write a sinusoidal function with the given period and amplitude that passes through the given point.
35. period: ; amplitude: 5; point:
SOLUTION: Use the period to find b.
Sample answer: One sinusoidal function in which a =5 and b = 2 is y = 5 cos 2x. Evaluate the function for
The function passes through . Therefore, a
sinusoidal function with period π and amplitude 5 that
passes through the point is y = 5 cos 2x.
36. period: 4 ; amplitude: 2; point: ( , 2)
SOLUTION: Use the period to find b.
Sample answer: One sinusoidal function in which a =
2 and b = is y = 2 sin . Evaluate the function
for x = π.
The function passes through ( , 2). Therefore, a
sinusoidal function with period 4π and amplitude 2
that passes through the point ( , 2) is y = 2 sin .
37. period: ; amplitude: ; point:
SOLUTION: Use the period to find b.
Sample answer: One sinusoidal function in which a =1.5 and b = 4 is y = 1.5 cos 4x. Evaluate the function
for
The function passes through . Therefore, a
sinusoidal function with period and amplitude 1.5
that passes through the point is y = 1.5 cos
4x.
38. period: 3π; amplitude: ; point:
SOLUTION: Use the period to find b.
Sample answer: One sinusoidal function in which a =
0.5 and b = is y = sin x. Evaluate the
function for
The function passes through . Therefore, a
sinusoidal function with period 3π and amplitude 0.5
that passes through the point is y = sin
x.
39. MULTIPLE REPRESENTATIONS In this problem, you will investigate the change in the graph of a sinusoidal function of the form y = sin x or y = cos x when multiplied by a polynomial function. a. GRAPHICAL Use a graphing calculator to sketch the graphs of y = 2x, y = –2x, and y = 2x cos x on the same coordinate plane, on the interval [–20, 20]. b. VERBAL Describe the behavior of the graph of y = 2x cos x in relation to the graphs of y = 2x and y = –2x. c. GRAPHICAL Use a graphing calculator to
sketch the graphs of y = x2, y = –x
2, and y = x
2 sin x
on the same coordinate plane, on the interval [–20, 20]. d. VERBAL Describe the behavior of the graph of
y = x2 sin x in relation to the graphs of y = x
2 and y
= –x2.
e. ANALYTICAL Make a conjecture as to the behavior of the graph of a sinusoidal function of the form y = sin x or y = cos x when multiplied by polynomial function of the form y = f (x).
SOLUTION: a.
b. The graph of y = 2x cos x oscillates between the graphs of y = 2x and y = –2x. c.
d. The graph of y = x2 sin x oscillates between the
graphs of y = x2 and y = –x
2.
e . The graph of y = f (x) sin x or y = f (x) cos x will oscillate between the graphs of y = f (x) and y = –f(x).
40. CHALLENGE Without graphing, find the exact coordinates of the first maximum point to the right of
the y-axis for
SOLUTION:
First, find the phase shift for
Next, find the period of the function.
The first maximum for one period can be found by
finding So, incorporating the phase shift, the
first maximum to the right of the y-axis is
. Because the amplitude is |4| = 4,
the maximum point is
REASONING Determine whether each statement is true or false . Explain your reasoning.
41. Every sine function of the form y = a sin (bx + c) + d can be written as a cosine function of the form y =a cos (bx + c) + d.
SOLUTION: It is true that every sine function of the form y = a sin (bx + c) + d can be written as a cosine function of the form y = a cos (bx + c) + d. The graph of cosine is a horizontal translation of the sine graph. Therefore, a cosine function can be written from any sine function using the same amplitude and period by applying the necessary phase shift.
For example, consider and
. Phase shift by
to obtain .
42. The period of f (x) = cos 8x is equal to four times the period of g(x) = cos 2x.
SOLUTION: Find the period of f (x) = cos 8x.
Find the period of g(x) = cos 2x.
Four times the period of g(x) = cos 2x is 4 ⋅ or
4 . So, the period of f (x) is the period of g(x).
Therefore, the statement is false.
43. CHALLENGE How many zeros does y = cos
1500x have on the interval 0 ≤ x ≤ 2 ?
SOLUTION: Find the period of y = cos 1500x.
Graph y = cos 1500x on .
The graph of y = cos 1500x has two x-intercepts for one cycle, so the function has 2 zeros per cycle. Find
the number of cycles for y = cos 1500x on [0, 2 ].
So, the graph of y = cos 1500x will complete 1500
cycles on [0, 2 ]. Because there are two zeros per cycle, y = cos 1500x will have 1500(2) or 3000 zeros
on [0, 2 ].
44. PROOF Prove the phase shift formula.
SOLUTION:
Consider y = a sin (bx + c), where a , b, and c ≠ 0. To find a zero of the function, find the value of x for which a sin (bx + c) = 0. Since sin 0 = 0, solving bx + c = 0 will yield a zero of the function.
Therefore, y = 0 when . The value of is
the phase shift. When c > 0: The graph of y = a sin (bx + c) is the
graph of y = a sin x, shifted units to the left.
When c < 0: The graph of y = a sin (bx + c) is the
graph of y = a sin x, shifted units to the right.
Consider the graph of y = cos x below in blue. In this equation a = 1, b = 1 and c = 0. One zero of y = cos x is . The green graph is shifted to the
left. Thus c is – . Then the shifted equation will be
.
45. Writing in Math The Power Tower ride in Sandusky, Ohio, is shown below. Along the side of each tower is a string of lights that send a continuouspulse of light up and down each tower at a constant rate. Explain why the distance d of this light from theground over time t cannot be represented by a sinusoidal function.
SOLUTION: Sample answer: Although the pulse of light can be represented as a function with a period, it is not a sinusoidal function because the distance the pulse of light is from the ground changes at a constant rate. As a result, the graph of this function would resemble the graph below.
The given point lies on the terminal side of an angle θ in standard position. Find the values of
the six trigonometric functions of θ. 46. (−4, 4)
SOLUTION: Use the values of x and y to find r.
Use x = –4, y = 4, and r = to write the six trigonometric ratios.
47. (8, −2)
SOLUTION: Use the values of x and y to find r.
Use x = 8, y = –2, and r = to write the six trigonometric ratios.
48. (−5, −9)
SOLUTION: Use the values of x and y to find r.
Use x = –5, y = – 9, and r = to write the six trigonometric ratios.
49. (4, 5)
SOLUTION: Use the values of x and y to find r.
Use x = 4, y = 5, and r = to write the six trigonometric ratios.
Write each degree measure in radians as a multiple of π and each radian measure in degrees.
50. 25°
SOLUTION: To convert a degree measure to radians, multiply by
51. −420°
SOLUTION: To convert a degree measure to radians, multiply by
52.
SOLUTION: To convert a radian measure to degrees, multiply by
53.
SOLUTION: To convert a radian measure to degrees, multiply by
54. SCIENCE Radiocarbon dating is a method of estimating the age of an organic material by calculating the amount of carbon-14 present in the material. The age of a material can be calculated
using A = t , where A is the age of the
object in years, t is the half-life of carbon-14 or 5700 years, and R is the ratio of the amount of carbon-14 in the sample to the amount of carbon-14 in living tissue. a. A sample of organic material contains 0.000076 gram of carbon-14. A living sample of the same
eSolutions Manual - Powered by Cognero Page 12
4-4 Graphing Sine and Cosine Functions
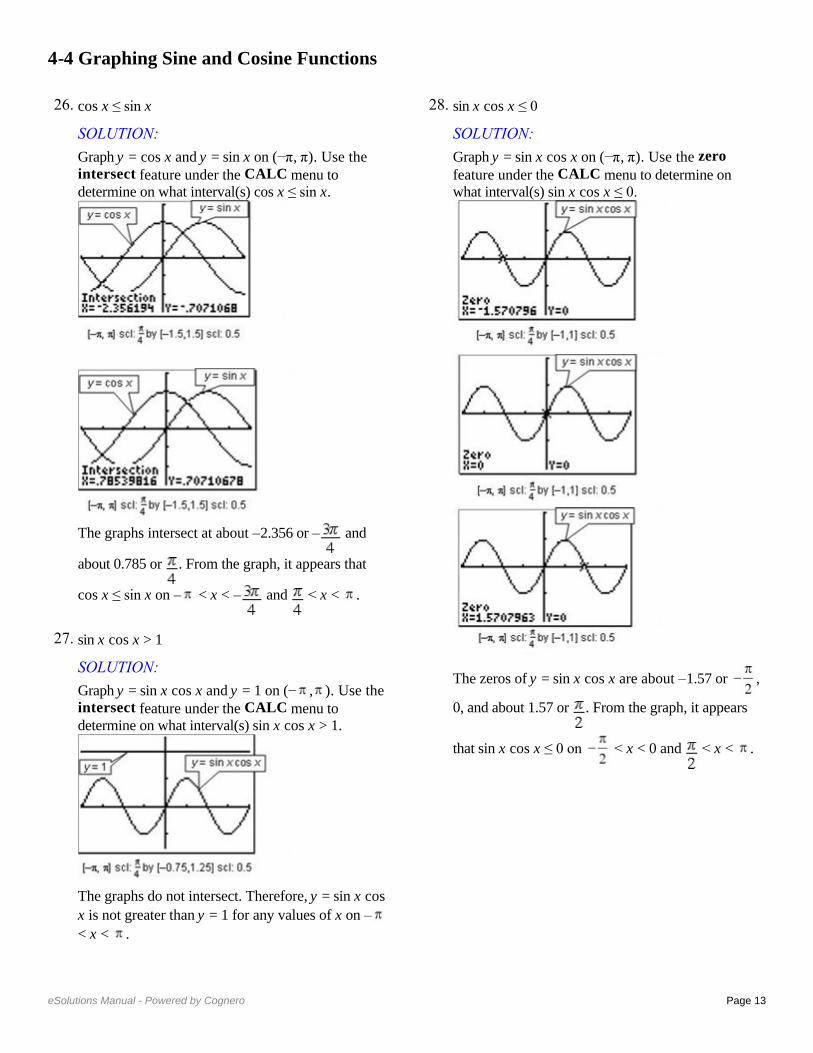
Describe how the graphs of f (x) and g (x) are related. Then find the amplitude of g (x), and sketch two periods of both functions on the same coordinate axes.
1. f (x) = sin x; g(x) = sin x
SOLUTION: The graph of g(x) is the graph of f (x) compressed
vertically. The amplitude of g(x) is or .
Create a table listing the coordinates of the x-intercepts and extrema for f (x) = sin x for one
period, 2 , on the interval [0, 2 ]. Then use the amplitude of g(x) to find corresponding points on its graph.
Sketch the curve through the indicated points for each function. Then repeat the pattern to complete asecond period.
Functions f (x) = sin x g(x) = sin x
x-int (0, 0) (0, 0)
Max
x-int
Min
x-int
2.
SOLUTION: The graph of g(x) is the graph of f (x) compressed
vertically. The amplitude of g(x) is or .
Create a table listing the coordinates of the x-intercepts and extrema for f (x) = cos x for one
period, 2 , on the interval [0, 2 ]. Then use the amplitude of g(x) to find corresponding points on its graph.
Sketch the curve through the indicated points for each function. Then repeat the pattern to complete asecond period.
Function f (x) = cos x
Max (0, 1)
x-int Min
x-in
Min
x-int
Function f (x) = cos x
Max x-int
Min
x-in
Min
x-int
3. f (x) = cos x; g(x) = 6 cos x
SOLUTION: The graph of g(x) is the graph of f (x) expanded
vertically. The amplitude of g(x) is or 6.
Create a table listing the coordinates of the x-intercepts and extrema for f (x) = cos x for one
period, 2 , on the interval [0, 2 ]. Then use the amplitude of g(x) to find corresponding points on its graph.
Sketch the curve through the indicated points for each function. Then repeat the pattern to complete asecond period.
Functions f (x) = cos x g(x) = 6 cos x
Max (0, 1) (0, 6)
x-int
Min
x-int
Max
4. f (x) = sin x; g(x) = −8 sin x
SOLUTION: The graph of g(x) is the graph of f (x) expanded
vertically. The amplitude of g(x) is or 8.
Create a table listing the coordinates of the x-intercepts and extrema for f (x) = sin x for one
period, 2 , on the interval [0, 2 ]. Then use the amplitude of g(x) to find corresponding points on its graph.
Sketch the curve through the indicated points for each function. Then repeat the pattern to complete asecond period.
Function f (x) = sin x
x-int (0, 0)
Max
x-int
Min
x-int
Function g(x) = −8
sin x
x-int (0, 0)
Min
x-int
Max
x-int
Describe how the graphs of f (x) and g (x) are related. Then find the period of g (x), and sketch at least one period of both functions on the same coordinate axes.
5. f (x) = sin x; g(x) = sin 4x
SOLUTION: The graph of g(x) is the graph of f (x) compressed
horizontally. The period of g(x) is . To find
corresponding points on the graph of g(x), change the x-coordinates of those key points on f (x) so that
they range from 0 to , increasing by increments of
.
Sketch the curve through the indicated points for each function. Then repeat the pattern to complete asecond period.
Functions f (x) = sin x g(x) = sin
4x
x-int (0, 0) (0, 0)
Max
x-int
Min
x-int
6. f (x) = cos x; g(x) = cos 2x
SOLUTION: The graph of g(x) is the graph of f (x) compressed
horizontally. The period of g(x) is or . To find
corresponding points on the graph of g(x), change the x-coordinates of those key points on f (x) so that
they range from 0 to , increasing by increments of
.
Sketch the curve through the indicated points for each function. Then repeat the pattern to complete asecond period.
Functions f (x) = cos x g(x) = cos 2x
Max (0, 1) (0, 1)
x-int
Min
x-int
Max
7. f (x) = cos x;
SOLUTION: The graph of g(x) is the graph of f (x) expanded
horizontally. The period of g(x) is . To
find corresponding points on the graph of g(x), change the x-coordinates of those key points on f (x)
so that they range from 0 to , increasing by
increments of or .
Sketch the curve through the indicated points for each function. Then repeat the pattern to complete asecond period.
Functions f (x) = cos x
Max (0, 1) (0, 1)
x-int
Min
x-int
Max
8. f (x) = sin x;
SOLUTION: The graph of g(x) is the graph of f (x) expanded
horizontally. The period of g(x) is . To find corresponding points on the graph of g(x), change the x-coordinates of those key points on f (x) so that they range from 0 to , increasing by increments of
or .
Sketch the curve through the indicated points for each function. Then repeat the pattern to complete asecond period.
Functions f (x) = sin x
x-int (0, 0) (0, 0)
Max
x-int
Min
x-int
9. VOICES The contralto vocal type includes the deepest female singing voice. Some contraltos can sing as low as the E below middle C (E3), which hasa frequency of 165 hertz. Write an equation for a sine function that models the initial behavior of the sound wave associated with E3 having an amplitude of 0.15.
SOLUTION: The general form of the equation will be y = a sin bt,where t is the time in seconds. Because the
amplitude is 0.15, |a|= 0.15. This means that a = ±0.15. The period is the reciprocal of the frequency or
. Use this value to find b.
Sample answer: One sine function that models the
initial behavior is y = 0.15 sin 330 t.
Write a sine function that can be used to model the initial behavior of a sound wave with the frequency and amplitude given.
10. f = 440, a = 0.3
SOLUTION: The general form of the equation is y = a sin bt, where t is the time in seconds. Because the
amplitude is 0.3, = 0.3. This means that a = ±0.3.
The period is the reciprocal of the frequency or
. Use this value to find b.
Using the positive values of a and b, one sine function that models the initial behavior is y = 0.3 sin
880 t.
11. f = 932, a = 0.25
SOLUTION: The general form of the equation is y = a sin bt, where t is the time in seconds. Because the
amplitude is 0.25, = 0.25. This means that a =
±0.25. The period is the reciprocal of the frequency
or . Use this value to find b.
Using the positive values of a and b, one sine function that models the initial behavior is y = 0.25
sin 1864 t.
12. f = 1245, a = 0.12
SOLUTION: The general form of the equation is y = a sin bt, where t is the time in seconds. Because the
amplitude is 0.12, = 0.12. This means that a =
±0.12. The period is the reciprocal of the frequency or
. Use this value to find b.
Using the positive values of a and b, one sine function that models the initial behavior is y = 0.12
sin 2490 t.
13. f = 623, a = 0.2
SOLUTION: The general form of the equation is y = a sin bt, where t is the time in seconds. Because the
amplitude is 0.2, = 0.2. This means that a = ±0.2.
The period is the reciprocal of the frequency or
. Use this value to find b.
Using the positive values of a and b, one sine function that models the initial behavior is y = 0.2 sin
1246 t.
State the amplitude, period, frequency, phase shift, and vertical shift of each function. Then graph two periods of the function.
14.
SOLUTION:
In this function, a = 3, b = 1, c = − , and d = 0.
Because d = 0, there is no vertical shift.
Graph y = 3 sin x shifted units to the right.
15.
SOLUTION:
In this function, a = 1, b = , c = , and d = 0.
Because d = 0, there is no vertical shift.
16. y = 0.25 cos x + 3
SOLUTION:
In this function, a = , b = 1, c = 0, and d = 3.
Graph y = cos x shifted 3 units up.
17. y = sin 3x – 2
SOLUTION: In this function, a = 1, b = 3, c = 0, and d = –2.
Graph y = sin 3x shifted 2 units down.
18.
SOLUTION:
In this function, a = 1, b = 1, c = , and d = –1.
.
Graph y = cos x shifted units to the right and 1
unit down.
19.
SOLUTION:
In this function, a = 1, b = 1, c = , and d = 4.
.
Graph y = sin x shifted units to the left and 4 units up.
20. VACATIONS The average number of reservations R that a vacation resort has at the beginning of each month is shown.
a. Write an equation of a sinusoidal function that models the average number of reservations using x =1 to represent January. b. According to your model, approximately how many reservations can the resort anticipate in November?
SOLUTION: a. Make a scatter plot of the data and choose a model.
Sample answer: Use a sinusoidal function of the form y = a cos (bx + c) + d to model the data. First, find the maximum M and minimum m values of the data, and use these values to find a, b, c, and d. The maximum and minimum reservations are 200 and 87, respectively. The amplitude a is half of the distance between these values.
The vertical shift d is the average of the maximum and minimum data values.
There are 3 months between the maximum and minimum, so the period is 6.
The maximum data value occurs when x = 1. Since y = cos x attains its first maximum when x = 0, we must apply a phase shift of 1 unit. Use this value to find c.
Write a function using the values for a, b, c, and d.
Use b =
b. To find the number of reservations in November, evaluate the model for x = 11.
Therefore, the resort can anticipate about 115 reservations in November.
21. TIDES The table shown below provides data for the first high and low tides of the day for a certain bay during one day in June.
a. Determine the amplitude, period, phase shift, and vertical shift of a sinusoidal function that models the height of the tide. Let x represent the number of hours that the high or low tide occurred after midnight. b. Write a sinusoidal function that models the data. c. According to your model, what was the height of
the tide at 8:45 P.M. that night?
SOLUTION: a. Sample answer: Use a sinusoidal function of the form y = a cos (bx + c) + d to model the data. First, find the amplitude a, which is half of the distance between the heights of the high and low tides.
The vertical shift d is the average of the heights of the high and low tides.
A sinusoid completes half of a period in the time thatit takes to go from its maximum to its minimum value. One period is twice this time. The first high tide occurs 6.5 hours before the first low tide, so the period is 13.
The maximum data value occurs when x ≈ 4.417. Since y = cos x attains its first maximum when x = 0,we must apply a phase shift of 4.417 units. Use this value to find c.
b. Write a function using the values for a, b, c, and
d. Use b =
c. To find the height of the water at 8:45 P.M. that
night, evaluate the model for x = 20.75.
Therefore, the tide was about 7.28 feet high at 8:45
P.M. that night.
22. METEOROLOGY The average monthly temperatures for Boston, Massachusetts are shown.
a. Determine the amplitude, period, phase shift, and vertical shift of a sinusoidal function that models the monthly temperatures using x = 1 to represent January. b. Write an equation of a sinusoidal function that models the monthly temperatures. c. According to your model, what is Boston’s average temperature in August?
SOLUTION: a. The maximum and minimum are 74° and 29°, respectively. The amplitude a is half of the distance between these values.
The vertical shift d is the average of the maximum and minimum data values.
A sinusoid completes half of a period in the time thatit takes to go from its maximum to its minimum value. So, one period is twice this time. The
maximum function value occurs in July, so xmax is 7.
The minimum function value occurs in January, so
xmin is 1. The period is 2(6) = 12.
The maximum data value occurs when x = 7. Since y = cos x attains its first maximum when x = 0, we must apply a phase shift of 7 units. Use this value to find c.
b. Using the values for a, b, c, and d from part a, a sinusoidal function that models that monthly temperatures in Boston is
c. To find the average monthly temperature for Boston in August, evaluate the model for x = 8.
Therefore, the average monthly temperature for Boston in August is about 71°F.
GRAPHING CALCULATOR Find the values of x in the interval – < x < that make each equation or inequality true. (Hint: Use the intersection function.)
23. –sin x = cos x
SOLUTION:
Graph y = −sin x and y = cos x on the same graphing
calculator screen on (−π, π). Use the intersect feature under the CALC menu to determine where the two graphs intersect.
The graphs intersect at about −0.7854 or − and
about 2.356 or . Therefore, on –π < x < π, –sin x
= cos x when x = − and .
24. sin x − cos x = 1
SOLUTION:
Graph y = sin x − cos x and y = 1 on the same
graphing calculator screen on (− , ). Use the intersect feature under the CALC menu to determine where the two graphs intersect.
The graphs intersect at about 1.57 or . Therefore,
on – < x < , sin x − cos x = 1 when x = .
25. sin x + cos x = 0
SOLUTION:
Graph y = sin x + cos x on (−π, π). Use the zero feature under the CALC menu to determine the zeros of the function.
There are zeros at about −0.785 or − or and about
2.356 or . Therefore, on – < x < , sin x + cos
x = 0 when
26. cos x ≤ sin x
SOLUTION:
Graph y = cos x and y = sin x on (−π, π). Use the intersect feature under the CALC menu to determine on what interval(s) cos x ≤ sin x.
The graphs intersect at about –2.356 or – and
about 0.785 or . From the graph, it appears that
cos x ≤ sin x on – < x < – and < x < .
27. sin x cos x > 1
SOLUTION:
Graph y = sin x cos x and y = 1 on (− , ). Use the intersect feature under the CALC menu to determine on what interval(s) sin x cos x > 1.
The graphs do not intersect. Therefore, y = sin x cos
x is not greater than y = 1 for any values of x on –< x < .
28. sin x cos x ≤ 0
SOLUTION:
Graph y = sin x cos x on (−π, π). Use the zero feature under the CALC menu to determine on what interval(s) sin x cos x ≤ 0.
The zeros of y = sin x cos x are about –1.57 or ,
0, and about 1.57 or . From the graph, it appears
that sin x cos x ≤ 0 on < x < 0 and < x < .
29. CAROUSELS A wooden horse on a carousel moves up and down as the carousel spins. When the ride ends, the horse usually stops in a vertical position different from where it started. The position y of the horse after t seconds can be modeled by y =1.5 sin (2t + c), where the phase shift c must be continuously adjusted to compensate for the differentstarting positions. If during one ride the horse
reached a maximum height after seconds, find
the equation that models the horse’s position.
SOLUTION: First, find the period of y = 1.5 sin (2t + c).
Since the period is π, the function will reach a
maximum height at radians. The phase shift is the
difference between the horizontal position of the
function at and radians, which is radians.
Substitute and b into the phase shift formula to
find c.
Therefore, the equation is
30. AMUSEMENT PARKS The position y in feet of a passenger cart relative to the center of a Ferris wheel over t seconds is shown below.
a. Find the time t that it takes for the cart to return toy = 0 during its initial spin. b. Find the period of the Ferris wheel. c. Sketch the graph representing the position of the passenger cart over one period. d. Write a sinusoidal function that models the position of the passenger cart as a function of time t.
SOLUTION: a. From the diagram, the height of the cart is 0 ft when t = 0, and reaches a maximum height of 19 feet when t = 3.75 seconds. So, the cart will return to y = 0 after 2(3.75) or 7.5 seconds. b. The cart completes half of a cycle from t = 0 to t = 7.5. So, the period is 2(7.5) or 15 seconds. c.
d. The amplitude a is half of the maximum and
minimum values. So, a =
The vertical shift d is the average of the maximum
and minimum data values. So,
Because the period of a sinusoidal function is
you can write Therefore,
There is no phase shift because the height of the cartwhen t = 0 is 0 feet, and the sine function has a y-intercept of 0. Therefore, one equation that could be used to model
the position of the passenger cart is y = 19 sin t.
Write an equation that corresponds to each graph.
31.
SOLUTION: Sample answer: There is an x-intercept at 0, so one equation that corresponds to this graph is y = a sin (bx + c) + d. Half of the distance from the maximum to the minimum value of the function is 3. So, the amplitudeis 3. It appears that the function completes one period on
[0, π]. Find b.
The midline appears to be at y = 0, so there does not appear to be any vertical shift. Therefore, one equation that corresponds to this graph is y = 3 sin (2x).
32.
SOLUTION:
Sample answer: Because there is a y-intercept at ,
one equation that corresponds to this graph is y = a cos (bx + c) + d. Half of the distance from the maximum to the
minimum value of the function is . So, the
amplitude is .
It appears that the function completes one period on [0, 6π]. Find b.
The midline appears to be at y = 0, so there does not appear to be any vertical shift. Therefore, one
equation that corresponds to this graph is y = cos
.
33.
SOLUTION: Sample answer: Because there is a y-intercept at 3, one equation that corresponds to this graph is y = a cos (bx + c) + d. Half of the distance from the maximum to the
minimum value of the function is 4 ÷ 2 or 2. So, the amplitude is 2. It appears that the function completes one period on
Find b.
The midline appears to be at y = 1, so there is a vertical shift 1 unit up. Therefore, one equation that corresponds to this graph is y = 2 cos 4x + 1.
34.
SOLUTION: Sample answer: There is an x-intercept at 0, so one equation that corresponds to this graph is y = a sin (bx + c) + d. Half of the distance from the maximum to the
minimum value of the function is 8 ÷ 2 or 4. So, the amplitude is 4. It appears that the function completes one period on [0, 4π]. Find b.
The midline appears to be at y = −2, so there is a vertical shift of 2 units down. Therefore, one equation that corresponds to this graph is y = 4 sin
− 2.
Write a sinusoidal function with the given period and amplitude that passes through the given point.
35. period: ; amplitude: 5; point:
SOLUTION: Use the period to find b.
Sample answer: One sinusoidal function in which a =5 and b = 2 is y = 5 cos 2x. Evaluate the function for
The function passes through . Therefore, a
sinusoidal function with period π and amplitude 5 that
passes through the point is y = 5 cos 2x.
36. period: 4 ; amplitude: 2; point: ( , 2)
SOLUTION: Use the period to find b.
Sample answer: One sinusoidal function in which a =
2 and b = is y = 2 sin . Evaluate the function
for x = π.
The function passes through ( , 2). Therefore, a
sinusoidal function with period 4π and amplitude 2
that passes through the point ( , 2) is y = 2 sin .
37. period: ; amplitude: ; point:
SOLUTION: Use the period to find b.
Sample answer: One sinusoidal function in which a =1.5 and b = 4 is y = 1.5 cos 4x. Evaluate the function
for
The function passes through . Therefore, a
sinusoidal function with period and amplitude 1.5
that passes through the point is y = 1.5 cos
4x.
38. period: 3π; amplitude: ; point:
SOLUTION: Use the period to find b.
Sample answer: One sinusoidal function in which a =
0.5 and b = is y = sin x. Evaluate the
function for
The function passes through . Therefore, a
sinusoidal function with period 3π and amplitude 0.5
that passes through the point is y = sin
x.
39. MULTIPLE REPRESENTATIONS In this problem, you will investigate the change in the graph of a sinusoidal function of the form y = sin x or y = cos x when multiplied by a polynomial function. a. GRAPHICAL Use a graphing calculator to sketch the graphs of y = 2x, y = –2x, and y = 2x cos x on the same coordinate plane, on the interval [–20, 20]. b. VERBAL Describe the behavior of the graph of y = 2x cos x in relation to the graphs of y = 2x and y = –2x. c. GRAPHICAL Use a graphing calculator to
sketch the graphs of y = x2, y = –x
2, and y = x
2 sin x
on the same coordinate plane, on the interval [–20, 20]. d. VERBAL Describe the behavior of the graph of
y = x2 sin x in relation to the graphs of y = x
2 and y
= –x2.
e. ANALYTICAL Make a conjecture as to the behavior of the graph of a sinusoidal function of the form y = sin x or y = cos x when multiplied by polynomial function of the form y = f (x).
SOLUTION: a.
b. The graph of y = 2x cos x oscillates between the graphs of y = 2x and y = –2x. c.
d. The graph of y = x2 sin x oscillates between the
graphs of y = x2 and y = –x
2.
e . The graph of y = f (x) sin x or y = f (x) cos x will oscillate between the graphs of y = f (x) and y = –f(x).
40. CHALLENGE Without graphing, find the exact coordinates of the first maximum point to the right of
the y-axis for
SOLUTION:
First, find the phase shift for
Next, find the period of the function.
The first maximum for one period can be found by
finding So, incorporating the phase shift, the
first maximum to the right of the y-axis is
. Because the amplitude is |4| = 4,
the maximum point is
REASONING Determine whether each statement is true or false . Explain your reasoning.
41. Every sine function of the form y = a sin (bx + c) + d can be written as a cosine function of the form y =a cos (bx + c) + d.
SOLUTION: It is true that every sine function of the form y = a sin (bx + c) + d can be written as a cosine function of the form y = a cos (bx + c) + d. The graph of cosine is a horizontal translation of the sine graph. Therefore, a cosine function can be written from any sine function using the same amplitude and period by applying the necessary phase shift.
For example, consider and
. Phase shift by
to obtain .
42. The period of f (x) = cos 8x is equal to four times the period of g(x) = cos 2x.
SOLUTION: Find the period of f (x) = cos 8x.
Find the period of g(x) = cos 2x.
Four times the period of g(x) = cos 2x is 4 ⋅ or
4 . So, the period of f (x) is the period of g(x).
Therefore, the statement is false.
43. CHALLENGE How many zeros does y = cos
1500x have on the interval 0 ≤ x ≤ 2 ?
SOLUTION: Find the period of y = cos 1500x.
Graph y = cos 1500x on .
The graph of y = cos 1500x has two x-intercepts for one cycle, so the function has 2 zeros per cycle. Find
the number of cycles for y = cos 1500x on [0, 2 ].
So, the graph of y = cos 1500x will complete 1500
cycles on [0, 2 ]. Because there are two zeros per cycle, y = cos 1500x will have 1500(2) or 3000 zeros
on [0, 2 ].
44. PROOF Prove the phase shift formula.
SOLUTION:
Consider y = a sin (bx + c), where a , b, and c ≠ 0. To find a zero of the function, find the value of x for which a sin (bx + c) = 0. Since sin 0 = 0, solving bx + c = 0 will yield a zero of the function.
Therefore, y = 0 when . The value of is
the phase shift. When c > 0: The graph of y = a sin (bx + c) is the
graph of y = a sin x, shifted units to the left.
When c < 0: The graph of y = a sin (bx + c) is the
graph of y = a sin x, shifted units to the right.
Consider the graph of y = cos x below in blue. In this equation a = 1, b = 1 and c = 0. One zero of y = cos x is . The green graph is shifted to the
left. Thus c is – . Then the shifted equation will be
.
45. Writing in Math The Power Tower ride in Sandusky, Ohio, is shown below. Along the side of each tower is a string of lights that send a continuouspulse of light up and down each tower at a constant rate. Explain why the distance d of this light from theground over time t cannot be represented by a sinusoidal function.
SOLUTION: Sample answer: Although the pulse of light can be represented as a function with a period, it is not a sinusoidal function because the distance the pulse of light is from the ground changes at a constant rate. As a result, the graph of this function would resemble the graph below.
The given point lies on the terminal side of an angle θ in standard position. Find the values of
the six trigonometric functions of θ. 46. (−4, 4)
SOLUTION: Use the values of x and y to find r.
Use x = –4, y = 4, and r = to write the six trigonometric ratios.
47. (8, −2)
SOLUTION: Use the values of x and y to find r.
Use x = 8, y = –2, and r = to write the six trigonometric ratios.
48. (−5, −9)
SOLUTION: Use the values of x and y to find r.
Use x = –5, y = – 9, and r = to write the six trigonometric ratios.
49. (4, 5)
SOLUTION: Use the values of x and y to find r.
Use x = 4, y = 5, and r = to write the six trigonometric ratios.
Write each degree measure in radians as a multiple of π and each radian measure in degrees.
50. 25°
SOLUTION: To convert a degree measure to radians, multiply by
51. −420°
SOLUTION: To convert a degree measure to radians, multiply by
52.
SOLUTION: To convert a radian measure to degrees, multiply by
53.
SOLUTION: To convert a radian measure to degrees, multiply by
54. SCIENCE Radiocarbon dating is a method of estimating the age of an organic material by calculating the amount of carbon-14 present in the material. The age of a material can be calculated
using A = t , where A is the age of the
object in years, t is the half-life of carbon-14 or 5700 years, and R is the ratio of the amount of carbon-14 in the sample to the amount of carbon-14 in living tissue. a. A sample of organic material contains 0.000076 gram of carbon-14. A living sample of the same
Describe how the graphs of f (x) and g (x) are related. Then find the amplitude of g (x), and sketch two periods of both functions on the same coordinate axes.
1. f (x) = sin x; g(x) = sin x
SOLUTION: The graph of g(x) is the graph of f (x) compressed
vertically. The amplitude of g(x) is or .
Create a table listing the coordinates of the x-intercepts and extrema for f (x) = sin x for one
period, 2 , on the interval [0, 2 ]. Then use the amplitude of g(x) to find corresponding points on its graph.
Sketch the curve through the indicated points for each function. Then repeat the pattern to complete asecond period.
Functions f (x) = sin x g(x) = sin x
x-int (0, 0) (0, 0)
Max
x-int
Min
x-int
2.
SOLUTION: The graph of g(x) is the graph of f (x) compressed
vertically. The amplitude of g(x) is or .
Create a table listing the coordinates of the x-intercepts and extrema for f (x) = cos x for one
period, 2 , on the interval [0, 2 ]. Then use the amplitude of g(x) to find corresponding points on its graph.
Sketch the curve through the indicated points for each function. Then repeat the pattern to complete asecond period.
Function f (x) = cos x
Max (0, 1)
x-int Min
x-in
Min
x-int
Function f (x) = cos x
Max x-int
Min
x-in
Min
x-int
3. f (x) = cos x; g(x) = 6 cos x
SOLUTION: The graph of g(x) is the graph of f (x) expanded
vertically. The amplitude of g(x) is or 6.
Create a table listing the coordinates of the x-intercepts and extrema for f (x) = cos x for one
period, 2 , on the interval [0, 2 ]. Then use the amplitude of g(x) to find corresponding points on its graph.
Sketch the curve through the indicated points for each function. Then repeat the pattern to complete asecond period.
Functions f (x) = cos x g(x) = 6 cos x
Max (0, 1) (0, 6)
x-int
Min
x-int
Max
4. f (x) = sin x; g(x) = −8 sin x
SOLUTION: The graph of g(x) is the graph of f (x) expanded
vertically. The amplitude of g(x) is or 8.
Create a table listing the coordinates of the x-intercepts and extrema for f (x) = sin x for one
period, 2 , on the interval [0, 2 ]. Then use the amplitude of g(x) to find corresponding points on its graph.
Sketch the curve through the indicated points for each function. Then repeat the pattern to complete asecond period.
Function f (x) = sin x
x-int (0, 0)
Max
x-int
Min
x-int
Function g(x) = −8
sin x
x-int (0, 0)
Min
x-int
Max
x-int
Describe how the graphs of f (x) and g (x) are related. Then find the period of g (x), and sketch at least one period of both functions on the same coordinate axes.
5. f (x) = sin x; g(x) = sin 4x
SOLUTION: The graph of g(x) is the graph of f (x) compressed
horizontally. The period of g(x) is . To find
corresponding points on the graph of g(x), change the x-coordinates of those key points on f (x) so that
they range from 0 to , increasing by increments of
.
Sketch the curve through the indicated points for each function. Then repeat the pattern to complete asecond period.
Functions f (x) = sin x g(x) = sin
4x
x-int (0, 0) (0, 0)
Max
x-int
Min
x-int
6. f (x) = cos x; g(x) = cos 2x
SOLUTION: The graph of g(x) is the graph of f (x) compressed
horizontally. The period of g(x) is or . To find
corresponding points on the graph of g(x), change the x-coordinates of those key points on f (x) so that
they range from 0 to , increasing by increments of
.
Sketch the curve through the indicated points for each function. Then repeat the pattern to complete asecond period.
Functions f (x) = cos x g(x) = cos 2x
Max (0, 1) (0, 1)
x-int
Min
x-int
Max
7. f (x) = cos x;
SOLUTION: The graph of g(x) is the graph of f (x) expanded
horizontally. The period of g(x) is . To
find corresponding points on the graph of g(x), change the x-coordinates of those key points on f (x)
so that they range from 0 to , increasing by
increments of or .
Sketch the curve through the indicated points for each function. Then repeat the pattern to complete asecond period.
Functions f (x) = cos x
Max (0, 1) (0, 1)
x-int
Min
x-int
Max
8. f (x) = sin x;
SOLUTION: The graph of g(x) is the graph of f (x) expanded
horizontally. The period of g(x) is . To find corresponding points on the graph of g(x), change the x-coordinates of those key points on f (x) so that they range from 0 to , increasing by increments of
or .
Sketch the curve through the indicated points for each function. Then repeat the pattern to complete asecond period.
Functions f (x) = sin x
x-int (0, 0) (0, 0)
Max
x-int
Min
x-int
9. VOICES The contralto vocal type includes the deepest female singing voice. Some contraltos can sing as low as the E below middle C (E3), which hasa frequency of 165 hertz. Write an equation for a sine function that models the initial behavior of the sound wave associated with E3 having an amplitude of 0.15.
SOLUTION: The general form of the equation will be y = a sin bt,where t is the time in seconds. Because the
amplitude is 0.15, |a|= 0.15. This means that a = ±0.15. The period is the reciprocal of the frequency or
. Use this value to find b.
Sample answer: One sine function that models the
initial behavior is y = 0.15 sin 330 t.
Write a sine function that can be used to model the initial behavior of a sound wave with the frequency and amplitude given.
10. f = 440, a = 0.3
SOLUTION: The general form of the equation is y = a sin bt, where t is the time in seconds. Because the
amplitude is 0.3, = 0.3. This means that a = ±0.3.
The period is the reciprocal of the frequency or
. Use this value to find b.
Using the positive values of a and b, one sine function that models the initial behavior is y = 0.3 sin
880 t.
11. f = 932, a = 0.25
SOLUTION: The general form of the equation is y = a sin bt, where t is the time in seconds. Because the
amplitude is 0.25, = 0.25. This means that a =
±0.25. The period is the reciprocal of the frequency
or . Use this value to find b.
Using the positive values of a and b, one sine function that models the initial behavior is y = 0.25
sin 1864 t.
12. f = 1245, a = 0.12
SOLUTION: The general form of the equation is y = a sin bt, where t is the time in seconds. Because the
amplitude is 0.12, = 0.12. This means that a =
±0.12. The period is the reciprocal of the frequency or
. Use this value to find b.
Using the positive values of a and b, one sine function that models the initial behavior is y = 0.12
sin 2490 t.
13. f = 623, a = 0.2
SOLUTION: The general form of the equation is y = a sin bt, where t is the time in seconds. Because the
amplitude is 0.2, = 0.2. This means that a = ±0.2.
The period is the reciprocal of the frequency or
. Use this value to find b.
Using the positive values of a and b, one sine function that models the initial behavior is y = 0.2 sin
1246 t.
State the amplitude, period, frequency, phase shift, and vertical shift of each function. Then graph two periods of the function.
14.
SOLUTION:
In this function, a = 3, b = 1, c = − , and d = 0.
Because d = 0, there is no vertical shift.
Graph y = 3 sin x shifted units to the right.
15.
SOLUTION:
In this function, a = 1, b = , c = , and d = 0.
Because d = 0, there is no vertical shift.
16. y = 0.25 cos x + 3
SOLUTION:
In this function, a = , b = 1, c = 0, and d = 3.
Graph y = cos x shifted 3 units up.
17. y = sin 3x – 2
SOLUTION: In this function, a = 1, b = 3, c = 0, and d = –2.
Graph y = sin 3x shifted 2 units down.
18.
SOLUTION:
In this function, a = 1, b = 1, c = , and d = –1.
.
Graph y = cos x shifted units to the right and 1
unit down.
19.
SOLUTION:
In this function, a = 1, b = 1, c = , and d = 4.
.
Graph y = sin x shifted units to the left and 4 units up.
20. VACATIONS The average number of reservations R that a vacation resort has at the beginning of each month is shown.
a. Write an equation of a sinusoidal function that models the average number of reservations using x =1 to represent January. b. According to your model, approximately how many reservations can the resort anticipate in November?
SOLUTION: a. Make a scatter plot of the data and choose a model.
Sample answer: Use a sinusoidal function of the form y = a cos (bx + c) + d to model the data. First, find the maximum M and minimum m values of the data, and use these values to find a, b, c, and d. The maximum and minimum reservations are 200 and 87, respectively. The amplitude a is half of the distance between these values.
The vertical shift d is the average of the maximum and minimum data values.
There are 3 months between the maximum and minimum, so the period is 6.
The maximum data value occurs when x = 1. Since y = cos x attains its first maximum when x = 0, we must apply a phase shift of 1 unit. Use this value to find c.
Write a function using the values for a, b, c, and d.
Use b =
b. To find the number of reservations in November, evaluate the model for x = 11.
Therefore, the resort can anticipate about 115 reservations in November.
21. TIDES The table shown below provides data for the first high and low tides of the day for a certain bay during one day in June.
a. Determine the amplitude, period, phase shift, and vertical shift of a sinusoidal function that models the height of the tide. Let x represent the number of hours that the high or low tide occurred after midnight. b. Write a sinusoidal function that models the data. c. According to your model, what was the height of
the tide at 8:45 P.M. that night?
SOLUTION: a. Sample answer: Use a sinusoidal function of the form y = a cos (bx + c) + d to model the data. First, find the amplitude a, which is half of the distance between the heights of the high and low tides.
The vertical shift d is the average of the heights of the high and low tides.
A sinusoid completes half of a period in the time thatit takes to go from its maximum to its minimum value. One period is twice this time. The first high tide occurs 6.5 hours before the first low tide, so the period is 13.
The maximum data value occurs when x ≈ 4.417. Since y = cos x attains its first maximum when x = 0,we must apply a phase shift of 4.417 units. Use this value to find c.
b. Write a function using the values for a, b, c, and
d. Use b =
c. To find the height of the water at 8:45 P.M. that
night, evaluate the model for x = 20.75.
Therefore, the tide was about 7.28 feet high at 8:45
P.M. that night.
22. METEOROLOGY The average monthly temperatures for Boston, Massachusetts are shown.
a. Determine the amplitude, period, phase shift, and vertical shift of a sinusoidal function that models the monthly temperatures using x = 1 to represent January. b. Write an equation of a sinusoidal function that models the monthly temperatures. c. According to your model, what is Boston’s average temperature in August?
SOLUTION: a. The maximum and minimum are 74° and 29°, respectively. The amplitude a is half of the distance between these values.
The vertical shift d is the average of the maximum and minimum data values.
A sinusoid completes half of a period in the time thatit takes to go from its maximum to its minimum value. So, one period is twice this time. The
maximum function value occurs in July, so xmax is 7.
The minimum function value occurs in January, so
xmin is 1. The period is 2(6) = 12.
The maximum data value occurs when x = 7. Since y = cos x attains its first maximum when x = 0, we must apply a phase shift of 7 units. Use this value to find c.
b. Using the values for a, b, c, and d from part a, a sinusoidal function that models that monthly temperatures in Boston is
c. To find the average monthly temperature for Boston in August, evaluate the model for x = 8.
Therefore, the average monthly temperature for Boston in August is about 71°F.
GRAPHING CALCULATOR Find the values of x in the interval – < x < that make each equation or inequality true. (Hint: Use the intersection function.)
23. –sin x = cos x
SOLUTION:
Graph y = −sin x and y = cos x on the same graphing
calculator screen on (−π, π). Use the intersect feature under the CALC menu to determine where the two graphs intersect.
The graphs intersect at about −0.7854 or − and
about 2.356 or . Therefore, on –π < x < π, –sin x
= cos x when x = − and .
24. sin x − cos x = 1
SOLUTION:
Graph y = sin x − cos x and y = 1 on the same
graphing calculator screen on (− , ). Use the intersect feature under the CALC menu to determine where the two graphs intersect.
The graphs intersect at about 1.57 or . Therefore,
on – < x < , sin x − cos x = 1 when x = .
25. sin x + cos x = 0
SOLUTION:
Graph y = sin x + cos x on (−π, π). Use the zero feature under the CALC menu to determine the zeros of the function.
There are zeros at about −0.785 or − or and about
2.356 or . Therefore, on – < x < , sin x + cos
x = 0 when
26. cos x ≤ sin x
SOLUTION:
Graph y = cos x and y = sin x on (−π, π). Use the intersect feature under the CALC menu to determine on what interval(s) cos x ≤ sin x.
The graphs intersect at about –2.356 or – and
about 0.785 or . From the graph, it appears that
cos x ≤ sin x on – < x < – and < x < .
27. sin x cos x > 1
SOLUTION:
Graph y = sin x cos x and y = 1 on (− , ). Use the intersect feature under the CALC menu to determine on what interval(s) sin x cos x > 1.
The graphs do not intersect. Therefore, y = sin x cos
x is not greater than y = 1 for any values of x on –< x < .
28. sin x cos x ≤ 0
SOLUTION:
Graph y = sin x cos x on (−π, π). Use the zero feature under the CALC menu to determine on what interval(s) sin x cos x ≤ 0.
The zeros of y = sin x cos x are about –1.57 or ,
0, and about 1.57 or . From the graph, it appears
that sin x cos x ≤ 0 on < x < 0 and < x < .
29. CAROUSELS A wooden horse on a carousel moves up and down as the carousel spins. When the ride ends, the horse usually stops in a vertical position different from where it started. The position y of the horse after t seconds can be modeled by y =1.5 sin (2t + c), where the phase shift c must be continuously adjusted to compensate for the differentstarting positions. If during one ride the horse
reached a maximum height after seconds, find
the equation that models the horse’s position.
SOLUTION: First, find the period of y = 1.5 sin (2t + c).
Since the period is π, the function will reach a
maximum height at radians. The phase shift is the
difference between the horizontal position of the
function at and radians, which is radians.
Substitute and b into the phase shift formula to
find c.
Therefore, the equation is
30. AMUSEMENT PARKS The position y in feet of a passenger cart relative to the center of a Ferris wheel over t seconds is shown below.
a. Find the time t that it takes for the cart to return toy = 0 during its initial spin. b. Find the period of the Ferris wheel. c. Sketch the graph representing the position of the passenger cart over one period. d. Write a sinusoidal function that models the position of the passenger cart as a function of time t.
SOLUTION: a. From the diagram, the height of the cart is 0 ft when t = 0, and reaches a maximum height of 19 feet when t = 3.75 seconds. So, the cart will return to y = 0 after 2(3.75) or 7.5 seconds. b. The cart completes half of a cycle from t = 0 to t = 7.5. So, the period is 2(7.5) or 15 seconds. c.
d. The amplitude a is half of the maximum and
minimum values. So, a =
The vertical shift d is the average of the maximum
and minimum data values. So,
Because the period of a sinusoidal function is
you can write Therefore,
There is no phase shift because the height of the cartwhen t = 0 is 0 feet, and the sine function has a y-intercept of 0. Therefore, one equation that could be used to model
the position of the passenger cart is y = 19 sin t.
Write an equation that corresponds to each graph.
31.
SOLUTION: Sample answer: There is an x-intercept at 0, so one equation that corresponds to this graph is y = a sin (bx + c) + d. Half of the distance from the maximum to the minimum value of the function is 3. So, the amplitudeis 3. It appears that the function completes one period on
[0, π]. Find b.
The midline appears to be at y = 0, so there does not appear to be any vertical shift. Therefore, one equation that corresponds to this graph is y = 3 sin (2x).
32.
SOLUTION:
Sample answer: Because there is a y-intercept at ,
one equation that corresponds to this graph is y = a cos (bx + c) + d. Half of the distance from the maximum to the
minimum value of the function is . So, the
amplitude is .
It appears that the function completes one period on [0, 6π]. Find b.
The midline appears to be at y = 0, so there does not appear to be any vertical shift. Therefore, one
equation that corresponds to this graph is y = cos
.
33.
SOLUTION: Sample answer: Because there is a y-intercept at 3, one equation that corresponds to this graph is y = a cos (bx + c) + d. Half of the distance from the maximum to the
minimum value of the function is 4 ÷ 2 or 2. So, the amplitude is 2. It appears that the function completes one period on
Find b.
The midline appears to be at y = 1, so there is a vertical shift 1 unit up. Therefore, one equation that corresponds to this graph is y = 2 cos 4x + 1.
34.
SOLUTION: Sample answer: There is an x-intercept at 0, so one equation that corresponds to this graph is y = a sin (bx + c) + d. Half of the distance from the maximum to the
minimum value of the function is 8 ÷ 2 or 4. So, the amplitude is 4. It appears that the function completes one period on [0, 4π]. Find b.
The midline appears to be at y = −2, so there is a vertical shift of 2 units down. Therefore, one equation that corresponds to this graph is y = 4 sin
− 2.
Write a sinusoidal function with the given period and amplitude that passes through the given point.
35. period: ; amplitude: 5; point:
SOLUTION: Use the period to find b.
Sample answer: One sinusoidal function in which a =5 and b = 2 is y = 5 cos 2x. Evaluate the function for
The function passes through . Therefore, a
sinusoidal function with period π and amplitude 5 that
passes through the point is y = 5 cos 2x.
36. period: 4 ; amplitude: 2; point: ( , 2)
SOLUTION: Use the period to find b.
Sample answer: One sinusoidal function in which a =
2 and b = is y = 2 sin . Evaluate the function
for x = π.
The function passes through ( , 2). Therefore, a
sinusoidal function with period 4π and amplitude 2
that passes through the point ( , 2) is y = 2 sin .
37. period: ; amplitude: ; point:
SOLUTION: Use the period to find b.
Sample answer: One sinusoidal function in which a =1.5 and b = 4 is y = 1.5 cos 4x. Evaluate the function
for
The function passes through . Therefore, a
sinusoidal function with period and amplitude 1.5
that passes through the point is y = 1.5 cos
4x.
38. period: 3π; amplitude: ; point:
SOLUTION: Use the period to find b.
Sample answer: One sinusoidal function in which a =
0.5 and b = is y = sin x. Evaluate the
function for
The function passes through . Therefore, a
sinusoidal function with period 3π and amplitude 0.5
that passes through the point is y = sin
x.
39. MULTIPLE REPRESENTATIONS In this problem, you will investigate the change in the graph of a sinusoidal function of the form y = sin x or y = cos x when multiplied by a polynomial function. a. GRAPHICAL Use a graphing calculator to sketch the graphs of y = 2x, y = –2x, and y = 2x cos x on the same coordinate plane, on the interval [–20, 20]. b. VERBAL Describe the behavior of the graph of y = 2x cos x in relation to the graphs of y = 2x and y = –2x. c. GRAPHICAL Use a graphing calculator to
sketch the graphs of y = x2, y = –x
2, and y = x
2 sin x
on the same coordinate plane, on the interval [–20, 20]. d. VERBAL Describe the behavior of the graph of
y = x2 sin x in relation to the graphs of y = x
2 and y
= –x2.
e. ANALYTICAL Make a conjecture as to the behavior of the graph of a sinusoidal function of the form y = sin x or y = cos x when multiplied by polynomial function of the form y = f (x).
SOLUTION: a.
b. The graph of y = 2x cos x oscillates between the graphs of y = 2x and y = –2x. c.
d. The graph of y = x2 sin x oscillates between the
graphs of y = x2 and y = –x
2.
e . The graph of y = f (x) sin x or y = f (x) cos x will oscillate between the graphs of y = f (x) and y = –f(x).
40. CHALLENGE Without graphing, find the exact coordinates of the first maximum point to the right of
the y-axis for
SOLUTION:
First, find the phase shift for
Next, find the period of the function.
The first maximum for one period can be found by
finding So, incorporating the phase shift, the
first maximum to the right of the y-axis is
. Because the amplitude is |4| = 4,
the maximum point is
REASONING Determine whether each statement is true or false . Explain your reasoning.
41. Every sine function of the form y = a sin (bx + c) + d can be written as a cosine function of the form y =a cos (bx + c) + d.
SOLUTION: It is true that every sine function of the form y = a sin (bx + c) + d can be written as a cosine function of the form y = a cos (bx + c) + d. The graph of cosine is a horizontal translation of the sine graph. Therefore, a cosine function can be written from any sine function using the same amplitude and period by applying the necessary phase shift.
For example, consider and
. Phase shift by
to obtain .
42. The period of f (x) = cos 8x is equal to four times the period of g(x) = cos 2x.
SOLUTION: Find the period of f (x) = cos 8x.
Find the period of g(x) = cos 2x.
Four times the period of g(x) = cos 2x is 4 ⋅ or
4 . So, the period of f (x) is the period of g(x).
Therefore, the statement is false.
43. CHALLENGE How many zeros does y = cos
1500x have on the interval 0 ≤ x ≤ 2 ?
SOLUTION: Find the period of y = cos 1500x.
Graph y = cos 1500x on .
The graph of y = cos 1500x has two x-intercepts for one cycle, so the function has 2 zeros per cycle. Find
the number of cycles for y = cos 1500x on [0, 2 ].
So, the graph of y = cos 1500x will complete 1500
cycles on [0, 2 ]. Because there are two zeros per cycle, y = cos 1500x will have 1500(2) or 3000 zeros
on [0, 2 ].
44. PROOF Prove the phase shift formula.
SOLUTION:
Consider y = a sin (bx + c), where a , b, and c ≠ 0. To find a zero of the function, find the value of x for which a sin (bx + c) = 0. Since sin 0 = 0, solving bx + c = 0 will yield a zero of the function.
Therefore, y = 0 when . The value of is
the phase shift. When c > 0: The graph of y = a sin (bx + c) is the
graph of y = a sin x, shifted units to the left.
When c < 0: The graph of y = a sin (bx + c) is the
graph of y = a sin x, shifted units to the right.
Consider the graph of y = cos x below in blue. In this equation a = 1, b = 1 and c = 0. One zero of y = cos x is . The green graph is shifted to the
left. Thus c is – . Then the shifted equation will be
.
45. Writing in Math The Power Tower ride in Sandusky, Ohio, is shown below. Along the side of each tower is a string of lights that send a continuouspulse of light up and down each tower at a constant rate. Explain why the distance d of this light from theground over time t cannot be represented by a sinusoidal function.
SOLUTION: Sample answer: Although the pulse of light can be represented as a function with a period, it is not a sinusoidal function because the distance the pulse of light is from the ground changes at a constant rate. As a result, the graph of this function would resemble the graph below.
The given point lies on the terminal side of an angle θ in standard position. Find the values of
the six trigonometric functions of θ. 46. (−4, 4)
SOLUTION: Use the values of x and y to find r.
Use x = –4, y = 4, and r = to write the six trigonometric ratios.
47. (8, −2)
SOLUTION: Use the values of x and y to find r.
Use x = 8, y = –2, and r = to write the six trigonometric ratios.
48. (−5, −9)
SOLUTION: Use the values of x and y to find r.
Use x = –5, y = – 9, and r = to write the six trigonometric ratios.
49. (4, 5)
SOLUTION: Use the values of x and y to find r.
Use x = 4, y = 5, and r = to write the six trigonometric ratios.
Write each degree measure in radians as a multiple of π and each radian measure in degrees.
50. 25°
SOLUTION: To convert a degree measure to radians, multiply by
51. −420°
SOLUTION: To convert a degree measure to radians, multiply by
52.
SOLUTION: To convert a radian measure to degrees, multiply by
53.
SOLUTION: To convert a radian measure to degrees, multiply by
54. SCIENCE Radiocarbon dating is a method of estimating the age of an organic material by calculating the amount of carbon-14 present in the material. The age of a material can be calculated
using A = t , where A is the age of the
object in years, t is the half-life of carbon-14 or 5700 years, and R is the ratio of the amount of carbon-14 in the sample to the amount of carbon-14 in living tissue. a. A sample of organic material contains 0.000076 gram of carbon-14. A living sample of the same
eSolutions Manual - Powered by Cognero Page 13
4-4 Graphing Sine and Cosine Functions
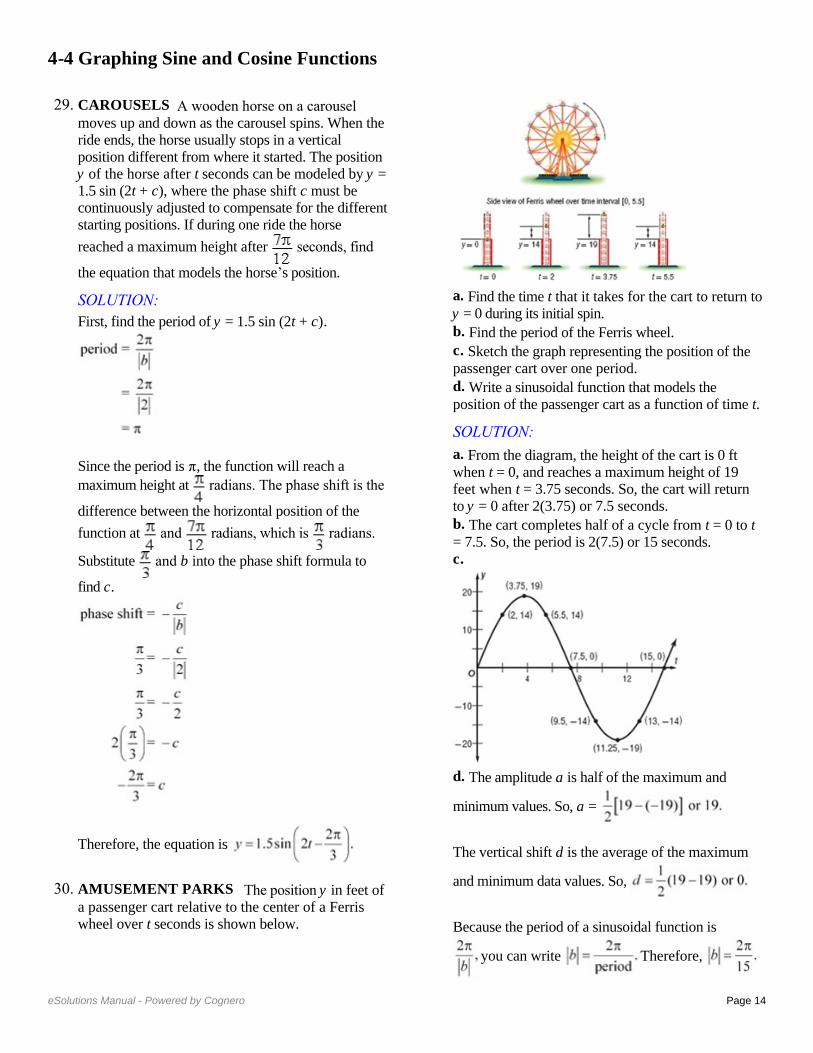
Describe how the graphs of f (x) and g (x) are related. Then find the amplitude of g (x), and sketch two periods of both functions on the same coordinate axes.
1. f (x) = sin x; g(x) = sin x
SOLUTION: The graph of g(x) is the graph of f (x) compressed
vertically. The amplitude of g(x) is or .
Create a table listing the coordinates of the x-intercepts and extrema for f (x) = sin x for one
period, 2 , on the interval [0, 2 ]. Then use the amplitude of g(x) to find corresponding points on its graph.
Sketch the curve through the indicated points for each function. Then repeat the pattern to complete asecond period.
Functions f (x) = sin x g(x) = sin x
x-int (0, 0) (0, 0)
Max
x-int
Min
x-int
2.
SOLUTION: The graph of g(x) is the graph of f (x) compressed
vertically. The amplitude of g(x) is or .
Create a table listing the coordinates of the x-intercepts and extrema for f (x) = cos x for one
period, 2 , on the interval [0, 2 ]. Then use the amplitude of g(x) to find corresponding points on its graph.
Sketch the curve through the indicated points for each function. Then repeat the pattern to complete asecond period.
Function f (x) = cos x
Max (0, 1)
x-int Min
x-in
Min
x-int
Function f (x) = cos x
Max x-int
Min
x-in
Min
x-int
3. f (x) = cos x; g(x) = 6 cos x
SOLUTION: The graph of g(x) is the graph of f (x) expanded
vertically. The amplitude of g(x) is or 6.
Create a table listing the coordinates of the x-intercepts and extrema for f (x) = cos x for one
period, 2 , on the interval [0, 2 ]. Then use the amplitude of g(x) to find corresponding points on its graph.
Sketch the curve through the indicated points for each function. Then repeat the pattern to complete asecond period.
Functions f (x) = cos x g(x) = 6 cos x
Max (0, 1) (0, 6)
x-int
Min
x-int
Max
4. f (x) = sin x; g(x) = −8 sin x
SOLUTION: The graph of g(x) is the graph of f (x) expanded
vertically. The amplitude of g(x) is or 8.
Create a table listing the coordinates of the x-intercepts and extrema for f (x) = sin x for one
period, 2 , on the interval [0, 2 ]. Then use the amplitude of g(x) to find corresponding points on its graph.
Sketch the curve through the indicated points for each function. Then repeat the pattern to complete asecond period.
Function f (x) = sin x
x-int (0, 0)
Max
x-int
Min
x-int
Function g(x) = −8
sin x
x-int (0, 0)
Min
x-int
Max
x-int
Describe how the graphs of f (x) and g (x) are related. Then find the period of g (x), and sketch at least one period of both functions on the same coordinate axes.
5. f (x) = sin x; g(x) = sin 4x
SOLUTION: The graph of g(x) is the graph of f (x) compressed
horizontally. The period of g(x) is . To find
corresponding points on the graph of g(x), change the x-coordinates of those key points on f (x) so that
they range from 0 to , increasing by increments of
.
Sketch the curve through the indicated points for each function. Then repeat the pattern to complete asecond period.
Functions f (x) = sin x g(x) = sin
4x
x-int (0, 0) (0, 0)
Max
x-int
Min
x-int
6. f (x) = cos x; g(x) = cos 2x
SOLUTION: The graph of g(x) is the graph of f (x) compressed
horizontally. The period of g(x) is or . To find
corresponding points on the graph of g(x), change the x-coordinates of those key points on f (x) so that
they range from 0 to , increasing by increments of
.
Sketch the curve through the indicated points for each function. Then repeat the pattern to complete asecond period.
Functions f (x) = cos x g(x) = cos 2x
Max (0, 1) (0, 1)
x-int
Min
x-int
Max
7. f (x) = cos x;
SOLUTION: The graph of g(x) is the graph of f (x) expanded
horizontally. The period of g(x) is . To
find corresponding points on the graph of g(x), change the x-coordinates of those key points on f (x)
so that they range from 0 to , increasing by
increments of or .
Sketch the curve through the indicated points for each function. Then repeat the pattern to complete asecond period.
Functions f (x) = cos x
Max (0, 1) (0, 1)
x-int
Min
x-int
Max
8. f (x) = sin x;
SOLUTION: The graph of g(x) is the graph of f (x) expanded
horizontally. The period of g(x) is . To find corresponding points on the graph of g(x), change the x-coordinates of those key points on f (x) so that they range from 0 to , increasing by increments of
or .
Sketch the curve through the indicated points for each function. Then repeat the pattern to complete asecond period.
Functions f (x) = sin x
x-int (0, 0) (0, 0)
Max
x-int
Min
x-int
9. VOICES The contralto vocal type includes the deepest female singing voice. Some contraltos can sing as low as the E below middle C (E3), which hasa frequency of 165 hertz. Write an equation for a sine function that models the initial behavior of the sound wave associated with E3 having an amplitude of 0.15.
SOLUTION: The general form of the equation will be y = a sin bt,where t is the time in seconds. Because the
amplitude is 0.15, |a|= 0.15. This means that a = ±0.15. The period is the reciprocal of the frequency or
. Use this value to find b.
Sample answer: One sine function that models the
initial behavior is y = 0.15 sin 330 t.
Write a sine function that can be used to model the initial behavior of a sound wave with the frequency and amplitude given.
10. f = 440, a = 0.3
SOLUTION: The general form of the equation is y = a sin bt, where t is the time in seconds. Because the
amplitude is 0.3, = 0.3. This means that a = ±0.3.
The period is the reciprocal of the frequency or
. Use this value to find b.
Using the positive values of a and b, one sine function that models the initial behavior is y = 0.3 sin
880 t.
11. f = 932, a = 0.25
SOLUTION: The general form of the equation is y = a sin bt, where t is the time in seconds. Because the
amplitude is 0.25, = 0.25. This means that a =
±0.25. The period is the reciprocal of the frequency
or . Use this value to find b.
Using the positive values of a and b, one sine function that models the initial behavior is y = 0.25
sin 1864 t.
12. f = 1245, a = 0.12
SOLUTION: The general form of the equation is y = a sin bt, where t is the time in seconds. Because the
amplitude is 0.12, = 0.12. This means that a =
±0.12. The period is the reciprocal of the frequency or
. Use this value to find b.
Using the positive values of a and b, one sine function that models the initial behavior is y = 0.12
sin 2490 t.
13. f = 623, a = 0.2
SOLUTION: The general form of the equation is y = a sin bt, where t is the time in seconds. Because the
amplitude is 0.2, = 0.2. This means that a = ±0.2.
The period is the reciprocal of the frequency or
. Use this value to find b.
Using the positive values of a and b, one sine function that models the initial behavior is y = 0.2 sin
1246 t.
State the amplitude, period, frequency, phase shift, and vertical shift of each function. Then graph two periods of the function.
14.
SOLUTION:
In this function, a = 3, b = 1, c = − , and d = 0.
Because d = 0, there is no vertical shift.
Graph y = 3 sin x shifted units to the right.
15.
SOLUTION:
In this function, a = 1, b = , c = , and d = 0.
Because d = 0, there is no vertical shift.
16. y = 0.25 cos x + 3
SOLUTION:
In this function, a = , b = 1, c = 0, and d = 3.
Graph y = cos x shifted 3 units up.
17. y = sin 3x – 2
SOLUTION: In this function, a = 1, b = 3, c = 0, and d = –2.
Graph y = sin 3x shifted 2 units down.
18.
SOLUTION:
In this function, a = 1, b = 1, c = , and d = –1.
.
Graph y = cos x shifted units to the right and 1
unit down.
19.
SOLUTION:
In this function, a = 1, b = 1, c = , and d = 4.
.
Graph y = sin x shifted units to the left and 4 units up.
20. VACATIONS The average number of reservations R that a vacation resort has at the beginning of each month is shown.
a. Write an equation of a sinusoidal function that models the average number of reservations using x =1 to represent January. b. According to your model, approximately how many reservations can the resort anticipate in November?
SOLUTION: a. Make a scatter plot of the data and choose a model.
Sample answer: Use a sinusoidal function of the form y = a cos (bx + c) + d to model the data. First, find the maximum M and minimum m values of the data, and use these values to find a, b, c, and d. The maximum and minimum reservations are 200 and 87, respectively. The amplitude a is half of the distance between these values.
The vertical shift d is the average of the maximum and minimum data values.
There are 3 months between the maximum and minimum, so the period is 6.
The maximum data value occurs when x = 1. Since y = cos x attains its first maximum when x = 0, we must apply a phase shift of 1 unit. Use this value to find c.
Write a function using the values for a, b, c, and d.
Use b =
b. To find the number of reservations in November, evaluate the model for x = 11.
Therefore, the resort can anticipate about 115 reservations in November.
21. TIDES The table shown below provides data for the first high and low tides of the day for a certain bay during one day in June.
a. Determine the amplitude, period, phase shift, and vertical shift of a sinusoidal function that models the height of the tide. Let x represent the number of hours that the high or low tide occurred after midnight. b. Write a sinusoidal function that models the data. c. According to your model, what was the height of
the tide at 8:45 P.M. that night?
SOLUTION: a. Sample answer: Use a sinusoidal function of the form y = a cos (bx + c) + d to model the data. First, find the amplitude a, which is half of the distance between the heights of the high and low tides.
The vertical shift d is the average of the heights of the high and low tides.
A sinusoid completes half of a period in the time thatit takes to go from its maximum to its minimum value. One period is twice this time. The first high tide occurs 6.5 hours before the first low tide, so the period is 13.
The maximum data value occurs when x ≈ 4.417. Since y = cos x attains its first maximum when x = 0,we must apply a phase shift of 4.417 units. Use this value to find c.
b. Write a function using the values for a, b, c, and
d. Use b =
c. To find the height of the water at 8:45 P.M. that
night, evaluate the model for x = 20.75.
Therefore, the tide was about 7.28 feet high at 8:45
P.M. that night.
22. METEOROLOGY The average monthly temperatures for Boston, Massachusetts are shown.
a. Determine the amplitude, period, phase shift, and vertical shift of a sinusoidal function that models the monthly temperatures using x = 1 to represent January. b. Write an equation of a sinusoidal function that models the monthly temperatures. c. According to your model, what is Boston’s average temperature in August?
SOLUTION: a. The maximum and minimum are 74° and 29°, respectively. The amplitude a is half of the distance between these values.
The vertical shift d is the average of the maximum and minimum data values.
A sinusoid completes half of a period in the time thatit takes to go from its maximum to its minimum value. So, one period is twice this time. The
maximum function value occurs in July, so xmax is 7.
The minimum function value occurs in January, so
xmin is 1. The period is 2(6) = 12.
The maximum data value occurs when x = 7. Since y = cos x attains its first maximum when x = 0, we must apply a phase shift of 7 units. Use this value to find c.
b. Using the values for a, b, c, and d from part a, a sinusoidal function that models that monthly temperatures in Boston is
c. To find the average monthly temperature for Boston in August, evaluate the model for x = 8.
Therefore, the average monthly temperature for Boston in August is about 71°F.
GRAPHING CALCULATOR Find the values of x in the interval – < x < that make each equation or inequality true. (Hint: Use the intersection function.)
23. –sin x = cos x
SOLUTION:
Graph y = −sin x and y = cos x on the same graphing
calculator screen on (−π, π). Use the intersect feature under the CALC menu to determine where the two graphs intersect.
The graphs intersect at about −0.7854 or − and
about 2.356 or . Therefore, on –π < x < π, –sin x
= cos x when x = − and .
24. sin x − cos x = 1
SOLUTION:
Graph y = sin x − cos x and y = 1 on the same
graphing calculator screen on (− , ). Use the intersect feature under the CALC menu to determine where the two graphs intersect.
The graphs intersect at about 1.57 or . Therefore,
on – < x < , sin x − cos x = 1 when x = .
25. sin x + cos x = 0
SOLUTION:
Graph y = sin x + cos x on (−π, π). Use the zero feature under the CALC menu to determine the zeros of the function.
There are zeros at about −0.785 or − or and about
2.356 or . Therefore, on – < x < , sin x + cos
x = 0 when
26. cos x ≤ sin x
SOLUTION:
Graph y = cos x and y = sin x on (−π, π). Use the intersect feature under the CALC menu to determine on what interval(s) cos x ≤ sin x.
The graphs intersect at about –2.356 or – and
about 0.785 or . From the graph, it appears that
cos x ≤ sin x on – < x < – and < x < .
27. sin x cos x > 1
SOLUTION:
Graph y = sin x cos x and y = 1 on (− , ). Use the intersect feature under the CALC menu to determine on what interval(s) sin x cos x > 1.
The graphs do not intersect. Therefore, y = sin x cos
x is not greater than y = 1 for any values of x on –< x < .
28. sin x cos x ≤ 0
SOLUTION:
Graph y = sin x cos x on (−π, π). Use the zero feature under the CALC menu to determine on what interval(s) sin x cos x ≤ 0.
The zeros of y = sin x cos x are about –1.57 or ,
0, and about 1.57 or . From the graph, it appears
that sin x cos x ≤ 0 on < x < 0 and < x < .
29. CAROUSELS A wooden horse on a carousel moves up and down as the carousel spins. When the ride ends, the horse usually stops in a vertical position different from where it started. The position y of the horse after t seconds can be modeled by y =1.5 sin (2t + c), where the phase shift c must be continuously adjusted to compensate for the differentstarting positions. If during one ride the horse
reached a maximum height after seconds, find
the equation that models the horse’s position.
SOLUTION: First, find the period of y = 1.5 sin (2t + c).
Since the period is π, the function will reach a
maximum height at radians. The phase shift is the
difference between the horizontal position of the
function at and radians, which is radians.
Substitute and b into the phase shift formula to
find c.
Therefore, the equation is
30. AMUSEMENT PARKS The position y in feet of a passenger cart relative to the center of a Ferris wheel over t seconds is shown below.
a. Find the time t that it takes for the cart to return toy = 0 during its initial spin. b. Find the period of the Ferris wheel. c. Sketch the graph representing the position of the passenger cart over one period. d. Write a sinusoidal function that models the position of the passenger cart as a function of time t.
SOLUTION: a. From the diagram, the height of the cart is 0 ft when t = 0, and reaches a maximum height of 19 feet when t = 3.75 seconds. So, the cart will return to y = 0 after 2(3.75) or 7.5 seconds. b. The cart completes half of a cycle from t = 0 to t = 7.5. So, the period is 2(7.5) or 15 seconds. c.
d. The amplitude a is half of the maximum and
minimum values. So, a =
The vertical shift d is the average of the maximum
and minimum data values. So,
Because the period of a sinusoidal function is
you can write Therefore,
There is no phase shift because the height of the cartwhen t = 0 is 0 feet, and the sine function has a y-intercept of 0. Therefore, one equation that could be used to model
the position of the passenger cart is y = 19 sin t.
Write an equation that corresponds to each graph.
31.
SOLUTION: Sample answer: There is an x-intercept at 0, so one equation that corresponds to this graph is y = a sin (bx + c) + d. Half of the distance from the maximum to the minimum value of the function is 3. So, the amplitudeis 3. It appears that the function completes one period on
[0, π]. Find b.
The midline appears to be at y = 0, so there does not appear to be any vertical shift. Therefore, one equation that corresponds to this graph is y = 3 sin (2x).
32.
SOLUTION:
Sample answer: Because there is a y-intercept at ,
one equation that corresponds to this graph is y = a cos (bx + c) + d. Half of the distance from the maximum to the
minimum value of the function is . So, the
amplitude is .
It appears that the function completes one period on [0, 6π]. Find b.
The midline appears to be at y = 0, so there does not appear to be any vertical shift. Therefore, one
equation that corresponds to this graph is y = cos
.
33.
SOLUTION: Sample answer: Because there is a y-intercept at 3, one equation that corresponds to this graph is y = a cos (bx + c) + d. Half of the distance from the maximum to the
minimum value of the function is 4 ÷ 2 or 2. So, the amplitude is 2. It appears that the function completes one period on
Find b.
The midline appears to be at y = 1, so there is a vertical shift 1 unit up. Therefore, one equation that corresponds to this graph is y = 2 cos 4x + 1.
34.
SOLUTION: Sample answer: There is an x-intercept at 0, so one equation that corresponds to this graph is y = a sin (bx + c) + d. Half of the distance from the maximum to the
minimum value of the function is 8 ÷ 2 or 4. So, the amplitude is 4. It appears that the function completes one period on [0, 4π]. Find b.
The midline appears to be at y = −2, so there is a vertical shift of 2 units down. Therefore, one equation that corresponds to this graph is y = 4 sin
− 2.
Write a sinusoidal function with the given period and amplitude that passes through the given point.
35. period: ; amplitude: 5; point:
SOLUTION: Use the period to find b.
Sample answer: One sinusoidal function in which a =5 and b = 2 is y = 5 cos 2x. Evaluate the function for
The function passes through . Therefore, a
sinusoidal function with period π and amplitude 5 that
passes through the point is y = 5 cos 2x.
36. period: 4 ; amplitude: 2; point: ( , 2)
SOLUTION: Use the period to find b.
Sample answer: One sinusoidal function in which a =
2 and b = is y = 2 sin . Evaluate the function
for x = π.
The function passes through ( , 2). Therefore, a
sinusoidal function with period 4π and amplitude 2
that passes through the point ( , 2) is y = 2 sin .
37. period: ; amplitude: ; point:
SOLUTION: Use the period to find b.
Sample answer: One sinusoidal function in which a =1.5 and b = 4 is y = 1.5 cos 4x. Evaluate the function
for
The function passes through . Therefore, a
sinusoidal function with period and amplitude 1.5
that passes through the point is y = 1.5 cos
4x.
38. period: 3π; amplitude: ; point:
SOLUTION: Use the period to find b.
Sample answer: One sinusoidal function in which a =
0.5 and b = is y = sin x. Evaluate the
function for
The function passes through . Therefore, a
sinusoidal function with period 3π and amplitude 0.5
that passes through the point is y = sin
x.
39. MULTIPLE REPRESENTATIONS In this problem, you will investigate the change in the graph of a sinusoidal function of the form y = sin x or y = cos x when multiplied by a polynomial function. a. GRAPHICAL Use a graphing calculator to sketch the graphs of y = 2x, y = –2x, and y = 2x cos x on the same coordinate plane, on the interval [–20, 20]. b. VERBAL Describe the behavior of the graph of y = 2x cos x in relation to the graphs of y = 2x and y = –2x. c. GRAPHICAL Use a graphing calculator to
sketch the graphs of y = x2, y = –x
2, and y = x
2 sin x
on the same coordinate plane, on the interval [–20, 20]. d. VERBAL Describe the behavior of the graph of
y = x2 sin x in relation to the graphs of y = x
2 and y
= –x2.
e. ANALYTICAL Make a conjecture as to the behavior of the graph of a sinusoidal function of the form y = sin x or y = cos x when multiplied by polynomial function of the form y = f (x).
SOLUTION: a.
b. The graph of y = 2x cos x oscillates between the graphs of y = 2x and y = –2x. c.
d. The graph of y = x2 sin x oscillates between the
graphs of y = x2 and y = –x
2.
e . The graph of y = f (x) sin x or y = f (x) cos x will oscillate between the graphs of y = f (x) and y = –f(x).
40. CHALLENGE Without graphing, find the exact coordinates of the first maximum point to the right of
the y-axis for
SOLUTION:
First, find the phase shift for
Next, find the period of the function.
The first maximum for one period can be found by
finding So, incorporating the phase shift, the
first maximum to the right of the y-axis is
. Because the amplitude is |4| = 4,
the maximum point is
REASONING Determine whether each statement is true or false . Explain your reasoning.
41. Every sine function of the form y = a sin (bx + c) + d can be written as a cosine function of the form y =a cos (bx + c) + d.
SOLUTION: It is true that every sine function of the form y = a sin (bx + c) + d can be written as a cosine function of the form y = a cos (bx + c) + d. The graph of cosine is a horizontal translation of the sine graph. Therefore, a cosine function can be written from any sine function using the same amplitude and period by applying the necessary phase shift.
For example, consider and
. Phase shift by
to obtain .
42. The period of f (x) = cos 8x is equal to four times the period of g(x) = cos 2x.
SOLUTION: Find the period of f (x) = cos 8x.
Find the period of g(x) = cos 2x.
Four times the period of g(x) = cos 2x is 4 ⋅ or
4 . So, the period of f (x) is the period of g(x).
Therefore, the statement is false.
43. CHALLENGE How many zeros does y = cos
1500x have on the interval 0 ≤ x ≤ 2 ?
SOLUTION: Find the period of y = cos 1500x.
Graph y = cos 1500x on .
The graph of y = cos 1500x has two x-intercepts for one cycle, so the function has 2 zeros per cycle. Find
the number of cycles for y = cos 1500x on [0, 2 ].
So, the graph of y = cos 1500x will complete 1500
cycles on [0, 2 ]. Because there are two zeros per cycle, y = cos 1500x will have 1500(2) or 3000 zeros
on [0, 2 ].
44. PROOF Prove the phase shift formula.
SOLUTION:
Consider y = a sin (bx + c), where a , b, and c ≠ 0. To find a zero of the function, find the value of x for which a sin (bx + c) = 0. Since sin 0 = 0, solving bx + c = 0 will yield a zero of the function.
Therefore, y = 0 when . The value of is
the phase shift. When c > 0: The graph of y = a sin (bx + c) is the
graph of y = a sin x, shifted units to the left.
When c < 0: The graph of y = a sin (bx + c) is the
graph of y = a sin x, shifted units to the right.
Consider the graph of y = cos x below in blue. In this equation a = 1, b = 1 and c = 0. One zero of y = cos x is . The green graph is shifted to the
left. Thus c is – . Then the shifted equation will be
.
45. Writing in Math The Power Tower ride in Sandusky, Ohio, is shown below. Along the side of each tower is a string of lights that send a continuouspulse of light up and down each tower at a constant rate. Explain why the distance d of this light from theground over time t cannot be represented by a sinusoidal function.
SOLUTION: Sample answer: Although the pulse of light can be represented as a function with a period, it is not a sinusoidal function because the distance the pulse of light is from the ground changes at a constant rate. As a result, the graph of this function would resemble the graph below.
The given point lies on the terminal side of an angle θ in standard position. Find the values of
the six trigonometric functions of θ. 46. (−4, 4)
SOLUTION: Use the values of x and y to find r.
Use x = –4, y = 4, and r = to write the six trigonometric ratios.
47. (8, −2)
SOLUTION: Use the values of x and y to find r.
Use x = 8, y = –2, and r = to write the six trigonometric ratios.
48. (−5, −9)
SOLUTION: Use the values of x and y to find r.
Use x = –5, y = – 9, and r = to write the six trigonometric ratios.
49. (4, 5)
SOLUTION: Use the values of x and y to find r.
Use x = 4, y = 5, and r = to write the six trigonometric ratios.
Write each degree measure in radians as a multiple of π and each radian measure in degrees.
50. 25°
SOLUTION: To convert a degree measure to radians, multiply by
51. −420°
SOLUTION: To convert a degree measure to radians, multiply by
52.
SOLUTION: To convert a radian measure to degrees, multiply by
53.
SOLUTION: To convert a radian measure to degrees, multiply by
54. SCIENCE Radiocarbon dating is a method of estimating the age of an organic material by calculating the amount of carbon-14 present in the material. The age of a material can be calculated
using A = t , where A is the age of the
object in years, t is the half-life of carbon-14 or 5700 years, and R is the ratio of the amount of carbon-14 in the sample to the amount of carbon-14 in living tissue. a. A sample of organic material contains 0.000076 gram of carbon-14. A living sample of the same
Describe how the graphs of f (x) and g (x) are related. Then find the amplitude of g (x), and sketch two periods of both functions on the same coordinate axes.
1. f (x) = sin x; g(x) = sin x
SOLUTION: The graph of g(x) is the graph of f (x) compressed
vertically. The amplitude of g(x) is or .
Create a table listing the coordinates of the x-intercepts and extrema for f (x) = sin x for one
period, 2 , on the interval [0, 2 ]. Then use the amplitude of g(x) to find corresponding points on its graph.
Sketch the curve through the indicated points for each function. Then repeat the pattern to complete asecond period.
Functions f (x) = sin x g(x) = sin x
x-int (0, 0) (0, 0)
Max
x-int
Min
x-int
2.
SOLUTION: The graph of g(x) is the graph of f (x) compressed
vertically. The amplitude of g(x) is or .
Create a table listing the coordinates of the x-intercepts and extrema for f (x) = cos x for one
period, 2 , on the interval [0, 2 ]. Then use the amplitude of g(x) to find corresponding points on its graph.
Sketch the curve through the indicated points for each function. Then repeat the pattern to complete asecond period.
Function f (x) = cos x
Max (0, 1)
x-int Min
x-in
Min
x-int
Function f (x) = cos x
Max x-int
Min
x-in
Min
x-int
3. f (x) = cos x; g(x) = 6 cos x
SOLUTION: The graph of g(x) is the graph of f (x) expanded
vertically. The amplitude of g(x) is or 6.
Create a table listing the coordinates of the x-intercepts and extrema for f (x) = cos x for one
period, 2 , on the interval [0, 2 ]. Then use the amplitude of g(x) to find corresponding points on its graph.
Sketch the curve through the indicated points for each function. Then repeat the pattern to complete asecond period.
Functions f (x) = cos x g(x) = 6 cos x
Max (0, 1) (0, 6)
x-int
Min
x-int
Max
4. f (x) = sin x; g(x) = −8 sin x
SOLUTION: The graph of g(x) is the graph of f (x) expanded
vertically. The amplitude of g(x) is or 8.
Create a table listing the coordinates of the x-intercepts and extrema for f (x) = sin x for one
period, 2 , on the interval [0, 2 ]. Then use the amplitude of g(x) to find corresponding points on its graph.
Sketch the curve through the indicated points for each function. Then repeat the pattern to complete asecond period.
Function f (x) = sin x
x-int (0, 0)
Max
x-int
Min
x-int
Function g(x) = −8
sin x
x-int (0, 0)
Min
x-int
Max
x-int
Describe how the graphs of f (x) and g (x) are related. Then find the period of g (x), and sketch at least one period of both functions on the same coordinate axes.
5. f (x) = sin x; g(x) = sin 4x
SOLUTION: The graph of g(x) is the graph of f (x) compressed
horizontally. The period of g(x) is . To find
corresponding points on the graph of g(x), change the x-coordinates of those key points on f (x) so that
they range from 0 to , increasing by increments of
.
Sketch the curve through the indicated points for each function. Then repeat the pattern to complete asecond period.
Functions f (x) = sin x g(x) = sin
4x
x-int (0, 0) (0, 0)
Max
x-int
Min
x-int
6. f (x) = cos x; g(x) = cos 2x
SOLUTION: The graph of g(x) is the graph of f (x) compressed
horizontally. The period of g(x) is or . To find
corresponding points on the graph of g(x), change the x-coordinates of those key points on f (x) so that
they range from 0 to , increasing by increments of
.
Sketch the curve through the indicated points for each function. Then repeat the pattern to complete asecond period.
Functions f (x) = cos x g(x) = cos 2x
Max (0, 1) (0, 1)
x-int
Min
x-int
Max
7. f (x) = cos x;
SOLUTION: The graph of g(x) is the graph of f (x) expanded
horizontally. The period of g(x) is . To
find corresponding points on the graph of g(x), change the x-coordinates of those key points on f (x)
so that they range from 0 to , increasing by
increments of or .
Sketch the curve through the indicated points for each function. Then repeat the pattern to complete asecond period.
Functions f (x) = cos x
Max (0, 1) (0, 1)
x-int
Min
x-int
Max
8. f (x) = sin x;
SOLUTION: The graph of g(x) is the graph of f (x) expanded
horizontally. The period of g(x) is . To find corresponding points on the graph of g(x), change the x-coordinates of those key points on f (x) so that they range from 0 to , increasing by increments of
or .
Sketch the curve through the indicated points for each function. Then repeat the pattern to complete asecond period.
Functions f (x) = sin x
x-int (0, 0) (0, 0)
Max
x-int
Min
x-int
9. VOICES The contralto vocal type includes the deepest female singing voice. Some contraltos can sing as low as the E below middle C (E3), which hasa frequency of 165 hertz. Write an equation for a sine function that models the initial behavior of the sound wave associated with E3 having an amplitude of 0.15.
SOLUTION: The general form of the equation will be y = a sin bt,where t is the time in seconds. Because the
amplitude is 0.15, |a|= 0.15. This means that a = ±0.15. The period is the reciprocal of the frequency or
. Use this value to find b.
Sample answer: One sine function that models the
initial behavior is y = 0.15 sin 330 t.
Write a sine function that can be used to model the initial behavior of a sound wave with the frequency and amplitude given.
10. f = 440, a = 0.3
SOLUTION: The general form of the equation is y = a sin bt, where t is the time in seconds. Because the
amplitude is 0.3, = 0.3. This means that a = ±0.3.
The period is the reciprocal of the frequency or
. Use this value to find b.
Using the positive values of a and b, one sine function that models the initial behavior is y = 0.3 sin
880 t.
11. f = 932, a = 0.25
SOLUTION: The general form of the equation is y = a sin bt, where t is the time in seconds. Because the
amplitude is 0.25, = 0.25. This means that a =
±0.25. The period is the reciprocal of the frequency
or . Use this value to find b.
Using the positive values of a and b, one sine function that models the initial behavior is y = 0.25
sin 1864 t.
12. f = 1245, a = 0.12
SOLUTION: The general form of the equation is y = a sin bt, where t is the time in seconds. Because the
amplitude is 0.12, = 0.12. This means that a =
±0.12. The period is the reciprocal of the frequency or
. Use this value to find b.
Using the positive values of a and b, one sine function that models the initial behavior is y = 0.12
sin 2490 t.
13. f = 623, a = 0.2
SOLUTION: The general form of the equation is y = a sin bt, where t is the time in seconds. Because the
amplitude is 0.2, = 0.2. This means that a = ±0.2.
The period is the reciprocal of the frequency or
. Use this value to find b.
Using the positive values of a and b, one sine function that models the initial behavior is y = 0.2 sin
1246 t.
State the amplitude, period, frequency, phase shift, and vertical shift of each function. Then graph two periods of the function.
14.
SOLUTION:
In this function, a = 3, b = 1, c = − , and d = 0.
Because d = 0, there is no vertical shift.
Graph y = 3 sin x shifted units to the right.
15.
SOLUTION:
In this function, a = 1, b = , c = , and d = 0.
Because d = 0, there is no vertical shift.
16. y = 0.25 cos x + 3
SOLUTION:
In this function, a = , b = 1, c = 0, and d = 3.
Graph y = cos x shifted 3 units up.
17. y = sin 3x – 2
SOLUTION: In this function, a = 1, b = 3, c = 0, and d = –2.
Graph y = sin 3x shifted 2 units down.
18.
SOLUTION:
In this function, a = 1, b = 1, c = , and d = –1.
.
Graph y = cos x shifted units to the right and 1
unit down.
19.
SOLUTION:
In this function, a = 1, b = 1, c = , and d = 4.
.
Graph y = sin x shifted units to the left and 4 units up.
20. VACATIONS The average number of reservations R that a vacation resort has at the beginning of each month is shown.
a. Write an equation of a sinusoidal function that models the average number of reservations using x =1 to represent January. b. According to your model, approximately how many reservations can the resort anticipate in November?
SOLUTION: a. Make a scatter plot of the data and choose a model.
Sample answer: Use a sinusoidal function of the form y = a cos (bx + c) + d to model the data. First, find the maximum M and minimum m values of the data, and use these values to find a, b, c, and d. The maximum and minimum reservations are 200 and 87, respectively. The amplitude a is half of the distance between these values.
The vertical shift d is the average of the maximum and minimum data values.
There are 3 months between the maximum and minimum, so the period is 6.
The maximum data value occurs when x = 1. Since y = cos x attains its first maximum when x = 0, we must apply a phase shift of 1 unit. Use this value to find c.
Write a function using the values for a, b, c, and d.
Use b =
b. To find the number of reservations in November, evaluate the model for x = 11.
Therefore, the resort can anticipate about 115 reservations in November.
21. TIDES The table shown below provides data for the first high and low tides of the day for a certain bay during one day in June.
a. Determine the amplitude, period, phase shift, and vertical shift of a sinusoidal function that models the height of the tide. Let x represent the number of hours that the high or low tide occurred after midnight. b. Write a sinusoidal function that models the data. c. According to your model, what was the height of
the tide at 8:45 P.M. that night?
SOLUTION: a. Sample answer: Use a sinusoidal function of the form y = a cos (bx + c) + d to model the data. First, find the amplitude a, which is half of the distance between the heights of the high and low tides.
The vertical shift d is the average of the heights of the high and low tides.
A sinusoid completes half of a period in the time thatit takes to go from its maximum to its minimum value. One period is twice this time. The first high tide occurs 6.5 hours before the first low tide, so the period is 13.
The maximum data value occurs when x ≈ 4.417. Since y = cos x attains its first maximum when x = 0,we must apply a phase shift of 4.417 units. Use this value to find c.
b. Write a function using the values for a, b, c, and
d. Use b =
c. To find the height of the water at 8:45 P.M. that
night, evaluate the model for x = 20.75.
Therefore, the tide was about 7.28 feet high at 8:45
P.M. that night.
22. METEOROLOGY The average monthly temperatures for Boston, Massachusetts are shown.
a. Determine the amplitude, period, phase shift, and vertical shift of a sinusoidal function that models the monthly temperatures using x = 1 to represent January. b. Write an equation of a sinusoidal function that models the monthly temperatures. c. According to your model, what is Boston’s average temperature in August?
SOLUTION: a. The maximum and minimum are 74° and 29°, respectively. The amplitude a is half of the distance between these values.
The vertical shift d is the average of the maximum and minimum data values.
A sinusoid completes half of a period in the time thatit takes to go from its maximum to its minimum value. So, one period is twice this time. The
maximum function value occurs in July, so xmax is 7.
The minimum function value occurs in January, so
xmin is 1. The period is 2(6) = 12.
The maximum data value occurs when x = 7. Since y = cos x attains its first maximum when x = 0, we must apply a phase shift of 7 units. Use this value to find c.
b. Using the values for a, b, c, and d from part a, a sinusoidal function that models that monthly temperatures in Boston is
c. To find the average monthly temperature for Boston in August, evaluate the model for x = 8.
Therefore, the average monthly temperature for Boston in August is about 71°F.
GRAPHING CALCULATOR Find the values of x in the interval – < x < that make each equation or inequality true. (Hint: Use the intersection function.)
23. –sin x = cos x
SOLUTION:
Graph y = −sin x and y = cos x on the same graphing
calculator screen on (−π, π). Use the intersect feature under the CALC menu to determine where the two graphs intersect.
The graphs intersect at about −0.7854 or − and
about 2.356 or . Therefore, on –π < x < π, –sin x
= cos x when x = − and .
24. sin x − cos x = 1
SOLUTION:
Graph y = sin x − cos x and y = 1 on the same
graphing calculator screen on (− , ). Use the intersect feature under the CALC menu to determine where the two graphs intersect.
The graphs intersect at about 1.57 or . Therefore,
on – < x < , sin x − cos x = 1 when x = .
25. sin x + cos x = 0
SOLUTION:
Graph y = sin x + cos x on (−π, π). Use the zero feature under the CALC menu to determine the zeros of the function.
There are zeros at about −0.785 or − or and about
2.356 or . Therefore, on – < x < , sin x + cos
x = 0 when
26. cos x ≤ sin x
SOLUTION:
Graph y = cos x and y = sin x on (−π, π). Use the intersect feature under the CALC menu to determine on what interval(s) cos x ≤ sin x.
The graphs intersect at about –2.356 or – and
about 0.785 or . From the graph, it appears that
cos x ≤ sin x on – < x < – and < x < .
27. sin x cos x > 1
SOLUTION:
Graph y = sin x cos x and y = 1 on (− , ). Use the intersect feature under the CALC menu to determine on what interval(s) sin x cos x > 1.
The graphs do not intersect. Therefore, y = sin x cos
x is not greater than y = 1 for any values of x on –< x < .
28. sin x cos x ≤ 0
SOLUTION:
Graph y = sin x cos x on (−π, π). Use the zero feature under the CALC menu to determine on what interval(s) sin x cos x ≤ 0.
The zeros of y = sin x cos x are about –1.57 or ,
0, and about 1.57 or . From the graph, it appears
that sin x cos x ≤ 0 on < x < 0 and < x < .
29. CAROUSELS A wooden horse on a carousel moves up and down as the carousel spins. When the ride ends, the horse usually stops in a vertical position different from where it started. The position y of the horse after t seconds can be modeled by y =1.5 sin (2t + c), where the phase shift c must be continuously adjusted to compensate for the differentstarting positions. If during one ride the horse
reached a maximum height after seconds, find
the equation that models the horse’s position.
SOLUTION: First, find the period of y = 1.5 sin (2t + c).
Since the period is π, the function will reach a
maximum height at radians. The phase shift is the
difference between the horizontal position of the
function at and radians, which is radians.
Substitute and b into the phase shift formula to
find c.
Therefore, the equation is
30. AMUSEMENT PARKS The position y in feet of a passenger cart relative to the center of a Ferris wheel over t seconds is shown below.
a. Find the time t that it takes for the cart to return toy = 0 during its initial spin. b. Find the period of the Ferris wheel. c. Sketch the graph representing the position of the passenger cart over one period. d. Write a sinusoidal function that models the position of the passenger cart as a function of time t.
SOLUTION: a. From the diagram, the height of the cart is 0 ft when t = 0, and reaches a maximum height of 19 feet when t = 3.75 seconds. So, the cart will return to y = 0 after 2(3.75) or 7.5 seconds. b. The cart completes half of a cycle from t = 0 to t = 7.5. So, the period is 2(7.5) or 15 seconds. c.
d. The amplitude a is half of the maximum and
minimum values. So, a =
The vertical shift d is the average of the maximum
and minimum data values. So,
Because the period of a sinusoidal function is
you can write Therefore,
There is no phase shift because the height of the cartwhen t = 0 is 0 feet, and the sine function has a y-intercept of 0. Therefore, one equation that could be used to model
the position of the passenger cart is y = 19 sin t.
Write an equation that corresponds to each graph.
31.
SOLUTION: Sample answer: There is an x-intercept at 0, so one equation that corresponds to this graph is y = a sin (bx + c) + d. Half of the distance from the maximum to the minimum value of the function is 3. So, the amplitudeis 3. It appears that the function completes one period on
[0, π]. Find b.
The midline appears to be at y = 0, so there does not appear to be any vertical shift. Therefore, one equation that corresponds to this graph is y = 3 sin (2x).
32.
SOLUTION:
Sample answer: Because there is a y-intercept at ,
one equation that corresponds to this graph is y = a cos (bx + c) + d. Half of the distance from the maximum to the
minimum value of the function is . So, the
amplitude is .
It appears that the function completes one period on [0, 6π]. Find b.
The midline appears to be at y = 0, so there does not appear to be any vertical shift. Therefore, one
equation that corresponds to this graph is y = cos
.
33.
SOLUTION: Sample answer: Because there is a y-intercept at 3, one equation that corresponds to this graph is y = a cos (bx + c) + d. Half of the distance from the maximum to the
minimum value of the function is 4 ÷ 2 or 2. So, the amplitude is 2. It appears that the function completes one period on
Find b.
The midline appears to be at y = 1, so there is a vertical shift 1 unit up. Therefore, one equation that corresponds to this graph is y = 2 cos 4x + 1.
34.
SOLUTION: Sample answer: There is an x-intercept at 0, so one equation that corresponds to this graph is y = a sin (bx + c) + d. Half of the distance from the maximum to the
minimum value of the function is 8 ÷ 2 or 4. So, the amplitude is 4. It appears that the function completes one period on [0, 4π]. Find b.
The midline appears to be at y = −2, so there is a vertical shift of 2 units down. Therefore, one equation that corresponds to this graph is y = 4 sin
− 2.
Write a sinusoidal function with the given period and amplitude that passes through the given point.
35. period: ; amplitude: 5; point:
SOLUTION: Use the period to find b.
Sample answer: One sinusoidal function in which a =5 and b = 2 is y = 5 cos 2x. Evaluate the function for
The function passes through . Therefore, a
sinusoidal function with period π and amplitude 5 that
passes through the point is y = 5 cos 2x.
36. period: 4 ; amplitude: 2; point: ( , 2)
SOLUTION: Use the period to find b.
Sample answer: One sinusoidal function in which a =
2 and b = is y = 2 sin . Evaluate the function
for x = π.
The function passes through ( , 2). Therefore, a
sinusoidal function with period 4π and amplitude 2
that passes through the point ( , 2) is y = 2 sin .
37. period: ; amplitude: ; point:
SOLUTION: Use the period to find b.
Sample answer: One sinusoidal function in which a =1.5 and b = 4 is y = 1.5 cos 4x. Evaluate the function
for
The function passes through . Therefore, a
sinusoidal function with period and amplitude 1.5
that passes through the point is y = 1.5 cos
4x.
38. period: 3π; amplitude: ; point:
SOLUTION: Use the period to find b.
Sample answer: One sinusoidal function in which a =
0.5 and b = is y = sin x. Evaluate the
function for
The function passes through . Therefore, a
sinusoidal function with period 3π and amplitude 0.5
that passes through the point is y = sin
x.
39. MULTIPLE REPRESENTATIONS In this problem, you will investigate the change in the graph of a sinusoidal function of the form y = sin x or y = cos x when multiplied by a polynomial function. a. GRAPHICAL Use a graphing calculator to sketch the graphs of y = 2x, y = –2x, and y = 2x cos x on the same coordinate plane, on the interval [–20, 20]. b. VERBAL Describe the behavior of the graph of y = 2x cos x in relation to the graphs of y = 2x and y = –2x. c. GRAPHICAL Use a graphing calculator to
sketch the graphs of y = x2, y = –x
2, and y = x
2 sin x
on the same coordinate plane, on the interval [–20, 20]. d. VERBAL Describe the behavior of the graph of
y = x2 sin x in relation to the graphs of y = x
2 and y
= –x2.
e. ANALYTICAL Make a conjecture as to the behavior of the graph of a sinusoidal function of the form y = sin x or y = cos x when multiplied by polynomial function of the form y = f (x).
SOLUTION: a.
b. The graph of y = 2x cos x oscillates between the graphs of y = 2x and y = –2x. c.
d. The graph of y = x2 sin x oscillates between the
graphs of y = x2 and y = –x
2.
e . The graph of y = f (x) sin x or y = f (x) cos x will oscillate between the graphs of y = f (x) and y = –f(x).
40. CHALLENGE Without graphing, find the exact coordinates of the first maximum point to the right of
the y-axis for
SOLUTION:
First, find the phase shift for
Next, find the period of the function.
The first maximum for one period can be found by
finding So, incorporating the phase shift, the
first maximum to the right of the y-axis is
. Because the amplitude is |4| = 4,
the maximum point is
REASONING Determine whether each statement is true or false . Explain your reasoning.
41. Every sine function of the form y = a sin (bx + c) + d can be written as a cosine function of the form y =a cos (bx + c) + d.
SOLUTION: It is true that every sine function of the form y = a sin (bx + c) + d can be written as a cosine function of the form y = a cos (bx + c) + d. The graph of cosine is a horizontal translation of the sine graph. Therefore, a cosine function can be written from any sine function using the same amplitude and period by applying the necessary phase shift.
For example, consider and
. Phase shift by
to obtain .
42. The period of f (x) = cos 8x is equal to four times the period of g(x) = cos 2x.
SOLUTION: Find the period of f (x) = cos 8x.
Find the period of g(x) = cos 2x.
Four times the period of g(x) = cos 2x is 4 ⋅ or
4 . So, the period of f (x) is the period of g(x).
Therefore, the statement is false.
43. CHALLENGE How many zeros does y = cos
1500x have on the interval 0 ≤ x ≤ 2 ?
SOLUTION: Find the period of y = cos 1500x.
Graph y = cos 1500x on .
The graph of y = cos 1500x has two x-intercepts for one cycle, so the function has 2 zeros per cycle. Find
the number of cycles for y = cos 1500x on [0, 2 ].
So, the graph of y = cos 1500x will complete 1500
cycles on [0, 2 ]. Because there are two zeros per cycle, y = cos 1500x will have 1500(2) or 3000 zeros
on [0, 2 ].
44. PROOF Prove the phase shift formula.
SOLUTION:
Consider y = a sin (bx + c), where a , b, and c ≠ 0. To find a zero of the function, find the value of x for which a sin (bx + c) = 0. Since sin 0 = 0, solving bx + c = 0 will yield a zero of the function.
Therefore, y = 0 when . The value of is
the phase shift. When c > 0: The graph of y = a sin (bx + c) is the
graph of y = a sin x, shifted units to the left.
When c < 0: The graph of y = a sin (bx + c) is the
graph of y = a sin x, shifted units to the right.
Consider the graph of y = cos x below in blue. In this equation a = 1, b = 1 and c = 0. One zero of y = cos x is . The green graph is shifted to the
left. Thus c is – . Then the shifted equation will be
.
45. Writing in Math The Power Tower ride in Sandusky, Ohio, is shown below. Along the side of each tower is a string of lights that send a continuouspulse of light up and down each tower at a constant rate. Explain why the distance d of this light from theground over time t cannot be represented by a sinusoidal function.
SOLUTION: Sample answer: Although the pulse of light can be represented as a function with a period, it is not a sinusoidal function because the distance the pulse of light is from the ground changes at a constant rate. As a result, the graph of this function would resemble the graph below.
The given point lies on the terminal side of an angle θ in standard position. Find the values of
the six trigonometric functions of θ. 46. (−4, 4)
SOLUTION: Use the values of x and y to find r.
Use x = –4, y = 4, and r = to write the six trigonometric ratios.
47. (8, −2)
SOLUTION: Use the values of x and y to find r.
Use x = 8, y = –2, and r = to write the six trigonometric ratios.
48. (−5, −9)
SOLUTION: Use the values of x and y to find r.
Use x = –5, y = – 9, and r = to write the six trigonometric ratios.
49. (4, 5)
SOLUTION: Use the values of x and y to find r.
Use x = 4, y = 5, and r = to write the six trigonometric ratios.
Write each degree measure in radians as a multiple of π and each radian measure in degrees.
50. 25°
SOLUTION: To convert a degree measure to radians, multiply by
51. −420°
SOLUTION: To convert a degree measure to radians, multiply by
52.
SOLUTION: To convert a radian measure to degrees, multiply by
53.
SOLUTION: To convert a radian measure to degrees, multiply by
54. SCIENCE Radiocarbon dating is a method of estimating the age of an organic material by calculating the amount of carbon-14 present in the material. The age of a material can be calculated
using A = t , where A is the age of the
object in years, t is the half-life of carbon-14 or 5700 years, and R is the ratio of the amount of carbon-14 in the sample to the amount of carbon-14 in living tissue. a. A sample of organic material contains 0.000076 gram of carbon-14. A living sample of the same
eSolutions Manual - Powered by Cognero Page 14
4-4 Graphing Sine and Cosine Functions
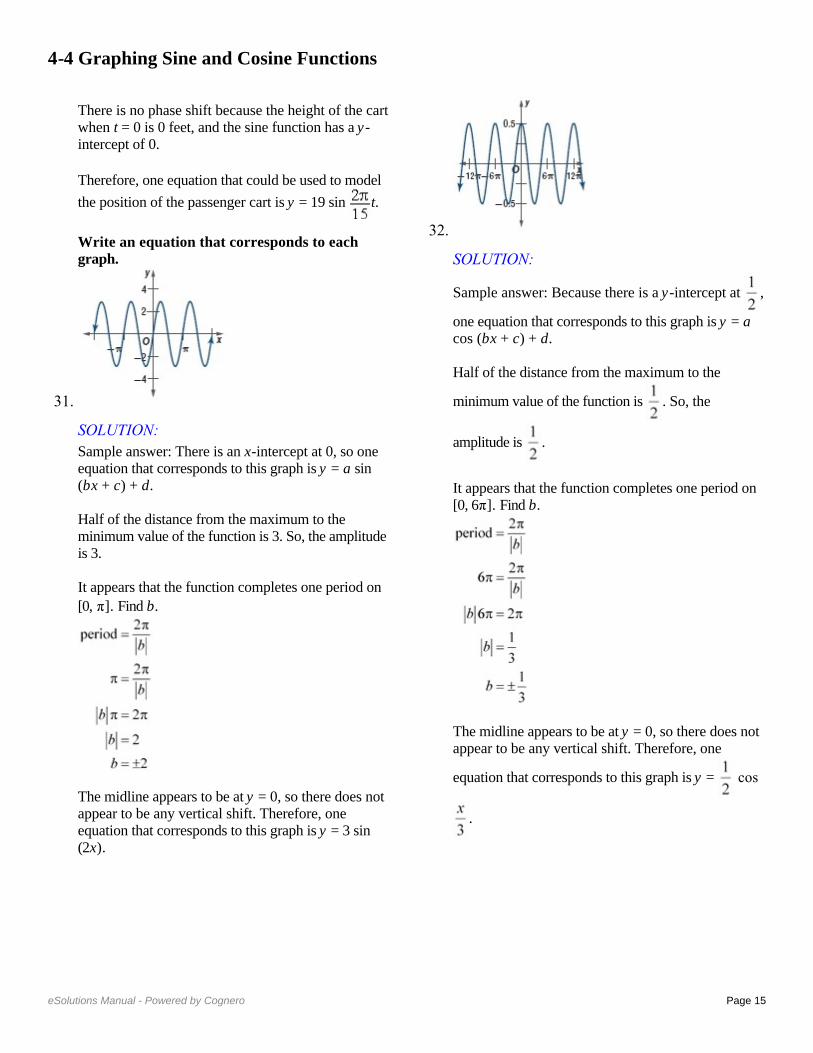
Describe how the graphs of f (x) and g (x) are related. Then find the amplitude of g (x), and sketch two periods of both functions on the same coordinate axes.
1. f (x) = sin x; g(x) = sin x
SOLUTION: The graph of g(x) is the graph of f (x) compressed
vertically. The amplitude of g(x) is or .
Create a table listing the coordinates of the x-intercepts and extrema for f (x) = sin x for one
period, 2 , on the interval [0, 2 ]. Then use the amplitude of g(x) to find corresponding points on its graph.
Sketch the curve through the indicated points for each function. Then repeat the pattern to complete asecond period.
Functions f (x) = sin x g(x) = sin x
x-int (0, 0) (0, 0)
Max
x-int
Min
x-int
2.
SOLUTION: The graph of g(x) is the graph of f (x) compressed
vertically. The amplitude of g(x) is or .
Create a table listing the coordinates of the x-intercepts and extrema for f (x) = cos x for one
period, 2 , on the interval [0, 2 ]. Then use the amplitude of g(x) to find corresponding points on its graph.
Sketch the curve through the indicated points for each function. Then repeat the pattern to complete asecond period.
Function f (x) = cos x
Max (0, 1)
x-int Min
x-in
Min
x-int
Function f (x) = cos x
Max x-int
Min
x-in
Min
x-int
3. f (x) = cos x; g(x) = 6 cos x
SOLUTION: The graph of g(x) is the graph of f (x) expanded
vertically. The amplitude of g(x) is or 6.
Create a table listing the coordinates of the x-intercepts and extrema for f (x) = cos x for one
period, 2 , on the interval [0, 2 ]. Then use the amplitude of g(x) to find corresponding points on its graph.
Sketch the curve through the indicated points for each function. Then repeat the pattern to complete asecond period.
Functions f (x) = cos x g(x) = 6 cos x
Max (0, 1) (0, 6)
x-int
Min
x-int
Max
4. f (x) = sin x; g(x) = −8 sin x
SOLUTION: The graph of g(x) is the graph of f (x) expanded
vertically. The amplitude of g(x) is or 8.
Create a table listing the coordinates of the x-intercepts and extrema for f (x) = sin x for one
period, 2 , on the interval [0, 2 ]. Then use the amplitude of g(x) to find corresponding points on its graph.
Sketch the curve through the indicated points for each function. Then repeat the pattern to complete asecond period.
Function f (x) = sin x
x-int (0, 0)
Max
x-int
Min
x-int
Function g(x) = −8
sin x
x-int (0, 0)
Min
x-int
Max
x-int
Describe how the graphs of f (x) and g (x) are related. Then find the period of g (x), and sketch at least one period of both functions on the same coordinate axes.
5. f (x) = sin x; g(x) = sin 4x
SOLUTION: The graph of g(x) is the graph of f (x) compressed
horizontally. The period of g(x) is . To find
corresponding points on the graph of g(x), change the x-coordinates of those key points on f (x) so that
they range from 0 to , increasing by increments of
.
Sketch the curve through the indicated points for each function. Then repeat the pattern to complete asecond period.
Functions f (x) = sin x g(x) = sin
4x
x-int (0, 0) (0, 0)
Max
x-int
Min
x-int
6. f (x) = cos x; g(x) = cos 2x
SOLUTION: The graph of g(x) is the graph of f (x) compressed
horizontally. The period of g(x) is or . To find
corresponding points on the graph of g(x), change the x-coordinates of those key points on f (x) so that
they range from 0 to , increasing by increments of
.
Sketch the curve through the indicated points for each function. Then repeat the pattern to complete asecond period.
Functions f (x) = cos x g(x) = cos 2x
Max (0, 1) (0, 1)
x-int
Min
x-int
Max
7. f (x) = cos x;
SOLUTION: The graph of g(x) is the graph of f (x) expanded
horizontally. The period of g(x) is . To
find corresponding points on the graph of g(x), change the x-coordinates of those key points on f (x)
so that they range from 0 to , increasing by
increments of or .
Sketch the curve through the indicated points for each function. Then repeat the pattern to complete asecond period.
Functions f (x) = cos x
Max (0, 1) (0, 1)
x-int
Min
x-int
Max
8. f (x) = sin x;
SOLUTION: The graph of g(x) is the graph of f (x) expanded
horizontally. The period of g(x) is . To find corresponding points on the graph of g(x), change the x-coordinates of those key points on f (x) so that they range from 0 to , increasing by increments of
or .
Sketch the curve through the indicated points for each function. Then repeat the pattern to complete asecond period.
Functions f (x) = sin x
x-int (0, 0) (0, 0)
Max
x-int
Min
x-int
9. VOICES The contralto vocal type includes the deepest female singing voice. Some contraltos can sing as low as the E below middle C (E3), which hasa frequency of 165 hertz. Write an equation for a sine function that models the initial behavior of the sound wave associated with E3 having an amplitude of 0.15.
SOLUTION: The general form of the equation will be y = a sin bt,where t is the time in seconds. Because the
amplitude is 0.15, |a|= 0.15. This means that a = ±0.15. The period is the reciprocal of the frequency or
. Use this value to find b.
Sample answer: One sine function that models the
initial behavior is y = 0.15 sin 330 t.
Write a sine function that can be used to model the initial behavior of a sound wave with the frequency and amplitude given.
10. f = 440, a = 0.3
SOLUTION: The general form of the equation is y = a sin bt, where t is the time in seconds. Because the
amplitude is 0.3, = 0.3. This means that a = ±0.3.
The period is the reciprocal of the frequency or
. Use this value to find b.
Using the positive values of a and b, one sine function that models the initial behavior is y = 0.3 sin
880 t.
11. f = 932, a = 0.25
SOLUTION: The general form of the equation is y = a sin bt, where t is the time in seconds. Because the
amplitude is 0.25, = 0.25. This means that a =
±0.25. The period is the reciprocal of the frequency
or . Use this value to find b.
Using the positive values of a and b, one sine function that models the initial behavior is y = 0.25
sin 1864 t.
12. f = 1245, a = 0.12
SOLUTION: The general form of the equation is y = a sin bt, where t is the time in seconds. Because the
amplitude is 0.12, = 0.12. This means that a =
±0.12. The period is the reciprocal of the frequency or
. Use this value to find b.
Using the positive values of a and b, one sine function that models the initial behavior is y = 0.12
sin 2490 t.
13. f = 623, a = 0.2
SOLUTION: The general form of the equation is y = a sin bt, where t is the time in seconds. Because the
amplitude is 0.2, = 0.2. This means that a = ±0.2.
The period is the reciprocal of the frequency or
. Use this value to find b.
Using the positive values of a and b, one sine function that models the initial behavior is y = 0.2 sin
1246 t.
State the amplitude, period, frequency, phase shift, and vertical shift of each function. Then graph two periods of the function.
14.
SOLUTION:
In this function, a = 3, b = 1, c = − , and d = 0.
Because d = 0, there is no vertical shift.
Graph y = 3 sin x shifted units to the right.
15.
SOLUTION:
In this function, a = 1, b = , c = , and d = 0.
Because d = 0, there is no vertical shift.
16. y = 0.25 cos x + 3
SOLUTION:
In this function, a = , b = 1, c = 0, and d = 3.
Graph y = cos x shifted 3 units up.
17. y = sin 3x – 2
SOLUTION: In this function, a = 1, b = 3, c = 0, and d = –2.
Graph y = sin 3x shifted 2 units down.
18.
SOLUTION:
In this function, a = 1, b = 1, c = , and d = –1.
.
Graph y = cos x shifted units to the right and 1
unit down.
19.
SOLUTION:
In this function, a = 1, b = 1, c = , and d = 4.
.
Graph y = sin x shifted units to the left and 4 units up.
20. VACATIONS The average number of reservations R that a vacation resort has at the beginning of each month is shown.
a. Write an equation of a sinusoidal function that models the average number of reservations using x =1 to represent January. b. According to your model, approximately how many reservations can the resort anticipate in November?
SOLUTION: a. Make a scatter plot of the data and choose a model.
Sample answer: Use a sinusoidal function of the form y = a cos (bx + c) + d to model the data. First, find the maximum M and minimum m values of the data, and use these values to find a, b, c, and d. The maximum and minimum reservations are 200 and 87, respectively. The amplitude a is half of the distance between these values.
The vertical shift d is the average of the maximum and minimum data values.
There are 3 months between the maximum and minimum, so the period is 6.
The maximum data value occurs when x = 1. Since y = cos x attains its first maximum when x = 0, we must apply a phase shift of 1 unit. Use this value to find c.
Write a function using the values for a, b, c, and d.
Use b =
b. To find the number of reservations in November, evaluate the model for x = 11.
Therefore, the resort can anticipate about 115 reservations in November.
21. TIDES The table shown below provides data for the first high and low tides of the day for a certain bay during one day in June.
a. Determine the amplitude, period, phase shift, and vertical shift of a sinusoidal function that models the height of the tide. Let x represent the number of hours that the high or low tide occurred after midnight. b. Write a sinusoidal function that models the data. c. According to your model, what was the height of
the tide at 8:45 P.M. that night?
SOLUTION: a. Sample answer: Use a sinusoidal function of the form y = a cos (bx + c) + d to model the data. First, find the amplitude a, which is half of the distance between the heights of the high and low tides.
The vertical shift d is the average of the heights of the high and low tides.
A sinusoid completes half of a period in the time thatit takes to go from its maximum to its minimum value. One period is twice this time. The first high tide occurs 6.5 hours before the first low tide, so the period is 13.
The maximum data value occurs when x ≈ 4.417. Since y = cos x attains its first maximum when x = 0,we must apply a phase shift of 4.417 units. Use this value to find c.
b. Write a function using the values for a, b, c, and
d. Use b =
c. To find the height of the water at 8:45 P.M. that
night, evaluate the model for x = 20.75.
Therefore, the tide was about 7.28 feet high at 8:45
P.M. that night.
22. METEOROLOGY The average monthly temperatures for Boston, Massachusetts are shown.
a. Determine the amplitude, period, phase shift, and vertical shift of a sinusoidal function that models the monthly temperatures using x = 1 to represent January. b. Write an equation of a sinusoidal function that models the monthly temperatures. c. According to your model, what is Boston’s average temperature in August?
SOLUTION: a. The maximum and minimum are 74° and 29°, respectively. The amplitude a is half of the distance between these values.
The vertical shift d is the average of the maximum and minimum data values.
A sinusoid completes half of a period in the time thatit takes to go from its maximum to its minimum value. So, one period is twice this time. The
maximum function value occurs in July, so xmax is 7.
The minimum function value occurs in January, so
xmin is 1. The period is 2(6) = 12.
The maximum data value occurs when x = 7. Since y = cos x attains its first maximum when x = 0, we must apply a phase shift of 7 units. Use this value to find c.
b. Using the values for a, b, c, and d from part a, a sinusoidal function that models that monthly temperatures in Boston is
c. To find the average monthly temperature for Boston in August, evaluate the model for x = 8.
Therefore, the average monthly temperature for Boston in August is about 71°F.
GRAPHING CALCULATOR Find the values of x in the interval – < x < that make each equation or inequality true. (Hint: Use the intersection function.)
23. –sin x = cos x
SOLUTION:
Graph y = −sin x and y = cos x on the same graphing
calculator screen on (−π, π). Use the intersect feature under the CALC menu to determine where the two graphs intersect.
The graphs intersect at about −0.7854 or − and
about 2.356 or . Therefore, on –π < x < π, –sin x
= cos x when x = − and .
24. sin x − cos x = 1
SOLUTION:
Graph y = sin x − cos x and y = 1 on the same
graphing calculator screen on (− , ). Use the intersect feature under the CALC menu to determine where the two graphs intersect.
The graphs intersect at about 1.57 or . Therefore,
on – < x < , sin x − cos x = 1 when x = .
25. sin x + cos x = 0
SOLUTION:
Graph y = sin x + cos x on (−π, π). Use the zero feature under the CALC menu to determine the zeros of the function.
There are zeros at about −0.785 or − or and about
2.356 or . Therefore, on – < x < , sin x + cos
x = 0 when
26. cos x ≤ sin x
SOLUTION:
Graph y = cos x and y = sin x on (−π, π). Use the intersect feature under the CALC menu to determine on what interval(s) cos x ≤ sin x.
The graphs intersect at about –2.356 or – and
about 0.785 or . From the graph, it appears that
cos x ≤ sin x on – < x < – and < x < .
27. sin x cos x > 1
SOLUTION:
Graph y = sin x cos x and y = 1 on (− , ). Use the intersect feature under the CALC menu to determine on what interval(s) sin x cos x > 1.
The graphs do not intersect. Therefore, y = sin x cos
x is not greater than y = 1 for any values of x on –< x < .
28. sin x cos x ≤ 0
SOLUTION:
Graph y = sin x cos x on (−π, π). Use the zero feature under the CALC menu to determine on what interval(s) sin x cos x ≤ 0.
The zeros of y = sin x cos x are about –1.57 or ,
0, and about 1.57 or . From the graph, it appears
that sin x cos x ≤ 0 on < x < 0 and < x < .
29. CAROUSELS A wooden horse on a carousel moves up and down as the carousel spins. When the ride ends, the horse usually stops in a vertical position different from where it started. The position y of the horse after t seconds can be modeled by y =1.5 sin (2t + c), where the phase shift c must be continuously adjusted to compensate for the differentstarting positions. If during one ride the horse
reached a maximum height after seconds, find
the equation that models the horse’s position.
SOLUTION: First, find the period of y = 1.5 sin (2t + c).
Since the period is π, the function will reach a
maximum height at radians. The phase shift is the
difference between the horizontal position of the
function at and radians, which is radians.
Substitute and b into the phase shift formula to
find c.
Therefore, the equation is
30. AMUSEMENT PARKS The position y in feet of a passenger cart relative to the center of a Ferris wheel over t seconds is shown below.
a. Find the time t that it takes for the cart to return toy = 0 during its initial spin. b. Find the period of the Ferris wheel. c. Sketch the graph representing the position of the passenger cart over one period. d. Write a sinusoidal function that models the position of the passenger cart as a function of time t.
SOLUTION: a. From the diagram, the height of the cart is 0 ft when t = 0, and reaches a maximum height of 19 feet when t = 3.75 seconds. So, the cart will return to y = 0 after 2(3.75) or 7.5 seconds. b. The cart completes half of a cycle from t = 0 to t = 7.5. So, the period is 2(7.5) or 15 seconds. c.
d. The amplitude a is half of the maximum and
minimum values. So, a =
The vertical shift d is the average of the maximum
and minimum data values. So,
Because the period of a sinusoidal function is
you can write Therefore,
There is no phase shift because the height of the cartwhen t = 0 is 0 feet, and the sine function has a y-intercept of 0. Therefore, one equation that could be used to model
the position of the passenger cart is y = 19 sin t.
Write an equation that corresponds to each graph.
31.
SOLUTION: Sample answer: There is an x-intercept at 0, so one equation that corresponds to this graph is y = a sin (bx + c) + d. Half of the distance from the maximum to the minimum value of the function is 3. So, the amplitudeis 3. It appears that the function completes one period on
[0, π]. Find b.
The midline appears to be at y = 0, so there does not appear to be any vertical shift. Therefore, one equation that corresponds to this graph is y = 3 sin (2x).
32.
SOLUTION:
Sample answer: Because there is a y-intercept at ,
one equation that corresponds to this graph is y = a cos (bx + c) + d. Half of the distance from the maximum to the
minimum value of the function is . So, the
amplitude is .
It appears that the function completes one period on [0, 6π]. Find b.
The midline appears to be at y = 0, so there does not appear to be any vertical shift. Therefore, one
equation that corresponds to this graph is y = cos
.
33.
SOLUTION: Sample answer: Because there is a y-intercept at 3, one equation that corresponds to this graph is y = a cos (bx + c) + d. Half of the distance from the maximum to the
minimum value of the function is 4 ÷ 2 or 2. So, the amplitude is 2. It appears that the function completes one period on
Find b.
The midline appears to be at y = 1, so there is a vertical shift 1 unit up. Therefore, one equation that corresponds to this graph is y = 2 cos 4x + 1.
34.
SOLUTION: Sample answer: There is an x-intercept at 0, so one equation that corresponds to this graph is y = a sin (bx + c) + d. Half of the distance from the maximum to the
minimum value of the function is 8 ÷ 2 or 4. So, the amplitude is 4. It appears that the function completes one period on [0, 4π]. Find b.
The midline appears to be at y = −2, so there is a vertical shift of 2 units down. Therefore, one equation that corresponds to this graph is y = 4 sin
− 2.
Write a sinusoidal function with the given period and amplitude that passes through the given point.
35. period: ; amplitude: 5; point:
SOLUTION: Use the period to find b.
Sample answer: One sinusoidal function in which a =5 and b = 2 is y = 5 cos 2x. Evaluate the function for
The function passes through . Therefore, a
sinusoidal function with period π and amplitude 5 that
passes through the point is y = 5 cos 2x.
36. period: 4 ; amplitude: 2; point: ( , 2)
SOLUTION: Use the period to find b.
Sample answer: One sinusoidal function in which a =
2 and b = is y = 2 sin . Evaluate the function
for x = π.
The function passes through ( , 2). Therefore, a
sinusoidal function with period 4π and amplitude 2
that passes through the point ( , 2) is y = 2 sin .
37. period: ; amplitude: ; point:
SOLUTION: Use the period to find b.
Sample answer: One sinusoidal function in which a =1.5 and b = 4 is y = 1.5 cos 4x. Evaluate the function
for
The function passes through . Therefore, a
sinusoidal function with period and amplitude 1.5
that passes through the point is y = 1.5 cos
4x.
38. period: 3π; amplitude: ; point:
SOLUTION: Use the period to find b.
Sample answer: One sinusoidal function in which a =
0.5 and b = is y = sin x. Evaluate the
function for
The function passes through . Therefore, a
sinusoidal function with period 3π and amplitude 0.5
that passes through the point is y = sin
x.
39. MULTIPLE REPRESENTATIONS In this problem, you will investigate the change in the graph of a sinusoidal function of the form y = sin x or y = cos x when multiplied by a polynomial function. a. GRAPHICAL Use a graphing calculator to sketch the graphs of y = 2x, y = –2x, and y = 2x cos x on the same coordinate plane, on the interval [–20, 20]. b. VERBAL Describe the behavior of the graph of y = 2x cos x in relation to the graphs of y = 2x and y = –2x. c. GRAPHICAL Use a graphing calculator to
sketch the graphs of y = x2, y = –x
2, and y = x
2 sin x
on the same coordinate plane, on the interval [–20, 20]. d. VERBAL Describe the behavior of the graph of
y = x2 sin x in relation to the graphs of y = x
2 and y
= –x2.
e. ANALYTICAL Make a conjecture as to the behavior of the graph of a sinusoidal function of the form y = sin x or y = cos x when multiplied by polynomial function of the form y = f (x).
SOLUTION: a.
b. The graph of y = 2x cos x oscillates between the graphs of y = 2x and y = –2x. c.
d. The graph of y = x2 sin x oscillates between the
graphs of y = x2 and y = –x
2.
e . The graph of y = f (x) sin x or y = f (x) cos x will oscillate between the graphs of y = f (x) and y = –f(x).
40. CHALLENGE Without graphing, find the exact coordinates of the first maximum point to the right of
the y-axis for
SOLUTION:
First, find the phase shift for
Next, find the period of the function.
The first maximum for one period can be found by
finding So, incorporating the phase shift, the
first maximum to the right of the y-axis is
. Because the amplitude is |4| = 4,
the maximum point is
REASONING Determine whether each statement is true or false . Explain your reasoning.
41. Every sine function of the form y = a sin (bx + c) + d can be written as a cosine function of the form y =a cos (bx + c) + d.
SOLUTION: It is true that every sine function of the form y = a sin (bx + c) + d can be written as a cosine function of the form y = a cos (bx + c) + d. The graph of cosine is a horizontal translation of the sine graph. Therefore, a cosine function can be written from any sine function using the same amplitude and period by applying the necessary phase shift.
For example, consider and
. Phase shift by
to obtain .
42. The period of f (x) = cos 8x is equal to four times the period of g(x) = cos 2x.
SOLUTION: Find the period of f (x) = cos 8x.
Find the period of g(x) = cos 2x.
Four times the period of g(x) = cos 2x is 4 ⋅ or
4 . So, the period of f (x) is the period of g(x).
Therefore, the statement is false.
43. CHALLENGE How many zeros does y = cos
1500x have on the interval 0 ≤ x ≤ 2 ?
SOLUTION: Find the period of y = cos 1500x.
Graph y = cos 1500x on .
The graph of y = cos 1500x has two x-intercepts for one cycle, so the function has 2 zeros per cycle. Find
the number of cycles for y = cos 1500x on [0, 2 ].
So, the graph of y = cos 1500x will complete 1500
cycles on [0, 2 ]. Because there are two zeros per cycle, y = cos 1500x will have 1500(2) or 3000 zeros
on [0, 2 ].
44. PROOF Prove the phase shift formula.
SOLUTION:
Consider y = a sin (bx + c), where a , b, and c ≠ 0. To find a zero of the function, find the value of x for which a sin (bx + c) = 0. Since sin 0 = 0, solving bx + c = 0 will yield a zero of the function.
Therefore, y = 0 when . The value of is
the phase shift. When c > 0: The graph of y = a sin (bx + c) is the
graph of y = a sin x, shifted units to the left.
When c < 0: The graph of y = a sin (bx + c) is the
graph of y = a sin x, shifted units to the right.
Consider the graph of y = cos x below in blue. In this equation a = 1, b = 1 and c = 0. One zero of y = cos x is . The green graph is shifted to the
left. Thus c is – . Then the shifted equation will be
.
45. Writing in Math The Power Tower ride in Sandusky, Ohio, is shown below. Along the side of each tower is a string of lights that send a continuouspulse of light up and down each tower at a constant rate. Explain why the distance d of this light from theground over time t cannot be represented by a sinusoidal function.
SOLUTION: Sample answer: Although the pulse of light can be represented as a function with a period, it is not a sinusoidal function because the distance the pulse of light is from the ground changes at a constant rate. As a result, the graph of this function would resemble the graph below.
The given point lies on the terminal side of an angle θ in standard position. Find the values of
the six trigonometric functions of θ. 46. (−4, 4)
SOLUTION: Use the values of x and y to find r.
Use x = –4, y = 4, and r = to write the six trigonometric ratios.
47. (8, −2)
SOLUTION: Use the values of x and y to find r.
Use x = 8, y = –2, and r = to write the six trigonometric ratios.
48. (−5, −9)
SOLUTION: Use the values of x and y to find r.
Use x = –5, y = – 9, and r = to write the six trigonometric ratios.
49. (4, 5)
SOLUTION: Use the values of x and y to find r.
Use x = 4, y = 5, and r = to write the six trigonometric ratios.
Write each degree measure in radians as a multiple of π and each radian measure in degrees.
50. 25°
SOLUTION: To convert a degree measure to radians, multiply by
51. −420°
SOLUTION: To convert a degree measure to radians, multiply by
52.
SOLUTION: To convert a radian measure to degrees, multiply by
53.
SOLUTION: To convert a radian measure to degrees, multiply by
54. SCIENCE Radiocarbon dating is a method of estimating the age of an organic material by calculating the amount of carbon-14 present in the material. The age of a material can be calculated
using A = t , where A is the age of the
object in years, t is the half-life of carbon-14 or 5700 years, and R is the ratio of the amount of carbon-14 in the sample to the amount of carbon-14 in living tissue. a. A sample of organic material contains 0.000076 gram of carbon-14. A living sample of the same
Describe how the graphs of f (x) and g (x) are related. Then find the amplitude of g (x), and sketch two periods of both functions on the same coordinate axes.
1. f (x) = sin x; g(x) = sin x
SOLUTION: The graph of g(x) is the graph of f (x) compressed
vertically. The amplitude of g(x) is or .
Create a table listing the coordinates of the x-intercepts and extrema for f (x) = sin x for one
period, 2 , on the interval [0, 2 ]. Then use the amplitude of g(x) to find corresponding points on its graph.
Sketch the curve through the indicated points for each function. Then repeat the pattern to complete asecond period.
Functions f (x) = sin x g(x) = sin x
x-int (0, 0) (0, 0)
Max
x-int
Min
x-int
2.
SOLUTION: The graph of g(x) is the graph of f (x) compressed
vertically. The amplitude of g(x) is or .
Create a table listing the coordinates of the x-intercepts and extrema for f (x) = cos x for one
period, 2 , on the interval [0, 2 ]. Then use the amplitude of g(x) to find corresponding points on its graph.
Sketch the curve through the indicated points for each function. Then repeat the pattern to complete asecond period.
Function f (x) = cos x
Max (0, 1)
x-int Min
x-in
Min
x-int
Function f (x) = cos x
Max x-int
Min
x-in
Min
x-int
3. f (x) = cos x; g(x) = 6 cos x
SOLUTION: The graph of g(x) is the graph of f (x) expanded
vertically. The amplitude of g(x) is or 6.
Create a table listing the coordinates of the x-intercepts and extrema for f (x) = cos x for one
period, 2 , on the interval [0, 2 ]. Then use the amplitude of g(x) to find corresponding points on its graph.
Sketch the curve through the indicated points for each function. Then repeat the pattern to complete asecond period.
Functions f (x) = cos x g(x) = 6 cos x
Max (0, 1) (0, 6)
x-int
Min
x-int
Max
4. f (x) = sin x; g(x) = −8 sin x
SOLUTION: The graph of g(x) is the graph of f (x) expanded
vertically. The amplitude of g(x) is or 8.
Create a table listing the coordinates of the x-intercepts and extrema for f (x) = sin x for one
period, 2 , on the interval [0, 2 ]. Then use the amplitude of g(x) to find corresponding points on its graph.
Sketch the curve through the indicated points for each function. Then repeat the pattern to complete asecond period.
Function f (x) = sin x
x-int (0, 0)
Max
x-int
Min
x-int
Function g(x) = −8
sin x
x-int (0, 0)
Min
x-int
Max
x-int
Describe how the graphs of f (x) and g (x) are related. Then find the period of g (x), and sketch at least one period of both functions on the same coordinate axes.
5. f (x) = sin x; g(x) = sin 4x
SOLUTION: The graph of g(x) is the graph of f (x) compressed
horizontally. The period of g(x) is . To find
corresponding points on the graph of g(x), change the x-coordinates of those key points on f (x) so that
they range from 0 to , increasing by increments of
.
Sketch the curve through the indicated points for each function. Then repeat the pattern to complete asecond period.
Functions f (x) = sin x g(x) = sin
4x
x-int (0, 0) (0, 0)
Max
x-int
Min
x-int
6. f (x) = cos x; g(x) = cos 2x
SOLUTION: The graph of g(x) is the graph of f (x) compressed
horizontally. The period of g(x) is or . To find
corresponding points on the graph of g(x), change the x-coordinates of those key points on f (x) so that
they range from 0 to , increasing by increments of
.
Sketch the curve through the indicated points for each function. Then repeat the pattern to complete asecond period.
Functions f (x) = cos x g(x) = cos 2x
Max (0, 1) (0, 1)
x-int
Min
x-int
Max
7. f (x) = cos x;
SOLUTION: The graph of g(x) is the graph of f (x) expanded
horizontally. The period of g(x) is . To
find corresponding points on the graph of g(x), change the x-coordinates of those key points on f (x)
so that they range from 0 to , increasing by
increments of or .
Sketch the curve through the indicated points for each function. Then repeat the pattern to complete asecond period.
Functions f (x) = cos x
Max (0, 1) (0, 1)
x-int
Min
x-int
Max
8. f (x) = sin x;
SOLUTION: The graph of g(x) is the graph of f (x) expanded
horizontally. The period of g(x) is . To find corresponding points on the graph of g(x), change the x-coordinates of those key points on f (x) so that they range from 0 to , increasing by increments of
or .
Sketch the curve through the indicated points for each function. Then repeat the pattern to complete asecond period.
Functions f (x) = sin x
x-int (0, 0) (0, 0)
Max
x-int
Min
x-int
9. VOICES The contralto vocal type includes the deepest female singing voice. Some contraltos can sing as low as the E below middle C (E3), which hasa frequency of 165 hertz. Write an equation for a sine function that models the initial behavior of the sound wave associated with E3 having an amplitude of 0.15.
SOLUTION: The general form of the equation will be y = a sin bt,where t is the time in seconds. Because the
amplitude is 0.15, |a|= 0.15. This means that a = ±0.15. The period is the reciprocal of the frequency or
. Use this value to find b.
Sample answer: One sine function that models the
initial behavior is y = 0.15 sin 330 t.
Write a sine function that can be used to model the initial behavior of a sound wave with the frequency and amplitude given.
10. f = 440, a = 0.3
SOLUTION: The general form of the equation is y = a sin bt, where t is the time in seconds. Because the
amplitude is 0.3, = 0.3. This means that a = ±0.3.
The period is the reciprocal of the frequency or
. Use this value to find b.
Using the positive values of a and b, one sine function that models the initial behavior is y = 0.3 sin
880 t.
11. f = 932, a = 0.25
SOLUTION: The general form of the equation is y = a sin bt, where t is the time in seconds. Because the
amplitude is 0.25, = 0.25. This means that a =
±0.25. The period is the reciprocal of the frequency
or . Use this value to find b.
Using the positive values of a and b, one sine function that models the initial behavior is y = 0.25
sin 1864 t.
12. f = 1245, a = 0.12
SOLUTION: The general form of the equation is y = a sin bt, where t is the time in seconds. Because the
amplitude is 0.12, = 0.12. This means that a =
±0.12. The period is the reciprocal of the frequency or
. Use this value to find b.
Using the positive values of a and b, one sine function that models the initial behavior is y = 0.12
sin 2490 t.
13. f = 623, a = 0.2
SOLUTION: The general form of the equation is y = a sin bt, where t is the time in seconds. Because the
amplitude is 0.2, = 0.2. This means that a = ±0.2.
The period is the reciprocal of the frequency or
. Use this value to find b.
Using the positive values of a and b, one sine function that models the initial behavior is y = 0.2 sin
1246 t.
State the amplitude, period, frequency, phase shift, and vertical shift of each function. Then graph two periods of the function.
14.
SOLUTION:
In this function, a = 3, b = 1, c = − , and d = 0.
Because d = 0, there is no vertical shift.
Graph y = 3 sin x shifted units to the right.
15.
SOLUTION:
In this function, a = 1, b = , c = , and d = 0.
Because d = 0, there is no vertical shift.
16. y = 0.25 cos x + 3
SOLUTION:
In this function, a = , b = 1, c = 0, and d = 3.
Graph y = cos x shifted 3 units up.
17. y = sin 3x – 2
SOLUTION: In this function, a = 1, b = 3, c = 0, and d = –2.
Graph y = sin 3x shifted 2 units down.
18.
SOLUTION:
In this function, a = 1, b = 1, c = , and d = –1.
.
Graph y = cos x shifted units to the right and 1
unit down.
19.
SOLUTION:
In this function, a = 1, b = 1, c = , and d = 4.
.
Graph y = sin x shifted units to the left and 4 units up.
20. VACATIONS The average number of reservations R that a vacation resort has at the beginning of each month is shown.
a. Write an equation of a sinusoidal function that models the average number of reservations using x =1 to represent January. b. According to your model, approximately how many reservations can the resort anticipate in November?
SOLUTION: a. Make a scatter plot of the data and choose a model.
Sample answer: Use a sinusoidal function of the form y = a cos (bx + c) + d to model the data. First, find the maximum M and minimum m values of the data, and use these values to find a, b, c, and d. The maximum and minimum reservations are 200 and 87, respectively. The amplitude a is half of the distance between these values.
The vertical shift d is the average of the maximum and minimum data values.
There are 3 months between the maximum and minimum, so the period is 6.
The maximum data value occurs when x = 1. Since y = cos x attains its first maximum when x = 0, we must apply a phase shift of 1 unit. Use this value to find c.
Write a function using the values for a, b, c, and d.
Use b =
b. To find the number of reservations in November, evaluate the model for x = 11.
Therefore, the resort can anticipate about 115 reservations in November.
21. TIDES The table shown below provides data for the first high and low tides of the day for a certain bay during one day in June.
a. Determine the amplitude, period, phase shift, and vertical shift of a sinusoidal function that models the height of the tide. Let x represent the number of hours that the high or low tide occurred after midnight. b. Write a sinusoidal function that models the data. c. According to your model, what was the height of
the tide at 8:45 P.M. that night?
SOLUTION: a. Sample answer: Use a sinusoidal function of the form y = a cos (bx + c) + d to model the data. First, find the amplitude a, which is half of the distance between the heights of the high and low tides.
The vertical shift d is the average of the heights of the high and low tides.
A sinusoid completes half of a period in the time thatit takes to go from its maximum to its minimum value. One period is twice this time. The first high tide occurs 6.5 hours before the first low tide, so the period is 13.
The maximum data value occurs when x ≈ 4.417. Since y = cos x attains its first maximum when x = 0,we must apply a phase shift of 4.417 units. Use this value to find c.
b. Write a function using the values for a, b, c, and
d. Use b =
c. To find the height of the water at 8:45 P.M. that
night, evaluate the model for x = 20.75.
Therefore, the tide was about 7.28 feet high at 8:45
P.M. that night.
22. METEOROLOGY The average monthly temperatures for Boston, Massachusetts are shown.
a. Determine the amplitude, period, phase shift, and vertical shift of a sinusoidal function that models the monthly temperatures using x = 1 to represent January. b. Write an equation of a sinusoidal function that models the monthly temperatures. c. According to your model, what is Boston’s average temperature in August?
SOLUTION: a. The maximum and minimum are 74° and 29°, respectively. The amplitude a is half of the distance between these values.
The vertical shift d is the average of the maximum and minimum data values.
A sinusoid completes half of a period in the time thatit takes to go from its maximum to its minimum value. So, one period is twice this time. The
maximum function value occurs in July, so xmax is 7.
The minimum function value occurs in January, so
xmin is 1. The period is 2(6) = 12.
The maximum data value occurs when x = 7. Since y = cos x attains its first maximum when x = 0, we must apply a phase shift of 7 units. Use this value to find c.
b. Using the values for a, b, c, and d from part a, a sinusoidal function that models that monthly temperatures in Boston is
c. To find the average monthly temperature for Boston in August, evaluate the model for x = 8.
Therefore, the average monthly temperature for Boston in August is about 71°F.
GRAPHING CALCULATOR Find the values of x in the interval – < x < that make each equation or inequality true. (Hint: Use the intersection function.)
23. –sin x = cos x
SOLUTION:
Graph y = −sin x and y = cos x on the same graphing
calculator screen on (−π, π). Use the intersect feature under the CALC menu to determine where the two graphs intersect.
The graphs intersect at about −0.7854 or − and
about 2.356 or . Therefore, on –π < x < π, –sin x
= cos x when x = − and .
24. sin x − cos x = 1
SOLUTION:
Graph y = sin x − cos x and y = 1 on the same
graphing calculator screen on (− , ). Use the intersect feature under the CALC menu to determine where the two graphs intersect.
The graphs intersect at about 1.57 or . Therefore,
on – < x < , sin x − cos x = 1 when x = .
25. sin x + cos x = 0
SOLUTION:
Graph y = sin x + cos x on (−π, π). Use the zero feature under the CALC menu to determine the zeros of the function.
There are zeros at about −0.785 or − or and about
2.356 or . Therefore, on – < x < , sin x + cos
x = 0 when
26. cos x ≤ sin x
SOLUTION:
Graph y = cos x and y = sin x on (−π, π). Use the intersect feature under the CALC menu to determine on what interval(s) cos x ≤ sin x.
The graphs intersect at about –2.356 or – and
about 0.785 or . From the graph, it appears that
cos x ≤ sin x on – < x < – and < x < .
27. sin x cos x > 1
SOLUTION:
Graph y = sin x cos x and y = 1 on (− , ). Use the intersect feature under the CALC menu to determine on what interval(s) sin x cos x > 1.
The graphs do not intersect. Therefore, y = sin x cos
x is not greater than y = 1 for any values of x on –< x < .
28. sin x cos x ≤ 0
SOLUTION:
Graph y = sin x cos x on (−π, π). Use the zero feature under the CALC menu to determine on what interval(s) sin x cos x ≤ 0.
The zeros of y = sin x cos x are about –1.57 or ,
0, and about 1.57 or . From the graph, it appears
that sin x cos x ≤ 0 on < x < 0 and < x < .
29. CAROUSELS A wooden horse on a carousel moves up and down as the carousel spins. When the ride ends, the horse usually stops in a vertical position different from where it started. The position y of the horse after t seconds can be modeled by y =1.5 sin (2t + c), where the phase shift c must be continuously adjusted to compensate for the differentstarting positions. If during one ride the horse
reached a maximum height after seconds, find
the equation that models the horse’s position.
SOLUTION: First, find the period of y = 1.5 sin (2t + c).
Since the period is π, the function will reach a
maximum height at radians. The phase shift is the
difference between the horizontal position of the
function at and radians, which is radians.
Substitute and b into the phase shift formula to
find c.
Therefore, the equation is
30. AMUSEMENT PARKS The position y in feet of a passenger cart relative to the center of a Ferris wheel over t seconds is shown below.
a. Find the time t that it takes for the cart to return toy = 0 during its initial spin. b. Find the period of the Ferris wheel. c. Sketch the graph representing the position of the passenger cart over one period. d. Write a sinusoidal function that models the position of the passenger cart as a function of time t.
SOLUTION: a. From the diagram, the height of the cart is 0 ft when t = 0, and reaches a maximum height of 19 feet when t = 3.75 seconds. So, the cart will return to y = 0 after 2(3.75) or 7.5 seconds. b. The cart completes half of a cycle from t = 0 to t = 7.5. So, the period is 2(7.5) or 15 seconds. c.
d. The amplitude a is half of the maximum and
minimum values. So, a =
The vertical shift d is the average of the maximum
and minimum data values. So,
Because the period of a sinusoidal function is
you can write Therefore,
There is no phase shift because the height of the cartwhen t = 0 is 0 feet, and the sine function has a y-intercept of 0. Therefore, one equation that could be used to model
the position of the passenger cart is y = 19 sin t.
Write an equation that corresponds to each graph.
31.
SOLUTION: Sample answer: There is an x-intercept at 0, so one equation that corresponds to this graph is y = a sin (bx + c) + d. Half of the distance from the maximum to the minimum value of the function is 3. So, the amplitudeis 3. It appears that the function completes one period on
[0, π]. Find b.
The midline appears to be at y = 0, so there does not appear to be any vertical shift. Therefore, one equation that corresponds to this graph is y = 3 sin (2x).
32.
SOLUTION:
Sample answer: Because there is a y-intercept at ,
one equation that corresponds to this graph is y = a cos (bx + c) + d. Half of the distance from the maximum to the
minimum value of the function is . So, the
amplitude is .
It appears that the function completes one period on [0, 6π]. Find b.
The midline appears to be at y = 0, so there does not appear to be any vertical shift. Therefore, one
equation that corresponds to this graph is y = cos
.
33.
SOLUTION: Sample answer: Because there is a y-intercept at 3, one equation that corresponds to this graph is y = a cos (bx + c) + d. Half of the distance from the maximum to the
minimum value of the function is 4 ÷ 2 or 2. So, the amplitude is 2. It appears that the function completes one period on
Find b.
The midline appears to be at y = 1, so there is a vertical shift 1 unit up. Therefore, one equation that corresponds to this graph is y = 2 cos 4x + 1.
34.
SOLUTION: Sample answer: There is an x-intercept at 0, so one equation that corresponds to this graph is y = a sin (bx + c) + d. Half of the distance from the maximum to the
minimum value of the function is 8 ÷ 2 or 4. So, the amplitude is 4. It appears that the function completes one period on [0, 4π]. Find b.
The midline appears to be at y = −2, so there is a vertical shift of 2 units down. Therefore, one equation that corresponds to this graph is y = 4 sin
− 2.
Write a sinusoidal function with the given period and amplitude that passes through the given point.
35. period: ; amplitude: 5; point:
SOLUTION: Use the period to find b.
Sample answer: One sinusoidal function in which a =5 and b = 2 is y = 5 cos 2x. Evaluate the function for
The function passes through . Therefore, a
sinusoidal function with period π and amplitude 5 that
passes through the point is y = 5 cos 2x.
36. period: 4 ; amplitude: 2; point: ( , 2)
SOLUTION: Use the period to find b.
Sample answer: One sinusoidal function in which a =
2 and b = is y = 2 sin . Evaluate the function
for x = π.
The function passes through ( , 2). Therefore, a
sinusoidal function with period 4π and amplitude 2
that passes through the point ( , 2) is y = 2 sin .
37. period: ; amplitude: ; point:
SOLUTION: Use the period to find b.
Sample answer: One sinusoidal function in which a =1.5 and b = 4 is y = 1.5 cos 4x. Evaluate the function
for
The function passes through . Therefore, a
sinusoidal function with period and amplitude 1.5
that passes through the point is y = 1.5 cos
4x.
38. period: 3π; amplitude: ; point:
SOLUTION: Use the period to find b.
Sample answer: One sinusoidal function in which a =
0.5 and b = is y = sin x. Evaluate the
function for
The function passes through . Therefore, a
sinusoidal function with period 3π and amplitude 0.5
that passes through the point is y = sin
x.
39. MULTIPLE REPRESENTATIONS In this problem, you will investigate the change in the graph of a sinusoidal function of the form y = sin x or y = cos x when multiplied by a polynomial function. a. GRAPHICAL Use a graphing calculator to sketch the graphs of y = 2x, y = –2x, and y = 2x cos x on the same coordinate plane, on the interval [–20, 20]. b. VERBAL Describe the behavior of the graph of y = 2x cos x in relation to the graphs of y = 2x and y = –2x. c. GRAPHICAL Use a graphing calculator to
sketch the graphs of y = x2, y = –x
2, and y = x
2 sin x
on the same coordinate plane, on the interval [–20, 20]. d. VERBAL Describe the behavior of the graph of
y = x2 sin x in relation to the graphs of y = x
2 and y
= –x2.
e. ANALYTICAL Make a conjecture as to the behavior of the graph of a sinusoidal function of the form y = sin x or y = cos x when multiplied by polynomial function of the form y = f (x).
SOLUTION: a.
b. The graph of y = 2x cos x oscillates between the graphs of y = 2x and y = –2x. c.
d. The graph of y = x2 sin x oscillates between the
graphs of y = x2 and y = –x
2.
e . The graph of y = f (x) sin x or y = f (x) cos x will oscillate between the graphs of y = f (x) and y = –f(x).
40. CHALLENGE Without graphing, find the exact coordinates of the first maximum point to the right of
the y-axis for
SOLUTION:
First, find the phase shift for
Next, find the period of the function.
The first maximum for one period can be found by
finding So, incorporating the phase shift, the
first maximum to the right of the y-axis is
. Because the amplitude is |4| = 4,
the maximum point is
REASONING Determine whether each statement is true or false . Explain your reasoning.
41. Every sine function of the form y = a sin (bx + c) + d can be written as a cosine function of the form y =a cos (bx + c) + d.
SOLUTION: It is true that every sine function of the form y = a sin (bx + c) + d can be written as a cosine function of the form y = a cos (bx + c) + d. The graph of cosine is a horizontal translation of the sine graph. Therefore, a cosine function can be written from any sine function using the same amplitude and period by applying the necessary phase shift.
For example, consider and
. Phase shift by
to obtain .
42. The period of f (x) = cos 8x is equal to four times the period of g(x) = cos 2x.
SOLUTION: Find the period of f (x) = cos 8x.
Find the period of g(x) = cos 2x.
Four times the period of g(x) = cos 2x is 4 ⋅ or
4 . So, the period of f (x) is the period of g(x).
Therefore, the statement is false.
43. CHALLENGE How many zeros does y = cos
1500x have on the interval 0 ≤ x ≤ 2 ?
SOLUTION: Find the period of y = cos 1500x.
Graph y = cos 1500x on .
The graph of y = cos 1500x has two x-intercepts for one cycle, so the function has 2 zeros per cycle. Find
the number of cycles for y = cos 1500x on [0, 2 ].
So, the graph of y = cos 1500x will complete 1500
cycles on [0, 2 ]. Because there are two zeros per cycle, y = cos 1500x will have 1500(2) or 3000 zeros
on [0, 2 ].
44. PROOF Prove the phase shift formula.
SOLUTION:
Consider y = a sin (bx + c), where a , b, and c ≠ 0. To find a zero of the function, find the value of x for which a sin (bx + c) = 0. Since sin 0 = 0, solving bx + c = 0 will yield a zero of the function.
Therefore, y = 0 when . The value of is
the phase shift. When c > 0: The graph of y = a sin (bx + c) is the
graph of y = a sin x, shifted units to the left.
When c < 0: The graph of y = a sin (bx + c) is the
graph of y = a sin x, shifted units to the right.
Consider the graph of y = cos x below in blue. In this equation a = 1, b = 1 and c = 0. One zero of y = cos x is . The green graph is shifted to the
left. Thus c is – . Then the shifted equation will be
.
45. Writing in Math The Power Tower ride in Sandusky, Ohio, is shown below. Along the side of each tower is a string of lights that send a continuouspulse of light up and down each tower at a constant rate. Explain why the distance d of this light from theground over time t cannot be represented by a sinusoidal function.
SOLUTION: Sample answer: Although the pulse of light can be represented as a function with a period, it is not a sinusoidal function because the distance the pulse of light is from the ground changes at a constant rate. As a result, the graph of this function would resemble the graph below.
The given point lies on the terminal side of an angle θ in standard position. Find the values of
the six trigonometric functions of θ. 46. (−4, 4)
SOLUTION: Use the values of x and y to find r.
Use x = –4, y = 4, and r = to write the six trigonometric ratios.
47. (8, −2)
SOLUTION: Use the values of x and y to find r.
Use x = 8, y = –2, and r = to write the six trigonometric ratios.
48. (−5, −9)
SOLUTION: Use the values of x and y to find r.
Use x = –5, y = – 9, and r = to write the six trigonometric ratios.
49. (4, 5)
SOLUTION: Use the values of x and y to find r.
Use x = 4, y = 5, and r = to write the six trigonometric ratios.
Write each degree measure in radians as a multiple of π and each radian measure in degrees.
50. 25°
SOLUTION: To convert a degree measure to radians, multiply by
51. −420°
SOLUTION: To convert a degree measure to radians, multiply by
52.
SOLUTION: To convert a radian measure to degrees, multiply by
53.
SOLUTION: To convert a radian measure to degrees, multiply by
54. SCIENCE Radiocarbon dating is a method of estimating the age of an organic material by calculating the amount of carbon-14 present in the material. The age of a material can be calculated
using A = t , where A is the age of the
object in years, t is the half-life of carbon-14 or 5700 years, and R is the ratio of the amount of carbon-14 in the sample to the amount of carbon-14 in living tissue. a. A sample of organic material contains 0.000076 gram of carbon-14. A living sample of the same
eSolutions Manual - Powered by Cognero Page 15
4-4 Graphing Sine and Cosine Functions
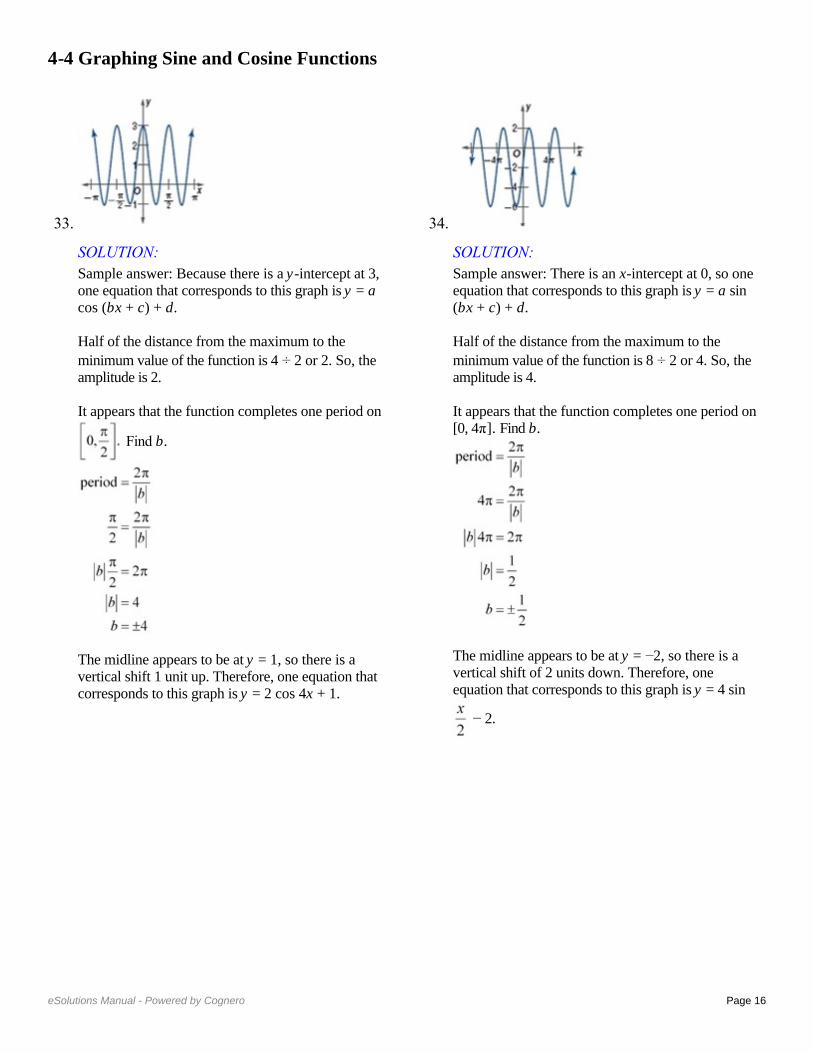
Describe how the graphs of f (x) and g (x) are related. Then find the amplitude of g (x), and sketch two periods of both functions on the same coordinate axes.
1. f (x) = sin x; g(x) = sin x
SOLUTION: The graph of g(x) is the graph of f (x) compressed
vertically. The amplitude of g(x) is or .
Create a table listing the coordinates of the x-intercepts and extrema for f (x) = sin x for one
period, 2 , on the interval [0, 2 ]. Then use the amplitude of g(x) to find corresponding points on its graph.
Sketch the curve through the indicated points for each function. Then repeat the pattern to complete asecond period.
Functions f (x) = sin x g(x) = sin x
x-int (0, 0) (0, 0)
Max
x-int
Min
x-int
2.
SOLUTION: The graph of g(x) is the graph of f (x) compressed
vertically. The amplitude of g(x) is or .
Create a table listing the coordinates of the x-intercepts and extrema for f (x) = cos x for one
period, 2 , on the interval [0, 2 ]. Then use the amplitude of g(x) to find corresponding points on its graph.
Sketch the curve through the indicated points for each function. Then repeat the pattern to complete asecond period.
Function f (x) = cos x
Max (0, 1)
x-int Min
x-in
Min
x-int
Function f (x) = cos x
Max x-int
Min
x-in
Min
x-int
3. f (x) = cos x; g(x) = 6 cos x
SOLUTION: The graph of g(x) is the graph of f (x) expanded
vertically. The amplitude of g(x) is or 6.
Create a table listing the coordinates of the x-intercepts and extrema for f (x) = cos x for one
period, 2 , on the interval [0, 2 ]. Then use the amplitude of g(x) to find corresponding points on its graph.
Sketch the curve through the indicated points for each function. Then repeat the pattern to complete asecond period.
Functions f (x) = cos x g(x) = 6 cos x
Max (0, 1) (0, 6)
x-int
Min
x-int
Max
4. f (x) = sin x; g(x) = −8 sin x
SOLUTION: The graph of g(x) is the graph of f (x) expanded
vertically. The amplitude of g(x) is or 8.
Create a table listing the coordinates of the x-intercepts and extrema for f (x) = sin x for one
period, 2 , on the interval [0, 2 ]. Then use the amplitude of g(x) to find corresponding points on its graph.
Sketch the curve through the indicated points for each function. Then repeat the pattern to complete asecond period.
Function f (x) = sin x
x-int (0, 0)
Max
x-int
Min
x-int
Function g(x) = −8
sin x
x-int (0, 0)
Min
x-int
Max
x-int
Describe how the graphs of f (x) and g (x) are related. Then find the period of g (x), and sketch at least one period of both functions on the same coordinate axes.
5. f (x) = sin x; g(x) = sin 4x
SOLUTION: The graph of g(x) is the graph of f (x) compressed
horizontally. The period of g(x) is . To find
corresponding points on the graph of g(x), change the x-coordinates of those key points on f (x) so that
they range from 0 to , increasing by increments of
.
Sketch the curve through the indicated points for each function. Then repeat the pattern to complete asecond period.
Functions f (x) = sin x g(x) = sin
4x
x-int (0, 0) (0, 0)
Max
x-int
Min
x-int
6. f (x) = cos x; g(x) = cos 2x
SOLUTION: The graph of g(x) is the graph of f (x) compressed
horizontally. The period of g(x) is or . To find
corresponding points on the graph of g(x), change the x-coordinates of those key points on f (x) so that
they range from 0 to , increasing by increments of
.
Sketch the curve through the indicated points for each function. Then repeat the pattern to complete asecond period.
Functions f (x) = cos x g(x) = cos 2x
Max (0, 1) (0, 1)
x-int
Min
x-int
Max
7. f (x) = cos x;
SOLUTION: The graph of g(x) is the graph of f (x) expanded
horizontally. The period of g(x) is . To
find corresponding points on the graph of g(x), change the x-coordinates of those key points on f (x)
so that they range from 0 to , increasing by
increments of or .
Sketch the curve through the indicated points for each function. Then repeat the pattern to complete asecond period.
Functions f (x) = cos x
Max (0, 1) (0, 1)
x-int
Min
x-int
Max
8. f (x) = sin x;
SOLUTION: The graph of g(x) is the graph of f (x) expanded
horizontally. The period of g(x) is . To find corresponding points on the graph of g(x), change the x-coordinates of those key points on f (x) so that they range from 0 to , increasing by increments of
or .
Sketch the curve through the indicated points for each function. Then repeat the pattern to complete asecond period.
Functions f (x) = sin x
x-int (0, 0) (0, 0)
Max
x-int
Min
x-int
9. VOICES The contralto vocal type includes the deepest female singing voice. Some contraltos can sing as low as the E below middle C (E3), which hasa frequency of 165 hertz. Write an equation for a sine function that models the initial behavior of the sound wave associated with E3 having an amplitude of 0.15.
SOLUTION: The general form of the equation will be y = a sin bt,where t is the time in seconds. Because the
amplitude is 0.15, |a|= 0.15. This means that a = ±0.15. The period is the reciprocal of the frequency or
. Use this value to find b.
Sample answer: One sine function that models the
initial behavior is y = 0.15 sin 330 t.
Write a sine function that can be used to model the initial behavior of a sound wave with the frequency and amplitude given.
10. f = 440, a = 0.3
SOLUTION: The general form of the equation is y = a sin bt, where t is the time in seconds. Because the
amplitude is 0.3, = 0.3. This means that a = ±0.3.
The period is the reciprocal of the frequency or
. Use this value to find b.
Using the positive values of a and b, one sine function that models the initial behavior is y = 0.3 sin
880 t.
11. f = 932, a = 0.25
SOLUTION: The general form of the equation is y = a sin bt, where t is the time in seconds. Because the
amplitude is 0.25, = 0.25. This means that a =
±0.25. The period is the reciprocal of the frequency
or . Use this value to find b.
Using the positive values of a and b, one sine function that models the initial behavior is y = 0.25
sin 1864 t.
12. f = 1245, a = 0.12
SOLUTION: The general form of the equation is y = a sin bt, where t is the time in seconds. Because the
amplitude is 0.12, = 0.12. This means that a =
±0.12. The period is the reciprocal of the frequency or
. Use this value to find b.
Using the positive values of a and b, one sine function that models the initial behavior is y = 0.12
sin 2490 t.
13. f = 623, a = 0.2
SOLUTION: The general form of the equation is y = a sin bt, where t is the time in seconds. Because the
amplitude is 0.2, = 0.2. This means that a = ±0.2.
The period is the reciprocal of the frequency or
. Use this value to find b.
Using the positive values of a and b, one sine function that models the initial behavior is y = 0.2 sin
1246 t.
State the amplitude, period, frequency, phase shift, and vertical shift of each function. Then graph two periods of the function.
14.
SOLUTION:
In this function, a = 3, b = 1, c = − , and d = 0.
Because d = 0, there is no vertical shift.
Graph y = 3 sin x shifted units to the right.
15.
SOLUTION:
In this function, a = 1, b = , c = , and d = 0.
Because d = 0, there is no vertical shift.
16. y = 0.25 cos x + 3
SOLUTION:
In this function, a = , b = 1, c = 0, and d = 3.
Graph y = cos x shifted 3 units up.
17. y = sin 3x – 2
SOLUTION: In this function, a = 1, b = 3, c = 0, and d = –2.
Graph y = sin 3x shifted 2 units down.
18.
SOLUTION:
In this function, a = 1, b = 1, c = , and d = –1.
.
Graph y = cos x shifted units to the right and 1
unit down.
19.
SOLUTION:
In this function, a = 1, b = 1, c = , and d = 4.
.
Graph y = sin x shifted units to the left and 4 units up.
20. VACATIONS The average number of reservations R that a vacation resort has at the beginning of each month is shown.
a. Write an equation of a sinusoidal function that models the average number of reservations using x =1 to represent January. b. According to your model, approximately how many reservations can the resort anticipate in November?
SOLUTION: a. Make a scatter plot of the data and choose a model.
Sample answer: Use a sinusoidal function of the form y = a cos (bx + c) + d to model the data. First, find the maximum M and minimum m values of the data, and use these values to find a, b, c, and d. The maximum and minimum reservations are 200 and 87, respectively. The amplitude a is half of the distance between these values.
The vertical shift d is the average of the maximum and minimum data values.
There are 3 months between the maximum and minimum, so the period is 6.
The maximum data value occurs when x = 1. Since y = cos x attains its first maximum when x = 0, we must apply a phase shift of 1 unit. Use this value to find c.
Write a function using the values for a, b, c, and d.
Use b =
b. To find the number of reservations in November, evaluate the model for x = 11.
Therefore, the resort can anticipate about 115 reservations in November.
21. TIDES The table shown below provides data for the first high and low tides of the day for a certain bay during one day in June.
a. Determine the amplitude, period, phase shift, and vertical shift of a sinusoidal function that models the height of the tide. Let x represent the number of hours that the high or low tide occurred after midnight. b. Write a sinusoidal function that models the data. c. According to your model, what was the height of
the tide at 8:45 P.M. that night?
SOLUTION: a. Sample answer: Use a sinusoidal function of the form y = a cos (bx + c) + d to model the data. First, find the amplitude a, which is half of the distance between the heights of the high and low tides.
The vertical shift d is the average of the heights of the high and low tides.
A sinusoid completes half of a period in the time thatit takes to go from its maximum to its minimum value. One period is twice this time. The first high tide occurs 6.5 hours before the first low tide, so the period is 13.
The maximum data value occurs when x ≈ 4.417. Since y = cos x attains its first maximum when x = 0,we must apply a phase shift of 4.417 units. Use this value to find c.
b. Write a function using the values for a, b, c, and
d. Use b =
c. To find the height of the water at 8:45 P.M. that
night, evaluate the model for x = 20.75.
Therefore, the tide was about 7.28 feet high at 8:45
P.M. that night.
22. METEOROLOGY The average monthly temperatures for Boston, Massachusetts are shown.
a. Determine the amplitude, period, phase shift, and vertical shift of a sinusoidal function that models the monthly temperatures using x = 1 to represent January. b. Write an equation of a sinusoidal function that models the monthly temperatures. c. According to your model, what is Boston’s average temperature in August?
SOLUTION: a. The maximum and minimum are 74° and 29°, respectively. The amplitude a is half of the distance between these values.
The vertical shift d is the average of the maximum and minimum data values.
A sinusoid completes half of a period in the time thatit takes to go from its maximum to its minimum value. So, one period is twice this time. The
maximum function value occurs in July, so xmax is 7.
The minimum function value occurs in January, so
xmin is 1. The period is 2(6) = 12.
The maximum data value occurs when x = 7. Since y = cos x attains its first maximum when x = 0, we must apply a phase shift of 7 units. Use this value to find c.
b. Using the values for a, b, c, and d from part a, a sinusoidal function that models that monthly temperatures in Boston is
c. To find the average monthly temperature for Boston in August, evaluate the model for x = 8.
Therefore, the average monthly temperature for Boston in August is about 71°F.
GRAPHING CALCULATOR Find the values of x in the interval – < x < that make each equation or inequality true. (Hint: Use the intersection function.)
23. –sin x = cos x
SOLUTION:
Graph y = −sin x and y = cos x on the same graphing
calculator screen on (−π, π). Use the intersect feature under the CALC menu to determine where the two graphs intersect.
The graphs intersect at about −0.7854 or − and
about 2.356 or . Therefore, on –π < x < π, –sin x
= cos x when x = − and .
24. sin x − cos x = 1
SOLUTION:
Graph y = sin x − cos x and y = 1 on the same
graphing calculator screen on (− , ). Use the intersect feature under the CALC menu to determine where the two graphs intersect.
The graphs intersect at about 1.57 or . Therefore,
on – < x < , sin x − cos x = 1 when x = .
25. sin x + cos x = 0
SOLUTION:
Graph y = sin x + cos x on (−π, π). Use the zero feature under the CALC menu to determine the zeros of the function.
There are zeros at about −0.785 or − or and about
2.356 or . Therefore, on – < x < , sin x + cos
x = 0 when
26. cos x ≤ sin x
SOLUTION:
Graph y = cos x and y = sin x on (−π, π). Use the intersect feature under the CALC menu to determine on what interval(s) cos x ≤ sin x.
The graphs intersect at about –2.356 or – and
about 0.785 or . From the graph, it appears that
cos x ≤ sin x on – < x < – and < x < .
27. sin x cos x > 1
SOLUTION:
Graph y = sin x cos x and y = 1 on (− , ). Use the intersect feature under the CALC menu to determine on what interval(s) sin x cos x > 1.
The graphs do not intersect. Therefore, y = sin x cos
x is not greater than y = 1 for any values of x on –< x < .
28. sin x cos x ≤ 0
SOLUTION:
Graph y = sin x cos x on (−π, π). Use the zero feature under the CALC menu to determine on what interval(s) sin x cos x ≤ 0.
The zeros of y = sin x cos x are about –1.57 or ,
0, and about 1.57 or . From the graph, it appears
that sin x cos x ≤ 0 on < x < 0 and < x < .
29. CAROUSELS A wooden horse on a carousel moves up and down as the carousel spins. When the ride ends, the horse usually stops in a vertical position different from where it started. The position y of the horse after t seconds can be modeled by y =1.5 sin (2t + c), where the phase shift c must be continuously adjusted to compensate for the differentstarting positions. If during one ride the horse
reached a maximum height after seconds, find
the equation that models the horse’s position.
SOLUTION: First, find the period of y = 1.5 sin (2t + c).
Since the period is π, the function will reach a
maximum height at radians. The phase shift is the
difference between the horizontal position of the
function at and radians, which is radians.
Substitute and b into the phase shift formula to
find c.
Therefore, the equation is
30. AMUSEMENT PARKS The position y in feet of a passenger cart relative to the center of a Ferris wheel over t seconds is shown below.
a. Find the time t that it takes for the cart to return toy = 0 during its initial spin. b. Find the period of the Ferris wheel. c. Sketch the graph representing the position of the passenger cart over one period. d. Write a sinusoidal function that models the position of the passenger cart as a function of time t.
SOLUTION: a. From the diagram, the height of the cart is 0 ft when t = 0, and reaches a maximum height of 19 feet when t = 3.75 seconds. So, the cart will return to y = 0 after 2(3.75) or 7.5 seconds. b. The cart completes half of a cycle from t = 0 to t = 7.5. So, the period is 2(7.5) or 15 seconds. c.
d. The amplitude a is half of the maximum and
minimum values. So, a =
The vertical shift d is the average of the maximum
and minimum data values. So,
Because the period of a sinusoidal function is
you can write Therefore,
There is no phase shift because the height of the cartwhen t = 0 is 0 feet, and the sine function has a y-intercept of 0. Therefore, one equation that could be used to model
the position of the passenger cart is y = 19 sin t.
Write an equation that corresponds to each graph.
31.
SOLUTION: Sample answer: There is an x-intercept at 0, so one equation that corresponds to this graph is y = a sin (bx + c) + d. Half of the distance from the maximum to the minimum value of the function is 3. So, the amplitudeis 3. It appears that the function completes one period on
[0, π]. Find b.
The midline appears to be at y = 0, so there does not appear to be any vertical shift. Therefore, one equation that corresponds to this graph is y = 3 sin (2x).
32.
SOLUTION:
Sample answer: Because there is a y-intercept at ,
one equation that corresponds to this graph is y = a cos (bx + c) + d. Half of the distance from the maximum to the
minimum value of the function is . So, the
amplitude is .
It appears that the function completes one period on [0, 6π]. Find b.
The midline appears to be at y = 0, so there does not appear to be any vertical shift. Therefore, one
equation that corresponds to this graph is y = cos
.
33.
SOLUTION: Sample answer: Because there is a y-intercept at 3, one equation that corresponds to this graph is y = a cos (bx + c) + d. Half of the distance from the maximum to the
minimum value of the function is 4 ÷ 2 or 2. So, the amplitude is 2. It appears that the function completes one period on
Find b.
The midline appears to be at y = 1, so there is a vertical shift 1 unit up. Therefore, one equation that corresponds to this graph is y = 2 cos 4x + 1.
34.
SOLUTION: Sample answer: There is an x-intercept at 0, so one equation that corresponds to this graph is y = a sin (bx + c) + d. Half of the distance from the maximum to the
minimum value of the function is 8 ÷ 2 or 4. So, the amplitude is 4. It appears that the function completes one period on [0, 4π]. Find b.
The midline appears to be at y = −2, so there is a vertical shift of 2 units down. Therefore, one equation that corresponds to this graph is y = 4 sin
− 2.
Write a sinusoidal function with the given period and amplitude that passes through the given point.
35. period: ; amplitude: 5; point:
SOLUTION: Use the period to find b.
Sample answer: One sinusoidal function in which a =5 and b = 2 is y = 5 cos 2x. Evaluate the function for
The function passes through . Therefore, a
sinusoidal function with period π and amplitude 5 that
passes through the point is y = 5 cos 2x.
36. period: 4 ; amplitude: 2; point: ( , 2)
SOLUTION: Use the period to find b.
Sample answer: One sinusoidal function in which a =
2 and b = is y = 2 sin . Evaluate the function
for x = π.
The function passes through ( , 2). Therefore, a
sinusoidal function with period 4π and amplitude 2
that passes through the point ( , 2) is y = 2 sin .
37. period: ; amplitude: ; point:
SOLUTION: Use the period to find b.
Sample answer: One sinusoidal function in which a =1.5 and b = 4 is y = 1.5 cos 4x. Evaluate the function
for
The function passes through . Therefore, a
sinusoidal function with period and amplitude 1.5
that passes through the point is y = 1.5 cos
4x.
38. period: 3π; amplitude: ; point:
SOLUTION: Use the period to find b.
Sample answer: One sinusoidal function in which a =
0.5 and b = is y = sin x. Evaluate the
function for
The function passes through . Therefore, a
sinusoidal function with period 3π and amplitude 0.5
that passes through the point is y = sin
x.
39. MULTIPLE REPRESENTATIONS In this problem, you will investigate the change in the graph of a sinusoidal function of the form y = sin x or y = cos x when multiplied by a polynomial function. a. GRAPHICAL Use a graphing calculator to sketch the graphs of y = 2x, y = –2x, and y = 2x cos x on the same coordinate plane, on the interval [–20, 20]. b. VERBAL Describe the behavior of the graph of y = 2x cos x in relation to the graphs of y = 2x and y = –2x. c. GRAPHICAL Use a graphing calculator to
sketch the graphs of y = x2, y = –x
2, and y = x
2 sin x
on the same coordinate plane, on the interval [–20, 20]. d. VERBAL Describe the behavior of the graph of
y = x2 sin x in relation to the graphs of y = x
2 and y
= –x2.
e. ANALYTICAL Make a conjecture as to the behavior of the graph of a sinusoidal function of the form y = sin x or y = cos x when multiplied by polynomial function of the form y = f (x).
SOLUTION: a.
b. The graph of y = 2x cos x oscillates between the graphs of y = 2x and y = –2x. c.
d. The graph of y = x2 sin x oscillates between the
graphs of y = x2 and y = –x
2.
e . The graph of y = f (x) sin x or y = f (x) cos x will oscillate between the graphs of y = f (x) and y = –f(x).
40. CHALLENGE Without graphing, find the exact coordinates of the first maximum point to the right of
the y-axis for
SOLUTION:
First, find the phase shift for
Next, find the period of the function.
The first maximum for one period can be found by
finding So, incorporating the phase shift, the
first maximum to the right of the y-axis is
. Because the amplitude is |4| = 4,
the maximum point is
REASONING Determine whether each statement is true or false . Explain your reasoning.
41. Every sine function of the form y = a sin (bx + c) + d can be written as a cosine function of the form y =a cos (bx + c) + d.
SOLUTION: It is true that every sine function of the form y = a sin (bx + c) + d can be written as a cosine function of the form y = a cos (bx + c) + d. The graph of cosine is a horizontal translation of the sine graph. Therefore, a cosine function can be written from any sine function using the same amplitude and period by applying the necessary phase shift.
For example, consider and
. Phase shift by
to obtain .
42. The period of f (x) = cos 8x is equal to four times the period of g(x) = cos 2x.
SOLUTION: Find the period of f (x) = cos 8x.
Find the period of g(x) = cos 2x.
Four times the period of g(x) = cos 2x is 4 ⋅ or
4 . So, the period of f (x) is the period of g(x).
Therefore, the statement is false.
43. CHALLENGE How many zeros does y = cos
1500x have on the interval 0 ≤ x ≤ 2 ?
SOLUTION: Find the period of y = cos 1500x.
Graph y = cos 1500x on .
The graph of y = cos 1500x has two x-intercepts for one cycle, so the function has 2 zeros per cycle. Find
the number of cycles for y = cos 1500x on [0, 2 ].
So, the graph of y = cos 1500x will complete 1500
cycles on [0, 2 ]. Because there are two zeros per cycle, y = cos 1500x will have 1500(2) or 3000 zeros
on [0, 2 ].
44. PROOF Prove the phase shift formula.
SOLUTION:
Consider y = a sin (bx + c), where a , b, and c ≠ 0. To find a zero of the function, find the value of x for which a sin (bx + c) = 0. Since sin 0 = 0, solving bx + c = 0 will yield a zero of the function.
Therefore, y = 0 when . The value of is
the phase shift. When c > 0: The graph of y = a sin (bx + c) is the
graph of y = a sin x, shifted units to the left.
When c < 0: The graph of y = a sin (bx + c) is the
graph of y = a sin x, shifted units to the right.
Consider the graph of y = cos x below in blue. In this equation a = 1, b = 1 and c = 0. One zero of y = cos x is . The green graph is shifted to the
left. Thus c is – . Then the shifted equation will be
.
45. Writing in Math The Power Tower ride in Sandusky, Ohio, is shown below. Along the side of each tower is a string of lights that send a continuouspulse of light up and down each tower at a constant rate. Explain why the distance d of this light from theground over time t cannot be represented by a sinusoidal function.
SOLUTION: Sample answer: Although the pulse of light can be represented as a function with a period, it is not a sinusoidal function because the distance the pulse of light is from the ground changes at a constant rate. As a result, the graph of this function would resemble the graph below.
The given point lies on the terminal side of an angle θ in standard position. Find the values of
the six trigonometric functions of θ. 46. (−4, 4)
SOLUTION: Use the values of x and y to find r.
Use x = –4, y = 4, and r = to write the six trigonometric ratios.
47. (8, −2)
SOLUTION: Use the values of x and y to find r.
Use x = 8, y = –2, and r = to write the six trigonometric ratios.
48. (−5, −9)
SOLUTION: Use the values of x and y to find r.
Use x = –5, y = – 9, and r = to write the six trigonometric ratios.
49. (4, 5)
SOLUTION: Use the values of x and y to find r.
Use x = 4, y = 5, and r = to write the six trigonometric ratios.
Write each degree measure in radians as a multiple of π and each radian measure in degrees.
50. 25°
SOLUTION: To convert a degree measure to radians, multiply by
51. −420°
SOLUTION: To convert a degree measure to radians, multiply by
52.
SOLUTION: To convert a radian measure to degrees, multiply by
53.
SOLUTION: To convert a radian measure to degrees, multiply by
54. SCIENCE Radiocarbon dating is a method of estimating the age of an organic material by calculating the amount of carbon-14 present in the material. The age of a material can be calculated
using A = t , where A is the age of the
object in years, t is the half-life of carbon-14 or 5700 years, and R is the ratio of the amount of carbon-14 in the sample to the amount of carbon-14 in living tissue. a. A sample of organic material contains 0.000076 gram of carbon-14. A living sample of the same
Describe how the graphs of f (x) and g (x) are related. Then find the amplitude of g (x), and sketch two periods of both functions on the same coordinate axes.
1. f (x) = sin x; g(x) = sin x
SOLUTION: The graph of g(x) is the graph of f (x) compressed
vertically. The amplitude of g(x) is or .
Create a table listing the coordinates of the x-intercepts and extrema for f (x) = sin x for one
period, 2 , on the interval [0, 2 ]. Then use the amplitude of g(x) to find corresponding points on its graph.
Sketch the curve through the indicated points for each function. Then repeat the pattern to complete asecond period.
Functions f (x) = sin x g(x) = sin x
x-int (0, 0) (0, 0)
Max
x-int
Min
x-int
2.
SOLUTION: The graph of g(x) is the graph of f (x) compressed
vertically. The amplitude of g(x) is or .
Create a table listing the coordinates of the x-intercepts and extrema for f (x) = cos x for one
period, 2 , on the interval [0, 2 ]. Then use the amplitude of g(x) to find corresponding points on its graph.
Sketch the curve through the indicated points for each function. Then repeat the pattern to complete asecond period.
Function f (x) = cos x
Max (0, 1)
x-int Min
x-in
Min
x-int
Function f (x) = cos x
Max x-int
Min
x-in
Min
x-int
3. f (x) = cos x; g(x) = 6 cos x
SOLUTION: The graph of g(x) is the graph of f (x) expanded
vertically. The amplitude of g(x) is or 6.
Create a table listing the coordinates of the x-intercepts and extrema for f (x) = cos x for one
period, 2 , on the interval [0, 2 ]. Then use the amplitude of g(x) to find corresponding points on its graph.
Sketch the curve through the indicated points for each function. Then repeat the pattern to complete asecond period.
Functions f (x) = cos x g(x) = 6 cos x
Max (0, 1) (0, 6)
x-int
Min
x-int
Max
4. f (x) = sin x; g(x) = −8 sin x
SOLUTION: The graph of g(x) is the graph of f (x) expanded
vertically. The amplitude of g(x) is or 8.
Create a table listing the coordinates of the x-intercepts and extrema for f (x) = sin x for one
period, 2 , on the interval [0, 2 ]. Then use the amplitude of g(x) to find corresponding points on its graph.
Sketch the curve through the indicated points for each function. Then repeat the pattern to complete asecond period.
Function f (x) = sin x
x-int (0, 0)
Max
x-int
Min
x-int
Function g(x) = −8
sin x
x-int (0, 0)
Min
x-int
Max
x-int
Describe how the graphs of f (x) and g (x) are related. Then find the period of g (x), and sketch at least one period of both functions on the same coordinate axes.
5. f (x) = sin x; g(x) = sin 4x
SOLUTION: The graph of g(x) is the graph of f (x) compressed
horizontally. The period of g(x) is . To find
corresponding points on the graph of g(x), change the x-coordinates of those key points on f (x) so that
they range from 0 to , increasing by increments of
.
Sketch the curve through the indicated points for each function. Then repeat the pattern to complete asecond period.
Functions f (x) = sin x g(x) = sin
4x
x-int (0, 0) (0, 0)
Max
x-int
Min
x-int
6. f (x) = cos x; g(x) = cos 2x
SOLUTION: The graph of g(x) is the graph of f (x) compressed
horizontally. The period of g(x) is or . To find
corresponding points on the graph of g(x), change the x-coordinates of those key points on f (x) so that
they range from 0 to , increasing by increments of
.
Sketch the curve through the indicated points for each function. Then repeat the pattern to complete asecond period.
Functions f (x) = cos x g(x) = cos 2x
Max (0, 1) (0, 1)
x-int
Min
x-int
Max
7. f (x) = cos x;
SOLUTION: The graph of g(x) is the graph of f (x) expanded
horizontally. The period of g(x) is . To
find corresponding points on the graph of g(x), change the x-coordinates of those key points on f (x)
so that they range from 0 to , increasing by
increments of or .
Sketch the curve through the indicated points for each function. Then repeat the pattern to complete asecond period.
Functions f (x) = cos x
Max (0, 1) (0, 1)
x-int
Min
x-int
Max
8. f (x) = sin x;
SOLUTION: The graph of g(x) is the graph of f (x) expanded
horizontally. The period of g(x) is . To find corresponding points on the graph of g(x), change the x-coordinates of those key points on f (x) so that they range from 0 to , increasing by increments of
or .
Sketch the curve through the indicated points for each function. Then repeat the pattern to complete asecond period.
Functions f (x) = sin x
x-int (0, 0) (0, 0)
Max
x-int
Min
x-int
9. VOICES The contralto vocal type includes the deepest female singing voice. Some contraltos can sing as low as the E below middle C (E3), which hasa frequency of 165 hertz. Write an equation for a sine function that models the initial behavior of the sound wave associated with E3 having an amplitude of 0.15.
SOLUTION: The general form of the equation will be y = a sin bt,where t is the time in seconds. Because the
amplitude is 0.15, |a|= 0.15. This means that a = ±0.15. The period is the reciprocal of the frequency or
. Use this value to find b.
Sample answer: One sine function that models the
initial behavior is y = 0.15 sin 330 t.
Write a sine function that can be used to model the initial behavior of a sound wave with the frequency and amplitude given.
10. f = 440, a = 0.3
SOLUTION: The general form of the equation is y = a sin bt, where t is the time in seconds. Because the
amplitude is 0.3, = 0.3. This means that a = ±0.3.
The period is the reciprocal of the frequency or
. Use this value to find b.
Using the positive values of a and b, one sine function that models the initial behavior is y = 0.3 sin
880 t.
11. f = 932, a = 0.25
SOLUTION: The general form of the equation is y = a sin bt, where t is the time in seconds. Because the
amplitude is 0.25, = 0.25. This means that a =
±0.25. The period is the reciprocal of the frequency
or . Use this value to find b.
Using the positive values of a and b, one sine function that models the initial behavior is y = 0.25
sin 1864 t.
12. f = 1245, a = 0.12
SOLUTION: The general form of the equation is y = a sin bt, where t is the time in seconds. Because the
amplitude is 0.12, = 0.12. This means that a =
±0.12. The period is the reciprocal of the frequency or
. Use this value to find b.
Using the positive values of a and b, one sine function that models the initial behavior is y = 0.12
sin 2490 t.
13. f = 623, a = 0.2
SOLUTION: The general form of the equation is y = a sin bt, where t is the time in seconds. Because the
amplitude is 0.2, = 0.2. This means that a = ±0.2.
The period is the reciprocal of the frequency or
. Use this value to find b.
Using the positive values of a and b, one sine function that models the initial behavior is y = 0.2 sin
1246 t.
State the amplitude, period, frequency, phase shift, and vertical shift of each function. Then graph two periods of the function.
14.
SOLUTION:
In this function, a = 3, b = 1, c = − , and d = 0.
Because d = 0, there is no vertical shift.
Graph y = 3 sin x shifted units to the right.
15.
SOLUTION:
In this function, a = 1, b = , c = , and d = 0.
Because d = 0, there is no vertical shift.
16. y = 0.25 cos x + 3
SOLUTION:
In this function, a = , b = 1, c = 0, and d = 3.
Graph y = cos x shifted 3 units up.
17. y = sin 3x – 2
SOLUTION: In this function, a = 1, b = 3, c = 0, and d = –2.
Graph y = sin 3x shifted 2 units down.
18.
SOLUTION:
In this function, a = 1, b = 1, c = , and d = –1.
.
Graph y = cos x shifted units to the right and 1
unit down.
19.
SOLUTION:
In this function, a = 1, b = 1, c = , and d = 4.
.
Graph y = sin x shifted units to the left and 4 units up.
20. VACATIONS The average number of reservations R that a vacation resort has at the beginning of each month is shown.
a. Write an equation of a sinusoidal function that models the average number of reservations using x =1 to represent January. b. According to your model, approximately how many reservations can the resort anticipate in November?
SOLUTION: a. Make a scatter plot of the data and choose a model.
Sample answer: Use a sinusoidal function of the form y = a cos (bx + c) + d to model the data. First, find the maximum M and minimum m values of the data, and use these values to find a, b, c, and d. The maximum and minimum reservations are 200 and 87, respectively. The amplitude a is half of the distance between these values.
The vertical shift d is the average of the maximum and minimum data values.
There are 3 months between the maximum and minimum, so the period is 6.
The maximum data value occurs when x = 1. Since y = cos x attains its first maximum when x = 0, we must apply a phase shift of 1 unit. Use this value to find c.
Write a function using the values for a, b, c, and d.
Use b =
b. To find the number of reservations in November, evaluate the model for x = 11.
Therefore, the resort can anticipate about 115 reservations in November.
21. TIDES The table shown below provides data for the first high and low tides of the day for a certain bay during one day in June.
a. Determine the amplitude, period, phase shift, and vertical shift of a sinusoidal function that models the height of the tide. Let x represent the number of hours that the high or low tide occurred after midnight. b. Write a sinusoidal function that models the data. c. According to your model, what was the height of
the tide at 8:45 P.M. that night?
SOLUTION: a. Sample answer: Use a sinusoidal function of the form y = a cos (bx + c) + d to model the data. First, find the amplitude a, which is half of the distance between the heights of the high and low tides.
The vertical shift d is the average of the heights of the high and low tides.
A sinusoid completes half of a period in the time thatit takes to go from its maximum to its minimum value. One period is twice this time. The first high tide occurs 6.5 hours before the first low tide, so the period is 13.
The maximum data value occurs when x ≈ 4.417. Since y = cos x attains its first maximum when x = 0,we must apply a phase shift of 4.417 units. Use this value to find c.
b. Write a function using the values for a, b, c, and
d. Use b =
c. To find the height of the water at 8:45 P.M. that
night, evaluate the model for x = 20.75.
Therefore, the tide was about 7.28 feet high at 8:45
P.M. that night.
22. METEOROLOGY The average monthly temperatures for Boston, Massachusetts are shown.
a. Determine the amplitude, period, phase shift, and vertical shift of a sinusoidal function that models the monthly temperatures using x = 1 to represent January. b. Write an equation of a sinusoidal function that models the monthly temperatures. c. According to your model, what is Boston’s average temperature in August?
SOLUTION: a. The maximum and minimum are 74° and 29°, respectively. The amplitude a is half of the distance between these values.
The vertical shift d is the average of the maximum and minimum data values.
A sinusoid completes half of a period in the time thatit takes to go from its maximum to its minimum value. So, one period is twice this time. The
maximum function value occurs in July, so xmax is 7.
The minimum function value occurs in January, so
xmin is 1. The period is 2(6) = 12.
The maximum data value occurs when x = 7. Since y = cos x attains its first maximum when x = 0, we must apply a phase shift of 7 units. Use this value to find c.
b. Using the values for a, b, c, and d from part a, a sinusoidal function that models that monthly temperatures in Boston is
c. To find the average monthly temperature for Boston in August, evaluate the model for x = 8.
Therefore, the average monthly temperature for Boston in August is about 71°F.
GRAPHING CALCULATOR Find the values of x in the interval – < x < that make each equation or inequality true. (Hint: Use the intersection function.)
23. –sin x = cos x
SOLUTION:
Graph y = −sin x and y = cos x on the same graphing
calculator screen on (−π, π). Use the intersect feature under the CALC menu to determine where the two graphs intersect.
The graphs intersect at about −0.7854 or − and
about 2.356 or . Therefore, on –π < x < π, –sin x
= cos x when x = − and .
24. sin x − cos x = 1
SOLUTION:
Graph y = sin x − cos x and y = 1 on the same
graphing calculator screen on (− , ). Use the intersect feature under the CALC menu to determine where the two graphs intersect.
The graphs intersect at about 1.57 or . Therefore,
on – < x < , sin x − cos x = 1 when x = .
25. sin x + cos x = 0
SOLUTION:
Graph y = sin x + cos x on (−π, π). Use the zero feature under the CALC menu to determine the zeros of the function.
There are zeros at about −0.785 or − or and about
2.356 or . Therefore, on – < x < , sin x + cos
x = 0 when
26. cos x ≤ sin x
SOLUTION:
Graph y = cos x and y = sin x on (−π, π). Use the intersect feature under the CALC menu to determine on what interval(s) cos x ≤ sin x.
The graphs intersect at about –2.356 or – and
about 0.785 or . From the graph, it appears that
cos x ≤ sin x on – < x < – and < x < .
27. sin x cos x > 1
SOLUTION:
Graph y = sin x cos x and y = 1 on (− , ). Use the intersect feature under the CALC menu to determine on what interval(s) sin x cos x > 1.
The graphs do not intersect. Therefore, y = sin x cos
x is not greater than y = 1 for any values of x on –< x < .
28. sin x cos x ≤ 0
SOLUTION:
Graph y = sin x cos x on (−π, π). Use the zero feature under the CALC menu to determine on what interval(s) sin x cos x ≤ 0.
The zeros of y = sin x cos x are about –1.57 or ,
0, and about 1.57 or . From the graph, it appears
that sin x cos x ≤ 0 on < x < 0 and < x < .
29. CAROUSELS A wooden horse on a carousel moves up and down as the carousel spins. When the ride ends, the horse usually stops in a vertical position different from where it started. The position y of the horse after t seconds can be modeled by y =1.5 sin (2t + c), where the phase shift c must be continuously adjusted to compensate for the differentstarting positions. If during one ride the horse
reached a maximum height after seconds, find
the equation that models the horse’s position.
SOLUTION: First, find the period of y = 1.5 sin (2t + c).
Since the period is π, the function will reach a
maximum height at radians. The phase shift is the
difference between the horizontal position of the
function at and radians, which is radians.
Substitute and b into the phase shift formula to
find c.
Therefore, the equation is
30. AMUSEMENT PARKS The position y in feet of a passenger cart relative to the center of a Ferris wheel over t seconds is shown below.
a. Find the time t that it takes for the cart to return toy = 0 during its initial spin. b. Find the period of the Ferris wheel. c. Sketch the graph representing the position of the passenger cart over one period. d. Write a sinusoidal function that models the position of the passenger cart as a function of time t.
SOLUTION: a. From the diagram, the height of the cart is 0 ft when t = 0, and reaches a maximum height of 19 feet when t = 3.75 seconds. So, the cart will return to y = 0 after 2(3.75) or 7.5 seconds. b. The cart completes half of a cycle from t = 0 to t = 7.5. So, the period is 2(7.5) or 15 seconds. c.
d. The amplitude a is half of the maximum and
minimum values. So, a =
The vertical shift d is the average of the maximum
and minimum data values. So,
Because the period of a sinusoidal function is
you can write Therefore,
There is no phase shift because the height of the cartwhen t = 0 is 0 feet, and the sine function has a y-intercept of 0. Therefore, one equation that could be used to model
the position of the passenger cart is y = 19 sin t.
Write an equation that corresponds to each graph.
31.
SOLUTION: Sample answer: There is an x-intercept at 0, so one equation that corresponds to this graph is y = a sin (bx + c) + d. Half of the distance from the maximum to the minimum value of the function is 3. So, the amplitudeis 3. It appears that the function completes one period on
[0, π]. Find b.
The midline appears to be at y = 0, so there does not appear to be any vertical shift. Therefore, one equation that corresponds to this graph is y = 3 sin (2x).
32.
SOLUTION:
Sample answer: Because there is a y-intercept at ,
one equation that corresponds to this graph is y = a cos (bx + c) + d. Half of the distance from the maximum to the
minimum value of the function is . So, the
amplitude is .
It appears that the function completes one period on [0, 6π]. Find b.
The midline appears to be at y = 0, so there does not appear to be any vertical shift. Therefore, one
equation that corresponds to this graph is y = cos
.
33.
SOLUTION: Sample answer: Because there is a y-intercept at 3, one equation that corresponds to this graph is y = a cos (bx + c) + d. Half of the distance from the maximum to the
minimum value of the function is 4 ÷ 2 or 2. So, the amplitude is 2. It appears that the function completes one period on
Find b.
The midline appears to be at y = 1, so there is a vertical shift 1 unit up. Therefore, one equation that corresponds to this graph is y = 2 cos 4x + 1.
34.
SOLUTION: Sample answer: There is an x-intercept at 0, so one equation that corresponds to this graph is y = a sin (bx + c) + d. Half of the distance from the maximum to the
minimum value of the function is 8 ÷ 2 or 4. So, the amplitude is 4. It appears that the function completes one period on [0, 4π]. Find b.
The midline appears to be at y = −2, so there is a vertical shift of 2 units down. Therefore, one equation that corresponds to this graph is y = 4 sin
− 2.
Write a sinusoidal function with the given period and amplitude that passes through the given point.
35. period: ; amplitude: 5; point:
SOLUTION: Use the period to find b.
Sample answer: One sinusoidal function in which a =5 and b = 2 is y = 5 cos 2x. Evaluate the function for
The function passes through . Therefore, a
sinusoidal function with period π and amplitude 5 that
passes through the point is y = 5 cos 2x.
36. period: 4 ; amplitude: 2; point: ( , 2)
SOLUTION: Use the period to find b.
Sample answer: One sinusoidal function in which a =
2 and b = is y = 2 sin . Evaluate the function
for x = π.
The function passes through ( , 2). Therefore, a
sinusoidal function with period 4π and amplitude 2
that passes through the point ( , 2) is y = 2 sin .
37. period: ; amplitude: ; point:
SOLUTION: Use the period to find b.
Sample answer: One sinusoidal function in which a =1.5 and b = 4 is y = 1.5 cos 4x. Evaluate the function
for
The function passes through . Therefore, a
sinusoidal function with period and amplitude 1.5
that passes through the point is y = 1.5 cos
4x.
38. period: 3π; amplitude: ; point:
SOLUTION: Use the period to find b.
Sample answer: One sinusoidal function in which a =
0.5 and b = is y = sin x. Evaluate the
function for
The function passes through . Therefore, a
sinusoidal function with period 3π and amplitude 0.5
that passes through the point is y = sin
x.
39. MULTIPLE REPRESENTATIONS In this problem, you will investigate the change in the graph of a sinusoidal function of the form y = sin x or y = cos x when multiplied by a polynomial function. a. GRAPHICAL Use a graphing calculator to sketch the graphs of y = 2x, y = –2x, and y = 2x cos x on the same coordinate plane, on the interval [–20, 20]. b. VERBAL Describe the behavior of the graph of y = 2x cos x in relation to the graphs of y = 2x and y = –2x. c. GRAPHICAL Use a graphing calculator to
sketch the graphs of y = x2, y = –x
2, and y = x
2 sin x
on the same coordinate plane, on the interval [–20, 20]. d. VERBAL Describe the behavior of the graph of
y = x2 sin x in relation to the graphs of y = x
2 and y
= –x2.
e. ANALYTICAL Make a conjecture as to the behavior of the graph of a sinusoidal function of the form y = sin x or y = cos x when multiplied by polynomial function of the form y = f (x).
SOLUTION: a.
b. The graph of y = 2x cos x oscillates between the graphs of y = 2x and y = –2x. c.
d. The graph of y = x2 sin x oscillates between the
graphs of y = x2 and y = –x
2.
e . The graph of y = f (x) sin x or y = f (x) cos x will oscillate between the graphs of y = f (x) and y = –f(x).
40. CHALLENGE Without graphing, find the exact coordinates of the first maximum point to the right of
the y-axis for
SOLUTION:
First, find the phase shift for
Next, find the period of the function.
The first maximum for one period can be found by
finding So, incorporating the phase shift, the
first maximum to the right of the y-axis is
. Because the amplitude is |4| = 4,
the maximum point is
REASONING Determine whether each statement is true or false . Explain your reasoning.
41. Every sine function of the form y = a sin (bx + c) + d can be written as a cosine function of the form y =a cos (bx + c) + d.
SOLUTION: It is true that every sine function of the form y = a sin (bx + c) + d can be written as a cosine function of the form y = a cos (bx + c) + d. The graph of cosine is a horizontal translation of the sine graph. Therefore, a cosine function can be written from any sine function using the same amplitude and period by applying the necessary phase shift.
For example, consider and
. Phase shift by
to obtain .
42. The period of f (x) = cos 8x is equal to four times the period of g(x) = cos 2x.
SOLUTION: Find the period of f (x) = cos 8x.
Find the period of g(x) = cos 2x.
Four times the period of g(x) = cos 2x is 4 ⋅ or
4 . So, the period of f (x) is the period of g(x).
Therefore, the statement is false.
43. CHALLENGE How many zeros does y = cos
1500x have on the interval 0 ≤ x ≤ 2 ?
SOLUTION: Find the period of y = cos 1500x.
Graph y = cos 1500x on .
The graph of y = cos 1500x has two x-intercepts for one cycle, so the function has 2 zeros per cycle. Find
the number of cycles for y = cos 1500x on [0, 2 ].
So, the graph of y = cos 1500x will complete 1500
cycles on [0, 2 ]. Because there are two zeros per cycle, y = cos 1500x will have 1500(2) or 3000 zeros
on [0, 2 ].
44. PROOF Prove the phase shift formula.
SOLUTION:
Consider y = a sin (bx + c), where a , b, and c ≠ 0. To find a zero of the function, find the value of x for which a sin (bx + c) = 0. Since sin 0 = 0, solving bx + c = 0 will yield a zero of the function.
Therefore, y = 0 when . The value of is
the phase shift. When c > 0: The graph of y = a sin (bx + c) is the
graph of y = a sin x, shifted units to the left.
When c < 0: The graph of y = a sin (bx + c) is the
graph of y = a sin x, shifted units to the right.
Consider the graph of y = cos x below in blue. In this equation a = 1, b = 1 and c = 0. One zero of y = cos x is . The green graph is shifted to the
left. Thus c is – . Then the shifted equation will be
.
45. Writing in Math The Power Tower ride in Sandusky, Ohio, is shown below. Along the side of each tower is a string of lights that send a continuouspulse of light up and down each tower at a constant rate. Explain why the distance d of this light from theground over time t cannot be represented by a sinusoidal function.
SOLUTION: Sample answer: Although the pulse of light can be represented as a function with a period, it is not a sinusoidal function because the distance the pulse of light is from the ground changes at a constant rate. As a result, the graph of this function would resemble the graph below.
The given point lies on the terminal side of an angle θ in standard position. Find the values of
the six trigonometric functions of θ. 46. (−4, 4)
SOLUTION: Use the values of x and y to find r.
Use x = –4, y = 4, and r = to write the six trigonometric ratios.
47. (8, −2)
SOLUTION: Use the values of x and y to find r.
Use x = 8, y = –2, and r = to write the six trigonometric ratios.
48. (−5, −9)
SOLUTION: Use the values of x and y to find r.
Use x = –5, y = – 9, and r = to write the six trigonometric ratios.
49. (4, 5)
SOLUTION: Use the values of x and y to find r.
Use x = 4, y = 5, and r = to write the six trigonometric ratios.
Write each degree measure in radians as a multiple of π and each radian measure in degrees.
50. 25°
SOLUTION: To convert a degree measure to radians, multiply by
51. −420°
SOLUTION: To convert a degree measure to radians, multiply by
52.
SOLUTION: To convert a radian measure to degrees, multiply by
53.
SOLUTION: To convert a radian measure to degrees, multiply by
54. SCIENCE Radiocarbon dating is a method of estimating the age of an organic material by calculating the amount of carbon-14 present in the material. The age of a material can be calculated
using A = t , where A is the age of the
object in years, t is the half-life of carbon-14 or 5700 years, and R is the ratio of the amount of carbon-14 in the sample to the amount of carbon-14 in living tissue. a. A sample of organic material contains 0.000076 gram of carbon-14. A living sample of the same
eSolutions Manual - Powered by Cognero Page 16
4-4 Graphing Sine and Cosine Functions
Describe how the graphs of f (x) and g (x) are related. Then find the amplitude of g (x), and sketch two periods of both functions on the same coordinate axes.
1. f (x) = sin x; g(x) = sin x
SOLUTION: The graph of g(x) is the graph of f (x) compressed
vertically. The amplitude of g(x) is or .
Create a table listing the coordinates of the x-intercepts and extrema for f (x) = sin x for one
period, 2 , on the interval [0, 2 ]. Then use the amplitude of g(x) to find corresponding points on its graph.
Sketch the curve through the indicated points for each function. Then repeat the pattern to complete asecond period.
Functions f (x) = sin x g(x) = sin x
x-int (0, 0) (0, 0)
Max
x-int
Min
x-int
2.
SOLUTION: The graph of g(x) is the graph of f (x) compressed
vertically. The amplitude of g(x) is or .
Create a table listing the coordinates of the x-intercepts and extrema for f (x) = cos x for one
period, 2 , on the interval [0, 2 ]. Then use the amplitude of g(x) to find corresponding points on its graph.
Sketch the curve through the indicated points for each function. Then repeat the pattern to complete asecond period.
Function f (x) = cos x
Max (0, 1)
x-int Min
x-in
Min
x-int
Function f (x) = cos x
Max x-int
Min
x-in
Min
x-int
3. f (x) = cos x; g(x) = 6 cos x
SOLUTION: The graph of g(x) is the graph of f (x) expanded
vertically. The amplitude of g(x) is or 6.
Create a table listing the coordinates of the x-intercepts and extrema for f (x) = cos x for one
period, 2 , on the interval [0, 2 ]. Then use the amplitude of g(x) to find corresponding points on its graph.
Sketch the curve through the indicated points for each function. Then repeat the pattern to complete asecond period.
Functions f (x) = cos x g(x) = 6 cos x
Max (0, 1) (0, 6)
x-int
Min
x-int
Max
4. f (x) = sin x; g(x) = −8 sin x
SOLUTION: The graph of g(x) is the graph of f (x) expanded
vertically. The amplitude of g(x) is or 8.
Create a table listing the coordinates of the x-intercepts and extrema for f (x) = sin x for one
period, 2 , on the interval [0, 2 ]. Then use the amplitude of g(x) to find corresponding points on its graph.
Sketch the curve through the indicated points for each function. Then repeat the pattern to complete asecond period.
Function f (x) = sin x
x-int (0, 0)
Max
x-int
Min
x-int
Function g(x) = −8
sin x
x-int (0, 0)
Min
x-int
Max
x-int
Describe how the graphs of f (x) and g (x) are related. Then find the period of g (x), and sketch at least one period of both functions on the same coordinate axes.
5. f (x) = sin x; g(x) = sin 4x
SOLUTION: The graph of g(x) is the graph of f (x) compressed
horizontally. The period of g(x) is . To find
corresponding points on the graph of g(x), change the x-coordinates of those key points on f (x) so that
they range from 0 to , increasing by increments of
.
Sketch the curve through the indicated points for each function. Then repeat the pattern to complete asecond period.
Functions f (x) = sin x g(x) = sin
4x
x-int (0, 0) (0, 0)
Max
x-int
Min
x-int
6. f (x) = cos x; g(x) = cos 2x
SOLUTION: The graph of g(x) is the graph of f (x) compressed
horizontally. The period of g(x) is or . To find
corresponding points on the graph of g(x), change the x-coordinates of those key points on f (x) so that
they range from 0 to , increasing by increments of
.
Sketch the curve through the indicated points for each function. Then repeat the pattern to complete asecond period.
Functions f (x) = cos x g(x) = cos 2x
Max (0, 1) (0, 1)
x-int
Min
x-int
Max
7. f (x) = cos x;
SOLUTION: The graph of g(x) is the graph of f (x) expanded
horizontally. The period of g(x) is . To
find corresponding points on the graph of g(x), change the x-coordinates of those key points on f (x)
so that they range from 0 to , increasing by
increments of or .
Sketch the curve through the indicated points for each function. Then repeat the pattern to complete asecond period.
Functions f (x) = cos x
Max (0, 1) (0, 1)
x-int
Min
x-int
Max
8. f (x) = sin x;
SOLUTION: The graph of g(x) is the graph of f (x) expanded
horizontally. The period of g(x) is . To find corresponding points on the graph of g(x), change the x-coordinates of those key points on f (x) so that they range from 0 to , increasing by increments of
or .
Sketch the curve through the indicated points for each function. Then repeat the pattern to complete asecond period.
Functions f (x) = sin x
x-int (0, 0) (0, 0)
Max
x-int
Min
x-int
9. VOICES The contralto vocal type includes the deepest female singing voice. Some contraltos can sing as low as the E below middle C (E3), which hasa frequency of 165 hertz. Write an equation for a sine function that models the initial behavior of the sound wave associated with E3 having an amplitude of 0.15.
SOLUTION: The general form of the equation will be y = a sin bt,where t is the time in seconds. Because the
amplitude is 0.15, |a|= 0.15. This means that a = ±0.15. The period is the reciprocal of the frequency or
. Use this value to find b.
Sample answer: One sine function that models the
initial behavior is y = 0.15 sin 330 t.
Write a sine function that can be used to model the initial behavior of a sound wave with the frequency and amplitude given.
10. f = 440, a = 0.3
SOLUTION: The general form of the equation is y = a sin bt, where t is the time in seconds. Because the
amplitude is 0.3, = 0.3. This means that a = ±0.3.
The period is the reciprocal of the frequency or
. Use this value to find b.
Using the positive values of a and b, one sine function that models the initial behavior is y = 0.3 sin
880 t.
11. f = 932, a = 0.25
SOLUTION: The general form of the equation is y = a sin bt, where t is the time in seconds. Because the
amplitude is 0.25, = 0.25. This means that a =
±0.25. The period is the reciprocal of the frequency
or . Use this value to find b.
Using the positive values of a and b, one sine function that models the initial behavior is y = 0.25
sin 1864 t.
12. f = 1245, a = 0.12
SOLUTION: The general form of the equation is y = a sin bt, where t is the time in seconds. Because the
amplitude is 0.12, = 0.12. This means that a =
±0.12. The period is the reciprocal of the frequency or
. Use this value to find b.
Using the positive values of a and b, one sine function that models the initial behavior is y = 0.12
sin 2490 t.
13. f = 623, a = 0.2
SOLUTION: The general form of the equation is y = a sin bt, where t is the time in seconds. Because the
amplitude is 0.2, = 0.2. This means that a = ±0.2.
The period is the reciprocal of the frequency or
. Use this value to find b.
Using the positive values of a and b, one sine function that models the initial behavior is y = 0.2 sin
1246 t.
State the amplitude, period, frequency, phase shift, and vertical shift of each function. Then graph two periods of the function.
14.
SOLUTION:
In this function, a = 3, b = 1, c = − , and d = 0.
Because d = 0, there is no vertical shift.
Graph y = 3 sin x shifted units to the right.
15.
SOLUTION:
In this function, a = 1, b = , c = , and d = 0.
Because d = 0, there is no vertical shift.
16. y = 0.25 cos x + 3
SOLUTION:
In this function, a = , b = 1, c = 0, and d = 3.
Graph y = cos x shifted 3 units up.
17. y = sin 3x – 2
SOLUTION: In this function, a = 1, b = 3, c = 0, and d = –2.
Graph y = sin 3x shifted 2 units down.
18.
SOLUTION:
In this function, a = 1, b = 1, c = , and d = –1.
.
Graph y = cos x shifted units to the right and 1
unit down.
19.
SOLUTION:
In this function, a = 1, b = 1, c = , and d = 4.
.
Graph y = sin x shifted units to the left and 4 units up.
20. VACATIONS The average number of reservations R that a vacation resort has at the beginning of each month is shown.
a. Write an equation of a sinusoidal function that models the average number of reservations using x =1 to represent January. b. According to your model, approximately how many reservations can the resort anticipate in November?
SOLUTION: a. Make a scatter plot of the data and choose a model.
Sample answer: Use a sinusoidal function of the form y = a cos (bx + c) + d to model the data. First, find the maximum M and minimum m values of the data, and use these values to find a, b, c, and d. The maximum and minimum reservations are 200 and 87, respectively. The amplitude a is half of the distance between these values.
The vertical shift d is the average of the maximum and minimum data values.
There are 3 months between the maximum and minimum, so the period is 6.
The maximum data value occurs when x = 1. Since y = cos x attains its first maximum when x = 0, we must apply a phase shift of 1 unit. Use this value to find c.
Write a function using the values for a, b, c, and d.
Use b =
b. To find the number of reservations in November, evaluate the model for x = 11.
Therefore, the resort can anticipate about 115 reservations in November.
21. TIDES The table shown below provides data for the first high and low tides of the day for a certain bay during one day in June.
a. Determine the amplitude, period, phase shift, and vertical shift of a sinusoidal function that models the height of the tide. Let x represent the number of hours that the high or low tide occurred after midnight. b. Write a sinusoidal function that models the data. c. According to your model, what was the height of
the tide at 8:45 P.M. that night?
SOLUTION: a. Sample answer: Use a sinusoidal function of the form y = a cos (bx + c) + d to model the data. First, find the amplitude a, which is half of the distance between the heights of the high and low tides.
The vertical shift d is the average of the heights of the high and low tides.
A sinusoid completes half of a period in the time thatit takes to go from its maximum to its minimum value. One period is twice this time. The first high tide occurs 6.5 hours before the first low tide, so the period is 13.
The maximum data value occurs when x ≈ 4.417. Since y = cos x attains its first maximum when x = 0,we must apply a phase shift of 4.417 units. Use this value to find c.
b. Write a function using the values for a, b, c, and
d. Use b =
c. To find the height of the water at 8:45 P.M. that
night, evaluate the model for x = 20.75.
Therefore, the tide was about 7.28 feet high at 8:45
P.M. that night.
22. METEOROLOGY The average monthly temperatures for Boston, Massachusetts are shown.
a. Determine the amplitude, period, phase shift, and vertical shift of a sinusoidal function that models the monthly temperatures using x = 1 to represent January. b. Write an equation of a sinusoidal function that models the monthly temperatures. c. According to your model, what is Boston’s average temperature in August?
SOLUTION: a. The maximum and minimum are 74° and 29°, respectively. The amplitude a is half of the distance between these values.
The vertical shift d is the average of the maximum and minimum data values.
A sinusoid completes half of a period in the time thatit takes to go from its maximum to its minimum value. So, one period is twice this time. The
maximum function value occurs in July, so xmax is 7.
The minimum function value occurs in January, so
xmin is 1. The period is 2(6) = 12.
The maximum data value occurs when x = 7. Since y = cos x attains its first maximum when x = 0, we must apply a phase shift of 7 units. Use this value to find c.
b. Using the values for a, b, c, and d from part a, a sinusoidal function that models that monthly temperatures in Boston is
c. To find the average monthly temperature for Boston in August, evaluate the model for x = 8.
Therefore, the average monthly temperature for Boston in August is about 71°F.
GRAPHING CALCULATOR Find the values of x in the interval – < x < that make each equation or inequality true. (Hint: Use the intersection function.)
23. –sin x = cos x
SOLUTION:
Graph y = −sin x and y = cos x on the same graphing
calculator screen on (−π, π). Use the intersect feature under the CALC menu to determine where the two graphs intersect.
The graphs intersect at about −0.7854 or − and
about 2.356 or . Therefore, on –π < x < π, –sin x
= cos x when x = − and .
24. sin x − cos x = 1
SOLUTION:
Graph y = sin x − cos x and y = 1 on the same
graphing calculator screen on (− , ). Use the intersect feature under the CALC menu to determine where the two graphs intersect.
The graphs intersect at about 1.57 or . Therefore,
on – < x < , sin x − cos x = 1 when x = .
25. sin x + cos x = 0
SOLUTION:
Graph y = sin x + cos x on (−π, π). Use the zero feature under the CALC menu to determine the zeros of the function.
There are zeros at about −0.785 or − or and about
2.356 or . Therefore, on – < x < , sin x + cos
x = 0 when
26. cos x ≤ sin x
SOLUTION:
Graph y = cos x and y = sin x on (−π, π). Use the intersect feature under the CALC menu to determine on what interval(s) cos x ≤ sin x.
The graphs intersect at about –2.356 or – and
about 0.785 or . From the graph, it appears that
cos x ≤ sin x on – < x < – and < x < .
27. sin x cos x > 1
SOLUTION:
Graph y = sin x cos x and y = 1 on (− , ). Use the intersect feature under the CALC menu to determine on what interval(s) sin x cos x > 1.
The graphs do not intersect. Therefore, y = sin x cos
x is not greater than y = 1 for any values of x on –< x < .
28. sin x cos x ≤ 0
SOLUTION:
Graph y = sin x cos x on (−π, π). Use the zero feature under the CALC menu to determine on what interval(s) sin x cos x ≤ 0.
The zeros of y = sin x cos x are about –1.57 or ,
0, and about 1.57 or . From the graph, it appears
that sin x cos x ≤ 0 on < x < 0 and < x < .
29. CAROUSELS A wooden horse on a carousel moves up and down as the carousel spins. When the ride ends, the horse usually stops in a vertical position different from where it started. The position y of the horse after t seconds can be modeled by y =1.5 sin (2t + c), where the phase shift c must be continuously adjusted to compensate for the differentstarting positions. If during one ride the horse
reached a maximum height after seconds, find
the equation that models the horse’s position.
SOLUTION: First, find the period of y = 1.5 sin (2t + c).
Since the period is π, the function will reach a
maximum height at radians. The phase shift is the
difference between the horizontal position of the
function at and radians, which is radians.
Substitute and b into the phase shift formula to
find c.
Therefore, the equation is
30. AMUSEMENT PARKS The position y in feet of a passenger cart relative to the center of a Ferris wheel over t seconds is shown below.
a. Find the time t that it takes for the cart to return toy = 0 during its initial spin. b. Find the period of the Ferris wheel. c. Sketch the graph representing the position of the passenger cart over one period. d. Write a sinusoidal function that models the position of the passenger cart as a function of time t.
SOLUTION: a. From the diagram, the height of the cart is 0 ft when t = 0, and reaches a maximum height of 19 feet when t = 3.75 seconds. So, the cart will return to y = 0 after 2(3.75) or 7.5 seconds. b. The cart completes half of a cycle from t = 0 to t = 7.5. So, the period is 2(7.5) or 15 seconds. c.
d. The amplitude a is half of the maximum and
minimum values. So, a =
The vertical shift d is the average of the maximum
and minimum data values. So,
Because the period of a sinusoidal function is
you can write Therefore,
There is no phase shift because the height of the cartwhen t = 0 is 0 feet, and the sine function has a y-intercept of 0. Therefore, one equation that could be used to model
the position of the passenger cart is y = 19 sin t.
Write an equation that corresponds to each graph.
31.
SOLUTION: Sample answer: There is an x-intercept at 0, so one equation that corresponds to this graph is y = a sin (bx + c) + d. Half of the distance from the maximum to the minimum value of the function is 3. So, the amplitudeis 3. It appears that the function completes one period on
[0, π]. Find b.
The midline appears to be at y = 0, so there does not appear to be any vertical shift. Therefore, one equation that corresponds to this graph is y = 3 sin (2x).
32.
SOLUTION:
Sample answer: Because there is a y-intercept at ,
one equation that corresponds to this graph is y = a cos (bx + c) + d. Half of the distance from the maximum to the
minimum value of the function is . So, the
amplitude is .
It appears that the function completes one period on [0, 6π]. Find b.
The midline appears to be at y = 0, so there does not appear to be any vertical shift. Therefore, one
equation that corresponds to this graph is y = cos
.
33.
SOLUTION: Sample answer: Because there is a y-intercept at 3, one equation that corresponds to this graph is y = a cos (bx + c) + d. Half of the distance from the maximum to the
minimum value of the function is 4 ÷ 2 or 2. So, the amplitude is 2. It appears that the function completes one period on
Find b.
The midline appears to be at y = 1, so there is a vertical shift 1 unit up. Therefore, one equation that corresponds to this graph is y = 2 cos 4x + 1.
34.
SOLUTION: Sample answer: There is an x-intercept at 0, so one equation that corresponds to this graph is y = a sin (bx + c) + d. Half of the distance from the maximum to the
minimum value of the function is 8 ÷ 2 or 4. So, the amplitude is 4. It appears that the function completes one period on [0, 4π]. Find b.
The midline appears to be at y = −2, so there is a vertical shift of 2 units down. Therefore, one equation that corresponds to this graph is y = 4 sin
− 2.
Write a sinusoidal function with the given period and amplitude that passes through the given point.
35. period: ; amplitude: 5; point:
SOLUTION: Use the period to find b.
Sample answer: One sinusoidal function in which a =5 and b = 2 is y = 5 cos 2x. Evaluate the function for
The function passes through . Therefore, a
sinusoidal function with period π and amplitude 5 that
passes through the point is y = 5 cos 2x.
36. period: 4 ; amplitude: 2; point: ( , 2)
SOLUTION: Use the period to find b.
Sample answer: One sinusoidal function in which a =
2 and b = is y = 2 sin . Evaluate the function
for x = π.
The function passes through ( , 2). Therefore, a
sinusoidal function with period 4π and amplitude 2
that passes through the point ( , 2) is y = 2 sin .
37. period: ; amplitude: ; point:
SOLUTION: Use the period to find b.
Sample answer: One sinusoidal function in which a =1.5 and b = 4 is y = 1.5 cos 4x. Evaluate the function
for
The function passes through . Therefore, a
sinusoidal function with period and amplitude 1.5
that passes through the point is y = 1.5 cos
4x.
38. period: 3π; amplitude: ; point:
SOLUTION: Use the period to find b.
Sample answer: One sinusoidal function in which a =
0.5 and b = is y = sin x. Evaluate the
function for
The function passes through . Therefore, a
sinusoidal function with period 3π and amplitude 0.5
that passes through the point is y = sin
x.
39. MULTIPLE REPRESENTATIONS In this problem, you will investigate the change in the graph of a sinusoidal function of the form y = sin x or y = cos x when multiplied by a polynomial function. a. GRAPHICAL Use a graphing calculator to sketch the graphs of y = 2x, y = –2x, and y = 2x cos x on the same coordinate plane, on the interval [–20, 20]. b. VERBAL Describe the behavior of the graph of y = 2x cos x in relation to the graphs of y = 2x and y = –2x. c. GRAPHICAL Use a graphing calculator to
sketch the graphs of y = x2, y = –x
2, and y = x
2 sin x
on the same coordinate plane, on the interval [–20, 20]. d. VERBAL Describe the behavior of the graph of
y = x2 sin x in relation to the graphs of y = x
2 and y
= –x2.
e. ANALYTICAL Make a conjecture as to the behavior of the graph of a sinusoidal function of the form y = sin x or y = cos x when multiplied by polynomial function of the form y = f (x).
SOLUTION: a.
b. The graph of y = 2x cos x oscillates between the graphs of y = 2x and y = –2x. c.
d. The graph of y = x2 sin x oscillates between the
graphs of y = x2 and y = –x
2.
e . The graph of y = f (x) sin x or y = f (x) cos x will oscillate between the graphs of y = f (x) and y = –f(x).
40. CHALLENGE Without graphing, find the exact coordinates of the first maximum point to the right of
the y-axis for
SOLUTION:
First, find the phase shift for
Next, find the period of the function.
The first maximum for one period can be found by
finding So, incorporating the phase shift, the
first maximum to the right of the y-axis is
. Because the amplitude is |4| = 4,
the maximum point is
REASONING Determine whether each statement is true or false . Explain your reasoning.
41. Every sine function of the form y = a sin (bx + c) + d can be written as a cosine function of the form y =a cos (bx + c) + d.
SOLUTION: It is true that every sine function of the form y = a sin (bx + c) + d can be written as a cosine function of the form y = a cos (bx + c) + d. The graph of cosine is a horizontal translation of the sine graph. Therefore, a cosine function can be written from any sine function using the same amplitude and period by applying the necessary phase shift.
For example, consider and
. Phase shift by
to obtain .
42. The period of f (x) = cos 8x is equal to four times the period of g(x) = cos 2x.
SOLUTION: Find the period of f (x) = cos 8x.
Find the period of g(x) = cos 2x.
Four times the period of g(x) = cos 2x is 4 ⋅ or
4 . So, the period of f (x) is the period of g(x).
Therefore, the statement is false.
43. CHALLENGE How many zeros does y = cos
1500x have on the interval 0 ≤ x ≤ 2 ?
SOLUTION: Find the period of y = cos 1500x.
Graph y = cos 1500x on .
The graph of y = cos 1500x has two x-intercepts for one cycle, so the function has 2 zeros per cycle. Find
the number of cycles for y = cos 1500x on [0, 2 ].
So, the graph of y = cos 1500x will complete 1500
cycles on [0, 2 ]. Because there are two zeros per cycle, y = cos 1500x will have 1500(2) or 3000 zeros
on [0, 2 ].
44. PROOF Prove the phase shift formula.
SOLUTION:
Consider y = a sin (bx + c), where a , b, and c ≠ 0. To find a zero of the function, find the value of x for which a sin (bx + c) = 0. Since sin 0 = 0, solving bx + c = 0 will yield a zero of the function.
Therefore, y = 0 when . The value of is
the phase shift. When c > 0: The graph of y = a sin (bx + c) is the
graph of y = a sin x, shifted units to the left.
When c < 0: The graph of y = a sin (bx + c) is the
graph of y = a sin x, shifted units to the right.
Consider the graph of y = cos x below in blue. In this equation a = 1, b = 1 and c = 0. One zero of y = cos x is . The green graph is shifted to the
left. Thus c is – . Then the shifted equation will be
.
45. Writing in Math The Power Tower ride in Sandusky, Ohio, is shown below. Along the side of each tower is a string of lights that send a continuouspulse of light up and down each tower at a constant rate. Explain why the distance d of this light from theground over time t cannot be represented by a sinusoidal function.
SOLUTION: Sample answer: Although the pulse of light can be represented as a function with a period, it is not a sinusoidal function because the distance the pulse of light is from the ground changes at a constant rate. As a result, the graph of this function would resemble the graph below.
The given point lies on the terminal side of an angle θ in standard position. Find the values of
the six trigonometric functions of θ. 46. (−4, 4)
SOLUTION: Use the values of x and y to find r.
Use x = –4, y = 4, and r = to write the six trigonometric ratios.
47. (8, −2)
SOLUTION: Use the values of x and y to find r.
Use x = 8, y = –2, and r = to write the six trigonometric ratios.
48. (−5, −9)
SOLUTION: Use the values of x and y to find r.
Use x = –5, y = – 9, and r = to write the six trigonometric ratios.
49. (4, 5)
SOLUTION: Use the values of x and y to find r.
Use x = 4, y = 5, and r = to write the six trigonometric ratios.
Write each degree measure in radians as a multiple of π and each radian measure in degrees.
50. 25°
SOLUTION: To convert a degree measure to radians, multiply by
51. −420°
SOLUTION: To convert a degree measure to radians, multiply by
52.
SOLUTION: To convert a radian measure to degrees, multiply by
53.
SOLUTION: To convert a radian measure to degrees, multiply by
54. SCIENCE Radiocarbon dating is a method of estimating the age of an organic material by calculating the amount of carbon-14 present in the material. The age of a material can be calculated
using A = t , where A is the age of the
object in years, t is the half-life of carbon-14 or 5700 years, and R is the ratio of the amount of carbon-14 in the sample to the amount of carbon-14 in living tissue. a. A sample of organic material contains 0.000076 gram of carbon-14. A living sample of the same
eSolutions Manual - Powered by Cognero Page 17
4-4 Graphing Sine and Cosine Functions
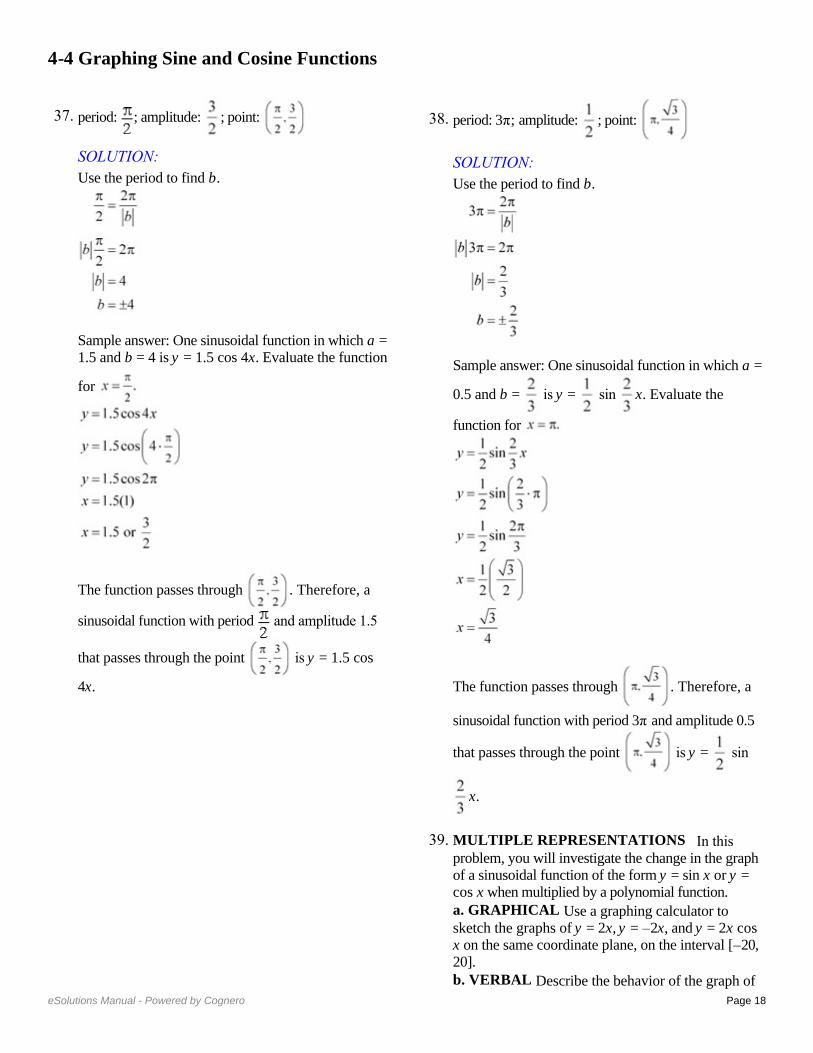
Describe how the graphs of f (x) and g (x) are related. Then find the amplitude of g (x), and sketch two periods of both functions on the same coordinate axes.
1. f (x) = sin x; g(x) = sin x
SOLUTION: The graph of g(x) is the graph of f (x) compressed
vertically. The amplitude of g(x) is or .
Create a table listing the coordinates of the x-intercepts and extrema for f (x) = sin x for one
period, 2 , on the interval [0, 2 ]. Then use the amplitude of g(x) to find corresponding points on its graph.
Sketch the curve through the indicated points for each function. Then repeat the pattern to complete asecond period.
Functions f (x) = sin x g(x) = sin x
x-int (0, 0) (0, 0)
Max
x-int
Min
x-int
2.
SOLUTION: The graph of g(x) is the graph of f (x) compressed
vertically. The amplitude of g(x) is or .
Create a table listing the coordinates of the x-intercepts and extrema for f (x) = cos x for one
period, 2 , on the interval [0, 2 ]. Then use the amplitude of g(x) to find corresponding points on its graph.
Sketch the curve through the indicated points for each function. Then repeat the pattern to complete asecond period.
Function f (x) = cos x
Max (0, 1)
x-int Min
x-in
Min
x-int
Function f (x) = cos x
Max x-int
Min
x-in
Min
x-int
3. f (x) = cos x; g(x) = 6 cos x
SOLUTION: The graph of g(x) is the graph of f (x) expanded
vertically. The amplitude of g(x) is or 6.
Create a table listing the coordinates of the x-intercepts and extrema for f (x) = cos x for one
period, 2 , on the interval [0, 2 ]. Then use the amplitude of g(x) to find corresponding points on its graph.
Sketch the curve through the indicated points for each function. Then repeat the pattern to complete asecond period.
Functions f (x) = cos x g(x) = 6 cos x
Max (0, 1) (0, 6)
x-int
Min
x-int
Max
4. f (x) = sin x; g(x) = −8 sin x
SOLUTION: The graph of g(x) is the graph of f (x) expanded
vertically. The amplitude of g(x) is or 8.
Create a table listing the coordinates of the x-intercepts and extrema for f (x) = sin x for one
period, 2 , on the interval [0, 2 ]. Then use the amplitude of g(x) to find corresponding points on its graph.
Sketch the curve through the indicated points for each function. Then repeat the pattern to complete asecond period.
Function f (x) = sin x
x-int (0, 0)
Max
x-int
Min
x-int
Function g(x) = −8
sin x
x-int (0, 0)
Min
x-int
Max
x-int
Describe how the graphs of f (x) and g (x) are related. Then find the period of g (x), and sketch at least one period of both functions on the same coordinate axes.
5. f (x) = sin x; g(x) = sin 4x
SOLUTION: The graph of g(x) is the graph of f (x) compressed
horizontally. The period of g(x) is . To find
corresponding points on the graph of g(x), change the x-coordinates of those key points on f (x) so that
they range from 0 to , increasing by increments of
.
Sketch the curve through the indicated points for each function. Then repeat the pattern to complete asecond period.
Functions f (x) = sin x g(x) = sin
4x
x-int (0, 0) (0, 0)
Max
x-int
Min
x-int
6. f (x) = cos x; g(x) = cos 2x
SOLUTION: The graph of g(x) is the graph of f (x) compressed
horizontally. The period of g(x) is or . To find
corresponding points on the graph of g(x), change the x-coordinates of those key points on f (x) so that
they range from 0 to , increasing by increments of
.
Sketch the curve through the indicated points for each function. Then repeat the pattern to complete asecond period.
Functions f (x) = cos x g(x) = cos 2x
Max (0, 1) (0, 1)
x-int
Min
x-int
Max
7. f (x) = cos x;
SOLUTION: The graph of g(x) is the graph of f (x) expanded
horizontally. The period of g(x) is . To
find corresponding points on the graph of g(x), change the x-coordinates of those key points on f (x)
so that they range from 0 to , increasing by
increments of or .
Sketch the curve through the indicated points for each function. Then repeat the pattern to complete asecond period.
Functions f (x) = cos x
Max (0, 1) (0, 1)
x-int
Min
x-int
Max
8. f (x) = sin x;
SOLUTION: The graph of g(x) is the graph of f (x) expanded
horizontally. The period of g(x) is . To find corresponding points on the graph of g(x), change the x-coordinates of those key points on f (x) so that they range from 0 to , increasing by increments of
or .
Sketch the curve through the indicated points for each function. Then repeat the pattern to complete asecond period.
Functions f (x) = sin x
x-int (0, 0) (0, 0)
Max
x-int
Min
x-int
9. VOICES The contralto vocal type includes the deepest female singing voice. Some contraltos can sing as low as the E below middle C (E3), which hasa frequency of 165 hertz. Write an equation for a sine function that models the initial behavior of the sound wave associated with E3 having an amplitude of 0.15.
SOLUTION: The general form of the equation will be y = a sin bt,where t is the time in seconds. Because the
amplitude is 0.15, |a|= 0.15. This means that a = ±0.15. The period is the reciprocal of the frequency or
. Use this value to find b.
Sample answer: One sine function that models the
initial behavior is y = 0.15 sin 330 t.
Write a sine function that can be used to model the initial behavior of a sound wave with the frequency and amplitude given.
10. f = 440, a = 0.3
SOLUTION: The general form of the equation is y = a sin bt, where t is the time in seconds. Because the
amplitude is 0.3, = 0.3. This means that a = ±0.3.
The period is the reciprocal of the frequency or
. Use this value to find b.
Using the positive values of a and b, one sine function that models the initial behavior is y = 0.3 sin
880 t.
11. f = 932, a = 0.25
SOLUTION: The general form of the equation is y = a sin bt, where t is the time in seconds. Because the
amplitude is 0.25, = 0.25. This means that a =
±0.25. The period is the reciprocal of the frequency
or . Use this value to find b.
Using the positive values of a and b, one sine function that models the initial behavior is y = 0.25
sin 1864 t.
12. f = 1245, a = 0.12
SOLUTION: The general form of the equation is y = a sin bt, where t is the time in seconds. Because the
amplitude is 0.12, = 0.12. This means that a =
±0.12. The period is the reciprocal of the frequency or
. Use this value to find b.
Using the positive values of a and b, one sine function that models the initial behavior is y = 0.12
sin 2490 t.
13. f = 623, a = 0.2
SOLUTION: The general form of the equation is y = a sin bt, where t is the time in seconds. Because the
amplitude is 0.2, = 0.2. This means that a = ±0.2.
The period is the reciprocal of the frequency or
. Use this value to find b.
Using the positive values of a and b, one sine function that models the initial behavior is y = 0.2 sin
1246 t.
State the amplitude, period, frequency, phase shift, and vertical shift of each function. Then graph two periods of the function.
14.
SOLUTION:
In this function, a = 3, b = 1, c = − , and d = 0.
Because d = 0, there is no vertical shift.
Graph y = 3 sin x shifted units to the right.
15.
SOLUTION:
In this function, a = 1, b = , c = , and d = 0.
Because d = 0, there is no vertical shift.
16. y = 0.25 cos x + 3
SOLUTION:
In this function, a = , b = 1, c = 0, and d = 3.
Graph y = cos x shifted 3 units up.
17. y = sin 3x – 2
SOLUTION: In this function, a = 1, b = 3, c = 0, and d = –2.
Graph y = sin 3x shifted 2 units down.
18.
SOLUTION:
In this function, a = 1, b = 1, c = , and d = –1.
.
Graph y = cos x shifted units to the right and 1
unit down.
19.
SOLUTION:
In this function, a = 1, b = 1, c = , and d = 4.
.
Graph y = sin x shifted units to the left and 4 units up.
20. VACATIONS The average number of reservations R that a vacation resort has at the beginning of each month is shown.
a. Write an equation of a sinusoidal function that models the average number of reservations using x =1 to represent January. b. According to your model, approximately how many reservations can the resort anticipate in November?
SOLUTION: a. Make a scatter plot of the data and choose a model.
Sample answer: Use a sinusoidal function of the form y = a cos (bx + c) + d to model the data. First, find the maximum M and minimum m values of the data, and use these values to find a, b, c, and d. The maximum and minimum reservations are 200 and 87, respectively. The amplitude a is half of the distance between these values.
The vertical shift d is the average of the maximum and minimum data values.
There are 3 months between the maximum and minimum, so the period is 6.
The maximum data value occurs when x = 1. Since y = cos x attains its first maximum when x = 0, we must apply a phase shift of 1 unit. Use this value to find c.
Write a function using the values for a, b, c, and d.
Use b =
b. To find the number of reservations in November, evaluate the model for x = 11.
Therefore, the resort can anticipate about 115 reservations in November.
21. TIDES The table shown below provides data for the first high and low tides of the day for a certain bay during one day in June.
a. Determine the amplitude, period, phase shift, and vertical shift of a sinusoidal function that models the height of the tide. Let x represent the number of hours that the high or low tide occurred after midnight. b. Write a sinusoidal function that models the data. c. According to your model, what was the height of
the tide at 8:45 P.M. that night?
SOLUTION: a. Sample answer: Use a sinusoidal function of the form y = a cos (bx + c) + d to model the data. First, find the amplitude a, which is half of the distance between the heights of the high and low tides.
The vertical shift d is the average of the heights of the high and low tides.
A sinusoid completes half of a period in the time thatit takes to go from its maximum to its minimum value. One period is twice this time. The first high tide occurs 6.5 hours before the first low tide, so the period is 13.
The maximum data value occurs when x ≈ 4.417. Since y = cos x attains its first maximum when x = 0,we must apply a phase shift of 4.417 units. Use this value to find c.
b. Write a function using the values for a, b, c, and
d. Use b =
c. To find the height of the water at 8:45 P.M. that
night, evaluate the model for x = 20.75.
Therefore, the tide was about 7.28 feet high at 8:45
P.M. that night.
22. METEOROLOGY The average monthly temperatures for Boston, Massachusetts are shown.
a. Determine the amplitude, period, phase shift, and vertical shift of a sinusoidal function that models the monthly temperatures using x = 1 to represent January. b. Write an equation of a sinusoidal function that models the monthly temperatures. c. According to your model, what is Boston’s average temperature in August?
SOLUTION: a. The maximum and minimum are 74° and 29°, respectively. The amplitude a is half of the distance between these values.
The vertical shift d is the average of the maximum and minimum data values.
A sinusoid completes half of a period in the time thatit takes to go from its maximum to its minimum value. So, one period is twice this time. The
maximum function value occurs in July, so xmax is 7.
The minimum function value occurs in January, so
xmin is 1. The period is 2(6) = 12.
The maximum data value occurs when x = 7. Since y = cos x attains its first maximum when x = 0, we must apply a phase shift of 7 units. Use this value to find c.
b. Using the values for a, b, c, and d from part a, a sinusoidal function that models that monthly temperatures in Boston is
c. To find the average monthly temperature for Boston in August, evaluate the model for x = 8.
Therefore, the average monthly temperature for Boston in August is about 71°F.
GRAPHING CALCULATOR Find the values of x in the interval – < x < that make each equation or inequality true. (Hint: Use the intersection function.)
23. –sin x = cos x
SOLUTION:
Graph y = −sin x and y = cos x on the same graphing
calculator screen on (−π, π). Use the intersect feature under the CALC menu to determine where the two graphs intersect.
The graphs intersect at about −0.7854 or − and
about 2.356 or . Therefore, on –π < x < π, –sin x
= cos x when x = − and .
24. sin x − cos x = 1
SOLUTION:
Graph y = sin x − cos x and y = 1 on the same
graphing calculator screen on (− , ). Use the intersect feature under the CALC menu to determine where the two graphs intersect.
The graphs intersect at about 1.57 or . Therefore,
on – < x < , sin x − cos x = 1 when x = .
25. sin x + cos x = 0
SOLUTION:
Graph y = sin x + cos x on (−π, π). Use the zero feature under the CALC menu to determine the zeros of the function.
There are zeros at about −0.785 or − or and about
2.356 or . Therefore, on – < x < , sin x + cos
x = 0 when
26. cos x ≤ sin x
SOLUTION:
Graph y = cos x and y = sin x on (−π, π). Use the intersect feature under the CALC menu to determine on what interval(s) cos x ≤ sin x.
The graphs intersect at about –2.356 or – and
about 0.785 or . From the graph, it appears that
cos x ≤ sin x on – < x < – and < x < .
27. sin x cos x > 1
SOLUTION:
Graph y = sin x cos x and y = 1 on (− , ). Use the intersect feature under the CALC menu to determine on what interval(s) sin x cos x > 1.
The graphs do not intersect. Therefore, y = sin x cos
x is not greater than y = 1 for any values of x on –< x < .
28. sin x cos x ≤ 0
SOLUTION:
Graph y = sin x cos x on (−π, π). Use the zero feature under the CALC menu to determine on what interval(s) sin x cos x ≤ 0.
The zeros of y = sin x cos x are about –1.57 or ,
0, and about 1.57 or . From the graph, it appears
that sin x cos x ≤ 0 on < x < 0 and < x < .
29. CAROUSELS A wooden horse on a carousel moves up and down as the carousel spins. When the ride ends, the horse usually stops in a vertical position different from where it started. The position y of the horse after t seconds can be modeled by y =1.5 sin (2t + c), where the phase shift c must be continuously adjusted to compensate for the differentstarting positions. If during one ride the horse
reached a maximum height after seconds, find
the equation that models the horse’s position.
SOLUTION: First, find the period of y = 1.5 sin (2t + c).
Since the period is π, the function will reach a
maximum height at radians. The phase shift is the
difference between the horizontal position of the
function at and radians, which is radians.
Substitute and b into the phase shift formula to
find c.
Therefore, the equation is
30. AMUSEMENT PARKS The position y in feet of a passenger cart relative to the center of a Ferris wheel over t seconds is shown below.
a. Find the time t that it takes for the cart to return toy = 0 during its initial spin. b. Find the period of the Ferris wheel. c. Sketch the graph representing the position of the passenger cart over one period. d. Write a sinusoidal function that models the position of the passenger cart as a function of time t.
SOLUTION: a. From the diagram, the height of the cart is 0 ft when t = 0, and reaches a maximum height of 19 feet when t = 3.75 seconds. So, the cart will return to y = 0 after 2(3.75) or 7.5 seconds. b. The cart completes half of a cycle from t = 0 to t = 7.5. So, the period is 2(7.5) or 15 seconds. c.
d. The amplitude a is half of the maximum and
minimum values. So, a =
The vertical shift d is the average of the maximum
and minimum data values. So,
Because the period of a sinusoidal function is
you can write Therefore,
There is no phase shift because the height of the cartwhen t = 0 is 0 feet, and the sine function has a y-intercept of 0. Therefore, one equation that could be used to model
the position of the passenger cart is y = 19 sin t.
Write an equation that corresponds to each graph.
31.
SOLUTION: Sample answer: There is an x-intercept at 0, so one equation that corresponds to this graph is y = a sin (bx + c) + d. Half of the distance from the maximum to the minimum value of the function is 3. So, the amplitudeis 3. It appears that the function completes one period on
[0, π]. Find b.
The midline appears to be at y = 0, so there does not appear to be any vertical shift. Therefore, one equation that corresponds to this graph is y = 3 sin (2x).
32.
SOLUTION:
Sample answer: Because there is a y-intercept at ,
one equation that corresponds to this graph is y = a cos (bx + c) + d. Half of the distance from the maximum to the
minimum value of the function is . So, the
amplitude is .
It appears that the function completes one period on [0, 6π]. Find b.
The midline appears to be at y = 0, so there does not appear to be any vertical shift. Therefore, one
equation that corresponds to this graph is y = cos
.
33.
SOLUTION: Sample answer: Because there is a y-intercept at 3, one equation that corresponds to this graph is y = a cos (bx + c) + d. Half of the distance from the maximum to the
minimum value of the function is 4 ÷ 2 or 2. So, the amplitude is 2. It appears that the function completes one period on
Find b.
The midline appears to be at y = 1, so there is a vertical shift 1 unit up. Therefore, one equation that corresponds to this graph is y = 2 cos 4x + 1.
34.
SOLUTION: Sample answer: There is an x-intercept at 0, so one equation that corresponds to this graph is y = a sin (bx + c) + d. Half of the distance from the maximum to the
minimum value of the function is 8 ÷ 2 or 4. So, the amplitude is 4. It appears that the function completes one period on [0, 4π]. Find b.
The midline appears to be at y = −2, so there is a vertical shift of 2 units down. Therefore, one equation that corresponds to this graph is y = 4 sin
− 2.
Write a sinusoidal function with the given period and amplitude that passes through the given point.
35. period: ; amplitude: 5; point:
SOLUTION: Use the period to find b.
Sample answer: One sinusoidal function in which a =5 and b = 2 is y = 5 cos 2x. Evaluate the function for
The function passes through . Therefore, a
sinusoidal function with period π and amplitude 5 that
passes through the point is y = 5 cos 2x.
36. period: 4 ; amplitude: 2; point: ( , 2)
SOLUTION: Use the period to find b.
Sample answer: One sinusoidal function in which a =
2 and b = is y = 2 sin . Evaluate the function
for x = π.
The function passes through ( , 2). Therefore, a
sinusoidal function with period 4π and amplitude 2
that passes through the point ( , 2) is y = 2 sin .
37. period: ; amplitude: ; point:
SOLUTION: Use the period to find b.
Sample answer: One sinusoidal function in which a =1.5 and b = 4 is y = 1.5 cos 4x. Evaluate the function
for
The function passes through . Therefore, a
sinusoidal function with period and amplitude 1.5
that passes through the point is y = 1.5 cos
4x.
38. period: 3π; amplitude: ; point:
SOLUTION: Use the period to find b.
Sample answer: One sinusoidal function in which a =
0.5 and b = is y = sin x. Evaluate the
function for
The function passes through . Therefore, a
sinusoidal function with period 3π and amplitude 0.5
that passes through the point is y = sin
x.
39. MULTIPLE REPRESENTATIONS In this problem, you will investigate the change in the graph of a sinusoidal function of the form y = sin x or y = cos x when multiplied by a polynomial function. a. GRAPHICAL Use a graphing calculator to sketch the graphs of y = 2x, y = –2x, and y = 2x cos x on the same coordinate plane, on the interval [–20, 20]. b. VERBAL Describe the behavior of the graph of y = 2x cos x in relation to the graphs of y = 2x and y = –2x. c. GRAPHICAL Use a graphing calculator to
sketch the graphs of y = x2, y = –x
2, and y = x
2 sin x
on the same coordinate plane, on the interval [–20, 20]. d. VERBAL Describe the behavior of the graph of
y = x2 sin x in relation to the graphs of y = x
2 and y
= –x2.
e. ANALYTICAL Make a conjecture as to the behavior of the graph of a sinusoidal function of the form y = sin x or y = cos x when multiplied by polynomial function of the form y = f (x).
SOLUTION: a.
b. The graph of y = 2x cos x oscillates between the graphs of y = 2x and y = –2x. c.
d. The graph of y = x2 sin x oscillates between the
graphs of y = x2 and y = –x
2.
e . The graph of y = f (x) sin x or y = f (x) cos x will oscillate between the graphs of y = f (x) and y = –f(x).
40. CHALLENGE Without graphing, find the exact coordinates of the first maximum point to the right of
the y-axis for
SOLUTION:
First, find the phase shift for
Next, find the period of the function.
The first maximum for one period can be found by
finding So, incorporating the phase shift, the
first maximum to the right of the y-axis is
. Because the amplitude is |4| = 4,
the maximum point is
REASONING Determine whether each statement is true or false . Explain your reasoning.
41. Every sine function of the form y = a sin (bx + c) + d can be written as a cosine function of the form y =a cos (bx + c) + d.
SOLUTION: It is true that every sine function of the form y = a sin (bx + c) + d can be written as a cosine function of the form y = a cos (bx + c) + d. The graph of cosine is a horizontal translation of the sine graph. Therefore, a cosine function can be written from any sine function using the same amplitude and period by applying the necessary phase shift.
For example, consider and
. Phase shift by
to obtain .
42. The period of f (x) = cos 8x is equal to four times the period of g(x) = cos 2x.
SOLUTION: Find the period of f (x) = cos 8x.
Find the period of g(x) = cos 2x.
Four times the period of g(x) = cos 2x is 4 ⋅ or
4 . So, the period of f (x) is the period of g(x).
Therefore, the statement is false.
43. CHALLENGE How many zeros does y = cos
1500x have on the interval 0 ≤ x ≤ 2 ?
SOLUTION: Find the period of y = cos 1500x.
Graph y = cos 1500x on .
The graph of y = cos 1500x has two x-intercepts for one cycle, so the function has 2 zeros per cycle. Find
the number of cycles for y = cos 1500x on [0, 2 ].
So, the graph of y = cos 1500x will complete 1500
cycles on [0, 2 ]. Because there are two zeros per cycle, y = cos 1500x will have 1500(2) or 3000 zeros
on [0, 2 ].
44. PROOF Prove the phase shift formula.
SOLUTION:
Consider y = a sin (bx + c), where a , b, and c ≠ 0. To find a zero of the function, find the value of x for which a sin (bx + c) = 0. Since sin 0 = 0, solving bx + c = 0 will yield a zero of the function.
Therefore, y = 0 when . The value of is
the phase shift. When c > 0: The graph of y = a sin (bx + c) is the
graph of y = a sin x, shifted units to the left.
When c < 0: The graph of y = a sin (bx + c) is the
graph of y = a sin x, shifted units to the right.
Consider the graph of y = cos x below in blue. In this equation a = 1, b = 1 and c = 0. One zero of y = cos x is . The green graph is shifted to the
left. Thus c is – . Then the shifted equation will be
.
45. Writing in Math The Power Tower ride in Sandusky, Ohio, is shown below. Along the side of each tower is a string of lights that send a continuouspulse of light up and down each tower at a constant rate. Explain why the distance d of this light from theground over time t cannot be represented by a sinusoidal function.
SOLUTION: Sample answer: Although the pulse of light can be represented as a function with a period, it is not a sinusoidal function because the distance the pulse of light is from the ground changes at a constant rate. As a result, the graph of this function would resemble the graph below.
The given point lies on the terminal side of an angle θ in standard position. Find the values of
the six trigonometric functions of θ. 46. (−4, 4)
SOLUTION: Use the values of x and y to find r.
Use x = –4, y = 4, and r = to write the six trigonometric ratios.
47. (8, −2)
SOLUTION: Use the values of x and y to find r.
Use x = 8, y = –2, and r = to write the six trigonometric ratios.
48. (−5, −9)
SOLUTION: Use the values of x and y to find r.
Use x = –5, y = – 9, and r = to write the six trigonometric ratios.
49. (4, 5)
SOLUTION: Use the values of x and y to find r.
Use x = 4, y = 5, and r = to write the six trigonometric ratios.
Write each degree measure in radians as a multiple of π and each radian measure in degrees.
50. 25°
SOLUTION: To convert a degree measure to radians, multiply by
51. −420°
SOLUTION: To convert a degree measure to radians, multiply by
52.
SOLUTION: To convert a radian measure to degrees, multiply by
53.
SOLUTION: To convert a radian measure to degrees, multiply by
54. SCIENCE Radiocarbon dating is a method of estimating the age of an organic material by calculating the amount of carbon-14 present in the material. The age of a material can be calculated
using A = t , where A is the age of the
object in years, t is the half-life of carbon-14 or 5700 years, and R is the ratio of the amount of carbon-14 in the sample to the amount of carbon-14 in living tissue. a. A sample of organic material contains 0.000076 gram of carbon-14. A living sample of the same
eSolutions Manual - Powered by Cognero Page 18
4-4 Graphing Sine and Cosine Functions

Describe how the graphs of f (x) and g (x) are related. Then find the amplitude of g (x), and sketch two periods of both functions on the same coordinate axes.
1. f (x) = sin x; g(x) = sin x
SOLUTION: The graph of g(x) is the graph of f (x) compressed
vertically. The amplitude of g(x) is or .
Create a table listing the coordinates of the x-intercepts and extrema for f (x) = sin x for one
period, 2 , on the interval [0, 2 ]. Then use the amplitude of g(x) to find corresponding points on its graph.
Sketch the curve through the indicated points for each function. Then repeat the pattern to complete asecond period.
Functions f (x) = sin x g(x) = sin x
x-int (0, 0) (0, 0)
Max
x-int
Min
x-int
2.
SOLUTION: The graph of g(x) is the graph of f (x) compressed
vertically. The amplitude of g(x) is or .
Create a table listing the coordinates of the x-intercepts and extrema for f (x) = cos x for one
period, 2 , on the interval [0, 2 ]. Then use the amplitude of g(x) to find corresponding points on its graph.
Sketch the curve through the indicated points for each function. Then repeat the pattern to complete asecond period.
Function f (x) = cos x
Max (0, 1)
x-int Min
x-in
Min
x-int
Function f (x) = cos x
Max x-int
Min
x-in
Min
x-int
3. f (x) = cos x; g(x) = 6 cos x
SOLUTION: The graph of g(x) is the graph of f (x) expanded
vertically. The amplitude of g(x) is or 6.
Create a table listing the coordinates of the x-intercepts and extrema for f (x) = cos x for one
period, 2 , on the interval [0, 2 ]. Then use the amplitude of g(x) to find corresponding points on its graph.
Sketch the curve through the indicated points for each function. Then repeat the pattern to complete asecond period.
Functions f (x) = cos x g(x) = 6 cos x
Max (0, 1) (0, 6)
x-int
Min
x-int
Max
4. f (x) = sin x; g(x) = −8 sin x
SOLUTION: The graph of g(x) is the graph of f (x) expanded
vertically. The amplitude of g(x) is or 8.
Create a table listing the coordinates of the x-intercepts and extrema for f (x) = sin x for one
period, 2 , on the interval [0, 2 ]. Then use the amplitude of g(x) to find corresponding points on its graph.
Sketch the curve through the indicated points for each function. Then repeat the pattern to complete asecond period.
Function f (x) = sin x
x-int (0, 0)
Max
x-int
Min
x-int
Function g(x) = −8
sin x
x-int (0, 0)
Min
x-int
Max
x-int
Describe how the graphs of f (x) and g (x) are related. Then find the period of g (x), and sketch at least one period of both functions on the same coordinate axes.
5. f (x) = sin x; g(x) = sin 4x
SOLUTION: The graph of g(x) is the graph of f (x) compressed
horizontally. The period of g(x) is . To find
corresponding points on the graph of g(x), change the x-coordinates of those key points on f (x) so that
they range from 0 to , increasing by increments of
.
Sketch the curve through the indicated points for each function. Then repeat the pattern to complete asecond period.
Functions f (x) = sin x g(x) = sin
4x
x-int (0, 0) (0, 0)
Max
x-int
Min
x-int
6. f (x) = cos x; g(x) = cos 2x
SOLUTION: The graph of g(x) is the graph of f (x) compressed
horizontally. The period of g(x) is or . To find
corresponding points on the graph of g(x), change the x-coordinates of those key points on f (x) so that
they range from 0 to , increasing by increments of
.
Sketch the curve through the indicated points for each function. Then repeat the pattern to complete asecond period.
Functions f (x) = cos x g(x) = cos 2x
Max (0, 1) (0, 1)
x-int
Min
x-int
Max
7. f (x) = cos x;
SOLUTION: The graph of g(x) is the graph of f (x) expanded
horizontally. The period of g(x) is . To
find corresponding points on the graph of g(x), change the x-coordinates of those key points on f (x)
so that they range from 0 to , increasing by
increments of or .
Sketch the curve through the indicated points for each function. Then repeat the pattern to complete asecond period.
Functions f (x) = cos x
Max (0, 1) (0, 1)
x-int
Min
x-int
Max
8. f (x) = sin x;
SOLUTION: The graph of g(x) is the graph of f (x) expanded
horizontally. The period of g(x) is . To find corresponding points on the graph of g(x), change the x-coordinates of those key points on f (x) so that they range from 0 to , increasing by increments of
or .
Sketch the curve through the indicated points for each function. Then repeat the pattern to complete asecond period.
Functions f (x) = sin x
x-int (0, 0) (0, 0)
Max
x-int
Min
x-int
9. VOICES The contralto vocal type includes the deepest female singing voice. Some contraltos can sing as low as the E below middle C (E3), which hasa frequency of 165 hertz. Write an equation for a sine function that models the initial behavior of the sound wave associated with E3 having an amplitude of 0.15.
SOLUTION: The general form of the equation will be y = a sin bt,where t is the time in seconds. Because the
amplitude is 0.15, |a|= 0.15. This means that a = ±0.15. The period is the reciprocal of the frequency or
. Use this value to find b.
Sample answer: One sine function that models the
initial behavior is y = 0.15 sin 330 t.
Write a sine function that can be used to model the initial behavior of a sound wave with the frequency and amplitude given.
10. f = 440, a = 0.3
SOLUTION: The general form of the equation is y = a sin bt, where t is the time in seconds. Because the
amplitude is 0.3, = 0.3. This means that a = ±0.3.
The period is the reciprocal of the frequency or
. Use this value to find b.
Using the positive values of a and b, one sine function that models the initial behavior is y = 0.3 sin
880 t.
11. f = 932, a = 0.25
SOLUTION: The general form of the equation is y = a sin bt, where t is the time in seconds. Because the
amplitude is 0.25, = 0.25. This means that a =
±0.25. The period is the reciprocal of the frequency
or . Use this value to find b.
Using the positive values of a and b, one sine function that models the initial behavior is y = 0.25
sin 1864 t.
12. f = 1245, a = 0.12
SOLUTION: The general form of the equation is y = a sin bt, where t is the time in seconds. Because the
amplitude is 0.12, = 0.12. This means that a =
±0.12. The period is the reciprocal of the frequency or
. Use this value to find b.
Using the positive values of a and b, one sine function that models the initial behavior is y = 0.12
sin 2490 t.
13. f = 623, a = 0.2
SOLUTION: The general form of the equation is y = a sin bt, where t is the time in seconds. Because the
amplitude is 0.2, = 0.2. This means that a = ±0.2.
The period is the reciprocal of the frequency or
. Use this value to find b.
Using the positive values of a and b, one sine function that models the initial behavior is y = 0.2 sin
1246 t.
State the amplitude, period, frequency, phase shift, and vertical shift of each function. Then graph two periods of the function.
14.
SOLUTION:
In this function, a = 3, b = 1, c = − , and d = 0.
Because d = 0, there is no vertical shift.
Graph y = 3 sin x shifted units to the right.
15.
SOLUTION:
In this function, a = 1, b = , c = , and d = 0.
Because d = 0, there is no vertical shift.
16. y = 0.25 cos x + 3
SOLUTION:
In this function, a = , b = 1, c = 0, and d = 3.
Graph y = cos x shifted 3 units up.
17. y = sin 3x – 2
SOLUTION: In this function, a = 1, b = 3, c = 0, and d = –2.
Graph y = sin 3x shifted 2 units down.
18.
SOLUTION:
In this function, a = 1, b = 1, c = , and d = –1.
.
Graph y = cos x shifted units to the right and 1
unit down.
19.
SOLUTION:
In this function, a = 1, b = 1, c = , and d = 4.
.
Graph y = sin x shifted units to the left and 4 units up.
20. VACATIONS The average number of reservations R that a vacation resort has at the beginning of each month is shown.
a. Write an equation of a sinusoidal function that models the average number of reservations using x =1 to represent January. b. According to your model, approximately how many reservations can the resort anticipate in November?
SOLUTION: a. Make a scatter plot of the data and choose a model.
Sample answer: Use a sinusoidal function of the form y = a cos (bx + c) + d to model the data. First, find the maximum M and minimum m values of the data, and use these values to find a, b, c, and d. The maximum and minimum reservations are 200 and 87, respectively. The amplitude a is half of the distance between these values.
The vertical shift d is the average of the maximum and minimum data values.
There are 3 months between the maximum and minimum, so the period is 6.
The maximum data value occurs when x = 1. Since y = cos x attains its first maximum when x = 0, we must apply a phase shift of 1 unit. Use this value to find c.
Write a function using the values for a, b, c, and d.
Use b =
b. To find the number of reservations in November, evaluate the model for x = 11.
Therefore, the resort can anticipate about 115 reservations in November.
21. TIDES The table shown below provides data for the first high and low tides of the day for a certain bay during one day in June.
a. Determine the amplitude, period, phase shift, and vertical shift of a sinusoidal function that models the height of the tide. Let x represent the number of hours that the high or low tide occurred after midnight. b. Write a sinusoidal function that models the data. c. According to your model, what was the height of
the tide at 8:45 P.M. that night?
SOLUTION: a. Sample answer: Use a sinusoidal function of the form y = a cos (bx + c) + d to model the data. First, find the amplitude a, which is half of the distance between the heights of the high and low tides.
The vertical shift d is the average of the heights of the high and low tides.
A sinusoid completes half of a period in the time thatit takes to go from its maximum to its minimum value. One period is twice this time. The first high tide occurs 6.5 hours before the first low tide, so the period is 13.
The maximum data value occurs when x ≈ 4.417. Since y = cos x attains its first maximum when x = 0,we must apply a phase shift of 4.417 units. Use this value to find c.
b. Write a function using the values for a, b, c, and
d. Use b =
c. To find the height of the water at 8:45 P.M. that
night, evaluate the model for x = 20.75.
Therefore, the tide was about 7.28 feet high at 8:45
P.M. that night.
22. METEOROLOGY The average monthly temperatures for Boston, Massachusetts are shown.
a. Determine the amplitude, period, phase shift, and vertical shift of a sinusoidal function that models the monthly temperatures using x = 1 to represent January. b. Write an equation of a sinusoidal function that models the monthly temperatures. c. According to your model, what is Boston’s average temperature in August?
SOLUTION: a. The maximum and minimum are 74° and 29°, respectively. The amplitude a is half of the distance between these values.
The vertical shift d is the average of the maximum and minimum data values.
A sinusoid completes half of a period in the time thatit takes to go from its maximum to its minimum value. So, one period is twice this time. The
maximum function value occurs in July, so xmax is 7.
The minimum function value occurs in January, so
xmin is 1. The period is 2(6) = 12.
The maximum data value occurs when x = 7. Since y = cos x attains its first maximum when x = 0, we must apply a phase shift of 7 units. Use this value to find c.
b. Using the values for a, b, c, and d from part a, a sinusoidal function that models that monthly temperatures in Boston is
c. To find the average monthly temperature for Boston in August, evaluate the model for x = 8.
Therefore, the average monthly temperature for Boston in August is about 71°F.
GRAPHING CALCULATOR Find the values of x in the interval – < x < that make each equation or inequality true. (Hint: Use the intersection function.)
23. –sin x = cos x
SOLUTION:
Graph y = −sin x and y = cos x on the same graphing
calculator screen on (−π, π). Use the intersect feature under the CALC menu to determine where the two graphs intersect.
The graphs intersect at about −0.7854 or − and
about 2.356 or . Therefore, on –π < x < π, –sin x
= cos x when x = − and .
24. sin x − cos x = 1
SOLUTION:
Graph y = sin x − cos x and y = 1 on the same
graphing calculator screen on (− , ). Use the intersect feature under the CALC menu to determine where the two graphs intersect.
The graphs intersect at about 1.57 or . Therefore,
on – < x < , sin x − cos x = 1 when x = .
25. sin x + cos x = 0
SOLUTION:
Graph y = sin x + cos x on (−π, π). Use the zero feature under the CALC menu to determine the zeros of the function.
There are zeros at about −0.785 or − or and about
2.356 or . Therefore, on – < x < , sin x + cos
x = 0 when
26. cos x ≤ sin x
SOLUTION:
Graph y = cos x and y = sin x on (−π, π). Use the intersect feature under the CALC menu to determine on what interval(s) cos x ≤ sin x.
The graphs intersect at about –2.356 or – and
about 0.785 or . From the graph, it appears that
cos x ≤ sin x on – < x < – and < x < .
27. sin x cos x > 1
SOLUTION:
Graph y = sin x cos x and y = 1 on (− , ). Use the intersect feature under the CALC menu to determine on what interval(s) sin x cos x > 1.
The graphs do not intersect. Therefore, y = sin x cos
x is not greater than y = 1 for any values of x on –< x < .
28. sin x cos x ≤ 0
SOLUTION:
Graph y = sin x cos x on (−π, π). Use the zero feature under the CALC menu to determine on what interval(s) sin x cos x ≤ 0.
The zeros of y = sin x cos x are about –1.57 or ,
0, and about 1.57 or . From the graph, it appears
that sin x cos x ≤ 0 on < x < 0 and < x < .
29. CAROUSELS A wooden horse on a carousel moves up and down as the carousel spins. When the ride ends, the horse usually stops in a vertical position different from where it started. The position y of the horse after t seconds can be modeled by y =1.5 sin (2t + c), where the phase shift c must be continuously adjusted to compensate for the differentstarting positions. If during one ride the horse
reached a maximum height after seconds, find
the equation that models the horse’s position.
SOLUTION: First, find the period of y = 1.5 sin (2t + c).
Since the period is π, the function will reach a
maximum height at radians. The phase shift is the
difference between the horizontal position of the
function at and radians, which is radians.
Substitute and b into the phase shift formula to
find c.
Therefore, the equation is
30. AMUSEMENT PARKS The position y in feet of a passenger cart relative to the center of a Ferris wheel over t seconds is shown below.
a. Find the time t that it takes for the cart to return toy = 0 during its initial spin. b. Find the period of the Ferris wheel. c. Sketch the graph representing the position of the passenger cart over one period. d. Write a sinusoidal function that models the position of the passenger cart as a function of time t.
SOLUTION: a. From the diagram, the height of the cart is 0 ft when t = 0, and reaches a maximum height of 19 feet when t = 3.75 seconds. So, the cart will return to y = 0 after 2(3.75) or 7.5 seconds. b. The cart completes half of a cycle from t = 0 to t = 7.5. So, the period is 2(7.5) or 15 seconds. c.
d. The amplitude a is half of the maximum and
minimum values. So, a =
The vertical shift d is the average of the maximum
and minimum data values. So,
Because the period of a sinusoidal function is
you can write Therefore,
There is no phase shift because the height of the cartwhen t = 0 is 0 feet, and the sine function has a y-intercept of 0. Therefore, one equation that could be used to model
the position of the passenger cart is y = 19 sin t.
Write an equation that corresponds to each graph.
31.
SOLUTION: Sample answer: There is an x-intercept at 0, so one equation that corresponds to this graph is y = a sin (bx + c) + d. Half of the distance from the maximum to the minimum value of the function is 3. So, the amplitudeis 3. It appears that the function completes one period on
[0, π]. Find b.
The midline appears to be at y = 0, so there does not appear to be any vertical shift. Therefore, one equation that corresponds to this graph is y = 3 sin (2x).
32.
SOLUTION:
Sample answer: Because there is a y-intercept at ,
one equation that corresponds to this graph is y = a cos (bx + c) + d. Half of the distance from the maximum to the
minimum value of the function is . So, the
amplitude is .
It appears that the function completes one period on [0, 6π]. Find b.
The midline appears to be at y = 0, so there does not appear to be any vertical shift. Therefore, one
equation that corresponds to this graph is y = cos
.
33.
SOLUTION: Sample answer: Because there is a y-intercept at 3, one equation that corresponds to this graph is y = a cos (bx + c) + d. Half of the distance from the maximum to the
minimum value of the function is 4 ÷ 2 or 2. So, the amplitude is 2. It appears that the function completes one period on
Find b.
The midline appears to be at y = 1, so there is a vertical shift 1 unit up. Therefore, one equation that corresponds to this graph is y = 2 cos 4x + 1.
34.
SOLUTION: Sample answer: There is an x-intercept at 0, so one equation that corresponds to this graph is y = a sin (bx + c) + d. Half of the distance from the maximum to the
minimum value of the function is 8 ÷ 2 or 4. So, the amplitude is 4. It appears that the function completes one period on [0, 4π]. Find b.
The midline appears to be at y = −2, so there is a vertical shift of 2 units down. Therefore, one equation that corresponds to this graph is y = 4 sin
− 2.
Write a sinusoidal function with the given period and amplitude that passes through the given point.
35. period: ; amplitude: 5; point:
SOLUTION: Use the period to find b.
Sample answer: One sinusoidal function in which a =5 and b = 2 is y = 5 cos 2x. Evaluate the function for
The function passes through . Therefore, a
sinusoidal function with period π and amplitude 5 that
passes through the point is y = 5 cos 2x.
36. period: 4 ; amplitude: 2; point: ( , 2)
SOLUTION: Use the period to find b.
Sample answer: One sinusoidal function in which a =
2 and b = is y = 2 sin . Evaluate the function
for x = π.
The function passes through ( , 2). Therefore, a
sinusoidal function with period 4π and amplitude 2
that passes through the point ( , 2) is y = 2 sin .
37. period: ; amplitude: ; point:
SOLUTION: Use the period to find b.
Sample answer: One sinusoidal function in which a =1.5 and b = 4 is y = 1.5 cos 4x. Evaluate the function
for
The function passes through . Therefore, a
sinusoidal function with period and amplitude 1.5
that passes through the point is y = 1.5 cos
4x.
38. period: 3π; amplitude: ; point:
SOLUTION: Use the period to find b.
Sample answer: One sinusoidal function in which a =
0.5 and b = is y = sin x. Evaluate the
function for
The function passes through . Therefore, a
sinusoidal function with period 3π and amplitude 0.5
that passes through the point is y = sin
x.
39. MULTIPLE REPRESENTATIONS In this problem, you will investigate the change in the graph of a sinusoidal function of the form y = sin x or y = cos x when multiplied by a polynomial function. a. GRAPHICAL Use a graphing calculator to sketch the graphs of y = 2x, y = –2x, and y = 2x cos x on the same coordinate plane, on the interval [–20, 20]. b. VERBAL Describe the behavior of the graph of y = 2x cos x in relation to the graphs of y = 2x and y = –2x. c. GRAPHICAL Use a graphing calculator to
sketch the graphs of y = x2, y = –x
2, and y = x
2 sin x
on the same coordinate plane, on the interval [–20, 20]. d. VERBAL Describe the behavior of the graph of
y = x2 sin x in relation to the graphs of y = x
2 and y
= –x2.
e. ANALYTICAL Make a conjecture as to the behavior of the graph of a sinusoidal function of the form y = sin x or y = cos x when multiplied by polynomial function of the form y = f (x).
SOLUTION: a.
b. The graph of y = 2x cos x oscillates between the graphs of y = 2x and y = –2x. c.
d. The graph of y = x2 sin x oscillates between the
graphs of y = x2 and y = –x
2.
e . The graph of y = f (x) sin x or y = f (x) cos x will oscillate between the graphs of y = f (x) and y = –f(x).
40. CHALLENGE Without graphing, find the exact coordinates of the first maximum point to the right of
the y-axis for
SOLUTION:
First, find the phase shift for
Next, find the period of the function.
The first maximum for one period can be found by
finding So, incorporating the phase shift, the
first maximum to the right of the y-axis is
. Because the amplitude is |4| = 4,
the maximum point is
REASONING Determine whether each statement is true or false . Explain your reasoning.
41. Every sine function of the form y = a sin (bx + c) + d can be written as a cosine function of the form y =a cos (bx + c) + d.
SOLUTION: It is true that every sine function of the form y = a sin (bx + c) + d can be written as a cosine function of the form y = a cos (bx + c) + d. The graph of cosine is a horizontal translation of the sine graph. Therefore, a cosine function can be written from any sine function using the same amplitude and period by applying the necessary phase shift.
For example, consider and
. Phase shift by
to obtain .
42. The period of f (x) = cos 8x is equal to four times the period of g(x) = cos 2x.
SOLUTION: Find the period of f (x) = cos 8x.
Find the period of g(x) = cos 2x.
Four times the period of g(x) = cos 2x is 4 ⋅ or
4 . So, the period of f (x) is the period of g(x).
Therefore, the statement is false.
43. CHALLENGE How many zeros does y = cos
1500x have on the interval 0 ≤ x ≤ 2 ?
SOLUTION: Find the period of y = cos 1500x.
Graph y = cos 1500x on .
The graph of y = cos 1500x has two x-intercepts for one cycle, so the function has 2 zeros per cycle. Find
the number of cycles for y = cos 1500x on [0, 2 ].
So, the graph of y = cos 1500x will complete 1500
cycles on [0, 2 ]. Because there are two zeros per cycle, y = cos 1500x will have 1500(2) or 3000 zeros
on [0, 2 ].
44. PROOF Prove the phase shift formula.
SOLUTION:
Consider y = a sin (bx + c), where a , b, and c ≠ 0. To find a zero of the function, find the value of x for which a sin (bx + c) = 0. Since sin 0 = 0, solving bx + c = 0 will yield a zero of the function.
Therefore, y = 0 when . The value of is
the phase shift. When c > 0: The graph of y = a sin (bx + c) is the
graph of y = a sin x, shifted units to the left.
When c < 0: The graph of y = a sin (bx + c) is the
graph of y = a sin x, shifted units to the right.
Consider the graph of y = cos x below in blue. In this equation a = 1, b = 1 and c = 0. One zero of y = cos x is . The green graph is shifted to the
left. Thus c is – . Then the shifted equation will be
.
45. Writing in Math The Power Tower ride in Sandusky, Ohio, is shown below. Along the side of each tower is a string of lights that send a continuouspulse of light up and down each tower at a constant rate. Explain why the distance d of this light from theground over time t cannot be represented by a sinusoidal function.
SOLUTION: Sample answer: Although the pulse of light can be represented as a function with a period, it is not a sinusoidal function because the distance the pulse of light is from the ground changes at a constant rate. As a result, the graph of this function would resemble the graph below.
The given point lies on the terminal side of an angle θ in standard position. Find the values of
the six trigonometric functions of θ. 46. (−4, 4)
SOLUTION: Use the values of x and y to find r.
Use x = –4, y = 4, and r = to write the six trigonometric ratios.
47. (8, −2)
SOLUTION: Use the values of x and y to find r.
Use x = 8, y = –2, and r = to write the six trigonometric ratios.
48. (−5, −9)
SOLUTION: Use the values of x and y to find r.
Use x = –5, y = – 9, and r = to write the six trigonometric ratios.
49. (4, 5)
SOLUTION: Use the values of x and y to find r.
Use x = 4, y = 5, and r = to write the six trigonometric ratios.
Write each degree measure in radians as a multiple of π and each radian measure in degrees.
50. 25°
SOLUTION: To convert a degree measure to radians, multiply by
51. −420°
SOLUTION: To convert a degree measure to radians, multiply by
52.
SOLUTION: To convert a radian measure to degrees, multiply by
53.
SOLUTION: To convert a radian measure to degrees, multiply by
54. SCIENCE Radiocarbon dating is a method of estimating the age of an organic material by calculating the amount of carbon-14 present in the material. The age of a material can be calculated
using A = t , where A is the age of the
object in years, t is the half-life of carbon-14 or 5700 years, and R is the ratio of the amount of carbon-14 in the sample to the amount of carbon-14 in living tissue. a. A sample of organic material contains 0.000076 gram of carbon-14. A living sample of the same
Describe how the graphs of f (x) and g (x) are related. Then find the amplitude of g (x), and sketch two periods of both functions on the same coordinate axes.
1. f (x) = sin x; g(x) = sin x
SOLUTION: The graph of g(x) is the graph of f (x) compressed
vertically. The amplitude of g(x) is or .
Create a table listing the coordinates of the x-intercepts and extrema for f (x) = sin x for one
period, 2 , on the interval [0, 2 ]. Then use the amplitude of g(x) to find corresponding points on its graph.
Sketch the curve through the indicated points for each function. Then repeat the pattern to complete asecond period.
Functions f (x) = sin x g(x) = sin x
x-int (0, 0) (0, 0)
Max
x-int
Min
x-int
2.
SOLUTION: The graph of g(x) is the graph of f (x) compressed
vertically. The amplitude of g(x) is or .
Create a table listing the coordinates of the x-intercepts and extrema for f (x) = cos x for one
period, 2 , on the interval [0, 2 ]. Then use the amplitude of g(x) to find corresponding points on its graph.
Sketch the curve through the indicated points for each function. Then repeat the pattern to complete asecond period.
Function f (x) = cos x
Max (0, 1)
x-int Min
x-in
Min
x-int
Function f (x) = cos x
Max x-int
Min
x-in
Min
x-int
3. f (x) = cos x; g(x) = 6 cos x
SOLUTION: The graph of g(x) is the graph of f (x) expanded
vertically. The amplitude of g(x) is or 6.
Create a table listing the coordinates of the x-intercepts and extrema for f (x) = cos x for one
period, 2 , on the interval [0, 2 ]. Then use the amplitude of g(x) to find corresponding points on its graph.
Sketch the curve through the indicated points for each function. Then repeat the pattern to complete asecond period.
Functions f (x) = cos x g(x) = 6 cos x
Max (0, 1) (0, 6)
x-int
Min
x-int
Max
4. f (x) = sin x; g(x) = −8 sin x
SOLUTION: The graph of g(x) is the graph of f (x) expanded
vertically. The amplitude of g(x) is or 8.
Create a table listing the coordinates of the x-intercepts and extrema for f (x) = sin x for one
period, 2 , on the interval [0, 2 ]. Then use the amplitude of g(x) to find corresponding points on its graph.
Sketch the curve through the indicated points for each function. Then repeat the pattern to complete asecond period.
Function f (x) = sin x
x-int (0, 0)
Max
x-int
Min
x-int
Function g(x) = −8
sin x
x-int (0, 0)
Min
x-int
Max
x-int
Describe how the graphs of f (x) and g (x) are related. Then find the period of g (x), and sketch at least one period of both functions on the same coordinate axes.
5. f (x) = sin x; g(x) = sin 4x
SOLUTION: The graph of g(x) is the graph of f (x) compressed
horizontally. The period of g(x) is . To find
corresponding points on the graph of g(x), change the x-coordinates of those key points on f (x) so that
they range from 0 to , increasing by increments of
.
Sketch the curve through the indicated points for each function. Then repeat the pattern to complete asecond period.
Functions f (x) = sin x g(x) = sin
4x
x-int (0, 0) (0, 0)
Max
x-int
Min
x-int
6. f (x) = cos x; g(x) = cos 2x
SOLUTION: The graph of g(x) is the graph of f (x) compressed
horizontally. The period of g(x) is or . To find
corresponding points on the graph of g(x), change the x-coordinates of those key points on f (x) so that
they range from 0 to , increasing by increments of
.
Sketch the curve through the indicated points for each function. Then repeat the pattern to complete asecond period.
Functions f (x) = cos x g(x) = cos 2x
Max (0, 1) (0, 1)
x-int
Min
x-int
Max
7. f (x) = cos x;
SOLUTION: The graph of g(x) is the graph of f (x) expanded
horizontally. The period of g(x) is . To
find corresponding points on the graph of g(x), change the x-coordinates of those key points on f (x)
so that they range from 0 to , increasing by
increments of or .
Sketch the curve through the indicated points for each function. Then repeat the pattern to complete asecond period.
Functions f (x) = cos x
Max (0, 1) (0, 1)
x-int
Min
x-int
Max
8. f (x) = sin x;
SOLUTION: The graph of g(x) is the graph of f (x) expanded
horizontally. The period of g(x) is . To find corresponding points on the graph of g(x), change the x-coordinates of those key points on f (x) so that they range from 0 to , increasing by increments of
or .
Sketch the curve through the indicated points for each function. Then repeat the pattern to complete asecond period.
Functions f (x) = sin x
x-int (0, 0) (0, 0)
Max
x-int
Min
x-int
9. VOICES The contralto vocal type includes the deepest female singing voice. Some contraltos can sing as low as the E below middle C (E3), which hasa frequency of 165 hertz. Write an equation for a sine function that models the initial behavior of the sound wave associated with E3 having an amplitude of 0.15.
SOLUTION: The general form of the equation will be y = a sin bt,where t is the time in seconds. Because the
amplitude is 0.15, |a|= 0.15. This means that a = ±0.15. The period is the reciprocal of the frequency or
. Use this value to find b.
Sample answer: One sine function that models the
initial behavior is y = 0.15 sin 330 t.
Write a sine function that can be used to model the initial behavior of a sound wave with the frequency and amplitude given.
10. f = 440, a = 0.3
SOLUTION: The general form of the equation is y = a sin bt, where t is the time in seconds. Because the
amplitude is 0.3, = 0.3. This means that a = ±0.3.
The period is the reciprocal of the frequency or
. Use this value to find b.
Using the positive values of a and b, one sine function that models the initial behavior is y = 0.3 sin
880 t.
11. f = 932, a = 0.25
SOLUTION: The general form of the equation is y = a sin bt, where t is the time in seconds. Because the
amplitude is 0.25, = 0.25. This means that a =
±0.25. The period is the reciprocal of the frequency
or . Use this value to find b.
Using the positive values of a and b, one sine function that models the initial behavior is y = 0.25
sin 1864 t.
12. f = 1245, a = 0.12
SOLUTION: The general form of the equation is y = a sin bt, where t is the time in seconds. Because the
amplitude is 0.12, = 0.12. This means that a =
±0.12. The period is the reciprocal of the frequency or
. Use this value to find b.
Using the positive values of a and b, one sine function that models the initial behavior is y = 0.12
sin 2490 t.
13. f = 623, a = 0.2
SOLUTION: The general form of the equation is y = a sin bt, where t is the time in seconds. Because the
amplitude is 0.2, = 0.2. This means that a = ±0.2.
The period is the reciprocal of the frequency or
. Use this value to find b.
Using the positive values of a and b, one sine function that models the initial behavior is y = 0.2 sin
1246 t.
State the amplitude, period, frequency, phase shift, and vertical shift of each function. Then graph two periods of the function.
14.
SOLUTION:
In this function, a = 3, b = 1, c = − , and d = 0.
Because d = 0, there is no vertical shift.
Graph y = 3 sin x shifted units to the right.
15.
SOLUTION:
In this function, a = 1, b = , c = , and d = 0.
Because d = 0, there is no vertical shift.
16. y = 0.25 cos x + 3
SOLUTION:
In this function, a = , b = 1, c = 0, and d = 3.
Graph y = cos x shifted 3 units up.
17. y = sin 3x – 2
SOLUTION: In this function, a = 1, b = 3, c = 0, and d = –2.
Graph y = sin 3x shifted 2 units down.
18.
SOLUTION:
In this function, a = 1, b = 1, c = , and d = –1.
.
Graph y = cos x shifted units to the right and 1
unit down.
19.
SOLUTION:
In this function, a = 1, b = 1, c = , and d = 4.
.
Graph y = sin x shifted units to the left and 4 units up.
20. VACATIONS The average number of reservations R that a vacation resort has at the beginning of each month is shown.
a. Write an equation of a sinusoidal function that models the average number of reservations using x =1 to represent January. b. According to your model, approximately how many reservations can the resort anticipate in November?
SOLUTION: a. Make a scatter plot of the data and choose a model.
Sample answer: Use a sinusoidal function of the form y = a cos (bx + c) + d to model the data. First, find the maximum M and minimum m values of the data, and use these values to find a, b, c, and d. The maximum and minimum reservations are 200 and 87, respectively. The amplitude a is half of the distance between these values.
The vertical shift d is the average of the maximum and minimum data values.
There are 3 months between the maximum and minimum, so the period is 6.
The maximum data value occurs when x = 1. Since y = cos x attains its first maximum when x = 0, we must apply a phase shift of 1 unit. Use this value to find c.
Write a function using the values for a, b, c, and d.
Use b =
b. To find the number of reservations in November, evaluate the model for x = 11.
Therefore, the resort can anticipate about 115 reservations in November.
21. TIDES The table shown below provides data for the first high and low tides of the day for a certain bay during one day in June.
a. Determine the amplitude, period, phase shift, and vertical shift of a sinusoidal function that models the height of the tide. Let x represent the number of hours that the high or low tide occurred after midnight. b. Write a sinusoidal function that models the data. c. According to your model, what was the height of
the tide at 8:45 P.M. that night?
SOLUTION: a. Sample answer: Use a sinusoidal function of the form y = a cos (bx + c) + d to model the data. First, find the amplitude a, which is half of the distance between the heights of the high and low tides.
The vertical shift d is the average of the heights of the high and low tides.
A sinusoid completes half of a period in the time thatit takes to go from its maximum to its minimum value. One period is twice this time. The first high tide occurs 6.5 hours before the first low tide, so the period is 13.
The maximum data value occurs when x ≈ 4.417. Since y = cos x attains its first maximum when x = 0,we must apply a phase shift of 4.417 units. Use this value to find c.
b. Write a function using the values for a, b, c, and
d. Use b =
c. To find the height of the water at 8:45 P.M. that
night, evaluate the model for x = 20.75.
Therefore, the tide was about 7.28 feet high at 8:45
P.M. that night.
22. METEOROLOGY The average monthly temperatures for Boston, Massachusetts are shown.
a. Determine the amplitude, period, phase shift, and vertical shift of a sinusoidal function that models the monthly temperatures using x = 1 to represent January. b. Write an equation of a sinusoidal function that models the monthly temperatures. c. According to your model, what is Boston’s average temperature in August?
SOLUTION: a. The maximum and minimum are 74° and 29°, respectively. The amplitude a is half of the distance between these values.
The vertical shift d is the average of the maximum and minimum data values.
A sinusoid completes half of a period in the time thatit takes to go from its maximum to its minimum value. So, one period is twice this time. The
maximum function value occurs in July, so xmax is 7.
The minimum function value occurs in January, so
xmin is 1. The period is 2(6) = 12.
The maximum data value occurs when x = 7. Since y = cos x attains its first maximum when x = 0, we must apply a phase shift of 7 units. Use this value to find c.
b. Using the values for a, b, c, and d from part a, a sinusoidal function that models that monthly temperatures in Boston is
c. To find the average monthly temperature for Boston in August, evaluate the model for x = 8.
Therefore, the average monthly temperature for Boston in August is about 71°F.
GRAPHING CALCULATOR Find the values of x in the interval – < x < that make each equation or inequality true. (Hint: Use the intersection function.)
23. –sin x = cos x
SOLUTION:
Graph y = −sin x and y = cos x on the same graphing
calculator screen on (−π, π). Use the intersect feature under the CALC menu to determine where the two graphs intersect.
The graphs intersect at about −0.7854 or − and
about 2.356 or . Therefore, on –π < x < π, –sin x
= cos x when x = − and .
24. sin x − cos x = 1
SOLUTION:
Graph y = sin x − cos x and y = 1 on the same
graphing calculator screen on (− , ). Use the intersect feature under the CALC menu to determine where the two graphs intersect.
The graphs intersect at about 1.57 or . Therefore,
on – < x < , sin x − cos x = 1 when x = .
25. sin x + cos x = 0
SOLUTION:
Graph y = sin x + cos x on (−π, π). Use the zero feature under the CALC menu to determine the zeros of the function.
There are zeros at about −0.785 or − or and about
2.356 or . Therefore, on – < x < , sin x + cos
x = 0 when
26. cos x ≤ sin x
SOLUTION:
Graph y = cos x and y = sin x on (−π, π). Use the intersect feature under the CALC menu to determine on what interval(s) cos x ≤ sin x.
The graphs intersect at about –2.356 or – and
about 0.785 or . From the graph, it appears that
cos x ≤ sin x on – < x < – and < x < .
27. sin x cos x > 1
SOLUTION:
Graph y = sin x cos x and y = 1 on (− , ). Use the intersect feature under the CALC menu to determine on what interval(s) sin x cos x > 1.
The graphs do not intersect. Therefore, y = sin x cos
x is not greater than y = 1 for any values of x on –< x < .
28. sin x cos x ≤ 0
SOLUTION:
Graph y = sin x cos x on (−π, π). Use the zero feature under the CALC menu to determine on what interval(s) sin x cos x ≤ 0.
The zeros of y = sin x cos x are about –1.57 or ,
0, and about 1.57 or . From the graph, it appears
that sin x cos x ≤ 0 on < x < 0 and < x < .
29. CAROUSELS A wooden horse on a carousel moves up and down as the carousel spins. When the ride ends, the horse usually stops in a vertical position different from where it started. The position y of the horse after t seconds can be modeled by y =1.5 sin (2t + c), where the phase shift c must be continuously adjusted to compensate for the differentstarting positions. If during one ride the horse
reached a maximum height after seconds, find
the equation that models the horse’s position.
SOLUTION: First, find the period of y = 1.5 sin (2t + c).
Since the period is π, the function will reach a
maximum height at radians. The phase shift is the
difference between the horizontal position of the
function at and radians, which is radians.
Substitute and b into the phase shift formula to
find c.
Therefore, the equation is
30. AMUSEMENT PARKS The position y in feet of a passenger cart relative to the center of a Ferris wheel over t seconds is shown below.
a. Find the time t that it takes for the cart to return toy = 0 during its initial spin. b. Find the period of the Ferris wheel. c. Sketch the graph representing the position of the passenger cart over one period. d. Write a sinusoidal function that models the position of the passenger cart as a function of time t.
SOLUTION: a. From the diagram, the height of the cart is 0 ft when t = 0, and reaches a maximum height of 19 feet when t = 3.75 seconds. So, the cart will return to y = 0 after 2(3.75) or 7.5 seconds. b. The cart completes half of a cycle from t = 0 to t = 7.5. So, the period is 2(7.5) or 15 seconds. c.
d. The amplitude a is half of the maximum and
minimum values. So, a =
The vertical shift d is the average of the maximum
and minimum data values. So,
Because the period of a sinusoidal function is
you can write Therefore,
There is no phase shift because the height of the cartwhen t = 0 is 0 feet, and the sine function has a y-intercept of 0. Therefore, one equation that could be used to model
the position of the passenger cart is y = 19 sin t.
Write an equation that corresponds to each graph.
31.
SOLUTION: Sample answer: There is an x-intercept at 0, so one equation that corresponds to this graph is y = a sin (bx + c) + d. Half of the distance from the maximum to the minimum value of the function is 3. So, the amplitudeis 3. It appears that the function completes one period on
[0, π]. Find b.
The midline appears to be at y = 0, so there does not appear to be any vertical shift. Therefore, one equation that corresponds to this graph is y = 3 sin (2x).
32.
SOLUTION:
Sample answer: Because there is a y-intercept at ,
one equation that corresponds to this graph is y = a cos (bx + c) + d. Half of the distance from the maximum to the
minimum value of the function is . So, the
amplitude is .
It appears that the function completes one period on [0, 6π]. Find b.
The midline appears to be at y = 0, so there does not appear to be any vertical shift. Therefore, one
equation that corresponds to this graph is y = cos
.
33.
SOLUTION: Sample answer: Because there is a y-intercept at 3, one equation that corresponds to this graph is y = a cos (bx + c) + d. Half of the distance from the maximum to the
minimum value of the function is 4 ÷ 2 or 2. So, the amplitude is 2. It appears that the function completes one period on
Find b.
The midline appears to be at y = 1, so there is a vertical shift 1 unit up. Therefore, one equation that corresponds to this graph is y = 2 cos 4x + 1.
34.
SOLUTION: Sample answer: There is an x-intercept at 0, so one equation that corresponds to this graph is y = a sin (bx + c) + d. Half of the distance from the maximum to the
minimum value of the function is 8 ÷ 2 or 4. So, the amplitude is 4. It appears that the function completes one period on [0, 4π]. Find b.
The midline appears to be at y = −2, so there is a vertical shift of 2 units down. Therefore, one equation that corresponds to this graph is y = 4 sin
− 2.
Write a sinusoidal function with the given period and amplitude that passes through the given point.
35. period: ; amplitude: 5; point:
SOLUTION: Use the period to find b.
Sample answer: One sinusoidal function in which a =5 and b = 2 is y = 5 cos 2x. Evaluate the function for
The function passes through . Therefore, a
sinusoidal function with period π and amplitude 5 that
passes through the point is y = 5 cos 2x.
36. period: 4 ; amplitude: 2; point: ( , 2)
SOLUTION: Use the period to find b.
Sample answer: One sinusoidal function in which a =
2 and b = is y = 2 sin . Evaluate the function
for x = π.
The function passes through ( , 2). Therefore, a
sinusoidal function with period 4π and amplitude 2
that passes through the point ( , 2) is y = 2 sin .
37. period: ; amplitude: ; point:
SOLUTION: Use the period to find b.
Sample answer: One sinusoidal function in which a =1.5 and b = 4 is y = 1.5 cos 4x. Evaluate the function
for
The function passes through . Therefore, a
sinusoidal function with period and amplitude 1.5
that passes through the point is y = 1.5 cos
4x.
38. period: 3π; amplitude: ; point:
SOLUTION: Use the period to find b.
Sample answer: One sinusoidal function in which a =
0.5 and b = is y = sin x. Evaluate the
function for
The function passes through . Therefore, a
sinusoidal function with period 3π and amplitude 0.5
that passes through the point is y = sin
x.
39. MULTIPLE REPRESENTATIONS In this problem, you will investigate the change in the graph of a sinusoidal function of the form y = sin x or y = cos x when multiplied by a polynomial function. a. GRAPHICAL Use a graphing calculator to sketch the graphs of y = 2x, y = –2x, and y = 2x cos x on the same coordinate plane, on the interval [–20, 20]. b. VERBAL Describe the behavior of the graph of y = 2x cos x in relation to the graphs of y = 2x and y = –2x. c. GRAPHICAL Use a graphing calculator to
sketch the graphs of y = x2, y = –x
2, and y = x
2 sin x
on the same coordinate plane, on the interval [–20, 20]. d. VERBAL Describe the behavior of the graph of
y = x2 sin x in relation to the graphs of y = x
2 and y
= –x2.
e. ANALYTICAL Make a conjecture as to the behavior of the graph of a sinusoidal function of the form y = sin x or y = cos x when multiplied by polynomial function of the form y = f (x).
SOLUTION: a.
b. The graph of y = 2x cos x oscillates between the graphs of y = 2x and y = –2x. c.
d. The graph of y = x2 sin x oscillates between the
graphs of y = x2 and y = –x
2.
e . The graph of y = f (x) sin x or y = f (x) cos x will oscillate between the graphs of y = f (x) and y = –f(x).
40. CHALLENGE Without graphing, find the exact coordinates of the first maximum point to the right of
the y-axis for
SOLUTION:
First, find the phase shift for
Next, find the period of the function.
The first maximum for one period can be found by
finding So, incorporating the phase shift, the
first maximum to the right of the y-axis is
. Because the amplitude is |4| = 4,
the maximum point is
REASONING Determine whether each statement is true or false . Explain your reasoning.
41. Every sine function of the form y = a sin (bx + c) + d can be written as a cosine function of the form y =a cos (bx + c) + d.
SOLUTION: It is true that every sine function of the form y = a sin (bx + c) + d can be written as a cosine function of the form y = a cos (bx + c) + d. The graph of cosine is a horizontal translation of the sine graph. Therefore, a cosine function can be written from any sine function using the same amplitude and period by applying the necessary phase shift.
For example, consider and
. Phase shift by
to obtain .
42. The period of f (x) = cos 8x is equal to four times the period of g(x) = cos 2x.
SOLUTION: Find the period of f (x) = cos 8x.
Find the period of g(x) = cos 2x.
Four times the period of g(x) = cos 2x is 4 ⋅ or
4 . So, the period of f (x) is the period of g(x).
Therefore, the statement is false.
43. CHALLENGE How many zeros does y = cos
1500x have on the interval 0 ≤ x ≤ 2 ?
SOLUTION: Find the period of y = cos 1500x.
Graph y = cos 1500x on .
The graph of y = cos 1500x has two x-intercepts for one cycle, so the function has 2 zeros per cycle. Find
the number of cycles for y = cos 1500x on [0, 2 ].
So, the graph of y = cos 1500x will complete 1500
cycles on [0, 2 ]. Because there are two zeros per cycle, y = cos 1500x will have 1500(2) or 3000 zeros
on [0, 2 ].
44. PROOF Prove the phase shift formula.
SOLUTION:
Consider y = a sin (bx + c), where a , b, and c ≠ 0. To find a zero of the function, find the value of x for which a sin (bx + c) = 0. Since sin 0 = 0, solving bx + c = 0 will yield a zero of the function.
Therefore, y = 0 when . The value of is
the phase shift. When c > 0: The graph of y = a sin (bx + c) is the
graph of y = a sin x, shifted units to the left.
When c < 0: The graph of y = a sin (bx + c) is the
graph of y = a sin x, shifted units to the right.
Consider the graph of y = cos x below in blue. In this equation a = 1, b = 1 and c = 0. One zero of y = cos x is . The green graph is shifted to the
left. Thus c is – . Then the shifted equation will be
.
45. Writing in Math The Power Tower ride in Sandusky, Ohio, is shown below. Along the side of each tower is a string of lights that send a continuouspulse of light up and down each tower at a constant rate. Explain why the distance d of this light from theground over time t cannot be represented by a sinusoidal function.
SOLUTION: Sample answer: Although the pulse of light can be represented as a function with a period, it is not a sinusoidal function because the distance the pulse of light is from the ground changes at a constant rate. As a result, the graph of this function would resemble the graph below.
The given point lies on the terminal side of an angle θ in standard position. Find the values of
the six trigonometric functions of θ. 46. (−4, 4)
SOLUTION: Use the values of x and y to find r.
Use x = –4, y = 4, and r = to write the six trigonometric ratios.
47. (8, −2)
SOLUTION: Use the values of x and y to find r.
Use x = 8, y = –2, and r = to write the six trigonometric ratios.
48. (−5, −9)
SOLUTION: Use the values of x and y to find r.
Use x = –5, y = – 9, and r = to write the six trigonometric ratios.
49. (4, 5)
SOLUTION: Use the values of x and y to find r.
Use x = 4, y = 5, and r = to write the six trigonometric ratios.
Write each degree measure in radians as a multiple of π and each radian measure in degrees.
50. 25°
SOLUTION: To convert a degree measure to radians, multiply by
51. −420°
SOLUTION: To convert a degree measure to radians, multiply by
52.
SOLUTION: To convert a radian measure to degrees, multiply by
53.
SOLUTION: To convert a radian measure to degrees, multiply by
54. SCIENCE Radiocarbon dating is a method of estimating the age of an organic material by calculating the amount of carbon-14 present in the material. The age of a material can be calculated
using A = t , where A is the age of the
object in years, t is the half-life of carbon-14 or 5700 years, and R is the ratio of the amount of carbon-14 in the sample to the amount of carbon-14 in living tissue. a. A sample of organic material contains 0.000076 gram of carbon-14. A living sample of the same
eSolutions Manual - Powered by Cognero Page 19
4-4 Graphing Sine and Cosine Functions
Describe how the graphs of f (x) and g (x) are related. Then find the amplitude of g (x), and sketch two periods of both functions on the same coordinate axes.
1. f (x) = sin x; g(x) = sin x
SOLUTION: The graph of g(x) is the graph of f (x) compressed
vertically. The amplitude of g(x) is or .
Create a table listing the coordinates of the x-intercepts and extrema for f (x) = sin x for one
period, 2 , on the interval [0, 2 ]. Then use the amplitude of g(x) to find corresponding points on its graph.
Sketch the curve through the indicated points for each function. Then repeat the pattern to complete asecond period.
Functions f (x) = sin x g(x) = sin x
x-int (0, 0) (0, 0)
Max
x-int
Min
x-int
2.
SOLUTION: The graph of g(x) is the graph of f (x) compressed
vertically. The amplitude of g(x) is or .
Create a table listing the coordinates of the x-intercepts and extrema for f (x) = cos x for one
period, 2 , on the interval [0, 2 ]. Then use the amplitude of g(x) to find corresponding points on its graph.
Sketch the curve through the indicated points for each function. Then repeat the pattern to complete asecond period.
Function f (x) = cos x
Max (0, 1)
x-int Min
x-in
Min
x-int
Function f (x) = cos x
Max x-int
Min
x-in
Min
x-int
3. f (x) = cos x; g(x) = 6 cos x
SOLUTION: The graph of g(x) is the graph of f (x) expanded
vertically. The amplitude of g(x) is or 6.
Create a table listing the coordinates of the x-intercepts and extrema for f (x) = cos x for one
period, 2 , on the interval [0, 2 ]. Then use the amplitude of g(x) to find corresponding points on its graph.
Sketch the curve through the indicated points for each function. Then repeat the pattern to complete asecond period.
Functions f (x) = cos x g(x) = 6 cos x
Max (0, 1) (0, 6)
x-int
Min
x-int
Max
4. f (x) = sin x; g(x) = −8 sin x
SOLUTION: The graph of g(x) is the graph of f (x) expanded
vertically. The amplitude of g(x) is or 8.
Create a table listing the coordinates of the x-intercepts and extrema for f (x) = sin x for one
period, 2 , on the interval [0, 2 ]. Then use the amplitude of g(x) to find corresponding points on its graph.
Sketch the curve through the indicated points for each function. Then repeat the pattern to complete asecond period.
Function f (x) = sin x
x-int (0, 0)
Max
x-int
Min
x-int
Function g(x) = −8
sin x
x-int (0, 0)
Min
x-int
Max
x-int
Describe how the graphs of f (x) and g (x) are related. Then find the period of g (x), and sketch at least one period of both functions on the same coordinate axes.
5. f (x) = sin x; g(x) = sin 4x
SOLUTION: The graph of g(x) is the graph of f (x) compressed
horizontally. The period of g(x) is . To find
corresponding points on the graph of g(x), change the x-coordinates of those key points on f (x) so that
they range from 0 to , increasing by increments of
.
Sketch the curve through the indicated points for each function. Then repeat the pattern to complete asecond period.
Functions f (x) = sin x g(x) = sin
4x
x-int (0, 0) (0, 0)
Max
x-int
Min
x-int
6. f (x) = cos x; g(x) = cos 2x
SOLUTION: The graph of g(x) is the graph of f (x) compressed
horizontally. The period of g(x) is or . To find
corresponding points on the graph of g(x), change the x-coordinates of those key points on f (x) so that
they range from 0 to , increasing by increments of
.
Sketch the curve through the indicated points for each function. Then repeat the pattern to complete asecond period.
Functions f (x) = cos x g(x) = cos 2x
Max (0, 1) (0, 1)
x-int
Min
x-int
Max
7. f (x) = cos x;
SOLUTION: The graph of g(x) is the graph of f (x) expanded
horizontally. The period of g(x) is . To
find corresponding points on the graph of g(x), change the x-coordinates of those key points on f (x)
so that they range from 0 to , increasing by
increments of or .
Sketch the curve through the indicated points for each function. Then repeat the pattern to complete asecond period.
Functions f (x) = cos x
Max (0, 1) (0, 1)
x-int
Min
x-int
Max
8. f (x) = sin x;
SOLUTION: The graph of g(x) is the graph of f (x) expanded
horizontally. The period of g(x) is . To find corresponding points on the graph of g(x), change the x-coordinates of those key points on f (x) so that they range from 0 to , increasing by increments of
or .
Sketch the curve through the indicated points for each function. Then repeat the pattern to complete asecond period.
Functions f (x) = sin x
x-int (0, 0) (0, 0)
Max
x-int
Min
x-int
9. VOICES The contralto vocal type includes the deepest female singing voice. Some contraltos can sing as low as the E below middle C (E3), which hasa frequency of 165 hertz. Write an equation for a sine function that models the initial behavior of the sound wave associated with E3 having an amplitude of 0.15.
SOLUTION: The general form of the equation will be y = a sin bt,where t is the time in seconds. Because the
amplitude is 0.15, |a|= 0.15. This means that a = ±0.15. The period is the reciprocal of the frequency or
. Use this value to find b.
Sample answer: One sine function that models the
initial behavior is y = 0.15 sin 330 t.
Write a sine function that can be used to model the initial behavior of a sound wave with the frequency and amplitude given.
10. f = 440, a = 0.3
SOLUTION: The general form of the equation is y = a sin bt, where t is the time in seconds. Because the
amplitude is 0.3, = 0.3. This means that a = ±0.3.
The period is the reciprocal of the frequency or
. Use this value to find b.
Using the positive values of a and b, one sine function that models the initial behavior is y = 0.3 sin
880 t.
11. f = 932, a = 0.25
SOLUTION: The general form of the equation is y = a sin bt, where t is the time in seconds. Because the
amplitude is 0.25, = 0.25. This means that a =
±0.25. The period is the reciprocal of the frequency
or . Use this value to find b.
Using the positive values of a and b, one sine function that models the initial behavior is y = 0.25
sin 1864 t.
12. f = 1245, a = 0.12
SOLUTION: The general form of the equation is y = a sin bt, where t is the time in seconds. Because the
amplitude is 0.12, = 0.12. This means that a =
±0.12. The period is the reciprocal of the frequency or
. Use this value to find b.
Using the positive values of a and b, one sine function that models the initial behavior is y = 0.12
sin 2490 t.
13. f = 623, a = 0.2
SOLUTION: The general form of the equation is y = a sin bt, where t is the time in seconds. Because the
amplitude is 0.2, = 0.2. This means that a = ±0.2.
The period is the reciprocal of the frequency or
. Use this value to find b.
Using the positive values of a and b, one sine function that models the initial behavior is y = 0.2 sin
1246 t.
State the amplitude, period, frequency, phase shift, and vertical shift of each function. Then graph two periods of the function.
14.
SOLUTION:
In this function, a = 3, b = 1, c = − , and d = 0.
Because d = 0, there is no vertical shift.
Graph y = 3 sin x shifted units to the right.
15.
SOLUTION:
In this function, a = 1, b = , c = , and d = 0.
Because d = 0, there is no vertical shift.
16. y = 0.25 cos x + 3
SOLUTION:
In this function, a = , b = 1, c = 0, and d = 3.
Graph y = cos x shifted 3 units up.
17. y = sin 3x – 2
SOLUTION: In this function, a = 1, b = 3, c = 0, and d = –2.
Graph y = sin 3x shifted 2 units down.
18.
SOLUTION:
In this function, a = 1, b = 1, c = , and d = –1.
.
Graph y = cos x shifted units to the right and 1
unit down.
19.
SOLUTION:
In this function, a = 1, b = 1, c = , and d = 4.
.
Graph y = sin x shifted units to the left and 4 units up.
20. VACATIONS The average number of reservations R that a vacation resort has at the beginning of each month is shown.
a. Write an equation of a sinusoidal function that models the average number of reservations using x =1 to represent January. b. According to your model, approximately how many reservations can the resort anticipate in November?
SOLUTION: a. Make a scatter plot of the data and choose a model.
Sample answer: Use a sinusoidal function of the form y = a cos (bx + c) + d to model the data. First, find the maximum M and minimum m values of the data, and use these values to find a, b, c, and d. The maximum and minimum reservations are 200 and 87, respectively. The amplitude a is half of the distance between these values.
The vertical shift d is the average of the maximum and minimum data values.
There are 3 months between the maximum and minimum, so the period is 6.
The maximum data value occurs when x = 1. Since y = cos x attains its first maximum when x = 0, we must apply a phase shift of 1 unit. Use this value to find c.
Write a function using the values for a, b, c, and d.
Use b =
b. To find the number of reservations in November, evaluate the model for x = 11.
Therefore, the resort can anticipate about 115 reservations in November.
21. TIDES The table shown below provides data for the first high and low tides of the day for a certain bay during one day in June.
a. Determine the amplitude, period, phase shift, and vertical shift of a sinusoidal function that models the height of the tide. Let x represent the number of hours that the high or low tide occurred after midnight. b. Write a sinusoidal function that models the data. c. According to your model, what was the height of
the tide at 8:45 P.M. that night?
SOLUTION: a. Sample answer: Use a sinusoidal function of the form y = a cos (bx + c) + d to model the data. First, find the amplitude a, which is half of the distance between the heights of the high and low tides.
The vertical shift d is the average of the heights of the high and low tides.
A sinusoid completes half of a period in the time thatit takes to go from its maximum to its minimum value. One period is twice this time. The first high tide occurs 6.5 hours before the first low tide, so the period is 13.
The maximum data value occurs when x ≈ 4.417. Since y = cos x attains its first maximum when x = 0,we must apply a phase shift of 4.417 units. Use this value to find c.
b. Write a function using the values for a, b, c, and
d. Use b =
c. To find the height of the water at 8:45 P.M. that
night, evaluate the model for x = 20.75.
Therefore, the tide was about 7.28 feet high at 8:45
P.M. that night.
22. METEOROLOGY The average monthly temperatures for Boston, Massachusetts are shown.
a. Determine the amplitude, period, phase shift, and vertical shift of a sinusoidal function that models the monthly temperatures using x = 1 to represent January. b. Write an equation of a sinusoidal function that models the monthly temperatures. c. According to your model, what is Boston’s average temperature in August?
SOLUTION: a. The maximum and minimum are 74° and 29°, respectively. The amplitude a is half of the distance between these values.
The vertical shift d is the average of the maximum and minimum data values.
A sinusoid completes half of a period in the time thatit takes to go from its maximum to its minimum value. So, one period is twice this time. The
maximum function value occurs in July, so xmax is 7.
The minimum function value occurs in January, so
xmin is 1. The period is 2(6) = 12.
The maximum data value occurs when x = 7. Since y = cos x attains its first maximum when x = 0, we must apply a phase shift of 7 units. Use this value to find c.
b. Using the values for a, b, c, and d from part a, a sinusoidal function that models that monthly temperatures in Boston is
c. To find the average monthly temperature for Boston in August, evaluate the model for x = 8.
Therefore, the average monthly temperature for Boston in August is about 71°F.
GRAPHING CALCULATOR Find the values of x in the interval – < x < that make each equation or inequality true. (Hint: Use the intersection function.)
23. –sin x = cos x
SOLUTION:
Graph y = −sin x and y = cos x on the same graphing
calculator screen on (−π, π). Use the intersect feature under the CALC menu to determine where the two graphs intersect.
The graphs intersect at about −0.7854 or − and
about 2.356 or . Therefore, on –π < x < π, –sin x
= cos x when x = − and .
24. sin x − cos x = 1
SOLUTION:
Graph y = sin x − cos x and y = 1 on the same
graphing calculator screen on (− , ). Use the intersect feature under the CALC menu to determine where the two graphs intersect.
The graphs intersect at about 1.57 or . Therefore,
on – < x < , sin x − cos x = 1 when x = .
25. sin x + cos x = 0
SOLUTION:
Graph y = sin x + cos x on (−π, π). Use the zero feature under the CALC menu to determine the zeros of the function.
There are zeros at about −0.785 or − or and about
2.356 or . Therefore, on – < x < , sin x + cos
x = 0 when
26. cos x ≤ sin x
SOLUTION:
Graph y = cos x and y = sin x on (−π, π). Use the intersect feature under the CALC menu to determine on what interval(s) cos x ≤ sin x.
The graphs intersect at about –2.356 or – and
about 0.785 or . From the graph, it appears that
cos x ≤ sin x on – < x < – and < x < .
27. sin x cos x > 1
SOLUTION:
Graph y = sin x cos x and y = 1 on (− , ). Use the intersect feature under the CALC menu to determine on what interval(s) sin x cos x > 1.
The graphs do not intersect. Therefore, y = sin x cos
x is not greater than y = 1 for any values of x on –< x < .
28. sin x cos x ≤ 0
SOLUTION:
Graph y = sin x cos x on (−π, π). Use the zero feature under the CALC menu to determine on what interval(s) sin x cos x ≤ 0.
The zeros of y = sin x cos x are about –1.57 or ,
0, and about 1.57 or . From the graph, it appears
that sin x cos x ≤ 0 on < x < 0 and < x < .
29. CAROUSELS A wooden horse on a carousel moves up and down as the carousel spins. When the ride ends, the horse usually stops in a vertical position different from where it started. The position y of the horse after t seconds can be modeled by y =1.5 sin (2t + c), where the phase shift c must be continuously adjusted to compensate for the differentstarting positions. If during one ride the horse
reached a maximum height after seconds, find
the equation that models the horse’s position.
SOLUTION: First, find the period of y = 1.5 sin (2t + c).
Since the period is π, the function will reach a
maximum height at radians. The phase shift is the
difference between the horizontal position of the
function at and radians, which is radians.
Substitute and b into the phase shift formula to
find c.
Therefore, the equation is
30. AMUSEMENT PARKS The position y in feet of a passenger cart relative to the center of a Ferris wheel over t seconds is shown below.
a. Find the time t that it takes for the cart to return toy = 0 during its initial spin. b. Find the period of the Ferris wheel. c. Sketch the graph representing the position of the passenger cart over one period. d. Write a sinusoidal function that models the position of the passenger cart as a function of time t.
SOLUTION: a. From the diagram, the height of the cart is 0 ft when t = 0, and reaches a maximum height of 19 feet when t = 3.75 seconds. So, the cart will return to y = 0 after 2(3.75) or 7.5 seconds. b. The cart completes half of a cycle from t = 0 to t = 7.5. So, the period is 2(7.5) or 15 seconds. c.
d. The amplitude a is half of the maximum and
minimum values. So, a =
The vertical shift d is the average of the maximum
and minimum data values. So,
Because the period of a sinusoidal function is
you can write Therefore,
There is no phase shift because the height of the cartwhen t = 0 is 0 feet, and the sine function has a y-intercept of 0. Therefore, one equation that could be used to model
the position of the passenger cart is y = 19 sin t.
Write an equation that corresponds to each graph.
31.
SOLUTION: Sample answer: There is an x-intercept at 0, so one equation that corresponds to this graph is y = a sin (bx + c) + d. Half of the distance from the maximum to the minimum value of the function is 3. So, the amplitudeis 3. It appears that the function completes one period on
[0, π]. Find b.
The midline appears to be at y = 0, so there does not appear to be any vertical shift. Therefore, one equation that corresponds to this graph is y = 3 sin (2x).
32.
SOLUTION:
Sample answer: Because there is a y-intercept at ,
one equation that corresponds to this graph is y = a cos (bx + c) + d. Half of the distance from the maximum to the
minimum value of the function is . So, the
amplitude is .
It appears that the function completes one period on [0, 6π]. Find b.
The midline appears to be at y = 0, so there does not appear to be any vertical shift. Therefore, one
equation that corresponds to this graph is y = cos
.
33.
SOLUTION: Sample answer: Because there is a y-intercept at 3, one equation that corresponds to this graph is y = a cos (bx + c) + d. Half of the distance from the maximum to the
minimum value of the function is 4 ÷ 2 or 2. So, the amplitude is 2. It appears that the function completes one period on
Find b.
The midline appears to be at y = 1, so there is a vertical shift 1 unit up. Therefore, one equation that corresponds to this graph is y = 2 cos 4x + 1.
34.
SOLUTION: Sample answer: There is an x-intercept at 0, so one equation that corresponds to this graph is y = a sin (bx + c) + d. Half of the distance from the maximum to the
minimum value of the function is 8 ÷ 2 or 4. So, the amplitude is 4. It appears that the function completes one period on [0, 4π]. Find b.
The midline appears to be at y = −2, so there is a vertical shift of 2 units down. Therefore, one equation that corresponds to this graph is y = 4 sin
− 2.
Write a sinusoidal function with the given period and amplitude that passes through the given point.
35. period: ; amplitude: 5; point:
SOLUTION: Use the period to find b.
Sample answer: One sinusoidal function in which a =5 and b = 2 is y = 5 cos 2x. Evaluate the function for
The function passes through . Therefore, a
sinusoidal function with period π and amplitude 5 that
passes through the point is y = 5 cos 2x.
36. period: 4 ; amplitude: 2; point: ( , 2)
SOLUTION: Use the period to find b.
Sample answer: One sinusoidal function in which a =
2 and b = is y = 2 sin . Evaluate the function
for x = π.
The function passes through ( , 2). Therefore, a
sinusoidal function with period 4π and amplitude 2
that passes through the point ( , 2) is y = 2 sin .
37. period: ; amplitude: ; point:
SOLUTION: Use the period to find b.
Sample answer: One sinusoidal function in which a =1.5 and b = 4 is y = 1.5 cos 4x. Evaluate the function
for
The function passes through . Therefore, a
sinusoidal function with period and amplitude 1.5
that passes through the point is y = 1.5 cos
4x.
38. period: 3π; amplitude: ; point:
SOLUTION: Use the period to find b.
Sample answer: One sinusoidal function in which a =
0.5 and b = is y = sin x. Evaluate the
function for
The function passes through . Therefore, a
sinusoidal function with period 3π and amplitude 0.5
that passes through the point is y = sin
x.
39. MULTIPLE REPRESENTATIONS In this problem, you will investigate the change in the graph of a sinusoidal function of the form y = sin x or y = cos x when multiplied by a polynomial function. a. GRAPHICAL Use a graphing calculator to sketch the graphs of y = 2x, y = –2x, and y = 2x cos x on the same coordinate plane, on the interval [–20, 20]. b. VERBAL Describe the behavior of the graph of y = 2x cos x in relation to the graphs of y = 2x and y = –2x. c. GRAPHICAL Use a graphing calculator to
sketch the graphs of y = x2, y = –x
2, and y = x
2 sin x
on the same coordinate plane, on the interval [–20, 20]. d. VERBAL Describe the behavior of the graph of
y = x2 sin x in relation to the graphs of y = x
2 and y
= –x2.
e. ANALYTICAL Make a conjecture as to the behavior of the graph of a sinusoidal function of the form y = sin x or y = cos x when multiplied by polynomial function of the form y = f (x).
SOLUTION: a.
b. The graph of y = 2x cos x oscillates between the graphs of y = 2x and y = –2x. c.
d. The graph of y = x2 sin x oscillates between the
graphs of y = x2 and y = –x
2.
e . The graph of y = f (x) sin x or y = f (x) cos x will oscillate between the graphs of y = f (x) and y = –f(x).
40. CHALLENGE Without graphing, find the exact coordinates of the first maximum point to the right of
the y-axis for
SOLUTION:
First, find the phase shift for
Next, find the period of the function.
The first maximum for one period can be found by
finding So, incorporating the phase shift, the
first maximum to the right of the y-axis is
. Because the amplitude is |4| = 4,
the maximum point is
REASONING Determine whether each statement is true or false . Explain your reasoning.
41. Every sine function of the form y = a sin (bx + c) + d can be written as a cosine function of the form y =a cos (bx + c) + d.
SOLUTION: It is true that every sine function of the form y = a sin (bx + c) + d can be written as a cosine function of the form y = a cos (bx + c) + d. The graph of cosine is a horizontal translation of the sine graph. Therefore, a cosine function can be written from any sine function using the same amplitude and period by applying the necessary phase shift.
For example, consider and
. Phase shift by
to obtain .
42. The period of f (x) = cos 8x is equal to four times the period of g(x) = cos 2x.
SOLUTION: Find the period of f (x) = cos 8x.
Find the period of g(x) = cos 2x.
Four times the period of g(x) = cos 2x is 4 ⋅ or
4 . So, the period of f (x) is the period of g(x).
Therefore, the statement is false.
43. CHALLENGE How many zeros does y = cos
1500x have on the interval 0 ≤ x ≤ 2 ?
SOLUTION: Find the period of y = cos 1500x.
Graph y = cos 1500x on .
The graph of y = cos 1500x has two x-intercepts for one cycle, so the function has 2 zeros per cycle. Find
the number of cycles for y = cos 1500x on [0, 2 ].
So, the graph of y = cos 1500x will complete 1500
cycles on [0, 2 ]. Because there are two zeros per cycle, y = cos 1500x will have 1500(2) or 3000 zeros
on [0, 2 ].
44. PROOF Prove the phase shift formula.
SOLUTION:
Consider y = a sin (bx + c), where a , b, and c ≠ 0. To find a zero of the function, find the value of x for which a sin (bx + c) = 0. Since sin 0 = 0, solving bx + c = 0 will yield a zero of the function.
Therefore, y = 0 when . The value of is
the phase shift. When c > 0: The graph of y = a sin (bx + c) is the
graph of y = a sin x, shifted units to the left.
When c < 0: The graph of y = a sin (bx + c) is the
graph of y = a sin x, shifted units to the right.
Consider the graph of y = cos x below in blue. In this equation a = 1, b = 1 and c = 0. One zero of y = cos x is . The green graph is shifted to the
left. Thus c is – . Then the shifted equation will be
.
45. Writing in Math The Power Tower ride in Sandusky, Ohio, is shown below. Along the side of each tower is a string of lights that send a continuouspulse of light up and down each tower at a constant rate. Explain why the distance d of this light from theground over time t cannot be represented by a sinusoidal function.
SOLUTION: Sample answer: Although the pulse of light can be represented as a function with a period, it is not a sinusoidal function because the distance the pulse of light is from the ground changes at a constant rate. As a result, the graph of this function would resemble the graph below.
The given point lies on the terminal side of an angle θ in standard position. Find the values of
the six trigonometric functions of θ. 46. (−4, 4)
SOLUTION: Use the values of x and y to find r.
Use x = –4, y = 4, and r = to write the six trigonometric ratios.
47. (8, −2)
SOLUTION: Use the values of x and y to find r.
Use x = 8, y = –2, and r = to write the six trigonometric ratios.
48. (−5, −9)
SOLUTION: Use the values of x and y to find r.
Use x = –5, y = – 9, and r = to write the six trigonometric ratios.
49. (4, 5)
SOLUTION: Use the values of x and y to find r.
Use x = 4, y = 5, and r = to write the six trigonometric ratios.
Write each degree measure in radians as a multiple of π and each radian measure in degrees.
50. 25°
SOLUTION: To convert a degree measure to radians, multiply by
51. −420°
SOLUTION: To convert a degree measure to radians, multiply by
52.
SOLUTION: To convert a radian measure to degrees, multiply by
53.
SOLUTION: To convert a radian measure to degrees, multiply by
54. SCIENCE Radiocarbon dating is a method of estimating the age of an organic material by calculating the amount of carbon-14 present in the material. The age of a material can be calculated
using A = t , where A is the age of the
object in years, t is the half-life of carbon-14 or 5700 years, and R is the ratio of the amount of carbon-14 in the sample to the amount of carbon-14 in living tissue. a. A sample of organic material contains 0.000076 gram of carbon-14. A living sample of the same
eSolutions Manual - Powered by Cognero Page 20
4-4 Graphing Sine and Cosine Functions
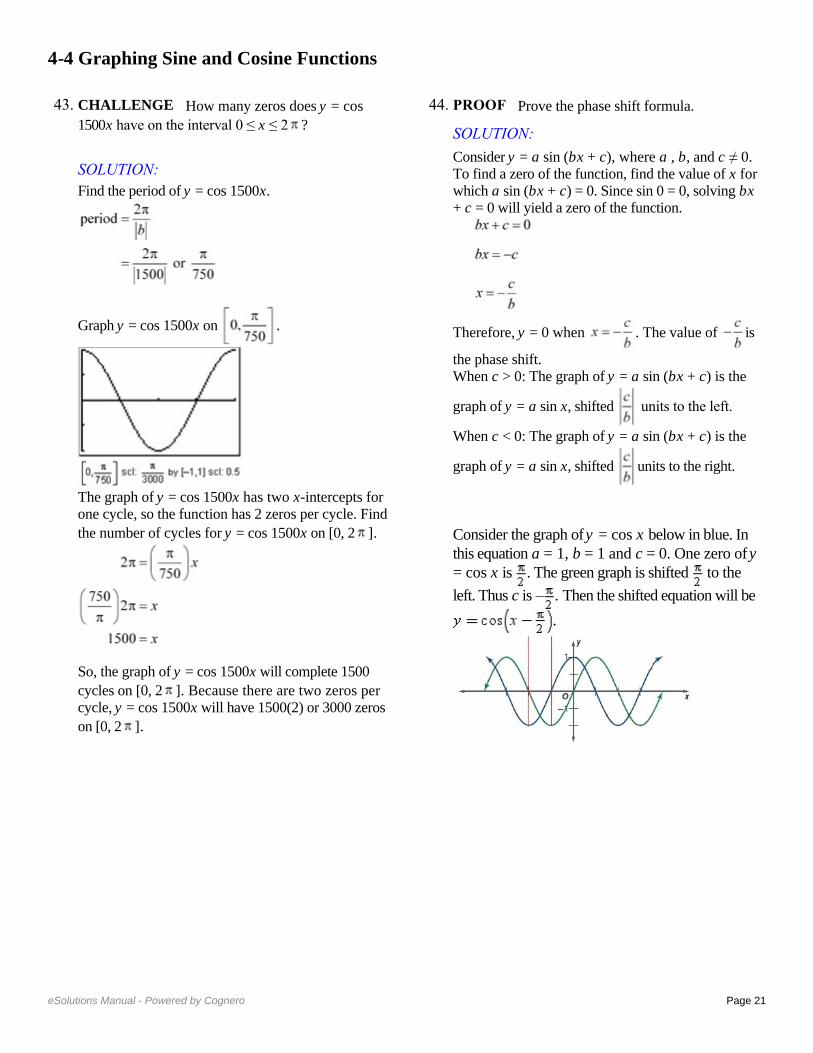
Describe how the graphs of f (x) and g (x) are related. Then find the amplitude of g (x), and sketch two periods of both functions on the same coordinate axes.
1. f (x) = sin x; g(x) = sin x
SOLUTION: The graph of g(x) is the graph of f (x) compressed
vertically. The amplitude of g(x) is or .
Create a table listing the coordinates of the x-intercepts and extrema for f (x) = sin x for one
period, 2 , on the interval [0, 2 ]. Then use the amplitude of g(x) to find corresponding points on its graph.
Sketch the curve through the indicated points for each function. Then repeat the pattern to complete asecond period.
Functions f (x) = sin x g(x) = sin x
x-int (0, 0) (0, 0)
Max
x-int
Min
x-int
2.
SOLUTION: The graph of g(x) is the graph of f (x) compressed
vertically. The amplitude of g(x) is or .
Create a table listing the coordinates of the x-intercepts and extrema for f (x) = cos x for one
period, 2 , on the interval [0, 2 ]. Then use the amplitude of g(x) to find corresponding points on its graph.
Sketch the curve through the indicated points for each function. Then repeat the pattern to complete asecond period.
Function f (x) = cos x
Max (0, 1)
x-int Min
x-in
Min
x-int
Function f (x) = cos x
Max x-int
Min
x-in
Min
x-int
3. f (x) = cos x; g(x) = 6 cos x
SOLUTION: The graph of g(x) is the graph of f (x) expanded
vertically. The amplitude of g(x) is or 6.
Create a table listing the coordinates of the x-intercepts and extrema for f (x) = cos x for one
period, 2 , on the interval [0, 2 ]. Then use the amplitude of g(x) to find corresponding points on its graph.
Sketch the curve through the indicated points for each function. Then repeat the pattern to complete asecond period.
Functions f (x) = cos x g(x) = 6 cos x
Max (0, 1) (0, 6)
x-int
Min
x-int
Max
4. f (x) = sin x; g(x) = −8 sin x
SOLUTION: The graph of g(x) is the graph of f (x) expanded
vertically. The amplitude of g(x) is or 8.
Create a table listing the coordinates of the x-intercepts and extrema for f (x) = sin x for one
period, 2 , on the interval [0, 2 ]. Then use the amplitude of g(x) to find corresponding points on its graph.
Sketch the curve through the indicated points for each function. Then repeat the pattern to complete asecond period.
Function f (x) = sin x
x-int (0, 0)
Max
x-int
Min
x-int
Function g(x) = −8
sin x
x-int (0, 0)
Min
x-int
Max
x-int
Describe how the graphs of f (x) and g (x) are related. Then find the period of g (x), and sketch at least one period of both functions on the same coordinate axes.
5. f (x) = sin x; g(x) = sin 4x
SOLUTION: The graph of g(x) is the graph of f (x) compressed
horizontally. The period of g(x) is . To find
corresponding points on the graph of g(x), change the x-coordinates of those key points on f (x) so that
they range from 0 to , increasing by increments of
.
Sketch the curve through the indicated points for each function. Then repeat the pattern to complete asecond period.
Functions f (x) = sin x g(x) = sin
4x
x-int (0, 0) (0, 0)
Max
x-int
Min
x-int
6. f (x) = cos x; g(x) = cos 2x
SOLUTION: The graph of g(x) is the graph of f (x) compressed
horizontally. The period of g(x) is or . To find
corresponding points on the graph of g(x), change the x-coordinates of those key points on f (x) so that
they range from 0 to , increasing by increments of
.
Sketch the curve through the indicated points for each function. Then repeat the pattern to complete asecond period.
Functions f (x) = cos x g(x) = cos 2x
Max (0, 1) (0, 1)
x-int
Min
x-int
Max
7. f (x) = cos x;
SOLUTION: The graph of g(x) is the graph of f (x) expanded
horizontally. The period of g(x) is . To
find corresponding points on the graph of g(x), change the x-coordinates of those key points on f (x)
so that they range from 0 to , increasing by
increments of or .
Sketch the curve through the indicated points for each function. Then repeat the pattern to complete asecond period.
Functions f (x) = cos x
Max (0, 1) (0, 1)
x-int
Min
x-int
Max
8. f (x) = sin x;
SOLUTION: The graph of g(x) is the graph of f (x) expanded
horizontally. The period of g(x) is . To find corresponding points on the graph of g(x), change the x-coordinates of those key points on f (x) so that they range from 0 to , increasing by increments of
or .
Sketch the curve through the indicated points for each function. Then repeat the pattern to complete asecond period.
Functions f (x) = sin x
x-int (0, 0) (0, 0)
Max
x-int
Min
x-int
9. VOICES The contralto vocal type includes the deepest female singing voice. Some contraltos can sing as low as the E below middle C (E3), which hasa frequency of 165 hertz. Write an equation for a sine function that models the initial behavior of the sound wave associated with E3 having an amplitude of 0.15.
SOLUTION: The general form of the equation will be y = a sin bt,where t is the time in seconds. Because the
amplitude is 0.15, |a|= 0.15. This means that a = ±0.15. The period is the reciprocal of the frequency or
. Use this value to find b.
Sample answer: One sine function that models the
initial behavior is y = 0.15 sin 330 t.
Write a sine function that can be used to model the initial behavior of a sound wave with the frequency and amplitude given.
10. f = 440, a = 0.3
SOLUTION: The general form of the equation is y = a sin bt, where t is the time in seconds. Because the
amplitude is 0.3, = 0.3. This means that a = ±0.3.
The period is the reciprocal of the frequency or
. Use this value to find b.
Using the positive values of a and b, one sine function that models the initial behavior is y = 0.3 sin
880 t.
11. f = 932, a = 0.25
SOLUTION: The general form of the equation is y = a sin bt, where t is the time in seconds. Because the
amplitude is 0.25, = 0.25. This means that a =
±0.25. The period is the reciprocal of the frequency
or . Use this value to find b.
Using the positive values of a and b, one sine function that models the initial behavior is y = 0.25
sin 1864 t.
12. f = 1245, a = 0.12
SOLUTION: The general form of the equation is y = a sin bt, where t is the time in seconds. Because the
amplitude is 0.12, = 0.12. This means that a =
±0.12. The period is the reciprocal of the frequency or
. Use this value to find b.
Using the positive values of a and b, one sine function that models the initial behavior is y = 0.12
sin 2490 t.
13. f = 623, a = 0.2
SOLUTION: The general form of the equation is y = a sin bt, where t is the time in seconds. Because the
amplitude is 0.2, = 0.2. This means that a = ±0.2.
The period is the reciprocal of the frequency or
. Use this value to find b.
Using the positive values of a and b, one sine function that models the initial behavior is y = 0.2 sin
1246 t.
State the amplitude, period, frequency, phase shift, and vertical shift of each function. Then graph two periods of the function.
14.
SOLUTION:
In this function, a = 3, b = 1, c = − , and d = 0.
Because d = 0, there is no vertical shift.
Graph y = 3 sin x shifted units to the right.
15.
SOLUTION:
In this function, a = 1, b = , c = , and d = 0.
Because d = 0, there is no vertical shift.
16. y = 0.25 cos x + 3
SOLUTION:
In this function, a = , b = 1, c = 0, and d = 3.
Graph y = cos x shifted 3 units up.
17. y = sin 3x – 2
SOLUTION: In this function, a = 1, b = 3, c = 0, and d = –2.
Graph y = sin 3x shifted 2 units down.
18.
SOLUTION:
In this function, a = 1, b = 1, c = , and d = –1.
.
Graph y = cos x shifted units to the right and 1
unit down.
19.
SOLUTION:
In this function, a = 1, b = 1, c = , and d = 4.
.
Graph y = sin x shifted units to the left and 4 units up.
20. VACATIONS The average number of reservations R that a vacation resort has at the beginning of each month is shown.
a. Write an equation of a sinusoidal function that models the average number of reservations using x =1 to represent January. b. According to your model, approximately how many reservations can the resort anticipate in November?
SOLUTION: a. Make a scatter plot of the data and choose a model.
Sample answer: Use a sinusoidal function of the form y = a cos (bx + c) + d to model the data. First, find the maximum M and minimum m values of the data, and use these values to find a, b, c, and d. The maximum and minimum reservations are 200 and 87, respectively. The amplitude a is half of the distance between these values.
The vertical shift d is the average of the maximum and minimum data values.
There are 3 months between the maximum and minimum, so the period is 6.
The maximum data value occurs when x = 1. Since y = cos x attains its first maximum when x = 0, we must apply a phase shift of 1 unit. Use this value to find c.
Write a function using the values for a, b, c, and d.
Use b =
b. To find the number of reservations in November, evaluate the model for x = 11.
Therefore, the resort can anticipate about 115 reservations in November.
21. TIDES The table shown below provides data for the first high and low tides of the day for a certain bay during one day in June.
a. Determine the amplitude, period, phase shift, and vertical shift of a sinusoidal function that models the height of the tide. Let x represent the number of hours that the high or low tide occurred after midnight. b. Write a sinusoidal function that models the data. c. According to your model, what was the height of
the tide at 8:45 P.M. that night?
SOLUTION: a. Sample answer: Use a sinusoidal function of the form y = a cos (bx + c) + d to model the data. First, find the amplitude a, which is half of the distance between the heights of the high and low tides.
The vertical shift d is the average of the heights of the high and low tides.
A sinusoid completes half of a period in the time thatit takes to go from its maximum to its minimum value. One period is twice this time. The first high tide occurs 6.5 hours before the first low tide, so the period is 13.
The maximum data value occurs when x ≈ 4.417. Since y = cos x attains its first maximum when x = 0,we must apply a phase shift of 4.417 units. Use this value to find c.
b. Write a function using the values for a, b, c, and
d. Use b =
c. To find the height of the water at 8:45 P.M. that
night, evaluate the model for x = 20.75.
Therefore, the tide was about 7.28 feet high at 8:45
P.M. that night.
22. METEOROLOGY The average monthly temperatures for Boston, Massachusetts are shown.
a. Determine the amplitude, period, phase shift, and vertical shift of a sinusoidal function that models the monthly temperatures using x = 1 to represent January. b. Write an equation of a sinusoidal function that models the monthly temperatures. c. According to your model, what is Boston’s average temperature in August?
SOLUTION: a. The maximum and minimum are 74° and 29°, respectively. The amplitude a is half of the distance between these values.
The vertical shift d is the average of the maximum and minimum data values.
A sinusoid completes half of a period in the time thatit takes to go from its maximum to its minimum value. So, one period is twice this time. The
maximum function value occurs in July, so xmax is 7.
The minimum function value occurs in January, so
xmin is 1. The period is 2(6) = 12.
The maximum data value occurs when x = 7. Since y = cos x attains its first maximum when x = 0, we must apply a phase shift of 7 units. Use this value to find c.
b. Using the values for a, b, c, and d from part a, a sinusoidal function that models that monthly temperatures in Boston is
c. To find the average monthly temperature for Boston in August, evaluate the model for x = 8.
Therefore, the average monthly temperature for Boston in August is about 71°F.
GRAPHING CALCULATOR Find the values of x in the interval – < x < that make each equation or inequality true. (Hint: Use the intersection function.)
23. –sin x = cos x
SOLUTION:
Graph y = −sin x and y = cos x on the same graphing
calculator screen on (−π, π). Use the intersect feature under the CALC menu to determine where the two graphs intersect.
The graphs intersect at about −0.7854 or − and
about 2.356 or . Therefore, on –π < x < π, –sin x
= cos x when x = − and .
24. sin x − cos x = 1
SOLUTION:
Graph y = sin x − cos x and y = 1 on the same
graphing calculator screen on (− , ). Use the intersect feature under the CALC menu to determine where the two graphs intersect.
The graphs intersect at about 1.57 or . Therefore,
on – < x < , sin x − cos x = 1 when x = .
25. sin x + cos x = 0
SOLUTION:
Graph y = sin x + cos x on (−π, π). Use the zero feature under the CALC menu to determine the zeros of the function.
There are zeros at about −0.785 or − or and about
2.356 or . Therefore, on – < x < , sin x + cos
x = 0 when
26. cos x ≤ sin x
SOLUTION:
Graph y = cos x and y = sin x on (−π, π). Use the intersect feature under the CALC menu to determine on what interval(s) cos x ≤ sin x.
The graphs intersect at about –2.356 or – and
about 0.785 or . From the graph, it appears that
cos x ≤ sin x on – < x < – and < x < .
27. sin x cos x > 1
SOLUTION:
Graph y = sin x cos x and y = 1 on (− , ). Use the intersect feature under the CALC menu to determine on what interval(s) sin x cos x > 1.
The graphs do not intersect. Therefore, y = sin x cos
x is not greater than y = 1 for any values of x on –< x < .
28. sin x cos x ≤ 0
SOLUTION:
Graph y = sin x cos x on (−π, π). Use the zero feature under the CALC menu to determine on what interval(s) sin x cos x ≤ 0.
The zeros of y = sin x cos x are about –1.57 or ,
0, and about 1.57 or . From the graph, it appears
that sin x cos x ≤ 0 on < x < 0 and < x < .
29. CAROUSELS A wooden horse on a carousel moves up and down as the carousel spins. When the ride ends, the horse usually stops in a vertical position different from where it started. The position y of the horse after t seconds can be modeled by y =1.5 sin (2t + c), where the phase shift c must be continuously adjusted to compensate for the differentstarting positions. If during one ride the horse
reached a maximum height after seconds, find
the equation that models the horse’s position.
SOLUTION: First, find the period of y = 1.5 sin (2t + c).
Since the period is π, the function will reach a
maximum height at radians. The phase shift is the
difference between the horizontal position of the
function at and radians, which is radians.
Substitute and b into the phase shift formula to
find c.
Therefore, the equation is
30. AMUSEMENT PARKS The position y in feet of a passenger cart relative to the center of a Ferris wheel over t seconds is shown below.
a. Find the time t that it takes for the cart to return toy = 0 during its initial spin. b. Find the period of the Ferris wheel. c. Sketch the graph representing the position of the passenger cart over one period. d. Write a sinusoidal function that models the position of the passenger cart as a function of time t.
SOLUTION: a. From the diagram, the height of the cart is 0 ft when t = 0, and reaches a maximum height of 19 feet when t = 3.75 seconds. So, the cart will return to y = 0 after 2(3.75) or 7.5 seconds. b. The cart completes half of a cycle from t = 0 to t = 7.5. So, the period is 2(7.5) or 15 seconds. c.
d. The amplitude a is half of the maximum and
minimum values. So, a =
The vertical shift d is the average of the maximum
and minimum data values. So,
Because the period of a sinusoidal function is
you can write Therefore,
There is no phase shift because the height of the cartwhen t = 0 is 0 feet, and the sine function has a y-intercept of 0. Therefore, one equation that could be used to model
the position of the passenger cart is y = 19 sin t.
Write an equation that corresponds to each graph.
31.
SOLUTION: Sample answer: There is an x-intercept at 0, so one equation that corresponds to this graph is y = a sin (bx + c) + d. Half of the distance from the maximum to the minimum value of the function is 3. So, the amplitudeis 3. It appears that the function completes one period on
[0, π]. Find b.
The midline appears to be at y = 0, so there does not appear to be any vertical shift. Therefore, one equation that corresponds to this graph is y = 3 sin (2x).
32.
SOLUTION:
Sample answer: Because there is a y-intercept at ,
one equation that corresponds to this graph is y = a cos (bx + c) + d. Half of the distance from the maximum to the
minimum value of the function is . So, the
amplitude is .
It appears that the function completes one period on [0, 6π]. Find b.
The midline appears to be at y = 0, so there does not appear to be any vertical shift. Therefore, one
equation that corresponds to this graph is y = cos
.
33.
SOLUTION: Sample answer: Because there is a y-intercept at 3, one equation that corresponds to this graph is y = a cos (bx + c) + d. Half of the distance from the maximum to the
minimum value of the function is 4 ÷ 2 or 2. So, the amplitude is 2. It appears that the function completes one period on
Find b.
The midline appears to be at y = 1, so there is a vertical shift 1 unit up. Therefore, one equation that corresponds to this graph is y = 2 cos 4x + 1.
34.
SOLUTION: Sample answer: There is an x-intercept at 0, so one equation that corresponds to this graph is y = a sin (bx + c) + d. Half of the distance from the maximum to the
minimum value of the function is 8 ÷ 2 or 4. So, the amplitude is 4. It appears that the function completes one period on [0, 4π]. Find b.
The midline appears to be at y = −2, so there is a vertical shift of 2 units down. Therefore, one equation that corresponds to this graph is y = 4 sin
− 2.
Write a sinusoidal function with the given period and amplitude that passes through the given point.
35. period: ; amplitude: 5; point:
SOLUTION: Use the period to find b.
Sample answer: One sinusoidal function in which a =5 and b = 2 is y = 5 cos 2x. Evaluate the function for
The function passes through . Therefore, a
sinusoidal function with period π and amplitude 5 that
passes through the point is y = 5 cos 2x.
36. period: 4 ; amplitude: 2; point: ( , 2)
SOLUTION: Use the period to find b.
Sample answer: One sinusoidal function in which a =
2 and b = is y = 2 sin . Evaluate the function
for x = π.
The function passes through ( , 2). Therefore, a
sinusoidal function with period 4π and amplitude 2
that passes through the point ( , 2) is y = 2 sin .
37. period: ; amplitude: ; point:
SOLUTION: Use the period to find b.
Sample answer: One sinusoidal function in which a =1.5 and b = 4 is y = 1.5 cos 4x. Evaluate the function
for
The function passes through . Therefore, a
sinusoidal function with period and amplitude 1.5
that passes through the point is y = 1.5 cos
4x.
38. period: 3π; amplitude: ; point:
SOLUTION: Use the period to find b.
Sample answer: One sinusoidal function in which a =
0.5 and b = is y = sin x. Evaluate the
function for
The function passes through . Therefore, a
sinusoidal function with period 3π and amplitude 0.5
that passes through the point is y = sin
x.
39. MULTIPLE REPRESENTATIONS In this problem, you will investigate the change in the graph of a sinusoidal function of the form y = sin x or y = cos x when multiplied by a polynomial function. a. GRAPHICAL Use a graphing calculator to sketch the graphs of y = 2x, y = –2x, and y = 2x cos x on the same coordinate plane, on the interval [–20, 20]. b. VERBAL Describe the behavior of the graph of y = 2x cos x in relation to the graphs of y = 2x and y = –2x. c. GRAPHICAL Use a graphing calculator to
sketch the graphs of y = x2, y = –x
2, and y = x
2 sin x
on the same coordinate plane, on the interval [–20, 20]. d. VERBAL Describe the behavior of the graph of
y = x2 sin x in relation to the graphs of y = x
2 and y
= –x2.
e. ANALYTICAL Make a conjecture as to the behavior of the graph of a sinusoidal function of the form y = sin x or y = cos x when multiplied by polynomial function of the form y = f (x).
SOLUTION: a.
b. The graph of y = 2x cos x oscillates between the graphs of y = 2x and y = –2x. c.
d. The graph of y = x2 sin x oscillates between the
graphs of y = x2 and y = –x
2.
e . The graph of y = f (x) sin x or y = f (x) cos x will oscillate between the graphs of y = f (x) and y = –f(x).
40. CHALLENGE Without graphing, find the exact coordinates of the first maximum point to the right of
the y-axis for
SOLUTION:
First, find the phase shift for
Next, find the period of the function.
The first maximum for one period can be found by
finding So, incorporating the phase shift, the
first maximum to the right of the y-axis is
. Because the amplitude is |4| = 4,
the maximum point is
REASONING Determine whether each statement is true or false . Explain your reasoning.
41. Every sine function of the form y = a sin (bx + c) + d can be written as a cosine function of the form y =a cos (bx + c) + d.
SOLUTION: It is true that every sine function of the form y = a sin (bx + c) + d can be written as a cosine function of the form y = a cos (bx + c) + d. The graph of cosine is a horizontal translation of the sine graph. Therefore, a cosine function can be written from any sine function using the same amplitude and period by applying the necessary phase shift.
For example, consider and
. Phase shift by
to obtain .
42. The period of f (x) = cos 8x is equal to four times the period of g(x) = cos 2x.
SOLUTION: Find the period of f (x) = cos 8x.
Find the period of g(x) = cos 2x.
Four times the period of g(x) = cos 2x is 4 ⋅ or
4 . So, the period of f (x) is the period of g(x).
Therefore, the statement is false.
43. CHALLENGE How many zeros does y = cos
1500x have on the interval 0 ≤ x ≤ 2 ?
SOLUTION: Find the period of y = cos 1500x.
Graph y = cos 1500x on .
The graph of y = cos 1500x has two x-intercepts for one cycle, so the function has 2 zeros per cycle. Find
the number of cycles for y = cos 1500x on [0, 2 ].
So, the graph of y = cos 1500x will complete 1500
cycles on [0, 2 ]. Because there are two zeros per cycle, y = cos 1500x will have 1500(2) or 3000 zeros
on [0, 2 ].
44. PROOF Prove the phase shift formula.
SOLUTION:
Consider y = a sin (bx + c), where a , b, and c ≠ 0. To find a zero of the function, find the value of x for which a sin (bx + c) = 0. Since sin 0 = 0, solving bx + c = 0 will yield a zero of the function.
Therefore, y = 0 when . The value of is
the phase shift. When c > 0: The graph of y = a sin (bx + c) is the
graph of y = a sin x, shifted units to the left.
When c < 0: The graph of y = a sin (bx + c) is the
graph of y = a sin x, shifted units to the right.
Consider the graph of y = cos x below in blue. In this equation a = 1, b = 1 and c = 0. One zero of y = cos x is . The green graph is shifted to the
left. Thus c is – . Then the shifted equation will be
.
45. Writing in Math The Power Tower ride in Sandusky, Ohio, is shown below. Along the side of each tower is a string of lights that send a continuouspulse of light up and down each tower at a constant rate. Explain why the distance d of this light from theground over time t cannot be represented by a sinusoidal function.
SOLUTION: Sample answer: Although the pulse of light can be represented as a function with a period, it is not a sinusoidal function because the distance the pulse of light is from the ground changes at a constant rate. As a result, the graph of this function would resemble the graph below.
The given point lies on the terminal side of an angle θ in standard position. Find the values of
the six trigonometric functions of θ. 46. (−4, 4)
SOLUTION: Use the values of x and y to find r.
Use x = –4, y = 4, and r = to write the six trigonometric ratios.
47. (8, −2)
SOLUTION: Use the values of x and y to find r.
Use x = 8, y = –2, and r = to write the six trigonometric ratios.
48. (−5, −9)
SOLUTION: Use the values of x and y to find r.
Use x = –5, y = – 9, and r = to write the six trigonometric ratios.
49. (4, 5)
SOLUTION: Use the values of x and y to find r.
Use x = 4, y = 5, and r = to write the six trigonometric ratios.
Write each degree measure in radians as a multiple of π and each radian measure in degrees.
50. 25°
SOLUTION: To convert a degree measure to radians, multiply by
51. −420°
SOLUTION: To convert a degree measure to radians, multiply by
52.
SOLUTION: To convert a radian measure to degrees, multiply by
53.
SOLUTION: To convert a radian measure to degrees, multiply by
54. SCIENCE Radiocarbon dating is a method of estimating the age of an organic material by calculating the amount of carbon-14 present in the material. The age of a material can be calculated
using A = t , where A is the age of the
object in years, t is the half-life of carbon-14 or 5700 years, and R is the ratio of the amount of carbon-14 in the sample to the amount of carbon-14 in living tissue. a. A sample of organic material contains 0.000076 gram of carbon-14. A living sample of the same
eSolutions Manual - Powered by Cognero Page 21
4-4 Graphing Sine and Cosine Functions
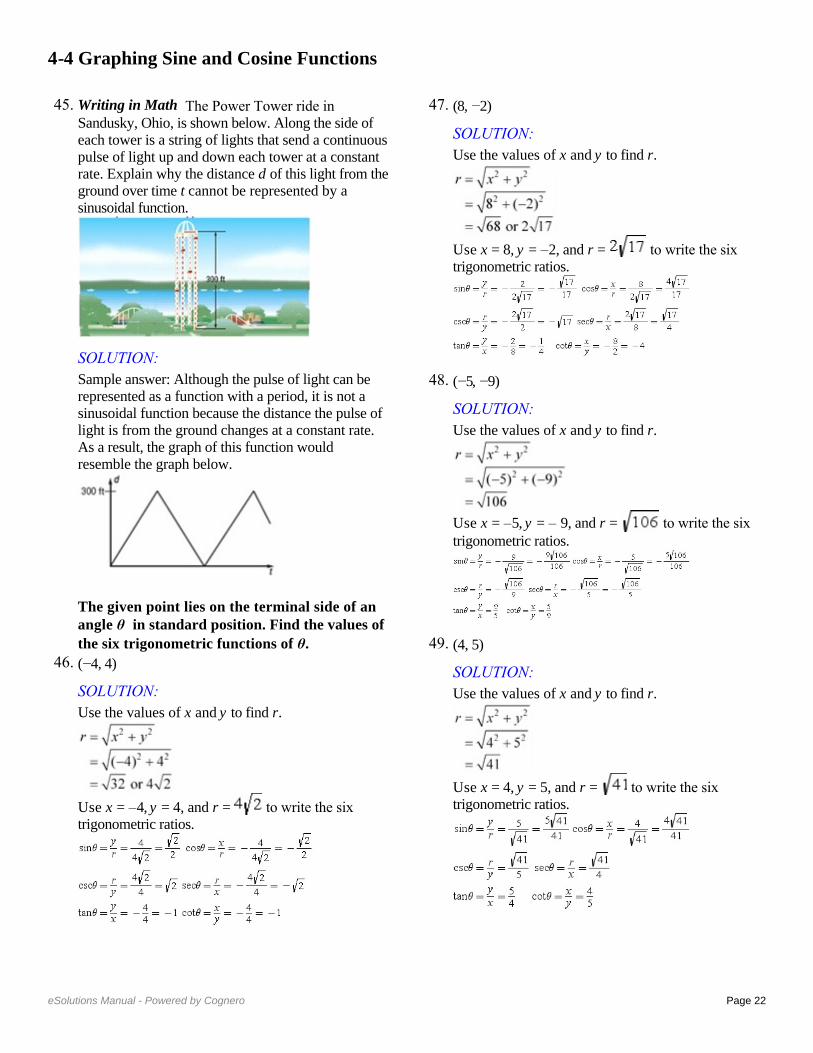
Describe how the graphs of f (x) and g (x) are related. Then find the amplitude of g (x), and sketch two periods of both functions on the same coordinate axes.
1. f (x) = sin x; g(x) = sin x
SOLUTION: The graph of g(x) is the graph of f (x) compressed
vertically. The amplitude of g(x) is or .
Create a table listing the coordinates of the x-intercepts and extrema for f (x) = sin x for one
period, 2 , on the interval [0, 2 ]. Then use the amplitude of g(x) to find corresponding points on its graph.
Sketch the curve through the indicated points for each function. Then repeat the pattern to complete asecond period.
Functions f (x) = sin x g(x) = sin x
x-int (0, 0) (0, 0)
Max
x-int
Min
x-int
2.
SOLUTION: The graph of g(x) is the graph of f (x) compressed
vertically. The amplitude of g(x) is or .
Create a table listing the coordinates of the x-intercepts and extrema for f (x) = cos x for one
period, 2 , on the interval [0, 2 ]. Then use the amplitude of g(x) to find corresponding points on its graph.
Sketch the curve through the indicated points for each function. Then repeat the pattern to complete asecond period.
Function f (x) = cos x
Max (0, 1)
x-int Min
x-in
Min
x-int
Function f (x) = cos x
Max x-int
Min
x-in
Min
x-int
3. f (x) = cos x; g(x) = 6 cos x
SOLUTION: The graph of g(x) is the graph of f (x) expanded
vertically. The amplitude of g(x) is or 6.
Create a table listing the coordinates of the x-intercepts and extrema for f (x) = cos x for one
period, 2 , on the interval [0, 2 ]. Then use the amplitude of g(x) to find corresponding points on its graph.
Sketch the curve through the indicated points for each function. Then repeat the pattern to complete asecond period.
Functions f (x) = cos x g(x) = 6 cos x
Max (0, 1) (0, 6)
x-int
Min
x-int
Max
4. f (x) = sin x; g(x) = −8 sin x
SOLUTION: The graph of g(x) is the graph of f (x) expanded
vertically. The amplitude of g(x) is or 8.
Create a table listing the coordinates of the x-intercepts and extrema for f (x) = sin x for one
period, 2 , on the interval [0, 2 ]. Then use the amplitude of g(x) to find corresponding points on its graph.
Sketch the curve through the indicated points for each function. Then repeat the pattern to complete asecond period.
Function f (x) = sin x
x-int (0, 0)
Max
x-int
Min
x-int
Function g(x) = −8
sin x
x-int (0, 0)
Min
x-int
Max
x-int
Describe how the graphs of f (x) and g (x) are related. Then find the period of g (x), and sketch at least one period of both functions on the same coordinate axes.
5. f (x) = sin x; g(x) = sin 4x
SOLUTION: The graph of g(x) is the graph of f (x) compressed
horizontally. The period of g(x) is . To find
corresponding points on the graph of g(x), change the x-coordinates of those key points on f (x) so that
they range from 0 to , increasing by increments of
.
Sketch the curve through the indicated points for each function. Then repeat the pattern to complete asecond period.
Functions f (x) = sin x g(x) = sin
4x
x-int (0, 0) (0, 0)
Max
x-int
Min
x-int
6. f (x) = cos x; g(x) = cos 2x
SOLUTION: The graph of g(x) is the graph of f (x) compressed
horizontally. The period of g(x) is or . To find
corresponding points on the graph of g(x), change the x-coordinates of those key points on f (x) so that
they range from 0 to , increasing by increments of
.
Sketch the curve through the indicated points for each function. Then repeat the pattern to complete asecond period.
Functions f (x) = cos x g(x) = cos 2x
Max (0, 1) (0, 1)
x-int
Min
x-int
Max
7. f (x) = cos x;
SOLUTION: The graph of g(x) is the graph of f (x) expanded
horizontally. The period of g(x) is . To
find corresponding points on the graph of g(x), change the x-coordinates of those key points on f (x)
so that they range from 0 to , increasing by
increments of or .
Sketch the curve through the indicated points for each function. Then repeat the pattern to complete asecond period.
Functions f (x) = cos x
Max (0, 1) (0, 1)
x-int
Min
x-int
Max
8. f (x) = sin x;
SOLUTION: The graph of g(x) is the graph of f (x) expanded
horizontally. The period of g(x) is . To find corresponding points on the graph of g(x), change the x-coordinates of those key points on f (x) so that they range from 0 to , increasing by increments of
or .
Sketch the curve through the indicated points for each function. Then repeat the pattern to complete asecond period.
Functions f (x) = sin x
x-int (0, 0) (0, 0)
Max
x-int
Min
x-int
9. VOICES The contralto vocal type includes the deepest female singing voice. Some contraltos can sing as low as the E below middle C (E3), which hasa frequency of 165 hertz. Write an equation for a sine function that models the initial behavior of the sound wave associated with E3 having an amplitude of 0.15.
SOLUTION: The general form of the equation will be y = a sin bt,where t is the time in seconds. Because the
amplitude is 0.15, |a|= 0.15. This means that a = ±0.15. The period is the reciprocal of the frequency or
. Use this value to find b.
Sample answer: One sine function that models the
initial behavior is y = 0.15 sin 330 t.
Write a sine function that can be used to model the initial behavior of a sound wave with the frequency and amplitude given.
10. f = 440, a = 0.3
SOLUTION: The general form of the equation is y = a sin bt, where t is the time in seconds. Because the
amplitude is 0.3, = 0.3. This means that a = ±0.3.
The period is the reciprocal of the frequency or
. Use this value to find b.
Using the positive values of a and b, one sine function that models the initial behavior is y = 0.3 sin
880 t.
11. f = 932, a = 0.25
SOLUTION: The general form of the equation is y = a sin bt, where t is the time in seconds. Because the
amplitude is 0.25, = 0.25. This means that a =
±0.25. The period is the reciprocal of the frequency
or . Use this value to find b.
Using the positive values of a and b, one sine function that models the initial behavior is y = 0.25
sin 1864 t.
12. f = 1245, a = 0.12
SOLUTION: The general form of the equation is y = a sin bt, where t is the time in seconds. Because the
amplitude is 0.12, = 0.12. This means that a =
±0.12. The period is the reciprocal of the frequency or
. Use this value to find b.
Using the positive values of a and b, one sine function that models the initial behavior is y = 0.12
sin 2490 t.
13. f = 623, a = 0.2
SOLUTION: The general form of the equation is y = a sin bt, where t is the time in seconds. Because the
amplitude is 0.2, = 0.2. This means that a = ±0.2.
The period is the reciprocal of the frequency or
. Use this value to find b.
Using the positive values of a and b, one sine function that models the initial behavior is y = 0.2 sin
1246 t.
State the amplitude, period, frequency, phase shift, and vertical shift of each function. Then graph two periods of the function.
14.
SOLUTION:
In this function, a = 3, b = 1, c = − , and d = 0.
Because d = 0, there is no vertical shift.
Graph y = 3 sin x shifted units to the right.
15.
SOLUTION:
In this function, a = 1, b = , c = , and d = 0.
Because d = 0, there is no vertical shift.
16. y = 0.25 cos x + 3
SOLUTION:
In this function, a = , b = 1, c = 0, and d = 3.
Graph y = cos x shifted 3 units up.
17. y = sin 3x – 2
SOLUTION: In this function, a = 1, b = 3, c = 0, and d = –2.
Graph y = sin 3x shifted 2 units down.
18.
SOLUTION:
In this function, a = 1, b = 1, c = , and d = –1.
.
Graph y = cos x shifted units to the right and 1
unit down.
19.
SOLUTION:
In this function, a = 1, b = 1, c = , and d = 4.
.
Graph y = sin x shifted units to the left and 4 units up.
20. VACATIONS The average number of reservations R that a vacation resort has at the beginning of each month is shown.
a. Write an equation of a sinusoidal function that models the average number of reservations using x =1 to represent January. b. According to your model, approximately how many reservations can the resort anticipate in November?
SOLUTION: a. Make a scatter plot of the data and choose a model.
Sample answer: Use a sinusoidal function of the form y = a cos (bx + c) + d to model the data. First, find the maximum M and minimum m values of the data, and use these values to find a, b, c, and d. The maximum and minimum reservations are 200 and 87, respectively. The amplitude a is half of the distance between these values.
The vertical shift d is the average of the maximum and minimum data values.
There are 3 months between the maximum and minimum, so the period is 6.
The maximum data value occurs when x = 1. Since y = cos x attains its first maximum when x = 0, we must apply a phase shift of 1 unit. Use this value to find c.
Write a function using the values for a, b, c, and d.
Use b =
b. To find the number of reservations in November, evaluate the model for x = 11.
Therefore, the resort can anticipate about 115 reservations in November.
21. TIDES The table shown below provides data for the first high and low tides of the day for a certain bay during one day in June.
a. Determine the amplitude, period, phase shift, and vertical shift of a sinusoidal function that models the height of the tide. Let x represent the number of hours that the high or low tide occurred after midnight. b. Write a sinusoidal function that models the data. c. According to your model, what was the height of
the tide at 8:45 P.M. that night?
SOLUTION: a. Sample answer: Use a sinusoidal function of the form y = a cos (bx + c) + d to model the data. First, find the amplitude a, which is half of the distance between the heights of the high and low tides.
The vertical shift d is the average of the heights of the high and low tides.
A sinusoid completes half of a period in the time thatit takes to go from its maximum to its minimum value. One period is twice this time. The first high tide occurs 6.5 hours before the first low tide, so the period is 13.
The maximum data value occurs when x ≈ 4.417. Since y = cos x attains its first maximum when x = 0,we must apply a phase shift of 4.417 units. Use this value to find c.
b. Write a function using the values for a, b, c, and
d. Use b =
c. To find the height of the water at 8:45 P.M. that
night, evaluate the model for x = 20.75.
Therefore, the tide was about 7.28 feet high at 8:45
P.M. that night.
22. METEOROLOGY The average monthly temperatures for Boston, Massachusetts are shown.
a. Determine the amplitude, period, phase shift, and vertical shift of a sinusoidal function that models the monthly temperatures using x = 1 to represent January. b. Write an equation of a sinusoidal function that models the monthly temperatures. c. According to your model, what is Boston’s average temperature in August?
SOLUTION: a. The maximum and minimum are 74° and 29°, respectively. The amplitude a is half of the distance between these values.
The vertical shift d is the average of the maximum and minimum data values.
A sinusoid completes half of a period in the time thatit takes to go from its maximum to its minimum value. So, one period is twice this time. The
maximum function value occurs in July, so xmax is 7.
The minimum function value occurs in January, so
xmin is 1. The period is 2(6) = 12.
The maximum data value occurs when x = 7. Since y = cos x attains its first maximum when x = 0, we must apply a phase shift of 7 units. Use this value to find c.
b. Using the values for a, b, c, and d from part a, a sinusoidal function that models that monthly temperatures in Boston is
c. To find the average monthly temperature for Boston in August, evaluate the model for x = 8.
Therefore, the average monthly temperature for Boston in August is about 71°F.
GRAPHING CALCULATOR Find the values of x in the interval – < x < that make each equation or inequality true. (Hint: Use the intersection function.)
23. –sin x = cos x
SOLUTION:
Graph y = −sin x and y = cos x on the same graphing
calculator screen on (−π, π). Use the intersect feature under the CALC menu to determine where the two graphs intersect.
The graphs intersect at about −0.7854 or − and
about 2.356 or . Therefore, on –π < x < π, –sin x
= cos x when x = − and .
24. sin x − cos x = 1
SOLUTION:
Graph y = sin x − cos x and y = 1 on the same
graphing calculator screen on (− , ). Use the intersect feature under the CALC menu to determine where the two graphs intersect.
The graphs intersect at about 1.57 or . Therefore,
on – < x < , sin x − cos x = 1 when x = .
25. sin x + cos x = 0
SOLUTION:
Graph y = sin x + cos x on (−π, π). Use the zero feature under the CALC menu to determine the zeros of the function.
There are zeros at about −0.785 or − or and about
2.356 or . Therefore, on – < x < , sin x + cos
x = 0 when
26. cos x ≤ sin x
SOLUTION:
Graph y = cos x and y = sin x on (−π, π). Use the intersect feature under the CALC menu to determine on what interval(s) cos x ≤ sin x.
The graphs intersect at about –2.356 or – and
about 0.785 or . From the graph, it appears that
cos x ≤ sin x on – < x < – and < x < .
27. sin x cos x > 1
SOLUTION:
Graph y = sin x cos x and y = 1 on (− , ). Use the intersect feature under the CALC menu to determine on what interval(s) sin x cos x > 1.
The graphs do not intersect. Therefore, y = sin x cos
x is not greater than y = 1 for any values of x on –< x < .
28. sin x cos x ≤ 0
SOLUTION:
Graph y = sin x cos x on (−π, π). Use the zero feature under the CALC menu to determine on what interval(s) sin x cos x ≤ 0.
The zeros of y = sin x cos x are about –1.57 or ,
0, and about 1.57 or . From the graph, it appears
that sin x cos x ≤ 0 on < x < 0 and < x < .
29. CAROUSELS A wooden horse on a carousel moves up and down as the carousel spins. When the ride ends, the horse usually stops in a vertical position different from where it started. The position y of the horse after t seconds can be modeled by y =1.5 sin (2t + c), where the phase shift c must be continuously adjusted to compensate for the differentstarting positions. If during one ride the horse
reached a maximum height after seconds, find
the equation that models the horse’s position.
SOLUTION: First, find the period of y = 1.5 sin (2t + c).
Since the period is π, the function will reach a
maximum height at radians. The phase shift is the
difference between the horizontal position of the
function at and radians, which is radians.
Substitute and b into the phase shift formula to
find c.
Therefore, the equation is
30. AMUSEMENT PARKS The position y in feet of a passenger cart relative to the center of a Ferris wheel over t seconds is shown below.
a. Find the time t that it takes for the cart to return toy = 0 during its initial spin. b. Find the period of the Ferris wheel. c. Sketch the graph representing the position of the passenger cart over one period. d. Write a sinusoidal function that models the position of the passenger cart as a function of time t.
SOLUTION: a. From the diagram, the height of the cart is 0 ft when t = 0, and reaches a maximum height of 19 feet when t = 3.75 seconds. So, the cart will return to y = 0 after 2(3.75) or 7.5 seconds. b. The cart completes half of a cycle from t = 0 to t = 7.5. So, the period is 2(7.5) or 15 seconds. c.
d. The amplitude a is half of the maximum and
minimum values. So, a =
The vertical shift d is the average of the maximum
and minimum data values. So,
Because the period of a sinusoidal function is
you can write Therefore,
There is no phase shift because the height of the cartwhen t = 0 is 0 feet, and the sine function has a y-intercept of 0. Therefore, one equation that could be used to model
the position of the passenger cart is y = 19 sin t.
Write an equation that corresponds to each graph.
31.
SOLUTION: Sample answer: There is an x-intercept at 0, so one equation that corresponds to this graph is y = a sin (bx + c) + d. Half of the distance from the maximum to the minimum value of the function is 3. So, the amplitudeis 3. It appears that the function completes one period on
[0, π]. Find b.
The midline appears to be at y = 0, so there does not appear to be any vertical shift. Therefore, one equation that corresponds to this graph is y = 3 sin (2x).
32.
SOLUTION:
Sample answer: Because there is a y-intercept at ,
one equation that corresponds to this graph is y = a cos (bx + c) + d. Half of the distance from the maximum to the
minimum value of the function is . So, the
amplitude is .
It appears that the function completes one period on [0, 6π]. Find b.
The midline appears to be at y = 0, so there does not appear to be any vertical shift. Therefore, one
equation that corresponds to this graph is y = cos
.
33.
SOLUTION: Sample answer: Because there is a y-intercept at 3, one equation that corresponds to this graph is y = a cos (bx + c) + d. Half of the distance from the maximum to the
minimum value of the function is 4 ÷ 2 or 2. So, the amplitude is 2. It appears that the function completes one period on
Find b.
The midline appears to be at y = 1, so there is a vertical shift 1 unit up. Therefore, one equation that corresponds to this graph is y = 2 cos 4x + 1.
34.
SOLUTION: Sample answer: There is an x-intercept at 0, so one equation that corresponds to this graph is y = a sin (bx + c) + d. Half of the distance from the maximum to the
minimum value of the function is 8 ÷ 2 or 4. So, the amplitude is 4. It appears that the function completes one period on [0, 4π]. Find b.
The midline appears to be at y = −2, so there is a vertical shift of 2 units down. Therefore, one equation that corresponds to this graph is y = 4 sin
− 2.
Write a sinusoidal function with the given period and amplitude that passes through the given point.
35. period: ; amplitude: 5; point:
SOLUTION: Use the period to find b.
Sample answer: One sinusoidal function in which a =5 and b = 2 is y = 5 cos 2x. Evaluate the function for
The function passes through . Therefore, a
sinusoidal function with period π and amplitude 5 that
passes through the point is y = 5 cos 2x.
36. period: 4 ; amplitude: 2; point: ( , 2)
SOLUTION: Use the period to find b.
Sample answer: One sinusoidal function in which a =
2 and b = is y = 2 sin . Evaluate the function
for x = π.
The function passes through ( , 2). Therefore, a
sinusoidal function with period 4π and amplitude 2
that passes through the point ( , 2) is y = 2 sin .
37. period: ; amplitude: ; point:
SOLUTION: Use the period to find b.
Sample answer: One sinusoidal function in which a =1.5 and b = 4 is y = 1.5 cos 4x. Evaluate the function
for
The function passes through . Therefore, a
sinusoidal function with period and amplitude 1.5
that passes through the point is y = 1.5 cos
4x.
38. period: 3π; amplitude: ; point:
SOLUTION: Use the period to find b.
Sample answer: One sinusoidal function in which a =
0.5 and b = is y = sin x. Evaluate the
function for
The function passes through . Therefore, a
sinusoidal function with period 3π and amplitude 0.5
that passes through the point is y = sin
x.
39. MULTIPLE REPRESENTATIONS In this problem, you will investigate the change in the graph of a sinusoidal function of the form y = sin x or y = cos x when multiplied by a polynomial function. a. GRAPHICAL Use a graphing calculator to sketch the graphs of y = 2x, y = –2x, and y = 2x cos x on the same coordinate plane, on the interval [–20, 20]. b. VERBAL Describe the behavior of the graph of y = 2x cos x in relation to the graphs of y = 2x and y = –2x. c. GRAPHICAL Use a graphing calculator to
sketch the graphs of y = x2, y = –x
2, and y = x
2 sin x
on the same coordinate plane, on the interval [–20, 20]. d. VERBAL Describe the behavior of the graph of
y = x2 sin x in relation to the graphs of y = x
2 and y
= –x2.
e. ANALYTICAL Make a conjecture as to the behavior of the graph of a sinusoidal function of the form y = sin x or y = cos x when multiplied by polynomial function of the form y = f (x).
SOLUTION: a.
b. The graph of y = 2x cos x oscillates between the graphs of y = 2x and y = –2x. c.
d. The graph of y = x2 sin x oscillates between the
graphs of y = x2 and y = –x
2.
e . The graph of y = f (x) sin x or y = f (x) cos x will oscillate between the graphs of y = f (x) and y = –f(x).
40. CHALLENGE Without graphing, find the exact coordinates of the first maximum point to the right of
the y-axis for
SOLUTION:
First, find the phase shift for
Next, find the period of the function.
The first maximum for one period can be found by
finding So, incorporating the phase shift, the
first maximum to the right of the y-axis is
. Because the amplitude is |4| = 4,
the maximum point is
REASONING Determine whether each statement is true or false . Explain your reasoning.
41. Every sine function of the form y = a sin (bx + c) + d can be written as a cosine function of the form y =a cos (bx + c) + d.
SOLUTION: It is true that every sine function of the form y = a sin (bx + c) + d can be written as a cosine function of the form y = a cos (bx + c) + d. The graph of cosine is a horizontal translation of the sine graph. Therefore, a cosine function can be written from any sine function using the same amplitude and period by applying the necessary phase shift.
For example, consider and
. Phase shift by
to obtain .
42. The period of f (x) = cos 8x is equal to four times the period of g(x) = cos 2x.
SOLUTION: Find the period of f (x) = cos 8x.
Find the period of g(x) = cos 2x.
Four times the period of g(x) = cos 2x is 4 ⋅ or
4 . So, the period of f (x) is the period of g(x).
Therefore, the statement is false.
43. CHALLENGE How many zeros does y = cos
1500x have on the interval 0 ≤ x ≤ 2 ?
SOLUTION: Find the period of y = cos 1500x.
Graph y = cos 1500x on .
The graph of y = cos 1500x has two x-intercepts for one cycle, so the function has 2 zeros per cycle. Find
the number of cycles for y = cos 1500x on [0, 2 ].
So, the graph of y = cos 1500x will complete 1500
cycles on [0, 2 ]. Because there are two zeros per cycle, y = cos 1500x will have 1500(2) or 3000 zeros
on [0, 2 ].
44. PROOF Prove the phase shift formula.
SOLUTION:
Consider y = a sin (bx + c), where a , b, and c ≠ 0. To find a zero of the function, find the value of x for which a sin (bx + c) = 0. Since sin 0 = 0, solving bx + c = 0 will yield a zero of the function.
Therefore, y = 0 when . The value of is
the phase shift. When c > 0: The graph of y = a sin (bx + c) is the
graph of y = a sin x, shifted units to the left.
When c < 0: The graph of y = a sin (bx + c) is the
graph of y = a sin x, shifted units to the right.
Consider the graph of y = cos x below in blue. In this equation a = 1, b = 1 and c = 0. One zero of y = cos x is . The green graph is shifted to the
left. Thus c is – . Then the shifted equation will be
.
45. Writing in Math The Power Tower ride in Sandusky, Ohio, is shown below. Along the side of each tower is a string of lights that send a continuouspulse of light up and down each tower at a constant rate. Explain why the distance d of this light from theground over time t cannot be represented by a sinusoidal function.
SOLUTION: Sample answer: Although the pulse of light can be represented as a function with a period, it is not a sinusoidal function because the distance the pulse of light is from the ground changes at a constant rate. As a result, the graph of this function would resemble the graph below.
The given point lies on the terminal side of an angle θ in standard position. Find the values of
the six trigonometric functions of θ. 46. (−4, 4)
SOLUTION: Use the values of x and y to find r.
Use x = –4, y = 4, and r = to write the six trigonometric ratios.
47. (8, −2)
SOLUTION: Use the values of x and y to find r.
Use x = 8, y = –2, and r = to write the six trigonometric ratios.
48. (−5, −9)
SOLUTION: Use the values of x and y to find r.
Use x = –5, y = – 9, and r = to write the six trigonometric ratios.
49. (4, 5)
SOLUTION: Use the values of x and y to find r.
Use x = 4, y = 5, and r = to write the six trigonometric ratios.
Write each degree measure in radians as a multiple of π and each radian measure in degrees.
50. 25°
SOLUTION: To convert a degree measure to radians, multiply by
51. −420°
SOLUTION: To convert a degree measure to radians, multiply by
52.
SOLUTION: To convert a radian measure to degrees, multiply by
53.
SOLUTION: To convert a radian measure to degrees, multiply by
54. SCIENCE Radiocarbon dating is a method of estimating the age of an organic material by calculating the amount of carbon-14 present in the material. The age of a material can be calculated
using A = t , where A is the age of the
object in years, t is the half-life of carbon-14 or 5700 years, and R is the ratio of the amount of carbon-14 in the sample to the amount of carbon-14 in living tissue. a. A sample of organic material contains 0.000076 gram of carbon-14. A living sample of the same
Describe how the graphs of f (x) and g (x) are related. Then find the amplitude of g (x), and sketch two periods of both functions on the same coordinate axes.
1. f (x) = sin x; g(x) = sin x
SOLUTION: The graph of g(x) is the graph of f (x) compressed
vertically. The amplitude of g(x) is or .
Create a table listing the coordinates of the x-intercepts and extrema for f (x) = sin x for one
period, 2 , on the interval [0, 2 ]. Then use the amplitude of g(x) to find corresponding points on its graph.
Sketch the curve through the indicated points for each function. Then repeat the pattern to complete asecond period.
Functions f (x) = sin x g(x) = sin x
x-int (0, 0) (0, 0)
Max
x-int
Min
x-int
2.
SOLUTION: The graph of g(x) is the graph of f (x) compressed
vertically. The amplitude of g(x) is or .
Create a table listing the coordinates of the x-intercepts and extrema for f (x) = cos x for one
period, 2 , on the interval [0, 2 ]. Then use the amplitude of g(x) to find corresponding points on its graph.
Sketch the curve through the indicated points for each function. Then repeat the pattern to complete asecond period.
Function f (x) = cos x
Max (0, 1)
x-int Min
x-in
Min
x-int
Function f (x) = cos x
Max x-int
Min
x-in
Min
x-int
3. f (x) = cos x; g(x) = 6 cos x
SOLUTION: The graph of g(x) is the graph of f (x) expanded
vertically. The amplitude of g(x) is or 6.
Create a table listing the coordinates of the x-intercepts and extrema for f (x) = cos x for one
period, 2 , on the interval [0, 2 ]. Then use the amplitude of g(x) to find corresponding points on its graph.
Sketch the curve through the indicated points for each function. Then repeat the pattern to complete asecond period.
Functions f (x) = cos x g(x) = 6 cos x
Max (0, 1) (0, 6)
x-int
Min
x-int
Max
4. f (x) = sin x; g(x) = −8 sin x
SOLUTION: The graph of g(x) is the graph of f (x) expanded
vertically. The amplitude of g(x) is or 8.
Create a table listing the coordinates of the x-intercepts and extrema for f (x) = sin x for one
period, 2 , on the interval [0, 2 ]. Then use the amplitude of g(x) to find corresponding points on its graph.
Sketch the curve through the indicated points for each function. Then repeat the pattern to complete asecond period.
Function f (x) = sin x
x-int (0, 0)
Max
x-int
Min
x-int
Function g(x) = −8
sin x
x-int (0, 0)
Min
x-int
Max
x-int
Describe how the graphs of f (x) and g (x) are related. Then find the period of g (x), and sketch at least one period of both functions on the same coordinate axes.
5. f (x) = sin x; g(x) = sin 4x
SOLUTION: The graph of g(x) is the graph of f (x) compressed
horizontally. The period of g(x) is . To find
corresponding points on the graph of g(x), change the x-coordinates of those key points on f (x) so that
they range from 0 to , increasing by increments of
.
Sketch the curve through the indicated points for each function. Then repeat the pattern to complete asecond period.
Functions f (x) = sin x g(x) = sin
4x
x-int (0, 0) (0, 0)
Max
x-int
Min
x-int
6. f (x) = cos x; g(x) = cos 2x
SOLUTION: The graph of g(x) is the graph of f (x) compressed
horizontally. The period of g(x) is or . To find
corresponding points on the graph of g(x), change the x-coordinates of those key points on f (x) so that
they range from 0 to , increasing by increments of
.
Sketch the curve through the indicated points for each function. Then repeat the pattern to complete asecond period.
Functions f (x) = cos x g(x) = cos 2x
Max (0, 1) (0, 1)
x-int
Min
x-int
Max
7. f (x) = cos x;
SOLUTION: The graph of g(x) is the graph of f (x) expanded
horizontally. The period of g(x) is . To
find corresponding points on the graph of g(x), change the x-coordinates of those key points on f (x)
so that they range from 0 to , increasing by
increments of or .
Sketch the curve through the indicated points for each function. Then repeat the pattern to complete asecond period.
Functions f (x) = cos x
Max (0, 1) (0, 1)
x-int
Min
x-int
Max
8. f (x) = sin x;
SOLUTION: The graph of g(x) is the graph of f (x) expanded
horizontally. The period of g(x) is . To find corresponding points on the graph of g(x), change the x-coordinates of those key points on f (x) so that they range from 0 to , increasing by increments of
or .
Sketch the curve through the indicated points for each function. Then repeat the pattern to complete asecond period.
Functions f (x) = sin x
x-int (0, 0) (0, 0)
Max
x-int
Min
x-int
9. VOICES The contralto vocal type includes the deepest female singing voice. Some contraltos can sing as low as the E below middle C (E3), which hasa frequency of 165 hertz. Write an equation for a sine function that models the initial behavior of the sound wave associated with E3 having an amplitude of 0.15.
SOLUTION: The general form of the equation will be y = a sin bt,where t is the time in seconds. Because the
amplitude is 0.15, |a|= 0.15. This means that a = ±0.15. The period is the reciprocal of the frequency or
. Use this value to find b.
Sample answer: One sine function that models the
initial behavior is y = 0.15 sin 330 t.
Write a sine function that can be used to model the initial behavior of a sound wave with the frequency and amplitude given.
10. f = 440, a = 0.3
SOLUTION: The general form of the equation is y = a sin bt, where t is the time in seconds. Because the
amplitude is 0.3, = 0.3. This means that a = ±0.3.
The period is the reciprocal of the frequency or
. Use this value to find b.
Using the positive values of a and b, one sine function that models the initial behavior is y = 0.3 sin
880 t.
11. f = 932, a = 0.25
SOLUTION: The general form of the equation is y = a sin bt, where t is the time in seconds. Because the
amplitude is 0.25, = 0.25. This means that a =
±0.25. The period is the reciprocal of the frequency
or . Use this value to find b.
Using the positive values of a and b, one sine function that models the initial behavior is y = 0.25
sin 1864 t.
12. f = 1245, a = 0.12
SOLUTION: The general form of the equation is y = a sin bt, where t is the time in seconds. Because the
amplitude is 0.12, = 0.12. This means that a =
±0.12. The period is the reciprocal of the frequency or
. Use this value to find b.
Using the positive values of a and b, one sine function that models the initial behavior is y = 0.12
sin 2490 t.
13. f = 623, a = 0.2
SOLUTION: The general form of the equation is y = a sin bt, where t is the time in seconds. Because the
amplitude is 0.2, = 0.2. This means that a = ±0.2.
The period is the reciprocal of the frequency or
. Use this value to find b.
Using the positive values of a and b, one sine function that models the initial behavior is y = 0.2 sin
1246 t.
State the amplitude, period, frequency, phase shift, and vertical shift of each function. Then graph two periods of the function.
14.
SOLUTION:
In this function, a = 3, b = 1, c = − , and d = 0.
Because d = 0, there is no vertical shift.
Graph y = 3 sin x shifted units to the right.
15.
SOLUTION:
In this function, a = 1, b = , c = , and d = 0.
Because d = 0, there is no vertical shift.
16. y = 0.25 cos x + 3
SOLUTION:
In this function, a = , b = 1, c = 0, and d = 3.
Graph y = cos x shifted 3 units up.
17. y = sin 3x – 2
SOLUTION: In this function, a = 1, b = 3, c = 0, and d = –2.
Graph y = sin 3x shifted 2 units down.
18.
SOLUTION:
In this function, a = 1, b = 1, c = , and d = –1.
.
Graph y = cos x shifted units to the right and 1
unit down.
19.
SOLUTION:
In this function, a = 1, b = 1, c = , and d = 4.
.
Graph y = sin x shifted units to the left and 4 units up.
20. VACATIONS The average number of reservations R that a vacation resort has at the beginning of each month is shown.
a. Write an equation of a sinusoidal function that models the average number of reservations using x =1 to represent January. b. According to your model, approximately how many reservations can the resort anticipate in November?
SOLUTION: a. Make a scatter plot of the data and choose a model.
Sample answer: Use a sinusoidal function of the form y = a cos (bx + c) + d to model the data. First, find the maximum M and minimum m values of the data, and use these values to find a, b, c, and d. The maximum and minimum reservations are 200 and 87, respectively. The amplitude a is half of the distance between these values.
The vertical shift d is the average of the maximum and minimum data values.
There are 3 months between the maximum and minimum, so the period is 6.
The maximum data value occurs when x = 1. Since y = cos x attains its first maximum when x = 0, we must apply a phase shift of 1 unit. Use this value to find c.
Write a function using the values for a, b, c, and d.
Use b =
b. To find the number of reservations in November, evaluate the model for x = 11.
Therefore, the resort can anticipate about 115 reservations in November.
21. TIDES The table shown below provides data for the first high and low tides of the day for a certain bay during one day in June.
a. Determine the amplitude, period, phase shift, and vertical shift of a sinusoidal function that models the height of the tide. Let x represent the number of hours that the high or low tide occurred after midnight. b. Write a sinusoidal function that models the data. c. According to your model, what was the height of
the tide at 8:45 P.M. that night?
SOLUTION: a. Sample answer: Use a sinusoidal function of the form y = a cos (bx + c) + d to model the data. First, find the amplitude a, which is half of the distance between the heights of the high and low tides.
The vertical shift d is the average of the heights of the high and low tides.
A sinusoid completes half of a period in the time thatit takes to go from its maximum to its minimum value. One period is twice this time. The first high tide occurs 6.5 hours before the first low tide, so the period is 13.
The maximum data value occurs when x ≈ 4.417. Since y = cos x attains its first maximum when x = 0,we must apply a phase shift of 4.417 units. Use this value to find c.
b. Write a function using the values for a, b, c, and
d. Use b =
c. To find the height of the water at 8:45 P.M. that
night, evaluate the model for x = 20.75.
Therefore, the tide was about 7.28 feet high at 8:45
P.M. that night.
22. METEOROLOGY The average monthly temperatures for Boston, Massachusetts are shown.
a. Determine the amplitude, period, phase shift, and vertical shift of a sinusoidal function that models the monthly temperatures using x = 1 to represent January. b. Write an equation of a sinusoidal function that models the monthly temperatures. c. According to your model, what is Boston’s average temperature in August?
SOLUTION: a. The maximum and minimum are 74° and 29°, respectively. The amplitude a is half of the distance between these values.
The vertical shift d is the average of the maximum and minimum data values.
A sinusoid completes half of a period in the time thatit takes to go from its maximum to its minimum value. So, one period is twice this time. The
maximum function value occurs in July, so xmax is 7.
The minimum function value occurs in January, so
xmin is 1. The period is 2(6) = 12.
The maximum data value occurs when x = 7. Since y = cos x attains its first maximum when x = 0, we must apply a phase shift of 7 units. Use this value to find c.
b. Using the values for a, b, c, and d from part a, a sinusoidal function that models that monthly temperatures in Boston is
c. To find the average monthly temperature for Boston in August, evaluate the model for x = 8.
Therefore, the average monthly temperature for Boston in August is about 71°F.
GRAPHING CALCULATOR Find the values of x in the interval – < x < that make each equation or inequality true. (Hint: Use the intersection function.)
23. –sin x = cos x
SOLUTION:
Graph y = −sin x and y = cos x on the same graphing
calculator screen on (−π, π). Use the intersect feature under the CALC menu to determine where the two graphs intersect.
The graphs intersect at about −0.7854 or − and
about 2.356 or . Therefore, on –π < x < π, –sin x
= cos x when x = − and .
24. sin x − cos x = 1
SOLUTION:
Graph y = sin x − cos x and y = 1 on the same
graphing calculator screen on (− , ). Use the intersect feature under the CALC menu to determine where the two graphs intersect.
The graphs intersect at about 1.57 or . Therefore,
on – < x < , sin x − cos x = 1 when x = .
25. sin x + cos x = 0
SOLUTION:
Graph y = sin x + cos x on (−π, π). Use the zero feature under the CALC menu to determine the zeros of the function.
There are zeros at about −0.785 or − or and about
2.356 or . Therefore, on – < x < , sin x + cos
x = 0 when
26. cos x ≤ sin x
SOLUTION:
Graph y = cos x and y = sin x on (−π, π). Use the intersect feature under the CALC menu to determine on what interval(s) cos x ≤ sin x.
The graphs intersect at about –2.356 or – and
about 0.785 or . From the graph, it appears that
cos x ≤ sin x on – < x < – and < x < .
27. sin x cos x > 1
SOLUTION:
Graph y = sin x cos x and y = 1 on (− , ). Use the intersect feature under the CALC menu to determine on what interval(s) sin x cos x > 1.
The graphs do not intersect. Therefore, y = sin x cos
x is not greater than y = 1 for any values of x on –< x < .
28. sin x cos x ≤ 0
SOLUTION:
Graph y = sin x cos x on (−π, π). Use the zero feature under the CALC menu to determine on what interval(s) sin x cos x ≤ 0.
The zeros of y = sin x cos x are about –1.57 or ,
0, and about 1.57 or . From the graph, it appears
that sin x cos x ≤ 0 on < x < 0 and < x < .
29. CAROUSELS A wooden horse on a carousel moves up and down as the carousel spins. When the ride ends, the horse usually stops in a vertical position different from where it started. The position y of the horse after t seconds can be modeled by y =1.5 sin (2t + c), where the phase shift c must be continuously adjusted to compensate for the differentstarting positions. If during one ride the horse
reached a maximum height after seconds, find
the equation that models the horse’s position.
SOLUTION: First, find the period of y = 1.5 sin (2t + c).
Since the period is π, the function will reach a
maximum height at radians. The phase shift is the
difference between the horizontal position of the
function at and radians, which is radians.
Substitute and b into the phase shift formula to
find c.
Therefore, the equation is
30. AMUSEMENT PARKS The position y in feet of a passenger cart relative to the center of a Ferris wheel over t seconds is shown below.
a. Find the time t that it takes for the cart to return toy = 0 during its initial spin. b. Find the period of the Ferris wheel. c. Sketch the graph representing the position of the passenger cart over one period. d. Write a sinusoidal function that models the position of the passenger cart as a function of time t.
SOLUTION: a. From the diagram, the height of the cart is 0 ft when t = 0, and reaches a maximum height of 19 feet when t = 3.75 seconds. So, the cart will return to y = 0 after 2(3.75) or 7.5 seconds. b. The cart completes half of a cycle from t = 0 to t = 7.5. So, the period is 2(7.5) or 15 seconds. c.
d. The amplitude a is half of the maximum and
minimum values. So, a =
The vertical shift d is the average of the maximum
and minimum data values. So,
Because the period of a sinusoidal function is
you can write Therefore,
There is no phase shift because the height of the cartwhen t = 0 is 0 feet, and the sine function has a y-intercept of 0. Therefore, one equation that could be used to model
the position of the passenger cart is y = 19 sin t.
Write an equation that corresponds to each graph.
31.
SOLUTION: Sample answer: There is an x-intercept at 0, so one equation that corresponds to this graph is y = a sin (bx + c) + d. Half of the distance from the maximum to the minimum value of the function is 3. So, the amplitudeis 3. It appears that the function completes one period on
[0, π]. Find b.
The midline appears to be at y = 0, so there does not appear to be any vertical shift. Therefore, one equation that corresponds to this graph is y = 3 sin (2x).
32.
SOLUTION:
Sample answer: Because there is a y-intercept at ,
one equation that corresponds to this graph is y = a cos (bx + c) + d. Half of the distance from the maximum to the
minimum value of the function is . So, the
amplitude is .
It appears that the function completes one period on [0, 6π]. Find b.
The midline appears to be at y = 0, so there does not appear to be any vertical shift. Therefore, one
equation that corresponds to this graph is y = cos
.
33.
SOLUTION: Sample answer: Because there is a y-intercept at 3, one equation that corresponds to this graph is y = a cos (bx + c) + d. Half of the distance from the maximum to the
minimum value of the function is 4 ÷ 2 or 2. So, the amplitude is 2. It appears that the function completes one period on
Find b.
The midline appears to be at y = 1, so there is a vertical shift 1 unit up. Therefore, one equation that corresponds to this graph is y = 2 cos 4x + 1.
34.
SOLUTION: Sample answer: There is an x-intercept at 0, so one equation that corresponds to this graph is y = a sin (bx + c) + d. Half of the distance from the maximum to the
minimum value of the function is 8 ÷ 2 or 4. So, the amplitude is 4. It appears that the function completes one period on [0, 4π]. Find b.
The midline appears to be at y = −2, so there is a vertical shift of 2 units down. Therefore, one equation that corresponds to this graph is y = 4 sin
− 2.
Write a sinusoidal function with the given period and amplitude that passes through the given point.
35. period: ; amplitude: 5; point:
SOLUTION: Use the period to find b.
Sample answer: One sinusoidal function in which a =5 and b = 2 is y = 5 cos 2x. Evaluate the function for
The function passes through . Therefore, a
sinusoidal function with period π and amplitude 5 that
passes through the point is y = 5 cos 2x.
36. period: 4 ; amplitude: 2; point: ( , 2)
SOLUTION: Use the period to find b.
Sample answer: One sinusoidal function in which a =
2 and b = is y = 2 sin . Evaluate the function
for x = π.
The function passes through ( , 2). Therefore, a
sinusoidal function with period 4π and amplitude 2
that passes through the point ( , 2) is y = 2 sin .
37. period: ; amplitude: ; point:
SOLUTION: Use the period to find b.
Sample answer: One sinusoidal function in which a =1.5 and b = 4 is y = 1.5 cos 4x. Evaluate the function
for
The function passes through . Therefore, a
sinusoidal function with period and amplitude 1.5
that passes through the point is y = 1.5 cos
4x.
38. period: 3π; amplitude: ; point:
SOLUTION: Use the period to find b.
Sample answer: One sinusoidal function in which a =
0.5 and b = is y = sin x. Evaluate the
function for
The function passes through . Therefore, a
sinusoidal function with period 3π and amplitude 0.5
that passes through the point is y = sin
x.
39. MULTIPLE REPRESENTATIONS In this problem, you will investigate the change in the graph of a sinusoidal function of the form y = sin x or y = cos x when multiplied by a polynomial function. a. GRAPHICAL Use a graphing calculator to sketch the graphs of y = 2x, y = –2x, and y = 2x cos x on the same coordinate plane, on the interval [–20, 20]. b. VERBAL Describe the behavior of the graph of y = 2x cos x in relation to the graphs of y = 2x and y = –2x. c. GRAPHICAL Use a graphing calculator to
sketch the graphs of y = x2, y = –x
2, and y = x
2 sin x
on the same coordinate plane, on the interval [–20, 20]. d. VERBAL Describe the behavior of the graph of
y = x2 sin x in relation to the graphs of y = x
2 and y
= –x2.
e. ANALYTICAL Make a conjecture as to the behavior of the graph of a sinusoidal function of the form y = sin x or y = cos x when multiplied by polynomial function of the form y = f (x).
SOLUTION: a.
b. The graph of y = 2x cos x oscillates between the graphs of y = 2x and y = –2x. c.
d. The graph of y = x2 sin x oscillates between the
graphs of y = x2 and y = –x
2.
e . The graph of y = f (x) sin x or y = f (x) cos x will oscillate between the graphs of y = f (x) and y = –f(x).
40. CHALLENGE Without graphing, find the exact coordinates of the first maximum point to the right of
the y-axis for
SOLUTION:
First, find the phase shift for
Next, find the period of the function.
The first maximum for one period can be found by
finding So, incorporating the phase shift, the
first maximum to the right of the y-axis is
. Because the amplitude is |4| = 4,
the maximum point is
REASONING Determine whether each statement is true or false . Explain your reasoning.
41. Every sine function of the form y = a sin (bx + c) + d can be written as a cosine function of the form y =a cos (bx + c) + d.
SOLUTION: It is true that every sine function of the form y = a sin (bx + c) + d can be written as a cosine function of the form y = a cos (bx + c) + d. The graph of cosine is a horizontal translation of the sine graph. Therefore, a cosine function can be written from any sine function using the same amplitude and period by applying the necessary phase shift.
For example, consider and
. Phase shift by
to obtain .
42. The period of f (x) = cos 8x is equal to four times the period of g(x) = cos 2x.
SOLUTION: Find the period of f (x) = cos 8x.
Find the period of g(x) = cos 2x.
Four times the period of g(x) = cos 2x is 4 ⋅ or
4 . So, the period of f (x) is the period of g(x).
Therefore, the statement is false.
43. CHALLENGE How many zeros does y = cos
1500x have on the interval 0 ≤ x ≤ 2 ?
SOLUTION: Find the period of y = cos 1500x.
Graph y = cos 1500x on .
The graph of y = cos 1500x has two x-intercepts for one cycle, so the function has 2 zeros per cycle. Find
the number of cycles for y = cos 1500x on [0, 2 ].
So, the graph of y = cos 1500x will complete 1500
cycles on [0, 2 ]. Because there are two zeros per cycle, y = cos 1500x will have 1500(2) or 3000 zeros
on [0, 2 ].
44. PROOF Prove the phase shift formula.
SOLUTION:
Consider y = a sin (bx + c), where a , b, and c ≠ 0. To find a zero of the function, find the value of x for which a sin (bx + c) = 0. Since sin 0 = 0, solving bx + c = 0 will yield a zero of the function.
Therefore, y = 0 when . The value of is
the phase shift. When c > 0: The graph of y = a sin (bx + c) is the
graph of y = a sin x, shifted units to the left.
When c < 0: The graph of y = a sin (bx + c) is the
graph of y = a sin x, shifted units to the right.
Consider the graph of y = cos x below in blue. In this equation a = 1, b = 1 and c = 0. One zero of y = cos x is . The green graph is shifted to the
left. Thus c is – . Then the shifted equation will be
.
45. Writing in Math The Power Tower ride in Sandusky, Ohio, is shown below. Along the side of each tower is a string of lights that send a continuouspulse of light up and down each tower at a constant rate. Explain why the distance d of this light from theground over time t cannot be represented by a sinusoidal function.
SOLUTION: Sample answer: Although the pulse of light can be represented as a function with a period, it is not a sinusoidal function because the distance the pulse of light is from the ground changes at a constant rate. As a result, the graph of this function would resemble the graph below.
The given point lies on the terminal side of an angle θ in standard position. Find the values of
the six trigonometric functions of θ. 46. (−4, 4)
SOLUTION: Use the values of x and y to find r.
Use x = –4, y = 4, and r = to write the six trigonometric ratios.
47. (8, −2)
SOLUTION: Use the values of x and y to find r.
Use x = 8, y = –2, and r = to write the six trigonometric ratios.
48. (−5, −9)
SOLUTION: Use the values of x and y to find r.
Use x = –5, y = – 9, and r = to write the six trigonometric ratios.
49. (4, 5)
SOLUTION: Use the values of x and y to find r.
Use x = 4, y = 5, and r = to write the six trigonometric ratios.
Write each degree measure in radians as a multiple of π and each radian measure in degrees.
50. 25°
SOLUTION: To convert a degree measure to radians, multiply by
51. −420°
SOLUTION: To convert a degree measure to radians, multiply by
52.
SOLUTION: To convert a radian measure to degrees, multiply by
53.
SOLUTION: To convert a radian measure to degrees, multiply by
54. SCIENCE Radiocarbon dating is a method of estimating the age of an organic material by calculating the amount of carbon-14 present in the material. The age of a material can be calculated
using A = t , where A is the age of the
object in years, t is the half-life of carbon-14 or 5700 years, and R is the ratio of the amount of carbon-14 in the sample to the amount of carbon-14 in living tissue. a. A sample of organic material contains 0.000076 gram of carbon-14. A living sample of the same
eSolutions Manual - Powered by Cognero Page 22
4-4 Graphing Sine and Cosine Functions
Describe how the graphs of f (x) and g (x) are related. Then find the amplitude of g (x), and sketch two periods of both functions on the same coordinate axes.
1. f (x) = sin x; g(x) = sin x
SOLUTION: The graph of g(x) is the graph of f (x) compressed
vertically. The amplitude of g(x) is or .
Create a table listing the coordinates of the x-intercepts and extrema for f (x) = sin x for one
period, 2 , on the interval [0, 2 ]. Then use the amplitude of g(x) to find corresponding points on its graph.
Sketch the curve through the indicated points for each function. Then repeat the pattern to complete asecond period.
Functions f (x) = sin x g(x) = sin x
x-int (0, 0) (0, 0)
Max
x-int
Min
x-int
2.
SOLUTION: The graph of g(x) is the graph of f (x) compressed
vertically. The amplitude of g(x) is or .
Create a table listing the coordinates of the x-intercepts and extrema for f (x) = cos x for one
period, 2 , on the interval [0, 2 ]. Then use the amplitude of g(x) to find corresponding points on its graph.
Sketch the curve through the indicated points for each function. Then repeat the pattern to complete asecond period.
Function f (x) = cos x
Max (0, 1)
x-int Min
x-in
Min
x-int
Function f (x) = cos x
Max x-int
Min
x-in
Min
x-int
3. f (x) = cos x; g(x) = 6 cos x
SOLUTION: The graph of g(x) is the graph of f (x) expanded
vertically. The amplitude of g(x) is or 6.
Create a table listing the coordinates of the x-intercepts and extrema for f (x) = cos x for one
period, 2 , on the interval [0, 2 ]. Then use the amplitude of g(x) to find corresponding points on its graph.
Sketch the curve through the indicated points for each function. Then repeat the pattern to complete asecond period.
Functions f (x) = cos x g(x) = 6 cos x
Max (0, 1) (0, 6)
x-int
Min
x-int
Max
4. f (x) = sin x; g(x) = −8 sin x
SOLUTION: The graph of g(x) is the graph of f (x) expanded
vertically. The amplitude of g(x) is or 8.
Create a table listing the coordinates of the x-intercepts and extrema for f (x) = sin x for one
period, 2 , on the interval [0, 2 ]. Then use the amplitude of g(x) to find corresponding points on its graph.
Sketch the curve through the indicated points for each function. Then repeat the pattern to complete asecond period.
Function f (x) = sin x
x-int (0, 0)
Max
x-int
Min
x-int
Function g(x) = −8
sin x
x-int (0, 0)
Min
x-int
Max
x-int
Describe how the graphs of f (x) and g (x) are related. Then find the period of g (x), and sketch at least one period of both functions on the same coordinate axes.
5. f (x) = sin x; g(x) = sin 4x
SOLUTION: The graph of g(x) is the graph of f (x) compressed
horizontally. The period of g(x) is . To find
corresponding points on the graph of g(x), change the x-coordinates of those key points on f (x) so that
they range from 0 to , increasing by increments of
.
Sketch the curve through the indicated points for each function. Then repeat the pattern to complete asecond period.
Functions f (x) = sin x g(x) = sin
4x
x-int (0, 0) (0, 0)
Max
x-int
Min
x-int
6. f (x) = cos x; g(x) = cos 2x
SOLUTION: The graph of g(x) is the graph of f (x) compressed
horizontally. The period of g(x) is or . To find
corresponding points on the graph of g(x), change the x-coordinates of those key points on f (x) so that
they range from 0 to , increasing by increments of
.
Sketch the curve through the indicated points for each function. Then repeat the pattern to complete asecond period.
Functions f (x) = cos x g(x) = cos 2x
Max (0, 1) (0, 1)
x-int
Min
x-int
Max
7. f (x) = cos x;
SOLUTION: The graph of g(x) is the graph of f (x) expanded
horizontally. The period of g(x) is . To
find corresponding points on the graph of g(x), change the x-coordinates of those key points on f (x)
so that they range from 0 to , increasing by
increments of or .
Sketch the curve through the indicated points for each function. Then repeat the pattern to complete asecond period.
Functions f (x) = cos x
Max (0, 1) (0, 1)
x-int
Min
x-int
Max
8. f (x) = sin x;
SOLUTION: The graph of g(x) is the graph of f (x) expanded
horizontally. The period of g(x) is . To find corresponding points on the graph of g(x), change the x-coordinates of those key points on f (x) so that they range from 0 to , increasing by increments of
or .
Sketch the curve through the indicated points for each function. Then repeat the pattern to complete asecond period.
Functions f (x) = sin x
x-int (0, 0) (0, 0)
Max
x-int
Min
x-int
9. VOICES The contralto vocal type includes the deepest female singing voice. Some contraltos can sing as low as the E below middle C (E3), which hasa frequency of 165 hertz. Write an equation for a sine function that models the initial behavior of the sound wave associated with E3 having an amplitude of 0.15.
SOLUTION: The general form of the equation will be y = a sin bt,where t is the time in seconds. Because the
amplitude is 0.15, |a|= 0.15. This means that a = ±0.15. The period is the reciprocal of the frequency or
. Use this value to find b.
Sample answer: One sine function that models the
initial behavior is y = 0.15 sin 330 t.
Write a sine function that can be used to model the initial behavior of a sound wave with the frequency and amplitude given.
10. f = 440, a = 0.3
SOLUTION: The general form of the equation is y = a sin bt, where t is the time in seconds. Because the
amplitude is 0.3, = 0.3. This means that a = ±0.3.
The period is the reciprocal of the frequency or
. Use this value to find b.
Using the positive values of a and b, one sine function that models the initial behavior is y = 0.3 sin
880 t.
11. f = 932, a = 0.25
SOLUTION: The general form of the equation is y = a sin bt, where t is the time in seconds. Because the
amplitude is 0.25, = 0.25. This means that a =
±0.25. The period is the reciprocal of the frequency
or . Use this value to find b.
Using the positive values of a and b, one sine function that models the initial behavior is y = 0.25
sin 1864 t.
12. f = 1245, a = 0.12
SOLUTION: The general form of the equation is y = a sin bt, where t is the time in seconds. Because the
amplitude is 0.12, = 0.12. This means that a =
±0.12. The period is the reciprocal of the frequency or
. Use this value to find b.
Using the positive values of a and b, one sine function that models the initial behavior is y = 0.12
sin 2490 t.
13. f = 623, a = 0.2
SOLUTION: The general form of the equation is y = a sin bt, where t is the time in seconds. Because the
amplitude is 0.2, = 0.2. This means that a = ±0.2.
The period is the reciprocal of the frequency or
. Use this value to find b.
Using the positive values of a and b, one sine function that models the initial behavior is y = 0.2 sin
1246 t.
State the amplitude, period, frequency, phase shift, and vertical shift of each function. Then graph two periods of the function.
14.
SOLUTION:
In this function, a = 3, b = 1, c = − , and d = 0.
Because d = 0, there is no vertical shift.
Graph y = 3 sin x shifted units to the right.
15.
SOLUTION:
In this function, a = 1, b = , c = , and d = 0.
Because d = 0, there is no vertical shift.
16. y = 0.25 cos x + 3
SOLUTION:
In this function, a = , b = 1, c = 0, and d = 3.
Graph y = cos x shifted 3 units up.
17. y = sin 3x – 2
SOLUTION: In this function, a = 1, b = 3, c = 0, and d = –2.
Graph y = sin 3x shifted 2 units down.
18.
SOLUTION:
In this function, a = 1, b = 1, c = , and d = –1.
.
Graph y = cos x shifted units to the right and 1
unit down.
19.
SOLUTION:
In this function, a = 1, b = 1, c = , and d = 4.
.
Graph y = sin x shifted units to the left and 4 units up.
20. VACATIONS The average number of reservations R that a vacation resort has at the beginning of each month is shown.
a. Write an equation of a sinusoidal function that models the average number of reservations using x =1 to represent January. b. According to your model, approximately how many reservations can the resort anticipate in November?
SOLUTION: a. Make a scatter plot of the data and choose a model.
Sample answer: Use a sinusoidal function of the form y = a cos (bx + c) + d to model the data. First, find the maximum M and minimum m values of the data, and use these values to find a, b, c, and d. The maximum and minimum reservations are 200 and 87, respectively. The amplitude a is half of the distance between these values.
The vertical shift d is the average of the maximum and minimum data values.
There are 3 months between the maximum and minimum, so the period is 6.
The maximum data value occurs when x = 1. Since y = cos x attains its first maximum when x = 0, we must apply a phase shift of 1 unit. Use this value to find c.
Write a function using the values for a, b, c, and d.
Use b =
b. To find the number of reservations in November, evaluate the model for x = 11.
Therefore, the resort can anticipate about 115 reservations in November.
21. TIDES The table shown below provides data for the first high and low tides of the day for a certain bay during one day in June.
a. Determine the amplitude, period, phase shift, and vertical shift of a sinusoidal function that models the height of the tide. Let x represent the number of hours that the high or low tide occurred after midnight. b. Write a sinusoidal function that models the data. c. According to your model, what was the height of
the tide at 8:45 P.M. that night?
SOLUTION: a. Sample answer: Use a sinusoidal function of the form y = a cos (bx + c) + d to model the data. First, find the amplitude a, which is half of the distance between the heights of the high and low tides.
The vertical shift d is the average of the heights of the high and low tides.
A sinusoid completes half of a period in the time thatit takes to go from its maximum to its minimum value. One period is twice this time. The first high tide occurs 6.5 hours before the first low tide, so the period is 13.
The maximum data value occurs when x ≈ 4.417. Since y = cos x attains its first maximum when x = 0,we must apply a phase shift of 4.417 units. Use this value to find c.
b. Write a function using the values for a, b, c, and
d. Use b =
c. To find the height of the water at 8:45 P.M. that
night, evaluate the model for x = 20.75.
Therefore, the tide was about 7.28 feet high at 8:45
P.M. that night.
22. METEOROLOGY The average monthly temperatures for Boston, Massachusetts are shown.
a. Determine the amplitude, period, phase shift, and vertical shift of a sinusoidal function that models the monthly temperatures using x = 1 to represent January. b. Write an equation of a sinusoidal function that models the monthly temperatures. c. According to your model, what is Boston’s average temperature in August?
SOLUTION: a. The maximum and minimum are 74° and 29°, respectively. The amplitude a is half of the distance between these values.
The vertical shift d is the average of the maximum and minimum data values.
A sinusoid completes half of a period in the time thatit takes to go from its maximum to its minimum value. So, one period is twice this time. The
maximum function value occurs in July, so xmax is 7.
The minimum function value occurs in January, so
xmin is 1. The period is 2(6) = 12.
The maximum data value occurs when x = 7. Since y = cos x attains its first maximum when x = 0, we must apply a phase shift of 7 units. Use this value to find c.
b. Using the values for a, b, c, and d from part a, a sinusoidal function that models that monthly temperatures in Boston is
c. To find the average monthly temperature for Boston in August, evaluate the model for x = 8.
Therefore, the average monthly temperature for Boston in August is about 71°F.
GRAPHING CALCULATOR Find the values of x in the interval – < x < that make each equation or inequality true. (Hint: Use the intersection function.)
23. –sin x = cos x
SOLUTION:
Graph y = −sin x and y = cos x on the same graphing
calculator screen on (−π, π). Use the intersect feature under the CALC menu to determine where the two graphs intersect.
The graphs intersect at about −0.7854 or − and
about 2.356 or . Therefore, on –π < x < π, –sin x
= cos x when x = − and .
24. sin x − cos x = 1
SOLUTION:
Graph y = sin x − cos x and y = 1 on the same
graphing calculator screen on (− , ). Use the intersect feature under the CALC menu to determine where the two graphs intersect.
The graphs intersect at about 1.57 or . Therefore,
on – < x < , sin x − cos x = 1 when x = .
25. sin x + cos x = 0
SOLUTION:
Graph y = sin x + cos x on (−π, π). Use the zero feature under the CALC menu to determine the zeros of the function.
There are zeros at about −0.785 or − or and about
2.356 or . Therefore, on – < x < , sin x + cos
x = 0 when
26. cos x ≤ sin x
SOLUTION:
Graph y = cos x and y = sin x on (−π, π). Use the intersect feature under the CALC menu to determine on what interval(s) cos x ≤ sin x.
The graphs intersect at about –2.356 or – and
about 0.785 or . From the graph, it appears that
cos x ≤ sin x on – < x < – and < x < .
27. sin x cos x > 1
SOLUTION:
Graph y = sin x cos x and y = 1 on (− , ). Use the intersect feature under the CALC menu to determine on what interval(s) sin x cos x > 1.
The graphs do not intersect. Therefore, y = sin x cos
x is not greater than y = 1 for any values of x on –< x < .
28. sin x cos x ≤ 0
SOLUTION:
Graph y = sin x cos x on (−π, π). Use the zero feature under the CALC menu to determine on what interval(s) sin x cos x ≤ 0.
The zeros of y = sin x cos x are about –1.57 or ,
0, and about 1.57 or . From the graph, it appears
that sin x cos x ≤ 0 on < x < 0 and < x < .
29. CAROUSELS A wooden horse on a carousel moves up and down as the carousel spins. When the ride ends, the horse usually stops in a vertical position different from where it started. The position y of the horse after t seconds can be modeled by y =1.5 sin (2t + c), where the phase shift c must be continuously adjusted to compensate for the differentstarting positions. If during one ride the horse
reached a maximum height after seconds, find
the equation that models the horse’s position.
SOLUTION: First, find the period of y = 1.5 sin (2t + c).
Since the period is π, the function will reach a
maximum height at radians. The phase shift is the
difference between the horizontal position of the
function at and radians, which is radians.
Substitute and b into the phase shift formula to
find c.
Therefore, the equation is
30. AMUSEMENT PARKS The position y in feet of a passenger cart relative to the center of a Ferris wheel over t seconds is shown below.
a. Find the time t that it takes for the cart to return toy = 0 during its initial spin. b. Find the period of the Ferris wheel. c. Sketch the graph representing the position of the passenger cart over one period. d. Write a sinusoidal function that models the position of the passenger cart as a function of time t.
SOLUTION: a. From the diagram, the height of the cart is 0 ft when t = 0, and reaches a maximum height of 19 feet when t = 3.75 seconds. So, the cart will return to y = 0 after 2(3.75) or 7.5 seconds. b. The cart completes half of a cycle from t = 0 to t = 7.5. So, the period is 2(7.5) or 15 seconds. c.
d. The amplitude a is half of the maximum and
minimum values. So, a =
The vertical shift d is the average of the maximum
and minimum data values. So,
Because the period of a sinusoidal function is
you can write Therefore,
There is no phase shift because the height of the cartwhen t = 0 is 0 feet, and the sine function has a y-intercept of 0. Therefore, one equation that could be used to model
the position of the passenger cart is y = 19 sin t.
Write an equation that corresponds to each graph.
31.
SOLUTION: Sample answer: There is an x-intercept at 0, so one equation that corresponds to this graph is y = a sin (bx + c) + d. Half of the distance from the maximum to the minimum value of the function is 3. So, the amplitudeis 3. It appears that the function completes one period on
[0, π]. Find b.
The midline appears to be at y = 0, so there does not appear to be any vertical shift. Therefore, one equation that corresponds to this graph is y = 3 sin (2x).
32.
SOLUTION:
Sample answer: Because there is a y-intercept at ,
one equation that corresponds to this graph is y = a cos (bx + c) + d. Half of the distance from the maximum to the
minimum value of the function is . So, the
amplitude is .
It appears that the function completes one period on [0, 6π]. Find b.
The midline appears to be at y = 0, so there does not appear to be any vertical shift. Therefore, one
equation that corresponds to this graph is y = cos
.
33.
SOLUTION: Sample answer: Because there is a y-intercept at 3, one equation that corresponds to this graph is y = a cos (bx + c) + d. Half of the distance from the maximum to the
minimum value of the function is 4 ÷ 2 or 2. So, the amplitude is 2. It appears that the function completes one period on
Find b.
The midline appears to be at y = 1, so there is a vertical shift 1 unit up. Therefore, one equation that corresponds to this graph is y = 2 cos 4x + 1.
34.
SOLUTION: Sample answer: There is an x-intercept at 0, so one equation that corresponds to this graph is y = a sin (bx + c) + d. Half of the distance from the maximum to the
minimum value of the function is 8 ÷ 2 or 4. So, the amplitude is 4. It appears that the function completes one period on [0, 4π]. Find b.
The midline appears to be at y = −2, so there is a vertical shift of 2 units down. Therefore, one equation that corresponds to this graph is y = 4 sin
− 2.
Write a sinusoidal function with the given period and amplitude that passes through the given point.
35. period: ; amplitude: 5; point:
SOLUTION: Use the period to find b.
Sample answer: One sinusoidal function in which a =5 and b = 2 is y = 5 cos 2x. Evaluate the function for
The function passes through . Therefore, a
sinusoidal function with period π and amplitude 5 that
passes through the point is y = 5 cos 2x.
36. period: 4 ; amplitude: 2; point: ( , 2)
SOLUTION: Use the period to find b.
Sample answer: One sinusoidal function in which a =
2 and b = is y = 2 sin . Evaluate the function
for x = π.
The function passes through ( , 2). Therefore, a
sinusoidal function with period 4π and amplitude 2
that passes through the point ( , 2) is y = 2 sin .
37. period: ; amplitude: ; point:
SOLUTION: Use the period to find b.
Sample answer: One sinusoidal function in which a =1.5 and b = 4 is y = 1.5 cos 4x. Evaluate the function
for
The function passes through . Therefore, a
sinusoidal function with period and amplitude 1.5
that passes through the point is y = 1.5 cos
4x.
38. period: 3π; amplitude: ; point:
SOLUTION: Use the period to find b.
Sample answer: One sinusoidal function in which a =
0.5 and b = is y = sin x. Evaluate the
function for
The function passes through . Therefore, a
sinusoidal function with period 3π and amplitude 0.5
that passes through the point is y = sin
x.
39. MULTIPLE REPRESENTATIONS In this problem, you will investigate the change in the graph of a sinusoidal function of the form y = sin x or y = cos x when multiplied by a polynomial function. a. GRAPHICAL Use a graphing calculator to sketch the graphs of y = 2x, y = –2x, and y = 2x cos x on the same coordinate plane, on the interval [–20, 20]. b. VERBAL Describe the behavior of the graph of y = 2x cos x in relation to the graphs of y = 2x and y = –2x. c. GRAPHICAL Use a graphing calculator to
sketch the graphs of y = x2, y = –x
2, and y = x
2 sin x
on the same coordinate plane, on the interval [–20, 20]. d. VERBAL Describe the behavior of the graph of
y = x2 sin x in relation to the graphs of y = x
2 and y
= –x2.
e. ANALYTICAL Make a conjecture as to the behavior of the graph of a sinusoidal function of the form y = sin x or y = cos x when multiplied by polynomial function of the form y = f (x).
SOLUTION: a.
b. The graph of y = 2x cos x oscillates between the graphs of y = 2x and y = –2x. c.
d. The graph of y = x2 sin x oscillates between the
graphs of y = x2 and y = –x
2.
e . The graph of y = f (x) sin x or y = f (x) cos x will oscillate between the graphs of y = f (x) and y = –f(x).
40. CHALLENGE Without graphing, find the exact coordinates of the first maximum point to the right of
the y-axis for
SOLUTION:
First, find the phase shift for
Next, find the period of the function.
The first maximum for one period can be found by
finding So, incorporating the phase shift, the
first maximum to the right of the y-axis is
. Because the amplitude is |4| = 4,
the maximum point is
REASONING Determine whether each statement is true or false . Explain your reasoning.
41. Every sine function of the form y = a sin (bx + c) + d can be written as a cosine function of the form y =a cos (bx + c) + d.
SOLUTION: It is true that every sine function of the form y = a sin (bx + c) + d can be written as a cosine function of the form y = a cos (bx + c) + d. The graph of cosine is a horizontal translation of the sine graph. Therefore, a cosine function can be written from any sine function using the same amplitude and period by applying the necessary phase shift.
For example, consider and
. Phase shift by
to obtain .
42. The period of f (x) = cos 8x is equal to four times the period of g(x) = cos 2x.
SOLUTION: Find the period of f (x) = cos 8x.
Find the period of g(x) = cos 2x.
Four times the period of g(x) = cos 2x is 4 ⋅ or
4 . So, the period of f (x) is the period of g(x).
Therefore, the statement is false.
43. CHALLENGE How many zeros does y = cos
1500x have on the interval 0 ≤ x ≤ 2 ?
SOLUTION: Find the period of y = cos 1500x.
Graph y = cos 1500x on .
The graph of y = cos 1500x has two x-intercepts for one cycle, so the function has 2 zeros per cycle. Find
the number of cycles for y = cos 1500x on [0, 2 ].
So, the graph of y = cos 1500x will complete 1500
cycles on [0, 2 ]. Because there are two zeros per cycle, y = cos 1500x will have 1500(2) or 3000 zeros
on [0, 2 ].
44. PROOF Prove the phase shift formula.
SOLUTION:
Consider y = a sin (bx + c), where a , b, and c ≠ 0. To find a zero of the function, find the value of x for which a sin (bx + c) = 0. Since sin 0 = 0, solving bx + c = 0 will yield a zero of the function.
Therefore, y = 0 when . The value of is
the phase shift. When c > 0: The graph of y = a sin (bx + c) is the
graph of y = a sin x, shifted units to the left.
When c < 0: The graph of y = a sin (bx + c) is the
graph of y = a sin x, shifted units to the right.
Consider the graph of y = cos x below in blue. In this equation a = 1, b = 1 and c = 0. One zero of y = cos x is . The green graph is shifted to the
left. Thus c is – . Then the shifted equation will be
.
45. Writing in Math The Power Tower ride in Sandusky, Ohio, is shown below. Along the side of each tower is a string of lights that send a continuouspulse of light up and down each tower at a constant rate. Explain why the distance d of this light from theground over time t cannot be represented by a sinusoidal function.
SOLUTION: Sample answer: Although the pulse of light can be represented as a function with a period, it is not a sinusoidal function because the distance the pulse of light is from the ground changes at a constant rate. As a result, the graph of this function would resemble the graph below.
The given point lies on the terminal side of an angle θ in standard position. Find the values of
the six trigonometric functions of θ. 46. (−4, 4)
SOLUTION: Use the values of x and y to find r.
Use x = –4, y = 4, and r = to write the six trigonometric ratios.
47. (8, −2)
SOLUTION: Use the values of x and y to find r.
Use x = 8, y = –2, and r = to write the six trigonometric ratios.
48. (−5, −9)
SOLUTION: Use the values of x and y to find r.
Use x = –5, y = – 9, and r = to write the six trigonometric ratios.
49. (4, 5)
SOLUTION: Use the values of x and y to find r.
Use x = 4, y = 5, and r = to write the six trigonometric ratios.
Write each degree measure in radians as a multiple of π and each radian measure in degrees.
50. 25°
SOLUTION: To convert a degree measure to radians, multiply by
51. −420°
SOLUTION: To convert a degree measure to radians, multiply by
52.
SOLUTION: To convert a radian measure to degrees, multiply by
53.
SOLUTION: To convert a radian measure to degrees, multiply by
54. SCIENCE Radiocarbon dating is a method of estimating the age of an organic material by calculating the amount of carbon-14 present in the material. The age of a material can be calculated
using A = t , where A is the age of the
object in years, t is the half-life of carbon-14 or 5700 years, and R is the ratio of the amount of carbon-14 in the sample to the amount of carbon-14 in living tissue. a. A sample of organic material contains 0.000076 gram of carbon-14. A living sample of the same
eSolutions Manual - Powered by Cognero Page 23
4-4 Graphing Sine and Cosine Functions
Describe how the graphs of f (x) and g (x) are related. Then find the amplitude of g (x), and sketch two periods of both functions on the same coordinate axes.
1. f (x) = sin x; g(x) = sin x
SOLUTION: The graph of g(x) is the graph of f (x) compressed
vertically. The amplitude of g(x) is or .
Create a table listing the coordinates of the x-intercepts and extrema for f (x) = sin x for one
period, 2 , on the interval [0, 2 ]. Then use the amplitude of g(x) to find corresponding points on its graph.
Sketch the curve through the indicated points for each function. Then repeat the pattern to complete asecond period.
Functions f (x) = sin x g(x) = sin x
x-int (0, 0) (0, 0)
Max
x-int
Min
x-int
2.
SOLUTION: The graph of g(x) is the graph of f (x) compressed
vertically. The amplitude of g(x) is or .
Create a table listing the coordinates of the x-intercepts and extrema for f (x) = cos x for one
period, 2 , on the interval [0, 2 ]. Then use the amplitude of g(x) to find corresponding points on its graph.
Sketch the curve through the indicated points for each function. Then repeat the pattern to complete asecond period.
Function f (x) = cos x
Max (0, 1)
x-int Min
x-in
Min
x-int
Function f (x) = cos x
Max x-int
Min
x-in
Min
x-int
3. f (x) = cos x; g(x) = 6 cos x
SOLUTION: The graph of g(x) is the graph of f (x) expanded
vertically. The amplitude of g(x) is or 6.
Create a table listing the coordinates of the x-intercepts and extrema for f (x) = cos x for one
period, 2 , on the interval [0, 2 ]. Then use the amplitude of g(x) to find corresponding points on its graph.
Sketch the curve through the indicated points for each function. Then repeat the pattern to complete asecond period.
Functions f (x) = cos x g(x) = 6 cos x
Max (0, 1) (0, 6)
x-int
Min
x-int
Max
4. f (x) = sin x; g(x) = −8 sin x
SOLUTION: The graph of g(x) is the graph of f (x) expanded
vertically. The amplitude of g(x) is or 8.
Create a table listing the coordinates of the x-intercepts and extrema for f (x) = sin x for one
period, 2 , on the interval [0, 2 ]. Then use the amplitude of g(x) to find corresponding points on its graph.
Sketch the curve through the indicated points for each function. Then repeat the pattern to complete asecond period.
Function f (x) = sin x
x-int (0, 0)
Max
x-int
Min
x-int
Function g(x) = −8
sin x
x-int (0, 0)
Min
x-int
Max
x-int
Describe how the graphs of f (x) and g (x) are related. Then find the period of g (x), and sketch at least one period of both functions on the same coordinate axes.
5. f (x) = sin x; g(x) = sin 4x
SOLUTION: The graph of g(x) is the graph of f (x) compressed
horizontally. The period of g(x) is . To find
corresponding points on the graph of g(x), change the x-coordinates of those key points on f (x) so that
they range from 0 to , increasing by increments of
.
Sketch the curve through the indicated points for each function. Then repeat the pattern to complete asecond period.
Functions f (x) = sin x g(x) = sin
4x
x-int (0, 0) (0, 0)
Max
x-int
Min
x-int
6. f (x) = cos x; g(x) = cos 2x
SOLUTION: The graph of g(x) is the graph of f (x) compressed
horizontally. The period of g(x) is or . To find
corresponding points on the graph of g(x), change the x-coordinates of those key points on f (x) so that
they range from 0 to , increasing by increments of
.
Sketch the curve through the indicated points for each function. Then repeat the pattern to complete asecond period.
Functions f (x) = cos x g(x) = cos 2x
Max (0, 1) (0, 1)
x-int
Min
x-int
Max
7. f (x) = cos x;
SOLUTION: The graph of g(x) is the graph of f (x) expanded
horizontally. The period of g(x) is . To
find corresponding points on the graph of g(x), change the x-coordinates of those key points on f (x)
so that they range from 0 to , increasing by
increments of or .
Sketch the curve through the indicated points for each function. Then repeat the pattern to complete asecond period.
Functions f (x) = cos x
Max (0, 1) (0, 1)
x-int
Min
x-int
Max
8. f (x) = sin x;
SOLUTION: The graph of g(x) is the graph of f (x) expanded
horizontally. The period of g(x) is . To find corresponding points on the graph of g(x), change the x-coordinates of those key points on f (x) so that they range from 0 to , increasing by increments of
or .
Sketch the curve through the indicated points for each function. Then repeat the pattern to complete asecond period.
Functions f (x) = sin x
x-int (0, 0) (0, 0)
Max
x-int
Min
x-int
9. VOICES The contralto vocal type includes the deepest female singing voice. Some contraltos can sing as low as the E below middle C (E3), which hasa frequency of 165 hertz. Write an equation for a sine function that models the initial behavior of the sound wave associated with E3 having an amplitude of 0.15.
SOLUTION: The general form of the equation will be y = a sin bt,where t is the time in seconds. Because the
amplitude is 0.15, |a|= 0.15. This means that a = ±0.15. The period is the reciprocal of the frequency or
. Use this value to find b.
Sample answer: One sine function that models the
initial behavior is y = 0.15 sin 330 t.
Write a sine function that can be used to model the initial behavior of a sound wave with the frequency and amplitude given.
10. f = 440, a = 0.3
SOLUTION: The general form of the equation is y = a sin bt, where t is the time in seconds. Because the
amplitude is 0.3, = 0.3. This means that a = ±0.3.
The period is the reciprocal of the frequency or
. Use this value to find b.
Using the positive values of a and b, one sine function that models the initial behavior is y = 0.3 sin
880 t.
11. f = 932, a = 0.25
SOLUTION: The general form of the equation is y = a sin bt, where t is the time in seconds. Because the
amplitude is 0.25, = 0.25. This means that a =
±0.25. The period is the reciprocal of the frequency
or . Use this value to find b.
Using the positive values of a and b, one sine function that models the initial behavior is y = 0.25
sin 1864 t.
12. f = 1245, a = 0.12
SOLUTION: The general form of the equation is y = a sin bt, where t is the time in seconds. Because the
amplitude is 0.12, = 0.12. This means that a =
±0.12. The period is the reciprocal of the frequency or
. Use this value to find b.
Using the positive values of a and b, one sine function that models the initial behavior is y = 0.12
sin 2490 t.
13. f = 623, a = 0.2
SOLUTION: The general form of the equation is y = a sin bt, where t is the time in seconds. Because the
amplitude is 0.2, = 0.2. This means that a = ±0.2.
The period is the reciprocal of the frequency or
. Use this value to find b.
Using the positive values of a and b, one sine function that models the initial behavior is y = 0.2 sin
1246 t.
State the amplitude, period, frequency, phase shift, and vertical shift of each function. Then graph two periods of the function.
14.
SOLUTION:
In this function, a = 3, b = 1, c = − , and d = 0.
Because d = 0, there is no vertical shift.
Graph y = 3 sin x shifted units to the right.
15.
SOLUTION:
In this function, a = 1, b = , c = , and d = 0.
Because d = 0, there is no vertical shift.
16. y = 0.25 cos x + 3
SOLUTION:
In this function, a = , b = 1, c = 0, and d = 3.
Graph y = cos x shifted 3 units up.
17. y = sin 3x – 2
SOLUTION: In this function, a = 1, b = 3, c = 0, and d = –2.
Graph y = sin 3x shifted 2 units down.
18.
SOLUTION:
In this function, a = 1, b = 1, c = , and d = –1.
.
Graph y = cos x shifted units to the right and 1
unit down.
19.
SOLUTION:
In this function, a = 1, b = 1, c = , and d = 4.
.
Graph y = sin x shifted units to the left and 4 units up.
20. VACATIONS The average number of reservations R that a vacation resort has at the beginning of each month is shown.
a. Write an equation of a sinusoidal function that models the average number of reservations using x =1 to represent January. b. According to your model, approximately how many reservations can the resort anticipate in November?
SOLUTION: a. Make a scatter plot of the data and choose a model.
Sample answer: Use a sinusoidal function of the form y = a cos (bx + c) + d to model the data. First, find the maximum M and minimum m values of the data, and use these values to find a, b, c, and d. The maximum and minimum reservations are 200 and 87, respectively. The amplitude a is half of the distance between these values.
The vertical shift d is the average of the maximum and minimum data values.
There are 3 months between the maximum and minimum, so the period is 6.
The maximum data value occurs when x = 1. Since y = cos x attains its first maximum when x = 0, we must apply a phase shift of 1 unit. Use this value to find c.
Write a function using the values for a, b, c, and d.
Use b =
b. To find the number of reservations in November, evaluate the model for x = 11.
Therefore, the resort can anticipate about 115 reservations in November.
21. TIDES The table shown below provides data for the first high and low tides of the day for a certain bay during one day in June.
a. Determine the amplitude, period, phase shift, and vertical shift of a sinusoidal function that models the height of the tide. Let x represent the number of hours that the high or low tide occurred after midnight. b. Write a sinusoidal function that models the data. c. According to your model, what was the height of
the tide at 8:45 P.M. that night?
SOLUTION: a. Sample answer: Use a sinusoidal function of the form y = a cos (bx + c) + d to model the data. First, find the amplitude a, which is half of the distance between the heights of the high and low tides.
The vertical shift d is the average of the heights of the high and low tides.
A sinusoid completes half of a period in the time thatit takes to go from its maximum to its minimum value. One period is twice this time. The first high tide occurs 6.5 hours before the first low tide, so the period is 13.
The maximum data value occurs when x ≈ 4.417. Since y = cos x attains its first maximum when x = 0,we must apply a phase shift of 4.417 units. Use this value to find c.
b. Write a function using the values for a, b, c, and
d. Use b =
c. To find the height of the water at 8:45 P.M. that
night, evaluate the model for x = 20.75.
Therefore, the tide was about 7.28 feet high at 8:45
P.M. that night.
22. METEOROLOGY The average monthly temperatures for Boston, Massachusetts are shown.
a. Determine the amplitude, period, phase shift, and vertical shift of a sinusoidal function that models the monthly temperatures using x = 1 to represent January. b. Write an equation of a sinusoidal function that models the monthly temperatures. c. According to your model, what is Boston’s average temperature in August?
SOLUTION: a. The maximum and minimum are 74° and 29°, respectively. The amplitude a is half of the distance between these values.
The vertical shift d is the average of the maximum and minimum data values.
A sinusoid completes half of a period in the time thatit takes to go from its maximum to its minimum value. So, one period is twice this time. The
maximum function value occurs in July, so xmax is 7.
The minimum function value occurs in January, so
xmin is 1. The period is 2(6) = 12.
The maximum data value occurs when x = 7. Since y = cos x attains its first maximum when x = 0, we must apply a phase shift of 7 units. Use this value to find c.
b. Using the values for a, b, c, and d from part a, a sinusoidal function that models that monthly temperatures in Boston is
c. To find the average monthly temperature for Boston in August, evaluate the model for x = 8.
Therefore, the average monthly temperature for Boston in August is about 71°F.
GRAPHING CALCULATOR Find the values of x in the interval – < x < that make each equation or inequality true. (Hint: Use the intersection function.)
23. –sin x = cos x
SOLUTION:
Graph y = −sin x and y = cos x on the same graphing
calculator screen on (−π, π). Use the intersect feature under the CALC menu to determine where the two graphs intersect.
The graphs intersect at about −0.7854 or − and
about 2.356 or . Therefore, on –π < x < π, –sin x
= cos x when x = − and .
24. sin x − cos x = 1
SOLUTION:
Graph y = sin x − cos x and y = 1 on the same
graphing calculator screen on (− , ). Use the intersect feature under the CALC menu to determine where the two graphs intersect.
The graphs intersect at about 1.57 or . Therefore,
on – < x < , sin x − cos x = 1 when x = .
25. sin x + cos x = 0
SOLUTION:
Graph y = sin x + cos x on (−π, π). Use the zero feature under the CALC menu to determine the zeros of the function.
There are zeros at about −0.785 or − or and about
2.356 or . Therefore, on – < x < , sin x + cos
x = 0 when
26. cos x ≤ sin x
SOLUTION:
Graph y = cos x and y = sin x on (−π, π). Use the intersect feature under the CALC menu to determine on what interval(s) cos x ≤ sin x.
The graphs intersect at about –2.356 or – and
about 0.785 or . From the graph, it appears that
cos x ≤ sin x on – < x < – and < x < .
27. sin x cos x > 1
SOLUTION:
Graph y = sin x cos x and y = 1 on (− , ). Use the intersect feature under the CALC menu to determine on what interval(s) sin x cos x > 1.
The graphs do not intersect. Therefore, y = sin x cos
x is not greater than y = 1 for any values of x on –< x < .
28. sin x cos x ≤ 0
SOLUTION:
Graph y = sin x cos x on (−π, π). Use the zero feature under the CALC menu to determine on what interval(s) sin x cos x ≤ 0.
The zeros of y = sin x cos x are about –1.57 or ,
0, and about 1.57 or . From the graph, it appears
that sin x cos x ≤ 0 on < x < 0 and < x < .
29. CAROUSELS A wooden horse on a carousel moves up and down as the carousel spins. When the ride ends, the horse usually stops in a vertical position different from where it started. The position y of the horse after t seconds can be modeled by y =1.5 sin (2t + c), where the phase shift c must be continuously adjusted to compensate for the differentstarting positions. If during one ride the horse
reached a maximum height after seconds, find
the equation that models the horse’s position.
SOLUTION: First, find the period of y = 1.5 sin (2t + c).
Since the period is π, the function will reach a
maximum height at radians. The phase shift is the
difference between the horizontal position of the
function at and radians, which is radians.
Substitute and b into the phase shift formula to
find c.
Therefore, the equation is
30. AMUSEMENT PARKS The position y in feet of a passenger cart relative to the center of a Ferris wheel over t seconds is shown below.
a. Find the time t that it takes for the cart to return toy = 0 during its initial spin. b. Find the period of the Ferris wheel. c. Sketch the graph representing the position of the passenger cart over one period. d. Write a sinusoidal function that models the position of the passenger cart as a function of time t.
SOLUTION: a. From the diagram, the height of the cart is 0 ft when t = 0, and reaches a maximum height of 19 feet when t = 3.75 seconds. So, the cart will return to y = 0 after 2(3.75) or 7.5 seconds. b. The cart completes half of a cycle from t = 0 to t = 7.5. So, the period is 2(7.5) or 15 seconds. c.
d. The amplitude a is half of the maximum and
minimum values. So, a =
The vertical shift d is the average of the maximum
and minimum data values. So,
Because the period of a sinusoidal function is
you can write Therefore,
There is no phase shift because the height of the cartwhen t = 0 is 0 feet, and the sine function has a y-intercept of 0. Therefore, one equation that could be used to model
the position of the passenger cart is y = 19 sin t.
Write an equation that corresponds to each graph.
31.
SOLUTION: Sample answer: There is an x-intercept at 0, so one equation that corresponds to this graph is y = a sin (bx + c) + d. Half of the distance from the maximum to the minimum value of the function is 3. So, the amplitudeis 3. It appears that the function completes one period on
[0, π]. Find b.
The midline appears to be at y = 0, so there does not appear to be any vertical shift. Therefore, one equation that corresponds to this graph is y = 3 sin (2x).
32.
SOLUTION:
Sample answer: Because there is a y-intercept at ,
one equation that corresponds to this graph is y = a cos (bx + c) + d. Half of the distance from the maximum to the
minimum value of the function is . So, the
amplitude is .
It appears that the function completes one period on [0, 6π]. Find b.
The midline appears to be at y = 0, so there does not appear to be any vertical shift. Therefore, one
equation that corresponds to this graph is y = cos
.
33.
SOLUTION: Sample answer: Because there is a y-intercept at 3, one equation that corresponds to this graph is y = a cos (bx + c) + d. Half of the distance from the maximum to the
minimum value of the function is 4 ÷ 2 or 2. So, the amplitude is 2. It appears that the function completes one period on
Find b.
The midline appears to be at y = 1, so there is a vertical shift 1 unit up. Therefore, one equation that corresponds to this graph is y = 2 cos 4x + 1.
34.
SOLUTION: Sample answer: There is an x-intercept at 0, so one equation that corresponds to this graph is y = a sin (bx + c) + d. Half of the distance from the maximum to the
minimum value of the function is 8 ÷ 2 or 4. So, the amplitude is 4. It appears that the function completes one period on [0, 4π]. Find b.
The midline appears to be at y = −2, so there is a vertical shift of 2 units down. Therefore, one equation that corresponds to this graph is y = 4 sin
− 2.
Write a sinusoidal function with the given period and amplitude that passes through the given point.
35. period: ; amplitude: 5; point:
SOLUTION: Use the period to find b.
Sample answer: One sinusoidal function in which a =5 and b = 2 is y = 5 cos 2x. Evaluate the function for
The function passes through . Therefore, a
sinusoidal function with period π and amplitude 5 that
passes through the point is y = 5 cos 2x.
36. period: 4 ; amplitude: 2; point: ( , 2)
SOLUTION: Use the period to find b.
Sample answer: One sinusoidal function in which a =
2 and b = is y = 2 sin . Evaluate the function
for x = π.
The function passes through ( , 2). Therefore, a
sinusoidal function with period 4π and amplitude 2
that passes through the point ( , 2) is y = 2 sin .
37. period: ; amplitude: ; point:
SOLUTION: Use the period to find b.
Sample answer: One sinusoidal function in which a =1.5 and b = 4 is y = 1.5 cos 4x. Evaluate the function
for
The function passes through . Therefore, a
sinusoidal function with period and amplitude 1.5
that passes through the point is y = 1.5 cos
4x.
38. period: 3π; amplitude: ; point:
SOLUTION: Use the period to find b.
Sample answer: One sinusoidal function in which a =
0.5 and b = is y = sin x. Evaluate the
function for
The function passes through . Therefore, a
sinusoidal function with period 3π and amplitude 0.5
that passes through the point is y = sin
x.
39. MULTIPLE REPRESENTATIONS In this problem, you will investigate the change in the graph of a sinusoidal function of the form y = sin x or y = cos x when multiplied by a polynomial function. a. GRAPHICAL Use a graphing calculator to sketch the graphs of y = 2x, y = –2x, and y = 2x cos x on the same coordinate plane, on the interval [–20, 20]. b. VERBAL Describe the behavior of the graph of y = 2x cos x in relation to the graphs of y = 2x and y = –2x. c. GRAPHICAL Use a graphing calculator to
sketch the graphs of y = x2, y = –x
2, and y = x
2 sin x
on the same coordinate plane, on the interval [–20, 20]. d. VERBAL Describe the behavior of the graph of
y = x2 sin x in relation to the graphs of y = x
2 and y
= –x2.
e. ANALYTICAL Make a conjecture as to the behavior of the graph of a sinusoidal function of the form y = sin x or y = cos x when multiplied by polynomial function of the form y = f (x).
SOLUTION: a.
b. The graph of y = 2x cos x oscillates between the graphs of y = 2x and y = –2x. c.
d. The graph of y = x2 sin x oscillates between the
graphs of y = x2 and y = –x
2.
e . The graph of y = f (x) sin x or y = f (x) cos x will oscillate between the graphs of y = f (x) and y = –f(x).
40. CHALLENGE Without graphing, find the exact coordinates of the first maximum point to the right of
the y-axis for
SOLUTION:
First, find the phase shift for
Next, find the period of the function.
The first maximum for one period can be found by
finding So, incorporating the phase shift, the
first maximum to the right of the y-axis is
. Because the amplitude is |4| = 4,
the maximum point is
REASONING Determine whether each statement is true or false . Explain your reasoning.
41. Every sine function of the form y = a sin (bx + c) + d can be written as a cosine function of the form y =a cos (bx + c) + d.
SOLUTION: It is true that every sine function of the form y = a sin (bx + c) + d can be written as a cosine function of the form y = a cos (bx + c) + d. The graph of cosine is a horizontal translation of the sine graph. Therefore, a cosine function can be written from any sine function using the same amplitude and period by applying the necessary phase shift.
For example, consider and
. Phase shift by
to obtain .
42. The period of f (x) = cos 8x is equal to four times the period of g(x) = cos 2x.
SOLUTION: Find the period of f (x) = cos 8x.
Find the period of g(x) = cos 2x.
Four times the period of g(x) = cos 2x is 4 ⋅ or
4 . So, the period of f (x) is the period of g(x).
Therefore, the statement is false.
43. CHALLENGE How many zeros does y = cos
1500x have on the interval 0 ≤ x ≤ 2 ?
SOLUTION: Find the period of y = cos 1500x.
Graph y = cos 1500x on .
The graph of y = cos 1500x has two x-intercepts for one cycle, so the function has 2 zeros per cycle. Find
the number of cycles for y = cos 1500x on [0, 2 ].
So, the graph of y = cos 1500x will complete 1500
cycles on [0, 2 ]. Because there are two zeros per cycle, y = cos 1500x will have 1500(2) or 3000 zeros
on [0, 2 ].
44. PROOF Prove the phase shift formula.
SOLUTION:
Consider y = a sin (bx + c), where a , b, and c ≠ 0. To find a zero of the function, find the value of x for which a sin (bx + c) = 0. Since sin 0 = 0, solving bx + c = 0 will yield a zero of the function.
Therefore, y = 0 when . The value of is
the phase shift. When c > 0: The graph of y = a sin (bx + c) is the
graph of y = a sin x, shifted units to the left.
When c < 0: The graph of y = a sin (bx + c) is the
graph of y = a sin x, shifted units to the right.
Consider the graph of y = cos x below in blue. In this equation a = 1, b = 1 and c = 0. One zero of y = cos x is . The green graph is shifted to the
left. Thus c is – . Then the shifted equation will be
.
45. Writing in Math The Power Tower ride in Sandusky, Ohio, is shown below. Along the side of each tower is a string of lights that send a continuouspulse of light up and down each tower at a constant rate. Explain why the distance d of this light from theground over time t cannot be represented by a sinusoidal function.
SOLUTION: Sample answer: Although the pulse of light can be represented as a function with a period, it is not a sinusoidal function because the distance the pulse of light is from the ground changes at a constant rate. As a result, the graph of this function would resemble the graph below.
The given point lies on the terminal side of an angle θ in standard position. Find the values of
the six trigonometric functions of θ. 46. (−4, 4)
SOLUTION: Use the values of x and y to find r.
Use x = –4, y = 4, and r = to write the six trigonometric ratios.
47. (8, −2)
SOLUTION: Use the values of x and y to find r.
Use x = 8, y = –2, and r = to write the six trigonometric ratios.
48. (−5, −9)
SOLUTION: Use the values of x and y to find r.
Use x = –5, y = – 9, and r = to write the six trigonometric ratios.
49. (4, 5)
SOLUTION: Use the values of x and y to find r.
Use x = 4, y = 5, and r = to write the six trigonometric ratios.
Write each degree measure in radians as a multiple of π and each radian measure in degrees.
50. 25°
SOLUTION: To convert a degree measure to radians, multiply by
51. −420°
SOLUTION: To convert a degree measure to radians, multiply by
52.
SOLUTION: To convert a radian measure to degrees, multiply by
53.
SOLUTION: To convert a radian measure to degrees, multiply by
54. SCIENCE Radiocarbon dating is a method of estimating the age of an organic material by calculating the amount of carbon-14 present in the material. The age of a material can be calculated
using A = t , where A is the age of the
object in years, t is the half-life of carbon-14 or 5700 years, and R is the ratio of the amount of carbon-14 in the sample to the amount of carbon-14 in living tissue. a. A sample of organic material contains 0.000076 gram of carbon-14. A living sample of the same gram of carbon-14. A living sample of the same material contains 0.00038 gram. About how old is the sample? b. A specific sample is at least 20,000 years old. What is the maximum percent of carbon-14 remaining in the sample?
SOLUTION:
a. Use the formula to find the age of
the sample. The half-life t is 5700. R is the ratio of the amount in the sample to the amount in living tissue. Divide to find R.
Substitute the values into the formula to find A.
The sample is about 13,238 years old. b. Set up an inequality using A = 20,000.
The maximum percent of carbon in the sample is approximately 8.8%.
State the number of possible real zeros and turning points of each function. Then determineall of the real zeros by factoring.
55. f (x) = x3 + 2x
2 – 8x
SOLUTION: The degree of f (x) is 3, so it will have at most three real zeros and two turning points.
So, the zeros are −4, 0, and 2.
56. f (x) = x4 – 10x
2 + 9
SOLUTION: The degree of f (x) is 4, so it will have at most four real zeros and three turning points.
So, the zeros are −3, −1, 1, and 3.
57. f (x) = x5 + 2x
4 – 4x
3 – 8x
2
SOLUTION: The degree of f (x) is 5, so it will have at most five real zeros and four turning points.
So, the zeros are −2, 0, and 2.
58. f (x) = x4 − 1
SOLUTION: The degree of f (x) is 4, so it will have at most four real zeros and five turning points.
So, the zeros are −1, and 1.
Determine whether f has an inverse function. Ifit does, find the inverse function and state any restrictions on its domain.
59. f (x) = −x – 2
SOLUTION:
Graph f (x) = −x – 2.
The graph of f passes the horizontal line test. Therefore, f is a one-to-one function and has an inverse function. From the graph, you can see that f
has domain (– , ) and range (– , ). Now find
f–1
.
Because f–1
and f are the same function, the domainand range of f are equal to the domain and range of
f–1
, respectively. Therefore, it is not necessary to
restrict the domain of f–1
.
60. f (x) =
SOLUTION:
Graph f (x) = .
The graph of f passes the horizontal line test. Therefore, f is a one-to-one function and has an inverse function. From the graph, you can see that f
has domain (– , –4) ∪ (–4, ) and range (– ,
0) ∪ (0, ). Now find f–1
.
Graph y = – 4.
From the graph of y = – 4 shown, you can see
that the inverse relation has domain (– , 0) ∪ (0,
) and range (– , –4) ∪ (–4, ). The domain and range of f are equal to the domain and range of
f–1
, respectively. Therefore, it is not necessary to restrict the domain of
f–1
.
61. f (x) = (x – 3)2 – 7
SOLUTION:
Graph f (x) = (x – 3)2 – 7.
The graph of f does not pass the horizontal line test. Therefore, f is not a one-to-one function and does not have an inverse function.
62. f (x) =
SOLUTION:
Graph f (x) = .
The graph of f does not pass the horizontal line test. Therefore, f is not a one-to-one function and does not have an inverse function.
63. SAT/ACT If x + y = 90° and x and y are both
nonnegative angles, what is equal to ?
A 0
B
C 1 D 1.5 E Cannot be determined from the information given.
SOLUTION:
If x + y = 90º, then x = 90º – y , and can be
rewritten as . Let y = 60º.
Try a second angle. Let y = 45º.
Therefore, = 1, and the correct answer is C.
64. REVIEW If tan x = in the figure below, what
are sin x and cos x?
F sin x = and cos x =
G sin x = and cos x =
H sin x = and cos x =
J sin x = and cos x =
SOLUTION:
If tan x = , then the side opposite x is 10 and the
side adjacent to x is 24.
Use the Pythagorean Theorem to find the length of the hypotenuse.
Find sin x and cos x.
Therefore, the correct answer is G.
65. Identify the equation represented by the graph.
A y = sin 4x
B y = sin 2x
C y = 2 sin 2x
D y = 4 sin x
SOLUTION: From the graph, it appears that the amplitude is 2 and
the period is π. Use the period to find b.
So, the sine function represented by the graph could be y = 2 sin 2x. Therefore, the correct answer is C.
66. REVIEW If cos θ = and the terminal side of
the angle is in Quadrant IV, what is the exact value
of sinθ ?
F
G
H
J
SOLUTION: The terminal side of the angle is in Quadrant IV, so x
is positive and y is negative. Because cos θ = =
, x = 8 and r = 17. Find y .
So, y = −15.
Therefore, sin θ = = , and the correct
answer is H.
gram of carbon-14. A living sample of the same material contains 0.00038 gram. About how old is the sample? b. A specific sample is at least 20,000 years old. What is the maximum percent of carbon-14 remaining in the sample?
SOLUTION:
a. Use the formula to find the age of
the sample. The half-life t is 5700. R is the ratio of the amount in the sample to the amount in living tissue. Divide to find R.
Substitute the values into the formula to find A.
The sample is about 13,238 years old. b. Set up an inequality using A = 20,000.
The maximum percent of carbon in the sample is approximately 8.8%.
State the number of possible real zeros and turning points of each function. Then determineall of the real zeros by factoring.
55. f (x) = x3 + 2x
2 – 8x
SOLUTION: The degree of f (x) is 3, so it will have at most three real zeros and two turning points.
So, the zeros are −4, 0, and 2.
56. f (x) = x4 – 10x
2 + 9
SOLUTION: The degree of f (x) is 4, so it will have at most four real zeros and three turning points.
So, the zeros are −3, −1, 1, and 3.
57. f (x) = x5 + 2x
4 – 4x
3 – 8x
2
SOLUTION: The degree of f (x) is 5, so it will have at most five real zeros and four turning points.
So, the zeros are −2, 0, and 2.
58. f (x) = x4 − 1
SOLUTION: The degree of f (x) is 4, so it will have at most four real zeros and five turning points.
So, the zeros are −1, and 1.
Determine whether f has an inverse function. Ifit does, find the inverse function and state any restrictions on its domain.
59. f (x) = −x – 2
SOLUTION:
Graph f (x) = −x – 2.
The graph of f passes the horizontal line test. Therefore, f is a one-to-one function and has an inverse function. From the graph, you can see that f
has domain (– , ) and range (– , ). Now find
f–1
.
Because f–1
and f are the same function, the domainand range of f are equal to the domain and range of
f–1
, respectively. Therefore, it is not necessary to
restrict the domain of f–1
.
60. f (x) =
SOLUTION:
Graph f (x) = .
The graph of f passes the horizontal line test. Therefore, f is a one-to-one function and has an inverse function. From the graph, you can see that f
has domain (– , –4) ∪ (–4, ) and range (– ,
0) ∪ (0, ). Now find f–1
.
Graph y = – 4.
From the graph of y = – 4 shown, you can see
that the inverse relation has domain (– , 0) ∪ (0,
) and range (– , –4) ∪ (–4, ). The domain and range of f are equal to the domain and range of
f–1
, respectively. Therefore, it is not necessary to restrict the domain of
f–1
.
61. f (x) = (x – 3)2 – 7
SOLUTION:
Graph f (x) = (x – 3)2 – 7.
The graph of f does not pass the horizontal line test. Therefore, f is not a one-to-one function and does not have an inverse function.
62. f (x) =
SOLUTION:
Graph f (x) = .
The graph of f does not pass the horizontal line test. Therefore, f is not a one-to-one function and does not have an inverse function.
63. SAT/ACT If x + y = 90° and x and y are both
nonnegative angles, what is equal to ?
A 0
B
C 1 D 1.5 E Cannot be determined from the information given.
SOLUTION:
If x + y = 90º, then x = 90º – y , and can be
rewritten as . Let y = 60º.
Try a second angle. Let y = 45º.
Therefore, = 1, and the correct answer is C.
64. REVIEW If tan x = in the figure below, what
are sin x and cos x?
F sin x = and cos x =
G sin x = and cos x =
H sin x = and cos x =
J sin x = and cos x =
SOLUTION:
If tan x = , then the side opposite x is 10 and the
side adjacent to x is 24.
Use the Pythagorean Theorem to find the length of the hypotenuse.
Find sin x and cos x.
Therefore, the correct answer is G.
65. Identify the equation represented by the graph.
A y = sin 4x
B y = sin 2x
C y = 2 sin 2x
D y = 4 sin x
SOLUTION: From the graph, it appears that the amplitude is 2 and
the period is π. Use the period to find b.
So, the sine function represented by the graph could be y = 2 sin 2x. Therefore, the correct answer is C.
66. REVIEW If cos θ = and the terminal side of
the angle is in Quadrant IV, what is the exact value
of sinθ ?
F
G
H
J
SOLUTION: The terminal side of the angle is in Quadrant IV, so x
is positive and y is negative. Because cos θ = =
, x = 8 and r = 17. Find y .
So, y = −15.
Therefore, sin θ = = , and the correct
answer is H.
eSolutions Manual - Powered by Cognero Page 24
4-4 Graphing Sine and Cosine Functions
gram of carbon-14. A living sample of the same material contains 0.00038 gram. About how old is the sample? b. A specific sample is at least 20,000 years old. What is the maximum percent of carbon-14 remaining in the sample?
SOLUTION:
a. Use the formula to find the age of
the sample. The half-life t is 5700. R is the ratio of the amount in the sample to the amount in living tissue. Divide to find R.
Substitute the values into the formula to find A.
The sample is about 13,238 years old. b. Set up an inequality using A = 20,000.
The maximum percent of carbon in the sample is approximately 8.8%.
State the number of possible real zeros and turning points of each function. Then determineall of the real zeros by factoring.
55. f (x) = x3 + 2x
2 – 8x
SOLUTION: The degree of f (x) is 3, so it will have at most three real zeros and two turning points.
So, the zeros are −4, 0, and 2.
56. f (x) = x4 – 10x
2 + 9
SOLUTION: The degree of f (x) is 4, so it will have at most four real zeros and three turning points.
So, the zeros are −3, −1, 1, and 3.
57. f (x) = x5 + 2x
4 – 4x
3 – 8x
2
SOLUTION: The degree of f (x) is 5, so it will have at most five real zeros and four turning points.
So, the zeros are −2, 0, and 2.
58. f (x) = x4 − 1
SOLUTION: The degree of f (x) is 4, so it will have at most four real zeros and five turning points.
So, the zeros are −1, and 1.
Determine whether f has an inverse function. Ifit does, find the inverse function and state any restrictions on its domain.
59. f (x) = −x – 2
SOLUTION:
Graph f (x) = −x – 2.
The graph of f passes the horizontal line test. Therefore, f is a one-to-one function and has an inverse function. From the graph, you can see that f
has domain (– , ) and range (– , ). Now find
f–1
.
Because f–1
and f are the same function, the domainand range of f are equal to the domain and range of
f–1
, respectively. Therefore, it is not necessary to
restrict the domain of f–1
.
60. f (x) =
SOLUTION:
Graph f (x) = .
The graph of f passes the horizontal line test. Therefore, f is a one-to-one function and has an inverse function. From the graph, you can see that f
has domain (– , –4) ∪ (–4, ) and range (– ,
0) ∪ (0, ). Now find f–1
.
Graph y = – 4.
From the graph of y = – 4 shown, you can see
that the inverse relation has domain (– , 0) ∪ (0,
) and range (– , –4) ∪ (–4, ). The domain and range of f are equal to the domain and range of
f–1
, respectively. Therefore, it is not necessary to restrict the domain of
f–1
.
61. f (x) = (x – 3)2 – 7
SOLUTION:
Graph f (x) = (x – 3)2 – 7.
The graph of f does not pass the horizontal line test. Therefore, f is not a one-to-one function and does not have an inverse function.
62. f (x) =
SOLUTION:
Graph f (x) = .
The graph of f does not pass the horizontal line test. Therefore, f is not a one-to-one function and does not have an inverse function.
63. SAT/ACT If x + y = 90° and x and y are both
nonnegative angles, what is equal to ?
A 0
B
C 1 D 1.5 E Cannot be determined from the information given.
SOLUTION:
If x + y = 90º, then x = 90º – y , and can be
rewritten as . Let y = 60º.
Try a second angle. Let y = 45º.
Therefore, = 1, and the correct answer is C.
64. REVIEW If tan x = in the figure below, what
are sin x and cos x?
F sin x = and cos x =
G sin x = and cos x =
H sin x = and cos x =
J sin x = and cos x =
SOLUTION:
If tan x = , then the side opposite x is 10 and the
side adjacent to x is 24.
Use the Pythagorean Theorem to find the length of the hypotenuse.
Find sin x and cos x.
Therefore, the correct answer is G.
65. Identify the equation represented by the graph.
A y = sin 4x
B y = sin 2x
C y = 2 sin 2x
D y = 4 sin x
SOLUTION: From the graph, it appears that the amplitude is 2 and
the period is π. Use the period to find b.
So, the sine function represented by the graph could be y = 2 sin 2x. Therefore, the correct answer is C.
66. REVIEW If cos θ = and the terminal side of
the angle is in Quadrant IV, what is the exact value
of sinθ ?
F
G
H
J
SOLUTION: The terminal side of the angle is in Quadrant IV, so x
is positive and y is negative. Because cos θ = =
, x = 8 and r = 17. Find y .
So, y = −15.
Therefore, sin θ = = , and the correct
answer is H.
eSolutions Manual - Powered by Cognero Page 25
4-4 Graphing Sine and Cosine Functions
gram of carbon-14. A living sample of the same material contains 0.00038 gram. About how old is the sample? b. A specific sample is at least 20,000 years old. What is the maximum percent of carbon-14 remaining in the sample?
SOLUTION:
a. Use the formula to find the age of
the sample. The half-life t is 5700. R is the ratio of the amount in the sample to the amount in living tissue. Divide to find R.
Substitute the values into the formula to find A.
The sample is about 13,238 years old. b. Set up an inequality using A = 20,000.
The maximum percent of carbon in the sample is approximately 8.8%.
State the number of possible real zeros and turning points of each function. Then determineall of the real zeros by factoring.
55. f (x) = x3 + 2x
2 – 8x
SOLUTION: The degree of f (x) is 3, so it will have at most three real zeros and two turning points.
So, the zeros are −4, 0, and 2.
56. f (x) = x4 – 10x
2 + 9
SOLUTION: The degree of f (x) is 4, so it will have at most four real zeros and three turning points.
So, the zeros are −3, −1, 1, and 3.
57. f (x) = x5 + 2x
4 – 4x
3 – 8x
2
SOLUTION: The degree of f (x) is 5, so it will have at most five real zeros and four turning points.
So, the zeros are −2, 0, and 2.
58. f (x) = x4 − 1
SOLUTION: The degree of f (x) is 4, so it will have at most four real zeros and five turning points.
So, the zeros are −1, and 1.
Determine whether f has an inverse function. Ifit does, find the inverse function and state any restrictions on its domain.
59. f (x) = −x – 2
SOLUTION:
Graph f (x) = −x – 2.
The graph of f passes the horizontal line test. Therefore, f is a one-to-one function and has an inverse function. From the graph, you can see that f
has domain (– , ) and range (– , ). Now find
f–1
.
Because f–1
and f are the same function, the domainand range of f are equal to the domain and range of
f–1
, respectively. Therefore, it is not necessary to
restrict the domain of f–1
.
60. f (x) =
SOLUTION:
Graph f (x) = .
The graph of f passes the horizontal line test. Therefore, f is a one-to-one function and has an inverse function. From the graph, you can see that f
has domain (– , –4) ∪ (–4, ) and range (– ,
0) ∪ (0, ). Now find f–1
.
Graph y = – 4.
From the graph of y = – 4 shown, you can see
that the inverse relation has domain (– , 0) ∪ (0,
) and range (– , –4) ∪ (–4, ). The domain and range of f are equal to the domain and range of
f–1
, respectively. Therefore, it is not necessary to restrict the domain of
f–1
.
61. f (x) = (x – 3)2 – 7
SOLUTION:
Graph f (x) = (x – 3)2 – 7.
The graph of f does not pass the horizontal line test. Therefore, f is not a one-to-one function and does not have an inverse function.
62. f (x) =
SOLUTION:
Graph f (x) = .
The graph of f does not pass the horizontal line test. Therefore, f is not a one-to-one function and does not have an inverse function.
63. SAT/ACT If x + y = 90° and x and y are both
nonnegative angles, what is equal to ?
A 0
B
C 1 D 1.5 E Cannot be determined from the information given.
SOLUTION:
If x + y = 90º, then x = 90º – y , and can be
rewritten as . Let y = 60º.
Try a second angle. Let y = 45º.
Therefore, = 1, and the correct answer is C.
64. REVIEW If tan x = in the figure below, what
are sin x and cos x?
F sin x = and cos x =
G sin x = and cos x =
H sin x = and cos x =
J sin x = and cos x =
SOLUTION:
If tan x = , then the side opposite x is 10 and the
side adjacent to x is 24.
Use the Pythagorean Theorem to find the length of the hypotenuse.
Find sin x and cos x.
Therefore, the correct answer is G.
65. Identify the equation represented by the graph.
A y = sin 4x
B y = sin 2x
C y = 2 sin 2x
D y = 4 sin x
SOLUTION: From the graph, it appears that the amplitude is 2 and
the period is π. Use the period to find b.
So, the sine function represented by the graph could be y = 2 sin 2x. Therefore, the correct answer is C.
66. REVIEW If cos θ = and the terminal side of
the angle is in Quadrant IV, what is the exact value
of sinθ ?
F
G
H
J
SOLUTION: The terminal side of the angle is in Quadrant IV, so x
is positive and y is negative. Because cos θ = =
, x = 8 and r = 17. Find y .
So, y = −15.
Therefore, sin θ = = , and the correct
answer is H.
gram of carbon-14. A living sample of the same material contains 0.00038 gram. About how old is the sample? b. A specific sample is at least 20,000 years old. What is the maximum percent of carbon-14 remaining in the sample?
SOLUTION:
a. Use the formula to find the age of
the sample. The half-life t is 5700. R is the ratio of the amount in the sample to the amount in living tissue. Divide to find R.
Substitute the values into the formula to find A.
The sample is about 13,238 years old. b. Set up an inequality using A = 20,000.
The maximum percent of carbon in the sample is approximately 8.8%.
State the number of possible real zeros and turning points of each function. Then determineall of the real zeros by factoring.
55. f (x) = x3 + 2x
2 – 8x
SOLUTION: The degree of f (x) is 3, so it will have at most three real zeros and two turning points.
So, the zeros are −4, 0, and 2.
56. f (x) = x4 – 10x
2 + 9
SOLUTION: The degree of f (x) is 4, so it will have at most four real zeros and three turning points.
So, the zeros are −3, −1, 1, and 3.
57. f (x) = x5 + 2x
4 – 4x
3 – 8x
2
SOLUTION: The degree of f (x) is 5, so it will have at most five real zeros and four turning points.
So, the zeros are −2, 0, and 2.
58. f (x) = x4 − 1
SOLUTION: The degree of f (x) is 4, so it will have at most four real zeros and five turning points.
So, the zeros are −1, and 1.
Determine whether f has an inverse function. Ifit does, find the inverse function and state any restrictions on its domain.
59. f (x) = −x – 2
SOLUTION:
Graph f (x) = −x – 2.
The graph of f passes the horizontal line test. Therefore, f is a one-to-one function and has an inverse function. From the graph, you can see that f
has domain (– , ) and range (– , ). Now find
f–1
.
Because f–1
and f are the same function, the domainand range of f are equal to the domain and range of
f–1
, respectively. Therefore, it is not necessary to
restrict the domain of f–1
.
60. f (x) =
SOLUTION:
Graph f (x) = .
The graph of f passes the horizontal line test. Therefore, f is a one-to-one function and has an inverse function. From the graph, you can see that f
has domain (– , –4) ∪ (–4, ) and range (– ,
0) ∪ (0, ). Now find f–1
.
Graph y = – 4.
From the graph of y = – 4 shown, you can see
that the inverse relation has domain (– , 0) ∪ (0,
) and range (– , –4) ∪ (–4, ). The domain and range of f are equal to the domain and range of
f–1
, respectively. Therefore, it is not necessary to restrict the domain of
f–1
.
61. f (x) = (x – 3)2 – 7
SOLUTION:
Graph f (x) = (x – 3)2 – 7.
The graph of f does not pass the horizontal line test. Therefore, f is not a one-to-one function and does not have an inverse function.
62. f (x) =
SOLUTION:
Graph f (x) = .
The graph of f does not pass the horizontal line test. Therefore, f is not a one-to-one function and does not have an inverse function.
63. SAT/ACT If x + y = 90° and x and y are both
nonnegative angles, what is equal to ?
A 0
B
C 1 D 1.5 E Cannot be determined from the information given.
SOLUTION:
If x + y = 90º, then x = 90º – y , and can be
rewritten as . Let y = 60º.
Try a second angle. Let y = 45º.
Therefore, = 1, and the correct answer is C.
64. REVIEW If tan x = in the figure below, what
are sin x and cos x?
F sin x = and cos x =
G sin x = and cos x =
H sin x = and cos x =
J sin x = and cos x =
SOLUTION:
If tan x = , then the side opposite x is 10 and the
side adjacent to x is 24.
Use the Pythagorean Theorem to find the length of the hypotenuse.
Find sin x and cos x.
Therefore, the correct answer is G.
65. Identify the equation represented by the graph.
A y = sin 4x
B y = sin 2x
C y = 2 sin 2x
D y = 4 sin x
SOLUTION: From the graph, it appears that the amplitude is 2 and
the period is π. Use the period to find b.
So, the sine function represented by the graph could be y = 2 sin 2x. Therefore, the correct answer is C.
66. REVIEW If cos θ = and the terminal side of
the angle is in Quadrant IV, what is the exact value
of sinθ ?
F
G
H
J
SOLUTION: The terminal side of the angle is in Quadrant IV, so x
is positive and y is negative. Because cos θ = =
, x = 8 and r = 17. Find y .
So, y = −15.
Therefore, sin θ = = , and the correct
answer is H.
eSolutions Manual - Powered by Cognero Page 26
4-4 Graphing Sine and Cosine Functions
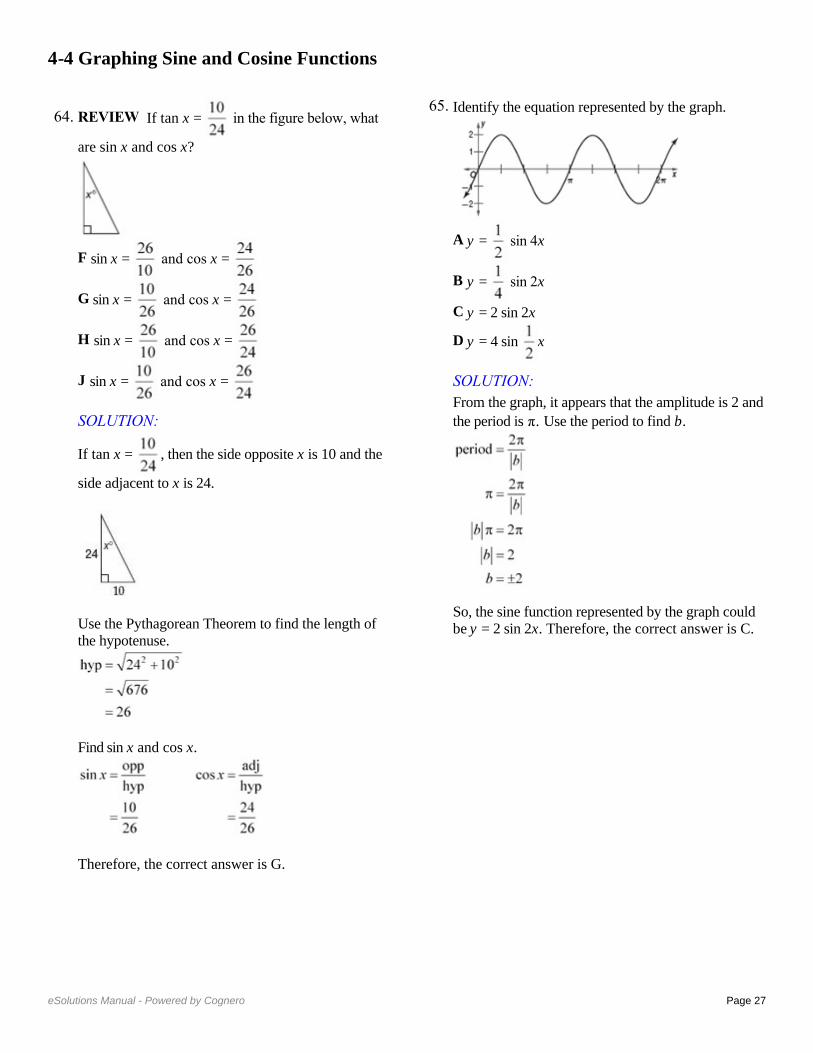
gram of carbon-14. A living sample of the same material contains 0.00038 gram. About how old is the sample? b. A specific sample is at least 20,000 years old. What is the maximum percent of carbon-14 remaining in the sample?
SOLUTION:
a. Use the formula to find the age of
the sample. The half-life t is 5700. R is the ratio of the amount in the sample to the amount in living tissue. Divide to find R.
Substitute the values into the formula to find A.
The sample is about 13,238 years old. b. Set up an inequality using A = 20,000.
The maximum percent of carbon in the sample is approximately 8.8%.
State the number of possible real zeros and turning points of each function. Then determineall of the real zeros by factoring.
55. f (x) = x3 + 2x
2 – 8x
SOLUTION: The degree of f (x) is 3, so it will have at most three real zeros and two turning points.
So, the zeros are −4, 0, and 2.
56. f (x) = x4 – 10x
2 + 9
SOLUTION: The degree of f (x) is 4, so it will have at most four real zeros and three turning points.
So, the zeros are −3, −1, 1, and 3.
57. f (x) = x5 + 2x
4 – 4x
3 – 8x
2
SOLUTION: The degree of f (x) is 5, so it will have at most five real zeros and four turning points.
So, the zeros are −2, 0, and 2.
58. f (x) = x4 − 1
SOLUTION: The degree of f (x) is 4, so it will have at most four real zeros and five turning points.
So, the zeros are −1, and 1.
Determine whether f has an inverse function. Ifit does, find the inverse function and state any restrictions on its domain.
59. f (x) = −x – 2
SOLUTION:
Graph f (x) = −x – 2.
The graph of f passes the horizontal line test. Therefore, f is a one-to-one function and has an inverse function. From the graph, you can see that f
has domain (– , ) and range (– , ). Now find
f–1
.
Because f–1
and f are the same function, the domainand range of f are equal to the domain and range of
f–1
, respectively. Therefore, it is not necessary to
restrict the domain of f–1
.
60. f (x) =
SOLUTION:
Graph f (x) = .
The graph of f passes the horizontal line test. Therefore, f is a one-to-one function and has an inverse function. From the graph, you can see that f
has domain (– , –4) ∪ (–4, ) and range (– ,
0) ∪ (0, ). Now find f–1
.
Graph y = – 4.
From the graph of y = – 4 shown, you can see
that the inverse relation has domain (– , 0) ∪ (0,
) and range (– , –4) ∪ (–4, ). The domain and range of f are equal to the domain and range of
f–1
, respectively. Therefore, it is not necessary to restrict the domain of
f–1
.
61. f (x) = (x – 3)2 – 7
SOLUTION:
Graph f (x) = (x – 3)2 – 7.
The graph of f does not pass the horizontal line test. Therefore, f is not a one-to-one function and does not have an inverse function.
62. f (x) =
SOLUTION:
Graph f (x) = .
The graph of f does not pass the horizontal line test. Therefore, f is not a one-to-one function and does not have an inverse function.
63. SAT/ACT If x + y = 90° and x and y are both
nonnegative angles, what is equal to ?
A 0
B
C 1 D 1.5 E Cannot be determined from the information given.
SOLUTION:
If x + y = 90º, then x = 90º – y , and can be
rewritten as . Let y = 60º.
Try a second angle. Let y = 45º.
Therefore, = 1, and the correct answer is C.
64. REVIEW If tan x = in the figure below, what
are sin x and cos x?
F sin x = and cos x =
G sin x = and cos x =
H sin x = and cos x =
J sin x = and cos x =
SOLUTION:
If tan x = , then the side opposite x is 10 and the
side adjacent to x is 24.
Use the Pythagorean Theorem to find the length of the hypotenuse.
Find sin x and cos x.
Therefore, the correct answer is G.
65. Identify the equation represented by the graph.
A y = sin 4x
B y = sin 2x
C y = 2 sin 2x
D y = 4 sin x
SOLUTION: From the graph, it appears that the amplitude is 2 and
the period is π. Use the period to find b.
So, the sine function represented by the graph could be y = 2 sin 2x. Therefore, the correct answer is C.
66. REVIEW If cos θ = and the terminal side of
the angle is in Quadrant IV, what is the exact value
of sinθ ?
F
G
H
J
SOLUTION: The terminal side of the angle is in Quadrant IV, so x
is positive and y is negative. Because cos θ = =
, x = 8 and r = 17. Find y .
So, y = −15.
Therefore, sin θ = = , and the correct
answer is H.
eSolutions Manual - Powered by Cognero Page 27
4-4 Graphing Sine and Cosine Functions
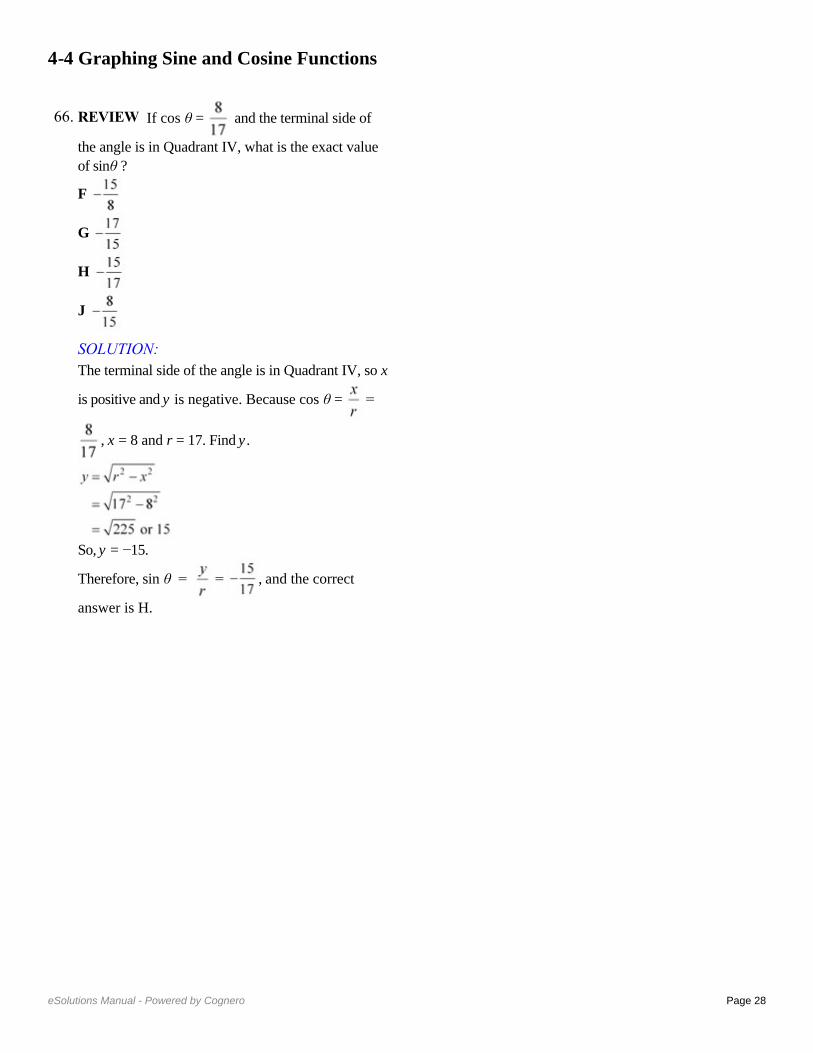
gram of carbon-14. A living sample of the same material contains 0.00038 gram. About how old is the sample? b. A specific sample is at least 20,000 years old. What is the maximum percent of carbon-14 remaining in the sample?
SOLUTION:
a. Use the formula to find the age of
the sample. The half-life t is 5700. R is the ratio of the amount in the sample to the amount in living tissue. Divide to find R.
Substitute the values into the formula to find A.
The sample is about 13,238 years old. b. Set up an inequality using A = 20,000.
The maximum percent of carbon in the sample is approximately 8.8%.
State the number of possible real zeros and turning points of each function. Then determineall of the real zeros by factoring.
55. f (x) = x3 + 2x
2 – 8x
SOLUTION: The degree of f (x) is 3, so it will have at most three real zeros and two turning points.
So, the zeros are −4, 0, and 2.
56. f (x) = x4 – 10x
2 + 9
SOLUTION: The degree of f (x) is 4, so it will have at most four real zeros and three turning points.
So, the zeros are −3, −1, 1, and 3.
57. f (x) = x5 + 2x
4 – 4x
3 – 8x
2
SOLUTION: The degree of f (x) is 5, so it will have at most five real zeros and four turning points.
So, the zeros are −2, 0, and 2.
58. f (x) = x4 − 1
SOLUTION: The degree of f (x) is 4, so it will have at most four real zeros and five turning points.
So, the zeros are −1, and 1.
Determine whether f has an inverse function. Ifit does, find the inverse function and state any restrictions on its domain.
59. f (x) = −x – 2
SOLUTION:
Graph f (x) = −x – 2.
The graph of f passes the horizontal line test. Therefore, f is a one-to-one function and has an inverse function. From the graph, you can see that f
has domain (– , ) and range (– , ). Now find
f–1
.
Because f–1
and f are the same function, the domainand range of f are equal to the domain and range of
f–1
, respectively. Therefore, it is not necessary to
restrict the domain of f–1
.
60. f (x) =
SOLUTION:
Graph f (x) = .
The graph of f passes the horizontal line test. Therefore, f is a one-to-one function and has an inverse function. From the graph, you can see that f
has domain (– , –4) ∪ (–4, ) and range (– ,
0) ∪ (0, ). Now find f–1
.
Graph y = – 4.
From the graph of y = – 4 shown, you can see
that the inverse relation has domain (– , 0) ∪ (0,
) and range (– , –4) ∪ (–4, ). The domain and range of f are equal to the domain and range of
f–1
, respectively. Therefore, it is not necessary to restrict the domain of
f–1
.
61. f (x) = (x – 3)2 – 7
SOLUTION:
Graph f (x) = (x – 3)2 – 7.
The graph of f does not pass the horizontal line test. Therefore, f is not a one-to-one function and does not have an inverse function.
62. f (x) =
SOLUTION:
Graph f (x) = .
The graph of f does not pass the horizontal line test. Therefore, f is not a one-to-one function and does not have an inverse function.
63. SAT/ACT If x + y = 90° and x and y are both
nonnegative angles, what is equal to ?
A 0
B
C 1 D 1.5 E Cannot be determined from the information given.
SOLUTION:
If x + y = 90º, then x = 90º – y , and can be
rewritten as . Let y = 60º.
Try a second angle. Let y = 45º.
Therefore, = 1, and the correct answer is C.
64. REVIEW If tan x = in the figure below, what
are sin x and cos x?
F sin x = and cos x =
G sin x = and cos x =
H sin x = and cos x =
J sin x = and cos x =
SOLUTION:
If tan x = , then the side opposite x is 10 and the
side adjacent to x is 24.
Use the Pythagorean Theorem to find the length of the hypotenuse.
Find sin x and cos x.
Therefore, the correct answer is G.
65. Identify the equation represented by the graph.
A y = sin 4x
B y = sin 2x
C y = 2 sin 2x
D y = 4 sin x
SOLUTION: From the graph, it appears that the amplitude is 2 and
the period is π. Use the period to find b.
So, the sine function represented by the graph could be y = 2 sin 2x. Therefore, the correct answer is C.
66. REVIEW If cos θ = and the terminal side of
the angle is in Quadrant IV, what is the exact value
of sinθ ?
F
G
H
J
SOLUTION: The terminal side of the angle is in Quadrant IV, so x
is positive and y is negative. Because cos θ = =
, x = 8 and r = 17. Find y .
So, y = −15.
Therefore, sin θ = = , and the correct
answer is H.
eSolutions Manual - Powered by Cognero Page 28
4-4 Graphing Sine and Cosine Functions
Recommended