ISG Confidential. © 2017 Information Services Group, Inc. All Rights Reserved.
Proprietary and Confidential. No part of this document may be reproduced in any form or by any electronic
or mechanical means, including information storage and retrieval devices or systems, without prior written
permission from Information Services Group, Inc.
Global Sourcing and As-a-Service Market Insights
Hosted by:
John King, Bank of America, Merrill Lynch
17 October 2017
THIRD QUARTER 2017
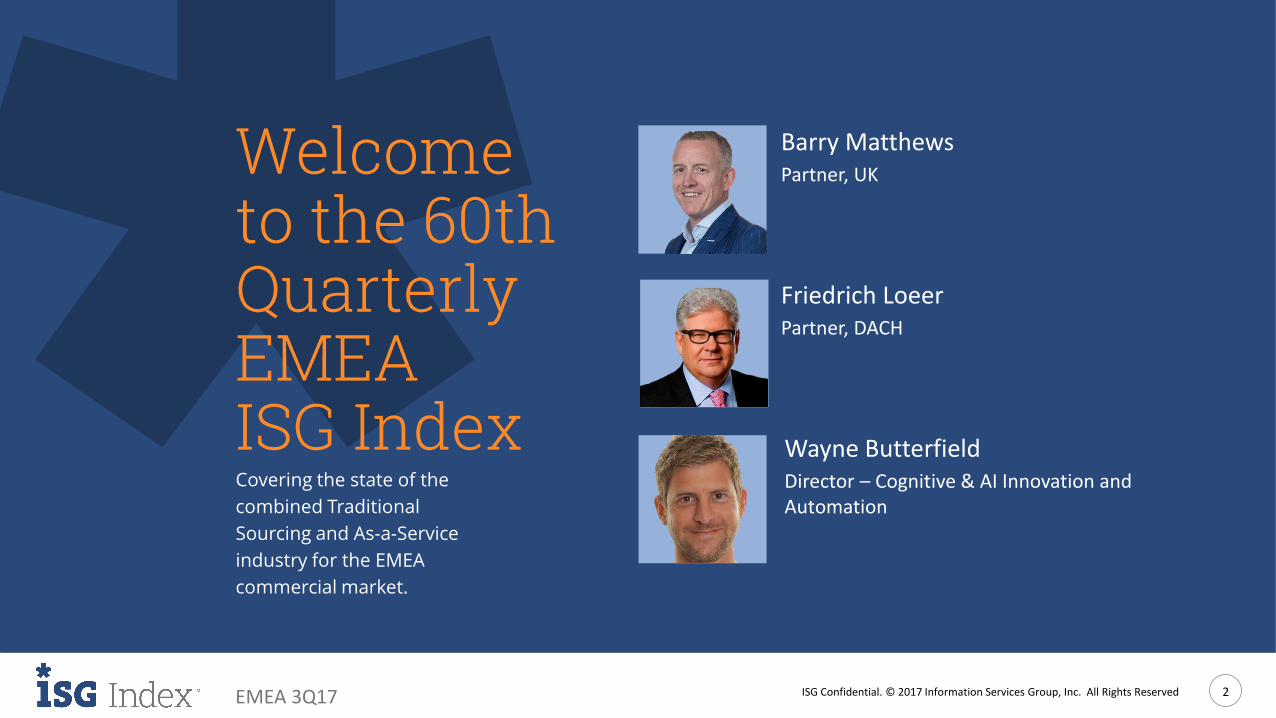
ISG Confidential. © 2017 Information Services Group, Inc. All Rights Reserved 2EMEA 3Q17
Covering the state of the
combined Traditional
Sourcing and As-a-Service
industry for the EMEA
commercial market.
Welcome to the 60th Quarterly EMEA ISG Index
Barry Matthews Partner, UK
Wayne ButterfieldDirector – Cognitive & AI Innovation and Automation
Friedrich LoeerPartner, DACH
ISG Confidential. © 2017 Information Services Group, Inc. All Rights Reserved 3EMEA 3Q17
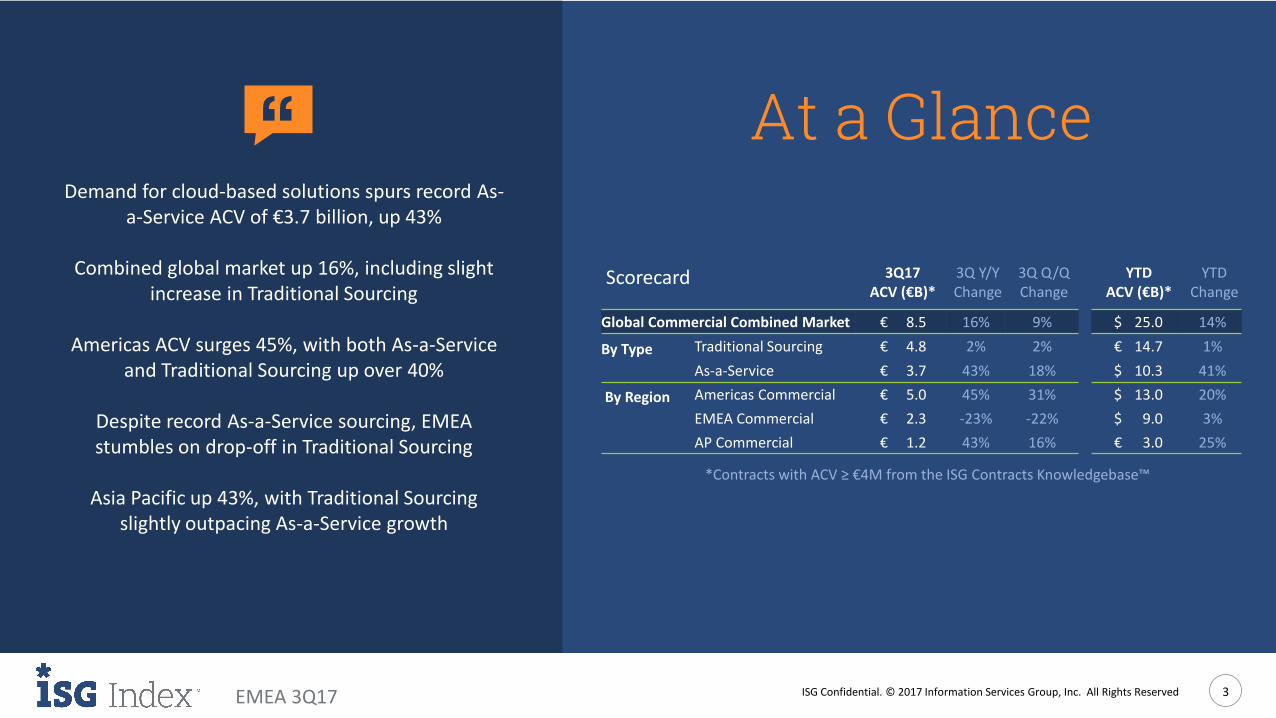
‘‘
*Contracts with ACV ≥ €4M from the ISG Contracts Knowledgebase™
At a GlanceDemand for cloud-based solutions spurs record As-
a-Service ACV of €3.7 billion, up 43%
Combined global market up 16%, including slight increase in Traditional Sourcing
Americas ACV surges 45%, with both As-a-Service and Traditional Sourcing up over 40%
Despite record As-a-Service sourcing, EMEA stumbles on drop-off in Traditional Sourcing
Asia Pacific up 43%, with Traditional Sourcing slightly outpacing As-a-Service growth
Scorecard 3Q17 3Q Y/Y 3Q Q/Q YTD YTD ACV (€B)* Change Change ACV (€B)* Change
Global Commercial Combined Market € 8.5 16% 9% $ 25.0 14%
By Type Traditional Sourcing € 4.8 2% 2% € 14.7 1%
As-a-Service € 3.7 43% 18% $ 10.3 41%
By Region Americas Commercial € 5.0 45% 31% $ 13.0 20%
EMEA Commercial € 2.3 -23% -22% $ 9.0 3%
AP Commercial € 1.2 43% 16% € 3.0 25%
ISG Confidential. © 2017 Information Services Group, Inc. All Rights Reserved 4EMEA 3Q17
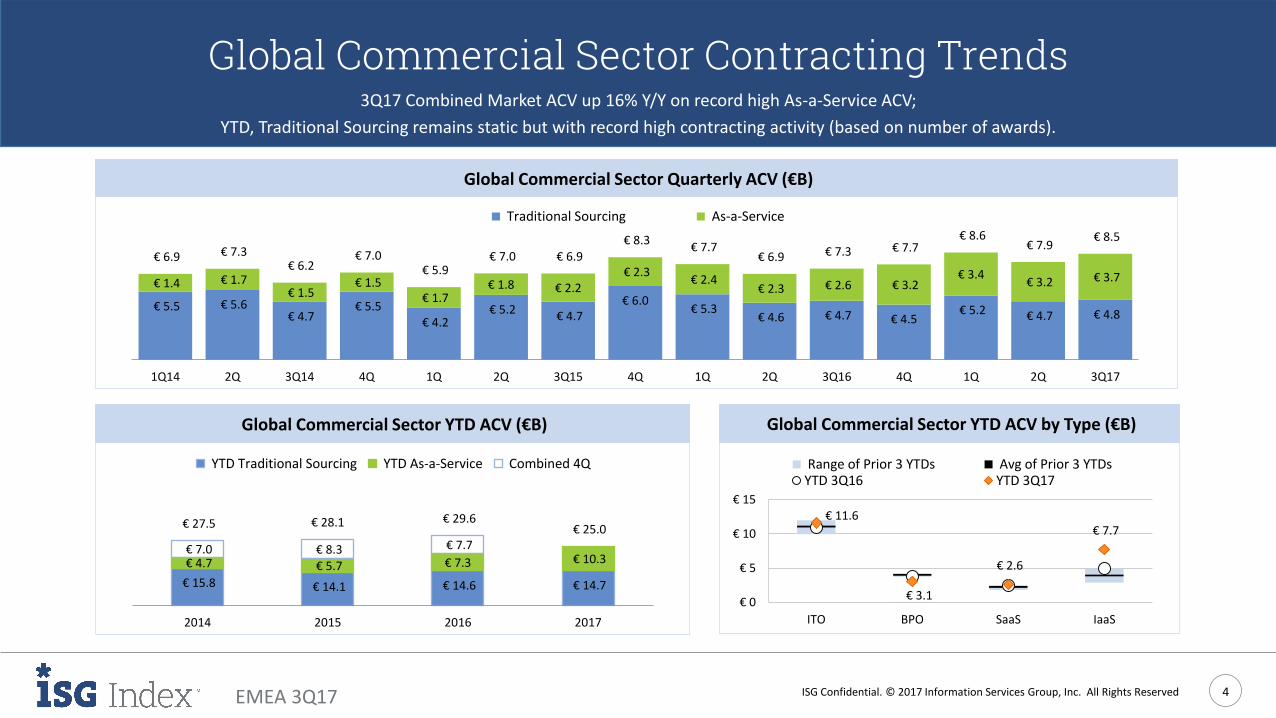
Global Commercial Sector Contracting Trends3Q17 Combined Market ACV up 16% Y/Y on record high As-a-Service ACV;
YTD, Traditional Sourcing remains static but with record high contracting activity (based on number of awards).
Global Commercial Sector Quarterly ACV (€B)
Global Commercial Sector YTD ACV (€B) Global Commercial Sector YTD ACV by Type (€B)
Global Commercial Sector Quarterly ACV (€B)
Global Commercial Sector YTD ACV (€B) Global Commercial Sector YTD ACV by Type (€B)
€ 4.8 € 4.7 € 5.2 € 4.5€ 4.7 € 4.6
€ 5.3 € 6.0
€ 4.7 € 5.2 € 4.2
€ 5.5 € 4.7
€ 5.6 € 5.5
€ 3.7 € 3.2 € 3.4
€ 3.2 € 2.6 € 2.3 € 2.4
€ 2.3 € 2.2 € 1.8
€ 1.7 € 1.5
€ 1.5 € 1.7 € 1.4
€ 8.5 € 7.9
€ 8.6 € 7.7 € 7.3 € 6.9
€ 7.7 € 8.3
€ 6.9 € 7.0 € 5.9
€ 7.0 € 6.2
€ 7.3 € 6.9
3Q172Q1Q4Q3Q162Q1Q4Q3Q152Q1Q4Q3Q142Q1Q14
Traditional Sourcing As-a-Service
€ 14.7 € 14.6 € 14.1 € 15.8
€ 10.3 € 7.3€ 5.7 € 4.7
€ 7.7 € 8.3 € 7.0
€ 25.0 € 29.6 € 28.1€ 27.5
2017201620152014
YTD Traditional Sourcing YTD As-a-Service Combined 4Q
€ 11.6
€ 3.1
€ 2.6
€ 7.7
€ 0
€ 5
€ 10
€ 15
ITO BPO SaaS IaaS
Range of Prior 3 YTDs Avg of Prior 3 YTDsYTD 3Q16 YTD 3Q17
ISG Confidential. © 2017 Information Services Group, Inc. All Rights Reserved 5EMEA 3Q17
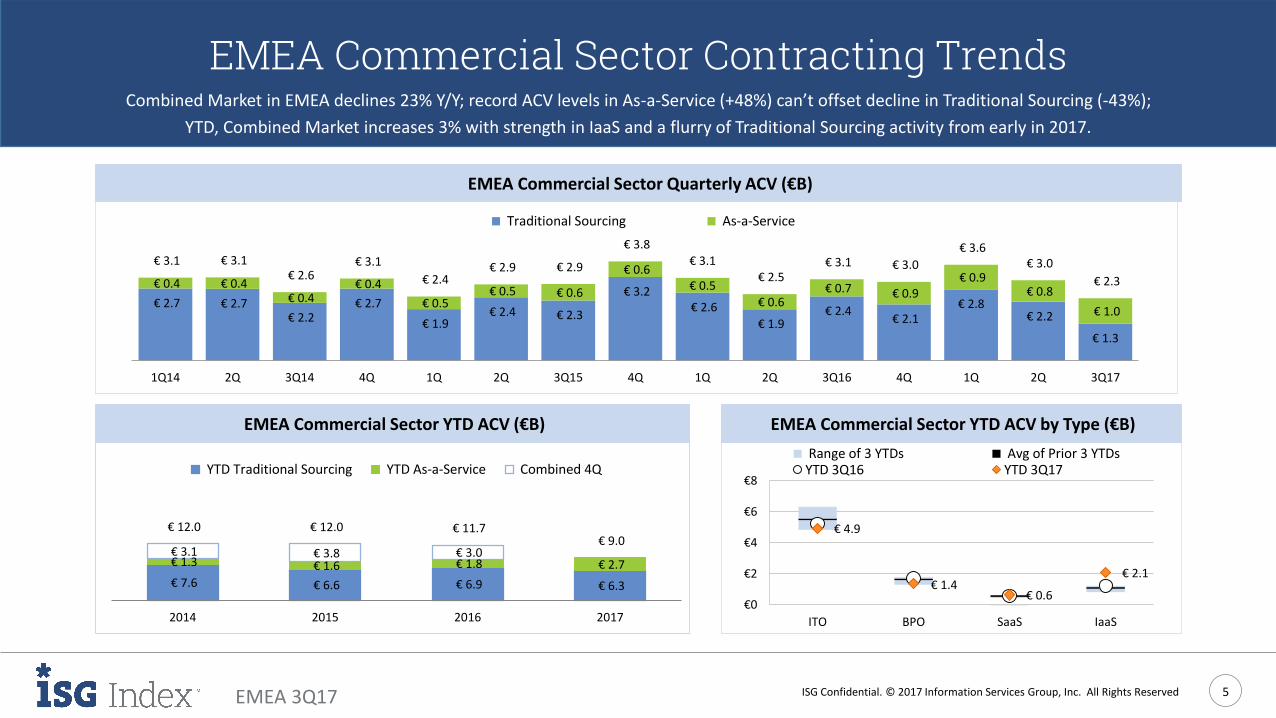
EMEA Commercial Sector Contracting TrendsCombined Market in EMEA declines 23% Y/Y; record ACV levels in As-a-Service (+48%) can’t offset decline in Traditional Sourcing (-43%);
YTD, Combined Market increases 3% with strength in IaaS and a flurry of Traditional Sourcing activity from early in 2017.
EMEA Commercial Sector Quarterly ACV (€B)
EMEA Commercial Sector YTD ACV (€B) EMEA Commercial Sector YTD ACV by Type (€B)
€ 1.3
€ 2.2 € 2.8
€ 2.1 € 2.4
€ 1.9
€ 2.6 € 3.2
€ 2.3 € 2.4 € 1.9
€ 2.7 € 2.2
€ 2.7 € 2.7 € 1.0
€ 0.8 € 0.9
€ 0.9 € 0.7 € 0.6
€ 0.5€ 0.6
€ 0.6 € 0.5 € 0.5
€ 0.4 € 0.4
€ 0.4 € 0.4 € 2.3
€ 3.0 € 3.6
€ 3.0 € 3.1 € 2.5
€ 3.1€ 3.8
€ 2.9 € 2.9 € 2.4
€ 3.1 € 2.6
€ 3.1 € 3.1
3Q172Q1Q4Q3Q162Q1Q4Q3Q152Q1Q4Q3Q142Q1Q14
Traditional Sourcing As-a-Service
€ 6.3 € 6.9 € 6.6 € 7.6
€ 2.7 € 1.8 € 1.6 € 1.3 € 3.0 € 3.8 € 3.1
€ 9.0 € 11.7 € 12.0 € 12.0
2017201620152014
YTD Traditional Sourcing YTD As-a-Service Combined 4Q
€ 4.9
€ 1.4 € 0.6
€ 2.1
€0
€2
€4
€6
€8
ITO BPO SaaS IaaS
Range of 3 YTDs Avg of Prior 3 YTDsYTD 3Q16 YTD 3Q17
ISG Confidential. © 2017 Information Services Group, Inc. All Rights Reserved 6EMEA 3Q17
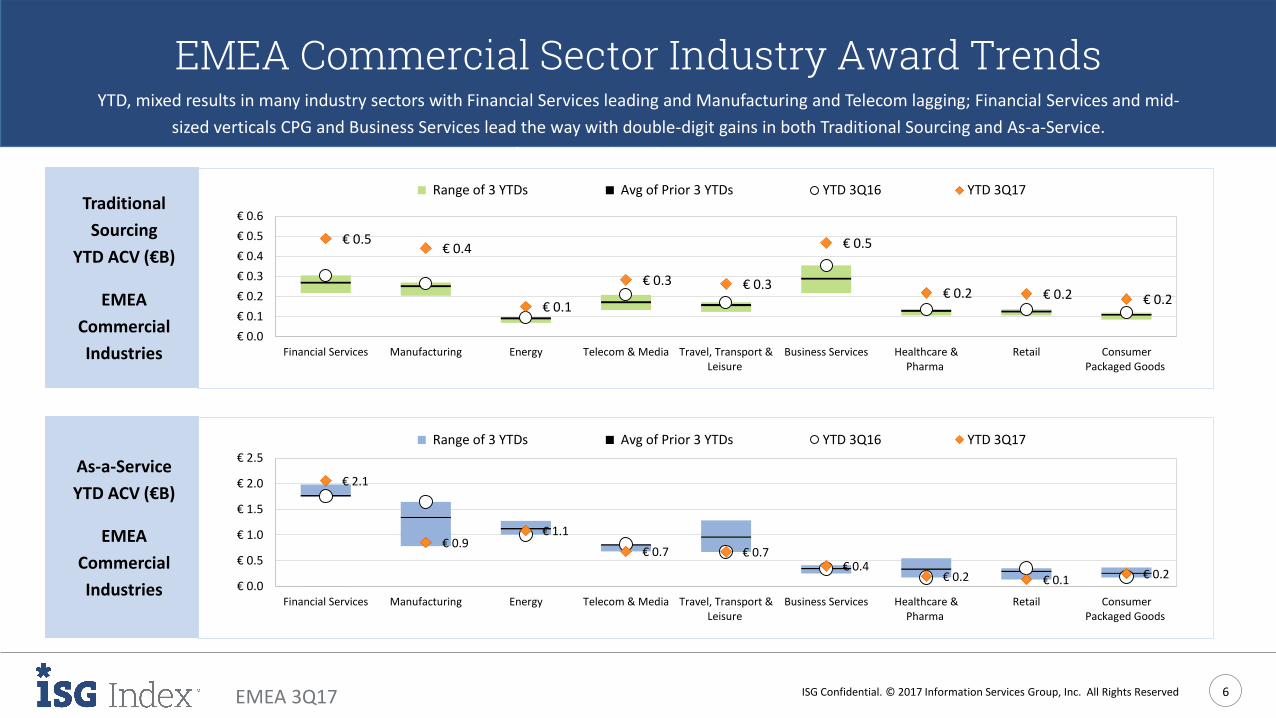
EMEA Commercial Sector Industry Award TrendsYTD, mixed results in many industry sectors with Financial Services leading and Manufacturing and Telecom lagging; Financial Services and mid-
sized verticals CPG and Business Services lead the way with double-digit gains in both Traditional Sourcing and As-a-Service.
Manufacturing and Retail are the exceptions.
Traditional
Sourcing
YTD ACV (€B)
EMEA
Commercial
Industries
As-a-Service
YTD ACV (€B)
EMEA
Commercial
Industries
€ 2.1
€ 0.9 € 1.1
€ 0.7 € 0.7 € 0.4
€ 0.2 € 0.1 € 0.2 € 0.0
€ 0.5
€ 1.0
€ 1.5
€ 2.0
€ 2.5
Financial Services Manufacturing Energy Telecom & Media Travel, Transport &Leisure
Business Services Healthcare &Pharma
Retail ConsumerPackaged Goods
Range of 3 YTDs Avg of Prior 3 YTDs YTD 3Q16 YTD 3Q17
€ 0.5 € 0.4
€ 0.1
€ 0.3 € 0.3
€ 0.5
€ 0.2 € 0.2 € 0.2
€ 0.0
€ 0.1
€ 0.2
€ 0.3
€ 0.4
€ 0.5
€ 0.6
Financial Services Manufacturing Energy Telecom & Media Travel, Transport &Leisure
Business Services Healthcare &Pharma
Retail ConsumerPackaged Goods
Range of 3 YTDs Avg of Prior 3 YTDs YTD 3Q16 YTD 3Q17
ISG Confidential. © 2017 Information Services Group, Inc. All Rights Reserved 7EMEA 3Q17
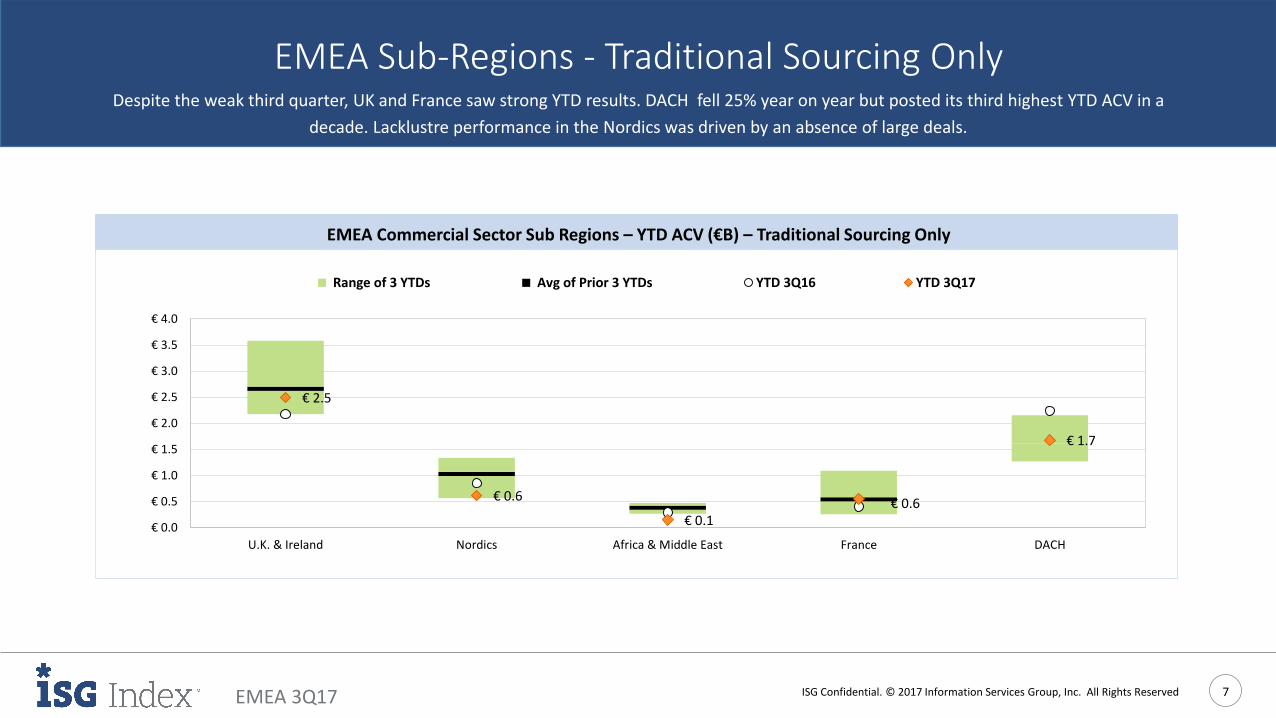
EMEA Sub-Regions - Traditional Sourcing Only Despite the weak third quarter, UK and France saw strong YTD results. DACH fell 25% year on year but posted its third highest YTD ACV in a
decade. Lacklustre performance in the Nordics was driven by an absence of large deals.
EMEA Commercial Sector Sub Regions – YTD ACV (€B) – Traditional Sourcing Only
€ 2.5
€ 0.6
€ 0.1 € 0.6
€ 1.7
€ 0.0
€ 0.5
€ 1.0
€ 1.5
€ 2.0
€ 2.5
€ 3.0
€ 3.5
€ 4.0
U.K. & Ireland Nordics Africa & Middle East France DACH
Range of 3 YTDs Avg of Prior 3 YTDs YTD 3Q16 YTD 3Q17
ISG Confidential. © 2017 Information Services Group, Inc. All Rights Reserved 8EMEA 3Q17
Our Contracts Knowledgebase™is used to determine placements
based on the annual value of commercial contracts
awarded in the past 12 months.
Traditional Sourcing MarketAdare Group
Coor Service ManagementEulen
Firstsource SolutionsHexaware
IbykusKMD
LuxoftMAYKORNNIT A/SVirtusaWNS
As-a-Service MarketInterxionLogMeIn
OVH
Traditional Sourcing MarketAtentoCapita
CarillionDiebold Nixdorf
EVRYHCL
InterserveOrange Business Services
Sopra SteriaTech Mahindra
TietoWipro
As-a-Service MarketAdobe Systems
EquinixUnited Internet
Traditional Sourcing MarketAccenture
AtosBT
CapgeminiCognizant
DXC TechnologyIBM
InfosysTCS
T-Systems
As-a-Service MarketAmazon Web Services
GoogleMicrosoft
OracleSAP
The Building 15 The Breakthrough 15The Big 15Co. Revenues > $10 BSourcing Standouts
EMEACo. Revenues $1 -10 B Co. Revenues < $1 B
Providers in alphabetical order; no rankings implied. Revenues sourced from Hoovers and individual company financial fillings.
theISG15
ISG Confidential. © 2017 Information Services Group, Inc. All Rights Reserved 9EMEA 3Q17
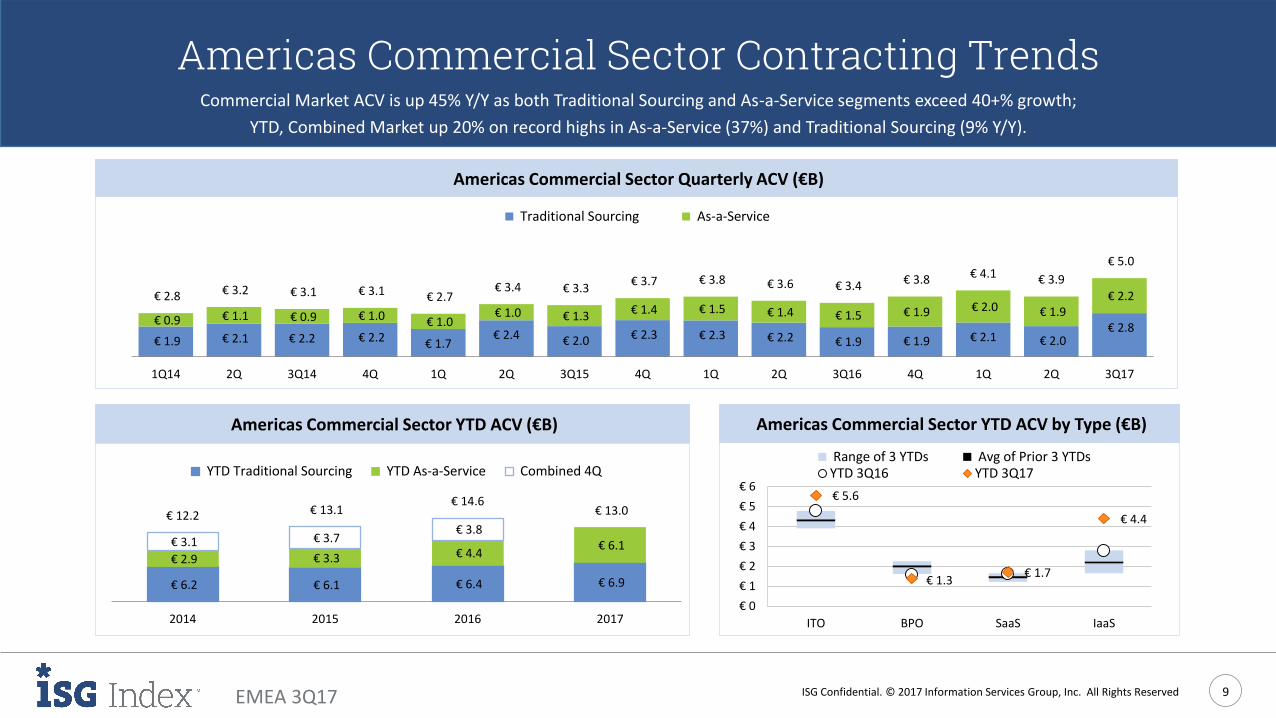
Americas Commercial Sector Contracting TrendsCommercial Market ACV is up 45% Y/Y as both Traditional Sourcing and As-a-Service segments exceed 40+% growth;
YTD, Combined Market up 20% on record highs in As-a-Service (37%) and Traditional Sourcing (9% Y/Y).
Americas Commercial Sector Quarterly ACV (€B)
Americas Commercial Sector YTD ACV (€B) Americas Commercial Sector YTD ACV by Type (€B)
€ 2.8 € 2.0 € 2.1€ 1.9 € 1.9 € 2.2 € 2.3 € 2.3 € 2.0 € 2.4
€ 1.7€ 2.2 € 2.2€ 2.1 € 1.9
€ 2.2 € 1.9 € 2.0 € 1.9 € 1.5 € 1.4 € 1.5 € 1.4 € 1.3 € 1.0
€ 1.0 € 1.0 € 0.9 € 1.1 € 0.9
€ 5.0
€ 3.9€ 4.1€ 3.8 € 3.4 € 3.6 € 3.8 € 3.7 € 3.3 € 3.4
€ 2.7 € 3.1 € 3.1 € 3.2 € 2.8
3Q172Q1Q4Q3Q162Q1Q4Q3Q152Q1Q4Q3Q142Q1Q14
Traditional Sourcing As-a-Service
€ 6.9 € 6.4 € 6.1 € 6.2
€ 6.1 € 4.4 € 3.3 € 2.9
€ 3.8 € 3.7 € 3.1
€ 13.0 € 14.6
€ 13.1 € 12.2
2017201620152014
YTD Traditional Sourcing YTD As-a-Service Combined 4Q
€ 5.6
€ 1.3€ 1.7
€ 4.4
€ 0
€ 1
€ 2
€ 3
€ 4
€ 5
€ 6
ITO BPO SaaS IaaS
Range of 3 YTDs Avg of Prior 3 YTDsYTD 3Q16 YTD 3Q17
ISG Confidential. © 2017 Information Services Group, Inc. All Rights Reserved 10EMEA 3Q17
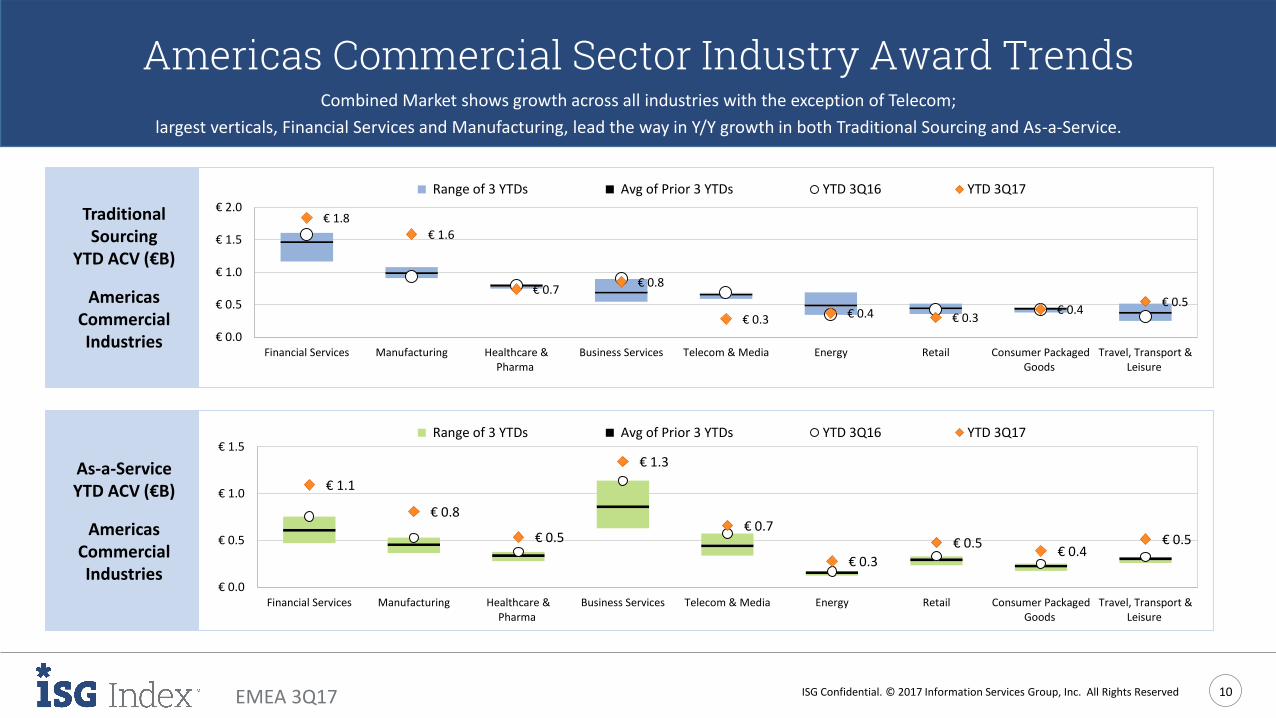
Americas Commercial Sector Industry Award TrendsCombined Market shows growth across all industries with the exception of Telecom;
largest verticals, Financial Services and Manufacturing, lead the way in Y/Y growth in both Traditional Sourcing and As-a-Service.
Traditional Sourcing
YTD ACV (€B)
Americas Commercial Industries
As-a-ServiceYTD ACV (€B)
Americas Commercial Industries
€ 1.8 € 1.6
€ 0.7 € 0.8
€ 0.3 € 0.4 € 0.3 € 0.4
€ 0.5
€ 0.0
€ 0.5
€ 1.0
€ 1.5
€ 2.0
Financial Services Manufacturing Healthcare &Pharma
Business Services Telecom & Media Energy Retail Consumer PackagedGoods
Travel, Transport &Leisure
Range of 3 YTDs Avg of Prior 3 YTDs YTD 3Q16 YTD 3Q17
€ 1.1
€ 0.8
€ 0.5
€ 1.3
€ 0.7
€ 0.3
€ 0.5 € 0.4
€ 0.5
€ 0.0
€ 0.5
€ 1.0
€ 1.5
Financial Services Manufacturing Healthcare &Pharma
Business Services Telecom & Media Energy Retail Consumer PackagedGoods
Travel, Transport &Leisure
Range of 3 YTDs Avg of Prior 3 YTDs YTD 3Q16 YTD 3Q17
ISG Confidential. © 2017 Information Services Group, Inc. All Rights Reserved 11EMEA 3Q17
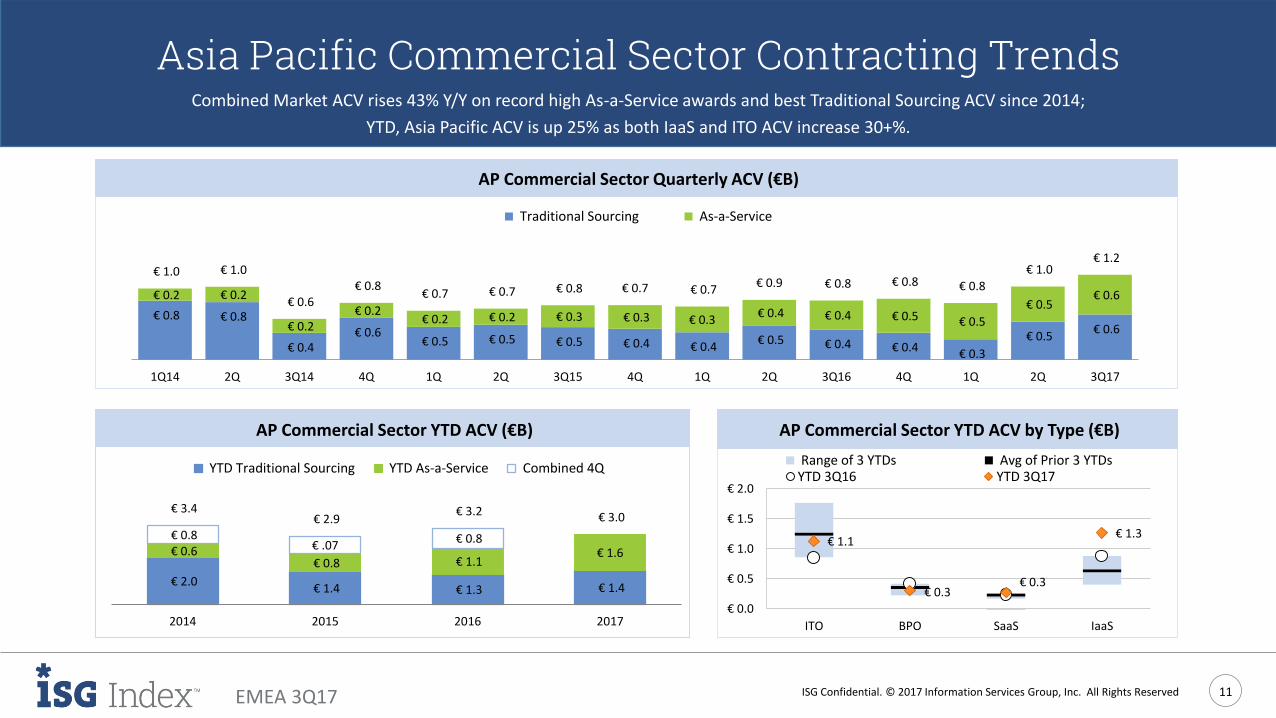
Asia Pacific Commercial Sector Contracting TrendsCombined Market ACV rises 43% Y/Y on record high As-a-Service awards and best Traditional Sourcing ACV since 2014;
YTD, Asia Pacific ACV is up 25% as both IaaS and ITO ACV increase 30+%.
AP Commercial Sector Quarterly ACV (€B)
AP Commercial Sector YTD ACV (€B) AP Commercial Sector YTD ACV by Type (€B)
€ 1.1
€ 0.3€ 0.3
€ 1.3
€ 0.0
€ 0.5
€ 1.0
€ 1.5
€ 2.0
ITO BPO SaaS IaaS
Range of 3 YTDs Avg of Prior 3 YTDsYTD 3Q16 YTD 3Q17
€ 1.4 € 1.3 € 1.4 € 2.0
€ 1.6€ 1.1 € 0.8
€ 0.6 € 0.8
€ .07€ 0.8
€ 3.0 € 3.2 € 2.9
€ 3.4
2017201620152014
YTD Traditional Sourcing YTD As-a-Service Combined 4Q
€ 0.6 € 0.5
€ 0.3 € 0.4 € 0.4 € 0.5 € 0.4 € 0.4 € 0.5 € 0.5 € 0.5
€ 0.6 € 0.4
€ 0.8 € 0.8
€ 0.6 € 0.5
€ 0.5 € 0.5 € 0.4 € 0.4 € 0.3€ 0.3 € 0.3 € 0.2 € 0.2
€ 0.2 € 0.2
€ 0.2 € 0.2
€ 1.2 € 1.0
€ 0.8 € 0.8 € 0.8 € 0.9€ 0.7 € 0.7€ 0.8 € 0.7 € 0.7
€ 0.8 € 0.6
€ 1.0 € 1.0
3Q172Q1Q4Q3Q162Q1Q4Q3Q152Q1Q4Q3Q142Q1Q14
Traditional Sourcing As-a-Service
ISG Confidential. © 2017 Information Services Group, Inc. All Rights Reserved 12EMEA 3Q17
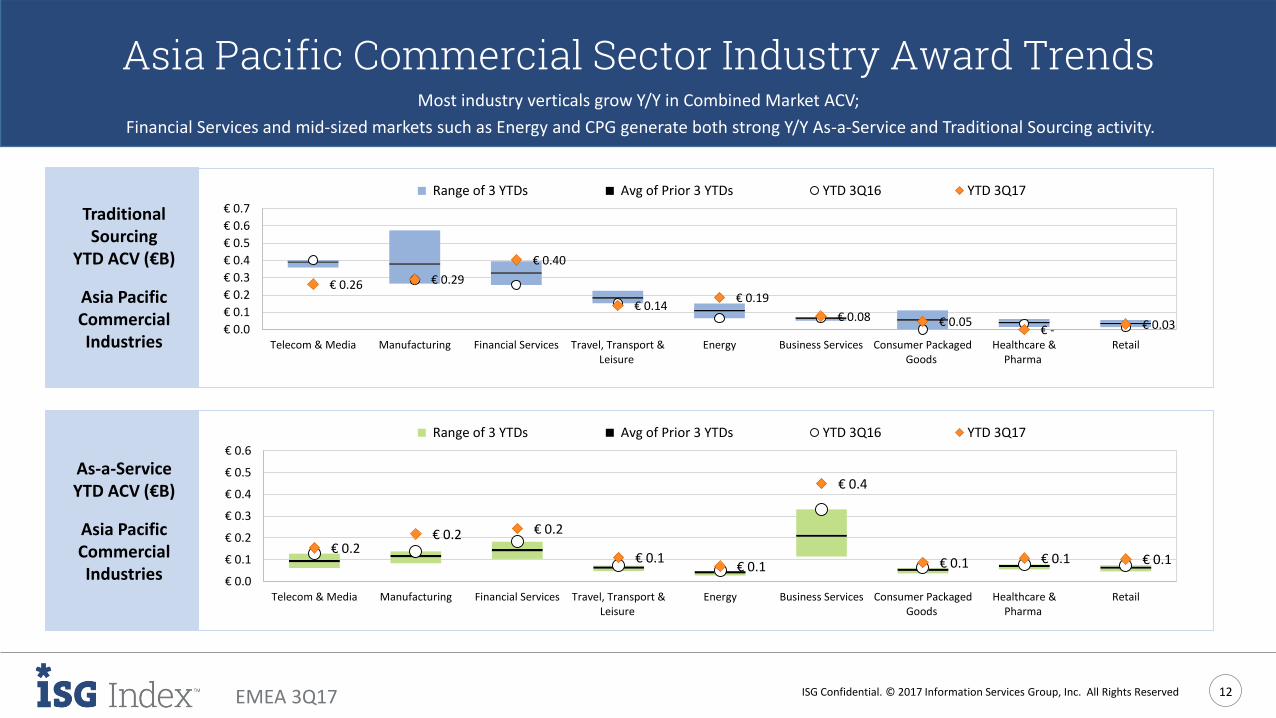
Asia Pacific Commercial Sector Industry Award TrendsMost industry verticals grow Y/Y in Combined Market ACV;
Financial Services and mid-sized markets such as Energy and CPG generate both strong Y/Y As-a-Service and Traditional Sourcing activity.
Traditional Sourcing
YTD ACV (€B)
Asia Pacific Commercial Industries
As-a-ServiceYTD ACV (€B)
Asia Pacific Commercial Industries
€ 0.26 € 0.29
€ 0.40
€ 0.14 € 0.19
€ 0.08 € 0.05 € - € 0.03 € 0.0
€ 0.1
€ 0.2
€ 0.3
€ 0.4
€ 0.5
€ 0.6
€ 0.7
Telecom & Media Manufacturing Financial Services Travel, Transport &Leisure
Energy Business Services Consumer PackagedGoods
Healthcare &Pharma
Retail
Range of 3 YTDs Avg of Prior 3 YTDs YTD 3Q16 YTD 3Q17
€ 0.2 € 0.2 € 0.2
€ 0.1 € 0.1
€ 0.4
€ 0.1 € 0.1 € 0.1
€ 0.0
€ 0.1
€ 0.2
€ 0.3
€ 0.4
€ 0.5
€ 0.6
Telecom & Media Manufacturing Financial Services Travel, Transport &Leisure
Energy Business Services Consumer PackagedGoods
Healthcare &Pharma
Retail
Range of 3 YTDs Avg of Prior 3 YTDs YTD 3Q16 YTD 3Q17
EMEA 3Q17
The Rapidly Transforming Digital Contact Center
Wayne ButterfieldDirector – Cognitive & AI Innovation and Automation
3Q17 Index Inside Track from
ISG Confidential. © 2017 Information Services Group, Inc. All Rights Reserved 14EMEA 3Q17
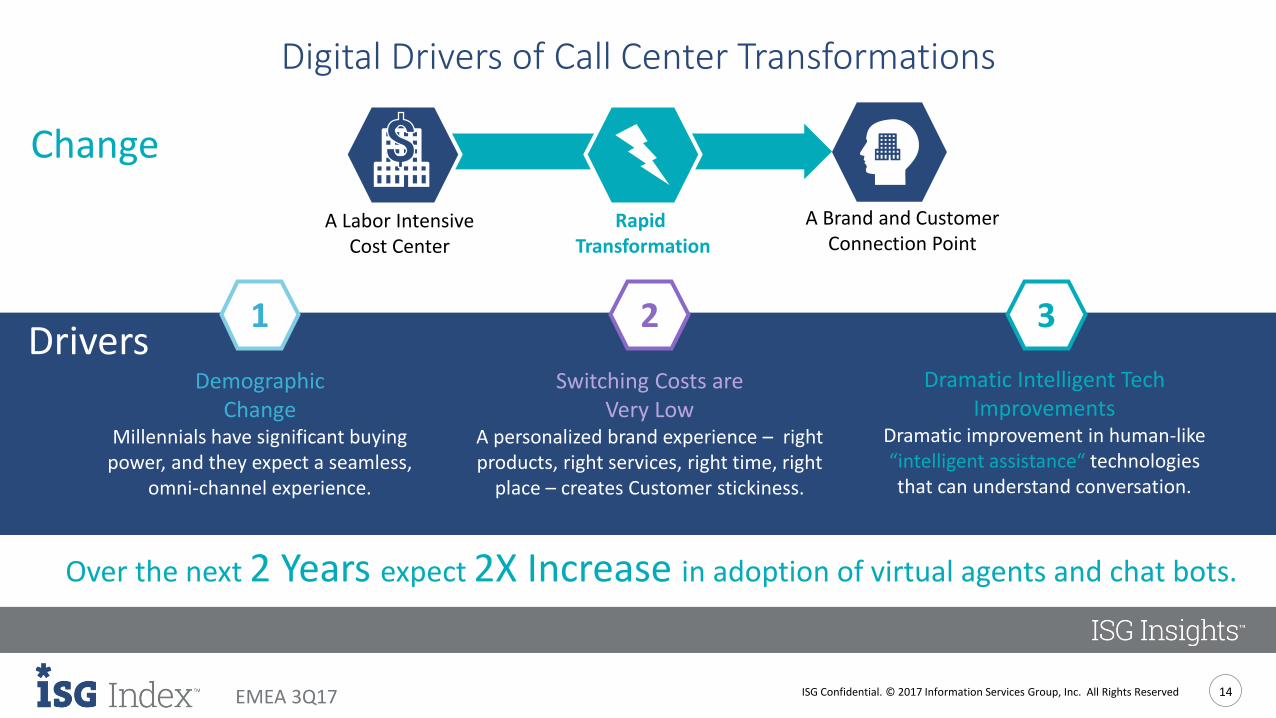
Digital Drivers of Call Center Transformations
A Labor IntensiveCost Center
A Brand and CustomerConnection Point
DemographicChange
Millennials have significant buying power, and they expect a seamless,
omni-channel experience.
Switching Costs areVery Low
A personalized brand experience – right products, right services, right time, right
place – creates Customer stickiness.
Dramatic Intelligent Tech Improvements
Dramatic improvement in human-like “intelligent assistance“ technologiesthat can understand conversation.
321
Over the next 2 Years expect 2X Increase in adoption of virtual agents and chat bots.
Rapid Transformation
Drivers
Change
ISG Confidential. © 2017 Information Services Group, Inc. All Rights Reserved 15EMEA 3Q17
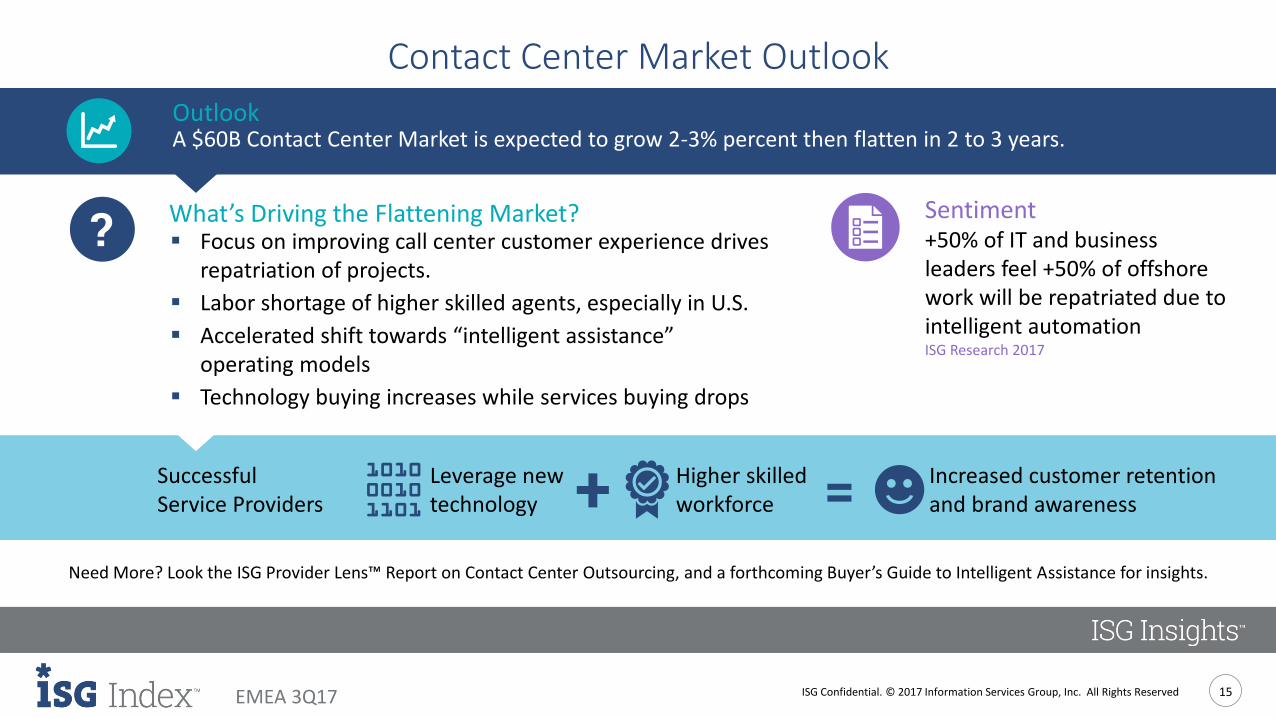
Contact Center Market Outlook
A $60B Contact Center Market is expected to grow 2-3% percent then flatten in 2 to 3 years.
Sentiment+50% of IT and business leaders feel +50% of offshore work will be repatriated due to intelligent automation ISG Research 2017
▪ Focus on improving call center customer experience drives repatriation of projects.
▪ Labor shortage of higher skilled agents, especially in U.S.
▪ Accelerated shift towards “intelligent assistance” operating models
▪ Technology buying increases while services buying drops
Higher skilledworkforce
What’s Driving the Flattening Market?
Outlook
Leverage new technology
SuccessfulService Providers
Increased customer retention and brand awareness
Need More? Look the ISG Provider Lens™ Report on Contact Center Outsourcing, and a forthcoming Buyer’s Guide to Intelligent Assistance for insights.
ISG Confidential. © 2017 Information Services Group, Inc. All Rights Reserved 16EMEA 3Q17
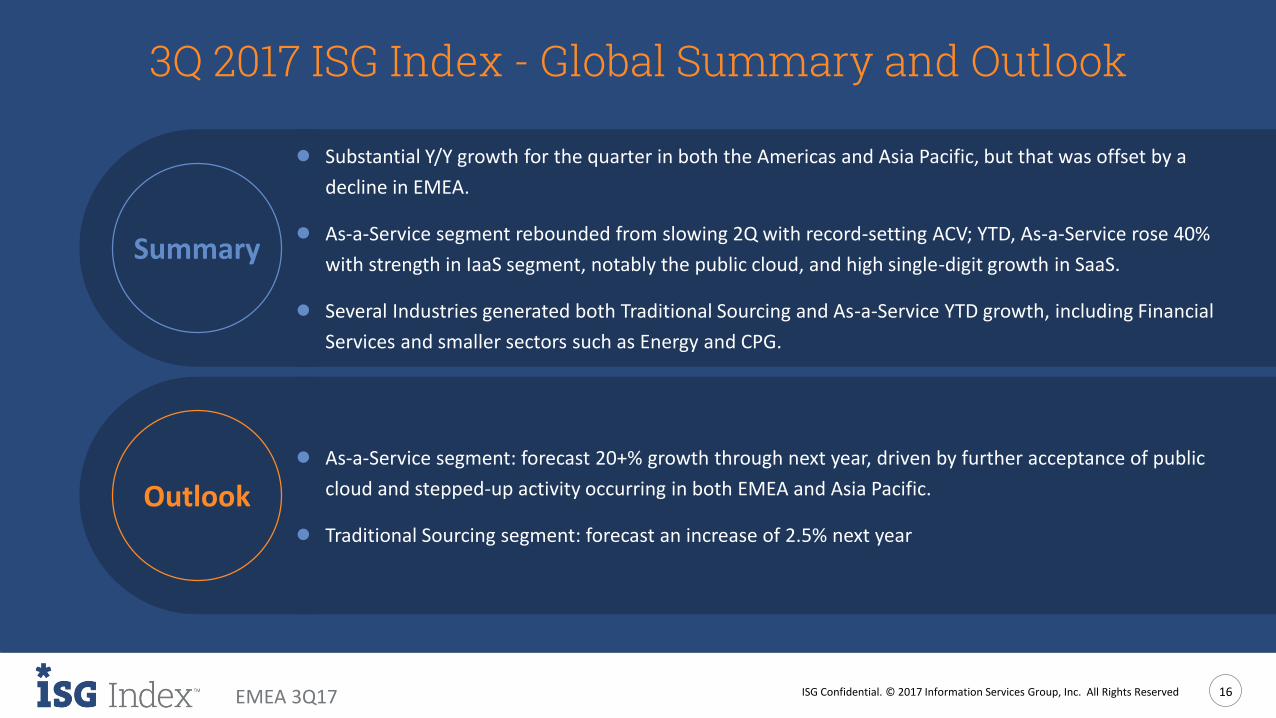
3Q 2017 ISG Index - Global Summary and Outlook
● Substantial Y/Y growth for the quarter in both the Americas and Asia Pacific, but that was offset by a
decline in EMEA.
● As-a-Service segment rebounded from slowing 2Q with record-setting ACV; YTD, As-a-Service rose 40%
with strength in IaaS segment, notably the public cloud, and high single-digit growth in SaaS.
● Several Industries generated both Traditional Sourcing and As-a-Service YTD growth, including Financial
Services and smaller sectors such as Energy and CPG.
● As-a-Service segment: forecast 20+% growth through next year, driven by further acceptance of public
cloud and stepped-up activity occurring in both EMEA and Asia Pacific.
● Traditional Sourcing segment: forecast an increase of 2.5% next year
Summary
Outlook
ISG Confidential. © 2017 Information Services Group, Inc. All Rights Reserved 17EMEA 3Q17
isg-one.com
Learn More
Barry Matthews Partner
+44 7881 954 [email protected]
Tara BenhamCohn & Wolfe for ISG+44 (0) 20 7331 5395
Denise Colgan EMEA and AP Media Contact
+44 1737 [email protected]
Esteban HerreraPartner, Global Leader
ISG Research+1 203 820 8987
Paul ReynoldsPartner, Chief Research Officer
ISG Momentum+1 508 625 2194
GLOBAL 4Q16
EMEA 3Q17
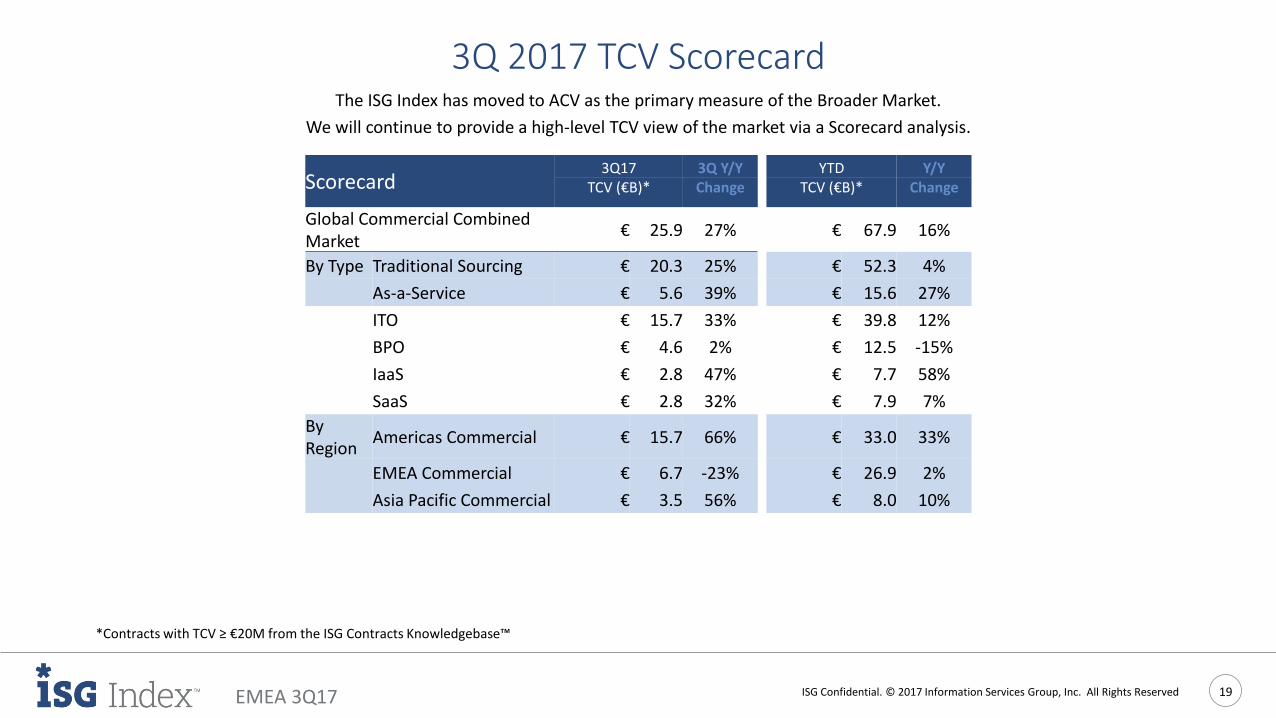
Appendix: Score Card for TCVTHIRD QUARTER 2017
ISG Confidential. © 2017 Information Services Group, Inc. All Rights Reserved 19EMEA 3Q17
3Q 2017 TCV ScorecardThe ISG Index has moved to ACV as the primary measure of the Broader Market.
We will continue to provide a high-level TCV view of the market via a Scorecard analysis.
*Contracts with TCV ≥ €20M from the ISG Contracts Knowledgebase™
Scorecard3Q17 3Q Y/Y YTD Y/Y
TCV (€B)* Change TCV (€B)* Change
Global Commercial Combined Market
€ 25.9 27% € 67.9 16%
By Type Traditional Sourcing € 20.3 25% € 52.3 4%
As-a-Service € 5.6 39% € 15.6 27%
ITO € 15.7 33% € 39.8 12%
BPO € 4.6 2% € 12.5 -15%
IaaS € 2.8 47% € 7.7 58%
SaaS € 2.8 32% € 7.9 7%
By Region
Americas Commercial € 15.7 66% € 33.0 33%
EMEA Commercial € 6.7 -23% € 26.9 2%
Asia Pacific Commercial € 3.5 56% € 8.0 10%
ISG Confidential. © 2017 Information Services Group, Inc. All Rights Reserved.
Proprietary and Confidential. No part of this document may be reproduced in any form or by any electronic
or mechanical means, including information storage and retrieval devices or systems, without prior written
permission from Information Services Group, Inc.isg-one.com
ISG (Information Services Group) (NASDAQ: III) is a leading global technology research and advisory
firm. A trusted business partner to more than 700 clients, including 75 of the top 100 enterprises in the
world, ISG is committed to helping corporations, public sector organizations, and service and technology
providers achieve operational excellence and faster growth. The firm specializes in digital
transformation services, including automation, cloud and data analytics; sourcing advisory; managed
governance and risk services; network carrier services; technology strategy and operations design;
change management; market intelligence and technology research and analysis. Founded in 2006, and
based in Stamford, Conn., ISG employs more than 1,300 professionals operating in more than 20
countries—a global team known for its innovative thinking, market influence, deep industry and
technology expertise, and world-class research and analytical capabilities based on the industry’s most
comprehensive marketplace data.
Recommended