Jordan Journal of Chemistry Vol. 7 No.4, 2012, pp. 349-363
349
JJC
Persistent Organic Pollutants in Soil Samples from Industrial Vicinity East of Zarqa City, Jordan
Ibrahim Tarawneh, Yahya Kusbe, Mahmoud Alawi∗
Faculty of Science, Department of Chemistry, University of Jordan, Amman-11942, Jordan.
Received on June 2, 2012 Accepted on Nov. 12, 2012
Abstract The levels of 13 Polyaromatic hydrocarbons (PAHs) and 12 Polychlorinated biphenyls
(PCBs) were determined in 23 soil samples collected from the vicinity of the Jordan petroleum
refinery and Al-Hussein thermal power stations in Zarqa region. The total concentrations of
PAHs were ranged between 0.94 µg/kg (site 13) and 191 µg/kg (site 19), while none of the
samples was containing any of the studied PCBs. Recoveries of PAHs and PCBs were found
between 82 -106% and 91-114% respectively. Precision of the method for both PAHs and
PCBs, calculated as relative standard deviation (RSD) was ranged between 0.6 – 7%. The limit
of detection for PAHs and PCBs were between 0.006- 0.070 µg/kg and 0.149-0.330 µg/kg
respectively. The total estimated cancer risks of exposure to PAHs in the soil samples were
ranged from 8.56 × 10⁻⁹ to 5.53 × 10⁻⁶. By multiplying these numbers of cancer risks of
exposure to soil sample-PAHs by 106, it is possible to determine the maximum theoretical
number of cancer cases per million of people. The maximum estimated cancer risks cases
determined in this study (6 out of million) are well within the acceptable range of excess cancer
risk specified by the US Environmental Protection Agency. In general, the studied area shows
very low pollution level.
Keywords: Cancer risk; Jordan; PAHs; PCBs; Soil; Zarqa.
Introduction Petrochemical industries have been identified as important emission sources of
environmental pollutants. Significant amounts of organic contaminants such as volatile
organic compounds, polyaromatic hydrocarbons (PAHs) and polychlorinated biphenyls
(PCBs) have been also detected in the environment. In turn, some epidemiological
studies have pointed out the possibility that the presence of this kind of facilities could
induce leukemia, as well as bone, brain, and bladder cancers [1].
Soil pollution is increasingly become a large problem which confront the humans
since the industrial revolution. Before soil pollution can be stopped, the sources of
pollution must be identified. The major sources of soil pollution are Persistent Organic
Pollutants (POPs) like polychlorinated biphenyls (PCBs) and polyaromatic
hydrocarbons (PAHs). Those POPs are ubiquitous environmental contaminants
derived from incomplete combustion of organic materials, e.g.: fossil fuels including
∗ Corresponding author: E-mail: [email protected], Phone: +962 777483679, Fax: +962 65300253.

350
petroleum refining. POPs are becoming more and more pressing on the environment
because of the growing population [2].
PCBs became available as industrial chemicals since 1930, their widespread
application in the subsequent 50 years, has resulted in their presence as persistent
and ubiquitous environmental contaminants and/or pollutants. Their potential
carcinogenic, mutagenic, teratogenic effects, their high chemical stability and
lipophilicity, and thus consequent bioaccumulation, have made their monitoring very
important in environmental research [3, 4, 5].
PCBs were commercially produced as complex mixtures at the beginning of
1929 and continued up to l970s. The production by Monsanto, the major world
manufacturer, was ceased in 1977. All of the commercial mixtures were synthesized
by direct chlorination of biphenyl with chlorine gas in the presence of AlCl3. And it has
been found that the average degree of chlorination was controlled by the reaction
conditions to yield the desired physical and chemical properties [6]. Since PCBs are
relatively nonflammable and have useful heat exchange and dielectric properties, they
have been used in a wide variety of applications [7, 8, 9].
According to literature the optimal value of dioxins/furans and PCBs for a soil
should be below 5 ng WHO-TEQ/ kg. Values greater than 100 ng WHO-TEQ/ kg are
considerd relatively high and reduces the possibility of using the soil, due to
contamination and level of toxicity [10].
PAHs are ubiquitous environmental contaminants derived from the incomplete
combustion of organic materials, e.g. any kind of fossil fuels. Due to carcinogenic and
mutagenic activity of many representatives of this group of compounds, PAHs pollution
has become a serious environmental problem. That is why the concentration of PAHs
in all compartments of the environment, i.e., water, soil and air, is regulated in most
countries of the world. Many PAHs are included in the “priority pollutants” listing of the
US EPA and European Commission (Regulation EC No 166/2006). Usually, solid
wastes contain hazardous trace compounds, including PAHs as a specific group of
POPs include a wide range of compounds: carboxylic and heterocyclic, substituted and
non-substituted homologues. For simplification of the analysis and regulation purposes
it was reasonable to select a set of priority pollutants of PAHs, to which the criteria
were stated [11].
One of the most important properties of PAHs concerning the analytical
determination appears to be the water solubility. As a rule, PAHs water solubility
decreases (and hydrophobic interaction increases) with the increase in the number of
fused benzene rings, and with angularity. Thus, high-molecular mass compounds are
more slowly desorbed from the matrix and dissolved in an appropriate solvent than
low-molecular mass PAHs. Volatilization generally decreases with increasing the
number of fused rings [http://www.ispac.org/Links.htm]. Risk assessment can be
evaluated by incremental lifetime cancer risk (ILCR) associated with exposures to

351
PAHs in soil samples using the US EPA standard models. The cancer risk was
assessed based on exposure according to type of land over the entire lifetime [12, 13, 14].
This study aims to give both qualitative and quantitative information and
establishing a base line data for POPs pollutants at the vicinity of the Jordan petroleum
refinery and Al-Hussein Thermal power station which are located in Zarqa region ca.
35 km northeast of the Capital Amman.
Materials and Methods Chemicals and Reagents
A standard mixture of PCBs containing the following 12 PCB congeners:
(1) 3, 3’, 4, 4’-Tetrachlorobiphenyl (PCB-77)
(2) 3, 4, 4’, 5-Tetrachlorobiphenyl (PCB-81)
(3) 2, 3, 3’, 4, 4’-Pentachlorobiphenyl (PCB-105)
(4) 2, 3, 4, 4’, 5-Pentachlorobiphenyl (PCB-114)
(5) 2, 3’, 4, 4’, 5-Pentachlorobiphenyl (PCB-118)
(6) 2', 3, 4, 4’, 5-Pentachlorobiphenyl (PCB-123)
(7) 3, 3’, 4, 4’, 5-Pentachlorobiphenyl (PCB-126)
(8) 2, 3, 3’, 4, 4’, 5-Hexachlorobiphenyl (PCB-156) (9) 2, 3, 3’, 4, 4’, 5’-Hexachlorobiphenyl (PCB-157)
(10) 2, 3’, 4, 4’, 5, 5’-Hexachlorobiphenyl (PCB-167)
(11) 3, 3’, 4, 4’, 5, 5’-Hexachlorobiphenyl (PCB-169) (12) 2, 3, 3’, 4, 4’, 5, 5’-Heptachlorobiphenyl (PCB189) was purchased from Dr. Ehrenstorfer (Augsburg, Germany), and a standard mixture of
PAHs containing the following 13 compounds: Acenaphthylene, Fluorene,
Phenanthrene, Anthracene, Pyrene, Benzo(a)anthracene, Chrysene, Benzo-
(b)fluoranthene, Benzo(k)fluoranthene, Benzo(a)pyrene, Indeno(1,2,3 cd)pyrene,
Dibenzo(a,h)anthracene, Benzo(g,h,i)perylene was purchased from Supelco (USA).
The internal standards 1, 8- dichloronaphthalene (1 mg/L) which was used for the
analysis of PCB and 1-fluoronaphthalene (1mg/L) which was used for the PAH-
analysis were purchased from Aldrich (USA).
The Silica Gel 60 and aluminum oxide (alumina B super I) chromatography
grade were purchased from ICN (Eschwege, Germany), Florisil (60 - 100 mesh) for
chromatography was purchased from SDS (Peypin, France). All adsorbent materials
were dried at 220oC prior to use. The following solvents of GC- grade were purchased
from Riedel-de Haën (Germany) and used as received: n-hexane, toluene and
dichloromethane.
Sampling and Sample Locations
Twenty three samples were collected from the area around the Jordan Petroleum
Refinery and Al-Hussein thermal power station in Zarqa as shown in figure 1. The
sampling locations were ca. 100 m apart from each other. Each sample consists of 5-8
portions, each of ca. 100 g was taken within an area of ca. 4 m2 and from a depth of
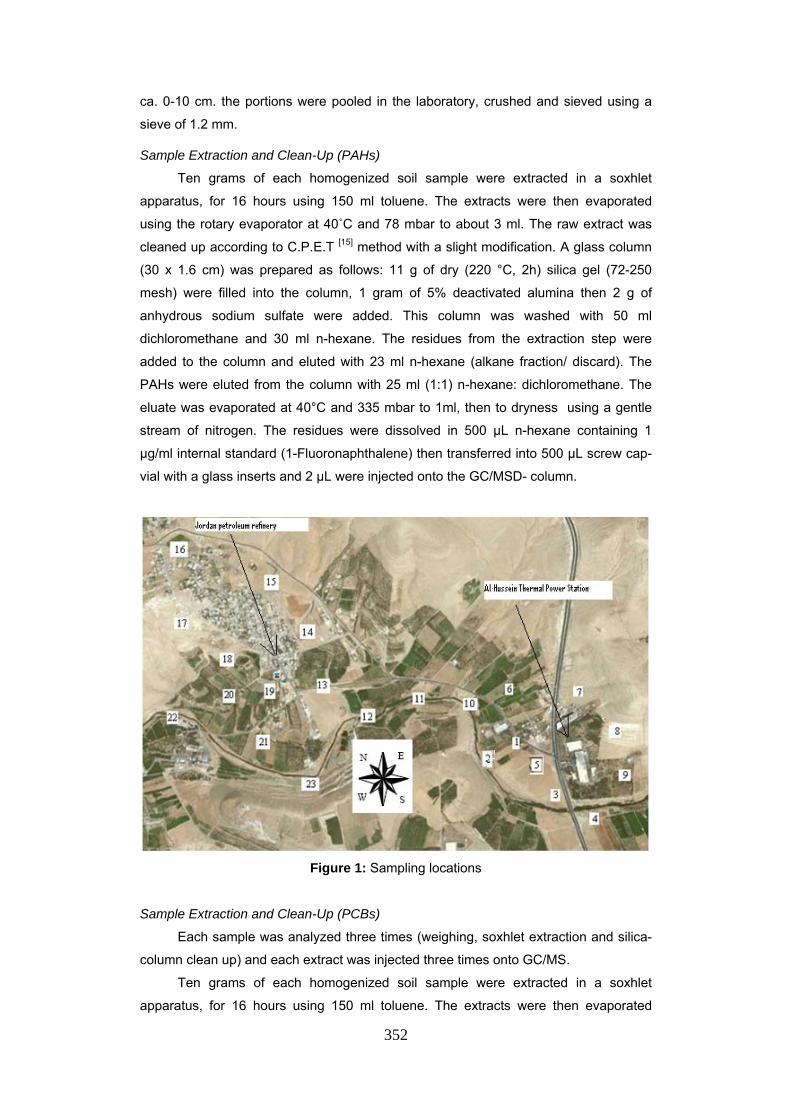
352
ca. 0-10 cm. the portions were pooled in the laboratory, crushed and sieved using a
sieve of 1.2 mm.
Sample Extraction and Clean-Up (PAHs)
Ten grams of each homogenized soil sample were extracted in a soxhlet
apparatus, for 16 hours using 150 ml toluene. The extracts were then evaporated
using the rotary evaporator at 40˚C and 78 mbar to about 3 ml. The raw extract was
cleaned up according to C.P.E.T [15] method with a slight modification. A glass column
(30 x 1.6 cm) was prepared as follows: 11 g of dry (220 °C, 2h) silica gel (72-250
mesh) were filled into the column, 1 gram of 5% deactivated alumina then 2 g of
anhydrous sodium sulfate were added. This column was washed with 50 ml
dichloromethane and 30 ml n-hexane. The residues from the extraction step were
added to the column and eluted with 23 ml n-hexane (alkane fraction/ discard). The
PAHs were eluted from the column with 25 ml (1:1) n-hexane: dichloromethane. The
eluate was evaporated at 40°C and 335 mbar to 1ml, then to dryness using a gentle
stream of nitrogen. The residues were dissolved in 500 µL n-hexane containing 1
µg/ml internal standard (1-Fluoronaphthalene) then transferred into 500 µL screw cap-
vial with a glass inserts and 2 µL were injected onto the GC/MSD- column.
Figure 1: Sampling locations
Sample Extraction and Clean-Up (PCBs)
Each sample was analyzed three times (weighing, soxhlet extraction and silica-
column clean up) and each extract was injected three times onto GC/MS.
Ten grams of each homogenized soil sample were extracted in a soxhlet
apparatus, for 16 hours using 150 ml toluene. The extracts were then evaporated

353
using the rotary evaporator at 40⁰C and 78 mbar to about 3 ml. The raw extract was
cleaned up according to Wenzel method [16] with slight modification. A glass column
(30 x 1.6 cm) was filled in the following order: 11 g of dry (220 °C, 2h) florisil (60-100
mesh) then 2 g of anhydrous sodium sulfate. This column was washed with 20 ml of a
mixture of (1:1) dichloromethane: n-hexane. The residues from the extraction step
were added to the column and eluted with 150 mL of the above mixture. The eluate
was evaporated at 40°C and 335 mbar to ca. 1ml, then to dryness using a gentle
stream of nitrogen and reconstituted in 500 µL n-hexane containing 1µg/mL internal
standard (2,8-dichloronaphthalene), then transferred into 500 µL screw cap-vial with a
glass inserts and 2 µl were injected onto the GC-MSD column.
Chromatographic Conditions and MS-Detection
The GC-MS analysis was carried out using an HP 6890 gas chromatograph and
an HP 5973 quadrupole mass spectrometer from Agilent Technologies (Waldbronn,
Germany). For chromatographic separation a (5%-phenyl)-methylpolysiloxane column
(DB5-MS, 30 m, 0.25 mm I.D., 0.25 µm film thickness) from Agilent Technologies was
used. The carrier gas was Helium of the purity 99.999%. The injected volume for both
analytes was 2 µL. The injection port and transfer line temperatures were set at 250oC
and 280oC, respectively. The carrier gas flow rate was set at 1mL/ min for both
methods. The temperature program for PAHs method was: start at 100oC (held for 10
min), set at a rate of 25oC/min up to 160oC, finally at a rate of 5oC /min up to 265oC
(held for 17 min). The temperature program for PCBs method was: start at 100oC (held
for 1 min), heat at a rate of 30oC/min up to 160oC, then at a heating rate of 5oC/min up
to 260oC (held for 25 min). Mass spectrometric measurements with electron ionization
(EI) at 70 eV were performed in the selected ion monitoring mode (SIM). Figure 2 and
figure 3 show the chromatograms of the standard mixtures of PAHs and PCBs,
respectively.
Method Validation
Linear Range
For the calculation of the performance data, a calibration was carried out with
five concentration levels for PAHs and PCBs in the range of 15-500 µg/L and 1-200
µg/L, respectively. From the resulting calibration curves, the regression coefficients
were calculated, characterizing the linearity of the calibration function. Regression
coefficients were > 0.99 in both cases, indicating a good linearity of the calibration
function in these concentration ranges.

354
Figure 2: Chromatogram of the standard mixture of PAHs (25 µg/L) of each compound.
Numbering and names are according to table 1.
Figure 3: Chromatogram of the standard mixture of PCBs (200 µg/L) of each compound.
Numbering and names are according to table 2.

355
Detection Limits and Limits of Quantitaion
The limits of detection (LODs) and limits of quantitation (LOQs) were determined
for PAHs and PCBs as shown in tables 1 and 2. The calculated LODs represent the
lowest concentration levels at which the target compounds could be detected with a
signal-to-noise ratio of 3 and found to be in the range 7 - 70 ng/kg for PAHs and 149 -
330 ng/kg for PCBs. The LOQs were determined as signal-to-noise ratio of 10 and
found to be in the range from 22 - 234 ng/kg for PAHs, and 495 - 1099 ng/kg for PCBs.
LODs, LOQs and the corresponding retention times of the studied compounds are
shown in tables 1 and 2.
Table 1: Elution sequence (Peak Number), retention time, LOD and LOQ of PAHs
Peak No.
Retention time tR (min)
Standard of PAHs LOD (µg/kg)
LOQ (µg/kg)
1 7.75 1-Fluoronaphthalene (I.S) - - 2 13.98 Acenaphthylene 0.007 0.024 3 15.91 Fluorene 0.007 0.023 4 19.00 Phenanthrene 0.009 0.030 5 19.16 Anthracene 0.018 0.059 6 24.54 Pyrene 0.007 0.022 7 29.95 Benzo(a)anthracene 0.009 0.029 8 30.12 Chrysene 0.006 0.020 9 34.69 Benzo(b)fluoranthene 0.064 0.212 10 34.81 Benzo(k)fluoranthene 0.070 0.234 11 36.23 Benzo(a)pyrene 0.058 0.193 12 43.94 Indeno(1,2,3 cd)pyrene 0.022 0.075 13 44.45 Dibenzo(a,h)anthracene 0.028 0.095 14 46.06 Benzo(g,h,i)perylene 0.021 0.068
Table 2: Elution sequence (Peak Number), retention time, LOD and LOQ of PCBs
Peak No.
Retention time tR (min) Standard of PAHs LOD
(µg/kg) LOQ
(µg/kg)1 6.13 (1,8-dichloronaphthalen) IS - - 2 13.74 3,3',4,4'-Tetrachlorobiphenyl 0.153 0.510 3 14.07 3,4,4',5-Tetrachlorobiphenyl 0.154 0.513 4 14.84 2,3,3',4,4'-Pentachlorobiphenyl 0.169 0.562 5 14.93 2,3,4,4',5-Pentachlorobiphenyl 0.149 0.495 6 15.28 2,3',4,4',5-Pentachlorobiphenyl 0.162 0.541 7 15.79 2',3,4,4',5-Pentachlorobiphenyl 0.164 0.546 8 16.91 3,3',4,4',5-Pentachlorobiphenyl 0.182 0.606 9 17.57 2,3,3',4,4',5-Hexachlorobiphenyl 0.204 0.680 10 18.31 2,3,3',4,4',5'-Hexachlorobiphenyl 0.214 0.714 11 18.50 2,3',4,4',5,5'-Hexachlorobiphenyl 0.199 0.662 12 19.61 3,3',4,4',5,5'-Hexachlorobiphenyl 0.291 0.971 13 20.83 2,3,3',4,4',5,5'-Heptachlorobiphenyl 0.330 1.099

356
Extraction Recoveries
A blank sand sample from the Jordanian desert was extracted, cleaned-up and
analyzed according to the above mentioned methods. The results show the absence of
PCBs and PAHs. Five portions, each of ten grams of the above tested blank sand
sample were spiked with the PAHs standard mixture to give the concentrations of 25,
50, 100, 500 and 1000 µg/kg, and three portions, each of ten grams of the above
tested blank sand sample were spiked with the PAHs standard mixture to give the
concentrations of 50, 100 and 200 µg/kg. These samples were mixed thoroughly and
extracted, cleaned-up and analyzed according to the above mentioned methods. The
recovery tests were done in triplicate at different times. The average recoveries of
PAHs and PCBs were found between 82 -106% and 91- 114% respectively. All
recoveries were found within the acceptable range for trace analysis [17].
Instrument Precision
The precision of the instrument was measured through the injection of standard
solutions (1000, 500, 25 ng/ml for PAHs) and (200, 100, 25 ng/ml for PCBs) each
three times. The relative standard deviations, calculated as the coefficient of
variations (CV) were found to be less than the accepted limit value for trace analysis
(CV <15%), which means a good instrument precision.
Results and Discussion Concentration of PAHs in the Real Samples
The results of the studied 23 samples for the 13 PAH compounds are presented
in Tables 3 and 4 and in figure 2. It is worthy to mention that the samples 1-10 are all
taken from the surroundings of Al-Hussein Thermal Power Station, the samples 13-19
are all taken from the surroundings of the Jordan Petroleum Refinery, while the rest of
the samples (11, 12 and 20-23) were all taken from the area between the two emission
sources.
In the first sample group (1-10), the compounds which were found in relatively
high concentrations are phenanthrene ( samples 1, 4, 5,6), pyrene ( samples 4, 5 and
6), chrysene (samples 4,5,6), benzo(b)fluorenthene (samples 4, 5,6) and benzo(g,h,i)
perylene (samples 4, 5,6).
In the second sample group (13-19), the samples 17 and 18 contain the
compounds phenanthrene, pyrene and chrysene in relatively high concentrations and
the sample 19 contains all compounds in relatively high concentrations, specially
benzo(a)pyrene.
All these samples (1,4,5,6,17,18,19) are located on the west direction and
therefore these relatively high concentrations can be explained through the dominant
direction of the wind in this area which is the northeast direction [18], carrying the
pollutants to the west side of the emission sources.
The nearest sample on the west side of the petroleum refinery is sample number
19 with the highest total concentration of all 13 PAH-compounds of 190.9 µg/kg (50.7
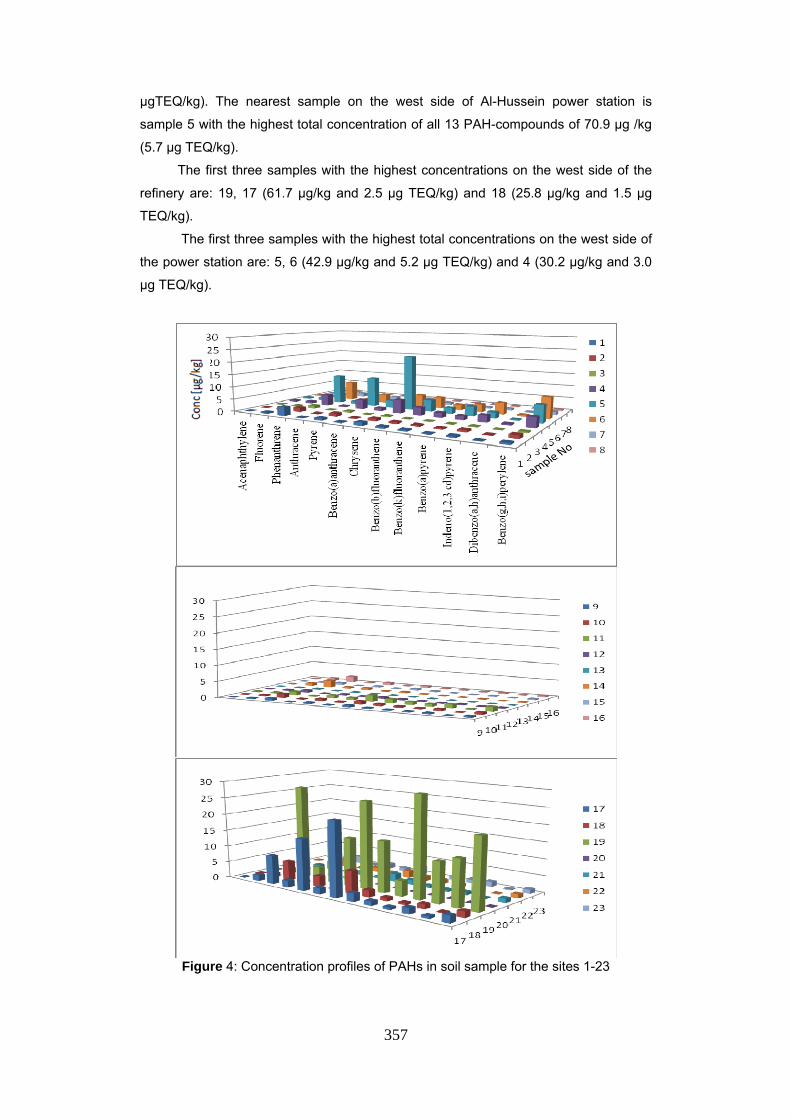
357
µgTEQ/kg). The nearest sample on the west side of Al-Hussein power station is
sample 5 with the highest total concentration of all 13 PAH-compounds of 70.9 µg /kg
(5.7 µg TEQ/kg).
The first three samples with the highest concentrations on the west side of the
refinery are: 19, 17 (61.7 µg/kg and 2.5 µg TEQ/kg) and 18 (25.8 µg/kg and 1.5 µg
TEQ/kg).
The first three samples with the highest total concentrations on the west side of
the power station are: 5, 6 (42.9 µg/kg and 5.2 µg TEQ/kg) and 4 (30.2 µg/kg and 3.0
µg TEQ/kg).
Figure 4: Concentration profiles of PAHs in soil sample for the sites 1-23

358
Table 3: Recovery-corrected concentrations (µg/kg) of PAH and µg TEQ/kg of the
samples 1 – 12. Sample Nr.→
Comp’d ↓ 1 2 3 4 5 6 7 8 9 10 11 12
Acenaph-
thylene
0.11±
0
0.13±
0
0.17±
0.1
0.49±
0
0.57±
0
0.38±
0
0.10±
0
0.02±
0
0.02±
0
0.10±
0
0.12±
0 0.03±0
Fluorene 0.47±
0
0.58±
0
0.38±
0
0.84±
0
1.21±
0
0.88±
0.1
0.36±
0
0.12±
0
0.29±
0
0.38±
0
0.34±
0
0.28±
0
Phenan-
threne
3.47±
0.1
1.77±
0.1
1.19±
0
4.57±
0.1
11.55±
0.2
7.74±
0.6
1.46±
0
0.56±
0.2
0.69±0
.1
1.28±
0.1
1.08±
0.2 0.62± 0
Anthra-
cene
0.22±
0
0.19±
0
0.13±
0
0.42±
0
1.00±
0
0.53±
0.1
0.16±
0
0.08±
0
0.08±
0 0.15±0
0.19±
0 0.10± 0
Pyrene 0.92±
0.1
1.18±
0.1
0.51±
0
3.77±
0.1
11.70±
0.3
3.53±
0.1
1.13±
0
0.34±
0.1
0.43±
0
0.63±0
0.1
0.89±
0.1 0.36± 0
Benzo(a)
anthracene
0.34±
0
0.32±
0.1
0.10±
0
1.19±
0
2.85±
0.2
1.75±
0.2
0.43±
0
0.12±
0
0.18±
0
0.29±
0
0.63±
0.1 0.19± 0
Chrysene 1.22±
0.1
1.05±
0.2
0.39±
0
5.26±
0.1
21.78±
4
4.70±
1.0
1.79±
0
0.50±
0.1
0.58±
0
0.96±
0.1
1.89±
0.3 0.43± 0
Benzo(b)-
fluoranthene
0.70±
0.1
0.61±
0.1
0.16±
0
3.07±0
0.2
4.60±
3
4.43±
1.0
0.94±
0
0.32±
0.1
0.35±
0
0.61±
0
1.24±
0.2
0.29±
0.1
Benzo(k)-
fluoranthene
0.54±
0.1 0.51±0.1
0.16±
0
1.88±
0.2
2.31±.0
0.4
2.19±0.
0.1
0.69±
0
0.17±
0
0.23±
0
0.41±
0
0.90±
0.1
0.23±
0.1
Benzo(a)-
pyrene
0.27±
0
0.40±
0.1
0.09±
0
1.54±
0.1
3.70±
0.2
3.19±
1.0
0.50±
0.1
0.19±
0
0.26±
0.1
0.37±
0
0.79±
0.1
0.16±
0.1
Indeno(1,2,3
cd)pyrene
0.56±
0.1
0.85±
0.2
0.28±
0.1
2.75±
0.1
2.30±
0.2
4.62±1.
0
0.77±
0
0.34±
0
0.36±0
.1
0.64±
0.1
1.16±
0.2
0.32±
0.1
Dibenzo(a,h)-
anthracene
0.12±
0
0.10±
0
0.08±
0
0.45±
0
0.42±
0.03
0.60±
0.02
0.17±
0
0.10±
0
0.09±
0
0.10±
0
0.22±
0
0.12±
0.1
Benzo(g,h,i)-
perylene
0.68±
0.1
1.27±
0.3
0.46±
0.1
4.02±
0.1
6.90±
0.2
8.34±1.
1.5
1.19±
0
0.62±
0.1
0.45±
0
0.65±
0.1
1.45±
0.2
0.32±
0.2
Total
(µg/kg)
9.61±
0.3
8.94±
0.5
4.10±
0.2
30.24±
0.3
70.88±
5.1
42.88±
2.6
9.69±
0.1
3.50±
0.21
4.03±
0.2
6.56±
0.22
10.91±
0.54
3.46±
0.3
µg TEQ/kg 0.62 0.76 0.26 2.99 5.65 5.24 0.98 0.40 0.48 0.68 1.44 0.39

359
Table 4: Recovery-corrected concentrations (µg/kg) of PAH and µg TEQ/kg of
samples 13-23. Sample→
Comp’d ↓
13 14 15 16 17 18 19 20 21 22 23
Acenaph-
thylene
0.00±
0
0.02±
0
0.04±
0
0.03±
0
0.11±
0
0.15±
0.1
0.35±
0
0.05±
0
0.16±
0
0.17±
0
0.10±
0
Fluorene 0.13±
0
0.73±
0.1
0.19±
0
0.75±
0.1
1.78±
0.3
1.12±
0.1
1.61±
0.2
0.42±
0.1
0.58±
0.1
0.42±
0
0.56±
0.1
Phenan-
threne
0.23±
0
2.09±
0.1
0.49±
0.1
1.69±
0.2
8.77±
2.0
5.92±
1.0
28.02±
2.0
0.99±
0.2
1.98±
0.3
1.93±
0.2
2.22±
0.2
Anthra-
cene
0.03±
0
0.43±
0
0.11±
0
0.26±
0
2.05±
0.3
0.82±
0.1
3.88±
0.4
0.22±
0
0.32±
0
0.22±
0
0.35±
0.1
Pyrene 0.13±
0
0.58±
0.1
0.36±
0.1
0.64±
0.1
15.56±
2.0
3.20±
0.2
17.39±
1.5
0.41±
0.1
1.21±
0.2
1.33±
0.1
1.47±
0.04
Benzo(a)-
anthracene
0.05±
0
0.09±
0
0.09±
0
0.11±
0
1.87±
0.1
0.61±
0.1
14.64±
2.0
0.10±
0
0.47±
0.1
0.67±
0.1
0.90±
0.2
Chrysene 0.11±
0
0.33±
0.1
0.47±
0.1
0.55±
0.1
22.34±
2.0
6.82±
0.3
26.31±
3.0
0.17±
0
2.34±
0.3
2.20±
0.2
2.39±
0.04
Benzo(b)-
fluoranthene
0.06±
0
0.14±
0
0.21±
0
0.28±
0
2.49±
0.2
2.07±
0.1
15.38±
2.0
0.14±
0
1.43±
0.3
1.40±
0.1
1.74±
0.04
Benzo(k)-
fluoranthene
0.05±
0
0.11±
0
0.13±
0
0.22±
0
1.32±
0.1
0.98±
0
4.68±
1.0
0.08±
0
0.66±
0.1
1.28±
0.1
0.94±
0.04
Benzo(a)-
pyrene
0.04±
0
0.10±
0
0.08±
0
0.18±
0
0.72±
0.1
0.62±
0.1
31.53±
5.5
0.07±
0
0.50±
0.1
0.90±
0.1
1.14±
0.05
Indeno(1,2,3
cd)pyrene
0.04±
0
0.12±
0
0.21±
0
0.42±
0.1
1.80±
0.3
1.43±
0.2 12.21±4.5
0.15±
0
0.96±
0.2
1.27±
0.1
1.57±
0.3
Dibenzo(a,h)-
anthracene
0.01±
0
0.00±
0
0.05±
0
0.13±
0
0.70±
0.1
0.24±
0
13.95±
4.0
0.05±
0
0.20±
0
0.19±
0
0.27±
0
Benzo(g,h,i)-
perylene
0.05±
0
0.17±
0
0.30±
0.1
0.46±
0.1
2.16±
0.3 1.77±0.2
20.90±
6.0
0.09±
0
1.22±
0.2 1.19±0.2
1.28±
0.3
Total
(µg/kg)
0.94±
0
4.93±
0.2
2.73±
0.2
5.72±
0.3
61.67±
3.5
25.75±
1.1
190.86±
11.3
2.92±
0.3
12.01±
0.66
13.18±
0.4
13.18±
0.54
µg TEQ/kg 0.79 0.17 0.20 0.43 2.46 1.48 50.73 0.17 1.09 1.59 1.59
Comparing the total concentrations of the PAHs in the studied samples from all
sites with other regions, we find that the concentration range in the present study (0.94
– 190.86 µg/kg) is much lower than those found in soil samples after long term
irrigation with wastewater in Shenyang, China, which was (950 – 2790 µg/kg) [19]. Soil
samples taken from the vicinity of Pincher Creek refinery in Alberta/Canada found to
contain a total concentration of PAHs of 9810 mg/kg [20]. According to the WHO [21], the
total PAHs level in unpolluted areas was 5-100 µg/kg soil. These facts show that the
pollution in the studied area is very low.

360
Toxicity Equivalents of the Samples
The benzo(a)pyrene-toxicity equivalents (B(a)P-TEQ) were calculated using
the B(a)P toxic equivalency factors (TEF) recommended for use by the US EPA [22] as
shown in table 5 and the results are presented in tables 3 and 4.
Table 5: Benzo (a)pyrene Toxic Equivalency Factors (BAP-TEF)[24] Compound EPA-TEF
Benzo(a)pyrene 1.0
Benz(a)anthracene 0.1
Benzo(b)fluoranthene 0.1
Benzo(k)fluoranthen 0.1
Chrysene 0.001
Dibenzo(a,h)anthracene 1.0
Indeno(1,2,3-c,d)pyrene 0.1
For the total concentrations of all 13 studied PAH-compounds, one can predict
from tables 3 and 4 that the five sites with the highest total concentrations have the
following ascending order: 19 >5 >17 > 6>18. For both TEQs and the total cancer risk,
also the same four sites show the highest values but in the following order: 19 >5 >6
>17>18.
Concentrations of PCBs in the Real Samples
It is also clear that our samples did not contain any concentration of the studied
PCBs mixture. This could be explained that PCBs need harder conditions to be
synthesized which are the presence of organic or inorganic chloride and a metal
catalyst. But our results are reasonable compared to those of the soil samples after
long period of wastewater irrigation from Shenyang, China [23] where they found PCBs
in the range of 4.4 – 20.14 µg/kg. While another surface soil samples from the
industrialized and urban area of KwaZulu-Natal, South Africa show a concentration
range of (1 – 10 µg/kg) [24], and in a more industrialized city like Moscow the range of
PCBs was 3.1– 42 µg/kg [25].
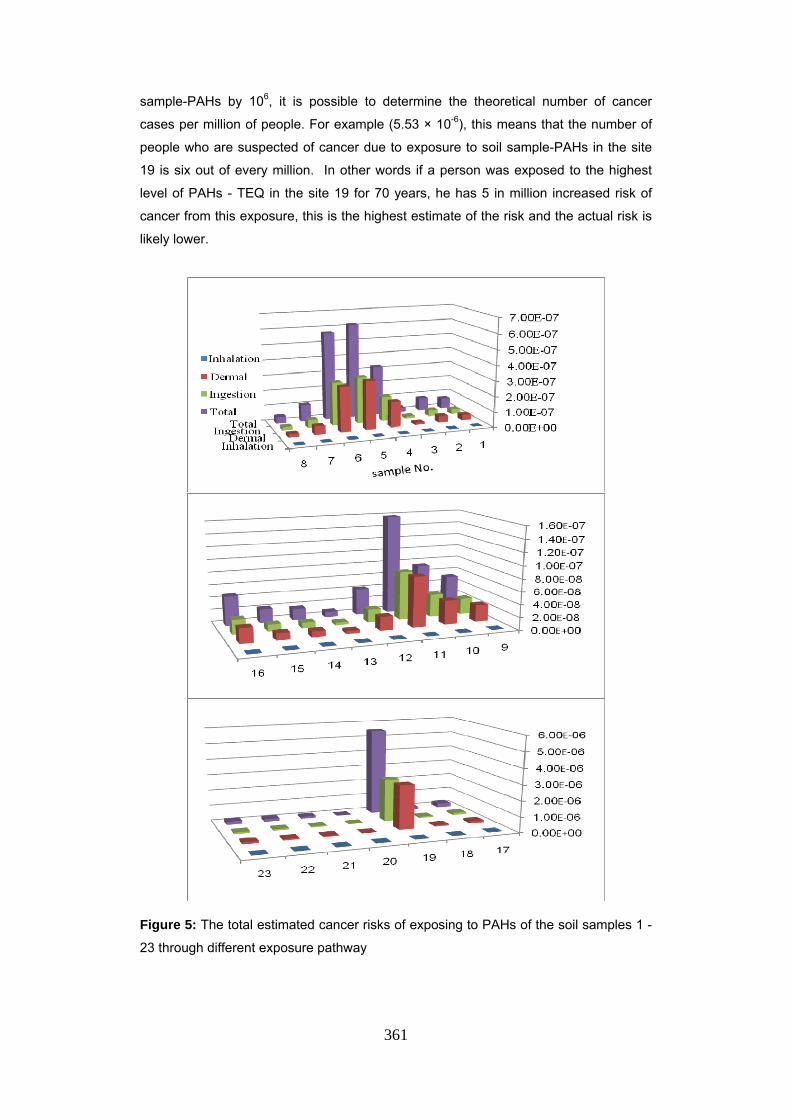
Cancer Risk Assessment
The values of total estimated cancer risk of the samples used to draw figure 3
were calculated using the Incremental Life Cancer Risk (ILCR) equation given in [26].
The highest total estimated cancer risk was found in soil sample 19. In
comparison, while the lowest total estimated cancer risk was found in soil sample 13,
as shown in figure 3. According to USEPA guidelines in regulatory terms, an estimated
cancer risk of 10-6 or less denotes virtual safety and an estimated cancer risk of greater
than 10-4 denotes potentially high risk. The estimated cancer risks under normal
exposures to soil samples-PAHs for all age groups in most of locations are equal or
less than 10-6. Under worst-case scenario, no estimated cancer risks of the extreme
exposures exceeded 10-4. By multiplying the estimated cancer risks of exposing to soil
361
sample-PAHs by 106, it is possible to determine the theoretical number of cancer
cases per million of people. For example (5.53 × 10⁻⁶), this means that the number of
people who are suspected of cancer due to exposure to soil sample-PAHs in the site
19 is six out of every million. In other words if a person was exposed to the highest
level of PAHs - TEQ in the site 19 for 70 years, he has 5 in million increased risk of
cancer from this exposure, this is the highest estimate of the risk and the actual risk is
likely lower.
Figure 5: The total estimated cancer risks of exposing to PAHs of the soil samples 1 -
23 through different exposure pathway
362
Concluding Remarks These findings show that the studied two industrial facilities did not cause high
level of organic pollution. The analyzed 23 samples did not contain any of the studied
13 compounds of PCBs and very low level of pollution with PAHs, but in measurable
concentrations.
The results show that the PAH-compounds found in relatively high
concentrations are: phenanthrene, pyrene, chrysene, benzo(b)fluorenthene and
benzo(g,h,i)perylene. Benzo(a)pyrene was found only in two samples (5 and 19) with
relatively high concentration.
The results show also that the samples with relatively high concentrations of
total PAH-compounds are located in the west side of the emission sources which
means that the northeast wind carry the pollutants from the emitting sources to the
west.
The results show that the petroleum refinery cause more pollution than the
power station and the sample with the highest TEQ-value (sample 19) is taken from
the vicinity (west side) of the refinery. This sample contains the highest concentration
of the carcinogenic compound benzo(a)pyrene ( 31.5 µg/kg).
The estimated cancer risk was acceptable compared to the USEPA guidelines
and the overall environmental situation in the surroundings of the two facilities is also
acceptable.
Abbreviations RSD = Relative standard deviation
TEQ = Toxicity equivalent
TEF = Toxic equivalency factor
References [1] Motelay-Massei, A.; Ollivon, D.; Garban, B.M.; Teil, J.; Blanchard, M.; Chevreuil M.
“Hydrologie et Environnement, Ecole Pratique des Hautes Etudes », UMR Sisyphe 7619,Universite’ Pierre Marie Curie, 4 place Jussieu, case 2003, 105, 75252 Paris cedex 05, France.
[2] Adami, G.; Barbieri, P.; Piselli, S.; redonzani S.;Reisenhofer E., J.Environ. Monit. ,2002, 2, 261 – 265.
[3] García-Ruiz, C.; Martín-Biosca, Y.; Crego, A.L.; Marina, M.L. ,Chromatography A., 2001, 910 (1), 157-164.
[4] Russo, M.V., Chromatographia, 2000, 93 – 98. [5] Cortazar, E.; Zuloaga, O.; Sanz, J.; Raposo, J.C.; Etxebarria, N.; Fernández,L.A.,
Chromatography A, 2002, 978 (1-2), 165 – 175. [6] Erickson, M.D. “Analytical chemistry of PCBs” 2nd Ed., Lewis publisher Boston (USA)
1986. [7] Siming, L.; Pleil, J.. “J.Chromatography B.” 2002, 769 (1), 155 - 167. [8] Patnaik, P. “Handbook of environmental analysis” Lewis Publisher, BocaRaton, FL
(USA). 1997. [9] Verschueren, K. “Handbook of environmental data on organic chemicals” second edition,
Van Nostrand Reinhold Co. Inc. New York 1983. [10] Antunes, P.; Viana, P.; Vinhas, T.; Capelo, J.; Rivera, L.C.; Elvira, M.; Gaspar, S.M.,
Science of the Total Environment., 2007, 377(1), 36-44. [11] Joa, K.; Panova, E.; Irha, N.; Teinemma, E.; Lintelmann J.; Kirso, U., Oil Shale, 2009, 26
(1), 59–72. [12] Chen, S.C; Liao, C.M., The Science of the Total Environment, 2006, (366), 112 – 123.
363
[13] USEPA. Risk Assessment Guidance for Superfund, Volume 1, Human Health Evaluation Manual (Part B, Development of Risk-based Preliminary Remediation Goals). EPA/540/R-92/003 Publication 9285.7e01B, 1991.
[14] Wang, Z. “Regional Study on Soil Polyaromatic Hydrocarbons in Liaoning: Patterns, Sources and Cancer Risks” Dalian University of Technology, Dalian.2007.
[15] Conor Pacific Environmental Technologies Inc. (C.P.E.T). “The determination of Polyaromatic Hydrocarbons (PAH), PolychlrorBiphenyls (PCB) and Organochlorine Compounds (OC) in ambient arctic air” Project number 441-J3034, 1999.
[16] Wenzel, K.-D.; Manz, M.; Hubert, A.; Schuurmann, G., The Science of the Total Environment, 2002, (286), 143-154.
[17] USEPA. Risk Assessment Guidance for Superfund, Volume 1, Human Health Evaluation Manual (Part E, Supplemental Guidance for Dermal Risk Assessment) EPA/540/R/99/005 OSWER 9285.7-02EP PB99-963312 July 2004.
[18] Annual report of the Meteorology Department, Amman-Jordan 2010, [19] Gonzalez, A.G.; Herrador, M.A., Trends in Analytical Chemistry, 2007, 26, 227 – 238. [20] Enviro-Test Laboratory (ETL). GC/MS Analysis –Gulf/Pincher Creek-Samples within
Process Area, Prepared for Gulf Canada. Inc. and Monenco Consultants Ltd., 1984, 48p. [21] WHO/IPCS, Environmental Health Criteria 202. Selected non-Heterocyclic Polycyclic
Aromatic Hydrocarbons. International Program on Chemical Safety. United Nations Environ- mental Program, World Health Organization, 1998, Geneva.
[22] U.S.EPA. Integrated Risk Information System (IRIS). , OH, Environmental Criteria and Assessment Office, U.S Environmental Protection Agency, 1993.
[23] Song, Y.F.; Wilk, B.M.; Song, X.Y.; Gong, P.; Zhou, Q.X.; Yang, G.F., Chemosphere, 2006, 65(10),1859–1868.
[24] Batterman, S.; Chernyak, S.; Gouden, Y.; Hayes, J.; Robins, T.; Chetty, S., Environmental Pollution, 2009, 157(2), 654-663.
[25] Wilcke W.; Martin K.; Grigorij S.A.; Fokin, D.; Kaupenjohann, M. ,Environmental Pollution, 2006, 141(2), 327 – 335.
[26] Canadian Council of Ministers of the Environment, Canadian Soil Quality Guidelines, Environmental and Health Effects, PN 1401, ISBN 978-1-896997-79-7 PDF, 2008.
Recommended