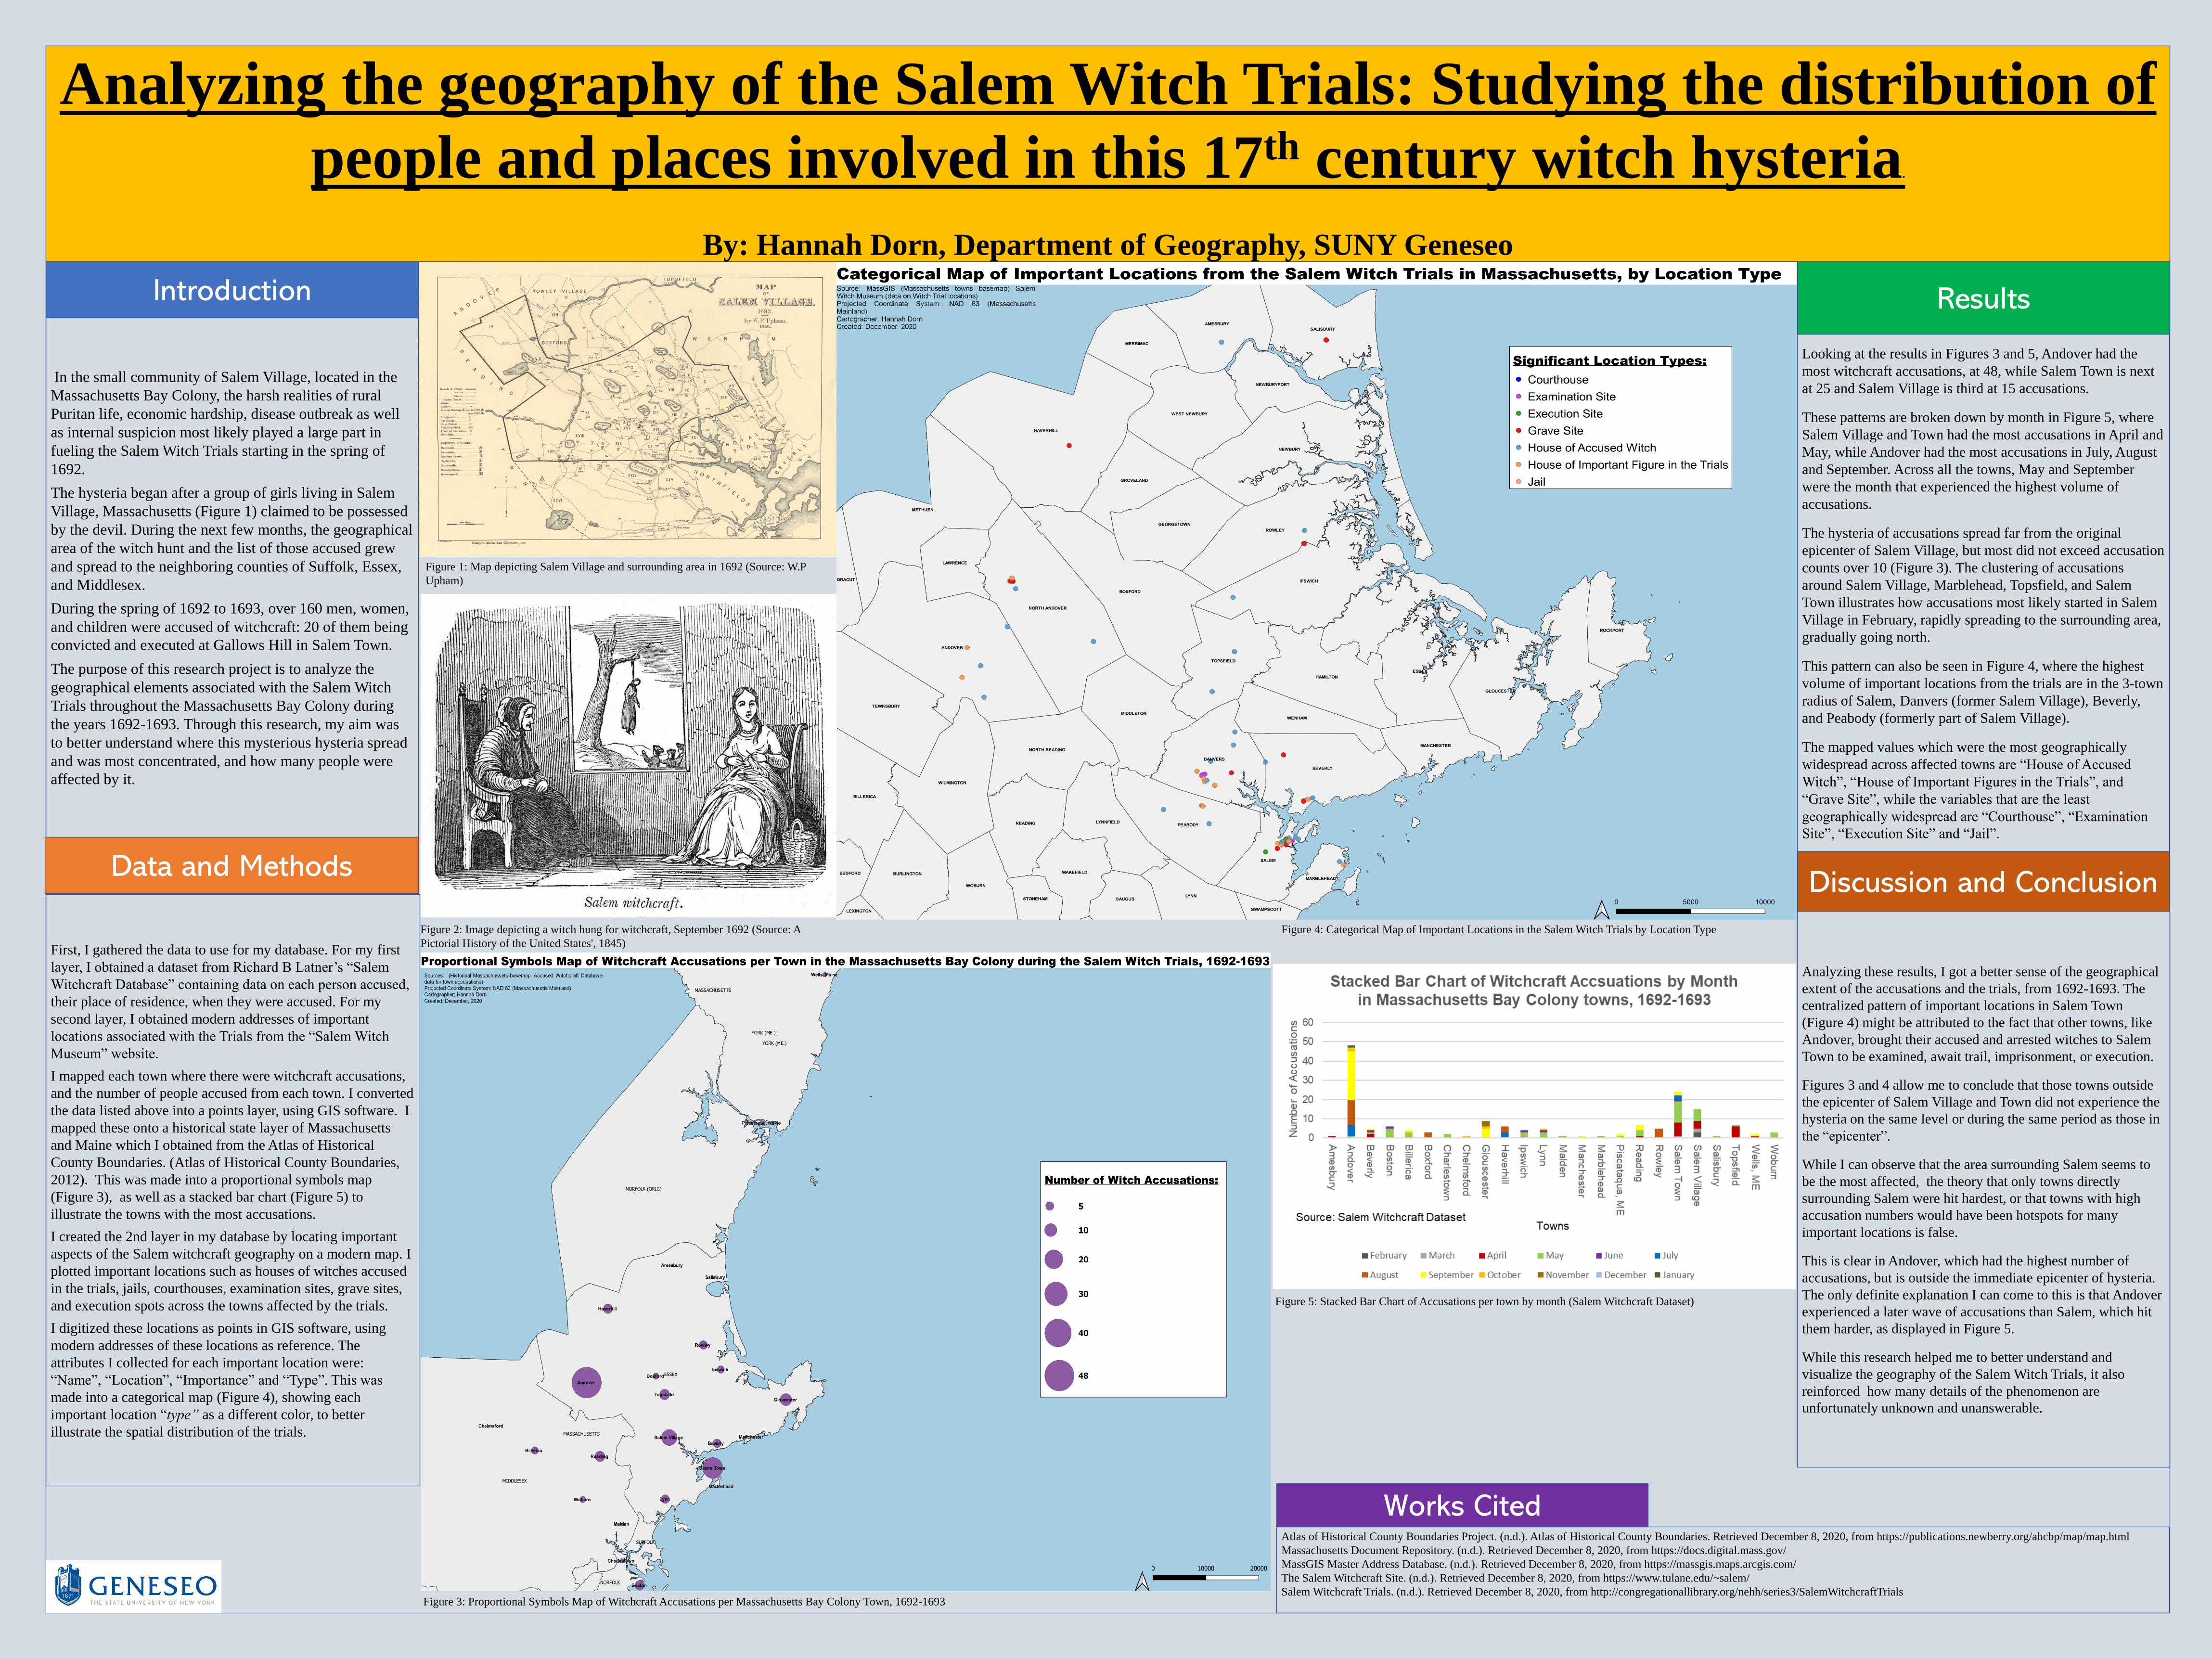
Analyzing the geography of the Salem Witch Trials: Studying the distribution of
people and places involved in this 17th century witch hysteria.
By: Hannah Dorn, Department of Geography, SUNY Geneseo
Introduction
In the small community of Salem Village, located in the
Massachusetts Bay Colony, the harsh realities of rural
Puritan life, economic hardship, disease outbreak as well
as internal suspicion most likely played a large part in
fueling the Salem Witch Trials starting in the spring of
1692.
The hysteria began after a group of girls living in Salem
Village, Massachusetts (Figure 1) claimed to be possessed
by the devil. During the next few months, the geographical
area of the witch hunt and the list of those accused grew
and spread to the neighboring counties of Suffolk, Essex,
and Middlesex.
During the spring of 1692 to 1693, over 160 men, women,
and children were accused of witchcraft: 20 of them being
convicted and executed at Gallows Hill in Salem Town.
The purpose of this research project is to analyze the
geographical elements associated with the Salem Witch
Trials throughout the Massachusetts Bay Colony during
the years 1692-1693. Through this research, my aim was
to better understand where this mysterious hysteria spread
and was most concentrated, and how many people were
affected by it.
Data and Methods
Results
Discussion and Conclusion
Works Cited
First, I gathered the data to use for my database. For my first
layer, I obtained a dataset from Richard B Latner’s “Salem
Witchcraft Database” containing data on each person accused,
their place of residence, when they were accused. For my
second layer, I obtained modern addresses of important
locations associated with the Trials from the “Salem Witch
Museum” website.
I mapped each town where there were witchcraft accusations,
and the number of people accused from each town. I converted
the data listed above into a points layer, using GIS software. I
mapped these onto a historical state layer of Massachusetts
and Maine which I obtained from the Atlas of Historical
County Boundaries. (Atlas of Historical County Boundaries,
2012). This was made into a proportional symbols map
(Figure 3), as well as a stacked bar chart (Figure 5) to
illustrate the towns with the most accusations.
I created the 2nd layer in my database by locating important
aspects of the Salem witchcraft geography on a modern map. I
plotted important locations such as houses of witches accused
in the trials, jails, courthouses, examination sites, grave sites,
and execution spots across the towns affected by the trials.
I digitized these locations as points in GIS software, using
modern addresses of these locations as reference. The
attributes I collected for each important location were:
“Name”, “Location”, “Importance” and “Type”. This was
made into a categorical map (Figure 4), showing each
important location “type” as a different color, to better
illustrate the spatial distribution of the trials.
Looking at the results in Figures 3 and 5, Andover had the
most witchcraft accusations, at 48, while Salem Town is next
at 25 and Salem Village is third at 15 accusations.
These patterns are broken down by month in Figure 5, where
Salem Village and Town had the most accusations in April and
May, while Andover had the most accusations in July, August
and September. Across all the towns, May and September
were the month that experienced the highest volume of
accusations.
The hysteria of accusations spread far from the original
epicenter of Salem Village, but most did not exceed accusation
counts over 10 (Figure 3). The clustering of accusations
around Salem Village, Marblehead, Topsfield, and Salem
Town illustrates how accusations most likely started in Salem
Village in February, rapidly spreading to the surrounding area,
gradually going north.
This pattern can also be seen in Figure 4, where the highest
volume of important locations from the trials are in the 3-town
radius of Salem, Danvers (former Salem Village), Beverly,
and Peabody (formerly part of Salem Village).
The mapped values which were the most geographically
widespread across affected towns are “House of Accused
Witch”, “House of Important Figures in the Trials”, and
“Grave Site”, while the variables that are the least
geographically widespread are “Courthouse”, “Examination
Site”, “Execution Site” and “Jail”.
Analyzing these results, I got a better sense of the geographical
extent of the accusations and the trials, from 1692-1693. The
centralized pattern of important locations in Salem Town
(Figure 4) might be attributed to the fact that other towns, like
Andover, brought their accused and arrested witches to Salem
Town to be examined, await trail, imprisonment, or execution.
Figures 3 and 4 allow me to conclude that those towns outside
the epicenter of Salem Village and Town did not experience the
hysteria on the same level or during the same period as those in
the “epicenter”.
While I can observe that the area surrounding Salem seems to
be the most affected, the theory that only towns directly
surrounding Salem were hit hardest, or that towns with high
accusation numbers would have been hotspots for many
important locations is false.
This is clear in Andover, which had the highest number of
accusations, but is outside the immediate epicenter of hysteria.
The only definite explanation I can come to this is that Andover
experienced a later wave of accusations than Salem, which hit
them harder, as displayed in Figure 5.
While this research helped me to better understand and
visualize the geography of the Salem Witch Trials, it also
reinforced how many details of the phenomenon are
unfortunately unknown and unanswerable.
Figure 1: Map depicting Salem Village and surrounding area in 1692 (Source: W.P
Upham)
Figure 2: Image depicting a witch hung for witchcraft, September 1692 (Source: A
Pictorial History of the United States', 1845)
Figure 5: Stacked Bar Chart of Accusations per town by month (Salem Witchcraft Dataset)
Figure 3: Proportional Symbols Map of Witchcraft Accusations per Massachusetts Bay Colony Town, 1692-1693
Figure 4: Categorical Map of Important Locations in the Salem Witch Trials by Location Type
Atlas of Historical County Boundaries Project. (n.d.). Atlas of Historical County Boundaries. Retrieved December 8, 2020, from https://publications.newberry.org/ahcbp/map/map.html
Massachusetts Document Repository. (n.d.). Retrieved December 8, 2020, from https://docs.digital.mass.gov/
MassGIS Master Address Database. (n.d.). Retrieved December 8, 2020, from https://massgis.maps.arcgis.com/
The Salem Witchcraft Site. (n.d.). Retrieved December 8, 2020, from https://www.tulane.edu/~salem/
Salem Witchcraft Trials. (n.d.). Retrieved December 8, 2020, from http://congregationallibrary.org/nehh/series3/SalemWitchcraftTrials
Recommended