3.2. Systematic sampling plan
Jiahua,Chen Week3b
Suppose the population is made of N = nk units.
The exact factorization assumption is to make our presentationsimpler.
If the population size cannot be perfectly factorized, we will usesome ad hoc remedies.
Jiahua,Chen Week3b

Suppose further that the sampling units have been lined-up.
This happens for the name list of a class, or name list of employersin a large company.
If customers of a store of a particular day is to be sampled, theorder of their entering the store is regarded as a line-up.
Another perfect example is offered by the card game.
Jiahua,Chen Week3b
The systematic sampling plan would random select the first unitfrom the set of units {1, 2, . . . , k}.
After the first unit is decided, we sample every kth unit from thepopulation.
If we do not have a perfect N = nk factorization, some ad hocsteps will be used.
Jiahua,Chen Week3b
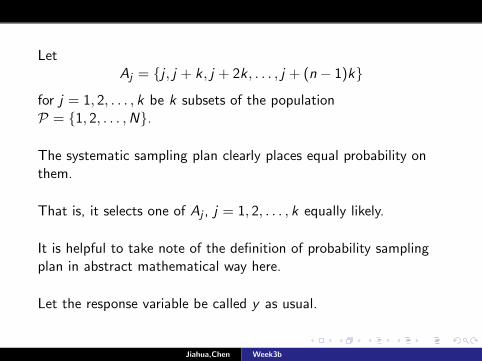
LetAj = {j , j + k, j + 2k , . . . , j + (n − 1)k}
for j = 1, 2, . . . , k be k subsets of the populationP = {1, 2, . . . ,N}.
The systematic sampling plan clearly places equal probability onthem.
That is, it selects one of Aj , j = 1, 2, . . . , k equally likely.
It is helpful to take note of the definition of probability samplingplan in abstract mathematical way here.
Let the response variable be called y as usual.
Jiahua,Chen Week3b
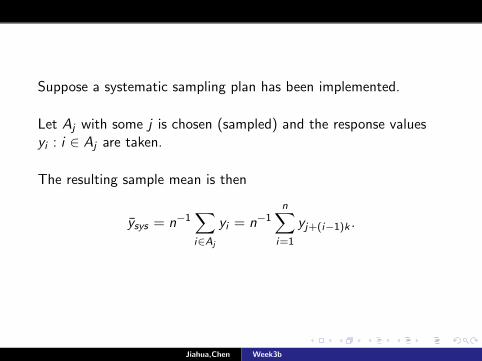
Suppose a systematic sampling plan has been implemented.
Let Aj with some j is chosen (sampled) and the response valuesyi : i ∈ Aj are taken.
The resulting sample mean is then
ysys = n−1∑i∈Aj
yi = n−1n∑
i=1
yj+(i−1)k .
Jiahua,Chen Week3b
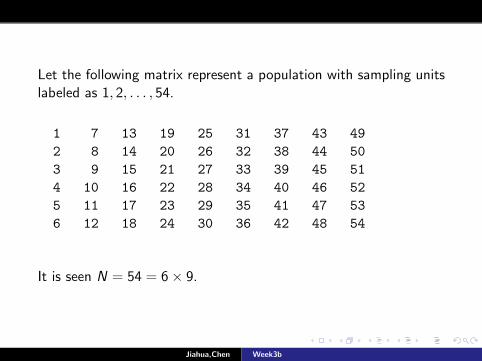
Let the following matrix represent a population with sampling unitslabeled as 1, 2, . . . , 54.
1 7 13 19 25 31 37 43 49
2 8 14 20 26 32 38 44 50
3 9 15 21 27 33 39 45 51
4 10 16 22 28 34 40 46 52
5 11 17 23 29 35 41 47 53
6 12 18 24 30 36 42 48 54
It is seen N = 54 = 6× 9.
Jiahua,Chen Week3b
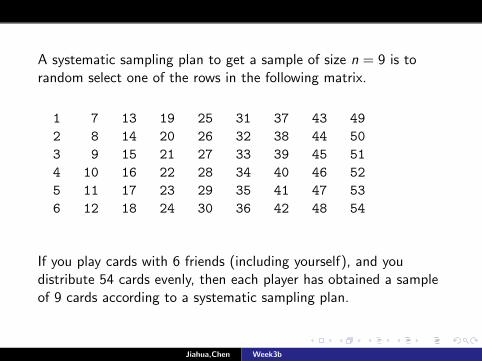
A systematic sampling plan to get a sample of size n = 9 is torandom select one of the rows in the following matrix.
1 7 13 19 25 31 37 43 49
2 8 14 20 26 32 38 44 50
3 9 15 21 27 33 39 45 51
4 10 16 22 28 34 40 46 52
5 11 17 23 29 35 41 47 53
6 12 18 24 30 36 42 48 54
If you play cards with 6 friends (including yourself), and youdistribute 54 cards evenly, then each player has obtained a sampleof 9 cards according to a systematic sampling plan.
Jiahua,Chen Week3b
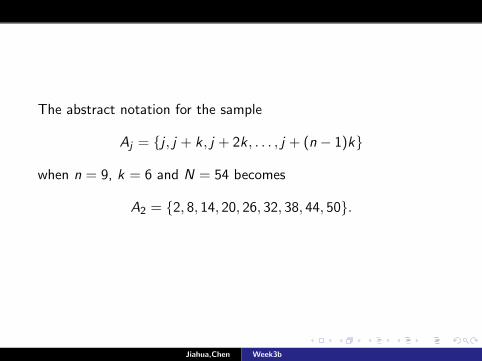
The abstract notation for the sample
Aj = {j , j + k, j + 2k , . . . , j + (n − 1)k}
when n = 9, k = 6 and N = 54 becomes
A2 = {2, 8, 14, 20, 26, 32, 38, 44, 50}.
Jiahua,Chen Week3b
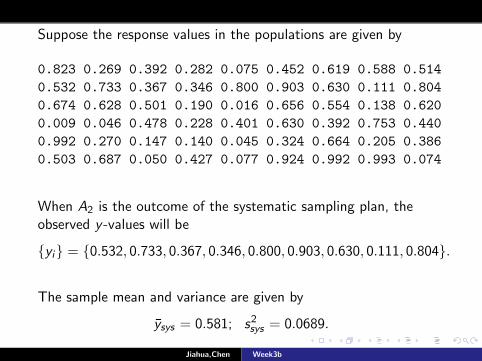
Suppose the response values in the populations are given by
0.823 0.269 0.392 0.282 0.075 0.452 0.619 0.588 0.514
0.532 0.733 0.367 0.346 0.800 0.903 0.630 0.111 0.804
0.674 0.628 0.501 0.190 0.016 0.656 0.554 0.138 0.620
0.009 0.046 0.478 0.228 0.401 0.630 0.392 0.753 0.440
0.992 0.270 0.147 0.140 0.045 0.324 0.664 0.205 0.386
0.503 0.687 0.050 0.427 0.077 0.924 0.992 0.993 0.074
When A2 is the outcome of the systematic sampling plan, theobserved y -values will be
{yi} = {0.532, 0.733, 0.367, 0.346, 0.800, 0.903, 0.630, 0.111, 0.804}.
The sample mean and variance are given by
ysys = 0.581; s2sys = 0.0689.
Jiahua,Chen Week3b
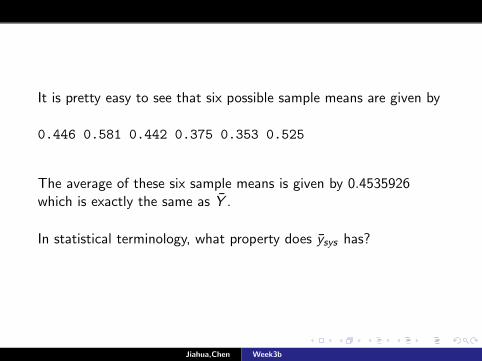
It is pretty easy to see that six possible sample means are given by
0.446 0.581 0.442 0.375 0.353 0.525
The average of these six sample means is given by 0.4535926which is exactly the same as Y .
In statistical terminology, what property does ysys has?
Jiahua,Chen Week3b
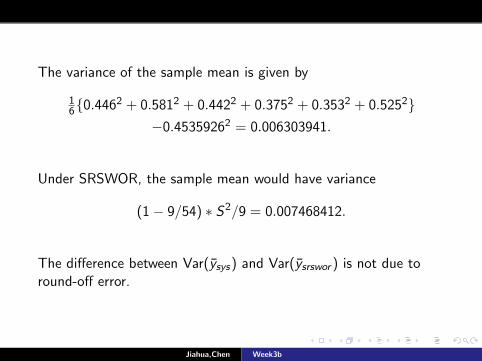
The variance of the sample mean is given by
16{0.4462 + 0.5812 + 0.4422 + 0.3752 + 0.3532 + 0.5252}
−0.45359262 = 0.006303941.
Under SRSWOR, the sample mean would have variance
(1− 9/54) ∗ S2/9 = 0.007468412.
The difference between Var(ysys) and Var(ysrswor ) is not due toround-off error.
Jiahua,Chen Week3b
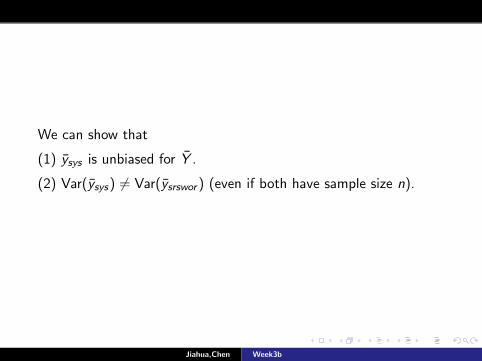
We can show that
(1) ysys is unbiased for Y .
(2) Var(ysys) 6= Var(ysrswor ) (even if both have sample size n).
Jiahua,Chen Week3b
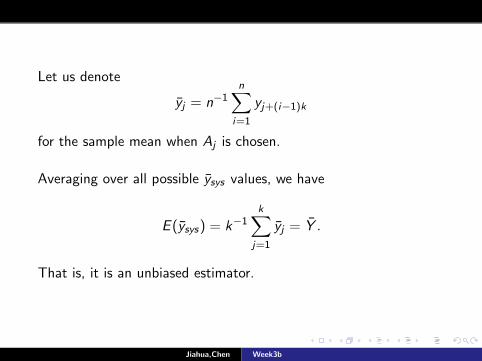
Let us denote
yj = n−1n∑
i=1
yj+(i−1)k
for the sample mean when Aj is chosen.
Averaging over all possible ysys values, we have
E (ysys) = k−1k∑
j=1
yj = Y .
That is, it is an unbiased estimator.
Jiahua,Chen Week3b
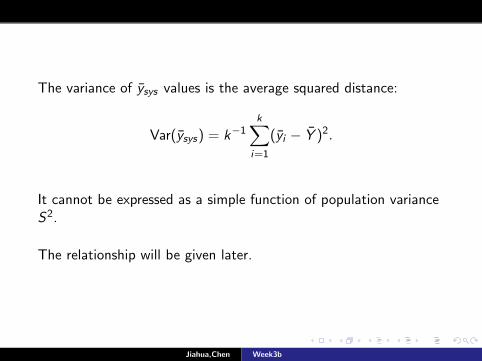
The variance of ysys values is the average squared distance:
Var(ysys) = k−1k∑
i=1
(yi − Y )2.
It cannot be expressed as a simple function of population varianceS2.
The relationship will be given later.
Jiahua,Chen Week3b
Comparison with SRSWOR
.Why do we introduce systematic sampling plan?
It is apparently easier to implement.
Everyone who have ever played cards know it.
Jiahua,Chen Week3b
Is systematic sampling plan superior statistically?
First, the systematic sampling is perfect when we can make eachyj ≈ Y .
In this case, there might be variations between y -values withineach sample, but there is nearly no variation between the samplemeans yj .
Thus, ysys has much lower variance compared to y underSRSWOR.
The pity is: we probably never know when this actually happens.
Jiahua,Chen Week3b
Is systematic sampling plan superior statistically again?
When there is a linear trend in response values when thepopulation is lined up, ysys may have lower variance compared to y .
When there is a cyclic trend in response values when the populationis lined up, use systematic sampling with a big dose of caution:it is bad if your cycle is the same as the cycle of the population.
When the population is lined up in random order, two samplingplans are practically the same.
Again, anyone who have ever played cards should agree.
Jiahua,Chen Week3b
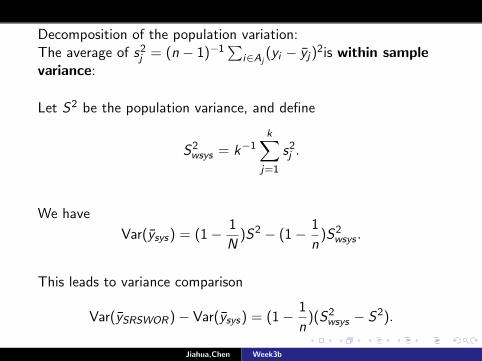
Decomposition of the population variation:The average of s2j = (n − 1)−1
∑i∈Aj
(yi − yj)2is within sample
variance:
Let S2 be the population variance, and define
S2wsys = k−1
k∑j=1
s2j .
We have
Var(ysys) = (1− 1
N)S2 − (1− 1
n)S2
wsys .
This leads to variance comparison
Var(ySRSWOR)− Var(ysys) = (1− 1
n)(S2
wsys − S2).
Jiahua,Chen Week3b
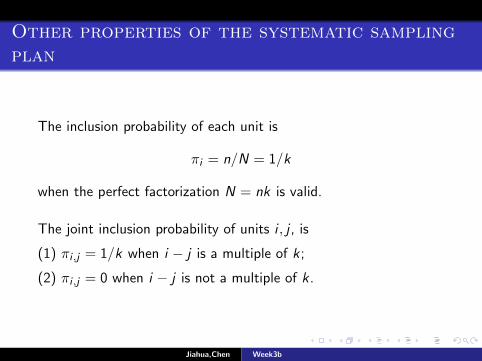
Other properties of the systematic samplingplan
The inclusion probability of each unit is
πi = n/N = 1/k
when the perfect factorization N = nk is valid.
The joint inclusion probability of units i , j , is
(1) πi ,j = 1/k when i − j is a multiple of k ;
(2) πi ,j = 0 when i − j is not a multiple of k .
Jiahua,Chen Week3b
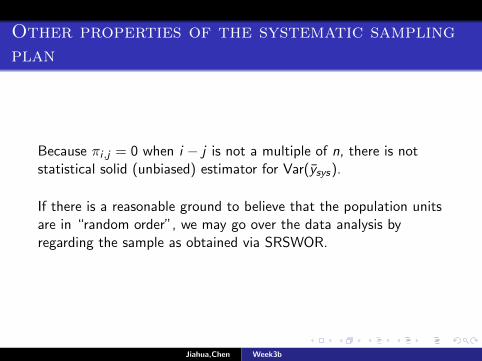
Other properties of the systematic samplingplan
Because πi ,j = 0 when i − j is not a multiple of n, there is notstatistical solid (unbiased) estimator for Var(ysys).
If there is a reasonable ground to believe that the population unitsare in “random order”, we may go over the data analysis byregarding the sample as obtained via SRSWOR.
Jiahua,Chen Week3b
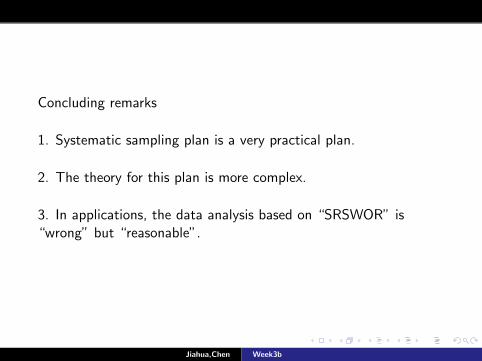
Concluding remarks
1. Systematic sampling plan is a very practical plan.
2. The theory for this plan is more complex.
3. In applications, the data analysis based on “SRSWOR” is“wrong” but “reasonable”.
Jiahua,Chen Week3b
Recommended