Valuation of anindustrial company
Pavia University
November 2014www.pwc.com
Agenda
1 Overview 1
2 Business Plan analysis 3
3 Discounted Cash Flow method 10
3.1 Business Plan: cash flow analysis 12
3.2 Figurative taxes on EBIT 15
3.3 Discount rate (WACC) 17
3.4 Terminal value 24
3.5 Surplus assets 30
3.6 DCF results 32
3.7 Sensitivity analysis 40
4 Market multiple methodology 44
5 Equity Value 48
Page
PwCNovember 2014
OverviewSection 1
Valuation of an industrial company • Pavia University1
PwCNovember 2014
The Group
We were asked to assist the Group in the estimate of its Enterprise Value, whichcan be divided in two separate business units:
– Business Unit Alfa: operating in the automotive lubricants industry. This sector ischaracterized by agreements between the carmakers and the oil producers for the"First Fill“
– Business Unit Beta: operating in the car cleaning and maintenance industry
Section 1 – Overview
Valuation of an industrial company • Pavia University2
PwCNovember 2014
Business Plan analysisSection 2
Valuation of an industrial company • Pavia University3
PwCNovember 2014
Business Plan analysis
Basis ofinformation:
approvedBusiness Plan
To determine the EV, the two business units were valuatedseparately in relation to different reference markets and totake into account the different risk profiles.
To do this, as a first step we analyzed the twobusinesses in order to understand the differentunderlying riskiness and specificities, which maybe taken into account in our valuation.
Section 2 – Business Plan analysis
Valuation of an industrial company • Pavia University4
PwCNovember 2014
Business Unit Alpha: market environment
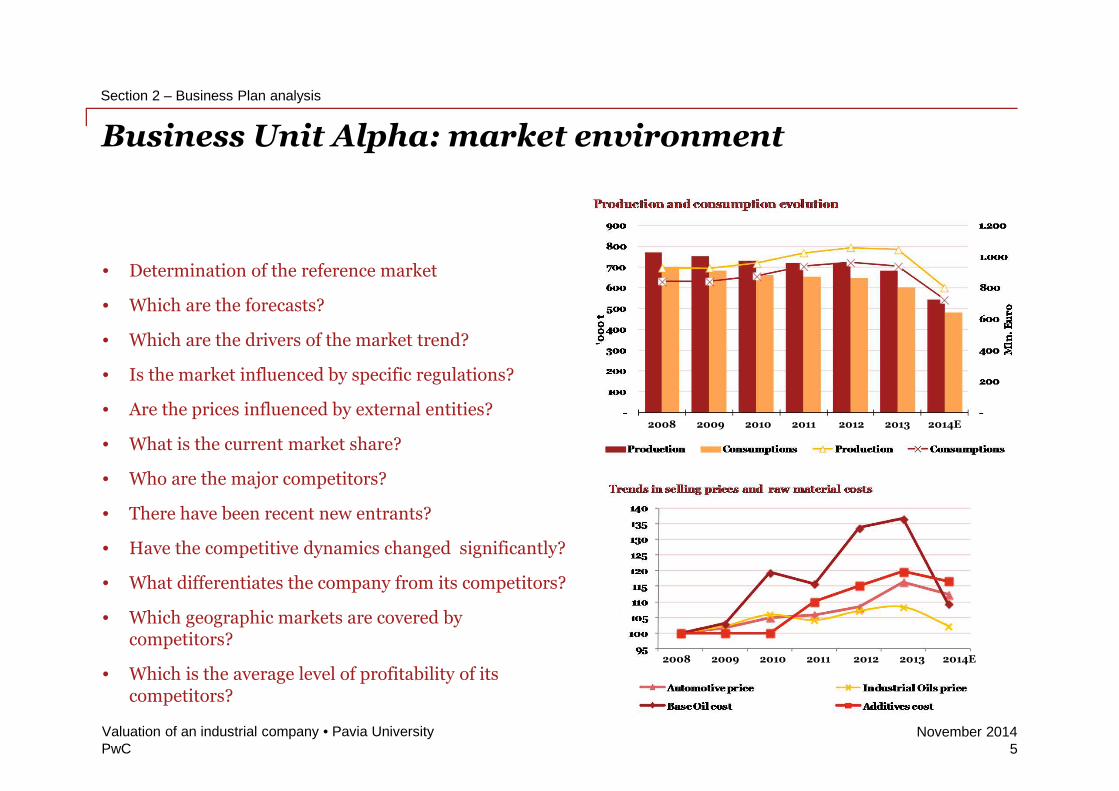
• Determination of the reference market
• Which are the forecasts?
• Which are the drivers of the market trend?
• Is the market influenced by specific regulations?
• Are the prices influenced by external entities?
• What is the current market share?
• Who are the major competitors?
• There have been recent new entrants?
• Have the competitive dynamics changed significantly?
• What differentiates the company from its competitors?
• Which geographic markets are covered bycompetitors?
• Which is the average level of profitability of itscompetitors?
Section 2 – Business Plan analysis
Valuation of an industrial company • Pavia University5
2006 2007 2008 2009 2010 2011 2012E
2006 2007 2008 2009 2010 2011 2012E
2008 2009 2010 2011 2012 2013 2014E
2006 2007 2008 2009 2010 2011 2012E2008 2009 2010 2011 2012 2013 2014E
PwCNovember 2014
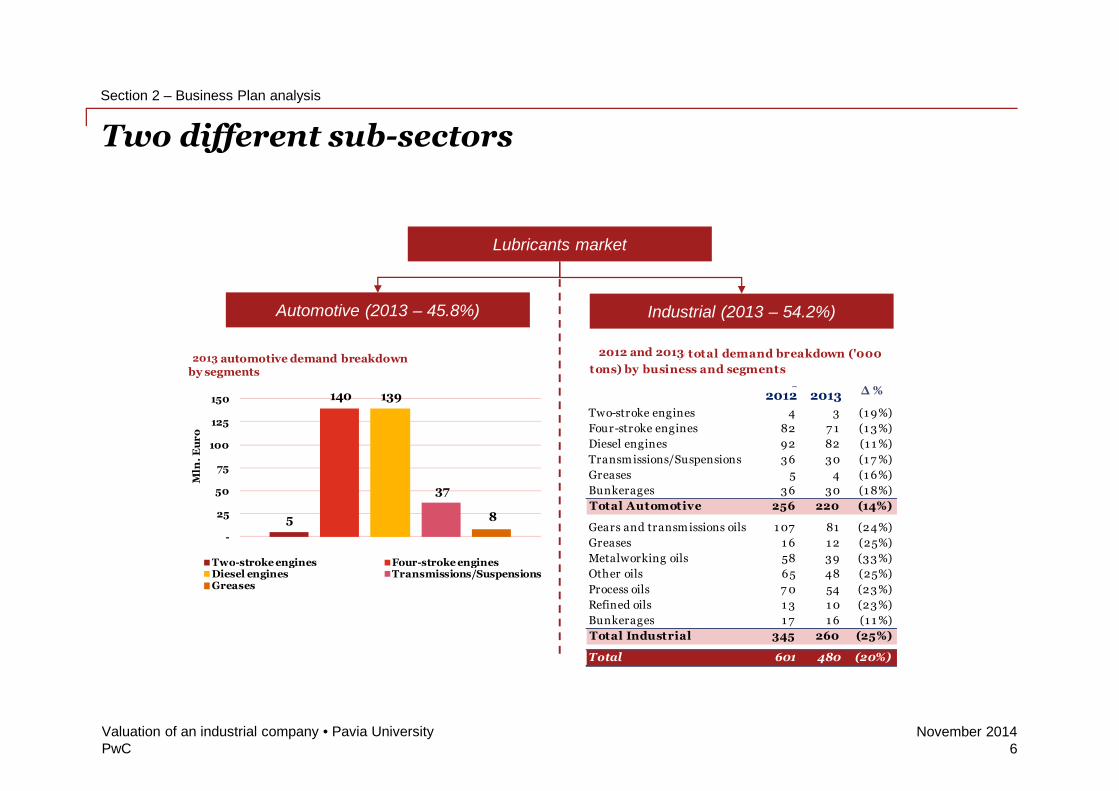
Two different sub-sectors
Automotive (2013 – 45.8%) Industrial (2013 – 54.2%)
Lubricants market
Section 2 – Business Plan analysis
Valuation of an industrial company • Pavia University6
5
140 139
37
8
-
25
50
75
100
125
150
Mln
.E
ur
o
2009 automotive demand breakdownby segments
Two-stroke engines Four-stroke enginesDiesel engines Transmissions/SuspensionsGreases
2008 2009 ∆ %
Two-stroke engines 4 3 (1 9%)
Four-stroke engines 82 7 1 (1 3%)
Diesel engines 92 82 (1 1 %)
Transmissions/Suspensions 36 30 (1 7 %)
Greases 5 4 (1 6%)
Bunkerages 36 30 (1 8%)
Total Automotive 256 220 (14%)
Gears and transmissions oils 1 07 81 (24%)
Greases 1 6 1 2 (25%)
Metalworking oils 58 39 (33%)
Other oils 65 48 (25%)
Process oils 7 0 54 (23%)
Refined oils 1 3 1 0 (23%)
Bunkerages 1 7 1 6 (1 1 %)
Total Industrial 345 260 (25%)
Total 601 480 (20%)
2008 and 2009 total demand breakdown ('000
tons) by business and segments2013
2012 and 2013
2012 2013
PwCNovember 2014
44,6% 39,7% 37,7% 36,0% 34,6%
15,7%18,6% 21,2%
22,1%22,4%8,4%
8,9%9,0%
9,7%10,7%
31,3%32,8%
32,1%
32,2%
32,3%
787862
943
1.032
1.134
-
200
400
600
800
1.000
1.200
2014 2015 2016 2017 2018
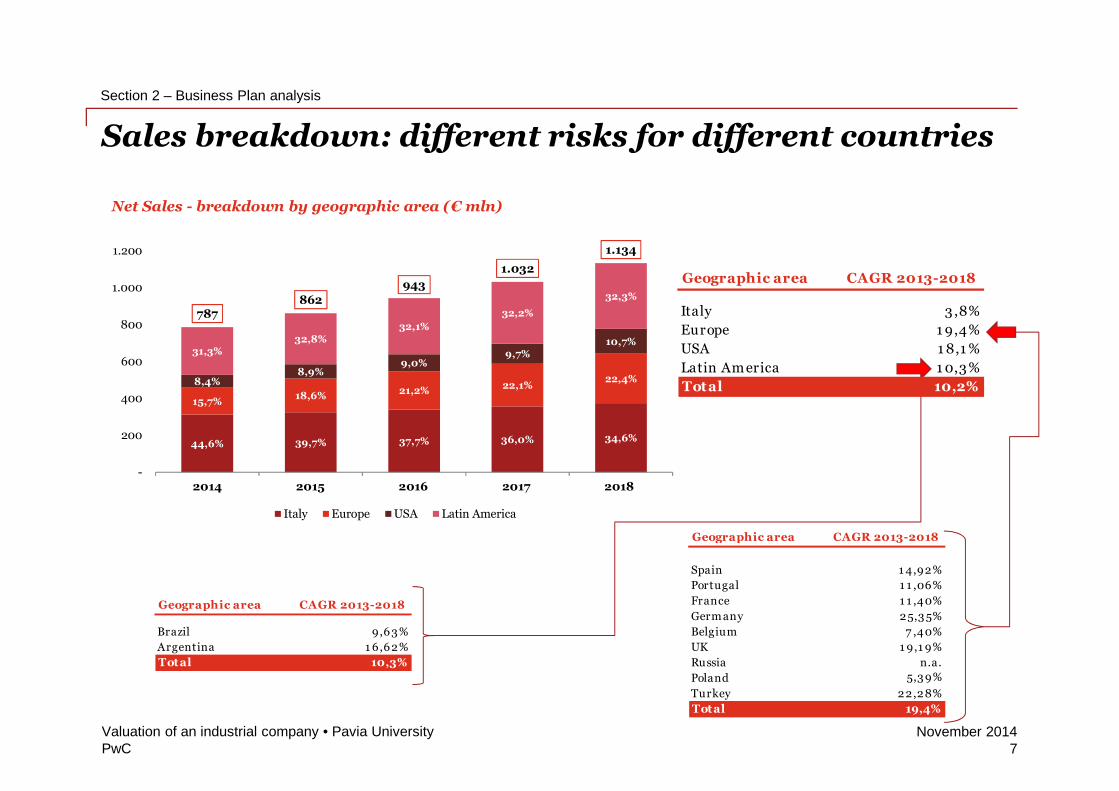
Net Sales - breakdown by geographic area (€ mln)
Italy Europe USA Latin America
Sales breakdown: different risks for different countries
Section 2 – Business Plan analysis
Valuation of an industrial company • Pavia University7
Geographic area CAGR 2013-2018
Italy 3 ,8%
Europe 1 9,4%
USA 1 8,1 %
Latin Am erica 1 0,3%
Total 10,2%
Geographic area CAGR 2013-2018
Spain 1 4,92%
Portugal 1 1 ,06%
France 1 1 ,40%
Germ any 25,3 5%
Belgium 7 ,40%
UK 1 9,1 9%
Russia n.a.
Poland 5,3 9%
Turkey 22,28%
Total 19,4%
Geographic area CAGR 2013-2018
Brazil 9,63%
Argentina 1 6,62%
Total 10,3%
PwCNovember 2014
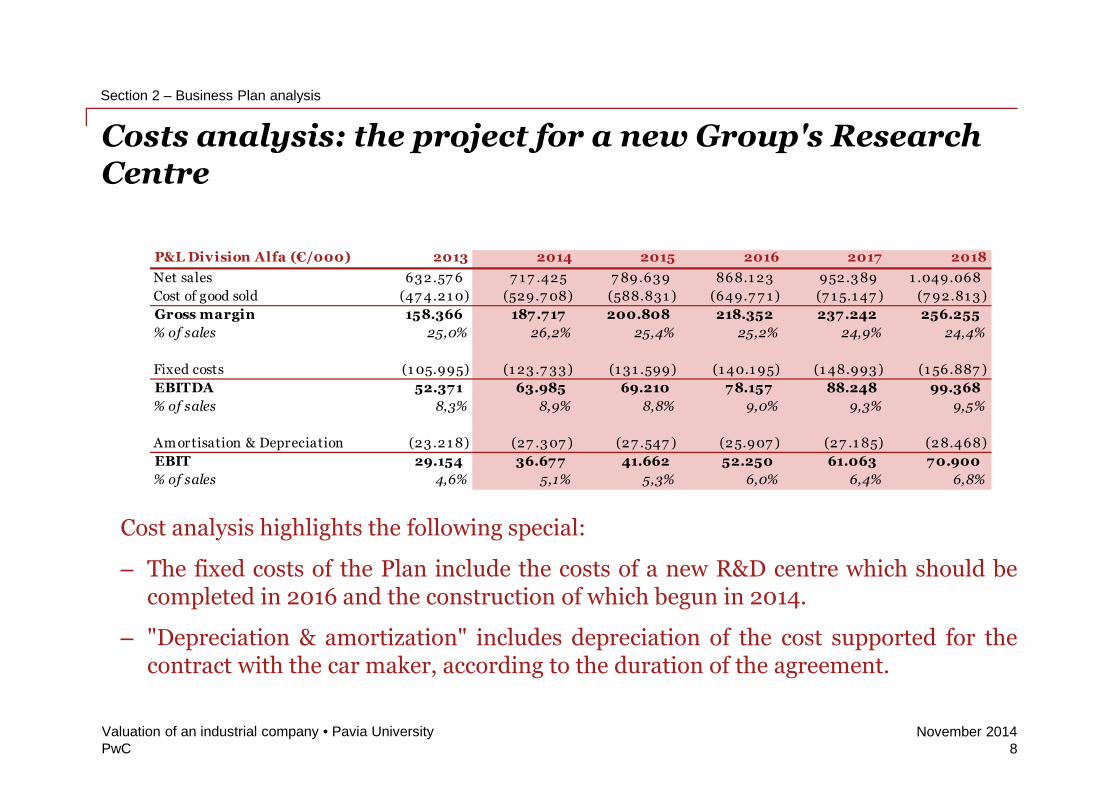
Costs analysis: the project for a new Group's ResearchCentre
Section 2 – Business Plan analysis
Valuation of an industrial company • Pavia University8
Cost analysis highlights the following special:
– The fixed costs of the Plan include the costs of a new R&D centre which should becompleted in 2016 and the construction of which begun in 2014.
– "Depreciation & amortization" includes depreciation of the cost supported for thecontract with the car maker, according to the duration of the agreement.
P&L Division Alfa (€/000) 2013 2014 2015 2016 2017 2018
Net sales 632.57 6 7 1 7 .425 7 89.639 868.1 23 952.3 89 1 .049.068
Cost of good sold (47 4.21 0) (529.7 08) (588.831 ) (649.7 7 1 ) (7 1 5.1 47 ) (7 92.81 3 )
Gross margin 158.366 187.717 200.808 218.352 237.242 256.255
% of sales 25,0% 26,2% 25,4% 25,2% 24,9% 24,4%
Fixed costs (1 05.995) (1 23 .7 33 ) (1 3 1 .599) (1 40.1 95) (1 48.993 ) (1 56.887 )
EBITDA 52.371 63.985 69.210 78.157 88.248 99.368
% of sales 8,3% 8,9% 8,8% 9,0% 9,3% 9,5%
Amortisation & Depreciation (23 .21 8) (27 .3 07 ) (27 .547 ) (25.907 ) (27 .1 85) (28.468)
EBIT 29.154 36.677 41.662 52.250 61.063 70.900
% of sales 4,6% 5,1% 5,3% 6,0% 6,4% 6,8%
PwCNovember 2014
Business Unit Beta
• Similarly, for Business Unit Beta were conducted the same analysis made forthe Business Unit Alpha:
– Analysis of competitive environment and market dynamics;
– Business Plan analysis
• From these analysis, the following features have to be taken into accountduring the valuation process:
– It isn’t required and flows normalization;
– The industry is significantly different with respect to the Business Unit Alfa(dynamics, competitors, reference markets, etc ..) and for this reason differentevaluation parameters were adopted for the two Business Units.
Section 2 – Business Plan analysis
Valuation of an industrial company • Pavia University9

PwCNovember 2014
Discounted Cash Flow methodSection 3
Valuation of an industrial company • Pavia University10
PwCNovember 2014
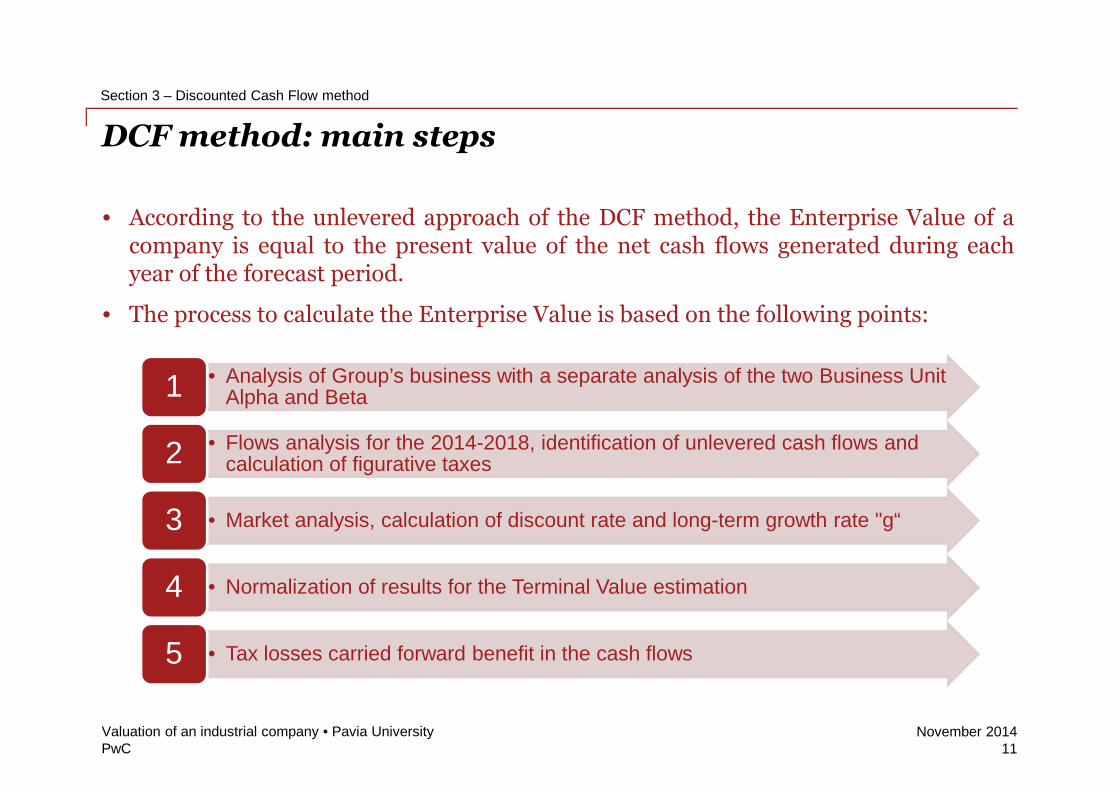
DCF method: main steps
• According to the unlevered approach of the DCF method, the Enterprise Value of acompany is equal to the present value of the net cash flows generated during eachyear of the forecast period.
• The process to calculate the Enterprise Value is based on the following points:
• Analysis of Group’s business with a separate analysis of the two Business UnitAlpha and Beta1
• Flows analysis for the 2014-2018, identification of unlevered cash flows andcalculation of figurative taxes2
• Market analysis, calculation of discount rate and long-term growth rate "g“3
• Normalization of results for the Terminal Value estimation4
• Tax losses carried forward benefit in the cash flows5
Section 3 – Discounted Cash Flow method
Valuation of an industrial company • Pavia University11
PwCNovember 2014
Business Plan: cash flow analysisSection 3.1
Valuation of an industrial company • Pavia University12
PwCNovember 2014
Discounted Cash Flow – unlevered free cash flows
Normalizationof Business
Plan cash flows
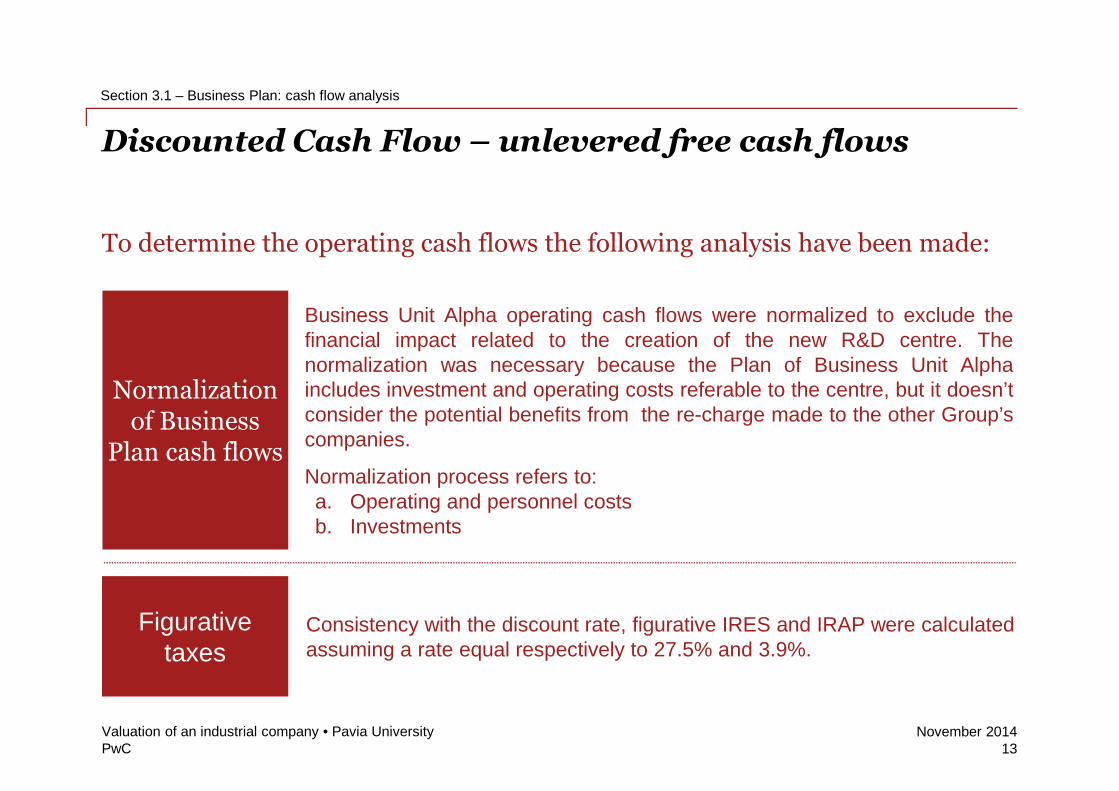
To determine the operating cash flows the following analysis have been made:
Figurativetaxes
Business Unit Alpha operating cash flows were normalized to exclude thefinancial impact related to the creation of the new R&D centre. Thenormalization was necessary because the Plan of Business Unit Alphaincludes investment and operating costs referable to the centre, but it doesn’tconsider the potential benefits from the re-charge made to the other Group’scompanies.
Normalization process refers to:a. Operating and personnel costsb. Investments
Consistency with the discount rate, figurative IRES and IRAP were calculatedassuming a rate equal respectively to 27.5% and 3.9%.
Section 3.1 – Business Plan: cash flow analysis
Valuation of an industrial company • Pavia University13
PwCNovember 2014
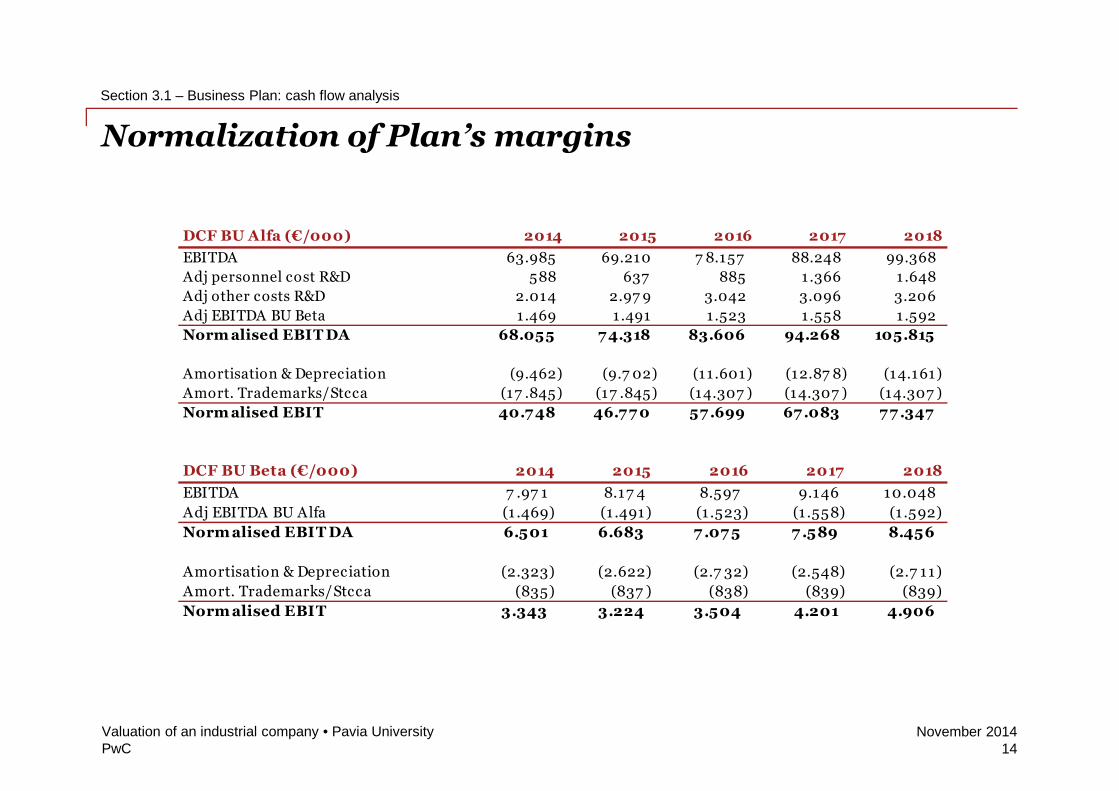
Normalization of Plan’s margins
Section 3.1 – Business Plan: cash flow analysis
Valuation of an industrial company • Pavia University14
DCF BU Beta (€/000) 2014 2015 2016 2017 2018
EBITDA 7 .97 1 8.17 4 8.597 9.146 10.048
Adj EBITDA BU Alfa (1 .469) (1 .491) (1 .523) (1 .558) (1 .592)
Norm alised EBIT DA 6.501 6.683 7 .07 5 7 .589 8.456
Amortisation & Depreciation (2.323) (2.622) (2.7 32) (2.548) (2.7 11)
Amort. Trademarks/Stcca (835) (837 ) (838) (839) (839)
Norm alised EBIT 3.343 3.224 3.504 4.201 4.906
DCF BU Alfa (€/000) 2014 2015 2016 2017 2018
EBITDA 63.985 69.210 7 8.157 88.248 99.368
Adj personnel cost R&D 588 637 885 1.366 1 .648
Adj other costs R&D 2.014 2.97 9 3.042 3.096 3.206
Adj EBITDA BU Beta 1.469 1.491 1 .523 1.558 1 .592
Norm alised EBIT DA 68.055 7 4.318 83.606 94.268 105.815
Amortisation & Depreciation (9.462) (9.7 02) (11 .601) (12.87 8) (14.161)
Amort. Trademarks/Stcca (17 .845) (17 .845) (14.307 ) (14.307 ) (14.307 )
Norm alised EBIT 40.7 48 46.7 7 0 57 .699 67 .083 7 7 .347
PwCNovember 2014
Figurative taxes on EBITSection 3.2
Valuation of an industrial company • Pavia University15
PwCNovember 2014
Calculation of figurative taxes
With regard to figurative taxes, we have proceeded with the following approach:
– Italy: we calculated IRES tax base (tax rate 27.5%) and "Carbon Tax" (tax rate 6.5%)on the basis of the EBIT of the Plan, adjusted in order to take into account:
o normalization of structural and personnel costs related to the creation of aglobal R&D centre;
o non-tax deductibility of brands’ amortization;
o Intercompany revenues from royalties.
– Rest of World: we considered country-specific EBIT and costs for royalties paid tothe BU Italy that are tax deductible.
Section 3.2 – Figurative taxes on EBIT
Valuation of an industrial company • Pavia University16
PwCNovember 2014
Discount rate (WACC)Section 3.3
Valuation of an industrial company • Pavia University17
PwCNovember 2014
Discounted Cash Flow – discount rate (WACC) 1/2
• In calculating the discount rate (WACC), you should refer to the different riskand performance profiles of each Business Unit that makes up the Group.Business Unit Alpha operates throughout the world, both in developingcountries and more mature countries, while the Business Unit Beta operatesmainly in Italy.
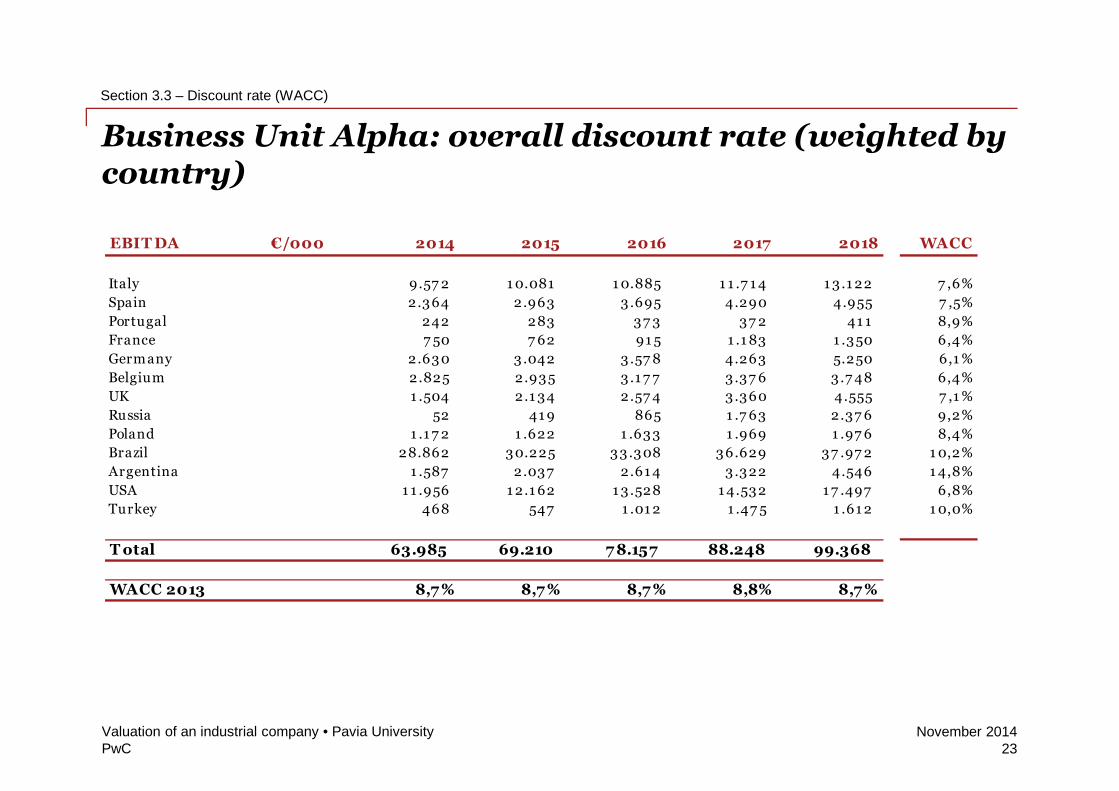
• Consequently, regarding the Alfa Business Unit, cash flows discounted usinga discount rate (WACC) different for each year of the Plan to weigh the"country risk" in discounting perspective flows. For Beta Business Unit,however, we used a single discount rate.
Section 3.3 – Discount rate (WACC)
Valuation of an industrial company • Pavia University18
PwCNovember 2014
Discounted Cash Flow – discount rate (WACC) 2/2
• The calculation of the discount rate by country was built over the followingassumptions:
– risk free rate of 10-year-BTP (or equivalent in the country) equal to the net yieldas of December 31, 2013;
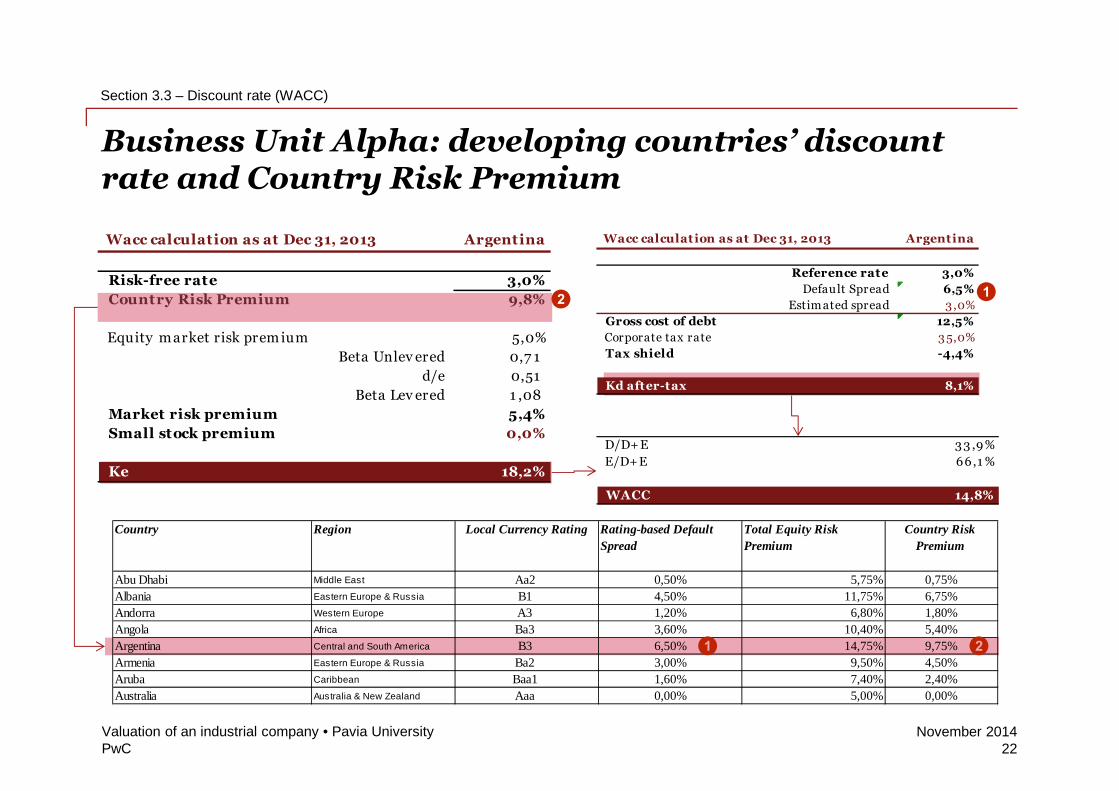
– country risk premium for each country on the base of an additional risk spread,according to the methodology suggested by Damodaran;
– Market Risk Premium ("MRP") equal to 5.0%: this value was consideredreasonable after the analysis of the Plan of Business Unit Alpha that highlighted a“conservative" approach by management for projections and estimates ofinvestments necessary to support the Group's competitive positioning;
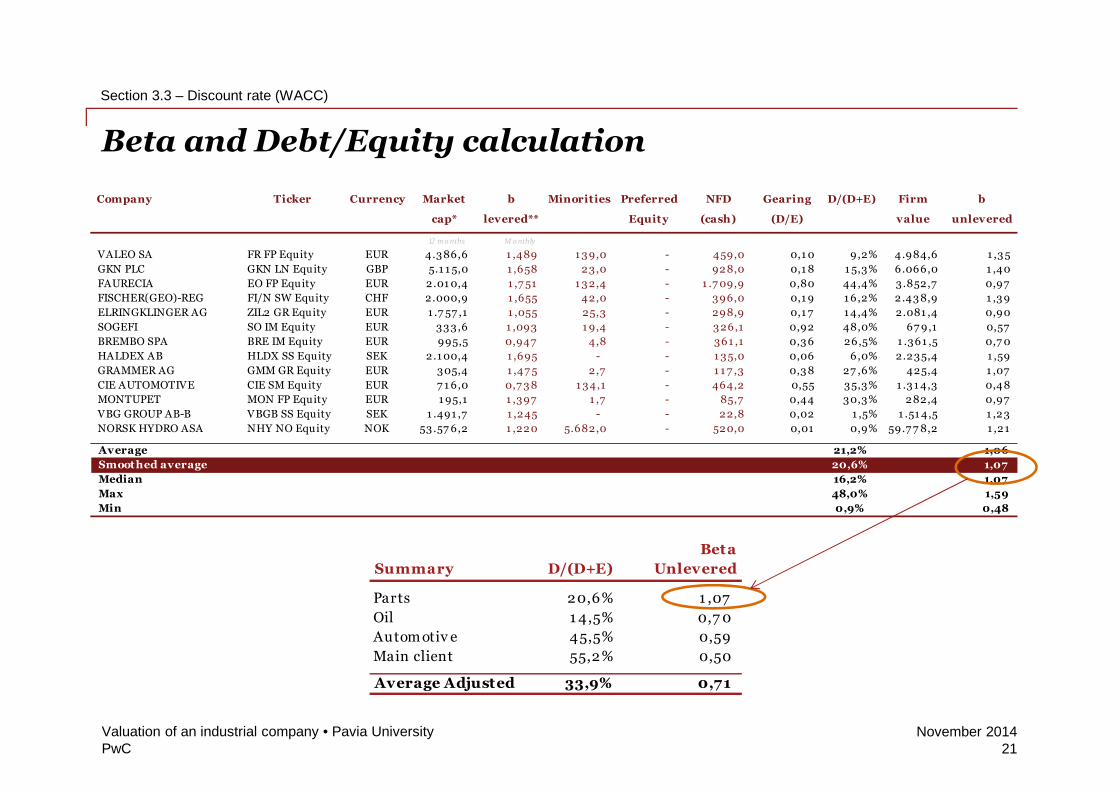
– Beta levered equal to 1.08 and Beta unlevered equal to 0.71;
– D/E structure depending on the analysis carried out on the market compared tothe identified comparable companies.
Section 3.3 – Discount rate (WACC)
Valuation of an industrial company • Pavia University19
PwCNovember 2014
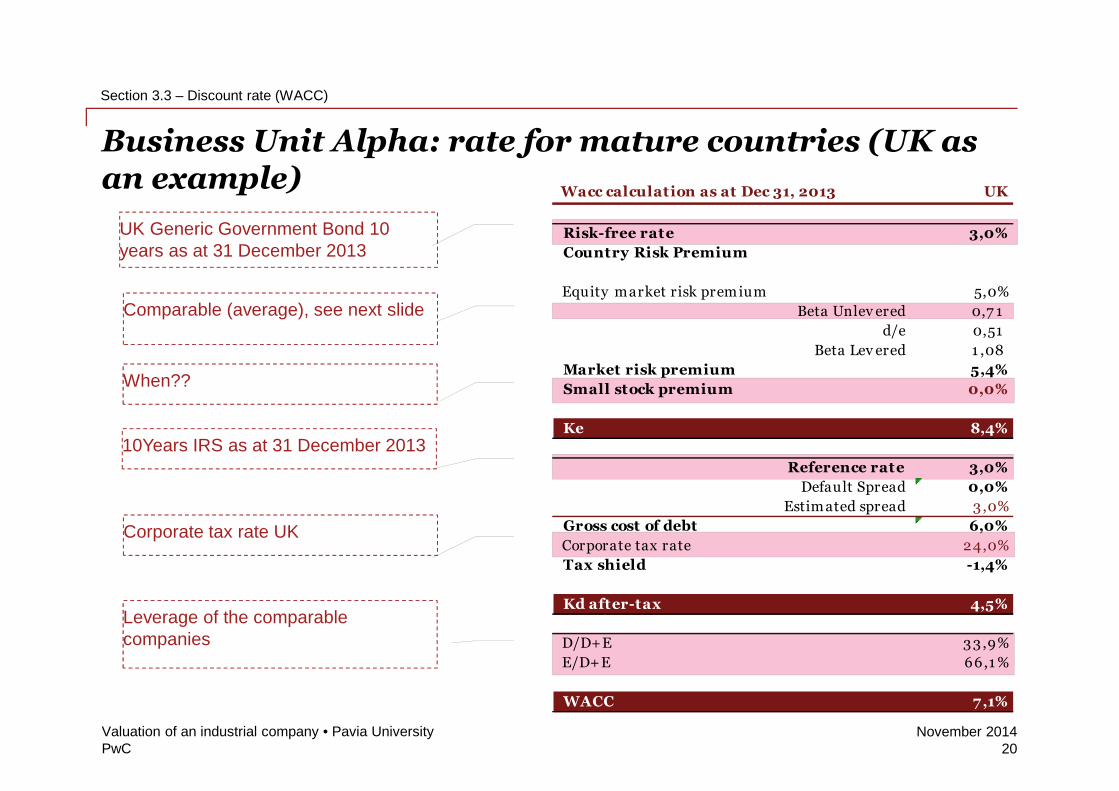
Business Unit Alpha: rate for mature countries (UK asan example)
Section 3.3 – Discount rate (WACC)
Valuation of an industrial company • Pavia University20
Corporate tax rate UK
UK Generic Government Bond 10years as at 31 December 2013
Comparable (average), see next slide
When??
10Years IRS as at 31 December 2013
Leverage of the comparablecompanies
Wacc calculation as at Dec 31, 2013 UK
Risk-free rate 3,0%
Country Risk Premium
Equity market risk prem ium 5,0%
Beta Unlev ered 0,7 1
d/e 0,51
Beta Lev ered 1 ,08
Market risk premium 5,4%
Small stock premium 0,0%
Ke 8,4%
Reference rate 3,0%
Default Spread 0,0%
Estim ated spread 3,0%
Gross cost of debt 6,0%
Corporate tax rate 24,0%
Tax shield -1,4%
Kd after-tax 4,5%
D/D+E 33,9%
E/D+E 66,1 %
WACC 7,1%
PwCNovember 2014
Beta and Debt/Equity calculation
Section 3.3 – Discount rate (WACC)
Valuation of an industrial company • Pavia University21
Company Ticker Currency Market b Minorities Preferred NFD Gearing D/(D+E) Firm b
cap* levered** Equity (cash) (D/E) value unlevered
12 m o nths M o nthly
VALEO SA FR FP Equity EUR 4.386,6 1 ,489 1 3 9,0 - 459,0 0,1 0 9,2% 4.984,6 1 ,3 5
GKN PLC GKN LN Equity GBP 5.1 1 5,0 1 ,658 23,0 - 928,0 0,1 8 1 5,3% 6.066,0 1 ,40
FAURECIA EO FP Equity EUR 2.01 0,4 1 ,7 51 1 3 2,4 - 1 .7 09,9 0,80 44,4% 3.852,7 0,97
FISCHER(GEO)-REG FI/N SW Equity CHF 2.000,9 1 ,655 42,0 - 396,0 0,1 9 1 6,2% 2.43 8,9 1 ,3 9
ELRINGKLINGER AG ZIL2 GR Equity EUR 1 .7 57 ,1 1 ,055 25,3 - 298,9 0,1 7 1 4,4% 2.081 ,4 0,90
SOGEFI SO IM Equity EUR 33 3,6 1 ,093 1 9,4 - 3 26,1 0,92 48,0% 67 9,1 0,57
BREMBO SPA BRE IM Equity EUR 995,5 0,947 4,8 - 361 ,1 0,3 6 26,5% 1 .361 ,5 0,7 0
HALDEX AB HLDX SS Equity SEK 2.1 00,4 1 ,695 - - 1 35,0 0,06 6,0% 2.235,4 1 ,59
GRAMMER AG GMM GR Equity EUR 305,4 1 ,47 5 2,7 - 1 1 7 ,3 0,3 8 27 ,6% 425,4 1 ,07
CIE AUTOMOTIVE CIE SM Equity EUR 7 1 6,0 0,7 3 8 1 34,1 - 464,2 0,55 35,3% 1 .3 1 4,3 0,48
MONTUPET MON FP Equity EUR 1 95,1 1 ,397 1 ,7 - 85,7 0,44 30,3% 282,4 0,97
VBG GROUP AB-B VBGB SS Equity SEK 1 .491 ,7 1 ,245 - - 22,8 0,02 1 ,5% 1 .51 4,5 1 ,23
NORSK HYDRO ASA NHY NO Equity NOK 53 .57 6,2 1 ,220 5.682,0 - 520,0 0,01 0,9% 59.7 7 8,2 1 ,21
Average 21,2% 1,06
Smoothed average 20,6% 1,07
Median 16,2% 1,07
Max 48,0% 1,59
Min 0,9% 0,48
Summary D/(D+E)
Beta
Unlevered
Parts 20,6% 1 ,07
Oil 1 4,5% 0,7 0
Autom otiv e 45,5% 0,59
Main client 55,2% 0,50
Average Adjusted 33,9% 0,71
PwCNovember 2014
Wacc calculation as at Dec 31, 2013 Argentina
Risk-free rate 3,0%
Country Risk Premium 9,8%
Equity market risk prem ium 5,0%
Beta Unlev ered 0,7 1
d/e 0,51
Beta Lev ered 1 ,08
Market risk premium 5,4%
Small stock premium 0,0%
Ke 18,2%
Business Unit Alpha: developing countries’ discountrate and Country Risk Premium
Section 3.3 – Discount rate (WACC)
Valuation of an industrial company • Pavia University22
Country Region Local Currency Rating Rating-based Default
Spread
Total Equity Risk
Premium
Country Risk
Premium
Abu Dhabi Middle East Aa2 0,50% 5,75% 0,75%
Albania Eastern Europe & Russia B1 4,50% 11,75% 6,75%
Andorra Western Europe A3 1,20% 6,80% 1,80%
Angola Africa Ba3 3,60% 10,40% 5,40%
Argentina Central and South America B3 6,50% 14,75% 9,75%
Armenia Eastern Europe & Russia Ba2 3,00% 9,50% 4,50%
Aruba Caribbean Baa1 1,60% 7,40% 2,40%
Australia Australia & New Zealand Aaa 0,00% 5,00% 0,00%
Wacc calculation as at Dec 31, 2013 Argentina
Reference rate 3,0%
Default Spread 6,5%
Estim ated spread 3,0%
Gross cost of debt 12,5%
Corporate tax rate 3 5,0%
Tax shield -4,4%
Kd after-tax 8,1%
!
!@
@
D/D+ E 33 ,9%
E/D+E 66,1 %
WACC 14,8%
PwCNovember 2014
Business Unit Alpha: overall discount rate (weighted bycountry)
Section 3.3 – Discount rate (WACC)
Valuation of an industrial company • Pavia University23
EBIT DA €/000 2014 2015 2016 2017 2018 WACC
Italy 9.57 2 1 0.081 1 0.885 1 1 .7 1 4 1 3.1 22 7 ,6%
Spain 2.364 2.963 3.695 4.290 4.955 7 ,5%
Portugal 242 283 37 3 37 2 41 1 8,9%
France 7 50 7 62 91 5 1 .1 83 1 .350 6,4%
Germany 2.630 3.042 3.57 8 4.263 5.250 6,1 %
Belgium 2.825 2.935 3.1 7 7 3.37 6 3.7 48 6,4%
UK 1 .504 2.1 34 2.57 4 3.360 4.555 7 ,1 %
Russia 52 41 9 865 1 .7 63 2.37 6 9,2%
Poland 1 .1 7 2 1 .622 1 .633 1 .969 1 .97 6 8,4%
Brazil 28.862 30.225 33.308 36.629 37 .97 2 1 0,2%
Argentina 1 .587 2.037 2.61 4 3.322 4.546 1 4,8%
USA 1 1 .956 1 2.1 62 1 3.528 1 4.532 1 7 .497 6,8%
Turkey 468 547 1 .01 2 1 .47 5 1 .61 2 1 0,0%
T otal 63.985 69.210 7 8.157 88.248 99.368
WACC 2013 8,7 % 8,7 % 8,7 % 8,8% 8,7 %
PwCNovember 2014
Terminal valueSection 3.4
Valuation of an industrial company • Pavia University24
PwCNovember 2014
Business Unit Alpha: Terminal Value
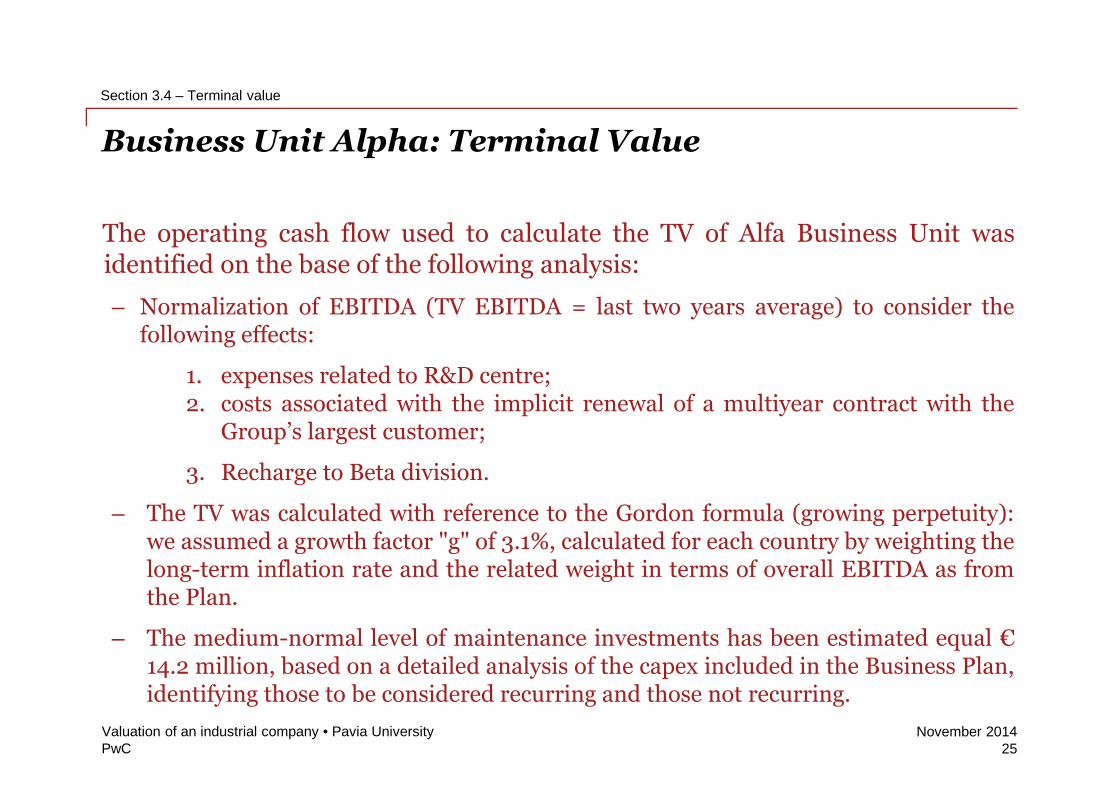
The operating cash flow used to calculate the TV of Alfa Business Unit wasidentified on the base of the following analysis:
– Normalization of EBITDA (TV EBITDA = last two years average) to consider thefollowing effects:
1. expenses related to R&D centre;2. costs associated with the implicit renewal of a multiyear contract with the
Group’s largest customer;
3. Recharge to Beta division.
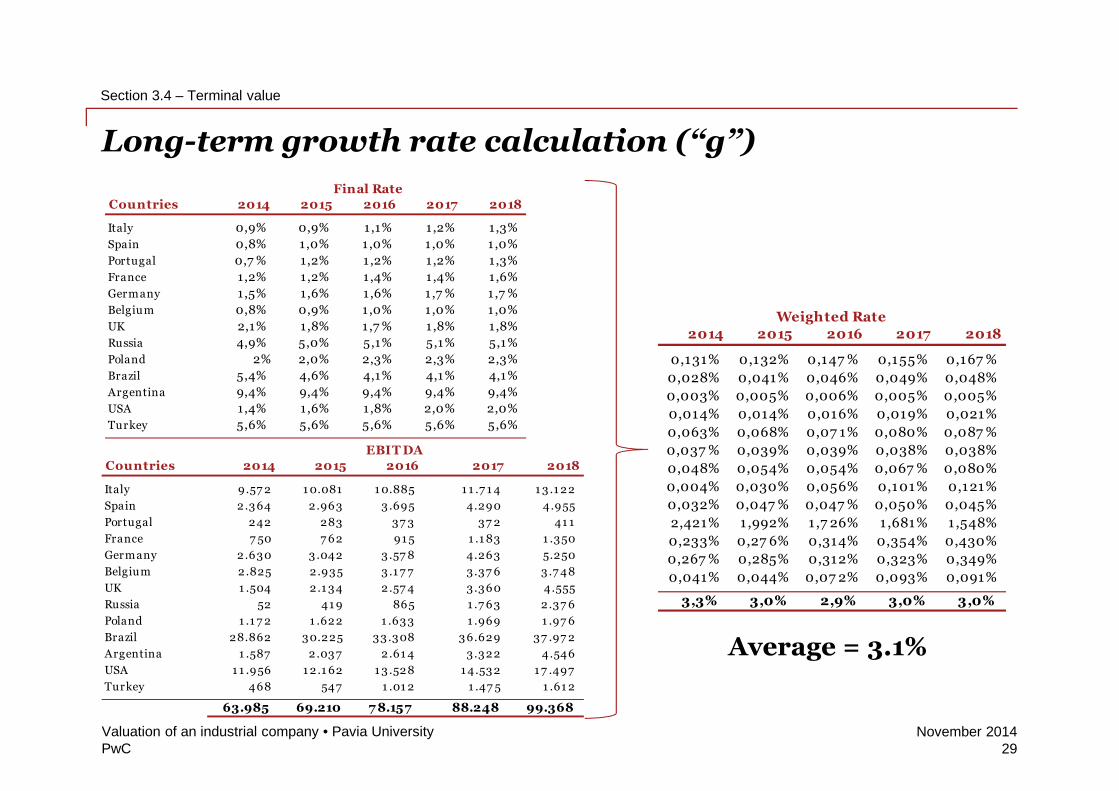
– The TV was calculated with reference to the Gordon formula (growing perpetuity):we assumed a growth factor "g" of 3.1%, calculated for each country by weighting thelong-term inflation rate and the related weight in terms of overall EBITDA as fromthe Plan.
– The medium-normal level of maintenance investments has been estimated equal €14.2 million, based on a detailed analysis of the capex included in the Business Plan,identifying those to be considered recurring and those not recurring.
Section 3.4 – Terminal value
Valuation of an industrial company • Pavia University25
PwCNovember 2014
Business Unit Beta: Terminal Value
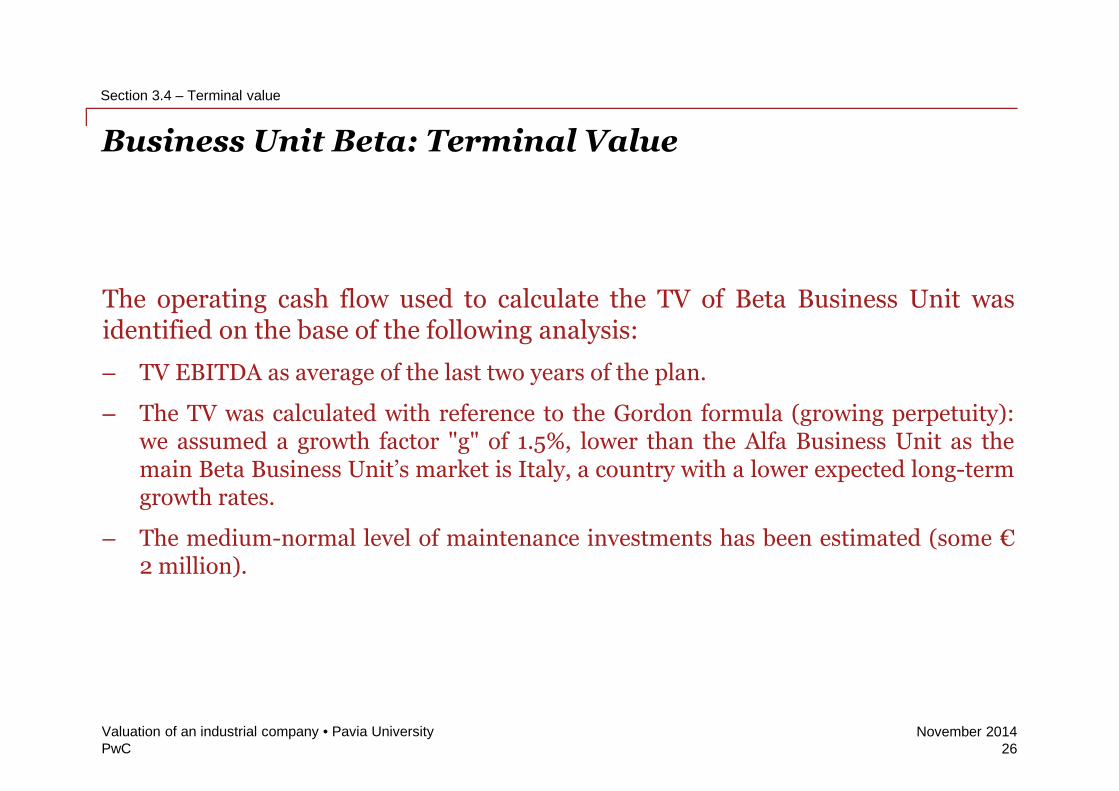
The operating cash flow used to calculate the TV of Beta Business Unit wasidentified on the base of the following analysis:
– TV EBITDA as average of the last two years of the plan.
– The TV was calculated with reference to the Gordon formula (growing perpetuity):we assumed a growth factor "g" of 1.5%, lower than the Alfa Business Unit as themain Beta Business Unit’s market is Italy, a country with a lower expected long-termgrowth rates.
– The medium-normal level of maintenance investments has been estimated (some €2 million).
Section 3.4 – Terminal value
Valuation of an industrial company • Pavia University26
PwCNovember 2014
Discounted Cash Flow – Terminal Value
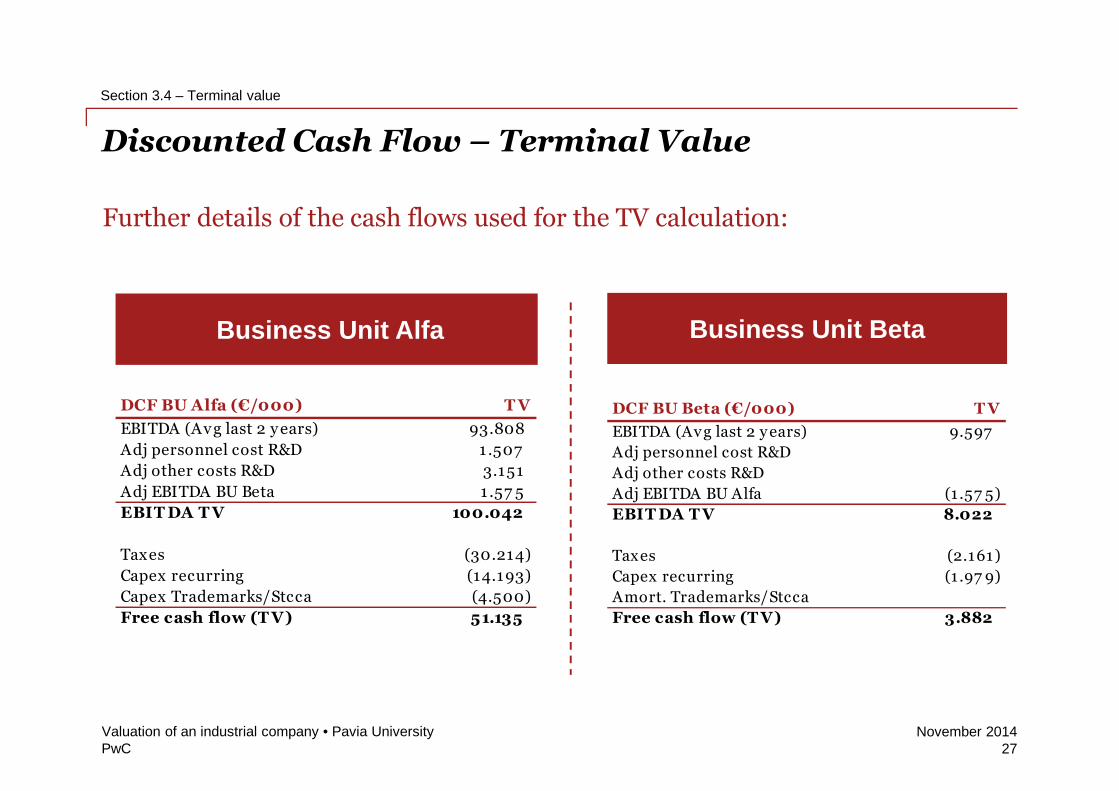
Further details of the cash flows used for the TV calculation:
Section 3.4 – Terminal value
Valuation of an industrial company • Pavia University27
Business Unit Alfa Business Unit Beta
DCF BU Alfa (€/000) T V
EBITDA (Avg last 2 y ears) 93.808
Adj personnel cost R&D 1.507
Adj other costs R&D 3.151
Adj EBITDA BU Beta 1 .57 5
EBIT DA T V 100.042
Taxes (30.214)
Capex recurring (14.193)
Capex Trademarks/Stcca (4.500)
Free cash flow (T V) 51.135
DCF BU Beta (€/000) T V
EBITDA (Avg last 2 y ears) 9.597
Adj personnel cost R&D
Adj other costs R&D
Adj EBITDA BU Alfa (1 .57 5)
EBIT DA T V 8.022
Taxes (2.161)
Capex recurring (1.97 9)
Amort. Trademarks/Stcca
Free cash flow (T V) 3.882
PwCNovember 2014
Long-term growth rate calculation (“g”)
Section 3.4 – Terminal value
Valuation of an industrial company • Pavia University28
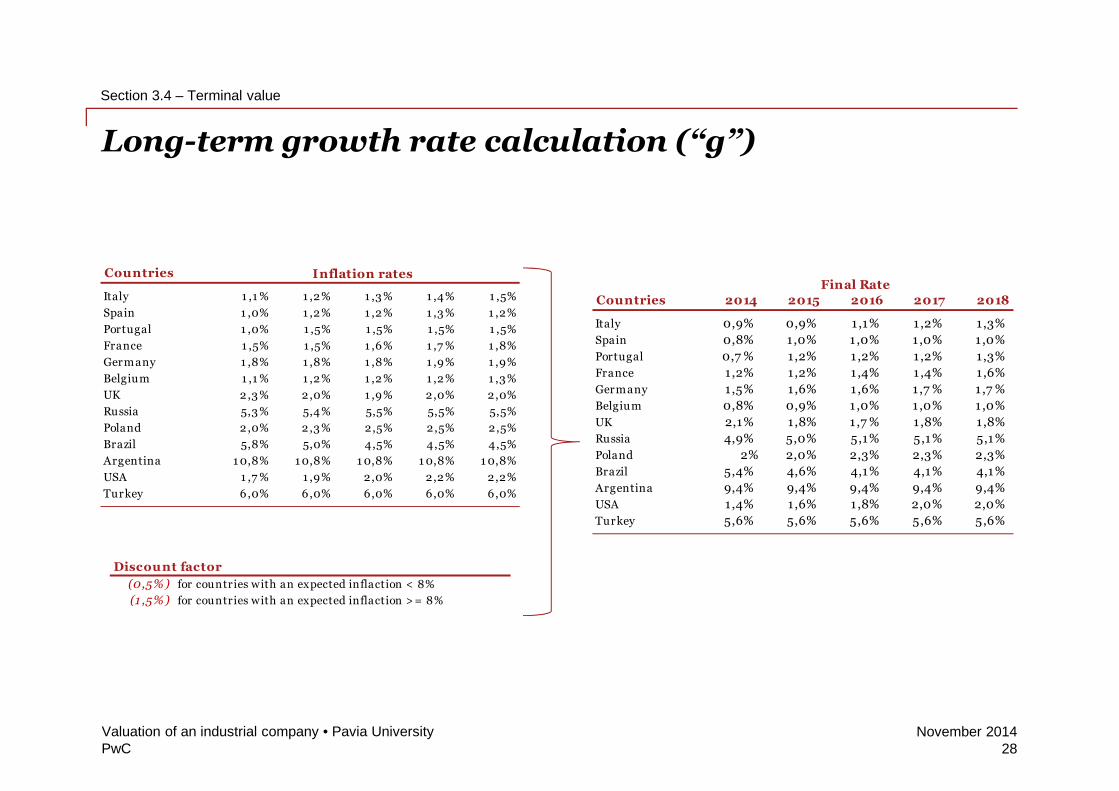
Countries
Italy 1 ,1 % 1 ,2% 1 ,3 % 1 ,4% 1 ,5%
Spain 1 ,0% 1 ,2% 1 ,2% 1 ,3 % 1 ,2%
Portugal 1 ,0% 1 ,5% 1 ,5% 1 ,5% 1 ,5%
France 1 ,5% 1 ,5% 1 ,6% 1 ,7 % 1 ,8%
Germany 1 ,8% 1 ,8% 1 ,8% 1 ,9% 1 ,9%
Belgium 1 ,1 % 1 ,2% 1 ,2% 1 ,2% 1 ,3%
UK 2,3 % 2,0% 1 ,9% 2,0% 2,0%
Russia 5,3 % 5,4% 5,5% 5,5% 5,5%
Poland 2,0% 2,3 % 2,5% 2,5% 2,5%
Brazil 5,8% 5,0% 4,5% 4,5% 4,5%
Argentina 1 0,8% 1 0,8% 1 0,8% 1 0,8% 1 0,8%
USA 1 ,7 % 1 ,9% 2,0% 2,2% 2,2%
Turkey 6,0% 6,0% 6,0% 6,0% 6,0%
Inflation rates
Countries 2014 2015 2016 2017 2018
Italy 0,9% 0,9% 1,1% 1,2% 1,3%
Spain 0,8% 1,0% 1,0% 1,0% 1,0%
Portugal 0,7 % 1,2% 1,2% 1,2% 1,3%
France 1,2% 1,2% 1,4% 1,4% 1,6%
Germany 1,5% 1,6% 1,6% 1,7 % 1,7 %
Belgium 0,8% 0,9% 1,0% 1,0% 1,0%
UK 2,1% 1,8% 1,7 % 1,8% 1,8%
Russia 4,9% 5,0% 5,1% 5,1% 5,1%
Poland 2% 2,0% 2,3% 2,3% 2,3%
Brazil 5,4% 4,6% 4,1% 4,1% 4,1%
Argentina 9,4% 9,4% 9,4% 9,4% 9,4%
USA 1,4% 1,6% 1,8% 2,0% 2,0%
Turkey 5,6% 5,6% 5,6% 5,6% 5,6%
Final Rate
(0,5% )
(1 ,5% ) for countries with an expected inflaction > = 8%
Discount factor
for countries with an expected inflaction < 8%
PwCNovember 2014
Long-term growth rate calculation (“g”)
Section 3.4 – Terminal value
Valuation of an industrial company • Pavia University29
Countries 2014 2015 2016 2017 2018
Italy 0,9% 0,9% 1,1% 1,2% 1,3%
Spain 0,8% 1,0% 1,0% 1,0% 1,0%
Portugal 0,7 % 1,2% 1,2% 1,2% 1,3%
France 1,2% 1,2% 1,4% 1,4% 1,6%
Germany 1,5% 1,6% 1,6% 1,7 % 1,7 %
Belgium 0,8% 0,9% 1,0% 1,0% 1,0%
UK 2,1% 1,8% 1,7 % 1,8% 1,8%
Russia 4,9% 5,0% 5,1% 5,1% 5,1%
Poland 2% 2,0% 2,3% 2,3% 2,3%
Brazil 5,4% 4,6% 4,1% 4,1% 4,1%
Argentina 9,4% 9,4% 9,4% 9,4% 9,4%
USA 1,4% 1,6% 1,8% 2,0% 2,0%
Turkey 5,6% 5,6% 5,6% 5,6% 5,6%
Final Rate
Countries 2014 2015 2016 2017 2018
Italy 9.57 2 1 0.081 1 0.885 1 1 .7 1 4 1 3 .1 22
Spain 2.3 64 2.963 3 .695 4.290 4.955
Portugal 242 283 37 3 37 2 41 1
France 7 50 7 62 91 5 1 .1 83 1 .350
Germany 2.630 3 .042 3 .57 8 4.263 5.250
Belgium 2.825 2.935 3 .1 7 7 3.37 6 3 .7 48
UK 1 .504 2.1 3 4 2.57 4 3.360 4.555
Russia 52 41 9 865 1 .7 63 2.37 6
Poland 1 .1 7 2 1 .622 1 .63 3 1 .969 1 .97 6
Brazil 28.862 30.225 33 .308 3 6.629 37 .97 2
Argentina 1 .587 2.03 7 2.61 4 3.322 4.546
USA 1 1 .956 1 2.1 62 1 3 .528 1 4.53 2 1 7 .497
Turkey 468 547 1 .01 2 1 .47 5 1 .61 2
63.985 69.210 7 8.157 88.248 99.368
EBIT DA
2014 2015 2016 2017 2018
0,131% 0,132% 0,147 % 0,155% 0,167 %
0,028% 0,041% 0,046% 0,049% 0,048%
0,003% 0,005% 0,006% 0,005% 0,005%
0,014% 0,014% 0,016% 0,019% 0,021%
0,063% 0,068% 0,07 1% 0,080% 0,087 %
0,037 % 0,039% 0,039% 0,038% 0,038%
0,048% 0,054% 0,054% 0,067 % 0,080%
0,004% 0,030% 0,056% 0,101% 0,121%
0,032% 0,047 % 0,047 % 0,050% 0,045%
2,421% 1,992% 1,7 26% 1,681% 1,548%
0,233% 0,27 6% 0,314% 0,354% 0,430%
0,267 % 0,285% 0,312% 0,323% 0,349%
0,041% 0,044% 0,07 2% 0,093% 0,091%
3,3% 3,0% 2,9% 3,0% 3,0%
Weighted Rate
Average = 3.1%

PwCNovember 2014
Surplus assetsSection 3.5
Valuation of an industrial company • Pavia University30
PwCNovember 2014
Calculation of tax benefits related to the use of past taxlosses
• We have also considered the discounted tax benefits arising from the use ofpast tax losses carried forward indefinitely and referable to Italy and Spain.The value so determined was regarded as a surplus asset.
• Conservatively, we didn’t consider tax losses that may accrue in the future onthe base of Plan’s results.
Section 3.5 – Surplus assets
Valuation of an industrial company • Pavia University31
PwCNovember 2014
DCF resultsSection 3.6
Valuation of an industrial company • Pavia University32
PwCNovember 2014
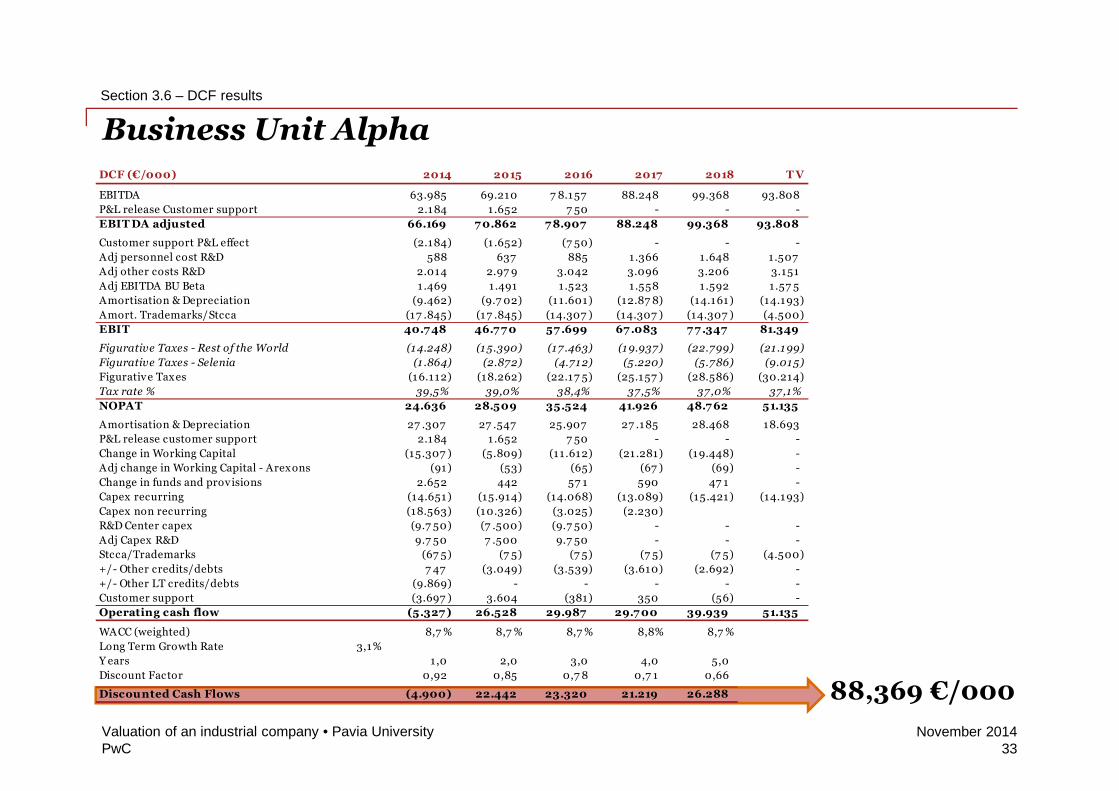
Business Unit Alpha
Section 3.6 – DCF results
Valuation of an industrial company • Pavia University33
DCF (€/000) 2014 2015 2016 2017 2018 T V
EBITDA 63.985 69.210 7 8.157 88.248 99.368 93.808
P&L release Customer support 2.184 1 .652 7 50 - - -
EBIT DA adjusted 66.169 7 0.862 7 8.907 88.248 99.368 93.808
Customer support P&L effect (2.184) (1 .652) (7 50) - - -
Adj personnel cost R&D 588 637 885 1.366 1.648 1.507
Adj other costs R&D 2.014 2.97 9 3.042 3.096 3.206 3.151
Adj EBITDA BU Beta 1 .469 1.491 1.523 1.558 1.592 1.57 5
Amortisation & Depreciation (9.462) (9.7 02) (11.601) (12.87 8) (14.161) (14.193)
Amort. Trademarks/Stcca (17 .845) (17 .845) (14.307 ) (14.307 ) (14.307 ) (4.500)
EBIT 40.7 48 46.7 7 0 57 .699 67 .083 7 7 .347 81.349
Figurative Taxes - Rest of the World (14.248) (15.390) (17 .463) (19.937) (22.799) (21.199)
Figurative Taxes - Selenia (1 .864) (2.872) (4.712) (5.220) (5.786) (9.015)
Figurativ e Taxes (16.112) (18.262) (22.17 5) (25.157 ) (28.586) (30.214)
Tax rate % 39,5% 39,0% 38,4% 37,5% 37,0% 37,1%
NOPAT 24.636 28.509 35.524 41.926 48.7 62 51.135
Amortisation & Depreciation 27 .307 27 .547 25.907 27 .185 28.468 18.693
P&L release customer support 2.184 1 .652 7 50 - - -
Change in Working Capital (15.307 ) (5.809) (11.612) (21 .281) (19.448) -
Adj change in Working Capital - Arexons (91) (53) (65) (67 ) (69) -
Change in funds and provisions 2.652 442 57 1 590 47 1 -
Capex recurring (14.651) (15.914) (14.068) (13.089) (15.421) (14.193)
Capex non recurring (18.563) (10.326) (3.025) (2.230)
R&D Center capex (9.7 50) (7 .500) (9.7 50) - - -
Adj Capex R&D 9.7 50 7 .500 9.7 50 - - -
Stcca/Trademarks (67 5) (7 5) (7 5) (7 5) (7 5) (4.500)
+/- Other credits/debts 7 47 (3.049) (3.539) (3.610) (2.692) -
+/- Other LT credits/debts (9.869) - - - - -
Customer support (3.697 ) 3.604 (381) 350 (56) -
Operating cash flow (5.327 ) 26.528 29.987 29.7 00 39.939 51.135
WACC (weighted) 8,7 % 8,7 % 8,7 % 8,8% 8,7 %
Long Term Growth Rate 3,1%
Y ears 1,0 2,0 3,0 4,0 5,0
Discount Factor 0,92 0,85 0,7 8 0,7 1 0,66
Discounted Cash Flows (4.900) 22.442 23.320 21.219 26.288 88,369 €/000
PwCNovember 2014
Business Unit Alpha
Section 3.6 – DCF results
Valuation of an industrial company • Pavia University34
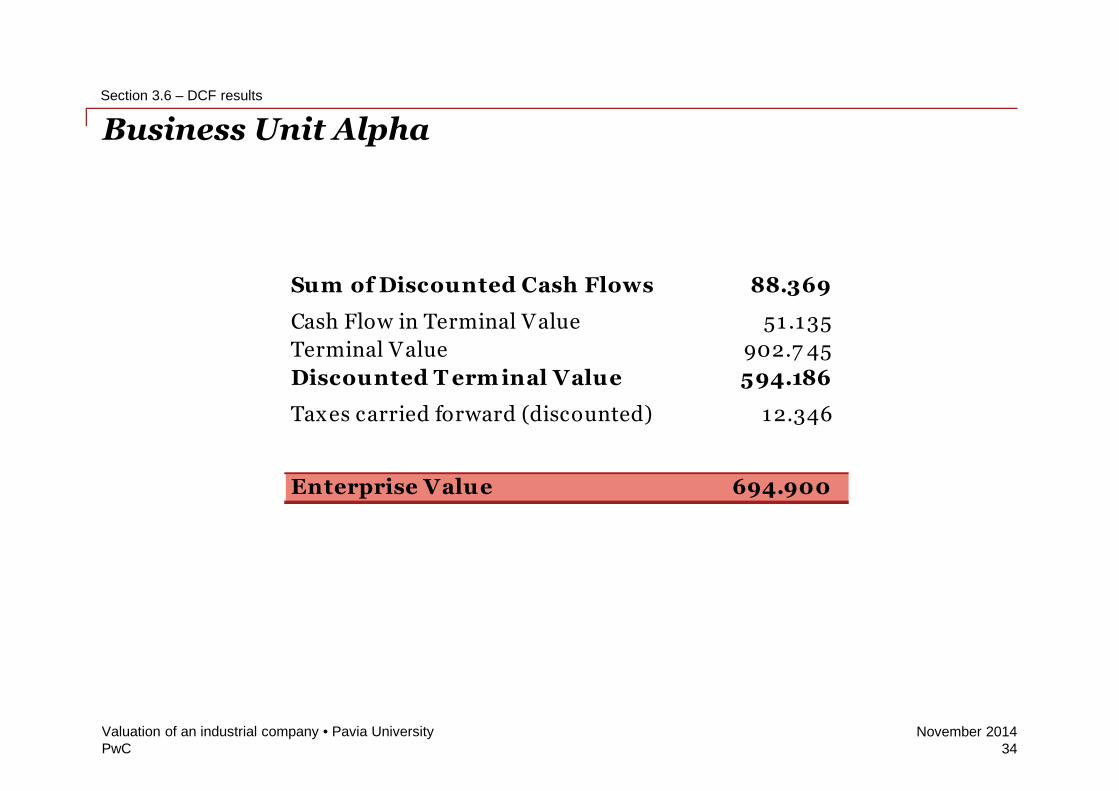
Sum of Discounted Cash Flows 88.369
Cash Flow in Terminal Value 51 .135
Terminal Value 902.7 45
Discounted T erm inal Value 594.186
Taxes carried forward (discounted) 12.346
Enterprise Value 694.900
PwCNovember 2014
Business Unit Beta
Section 3.6 – DCF results
Valuation of an industrial company • Pavia University35
6,950 €/000
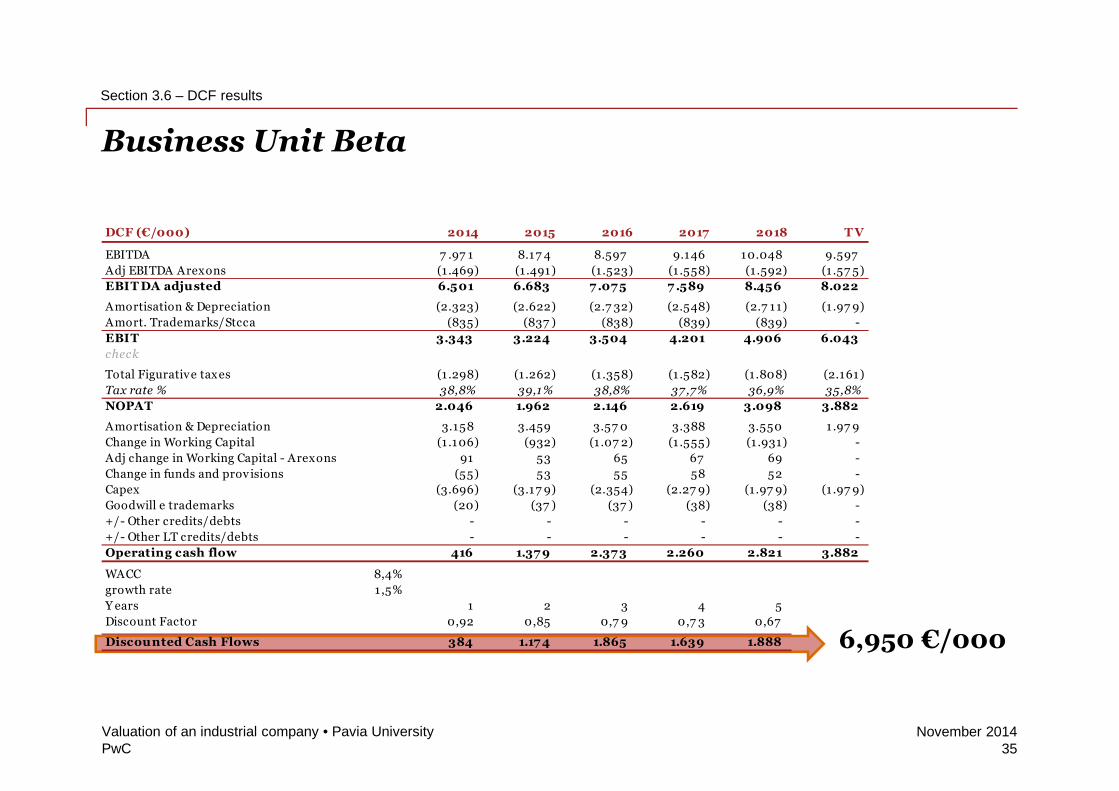
DCF (€/000) 2014 2015 2016 2017 2018 T V
EBITDA 7 .97 1 8.17 4 8.597 9.146 10.048 9.597
Adj EBITDA Arexons (1 .469) (1 .491) (1.523) (1 .558) (1.592) (1 .57 5)
EBIT DA adjusted 6.501 6.683 7 .07 5 7 .589 8.456 8.022
Amortisation & Depreciation (2.323) (2.622) (2.7 32) (2.548) (2.7 11) (1 .97 9)
Amort. Trademarks/Stcca (835) (837 ) (838) (839) (839) -
EBIT 3.343 3.224 3.504 4.201 4.906 6.043
check
Total Figurative taxes (1 .298) (1 .262) (1.358) (1 .582) (1.808) (2.161)
Tax rate % 38,8% 39,1% 38,8% 37 ,7% 36,9% 35,8%
NOPAT 2.046 1.962 2.146 2.619 3.098 3.882
Amortisation & Depreciation 3.158 3.459 3.57 0 3.388 3.550 1.97 9
Change in Working Capital (1 .106) (932) (1 .07 2) (1 .555) (1 .931) -
Adj change in Working Capital - Arexons 91 53 65 67 69 -
Change in funds and prov isions (55) 53 55 58 52 -
Capex (3.696) (3.17 9) (2.354) (2.27 9) (1.97 9) (1 .97 9)
Goodwill e trademarks (20) (37 ) (37 ) (38) (38) -
+/- Other credits/debts - - - - - -
+/- Other LT credits/debts - - - - - -
Operating cash flow 416 1.37 9 2.37 3 2.260 2.821 3.882
WACC 8,4%
growth rate 1 ,5%
Y ears 1 2 3 4 5
Discount Factor 0,92 0,85 0,7 9 0,7 3 0,67
Discounted Cash Flows 384 1.17 4 1.865 1.639 1.888
PwCNovember 2014
Business Unit Beta
Section 3.6 – DCF results
Valuation of an industrial company • Pavia University36
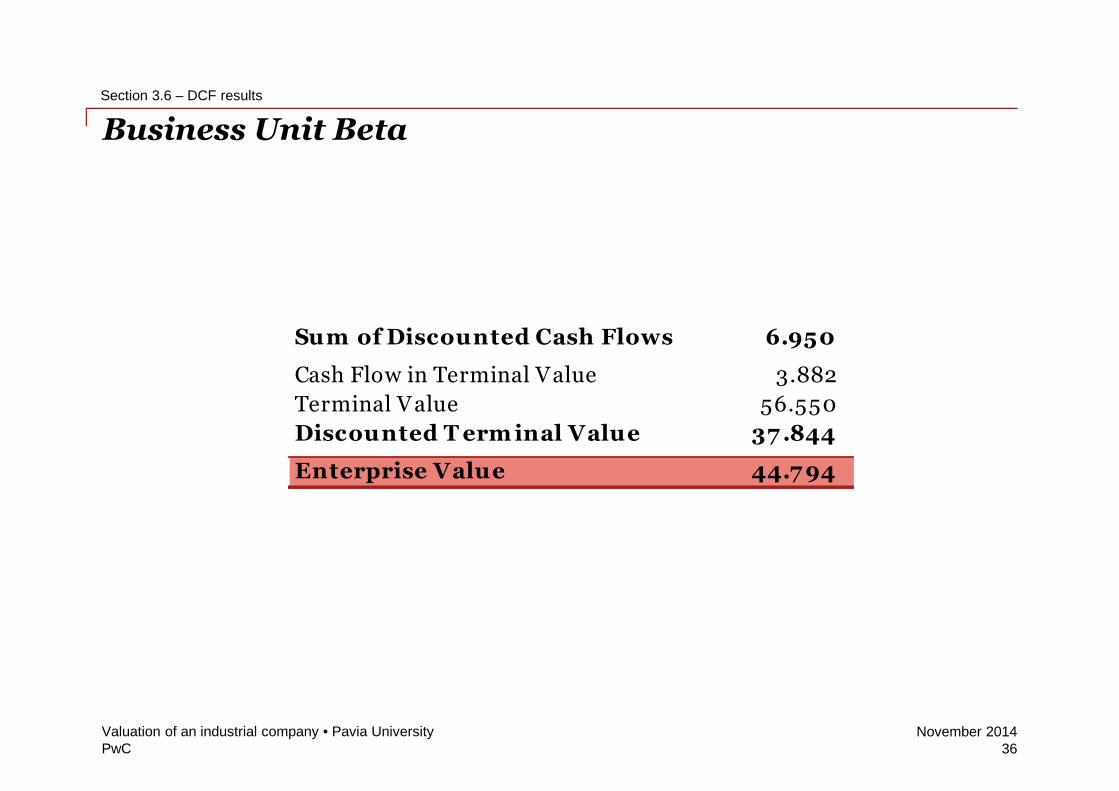
Sum of Discounted Cash Flows 6.950
Cash Flow in Terminal Value 3.882
Terminal Value 56.550
Discounted T erm inal Value 37 .844
Enterprise Value 44.7 94
PwCNovember 2014
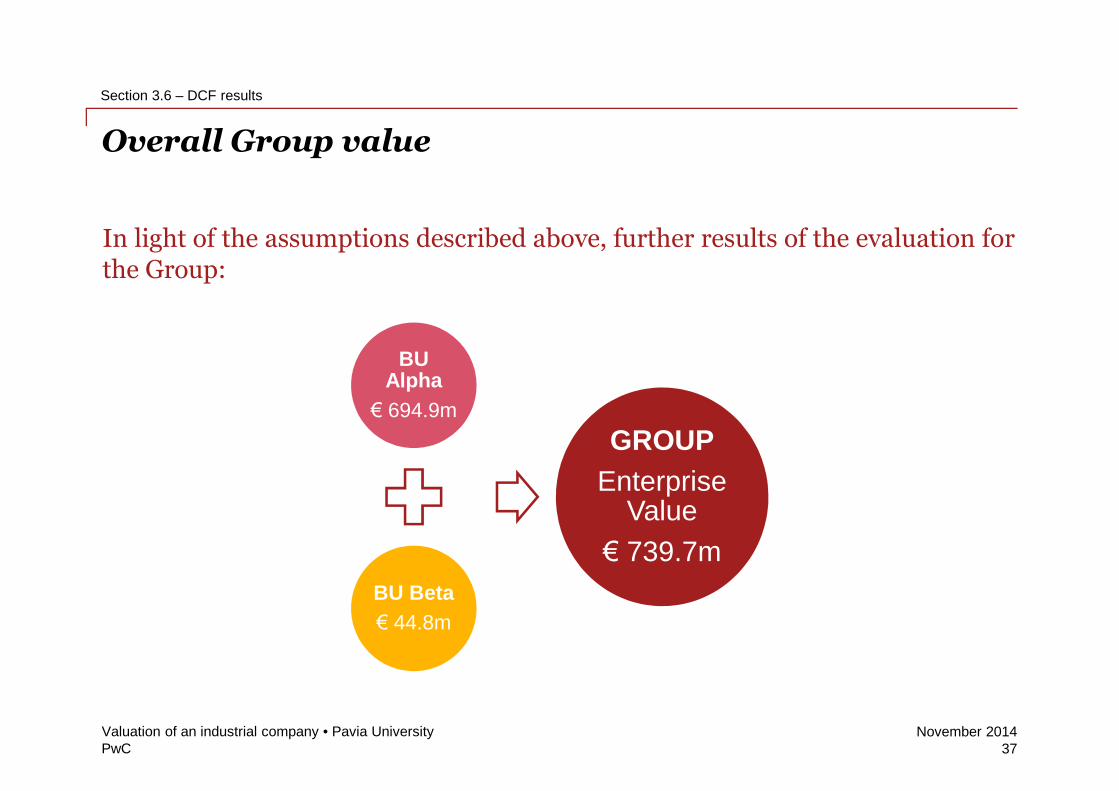
Overall Group value
In light of the assumptions described above, further results of the evaluation forthe Group:
BUAlpha
€ 694.9m
BU Beta
€ 44.8m
GROUP
EnterpriseValue
€ 739.7m
Section 3.6 – DCF results
Valuation of an industrial company • Pavia University37
PwCNovember 2014
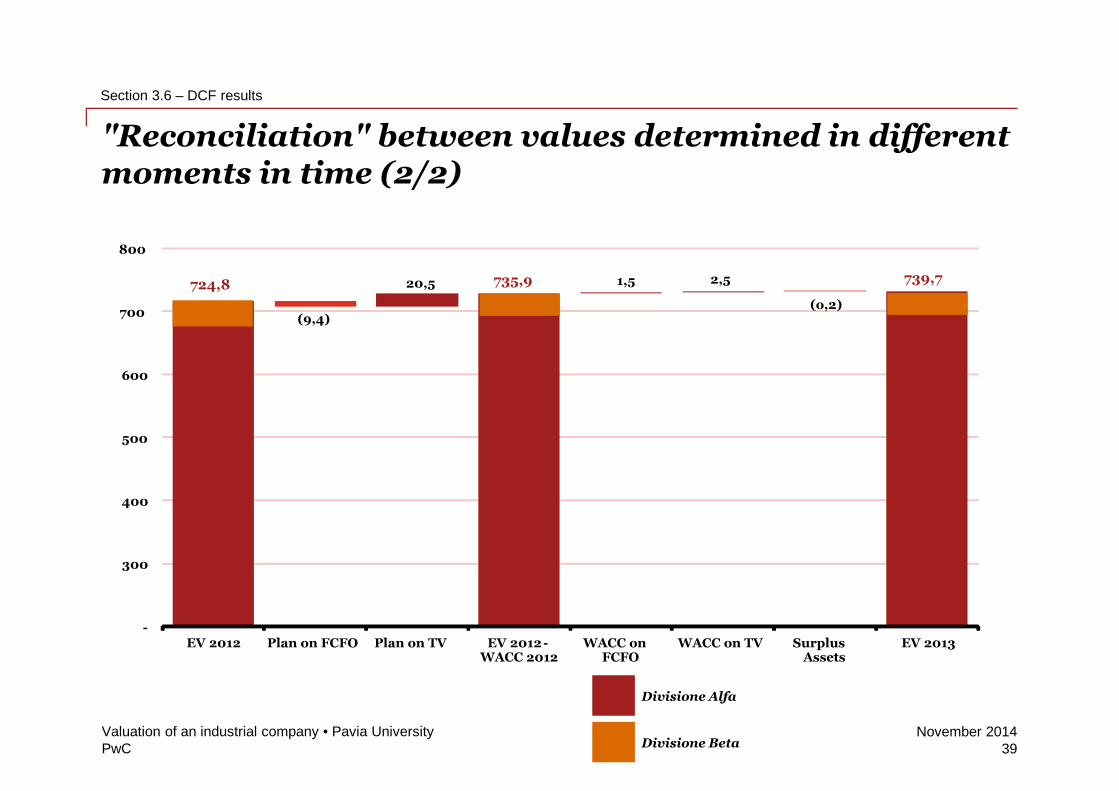
"Reconciliation" between values determined in differentmoments in time (1/2)
With regard to the value arising from this valuation exercise, it was decided tocompare this EV with those calculated in the previous year to assess the logicalconsistency. In particular, the comparison was made on the base of thefollowing:
– time horizon is homogeneous with respect to explicit flows;
– analysis of major changes for both Alpha and Beta Business Units;
– analysis of the impact on the value of the main components identified, both inexplicit flows and Terminal Value;
– quantification of the main effects with regard to cash flows and discount rate(WACC).
Section 3.6 – DCF results
Valuation of an industrial company • Pavia University38
PwCNovember 2014
"Reconciliation" between values determined in differentmoments in time (2/2)
Section 3.6 – DCF results
Valuation of an industrial company • Pavia University39
724,8
(9,4)
20,5 735,9 1,5 2,5
(o,2)
739,7
-
300
400
500
600
700
800
EV 2012 Plan on FCFO Plan on TV EV 2012 -WACC 2012
WACC onFCFO
WACC on TV SurplusAssets
EV 2013
Divisione Beta
Divisione Alfa

PwCNovember 2014
Sensitivity analysisSection 3.7
Valuation of an industrial company • Pavia University40
PwCNovember 2014
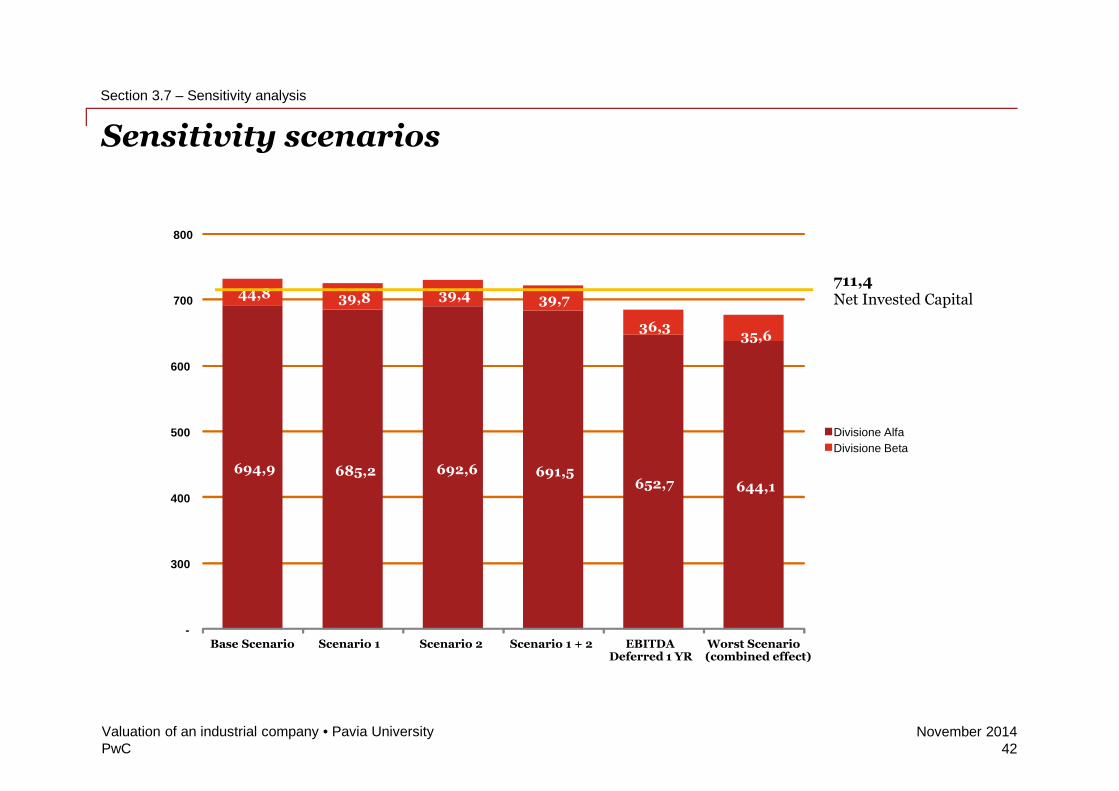
Sensitivity analysis
• In the final phase of the valuation, we have to verify the value of thecompany/asset and interpret the results in light of the general framework inorder to check the logical consistency and minimize the possibility of error.In fact, since the results are related to plans, and therefore to uncertaintiesand risks, you "must consider the value in terms of scenarios and valueranges that reflects such uncertainty" (Tom Copeland, The value of thecompany).
• In order to reduce the error margin, who perform the valuation may:
– identify factors that can invalidate the assumptions of the plan;
– estimate the likelihood of those events and factors, related to a general situationand/or the specific company, to occur;
– develop alternative scenarios suggested by the results of the analysis previouslyundertaken in order to highlight "the value ...in each assumption made, rather thandevelop a single forecast, considered the most likely and determine a singlevalue...“ (Tom Copeland).
Section 3.7 – Sensitivity analysis
Valuation of an industrial company • Pavia University41
PwCNovember 2014
Sensitivity scenarios
Section 3.7 – Sensitivity analysis
Valuation of an industrial company • Pavia University42
694,9 685,2 692,6 691,5652,7 644,1
44,8 39,8 39,4 39,7
36,335,6
-
300
400
500
600
700
800
Base Scenario Scenario 1 Scenario 2 Scenario 1 + 2 EBITDADeferred 1 YR
Worst Scenario(combined effect)
Divisione Beta
Divisione Alfa
711,4Net Invested Capital
PwCNovember 2014
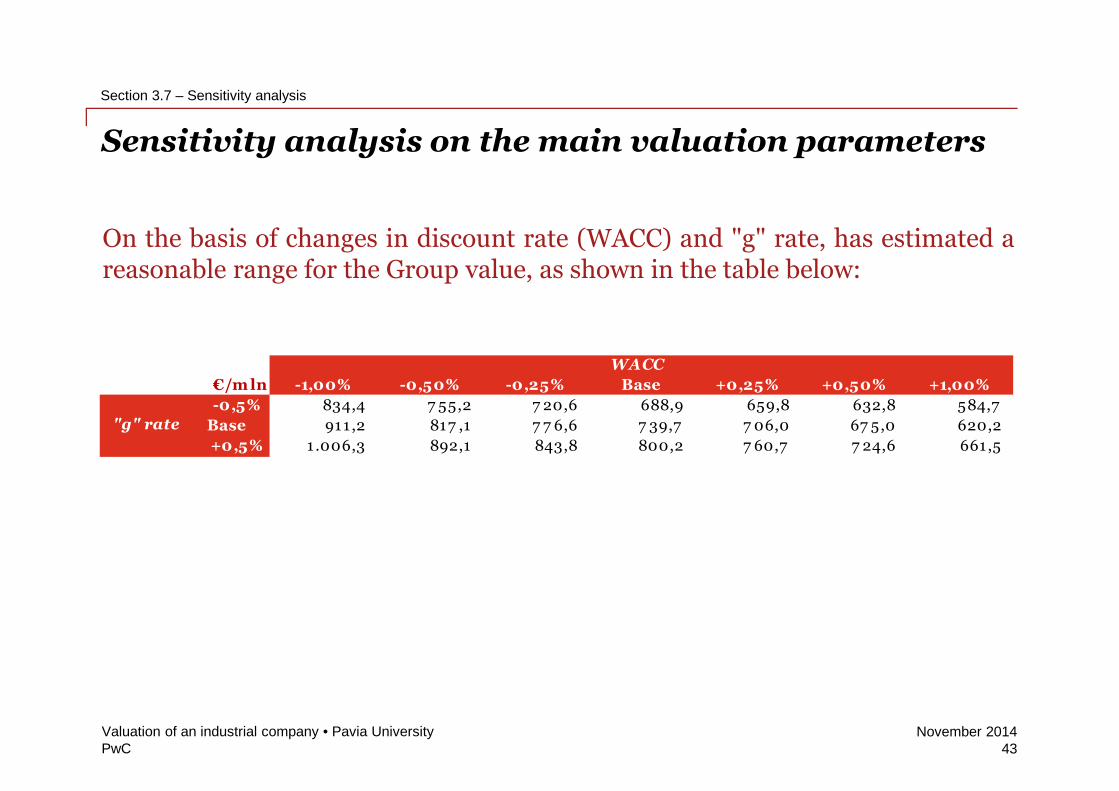
Sensitivity analysis on the main valuation parameters
On the basis of changes in discount rate (WACC) and "g" rate, has estimated areasonable range for the Group value, as shown in the table below:
Section 3.7 – Sensitivity analysis
Valuation of an industrial company • Pavia University43
€/m ln -1,00% -0,50% -0,25% Base +0,25% +0,50% +1,00%
-0,5% 834,4 7 55,2 7 20,6 688,9 659,8 632,8 584,7
Base 911 ,2 817 ,1 7 7 6,6 7 39,7 7 06,0 67 5,0 620,2
+0,5% 1 .006,3 892,1 843,8 800,2 7 60,7 7 24,6 661 ,5
WACC
"g" rate
PwCNovember 2014
Market multiple methodologySection 4
Valuation of an industrial company • Pavia University44
PwCNovember 2014
The market multiples as a control method
In order to check the "sustainability" of the Enterprise Value determinedthrough the DCF method we have done a comparison with the EV obtained withthe market multiples method, referring to the same "panel" of comparablecompanies used for beta determination.
Section 4 – Market multiple methodology
Valuation of an industrial company • Pavia University45
PwCNovember 2014
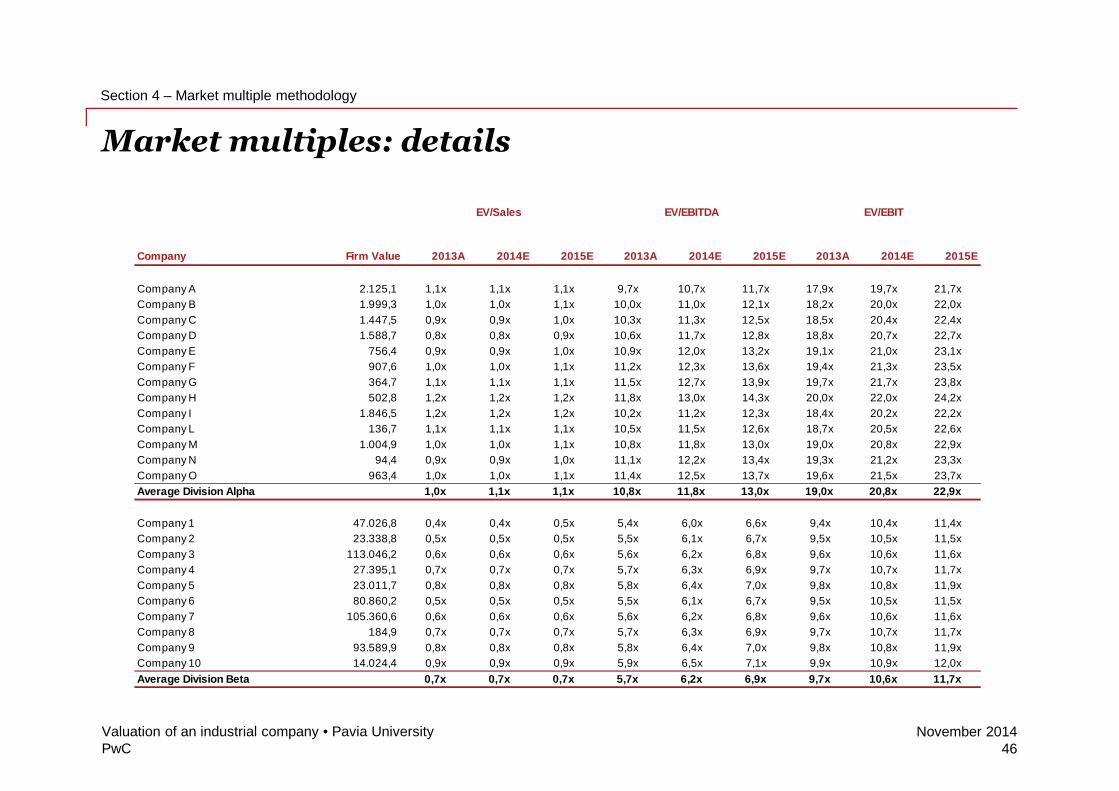
Market multiples: details
Section 4 – Market multiple methodology
Valuation of an industrial company • Pavia University46
Company Firm Value 2013A 2014E 2015E 2013A 2014E 2015E 2013A 2014E 2015E
Company A 2.125,1 1,1x 1,1x 1,1x 9,7x 10,7x 11,7x 17,9x 19,7x 21,7x
Company B 1.999,3 1,0x 1,0x 1,1x 10,0x 11,0x 12,1x 18,2x 20,0x 22,0x
Company C 1.447,5 0,9x 0,9x 1,0x 10,3x 11,3x 12,5x 18,5x 20,4x 22,4x
Company D 1.588,7 0,8x 0,8x 0,9x 10,6x 11,7x 12,8x 18,8x 20,7x 22,7x
Company E 756,4 0,9x 0,9x 1,0x 10,9x 12,0x 13,2x 19,1x 21,0x 23,1x
Company F 907,6 1,0x 1,0x 1,1x 11,2x 12,3x 13,6x 19,4x 21,3x 23,5x
Company G 364,7 1,1x 1,1x 1,1x 11,5x 12,7x 13,9x 19,7x 21,7x 23,8x
Company H 502,8 1,2x 1,2x 1,2x 11,8x 13,0x 14,3x 20,0x 22,0x 24,2x
Company I 1.846,5 1,2x 1,2x 1,2x 10,2x 11,2x 12,3x 18,4x 20,2x 22,2x
Company L 136,7 1,1x 1,1x 1,1x 10,5x 11,5x 12,6x 18,7x 20,5x 22,6x
Company M 1.004,9 1,0x 1,0x 1,1x 10,8x 11,8x 13,0x 19,0x 20,8x 22,9x
Company N 94,4 0,9x 0,9x 1,0x 11,1x 12,2x 13,4x 19,3x 21,2x 23,3x
Company O 963,4 1,0x 1,0x 1,1x 11,4x 12,5x 13,7x 19,6x 21,5x 23,7x
Average Division Alpha 1,0x 1,1x 1,1x 10,8x 11,8x 13,0x 19,0x 20,8x 22,9x
Company 1 47.026,8 0,4x 0,4x 0,5x 5,4x 6,0x 6,6x 9,4x 10,4x 11,4x
Company 2 23.338,8 0,5x 0,5x 0,5x 5,5x 6,1x 6,7x 9,5x 10,5x 11,5x
Company 3 113.046,2 0,6x 0,6x 0,6x 5,6x 6,2x 6,8x 9,6x 10,6x 11,6x
Company 4 27.395,1 0,7x 0,7x 0,7x 5,7x 6,3x 6,9x 9,7x 10,7x 11,7x
Company 5 23.011,7 0,8x 0,8x 0,8x 5,8x 6,4x 7,0x 9,8x 10,8x 11,9x
Company 6 80.860,2 0,5x 0,5x 0,5x 5,5x 6,1x 6,7x 9,5x 10,5x 11,5x
Company 7 105.360,6 0,6x 0,6x 0,6x 5,6x 6,2x 6,8x 9,6x 10,6x 11,6x
Company 8 184,9 0,7x 0,7x 0,7x 5,7x 6,3x 6,9x 9,7x 10,7x 11,7x
Company 9 93.589,9 0,8x 0,8x 0,8x 5,8x 6,4x 7,0x 9,8x 10,8x 11,9x
Company 10 14.024,4 0,9x 0,9x 0,9x 5,9x 6,5x 7,1x 9,9x 10,9x 12,0x
Average Division Beta 0,7x 0,7x 0,7x 5,7x 6,2x 6,9x 9,7x 10,6x 11,7x
EV/Sales EV/EBITDA EV/EBIT
PwCNovember 2014
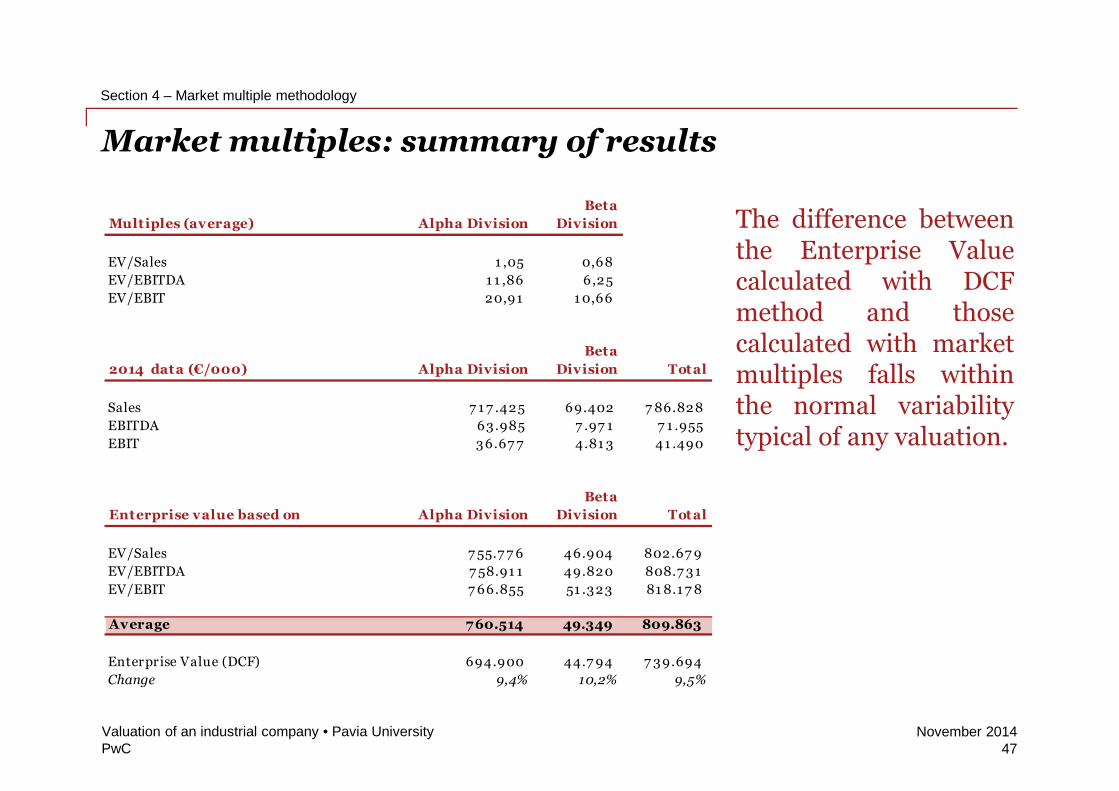
Market multiples: summary of results
The difference betweenthe Enterprise Valuecalculated with DCFmethod and thosecalculated with marketmultiples falls withinthe normal variabilitytypical of any valuation.
Section 4 – Market multiple methodology
Valuation of an industrial company • Pavia University47
Multiples (average) Alpha Division
Beta
Division
EV/Sales 1 ,05 0,68
EV/EBITDA 1 1 ,86 6,25
EV/EBIT 20,91 1 0,66
2014 data (€/000) Alpha Division
Beta
Division Total
Sales 7 1 7 .425 69.402 7 86.828
EBITDA 63.985 7 .97 1 7 1 .955
EBIT 36.67 7 4.81 3 41 .490
Enterprise value based on Alpha Division
Beta
Division Total
EV/Sales 7 55.7 7 6 46.904 802.67 9
EV/EBITDA 7 58.91 1 49.820 808.7 31
EV/EBIT 7 66.855 51 .323 81 8.1 7 8
Average 760.514 49.349 809.863
Enterprise Value (DCF) 694.900 44.7 94 7 39.694
Change 9,4% 10,2% 9,5%
PwCNovember 2014
Equity ValueSection 5
Valuation of an industrial company • Pavia University48
PwCNovember 2014
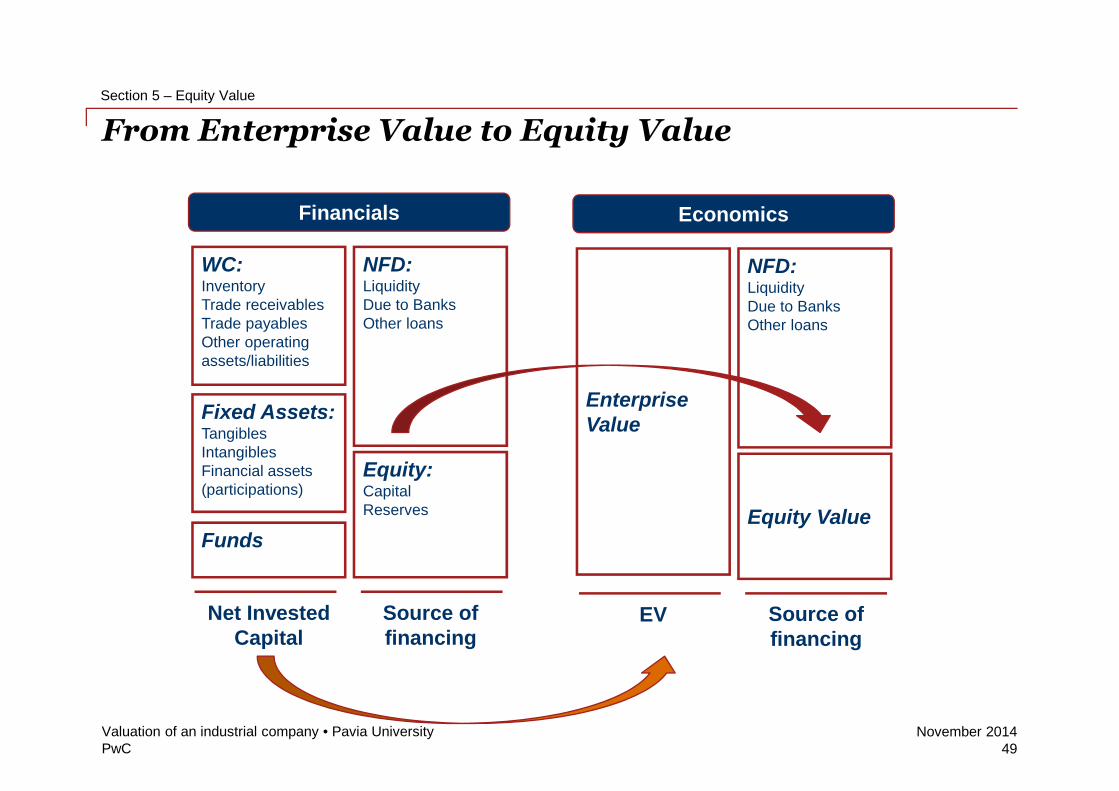
From Enterprise Value to Equity Value
WC:InventoryTrade receivablesTrade payablesOther operatingassets/liabilities
Funds
NFD:LiquidityDue to BanksOther loans
Equity:CapitalReserves
Fixed Assets:TangiblesIntangiblesFinancial assets(participations)
Net InvestedCapital
Source offinancing
Financials
EnterpriseValue
NFD:LiquidityDue to BanksOther loans
Equity Value
EV Source offinancing
Economics
Section 5 – Equity Value
Valuation of an industrial company • Pavia University49
PwCNovember 2014
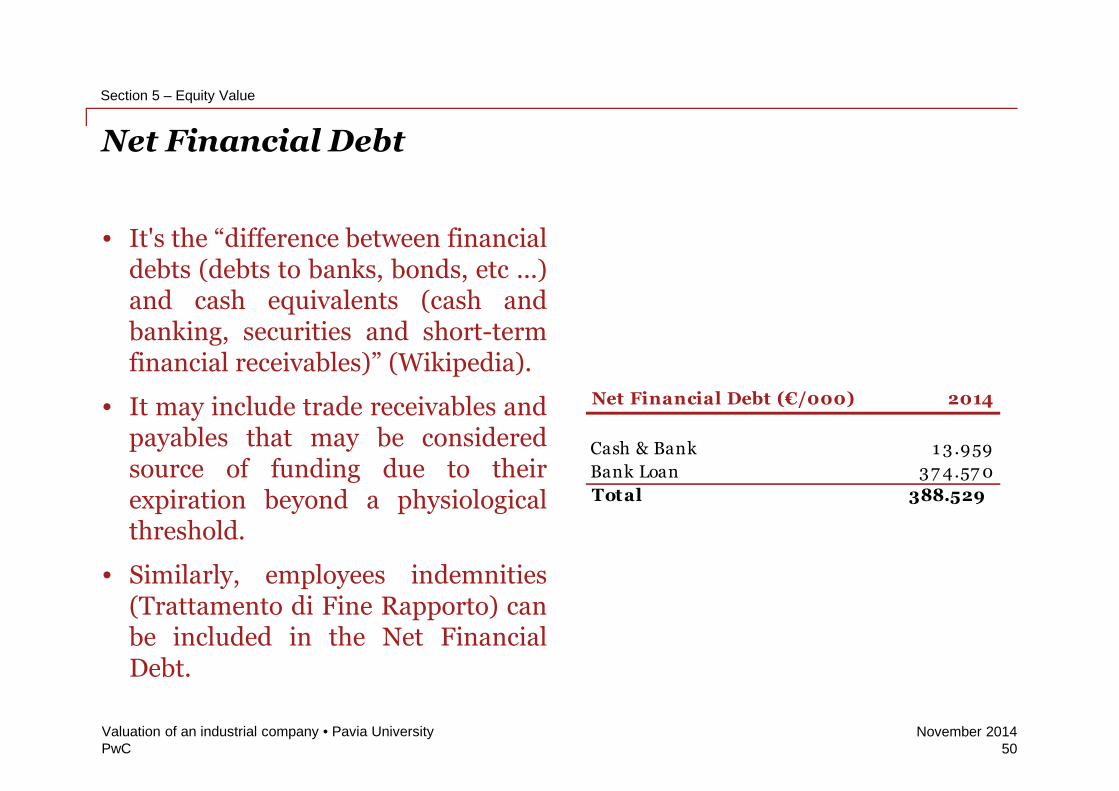
Net Financial Debt
• It's the “difference between financialdebts (debts to banks, bonds, etc ...)and cash equivalents (cash andbanking, securities and short-termfinancial receivables)” (Wikipedia).
• It may include trade receivables andpayables that may be consideredsource of funding due to theirexpiration beyond a physiologicalthreshold.
• Similarly, employees indemnities(Trattamento di Fine Rapporto) canbe included in the Net FinancialDebt.
Section 5 – Equity Value
Valuation of an industrial company • Pavia University50
Net Financial Debt (€/000) 2014
Cash & Bank 1 3.959
Bank Loan 37 4.57 0
Total 388.529
PwCNovember 2014
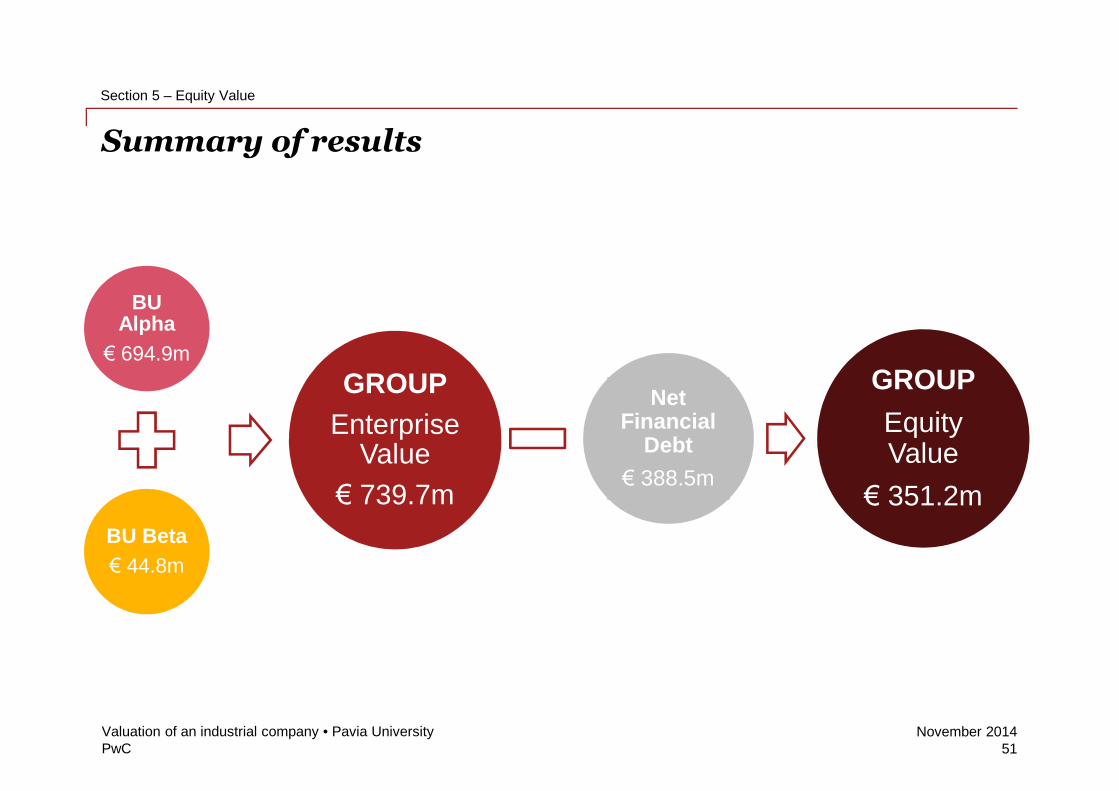
Summary of results
NetFinancial
Debt
€ 388.5m
GROUP
EquityValue
€ 351.2m
Section 5 – Equity Value
Valuation of an industrial company • Pavia University51
BUAlpha
€ 694.9m
BU Beta
€ 44.8m
GROUP
EnterpriseValue
€ 739.7m
Recommended