8-1

8-2
C H A P T E R C H A P T E R 88
VALUATION OF INVENTORIES: VALUATION OF INVENTORIES: A COST-BASIS APPROACHA COST-BASIS APPROACH
Intermediate AccountingIFRS Edition
Kieso, Weygandt, and Warfield

8-3
1. Identify major classifications of inventory.
2. Distinguish between perpetual and periodic inventory
systems.
3. Identify the effects of inventory errors on the financial
statements.
4. Understand the items to include as inventory cost.
5. Describe and compare the methods used to price
inventories.
Learning ObjectivesLearning ObjectivesLearning ObjectivesLearning Objectives

8-4
Goods in transit
Consigned goods
Special sales agreements
Inventory errors
Inventory IssuesInventory IssuesPhysical Goods Physical Goods
Included in Included in InventoryInventory
Cost Included in Cost Included in InventoryInventory
Cost Flow Cost Flow AssumptionsAssumptions
Classification
Cost flow
Control
Basic inventory valuation
Product costs
Period costs
Purchase discounts
Specific identification
Average cost
FIFO
Summary analysis
Valuation of Inventories:Valuation of Inventories:Cost-Basis ApproachCost-Basis Approach
Valuation of Inventories:Valuation of Inventories:Cost-Basis ApproachCost-Basis Approach

8-5
Inventories are:
items held for sale, or
goods to be used in the production of goods to be sold.
Inventory IssuesInventory IssuesInventory IssuesInventory Issues
LO 1 Identify major classifications of inventory.LO 1 Identify major classifications of inventory.
MerchandiserMerchandiser ManufacturerManufacturer
Businesses with Inventory
or
Classification

8-6
One inventory
account.
Purchase goods
in form ready for
sale.
Classification
Inventory IssuesInventory IssuesInventory IssuesInventory Issues
LO 1 Identify major classifications of inventory.LO 1 Identify major classifications of inventory.
Illustration 8-1

8-7
Three accounts
• Raw materials
• Work in process
• Finished goods
Classification
Inventory IssuesInventory IssuesInventory IssuesInventory Issues
LO 1LO 1
Illustration 8-1

8-8
Inventory Cost Flow
Inventory IssuesInventory IssuesInventory IssuesInventory Issues
Illustration 8-2
LO 1 Identify major classifications of inventory.LO 1 Identify major classifications of inventory.

8-9
Inventory Cost Flow
Inventory IssuesInventory IssuesInventory IssuesInventory Issues
Illustration 8-3
LO 1 Identify major classifications of inventory.LO 1 Identify major classifications of inventory.
Companies use one of two types of systems for maintaining inventory records — perpetual system or periodic system.

8-10
Inventory Cost FlowInventory Cost FlowInventory Cost FlowInventory Cost Flow
LO 2 Distinguish between perpetual and periodic inventory systems.LO 2 Distinguish between perpetual and periodic inventory systems.
Perpetual System
1. Purchases of merchandise are debited to Inventory.
2. Freight-in is debited to Inventory. Purchase returns and
allowances and purchase discounts are credited to Inventory.
3. Cost of goods sold is debited and Inventory is credited for each
sale.
4. Subsidiary records show quantity and cost of each type of
inventory on hand.
The perpetual inventory system provides a continuous record of Inventory and Cost of Goods Sold.

8-11
Inventory Cost FlowInventory Cost FlowInventory Cost FlowInventory Cost Flow
LO 2 Distinguish between perpetual and periodic inventory systems.LO 2 Distinguish between perpetual and periodic inventory systems.
Periodic System
1. Purchases of merchandise are debited to Purchases.
2. Ending Inventory determined by physical count.
3. Calculation of Cost of Goods Sold:
Beginning inventory
$ 100,000
Purchases, net
800,000
Goods available for sale
900,000
Ending inventory
125,000
Cost of goods sold
$ 775,000

8-12
Inventory Cost FlowInventory Cost FlowInventory Cost FlowInventory Cost Flow
LO 2 Distinguish between perpetual and periodic inventory systems.LO 2 Distinguish between perpetual and periodic inventory systems.
Illustration: Fesmire Company had the following transactions during the current year.
Record these transactions using the Perpetual and Periodic systems.

8-13
Inventory Cost FlowInventory Cost FlowInventory Cost FlowInventory Cost Flow
LO 2 Distinguish between perpetual and periodic inventory systems.LO 2 Distinguish between perpetual and periodic inventory systems.
Illustration 8-4Illustration:

8-14
Inventory Cost FlowInventory Cost FlowInventory Cost FlowInventory Cost Flow
LO 2 Distinguish between perpetual and periodic inventory systems.LO 2 Distinguish between perpetual and periodic inventory systems.
Illustration: Assume that at the end of the reporting period, the perpetual inventory account reported an inventory balance of $4,000. However, a physical count indicates inventory of $3,800 is actually on hand. The entry to record the necessary write-down is as follows.
Inventory Over and Short 200
Inventory 200
Note: Inventory Over and Short adjusts Cost of Goods Sold. In practice, companies sometimes report Inventory Over and Short in the “Other income and expense” section of the income statement.

8-15
Inventory Control
Inventory IssuesInventory IssuesInventory IssuesInventory Issues
LO 2 Distinguish between perpetual and periodic inventory systems.LO 2 Distinguish between perpetual and periodic inventory systems.
All companies need periodic verification of the inventory
records by actual count, weight, or measurement, with the
counts compared with the detailed inventory records.
Companies should take the physical inventory near the
end of their fiscal year, to properly report inventory
quantities in their annual accounting reports.

8-16
Inventory IssuesInventory IssuesInventory IssuesInventory Issues
LO 2 Distinguish between perpetual and periodic inventory systems.LO 2 Distinguish between perpetual and periodic inventory systems.
Basic Issues in Inventory Valuation
Companies must allocate the cost of all the goods available for sale (or use) between the goods that were sold or used and those that are still on hand.
Illustration 8-5

8-17
Basic Issues in Inventory ValuationBasic Issues in Inventory ValuationBasic Issues in Inventory ValuationBasic Issues in Inventory Valuation
LO 2 Distinguish between perpetual and periodic inventory systems.LO 2 Distinguish between perpetual and periodic inventory systems.
The physical goods (goods on hand, goods in transit,
consigned goods, special sales agreements).
The costs to include (product vs. period costs).
The cost flow assumption (specific Identification,
average cost, FIFO, retail, etc.).
Valuation requires determining

8-18
A company should record purchases when it obtains legal title to the goods.
Physical Goods Included in InventoryPhysical Goods Included in InventoryPhysical Goods Included in InventoryPhysical Goods Included in Inventory
LO 2 Distinguish between perpetual and periodic inventory systems.LO 2 Distinguish between perpetual and periodic inventory systems.
Illustration 8-6

8-19
Physical Goods Included in InventoryPhysical Goods Included in InventoryPhysical Goods Included in InventoryPhysical Goods Included in Inventory
LO 3 Identify the effects of inventory errors on the financial statements.LO 3 Identify the effects of inventory errors on the financial statements.
Effect of Inventory Errors
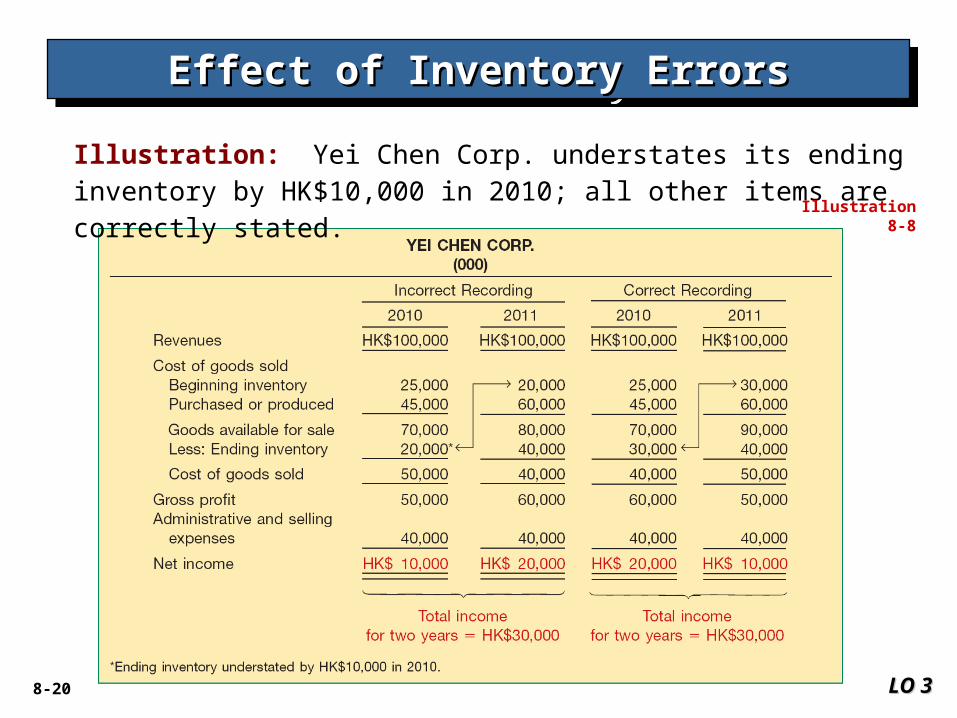
The effect of an error on net income in one year (2010) will be counterbalanced in the next (2011), however the income statement will be misstated for both years.
Illustration 8-7
Ending Inventory Misstated
8-20
Effect of Inventory ErrorsEffect of Inventory ErrorsEffect of Inventory ErrorsEffect of Inventory Errors
Illustration: Yei Chen Corp. understates its ending inventory by HK$10,000 in 2010; all other items are correctly stated.
Illustration 8-8
LO 3LO 3

8-21
Physical Goods Included in InventoryPhysical Goods Included in InventoryPhysical Goods Included in InventoryPhysical Goods Included in Inventory
LO 3 Identify the effects of inventory errors on the financial statements.LO 3 Identify the effects of inventory errors on the financial statements.
Effect of Inventory Errors
The understatement does not affect cost of goods sold and net income because the errors offset one another.
Illustration 8-9
Purchases and Inventory
Misstated

8-22
Costs Included in InventoryCosts Included in InventoryCosts Included in InventoryCosts Included in Inventory
LO 4 Understand the items to include as inventory cost.LO 4 Understand the items to include as inventory cost.
Product Costs - costs directly connected with
bringing the goods to the buyer’s place of business
and converting such goods to a salable condition.
Period Costs – generally selling, general, and
administrative expenses.
Treatment of Purchase Discounts – Gross vs.
Net Method

8-23
Costs Included in InventoryCosts Included in InventoryCosts Included in InventoryCosts Included in Inventory
LO 4 Understand the items to include as inventory cost.LO 4 Understand the items to include as inventory cost.
Treatment of Purchase DiscountsIllustration 8-11
* $4,000 x 2% = $80
*
** $10,000 x 98% = $9,800
**

8-24
Method adopted should be one that most clearly reflects periodic income.
Cost Flow Assumption Adopted
does not need to equal
Physical Movement of Goods
Cost Flow Assumption Adopted
does not need to equal
Physical Movement of Goods
Which Cost Flow Assumption to Adopt?Which Cost Flow Assumption to Adopt?Which Cost Flow Assumption to Adopt?Which Cost Flow Assumption to Adopt?
Specific Identification --- Average Cost --- LIFO
LO 5 Describe and compare the methods used to price inventories.LO 5 Describe and compare the methods used to price inventories.
8-25
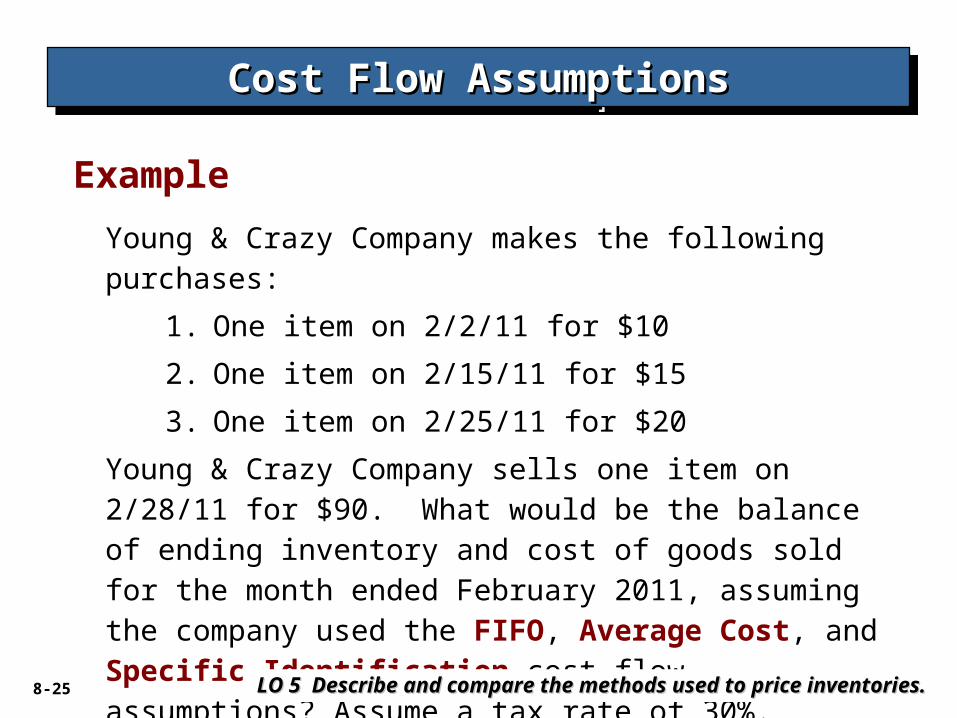
Young & Crazy Company makes the following purchases:
1. One item on 2/2/11 for $10
2. One item on 2/15/11 for $15
3. One item on 2/25/11 for $20
Young & Crazy Company sells one item on 2/28/11 for $90. What would be the balance of ending inventory and cost of goods sold for the month ended February 2011, assuming the company used the FIFO, Average Cost, and Specific Identification cost flow assumptions? Assume a tax rate of 30%.
Example
Cost Flow AssumptionsCost Flow AssumptionsCost Flow AssumptionsCost Flow Assumptions
LO 5 Describe and compare the methods used to price inventories.LO 5 Describe and compare the methods used to price inventories.

8-26
Purchase on 2/2/11 for $10
Purchase on 2/15/11 for $15
Purchase on 2/25/11 for $20
Inventory Balance = $ 45
Young & Crazy CompanyIncome Statement
For the Month of Feb. 2011 Sales $ 90 Cost of goods sold 0 Gross profit 90 Expenses: Administrative 14 Selling 12 Interest 7 Total expenses 33 Income before tax 57 Taxes 17 Net Income $ 40
Cost Flow AssumptionsCost Flow AssumptionsCost Flow AssumptionsCost Flow Assumptions
“First-In-First-Out (FIFO)”
LO 5LO 5

8-27
Purchase on 2/2/11 for $10
Purchase on 2/15/11 for $15
Purchase on 2/25/11 for $20
Cost Flow AssumptionsCost Flow AssumptionsCost Flow AssumptionsCost Flow Assumptions
Inventory Balance = $ 35
Young & Crazy CompanyIncome Statement
For the Month of Feb. 2011 Sales $ 90 Cost of goods sold 10 10 Gross profit 80 Expenses: Administrative 14 Selling 12 Interest 7 Total expenses 33 Income before tax 4747 Taxes 14 14 Net Income $ 33 $ 33
“First-In-First-Out (FIFO)”
LO 5LO 5

8-28
Purchase on 2/2/11 for $10
Purchase on 2/15/11 for $15
Purchase on 2/25/11 for $20
Inventory Balance = $ 45
Young & Crazy CompanyIncome Statement
For the Month of Feb. 2011 Sales $ 90 Cost of goods sold 0 Gross profit 90 Expenses: Administrative 14 Selling 12 Interest 7 Total expenses 33 Income before tax 57 Taxes 17 Net Income $ 40
Cost Flow AssumptionsCost Flow AssumptionsCost Flow AssumptionsCost Flow Assumptions
“Average Cost”
LO 5LO 5

8-29
Purchase on 2/2/11 for $10
Purchase on 2/15/11 for $15
Purchase on 2/25/11 for $20
Inventory Balance = $ 30
Cost Flow AssumptionsCost Flow AssumptionsCost Flow AssumptionsCost Flow Assumptions
Young & Crazy CompanyIncome Statement
For the Month of Feb. 2011 Sales $ 90 Cost of goods sold 15 15 Gross profit 75 Expenses: Administrative 14 Selling 12 Interest 7 Total expenses 33 Income before tax 42 42 Taxes 12 12 Net Income $ $ 3030
“Average Cost”
LO 5LO 5

8-30
Purchase on 2/2/11 for $10
Purchase on 2/15/11 for $15
Purchase on 2/25/11 for $20
Inventory Balance = $ 45
Young & Crazy CompanyIncome Statement
For the Month of Feb. 2011 Sales $ 90 Cost of goods sold 0 Gross profit 90 Expenses: Administrative 14 Selling 12 Interest 7 Total expenses 33 Income before tax 57 Taxes 17 Net Income $ 40
Cost Flow AssumptionsCost Flow AssumptionsCost Flow AssumptionsCost Flow Assumptions
“Specific Identification”
LO 5LO 5

8-31
Young & Crazy CompanyIncome Statement
For the Month of Feb. 2011 Sales $ 90 Cost of goods sold 0 Gross profit 90 Expenses: Administrative 14 Selling 12 Interest 7 Total expenses 33 Income before tax 57 Taxes 17 Net Income $ 40
Depends which one is soldDepends which one is sold
Purchase on 2/2/11 for $10
Purchase on 2/15/11 for $15
Purchase on 2/25/11 for $20
Inventory Balance = $ 45
Cost Flow AssumptionsCost Flow AssumptionsCost Flow AssumptionsCost Flow Assumptions
“Specific Identification”
LO 5LO 5

8-32
Financial Statement Summary
FIFO AverageSales 90$ 90$ Cost of goods sold 10 15
Gross profit 80 75 Operating expenses:
Administrative 14 14 Selling 12 12 Interest 7 7
Total expenses 33 33 Income before taxes 47 42 Income tax expense 14 12 Net income 33$ 30$
Inventory Balance 3035
Cost Flow AssumptionsCost Flow AssumptionsCost Flow AssumptionsCost Flow Assumptions
LO 5LO 5
8-33
Cost Flow AssumptionsCost Flow AssumptionsCost Flow AssumptionsCost Flow Assumptions
LO 5LO 5
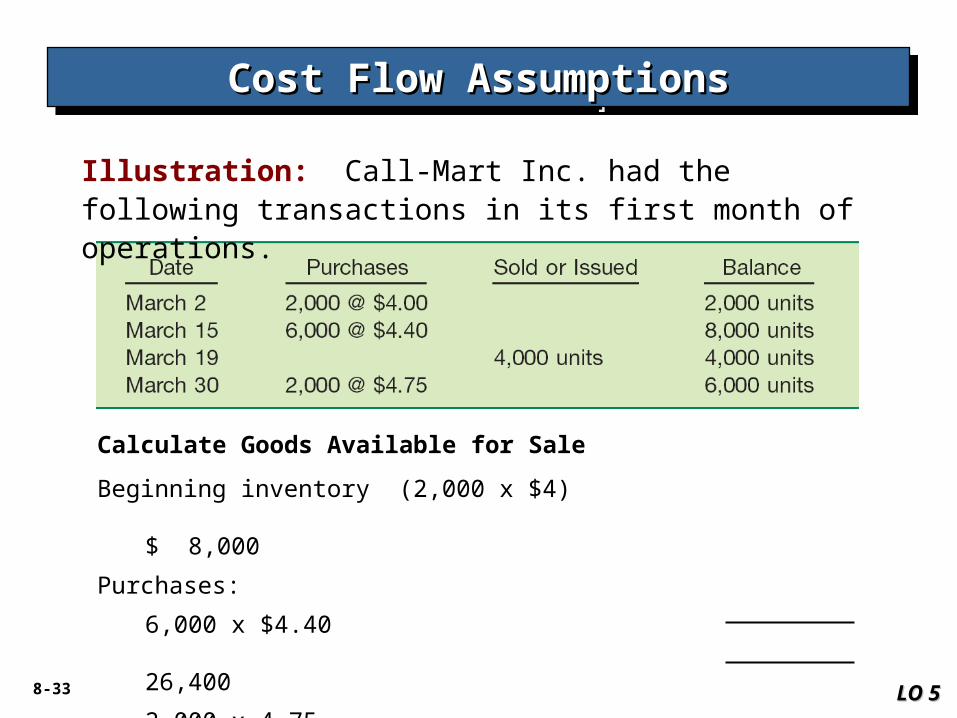
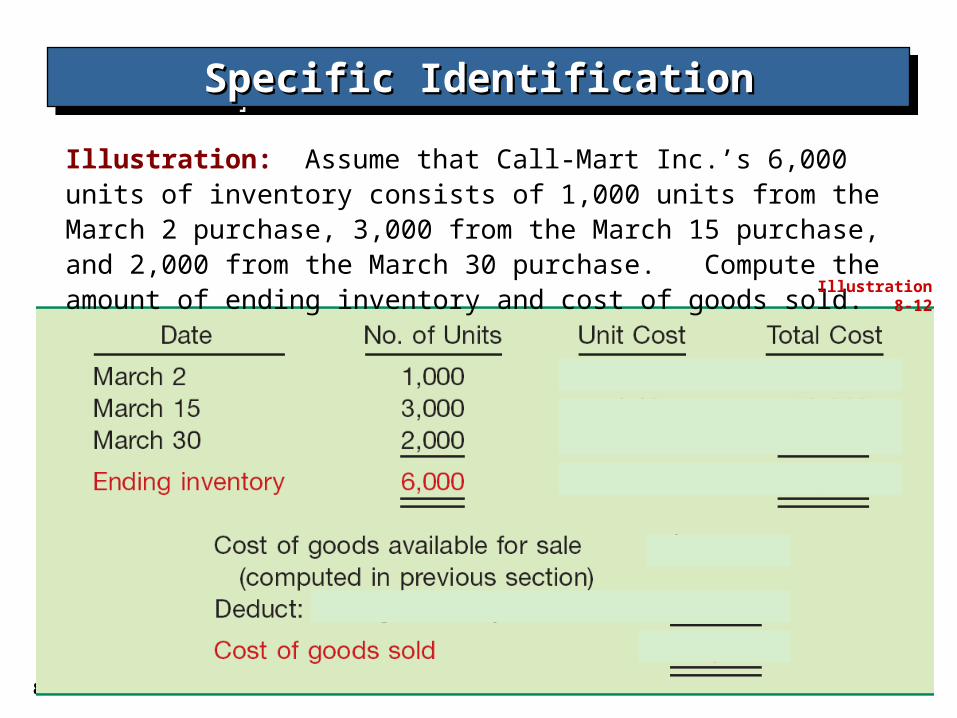
Illustration: Call-Mart Inc. had the following transactions in its first month of operations.
Beginning inventory (2,000 x $4)
$ 8,000
Purchases:
6,000 x $4.40
26,400
2,000 x 4.75
9,500
Goods available for sale
$43,900
Calculate Goods Available for Sale
8-34
Specific IdentificationSpecific IdentificationSpecific IdentificationSpecific Identification
Illustration: Assume that Call-Mart Inc.’s 6,000 units of inventory consists of 1,000 units from the March 2 purchase, 3,000 from the March 15 purchase, and 2,000 from the March 30 purchase. Compute the amount of ending inventory and cost of goods sold.
Illustration 8-12

8-35
Average CostAverage CostAverage CostAverage Cost
Illustration 8-13Weighted-Average
LO 5 Describe and compare the methods used to price inventories.LO 5 Describe and compare the methods used to price inventories.

8-36
Average CostAverage CostAverage CostAverage Cost
Illustration 8-14
In this method, Call-Mart computes a new average unit cost each time it makes a purchase.
Moving-Average
LO 5 Describe and compare the methods used to price inventories.LO 5 Describe and compare the methods used to price inventories.

8-37
First-In, First-Out (FIFO)First-In, First-Out (FIFO)First-In, First-Out (FIFO)First-In, First-Out (FIFO)
Illustration 8-15Periodic Method
Determine cost of ending inventory by taking the cost of the most recent purchase and working back until it accounts for all units in the inventory.
LO 5 Describe and compare the methods used to price inventories.LO 5 Describe and compare the methods used to price inventories.

8-38
First-In, First-Out (FIFO)First-In, First-Out (FIFO)First-In, First-Out (FIFO)First-In, First-Out (FIFO)
Illustration 8-16
Perpetual Method
In all cases where FIFO is used, the inventory and cost of goods sold would be the same at the end of the month whether a perpetual or periodic system is used.
LO 5 Describe and compare the methods used to price inventories.LO 5 Describe and compare the methods used to price inventories.

8-39
Inventory Valuation Methods - SummaryInventory Valuation Methods - SummaryInventory Valuation Methods - SummaryInventory Valuation Methods - Summary
Illustration 8-17
LO 5 Describe and compare the methods used to price inventories.LO 5 Describe and compare the methods used to price inventories.

8-40
Inventory Valuation Methods - SummaryInventory Valuation Methods - SummaryInventory Valuation Methods - SummaryInventory Valuation Methods - Summary
Illustration 8-18Balances of Selected Items under Alternative Inventory Valuation Methods
LO 5 Describe and compare the methods used to price inventories.LO 5 Describe and compare the methods used to price inventories.

8-41 LO 6 Describe the LIFO cost flow assumption.LO 6 Describe the LIFO cost flow assumption.
Under IFRS, LIFO is not permitted for financial reporting
purposes.
Nonetheless, LIFO is permitted for financial reporting
purposes in the United States, it is permitted for tax purposes
in some countries, and its use can result in significant tax
savings.
Recommended