Webcast: ir.avisbudgetgroup.com
Dial-in: (773) 756-0108
Replay: (203) 369-3335
Passcode: 9806274
2019 FIRST
QUARTEREARNINGS
CALL
May 2, 2019

2
Statements about future results made in this presentation constitute forward-looking statements within the meaning of the Private Securities Litigation Reform Act of 1995. Such forward-looking statements include projections.
These statements are based on current expectations and the current economic environment. Forward-looking statements and projections are inherently subject to significant economic, competitive and other uncertainties and contingencies, many of which are beyond the control of management. The Company cautions that these statements are not guarantees of future performance. Actual results may differ materially from those expressed or implied in the forward-looking statements.
Important assumptions and other important factors that could cause actual results to differ materially from those in the forward-looking statements and projections are specified in the Company’s most recently filed Form 10-K and other SEC filings.
You are cautioned not to place undue reliance on these forward-looking statements, which speak only as of the date stated, or if no date is stated, the date of our last earnings conference call. The Company undertakes no obligation to publicly update any forward-looking statements to reflect subsequent events or circumstances.
This presentation includes certain non-GAAP financial measures as defined under SEC rules. We believe that our financial performance is better demonstrated using these non-GAAP financial measures. Important information regarding reconciliation of such measures is contained within this presentation, included in the appendix.
FORWARD-LOOKING STATEMENTS

3
$1,968 $1,920
First Quarter2018
First Quarter2019
FIRST QUARTER HIGHLIGHTS
$2
($1)
First Quarter2018
First Quarter2019
Revenue
Adjusted EBITDA
• Per-Unit Fleet Costs improved 5%
Americas Per-Unit Fleet Costs 8% lower
• Utilization was flat
• Adjusted EBITDA was $3 million lower
• Rental Days increased 2% driven by strong International
volume
• Revenue and Revenue per Day were 2% lower
Pricing flat in the Americas and down in International
Revenue had a $56 million impact from currency
exchange rates
$’s in millionsRevenue per Day and Per-Unit Fleet Costs exclude exchange rate effectsSee appendix for reconciliation of net income (loss) to Adjusted EBITDA

4
ENHANCING THE CUSTOMER EXPERIENCE
Enhancing The Avis App
• Split-bill functionality
Beginning this month customers will be able to purchase
ancillaries or car upgrades with their personal card
• Partnership with Arrive
Added nationwide off-street parking reservations to the
Avis App
Enhancing The Budget App
• Launched a redesigned Budget app
Improving The Rental Experience
• Created a new counter-sales incentive program that produces
positive Revenues and Net Promoter Scores

5
Improving Margins Through Technology
Investing for the Future
Connected Fleet
Driving Efficiencies Through Connected Car
• Plan to more than double the amount of connected cars over last year
• Standalone devices from I.D. Systems and Continental
• OEM-enabled connected cars from Ford, Peugeot, and Toyota
Operationalize Connected Car Data
• Mileage optimization across fleet to reduce costs
• Balance mileage accumulation across vehicle pool
Next Generation Mobility platform
• Partnership with Lyft
• Fully Integrated into the Lyft driver app
DIGITIZING OUR BUSINESS
6
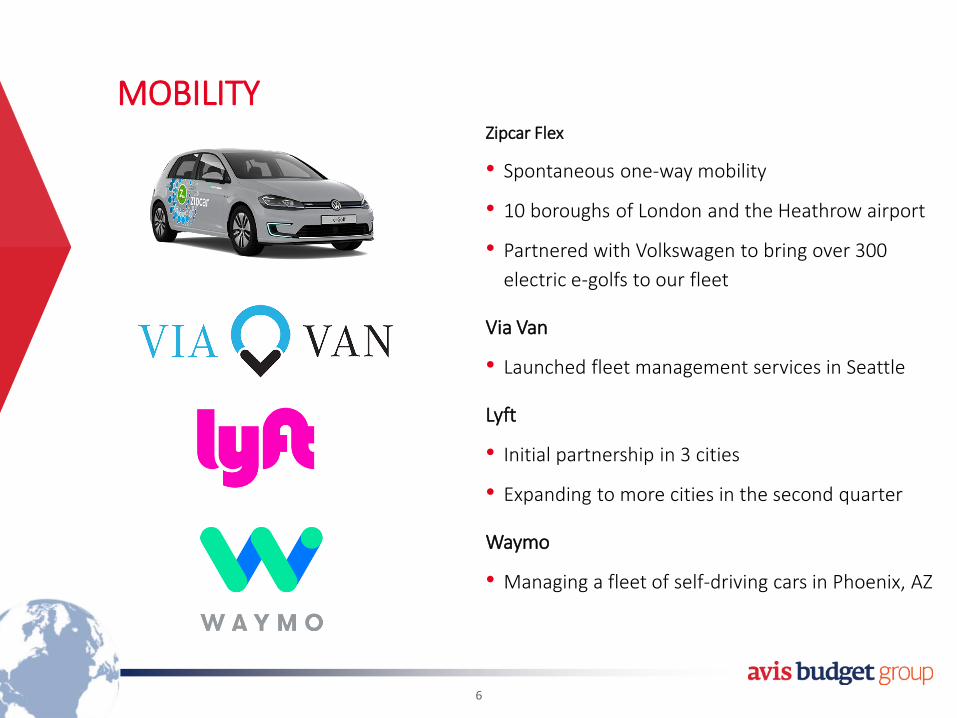
MOBILITYZipcar Flex
• Spontaneous one-way mobility
• 10 boroughs of London and the Heathrow airport
• Partnered with Volkswagen to bring over 300
electric e-golfs to our fleet
Via Van
• Launched fleet management services in Seattle
Lyft
• Initial partnership in 3 cities
• Expanding to more cities in the second quarter
Waymo
• Managing a fleet of self-driving cars in Phoenix, AZ

7
$15
$35
First Quarter2018
First Quarter2019
$1,348 $1,327
First Quarter2018
First Quarter2019
AMERICAS FIRST QUARTER RESULTSRevenue
Adjusted EBITDA
• Per-Unit Fleet Costs improved 8%
• Vehicle Utilization was 30 basis points lower
• Adjusted EBITDA grew to $35 million
• Flat Revenue per Day despite Easter shift
Underlying leisure pricing growth for seven quarters
Direct website sales up 7%
• 1% lower volume
• Revenue 2% lower in the quarter
$’s in millionsRevenue per Day and Per-Unit Fleet Costs exclude exchange rate effects

8
$3
($21)
First Quarter2018
First Quarter2019
$620 $593
First Quarter2018
First Quarter2019
INTERNATIONAL FIRST QUARTER RESULTSRevenue
Adjusted EBITDA
• Per-Unit Fleet Costs increased 3%
• Vehicle Utilization improved 80 basis points to 70%
• Adjusted EBITDA decreased by $24 million
• Revenue increased 4% excluding exchange rate effects
Revenue per Day decreased 4%
Volume grew 8%
• Revenue decreased 4% after a $50 million impact from currency exchange rates
$’s in millionsRevenue per Day and Per-Unit Fleet Costs exclude exchange rate effects

9
• Adjusted Free Cash Flow was an outflow of $46 million
• Net Corporate Leverage within our targeted range of 3-4x
• $3.3 billion of liquidity
• No corporate debt maturities until 2023
STRONG CASH FLOW AND FUNDING POSITION
4.0x3.8x
March 312018
March 312019
Net Corporate Leverage
Net cash provided by operating activities for the three months ended March 31, 2019 was $440 millionCorporate leverage is calculated by dividing Net Corporate Debt by last twelve months Adjusted EBITDACorporate debt maturities as of March 31, 2019

10
($’s in millions, except EPS)
Revenues
Full-Year
9,200 – 9,500
Adjusted EBITDA 750 – 850
Non-vehicle D&A 215
Non-vehicle Interest expense 185
Adjusted pretax income 350 – 450
2019 OUTLOOK
[3-6%]
[1-10%]
[4%]
[6%]
[(5%)-16%]
[(1%-26%]
Year-over-Year Growth
2%
2%
10%
(2%)
1%
Adjusted diluted EPS 3.35 – 4.20 3%
See appendix for potential currency effects on Revenues and Adjusted EBITDA and definitions of non-GAAP financial measuresNon-vehicle depreciation and amortization (D&A) excludes acquisition-related amortization expenseInterest expense excludes early extinguishment of debtAll figures are approximate and year-over-year percentage growth is calculated at the midpoint
11
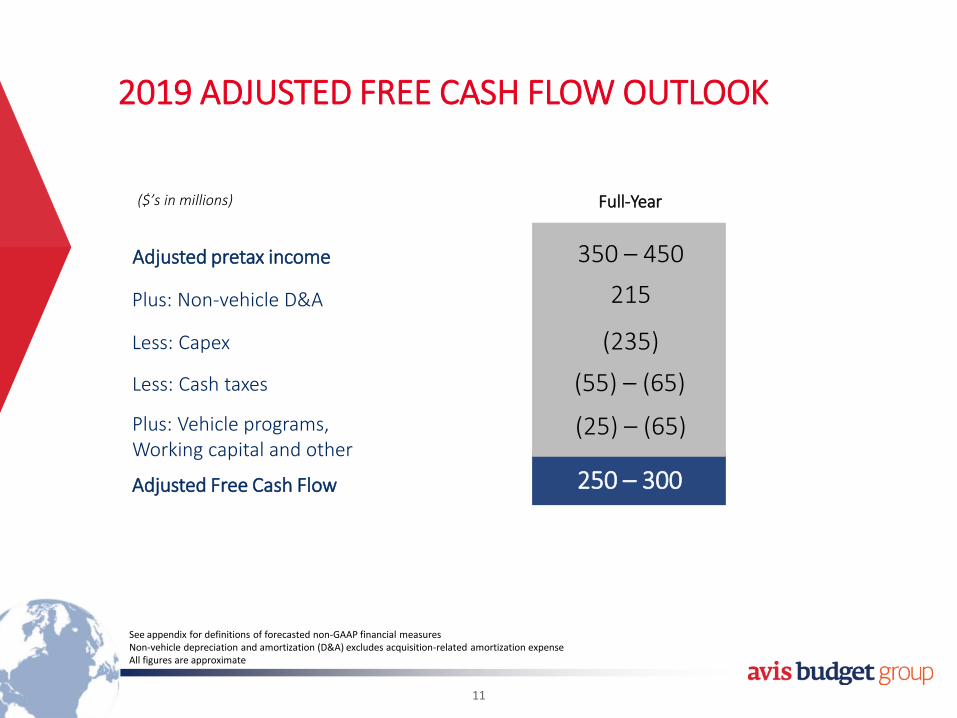
($’s in millions) Full-Year
Adjusted pretax income 350 – 450
215
(235)
Plus: Non-vehicle D&A
Less: Capex
(25) – (65)
Less: Cash taxes
Plus: Vehicle programs, Working capital and other
Adjusted Free Cash Flow 250 – 300
2019 ADJUSTED FREE CASH FLOW OUTLOOK
(55) – (65)
See appendix for definitions of forecasted non-GAAP financial measuresNon-vehicle depreciation and amortization (D&A) excludes acquisition-related amortization expenseAll figures are approximate

12
SUMMARY
• 2019 Adjusted EBITDA guidance remains unchanged
• Strong first quarter driven largely by a stable Americas pricing environment and
significantly lower Per-Unit Fleet Costs
• Leisure pricing in the Americas continues to grow
Underlying leisure pricing has increased year-over-year for seven quarters
• Strong funding position with no corporate debt maturities until 2023
Corporate debt maturities as of March 31, 2019


APPENDIX
2019 CURRENCY OUTLOOK
A-1
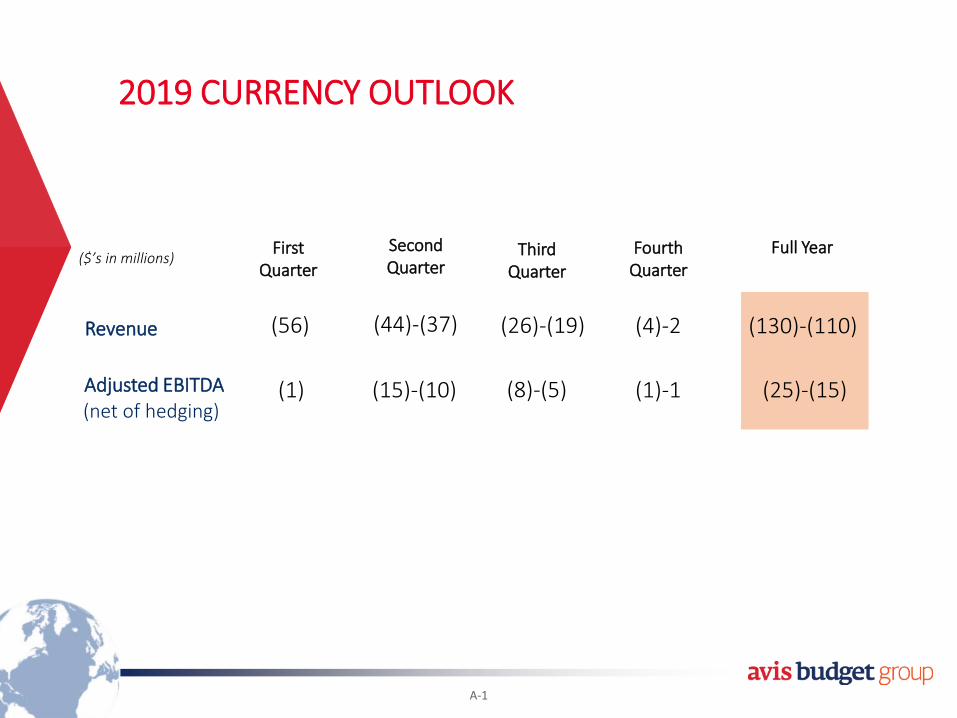
($’s in millions)First
Quarter
Revenue (56)
(1)Adjusted EBITDA
SecondQuarter
(44)-(37)
(15)-(10)
Third Quarter
(26)-(19)
(8)-(5)
FourthQuarter
(4)-2
(1)-1
Full Year
(130)-(110)
(25)-(15)(net of hedging)
DEFINITIONS
A-2
This presentation includes certain non-GAAP (generally accepted accounting principles) financial measures as defined under SEC rules. We have provided below reasons why we present these non-GAAP financial measures, a description of what they represent and a reconciliation to the most comparable financial measure calculated and presented in accordance with GAAP. The GAAP measures most directly comparable to Adjusted EBITDA, Adjusted free cash flow, Adjusted pretax income (loss), Adjusted net income (loss) and Adjusted diluted earnings (loss) per share are net income (loss), net cash provided by operating activities, income (loss) before income taxes, net income (loss) and diluted earnings (loss) per share, respectively. Because of the forward-lookingnature of the Company’s forecasted non-GAAP Adjusted EBITDA, Adjusted free cash flow, Adjusted pretax income (loss), Adjusted net income (loss) and Adjusted diluted earnings (loss) per share, specific quantifications of the amounts that would be required to reconcile forecasted net income (loss), net cash provided by operating activities, pretax income (loss), net income (loss) and diluted earnings (loss) per share are not available. The Company believes that there is a degree of volatility with respect to certain of the Company’s GAAP measures which preclude the Company from providing accurate forecasted GAAP to non-GAAP reconciliations. Based on the above, the Company believes that providing estimates of the amounts that would be required to reconcile the range of the non-GAAP measures to forecasted GAAP measures would imply a degree of precision that would be confusing or misleading to investors for the reasons identified above. Additional definitions and reconciliations of non-GAAP measures are provided in Appendix I and the tables of our press release furnished on Form 8-K on May 1, 2019.
Adjusted EBITDAAdjusted EBITDA represents income (loss) from continuing operations before non-vehicle related depreciation and amortization, any impairment charges, restructuring and other related charges, early extinguishment of debt costs, non-vehicle related interest, transaction-related costs, net charges for unprecedented personal-injury legal matters, non-operational charges related to shareholder activist activity and income taxes. Net charges for unprecedented personal-injury legal matters are recorded within operating expenses in our consolidated statement of operations. Non-operational charges related to shareholder activist activity include third party advisory, legal and other professional service fees and are recorded within selling, general and administrative expenses in our consolidated results of operations. Adjusted EBITDA includes stock-based compensation expense and deferred financing fee amortization.
We and our management believe that Adjusted EBITDA is useful to investors as a supplemental measure in evaluating the aggregate performance of our operating businesses and in comparing our results from period to period. Adjusted EBITDA is the measure that is used by our management, including our chief operating decision maker, to perform such evaluation. Adjusted EBITDA is also a component in the determination of management's compensation. Adjusted EBITDA should not be considered in isolation or as a substitute for net income or other income statement data prepared in accordance with GAAP and our presentation of Adjusted EBITDA may not be comparable to similarly-titled measures used by other companies. A reconciliation of Adjusted EBITDA from net income (loss) recognized under GAAP is provided in this appendix and on Table 5 of our press release furnished on Form 8-K on May 1, 2019.
Adjusted Free Cash FlowRepresents Net Cash Provided by Operating Activities adjusted to reflect the cash inflows and outflows relating to capital expenditures, the investing and financing activities of our vehicle programs, asset sales, if any, and to exclude debt extinguishment costs, transaction-related costs, restructuring and other related charges and non-operational charges related to shareholder activist activity. We have revised our definition of Adjusted Free Cash Flow to exclude restructuring and other related charges and have revised prior years' Adjusted Free Cash Flow amounts accordingly. We believe this change is meaningful to investors as it brings the measurement in line with our other non-GAAP measures. We believe that Adjusted Free Cash Flow is useful to management and investors in measuring the cash generated that is available to be used to repay debt obligations, repurchase stock, pay dividends and invest in future growth through new business development activities or acquisitions. Adjusted Free Cash Flow should not be construed as a substitute in measuring operating results or liquidity, and our presentation of Adjusted Free Cash Flow may not be comparable to similarly-titled measures used by other companies. A reconciliation of Adjusted Free Cash Flow to the appropriate measure recognized under GAAP is provided on Table 4 of our press release furnished on Form 8-K on May 1, 2019.
Foreign CurrencyWe present currency exchange rate effects to provide a method of assessing how our business performed excluding the effects of foreign currency rate fluctuations. Local currency results are calculated using functional currencies outside the United States. Foreign currency exchange rate effects are calculated by translating the current-year results at the prior-period average exchange rate plus or minus any related gains and losses on currency hedges.
Last Twelve Month Period Financial InformationWe present certain unaudited financial information for the last twelve month period ended March 31, 2019, which is calculated as the three months ended March 31, 2019 plus the actual year ended December 31, 2018 less the actual three months ended March 31, 2018. This presentation is not in accordance with GAAP. However, the Company believes that this presentation provides useful information to investors regarding its recent financial performance, and it views this presentation of the four most recently completed fiscal quarters as a key measurement period for investors to assess its historical results.
Three Months Ended March 31,
2019 2018
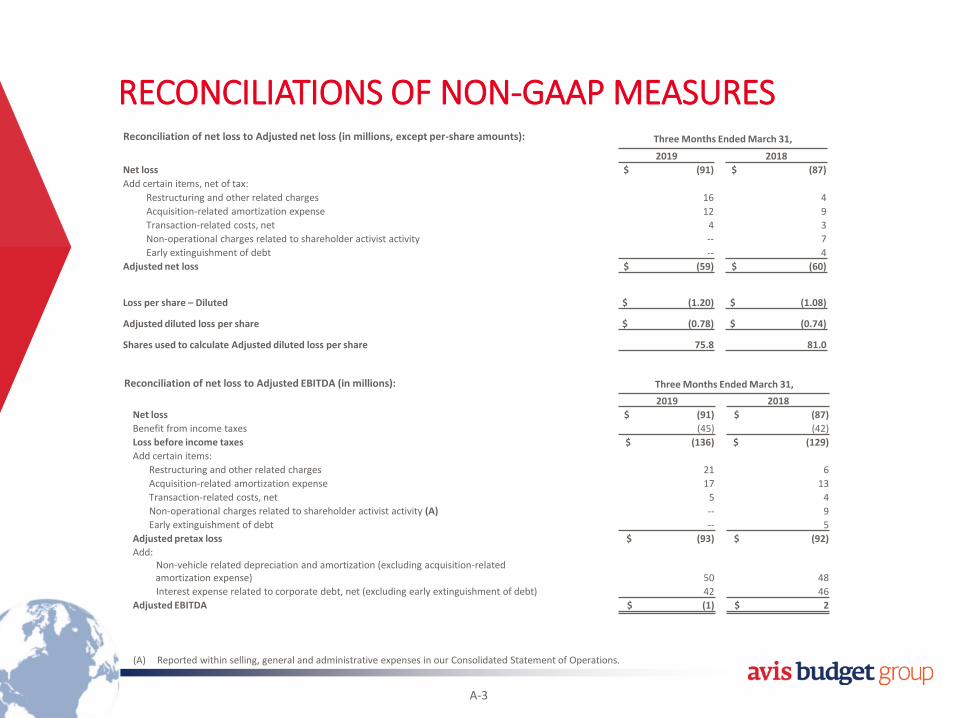
Net loss $ (91) $ (87)
Benefit from income taxes (45) (42)
Loss before income taxes $ (136) $ (129)
Add certain items:
Restructuring and other related charges 21 6
Acquisition-related amortization expense 17 13
Transaction-related costs, net 5 4
Non-operational charges related to shareholder activist activity (A) -- 9
Early extinguishment of debt -- 5
Adjusted pretax loss $ (93) $ (92)
Add: Non-vehicle related depreciation and amortization (excluding acquisition-related amortization expense) 50 48
Interest expense related to corporate debt, net (excluding early extinguishment of debt) 42 46
Adjusted EBITDA $ (1) $ 2
Three Months Ended March 31,
2019 2018
Net loss $ (91) $ (87)
Add certain items, net of tax:
Restructuring and other related charges 16 4
Acquisition-related amortization expense 12 9
Transaction-related costs, net 4 3
Non-operational charges related to shareholder activist activity -- 7
Early extinguishment of debt -- 4
Adjusted net loss $ (59) $ (60)
Loss per share – Diluted $ (1.20) $ (1.08)
Adjusted diluted loss per share $ (0.78) $ (0.74)
Shares used to calculate Adjusted diluted loss per share 75.8 81.0
Reconciliation of net loss to Adjusted EBITDA (in millions):
Reconciliation of net loss to Adjusted net loss (in millions, except per-share amounts):
RECONCILIATIONS OF NON-GAAP MEASURES
A-3
(A) Reported within selling, general and administrative expenses in our Consolidated Statement of Operations.

Last 12 Months EndedMarch 31, 2019
Last 12 Months EndedMarch 31, 2018
Net income $ 161 $ 381
Provision (benefit from) for income taxes 99 (134)
Income before income taxes $ 260 $ 247
Add certain items:
Acquisition-related amortization expense 65 57
Restructuring and other related charges 37 62
Transaction-related costs, net 21 24
Early extinguishment of debt 14 5
Non-operational charges related to shareholder activist activity (A) - 9
Impairment - 2
Charges for legal matter, net (B) - (27)
Adjusted pretax income $ 397 $ 379
Add: Non-vehicle related depreciation and amortization (excluding acquisition-related amortization expense) 197 200
Interest expense related to corporate debt, net (excluding early extinguishment of debt) 184 185
Adjusted EBITDA $ 778 $ 764
Reconciliation of Net Corporate Debt (in millions): March 31, March 31,
2019 2018
Corporate debt $ 3,524 $ 3,607
Less: Cash and cash equivalents 540 544
Net Corporate Debt $ 2,984 $ 3,063
Reconciliation of net income to Adjusted EBITDA (in millions):
RECONCILIATIONS OF NON-GAAP MEASURES
A-4
(A) Reported within selling, general and administrative expenses in our Consolidated Statement of Operations.(B) Reported within operating expenses in our Consolidated Statement of Operations.
Recommended