1
A Survey of Foundations in North America Published on November 8, 2018
2018 STATE OF PHILANTHROPY TECH
One North State Street, Suite 1500 Chicago, IL 60602
Technology Affinity Group

Learn more at tagtech.org/philanthropytech2018
2
EXECUTIVE SUMMARY
Assessing Current Technology Practices in Philanthropy In July 2018, the Technology Affinity Group (TAG) conducted a survey to better understand the technology environment, practices, and perceptions of TAG members and their peers throughout North America. This year’s survey builds on past surveys which focused on IT tools, management, and security. New this year, the survey also explores new topics on diversity, equity, and inclusion (DEI), integration between IT and program teams as well as use of blockchain. Furthermore, this year’s survey addresses an often-asked question: How many IT staff/consultants are typically employed at foundations? Nearly 200 foundations throughout North America responded, providing a valuable assessment of the current state of technology in philanthropy including:
1. The perception of the strategic value of technology and related integration of technology teams with program strategy and grantmaking;
2. Diversity, equity, and inclusion practices; 3. Security breaches, protections, and practices 4. Technology tools and practices in use within philanthropy
Key findings are introduced below and then explored more fully on page 5. TAG Members: Download the raw survey results (with identifiers removed) at http://www.tagtech.org/philanthropytech2018.
Learn more at tagtech.org/philanthropytech2018
3
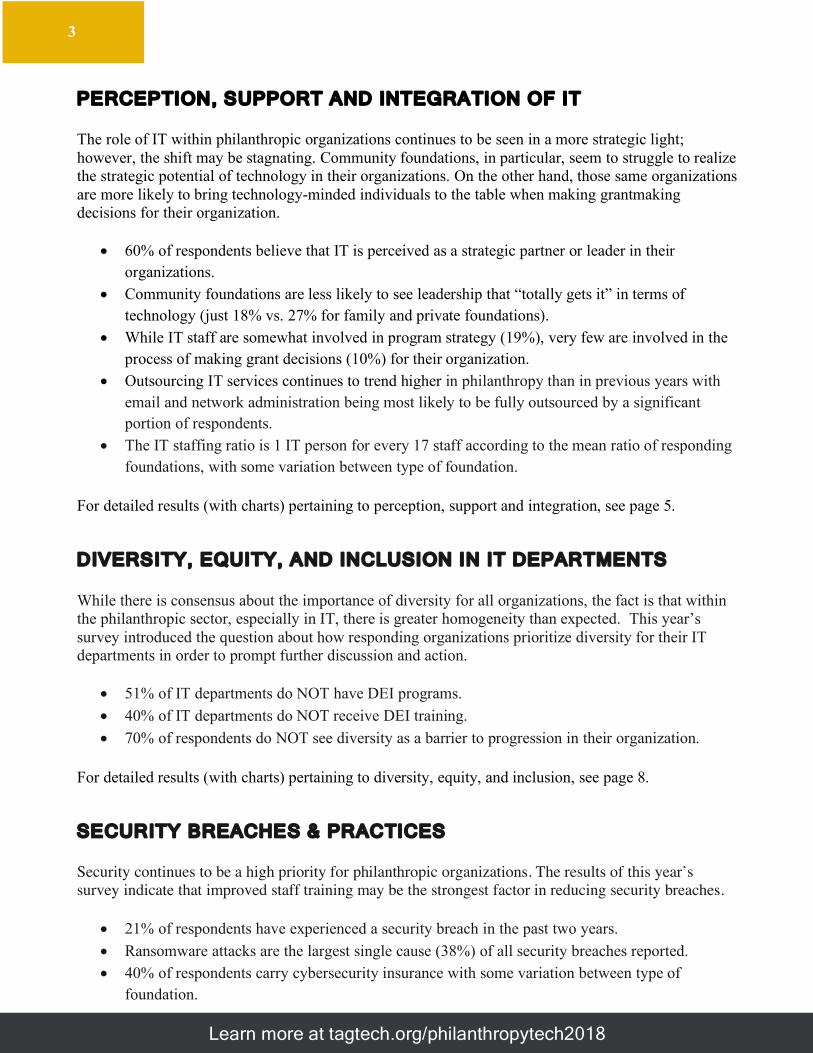
PERCEPTION, SUPPORT AND INTEGRATION OF IT The role of IT within philanthropic organizations continues to be seen in a more strategic light; however, the shift may be stagnating. Community foundations, in particular, seem to struggle to realize the strategic potential of technology in their organizations. On the other hand, those same organizations are more likely to bring technology-minded individuals to the table when making grantmaking decisions for their organization.
• 60% of respondents believe that IT is perceived as a strategic partner or leader in their organizations.
• Community foundations are less likely to see leadership that “totally gets it” in terms of technology (just 18% vs. 27% for family and private foundations).
• While IT staff are somewhat involved in program strategy (19%), very few are involved in the process of making grant decisions (10%) for their organization.
• Outsourcing IT services continues to trend higher in philanthropy than in previous years with email and network administration being most likely to be fully outsourced by a significant portion of respondents.
• The IT staffing ratio is 1 IT person for every 17 staff according to the mean ratio of responding foundations, with some variation between type of foundation.
For detailed results (with charts) pertaining to perception, support and integration, see page 5.
DIVERSITY, EQUITY, AND INCLUSION IN IT DEPARTMENTS While there is consensus about the importance of diversity for all organizations, the fact is that within the philanthropic sector, especially in IT, there is greater homogeneity than expected. This year’s survey introduced the question about how responding organizations prioritize diversity for their IT departments in order to prompt further discussion and action.
• 51% of IT departments do NOT have DEI programs. • 40% of IT departments do NOT receive DEI training. • 70% of respondents do NOT see diversity as a barrier to progression in their organization.
For detailed results (with charts) pertaining to diversity, equity, and inclusion, see page 8.
SECURITY BREACHES & PRACTICES Security continues to be a high priority for philanthropic organizations. The results of this year’s survey indicate that improved staff training may be the strongest factor in reducing security breaches.
• 21% of respondents have experienced a security breach in the past two years. • Ransomware attacks are the largest single cause (38%) of all security breaches reported. • 40% of respondents carry cybersecurity insurance with some variation between type of
foundation.

Learn more at tagtech.org/philanthropytech2018
4
• There were no notable differences in terms of security tools between breached organizations and non-breached organizations; however, there are notable differences in terms of security awareness.
For detailed results (with charts) pertaining to security, see page 10.
TOOLS & TECHNOLOGY IN USE The use of specific tools within philanthropy is less dynamic than other areas reported in this survey, therefore a few highlights of note are shared below.
• The grants management software space is shifting with established providers sharing the market with newer offerings based on Salesforce (6% of respondents “wrote in” a Salesforce-based system). 15% of responding foundations report using Fluxx, 10% report using Blackbaud GIFTS, and 9% report using roundCorner’s FoundationConnect. See the full results on page 12.
• 34% of responding foundations report NOT using any project management software. • 23% report using Salesforce for constituent relationship management (CRM). 22% report using
their grants management system for CRM functionality. • For document and file-sharing, more organizations are migrating to cloud-based services;
however, 37% of respondents report using Windows file server to some degree for document storage.
For detailed results (with charts) pertaining to tools and technology, see page 5. TAG Members: Download the raw survey results (with identifiers removed) at http://www.tagtech.org/philanthropytech2018.
ABOUT THIS SURVEY The results presented here are based upon answers to the “2018 State of Philanthropy Tech” survey conducted by the Technology Affinity Group (TAG). For over a decade now, TAG has conducted surveys of its members focused on technology, management, and security. In 2018, the Technology Affinity Group’s Survey Committee expanded our approach to include respondents beyond TAG membership and introduced new questions focused on strategy, use of blockchain, integration with program staff as well as diversity, equity, and inclusion. The final survey contained 33 questions via SurveyMonkey. The online survey was publicly available for six weeks and promoted via email, website, and social media. 199 foundations located throughout North America responded. For information about the methodology, see page 15. For information about responding organizations, see page 17.

Learn more at tagtech.org/philanthropytech2018
5
KEY FINDINGS The following sections will explore each of the four areas presented above in greater depth with supporting data and charts where helpful.
1. The perception, support, and integration of IT; 2. Diversity, equity, and inclusion practices; 3. Security breaches, protections, and practices; 4. Technology tools and practices in use within philanthropy
TAG Members: Download the raw survey results (with identifiers removed) at http://www.tagtech.org/philanthropytech2018.
PERCEPTION, SUPPORT, AND INTEGRATION OF IT The survey included a series of questions designed to assess the role of IT within the organization’s structure and strategy. The results indicate that IT leaders believe their departments play a strategic role while at the same time many leaders are choosing to increasingly outsource many IT services. These themes and more are described below.
60% of overall respondents believe that IT is perceived as a strategic partner or leader in their organizations. This is less the case for community foundations.
• The overall rate is down from 68% in 2017 but the same as 60% in 2016; however, in both
2016 and 2017 survey responses were only available from 99 organizations so the expanded scope of respondents in 2018 may be reflecting a broader state in philanthropy.
• It is worth noting that in foundations with more than 20 IT employees, 100% of respondents self-identify IT as strategic leaders within their organization.
CommunityFoundation
Family Foundation Private (Independent)Foundation
0%
10%
20%
30%
40%
50%
60%
ORGANIZATION'S PERCEIVED ROLE OF IT
UTILITY PROVIDER:
SERVICE PROVIDER:
STRATEGIC PARTNER:
STRATEGICLEADER/ENABLER:
Learn more at tagtech.org/philanthropytech2018
6
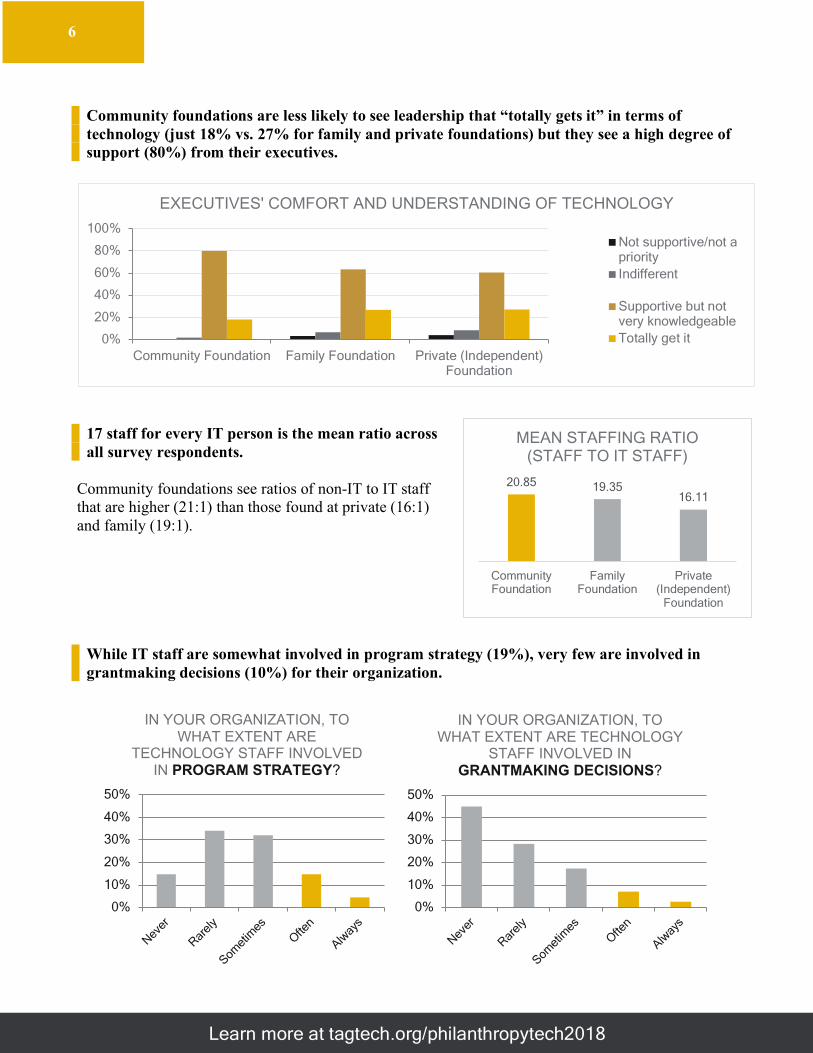
Community foundations are less likely to see leadership that “totally gets it” in terms of technology (just 18% vs. 27% for family and private foundations) but they see a high degree of support (80%) from their executives.
17 staff for every IT person is the mean ratio across all survey respondents.
Community foundations see ratios of non-IT to IT staff that are higher (21:1) than those found at private (16:1) and family (19:1).
While IT staff are somewhat involved in program strategy (19%), very few are involved in grantmaking decisions (10%) for their organization.
Community Foundation Family Foundation Private (Independent)Foundation
0%
20%
40%
60%
80%
100%
EXECUTIVES' COMFORT AND UNDERSTANDING OF TECHNOLOGY
Not supportive/not apriorityIndifferent
Supportive but notvery knowledgeableTotally get it
Never
Rarely
Somet
imes
Often
Alway
s0%
10%
20%
30%
40%
50%
IN YOUR ORGANIZATION, TO WHAT EXTENT ARE
TECHNOLOGY STAFF INVOLVED IN PROGRAM STRATEGY?
Never
Rarely
Somet
imes
Often
Alway
s0%
10%
20%
30%
40%
50%
IN YOUR ORGANIZATION, TO WHAT EXTENT ARE TECHNOLOGY
STAFF INVOLVED IN GRANTMAKING DECISIONS?
20.85 19.3516.11
CommunityFoundation
FamilyFoundation
Private(Independent)
Foundation
MEAN STAFFING RATIO (STAFF TO IT STAFF)
Learn more at tagtech.org/philanthropytech2018
7
An interesting finding from this year’s survey highlights that there may be unrealized potential at larger organizations for IT staff to contribute expertise to program strategy.
While larger organizations report being strategy leaders, they are slightly less likely to be involved in program strategy decisions than smaller organizations, raising questions about organizational siloing and integrated thinking about program strategy.
• 83% of foundations with 20 or more IT employees self-identify as strategy leaders within
their organization but only 17% report being OFTEN or ALWAYS involved in program strategy.
• In contrast, just 15% of smaller organizations (10 or less IT staff) report being strategy leaders but 20% are OFTEN or ALWAYS involved in program strategy.
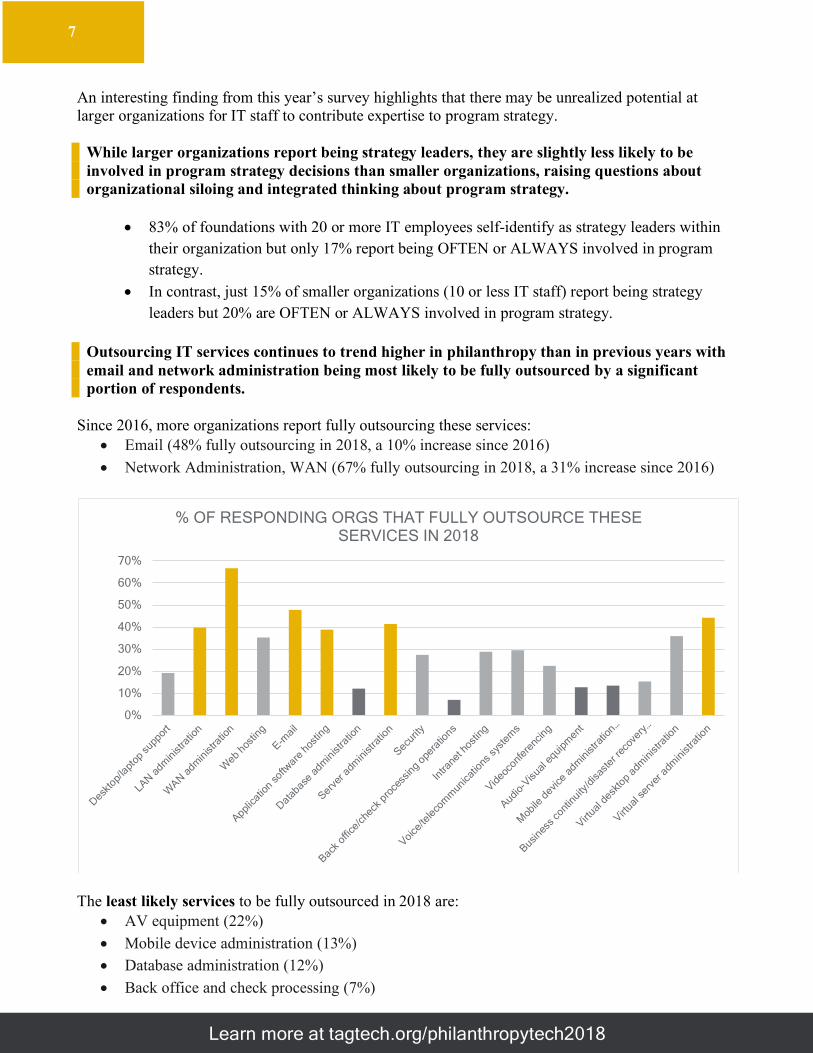
Outsourcing IT services continues to trend higher in philanthropy than in previous years with email and network administration being most likely to be fully outsourced by a significant portion of respondents.
Since 2016, more organizations report fully outsourcing these services:
• Email (48% fully outsourcing in 2018, a 10% increase since 2016) • Network Administration, WAN (67% fully outsourcing in 2018, a 31% increase since 2016)
The least likely services to be fully outsourced in 2018 are:
• AV equipment (22%) • Mobile device administration (13%) • Database administration (12%) • Back office and check processing (7%)
0%
10%
20%
30%
40%
50%
60%
70%
Deskto
p/lapt
op su
ppor
t
LAN adm
inistra
tion
WAN a
dmin
istra
tion
Web h
ostin
g
Applica
tion so
ftware
hos
ting
Database
adm
inist
ratio
n
Server
adm
inistr
ation
Securit
y
Back o
ffice/ch
eck p
roce
ssing
opera
tions
Intra
net h
osting
Voice/te
lecom
mun
icatio
ns sy
stem
s
Videoc
onfere
ncing
Audio-V
isual
equip
ment
Mob
ile d
evice a
dminist
ratio
n…
Busines
s cont
inuity
/disa
ster r
ecov
ery…
Virtual
desk
top a
dmini
stratio
n
Virtual
serv
er a
dmini
strat
ion
% OF RESPONDING ORGS THAT FULLY OUTSOURCE THESE SERVICES IN 2018

Learn more at tagtech.org/philanthropytech2018
8
DIVERSITY, EQUITY, AND INCLUSION IN IT DEPARTMENTS Introduced in this year’s survey were questions pertaining to diversity, equity, and inclusion (DEI). Questions included in the TAG survey were developed based upon PricewaterhouseCooper’s (PwC) global survey on diversity and inclusion: https://www.pwc.com/gx/en/services/people-organisation/global-diversity-and-inclusion-survey.html Leveraging selections from the PwC question set enables the philanthropic sector to explore the results presented here in comparison to data from PwC:
• PwC results for North America: https://www.pwc.com/gx/en/services/people-organisation/global-diversity-and-inclusion-survey/north-american-report.pdf
• PwC results for technology organizations: https://www.pwc.com/gx/en/services/people-organisation/global-diversity-and-inclusion-survey/technology-report.pdf
To begin the conversation, results from the 2018 State of Philanthropy Tech survey indicate that while this conversation may be underway in many foundations as a whole, their IT departments may not receive adequate training, policies, and support for diversity, equity, and inclusion.
51% of IT departments responding do NOT have DEI programs in place. Possible answers to this question were selected from the PwC survey on diversity and inclusion and included DEI programs such as recruiting diverse candidates, developing a pipeline of diverse leaders, or providing targeted development opportunities for diverse employees.
Recruit diversecandidates
Develop apipeline of
diverse leaders
Provide targeteddevelopment
opportunities fordiverse
employees
Demonstratefairness in
performanceand
compensationdecisions
None of theabove
I don’t know0%
10%
20%
30%
40%
50%
60%
IN YOUR ORGANIZATION, THE IT DEPARTMENT HAS PROGRAMS IN PLACE TO:
Learn more at tagtech.org/philanthropytech2018
9
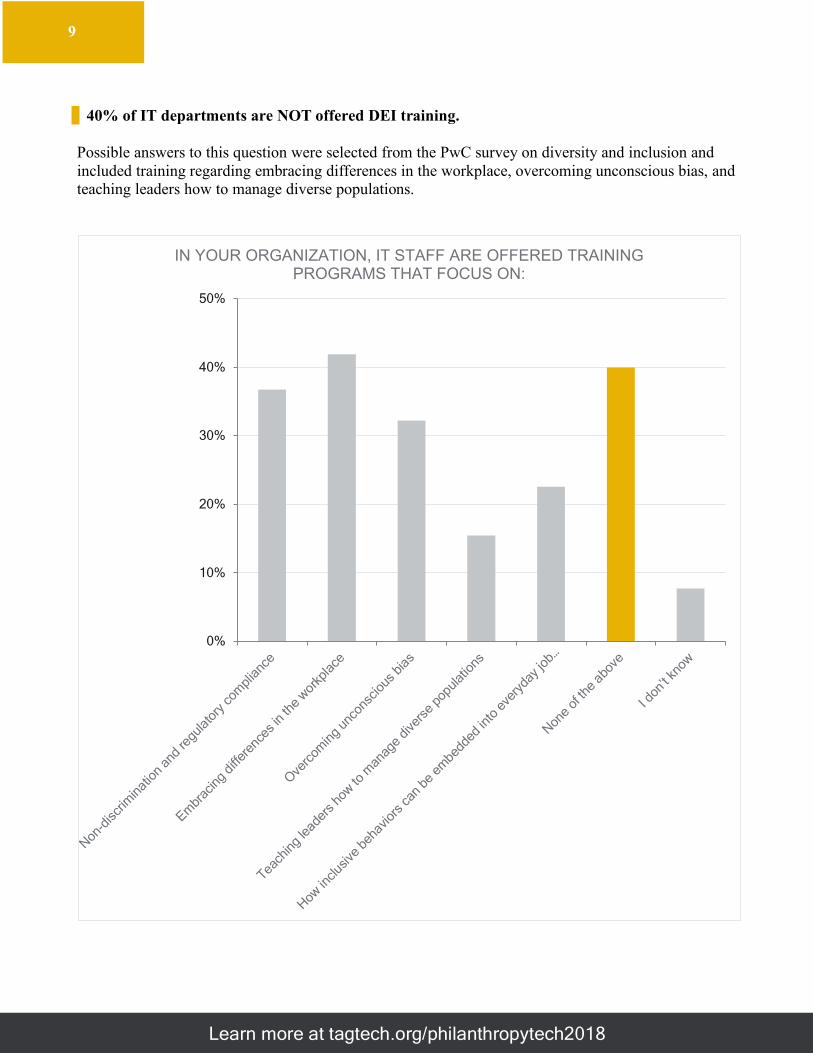
40% of IT departments are NOT offered DEI training.
Possible answers to this question were selected from the PwC survey on diversity and inclusion and included training regarding embracing differences in the workplace, overcoming unconscious bias, and teaching leaders how to manage diverse populations.
Non-d
iscrim
inatio
n an
d regu
latory
com
plian
ce
Embr
acing
diffe
rence
s in
the
workpla
ce
Overc
oming
unc
onsc
ious b
ias
Teachin
g leade
rs h
ow to
man
age
diver
se p
opula
tions
How in
clusiv
e be
havio
rs ca
n be
em
bedde
d int
o ev
eryd
ay jo
b…
None o
f the
abo
ve
I don
’t kno
w
0%
10%
20%
30%
40%
50%
IN YOUR ORGANIZATION, IT STAFF ARE OFFERED TRAINING PROGRAMS THAT FOCUS ON:

Learn more at tagtech.org/philanthropytech2018
10
70% of respondents do NOT see diversity as a barrier to progression in their organization.
Reportedly, the phrasing of this question felt unclear to some respondents, though TAG selected this question directly from PwC’s global survey on diversity and inclusion: https://www.pwc.com/gx/en/services/people-organisation/global-diversity-and-inclusion-survey.html. In future research, TAG aims to improve its survey methodology.
SECURITY BREACHES & PRACTICES
21% of respondents have experienced a security breach in the past two years.
The percentage of respondents reporting a breach is relatively stable since 2016 but differences between community, family, and private independent foundations show enough variation to warrant further exploration.
Ransomware attacks are the largest single cause (38%) of all security breaches reported.
Strongly Disagree Disagree Neither Agree norDisagree
Agree Strongly Agree0%
10%
20%
30%
40%
50%
THINKING ABOUT THE EMPLOYEE EXPERIENCE AT YOUR ORGANIZATION, SELECT THE ANSWER THAT MOST CLOSELY APPLIES…DIVERSITY IS A BARRIER TO PROGRESSION AT MY
ORGANIZATION.
0%
5%
10%
15%
20%
25%
30%
2016 2018
Community Family Private
% REPORTING A SECURITY BREACH

Learn more at tagtech.org/philanthropytech2018
11
In terms of security tools organizations use, basic firewall, email filtering, and antivirus tools are in place but only high asset organizations (>$1 billion) are widely adopting intrusion detection, multi-factor authentication, and single sign-on.
It is important to note that there were no notable differences between breached organizations and non-breached organizations in terms of security tools; however, there are notable differences in terms of security awareness.
Responding organizations who did NOT report a breach are:
• More likely to have a security awareness policy (60% compared to 40% for organizations that encountered a breach)
• More likely to hold security awareness training during staff meetings (51% compared to 23% for organizations that encountered a breach)
40% reported carrying cybersecurity insurance with private foundations being most likely (45%) and family foundations being least likely (27%).
0%
20%
40%
60%
80%
100%
Firewall
Spam
bloc
king
/Con
tent
filte
ring
Serve
r viru
s pro
tecti
on
Malw
are
Intru
sion
dete
ction
…
Mult
i-fac
tor…
gate
way…
Single
Sign-O
n
Proxy
Inte
rnet
acc
ess
Less than $250 million$250 million - $500 million$500 million - $1 billionOver $1 billion
Community Foundation Family Foundation Private (Independent)Foundations
0%
10%
20%
30%
40%
50%
HAS CYBER SECURITY INSURANCE
Yes
No
Not sure
Learn more at tagtech.org/philanthropytech2018
12
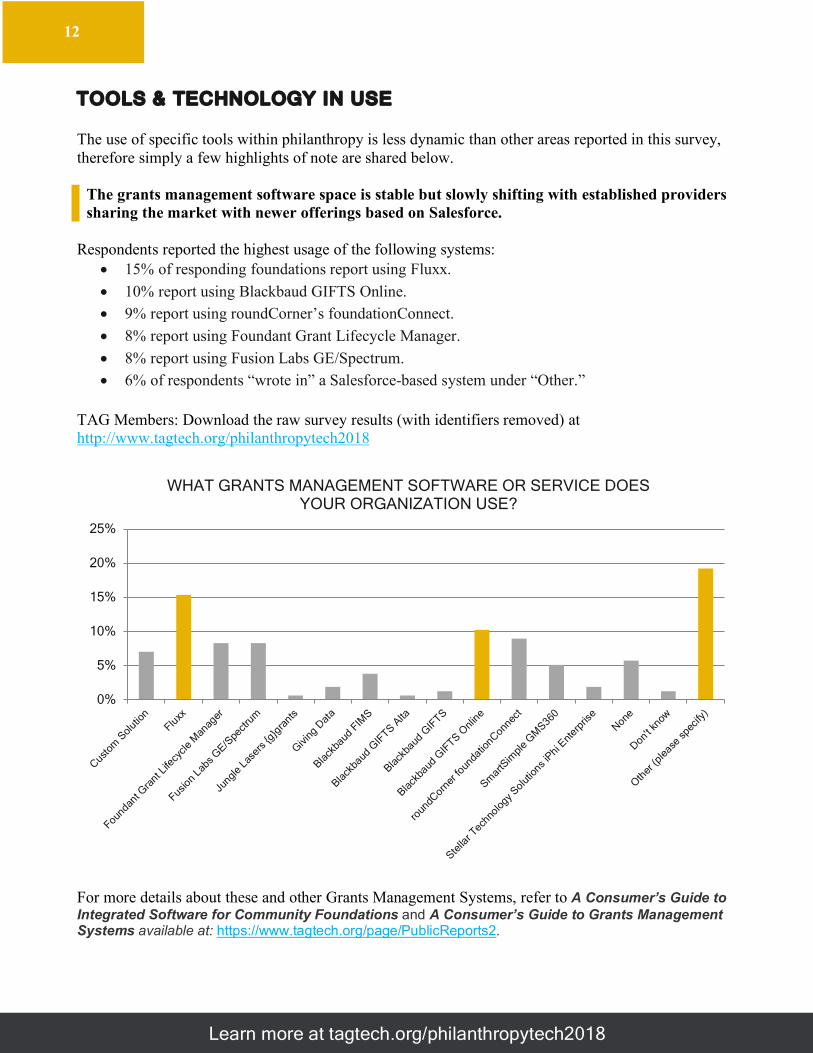
TOOLS & TECHNOLOGY IN USE The use of specific tools within philanthropy is less dynamic than other areas reported in this survey, therefore simply a few highlights of note are shared below.
The grants management software space is stable but slowly shifting with established providers sharing the market with newer offerings based on Salesforce.
Respondents reported the highest usage of the following systems:
• 15% of responding foundations report using Fluxx. • 10% report using Blackbaud GIFTS Online. • 9% report using roundCorner’s foundationConnect. • 8% report using Foundant Grant Lifecycle Manager. • 8% report using Fusion Labs GE/Spectrum. • 6% of respondents “wrote in” a Salesforce-based system under “Other.”
TAG Members: Download the raw survey results (with identifiers removed) at http://www.tagtech.org/philanthropytech2018
For more details about these and other Grants Management Systems, refer to A Consumer’s Guide to Integrated Software for Community Foundations and A Consumer’s Guide to Grants Management Systems available at: https://www.tagtech.org/page/PublicReports2.
Custom
Solu
tion
Fluxx
Foundan
t Gra
nt Life
cycle
Man
ager
Fusion
Labs G
E/Spe
ctrum
Jungle
Las
ers {g
}gra
nts
Giving
Dat
a
Blackb
aud F
IMS
Blackb
aud G
IFTS A
lta
Blackb
aud G
IFTS
Blackb
aud G
IFTS O
nline
roun
dCorn
er fo
unda
tionConn
ect
SmartS
imple
GM
S360
Stella
r Tech
nolog
y Solut
ions i
Phi Ent
erpris
eNone
Don't kn
ow
Other
(plea
se sp
ecify
)0%
5%
10%
15%
20%
25%
WHAT GRANTS MANAGEMENT SOFTWARE OR SERVICE DOES YOUR ORGANIZATION USE?
Learn more at tagtech.org/philanthropytech2018
13
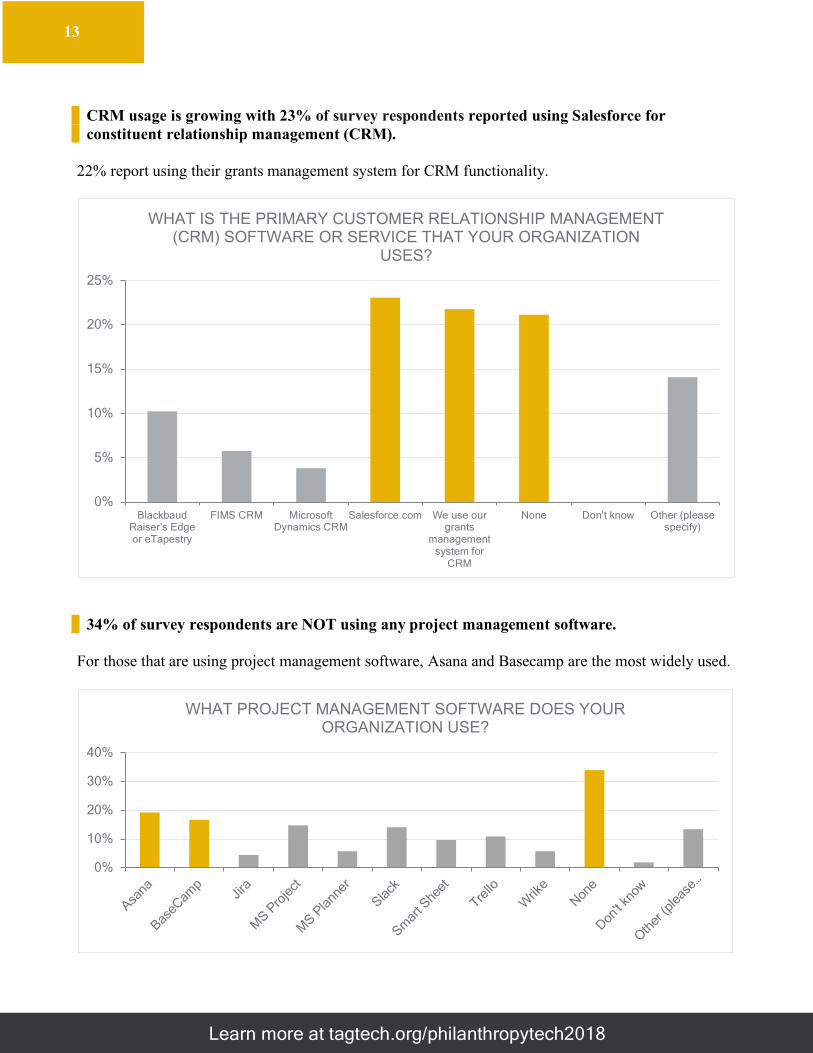
CRM usage is growing with 23% of survey respondents reported using Salesforce for constituent relationship management (CRM).
22% report using their grants management system for CRM functionality.
34% of survey respondents are NOT using any project management software. For those that are using project management software, Asana and Basecamp are the most widely used.
Blackbaud Raiser’s Edge or eTapestry
FIMS CRM MicrosoftDynamics CRM
Salesforce.com We use ourgrants
managementsystem for
CRM
None Don't know Other (pleasespecify)
0%
5%
10%
15%
20%
25%
WHAT IS THE PRIMARY CUSTOMER RELATIONSHIP MANAGEMENT (CRM) SOFTWARE OR SERVICE THAT YOUR ORGANIZATION
USES?
Asana
BaseC
amp
Jira
MS P
rojec
t
MS P
lanne
r
Slack
Smar
t She
et
Trello
Wrik
eNon
e
Don't k
now
Other
(plea
se…
0%
10%
20%
30%
40%
WHAT PROJECT MANAGEMENT SOFTWARE DOES YOUR ORGANIZATION USE?

Learn more at tagtech.org/philanthropytech2018
14
Cloud-based services for document sharing, collaboration and storage are commonly in use.
• 40% of respondents reported using OneDrive and 34% reported using Dropbox. • It is also worth noting that 37% of respondents report using Windows file server to some
degree for document storage.
Box
Dropb
ox
Google D
rive
Micr
osof
t One
Drive
Salesfo
rce
Files
Share
Point
SpringC
M
Wind
ows f
ile se
rver
None
Don't k
now
Other
(plea
se sp
ecify
)0%
10%
20%
30%
40%
50%
WHAT COLLABORATIVE DOCUMENT AND FILE SHARING SERVICES DOES YOUR ORGANIZATION USE?

Learn more at tagtech.org/philanthropytech2018
15
METHODOLOGY The results presented here are based upon answers to the “2018 State of Philanthropy Tech” survey conducted by the Technology Affinity Group (TAG). For over a decade now, TAG has conducted surveys of its members focused on technology, management, and security. In 2018, the Technology Affinity Group’s Survey Committee led by Edima Elinewinga, CTO at Zero to Three, expanded our approach to include respondents beyond TAG membership. The 2018 survey included the following:
• Selected questions from previous TAG Technology Management surveys • Selected questions from previous TAG Tools surveys • Selected questions from previous TAG Security surveys • New questions related to diversity, equity, and inclusion based upon PwC’s global survey on
diversity and inclusion: https://www.pwc.com/gx/en/services/people-organisation/global-diversity-and-inclusion-survey.html.
• New questions related to the use of blockchain. • New questions designed to understand the integration between IT staff and programming staff. • A new question designed to address a common TAG member question regarding staffing ratios
for IT staff. The final survey contained 33 questions via SurveyMonkey. The online survey was publicly available for six weeks and promoted via email, website, and social media. 199 foundations located throughout North America responded. For information about responding organizations, see the appendix on page 17.
STRENGTHS • The 2018 approach, leveraging selected questions from previous surveys, has enabled TAG to
conduct trends analysis on topics such as security breaches, perceptions of the strategic role of IT, and the use of outsourcing.
• Enabling non-TAG members to respond has widened the lens through which the philanthropic sector reflects upon its current state.
• The addition of new questions related to diversity, equity, and inclusion (DEI) raises important questions about the extent to which IT departments are being included in training and awareness programs within foundations.
LIMITATIONS • Questions related to diversity, equity, and inclusion were based upon PwC’s global survey on
diversity and inclusion (https://www.pwc.com/gx/en/services/people-organisation/global-diversity-and-inclusion-survey.html) and may have used language that felt awkward to North American respondents.
• Only two (2) corporate foundations responded, limiting the ability to make meaningful inferences based on the data.

Learn more at tagtech.org/philanthropytech2018
16
CREDITS The 2018 State of Philanthropy Tech survey as well the results presented here were developed by the Technology Affinity Group’s Survey Committee led by Edima Elinewinga, Chief Technology Officer, Zero to Three and Chantal Forster, Executive Director, Technology Affinity Group. Committee members include: Amado Ulloa, Business Analyst, First 5 LA Andrew Halpryn, Senior Information Technology Manager, Hartford Foundation for Public Giving Jose Aron-Diaz, Associate Director, Solution Delivery, The Rockefeller Foundation Karen Morabito, Director of Information Management, Arizona Community Foundation Tracie Mooneyham, Program and Grants Manager, Robins Foundation Additional research and reviews were conducted by: Kris McDaid, Robert Wood Johnson Foundation Laura Goff, Marin Community Foundation Rex Kim, Carnegie Corporation Sam Caplan, Walton Family Foundation Trevor Starkey, Arizona Community Foundation
Learn more at tagtech.org/philanthropytech2018
17
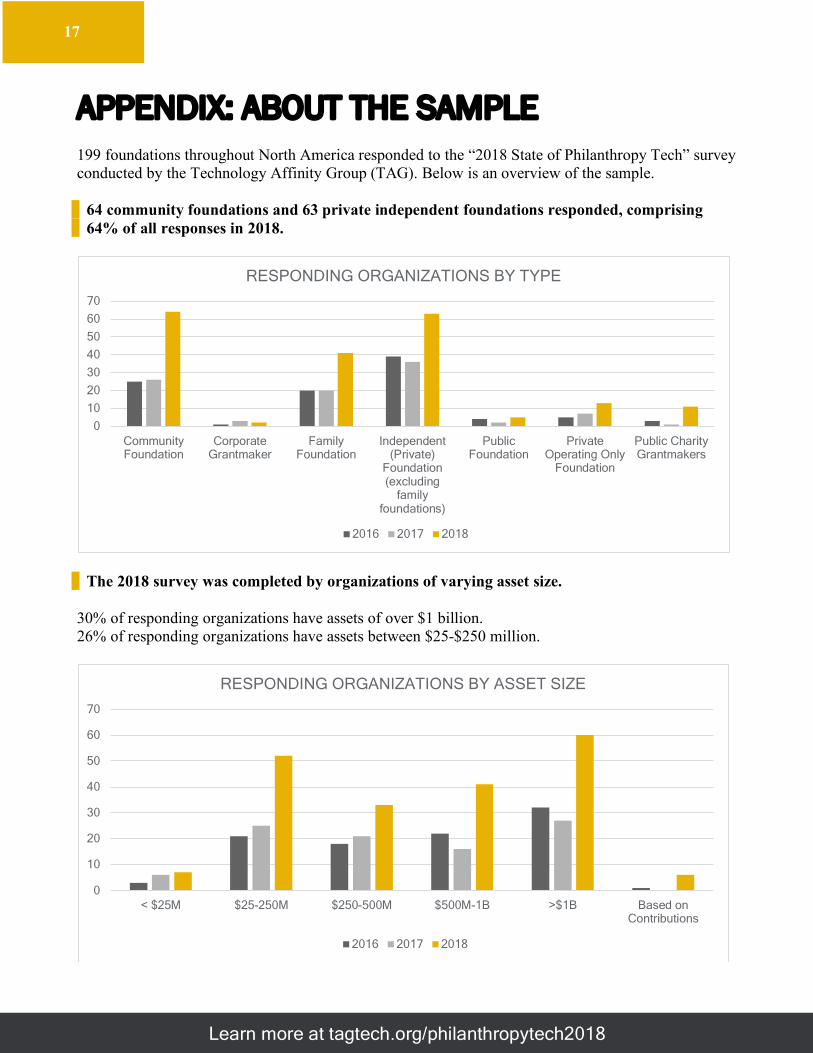
APPENDIX: ABOUT THE SAMPLE 199 foundations throughout North America responded to the “2018 State of Philanthropy Tech” survey conducted by the Technology Affinity Group (TAG). Below is an overview of the sample.
64 community foundations and 63 private independent foundations responded, comprising 64% of all responses in 2018.
The 2018 survey was completed by organizations of varying asset size. 30% of responding organizations have assets of over $1 billion. 26% of responding organizations have assets between $25-$250 million.
0
10
20
30
40
50
60
70
CommunityFoundation
CorporateGrantmaker
FamilyFoundation
Independent(Private)
Foundation(excluding
familyfoundations)
PublicFoundation
PrivateOperating Only
Foundation
Public CharityGrantmakers
RESPONDING ORGANIZATIONS BY TYPE
2016 2017 2018
0
10
20
30
40
50
60
70
< $25M $25-250M $250-500M $500M-1B >$1B Based onContributions
RESPONDING ORGANIZATIONS BY ASSET SIZE
2016 2017 2018

Learn more at tagtech.org/philanthropytech2018
18
The 2018 survey was completed by organizations of varying staff size. 26% of responding organizations employ between 26 and 50 staff.
0
10
20
30
40
50
60
0-10 11-25 26-50 51-100 101-200 >200
RESPONDING ORGANIZATIONS BY STAFF SIZE
2016 2017 2018
Recommended