2018 Quota Submissions for Commercially Harvested Macropods in Queensland
Prepared by: Macropod Management Program, Environmental Services and Regulation, Department of Environment and
Science
© State of Queensland, 2018.
The Queensland Government supports and encourages the dissemination and exchange of its information. The copyright in this
publication is licensed under a Creative Commons Attribution 3.0 Australia (CC BY) licence.
Under this licence you are free, without having to seek our permission, to use this publication in accordance with the licence
terms.
You must keep intact the copyright notice and attribute the State of Queensland as the source of the publication.
For more information on this licence, visit http://creativecommons.org/licenses/by/3.0/au/deed.en
January 2018

iii
Executive summary The commercial macropod harvest in Queensland is focused on three species (red kangaroo Macropus rufus, eastern grey kangaroo Macropus giganteus, and common wallaroo Macropus robustus) located in four zones: no harvest zone, eastern harvest zone, central harvest zone and western harvest zone.
The harvest is administered through a quota and a quota submission which is released annually and outlines proposed quotas for each species in each zone for the following calendar year. Quotas are set between 10% and 20% of the estimated population for each species in each zone, depending on survey intensity and the standard error associated with population estimates.
Population estimates for 2017 and proposed sustainable use quotas for the 2018 commercial harvest
Species Harvest zone 2017 estimated population (rounded to the nearest 50)
2018 sustainable use quota (rounded to the nearest 50)
Proportion of population (% rounded to the nearest whole number)
Red kangaroo Central
Eastern
Western
Combined
5,866,450
174,400
485,850
6,526,700
1,173,300
17,450
48,600
1,239,350
20
10
10
19
Eastern grey kangaroo Central
Eastern
Western
Combined
8,681,600
4,303,300
7,250
12,992,150
1,213,050
430,350
0
1,643,400
14
10
0
13
Common wallaroo
Central
Eastern
Western
Combined
1,790,200
1,579,850
47,050
3,417,100
268,550
158,000
4,700
431,250
15
10
10
13
The formation of quotas is informed by criteria including:
population trends (estimates obtained through aerial surveys)
review of previous harvests
the extent of non-commercial harvest mortality
the extent of areas not subject to any harvest
rainfall trends.
This quota submission outlines in detail the aspects of these criteria that pertain to the 2018 proposed quotas.
For 2017, aerial surveys were conducted at 13 monitor blocks across Queensland. Since regionalisation of the Queensland commercial macropod harvest was introduced in 2003, an estimate of macropod population size in the eastern and western zones has been made. The model used to estimate these populations is based on a small sample area and the reduced sampling effort is reflected in a conservative quota. This model was updated in 2012 to incorporate almost a decade of survey data and to generate trigger points for the commercial quota allocation.
Population estimates have decreased marginally for eastern grey kangaroos in the eastern zone but increased overall in the central zone in 2017. However in the central zone north the eastern grey population estimate is below a predetermined trigger point and the quota for this region has been halved for 2018. The red kangaroo population estimate for the central and eastern zones increased slightly since the 2016 surveys. Common wallaroo population estimates decreased in the central zone but increased significantly in the eastern zone. The western zone was not surveyed in 2017. Overall combined totals for all three species remained similar to 2016 across the state.

iv
Examination of long-term trends in population and block density estimates indicates that the 2017 estimates are within the realm of fluctuations in previous years. Estimates for all three commercially harvested species consistently number over 1,000,000 in Queensland.
In the 2016 harvest period, 22.9% of the commercial harvest quota was utilised, with the highest percentage of quota used being 31.2% for eastern grey kangaroos in the central zone. The overall harvest was male biased, with females comprising less than 4% of the overall harvest.
Figures available on 31 May 2017 show that 5.3% of the available quota for red kangaroos in the western zone had been harvested with 3.3% and 10.2% of the quota harvested in the eastern and central zones respectively. For eastern grey kangaroos, 14.7% and 2.5% of the quota was harvested in the central and eastern zones respectively. For common wallaroos, the highest percentage of quota harvested was 17.9% in the central zone, whilst only 2% of the quota was harvested in the eastern zone and 8.7% in the western zone. Given these figures, it is unlikely that quotas will be met for each species in each zone in 2017.
Non-commercial take under damage mitigation permits (DMPs) were below quota for the 2016 harvest period. This trend is likely to be repeated in 2017 with a decrease in the uptake of DMPs by landholders.
The three commercially harvested macropod species continue to be protected from harvesting within the harvest zones in national parks and state forests. The protected area within the harvest zones is 79,981km². Macropods are further protected from harvest in Queensland within the non-harvest zones.
Annual rainfall across Queensland was wetter than average during 2016 with many parts of the state flooding in winter that year. However 2017 has been very dry throughout most parts with the majority of the harvest zones still drought declared at 31 August 2017.

v
Contents Executive summary ..................................................................................................................................................... iii
Introduction ................................................................................................................................................................... 1
Proposed quotas ........................................................................................................................................................... 2
Criteria considered in quota determination ................................................................................................................... 4
Long-term population trends ..................................................................................................................................... 4
Trigger points .......................................................................................................................................................... 11
Comparison between 2015 and 2016 population estimates ................................................................................... 13
Review of the 2015 harvest ..................................................................................................................................... 20
Sex ratio by species and zone ................................................................................................................................ 21
Harvest update for 2016 .......................................................................................................................................... 23
The extent of non-commercial harvest mortality ..................................................................................................... 23
Proportion of the population not subject to harvesting ............................................................................................ 26
Rainfall trends ......................................................................................................................................................... 30
Summary and conclusion ........................................................................................................................................ 33
References .................................................................................................................................................................. 34
Appendixes ................................................................................................................................................................. 35
Appendix 1 Summary of the methodology for population monitoring and quota derivation for Queensland ......... 35
Appendix 2 Densities per km2 of the commercially harvested macropod species 2004–2016 .............................. 38

2018 Quota Submission for Commercially Harvested Macropods in Queensland
1
Introduction The commercial harvesting in Queensland of three macropod species—red kangaroo Macropus rufus, eastern grey kangaroo Macropus giganteus and common wallaroo Macropus robustus—is regulated through:
Environment Protection and Biodiversity Conservation Act 1999
Queensland Wildlife Trade Management Plan for Export—Commercially Harvested Macropods 2013–2017
Nature Conservation Act 1992 o Nature Conservation (Administration) Regulation 2017 o Nature Conservation (Wildlife Management) Regulation 2006 o Nature Conservation (Wildlife) Regulation 2006 o Nature Conservation (Macropod) Conservation Plan 2017 o Nature Conservation (Macropod Harvest Period) Notice
Animal Care and Protection Act 2001
Food Production (Safety) Act 2000.
The Department of Environment and Science (DES) administers the harvest of macropods in Queensland in accordance with the International Union for Conservation of Nature (IUCN) Recommendation 18.24, ‘the ethical, wise and sustainable use of some wildlife can provide an alternative or supplementary means of productive land-use, and can be consistent with and encourage conservation, where such use is in accordance with appropriate safeguards’ (IUCN 1990) and the Wildlife Trade Management Plan for Export—Commercially Harvested Macropods 2013–17, ‘to provide for the sustainable use of macropod species covered by the plan, in accordance with the principles of ecologically sustainable development’ (Anon 2012).
Management of the harvest is facilitated via a quota that sets the number of animals that can be taken. Quotas are established largely based on aerial surveys of the commercially harvested species and have been used in Queensland since 1975. The Director-General of DES declares a harvest period open annually via the harvest period notice and sets quotas for this period having regard to the Queensland Wildlife Trade Management Plan for Export—Commercially Harvested Macropods 2013–17. Quotas are provided to the Commonwealth Minister for The Environment for endorsement.
Quotas in Queensland are set between 10% and 20% of the estimated population for each species in each zone. Harvesting at these levels will ensure a sustainable yield and long-term conservation of macropod populations.
Since 2003, quotas have been set for each species for four harvest zones to ensure that harvest pressure is distributed across the range of the species (Figure 1):
no harvest zone (quota zero)
eastern harvest zone
central harvest zone
western harvest zone.
This quota submission contains a summary of the recommended quotas for each of the species in each of the harvest zones for 2018. Additionally, the submission outlines the basis of how these quotas were determined.
The Nature Conservation (Macropod Harvest Period 2018) Notice 2017 is due for release in December 2017. The release of this notice will allow the harvest period to be declared open on 1 January 2018. The notice will outline specific conditions for the 2018 harvest period including, but not limited to, harvest zone boundaries, weights and more.
The proposed quotas were calculated using a fixed proportion of the estimated macropod populations within the Queensland harvest areas. Proportions were adjusted for each species across the harvest zones in relation to the margins of error present in population estimates derived from aerial surveys. The maximum proportions used for each species were 15% of the populations for eastern grey kangaroos and common wallaroos and 20% of the population for red kangaroos for the central zone. For the eastern and western zones, where survey effort is less extensive when compared to the central zone, the more conservative maximum proportion of 10% was applied for all three species.
2018 Quota Submission for Commercially Harvested Macropods in Queensland
2
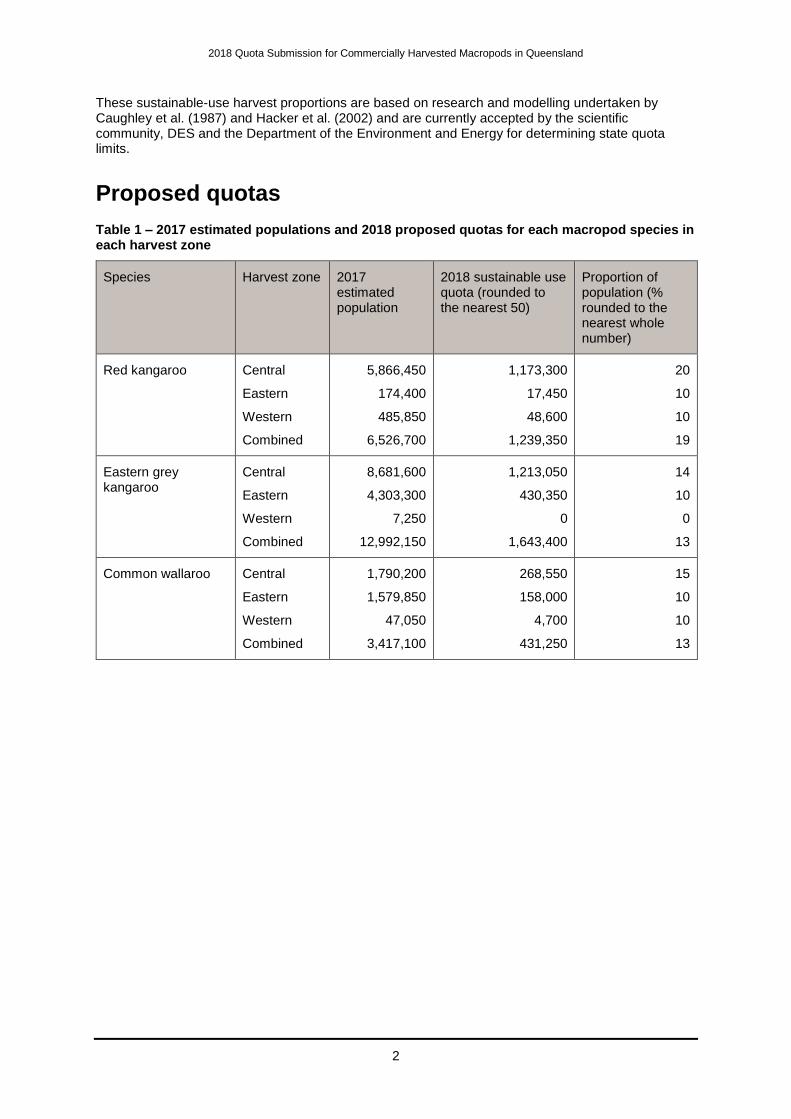
These sustainable-use harvest proportions are based on research and modelling undertaken by Caughley et al. (1987) and Hacker et al. (2002) and are currently accepted by the scientific community, DES and the Department of the Environment and Energy for determining state quota limits.
Proposed quotas
Table 1 – 2017 estimated populations and 2018 proposed quotas for each macropod species in each harvest zone
Species Harvest zone 2017 estimated population
2018 sustainable use quota (rounded to the nearest 50)
Proportion of population (% rounded to the nearest whole number)
Red kangaroo Central
Eastern
Western
Combined
5,866,450
174,400
485,850
6,526,700
1,173,300
17,450
48,600
1,239,350
20
10
10
19
Eastern grey kangaroo
Central
Eastern
Western
Combined
8,681,600
4,303,300
7,250
12,992,150
1,213,050
430,350
0
1,643,400
14
10
0
13
Common wallaroo
Central
Eastern
Western
Combined
1,790,200
1,579,850
47,050
3,417,100
268,550
158,000
4,700
431,250
15
10
10
13

2018 Quota Submission for Commercially Harvested Macropods in Queensland
3
Figure 1 – Queensland macropod harvest zones

2018 Quota Submission for Commercially Harvested Macropods in Queensland
4
Criteria considered in quota determination The following criteria were considered in determining the quotas for each macropod species:
population trends (estimates obtained through aerial surveys)
review of previous harvests
the extent of non-commercial harvest mortality
the extent of areas not subject to any harvest
rainfall trends.
Each of these criteria will be outlined in detail in this quota submission.
Long-term population trends
Population estimates
Since 1992, the Queensland Government has coordinated an annual program of aerial surveys to directly monitor populations of the three commercially harvested macropod species. These surveys occur over 22 representative monitor blocks across the state and are utilised to obtain population estimates that inform the quota. The methodology of the surveys is outlined in detail in Appendix 1. Since 2011 a correction factor of 1.85 has been applied to population estimates for common wallaroo in Queensland. Prior to this a correction factor of 1.2 was applied.
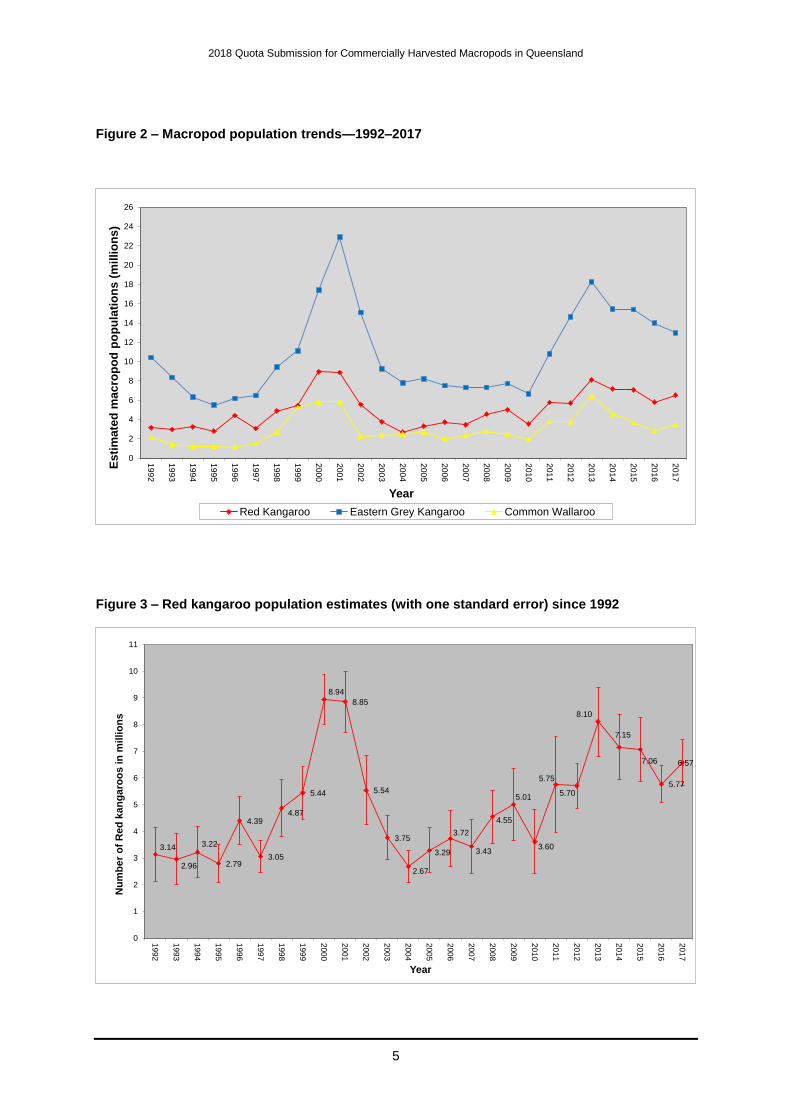
Current harvesting rates (quotas ranging from 10% to 20% of population estimates) are considered sustainable. None of the three commercially harvested species has shown a consistent decline in abundance since 1992 (figures 2, 3, 4 and 5), which would necessitate a reassessment of the harvest take and species conservation status. Whilst no consistent declines have been observed, the macropod populations in Queensland have fluctuated over time.
Density estimates
To contribute to ensuring commercially harvested macropod species are maintained across their distributions, density estimates are calculated for representative survey blocks as part of the aerial surveys (Appendix 2). For the purposes of interpreting this data in an easily understood manner, the density estimates for each species have been grouped into the eastern and western harvest zones, with the central harvest zone divided into three regions, central zone north (Mitchell Grass dominant), central zone south (Mulga Lands dominant) and central zone east (Brigalow Belt dominant) (Figure 6).
2018 Quota Submission for Commercially Harvested Macropods in Queensland
5
Figure 2 – Macropod population trends—1992–2017
Figure 3 – Red kangaroo population estimates (with one standard error) since 1992
0
2
4
6
8
10
12
14
16
18
20
22
24
26
19
92
19
93
19
94
19
95
19
96
19
97
19
98
19
99
20
00
20
01
20
02
20
03
20
04
20
05
20
06
20
07
20
08
20
09
20
10
20
11
20
12
20
13
20
14
20
15
20
16
20
17
Esti
mate
d m
acro
po
d p
op
ula
tio
ns (
millio
ns)
Year
Red Kangaroo Eastern Grey Kangaroo Common Wallaroo
3.14
2.96
3.22
2.79
4.39
3.05
4.87
5.44
8.94
8.85
5.54
3.75
2.67
3.29
3.72
3.43
4.55
5.01
3.60
5.75
5.70
8.10
7.15
7.06
5.77
6.57
0
1
2
3
4
5
6
7
8
9
10
111992
19
93
19
94
1995
19
96
19
97
19
98
19
99
20
00
20
01
20
02
20
03
20
04
20
05
2006
20
07
20
08
2009
20
10
20
11
20
12
20
13
20
14
20
15
20
16
20
17
Nu
mb
er
of
Re
d k
an
ga
roo
s in
mil
lio
ns
Year

2018 Quota Submission for Commercially Harvested Macropods in Queensland
6
Figure 4 – Eastern grey kangaroo population estimates (with one standard error) since 1992
Figure 5 – Common wallaroo population estimates (with one standard error) since 1992. Estimates include a 1.85 correction factor for 2011 to 2017 and a 1.2 correction factor all other years
10.40
8.36
6.31
5.50
6.176.47
9.44
11.10
17.40
22.89
15.09
9.25
7.78
8.20
7.49
7.31
7.33
7.72
6.65
10.80
14.64
18.25
15.43
15.40
13.99
12.99
0
2
4
6
8
10
12
14
16
18
20
22
24
26
28
30
32
19
92
19
93
19
94
19
95
19
96
19
97
19
98
19
99
20
00
20
01
20
02
20
03
20
04
20
05
20
06
20
07
20
08
20
09
20
10
20
11
20
12
20
13
20
14
20
15
20
16
20
17
Nu
mb
er
of
Ea
ste
rn g
rey k
an
ga
roo
s in
mil
lio
ns
Year
2.14
1.43
1.201.18
1.12
1.50
2.66
5.25
5.815.83
2.232.39 2.47
2.70
1.95
2.34
2.742.41
1.92
3.77
3.75
6.45
4.58
3.69
2.80
3.42
0
1
2
3
4
5
6
7
8
9
10
19
92
19
93
19
94
19
95
19
96
19
97
19
98
19
99
20
00
200
1
200
2
200
3
200
4
200
5
200
6
200
7
20
08
20
09
20
10
20
11
20
12
20
13
20
14
20
15
20
16
20
17
Nu
mb
er
of
Co
mm
on
wa
lla
roo
s in
mil
lio
ns
Year

2018 Quota Submission for Commercially Harvested Macropods in Queensland
7
This data is monitored for any significant decreases in densities. This approach is possible for all data collected since 2005. Examination of trends in density for the three commercially harvested macropod species in the areas outlined above for the period 2005–2017 demonstrates densities do fluctuate over time (figures 7–11).
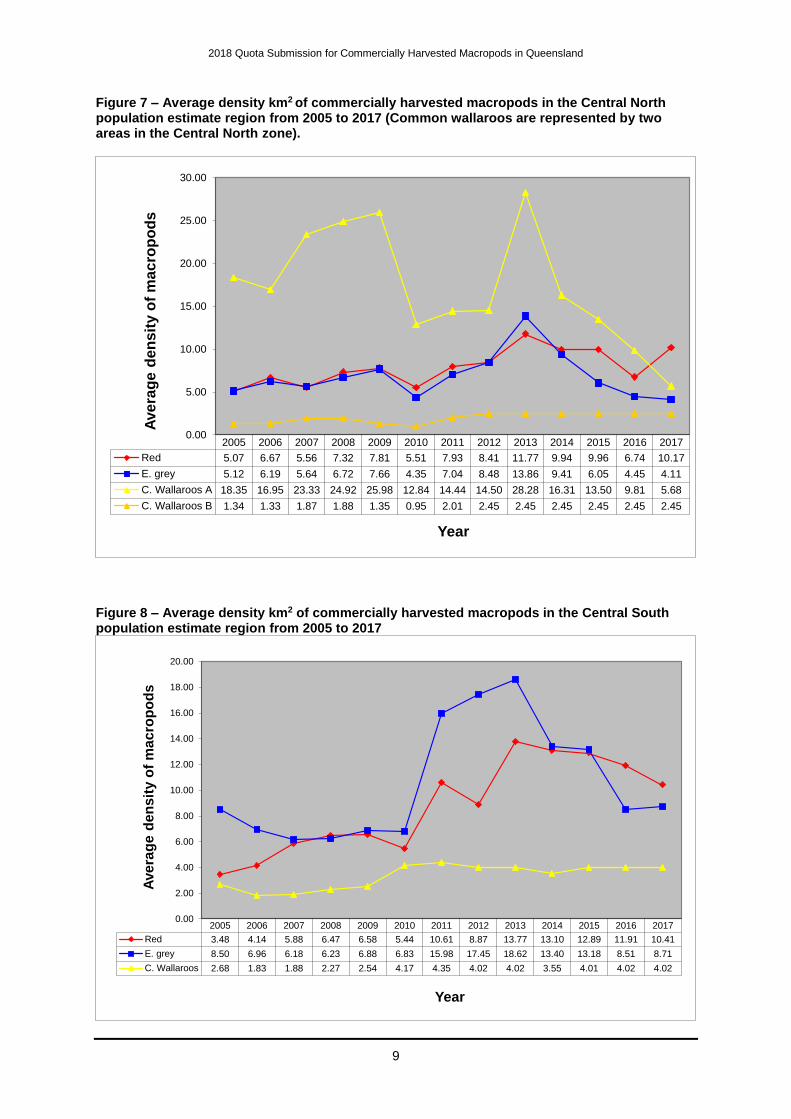
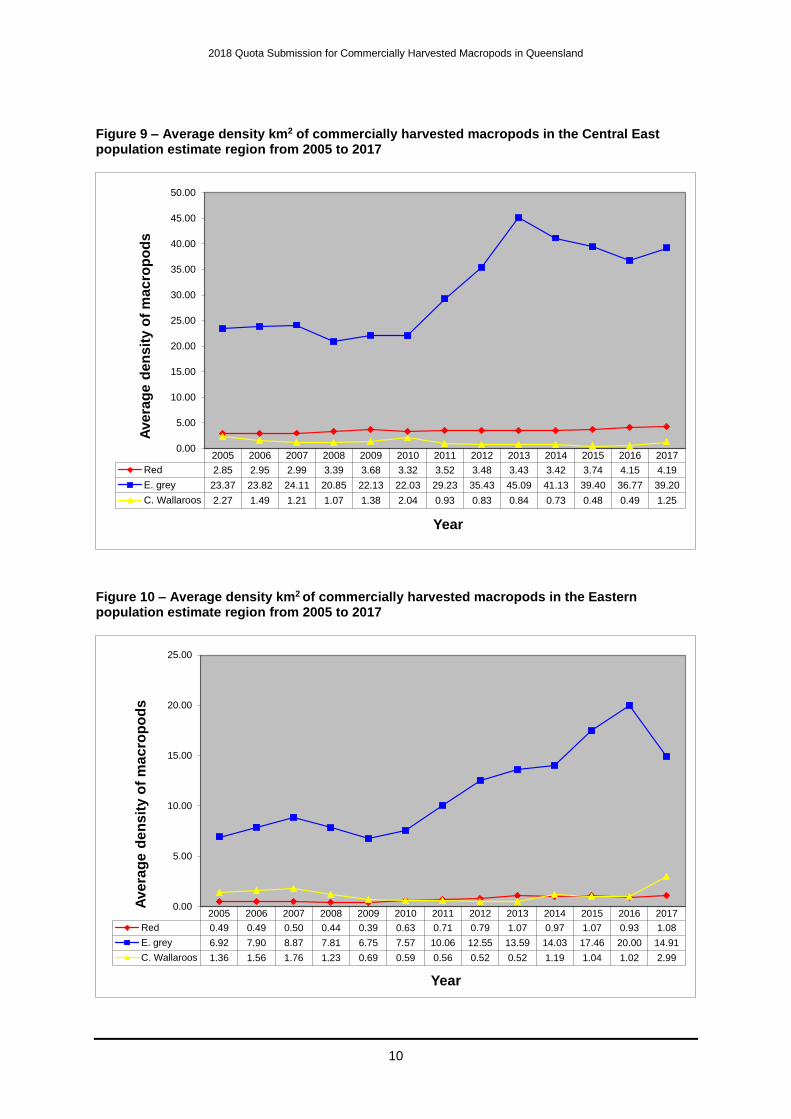
For red kangaroos densities are greatest in the central zone north and central zone south, with densities lowest in the eastern zone (Figure 10). Low densities in the eastern zone are expected as this area incorporates the edge of the distributional range for this species.
For eastern grey kangaroos highest densities are recorded in the central zone east (Figure 9). Eastern grey kangaroos occur in consistently low densities in the western zone at the edge of their distributional range. As such, there is no quota for eastern grey kangaroos in this zone (Table 1).
Common wallaroos occur in highest densities in the central zone north. This area is further divided into two regions for the purposes of estimating populations due to the considerably higher densities recorded around Blackall, Tambo and Longreach when compared to the rest of the zone (Figure 7 and Appendix 2). Lowest densities for this species occur in the western zone (Figure 11). Density fluctuations for this species do not follow the same patterns as those exhibited by red and eastern grey kangaroos (figures 7–11).

2018 Quota Submission for Commercially Harvested Macropods in Queensland
8
Figure 6 – Regions used to calculate population estimates of commercially harvested macropods
2018 Quota Submission for Commercially Harvested Macropods in Queensland
9
Figure 7 – Average density km2 of commercially harvested macropods in the Central North population estimate region from 2005 to 2017 (Common wallaroos are represented by two areas in the Central North zone).
Figure 8 – Average density km2 of commercially harvested macropods in the Central South population estimate region from 2005 to 2017
2005 2006 2007 2008 2009 2010 2011 2012 2013 2014 2015 2016 2017
Red 5.07 6.67 5.56 7.32 7.81 5.51 7.93 8.41 11.77 9.94 9.96 6.74 10.17
E. grey 5.12 6.19 5.64 6.72 7.66 4.35 7.04 8.48 13.86 9.41 6.05 4.45 4.11
C. Wallaroos A 18.35 16.95 23.33 24.92 25.98 12.84 14.44 14.50 28.28 16.31 13.50 9.81 5.68
C. Wallaroos B 1.34 1.33 1.87 1.88 1.35 0.95 2.01 2.45 2.45 2.45 2.45 2.45 2.45
0.00
5.00
10.00
15.00
20.00
25.00
30.00
Ave
rag
e d
en
sit
y o
f m
ac
rop
od
s
Year
2005 2006 2007 2008 2009 2010 2011 2012 2013 2014 2015 2016 2017
Red 3.48 4.14 5.88 6.47 6.58 5.44 10.61 8.87 13.77 13.10 12.89 11.91 10.41
E. grey 8.50 6.96 6.18 6.23 6.88 6.83 15.98 17.45 18.62 13.40 13.18 8.51 8.71
C. Wallaroos 2.68 1.83 1.88 2.27 2.54 4.17 4.35 4.02 4.02 3.55 4.01 4.02 4.02
0.00
2.00
4.00
6.00
8.00
10.00
12.00
14.00
16.00
18.00
20.00
Ave
rag
e d
en
sit
y o
f m
ac
rop
od
s
Year
2018 Quota Submission for Commercially Harvested Macropods in Queensland
10
Figure 9 – Average density km2 of commercially harvested macropods in the Central East population estimate region from 2005 to 2017
Figure 10 – Average density km2 of commercially harvested macropods in the Eastern population estimate region from 2005 to 2017
2005 2006 2007 2008 2009 2010 2011 2012 2013 2014 2015 2016 2017
Red 2.85 2.95 2.99 3.39 3.68 3.32 3.52 3.48 3.43 3.42 3.74 4.15 4.19
E. grey 23.37 23.82 24.11 20.85 22.13 22.03 29.23 35.43 45.09 41.13 39.40 36.77 39.20
C. Wallaroos 2.27 1.49 1.21 1.07 1.38 2.04 0.93 0.83 0.84 0.73 0.48 0.49 1.25
0.00
5.00
10.00
15.00
20.00
25.00
30.00
35.00
40.00
45.00
50.00
Ave
rag
e d
en
sit
y o
f m
ac
rop
od
s
Year
2005 2006 2007 2008 2009 2010 2011 2012 2013 2014 2015 2016 2017
Red 0.49 0.49 0.50 0.44 0.39 0.63 0.71 0.79 1.07 0.97 1.07 0.93 1.08
E. grey 6.92 7.90 8.87 7.81 6.75 7.57 10.06 12.55 13.59 14.03 17.46 20.00 14.91
C. Wallaroos 1.36 1.56 1.76 1.23 0.69 0.59 0.56 0.52 0.52 1.19 1.04 1.02 2.99
0.00
5.00
10.00
15.00
20.00
25.00
Ave
rag
e d
en
sit
y o
f m
ac
rop
od
s
Year

2018 Quota Submission for Commercially Harvested Macropods in Queensland
11
Figure 11 – Average density km2 of commercially harvested macropods in the Western population estimate region from 2005 to 2017
Trigger points
2013 marked the beginning of a new Queensland Wildlife Trade Management Plan for Export (Commercially Harvested Macropods 2013–17). Incorporated into this new plan are pre-determined trigger points for each of the commercial harvest quotas. Each trigger point represents a threshold level based on analysis of the long-term population estimate for each harvested species in each population estimate region.
Where an estimated population for a region falls below a trigger point of 1.5 standard deviations (SD) below the long-term average for that region then the harvest quota will be halved for that region in the next calendar year. If a population estimate falls below 2 SDs below the long-term average for that species in that region then there will be no quota for the following year.
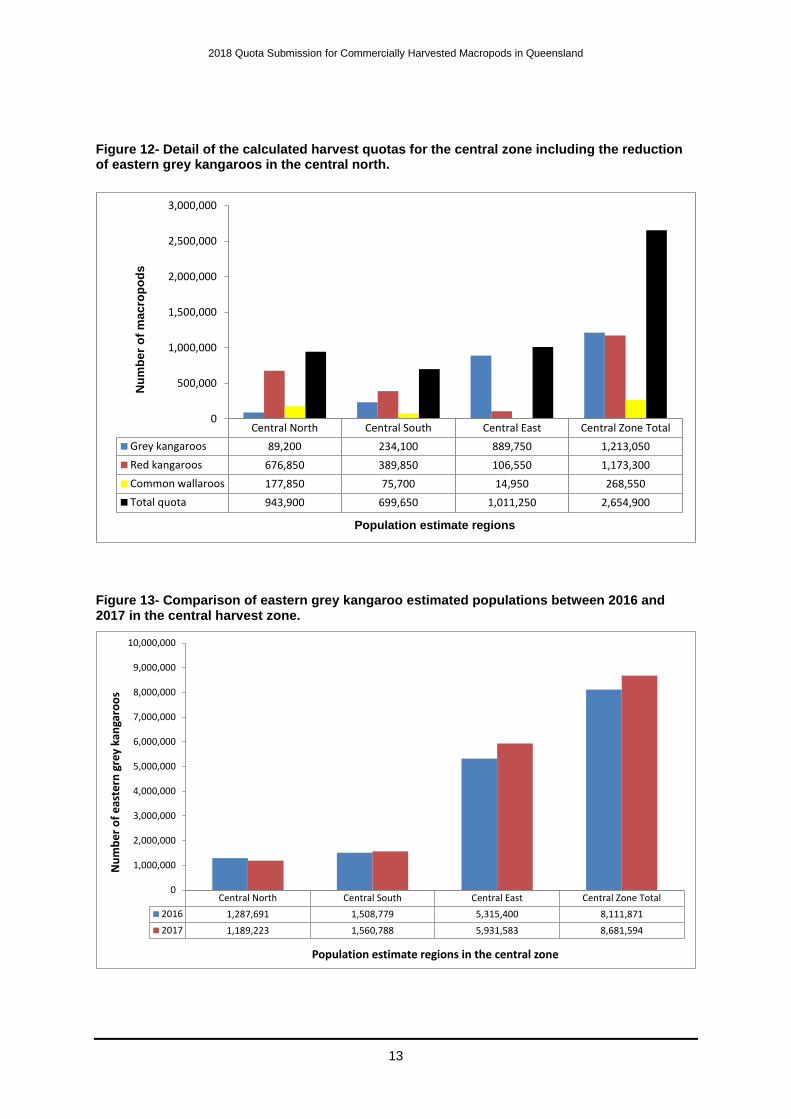
Table 2 shows the calculated trigger points for 2018 for each species in each region compared with the population estimates for those regions. The estimated population for eastern grey kangaroos in the central north region is below 1.5 SD trigger point. Consistent with the Wildlife Trade Management Plan for Export—Commercially Harvested Macropods 2013–17 the harvest quota for this species has been halved for 2018. The harvest of eastern grey kangaroos will be limited to a maximum of 89,200 in the central north region for 2018 (figure 12). All other species are above the calculated trigger points and quotas have been allocated accordingly (Figure 12). As the western zone is on the very limit of the eastern grey kangaroo range no quota is set for this species in this zone. Consequently there are no trigger points calculated for this species in this zone.
2005 2006 2007 2008 2009 2010 2011 2012 2013 2014 2015 2016 2017
Red 2.53 2.53 3.25 3.98 2.95 1.93 2.02 2.02 3.37 3.37 2.86 2.31 2.31
E. grey 0.09 0.13 0.09 0.05 0.08 0.12 0.02 0.02 0.04 0.04 0.00 0.03 0.03
C. Wallaroos 0.25 0.21 0.69 1.17 0.90 0.63 0.18 0.18 0.65 0.65 0.01 0.11 0.11
0.00
0.50
1.00
1.50
2.00
2.50
3.00
3.50
4.00
4.50
Ave
rag
e d
en
sit
y o
f m
ac
rop
od
s
Year

2018 Quota Submission for Commercially Harvested Macropods in Queensland
12
Table 2 – Calculated trigger points for 2018 and estimated populations of commercially harvested macropod species in each region for 2017
Note: There is no quota set for eastern grey kangaroos in the western region. The quota for this species will be halved for the central north region in 2018 as the estimated population is below the 1.5 SD trigger point.
Species Population
estimate region
2017 estimated
population
2018 1.5 SD
trigger point
2018 2 SD
trigger point
Red kangaroo Central North
Central South
Central East
Eastern
Western
3,384,364
1,949,256
532,808
174,408
485,835
1,815,176
689,013
96,044
73,800
180,150
1,599,711
557,976
72,409
63,800
142,400
Eastern grey kangaroo
Central North
Central South
Central East
Eastern
Western
1,189,223
1,560,788
5,931,583
4,303,285
7,267
1,236,292
861,140
2,450,768
1,152,100
NA
1,017,324
692,537
2,068,980
886,300
NA
Common wallaroo
Central North
Central South
Central East
Eastern
Western
1,185,629
504,748
99,803
1,579,844
47,057
444,645
93,187
15,587
209,650
20,300
338,405
67,614
11,860
164,700
12,300
Note: There is no quota set for eastern grey kangaroos in the western region.
Whilst the effect of halving the harvest quota for eastern greys in the central north reduces the available harvest for this species this effect is unlikely to impact the industry. The overall availability of harvest macropods in the central north is 943,900 whilst the overall availability of eastern greys in the entire central zone is 1,213,050 (figure 12). Although the estimated population for eastern greys decreased in this region it remained very similar to 2016 and increased slightly over the combined central harvest zone (figure 13).
2018 Quota Submission for Commercially Harvested Macropods in Queensland
13
Figure 12- Detail of the calculated harvest quotas for the central zone including the reduction of eastern grey kangaroos in the central north.
Figure 13- Comparison of eastern grey kangaroo estimated populations between 2016 and 2017 in the central harvest zone.
Central North Central South Central East Central Zone Total
Grey kangaroos 89,200 234,100 889,750 1,213,050
Red kangaroos 676,850 389,850 106,550 1,173,300
Common wallaroos 177,850 75,700 14,950 268,550
Total quota 943,900 699,650 1,011,250 2,654,900
0
500,000
1,000,000
1,500,000
2,000,000
2,500,000
3,000,000
Nu
mb
er
of
ma
cro
po
ds
Population estimate regions
Central North Central South Central East Central Zone Total
2016 1,287,691 1,508,779 5,315,400 8,111,871
2017 1,189,223 1,560,788 5,931,583 8,681,594
0
1,000,000
2,000,000
3,000,000
4,000,000
5,000,000
6,000,000
7,000,000
8,000,000
9,000,000
10,000,000
Nu
mb
er o
f ea
ster
n g
rey
kan
garo
os
Population estimate regions in the central zone

2018 Quota Submission for Commercially Harvested Macropods in Queensland
14
Comparison between 2016 and 2017 population estimates
The total population estimates combined across all three harvest zones has decreased for eastern grey kangaroos and increased for red kangaroos and common wallaroos in 2017 compared with 2016 (Figure 13). However whilst some population estimates have decreased for specific zones others have increased (Table 3). Red kangaroo population estimates increased in the central and eastern zones (figure 14). The eastern grey population estimates decreased in the eastern zones and increased in the central zone (figure 14). Common wallaroo population estimates increased significantly in the eastern zone due mostly to a large density increase recorded at the Inglewood survey block (Appendix 2). However common wallaroos decreased in the central zone (figure 14). The western harvest zone was not surveyed in 2017.
Since regionalisation of the Queensland commercial macropod harvest was introduced in 2003 an estimate of macropod population size in the eastern and western zones has been made. The model used to estimate these populations is based on a small sample area and the reduced sampling effort is reflected in a conservative quota (figure 15). This model was updated in 2012 to incorporate almost a decade of survey data and to generate trigger points for the commercial quota allocation.
Figure 13 – Comparison of overall macropod populations in the commercial harvest zones 2016 and 2017 (with one standard error).
2016
2016
2016
2017 20172017
0
2
4
6
8
10
12
14
16
18
20
Red Kangaroo Eastern Grey Kangaroo Common Wallaroo
Esti
ma
ted
po
pu
lati
on
in
millio
ns
Macropod species

2018 Quota Submission for Commercially Harvested Macropods in Queensland
15
Table 3 – Comparison between 2016 and 2017 macropod population estimates. Note the western zone was not surveyed in 2017.
Species Harvest zone
2016 population estimate
2017 population estimate
Red kangaroo Central
Eastern
Western
Combined
5,137,600
145,200
485,850
5,768,650
5,866,450
174,400
485,850
6,526,700
Eastern grey kangaroo Central
Eastern
Western
Combined
8,111,850
5,873,850
7,250
13,992,950
8,681,600
4,303,300
7,250
12,992,150
Common wallaroo
Central
Eastern
Western
Combined
2,205,600
552,500
47,050
2,805,150
1,790,200
1,579,850
47,050
3,417,100
Figure 14 – Comparison of macropod populations from 2016 to 2017 by species and zone.
48
5,8
50
5,1
37
,60
0
14
5,2
00
7,2
50
8,1
11
,85
0
5,8
73
,85
0
47
,05
0
2,2
05
,60
0
55
2,5
00
48
5,8
50
5,8
66
,45
0
17
4,4
00
7,2
50
8,6
81
,60
0
4,3
03
,30
0
47
,05
0
1,7
90
,20
0
1,5
79
,85
0
0
1,000,000
2,000,000
3,000,000
4,000,000
5,000,000
6,000,000
7,000,000
8,000,000
9,000,000
10,000,000
Western Central Eastern Western Central Eastern Western Central Eastern
Red kangaroo Eastern grey kangaroo Common wallaroo
Nu
mb
er o
f m
acro
po
ds
Species and harvest zones
2016 2017

2018 Quota Submission for Commercially Harvested Macropods in Queensland
16
Figure 15 – Comparison of 2017 actual and 2018 proposed harvest quotas.
Long-term quota and harvest trends
Figures 16 to 18 outline data on the three commercially harvested macropod species pertaining to estimated population, quota and harvest for the years 1992 to 2016. Please note that population estimates are based on aerial surveys conducted in the previous year to the quota and harvest. Combined population estimates, quota and harvest data have been used for the period post-regionalisation in 2003, to enable comparison with data collated prior to this period.
48
,60
0
1,0
27
,50
0
14
,50
0
0
1,2
16
,80
0
58
7,4
00
4,7
00
33
0,8
50
55
,25
0
48
,60
0
1,1
73
,30
0
17
,45
0
0
1,2
13
,05
0
43
0,3
50
4,7
00
26
8,5
50
15
8,0
00
0
200,000
400,000
600,000
800,000
1,000,000
1,200,000
1,400,000
Western Central Eastern Western Central Eastern Western Central Eastern
Red kangaroo Eastern grey kangaroo Common wallaroo
Nu
mb
er o
f m
acro
po
ds
Species and harvest zones
2017 2018

2018 Quota Submission for Commercially Harvested Macropods in Queensland
17
Figure 16 – Long-term population estimates (± one standard error), quota and harvest data (commercial harvest + damage mitigation permits) for the red kangaroo in Queensland.
Note: population estimates are based on aerial surveys conducted the year before the harvest was taken.
0
2,000,000
4,000,000
6,000,000
8,000,000
10,000,000
12,000,000
1992 1993 1994 1995 1996 1997 1998 1999 2000 2001 2002 2003 2004 2005 2006 2007 2008 2009 2010 2011 2012 2013 2014 2015 2016
Nu
mb
er
of
red
ka
ng
aro
os
Year
Quota Combined harvest Red kangaroo population estimate

2018 Quota Submission for Commercially Harvested Macropods in Queensland
18
Figure 17 – Long-term population estimates (± one standard error), quota and harvest data (commercial harvest + damage mitigation permits) for the eastern grey kangaroo in Queensland.
Note: population estimates are based on aerial surveys conducted the year before the harvest was taken.
0
5,000,000
10,000,000
15,000,000
20,000,000
25,000,000
30,000,000
35,000,000
1992 1993 1994 1995 1996 1997 1998 1999 2000 2001 2002 2003 2004 2005 2006 2007 2008 2009 2010 2011 2012 2013 2014 2015 2016
Nu
mb
er
of
ea
ste
rn g
rey k
an
ga
roo
s
Year
Quota Combined harvest Eastern grey kangaroo population estimate
2018 Quota Submission for Commercially Harvested Macropods in Queensland
19
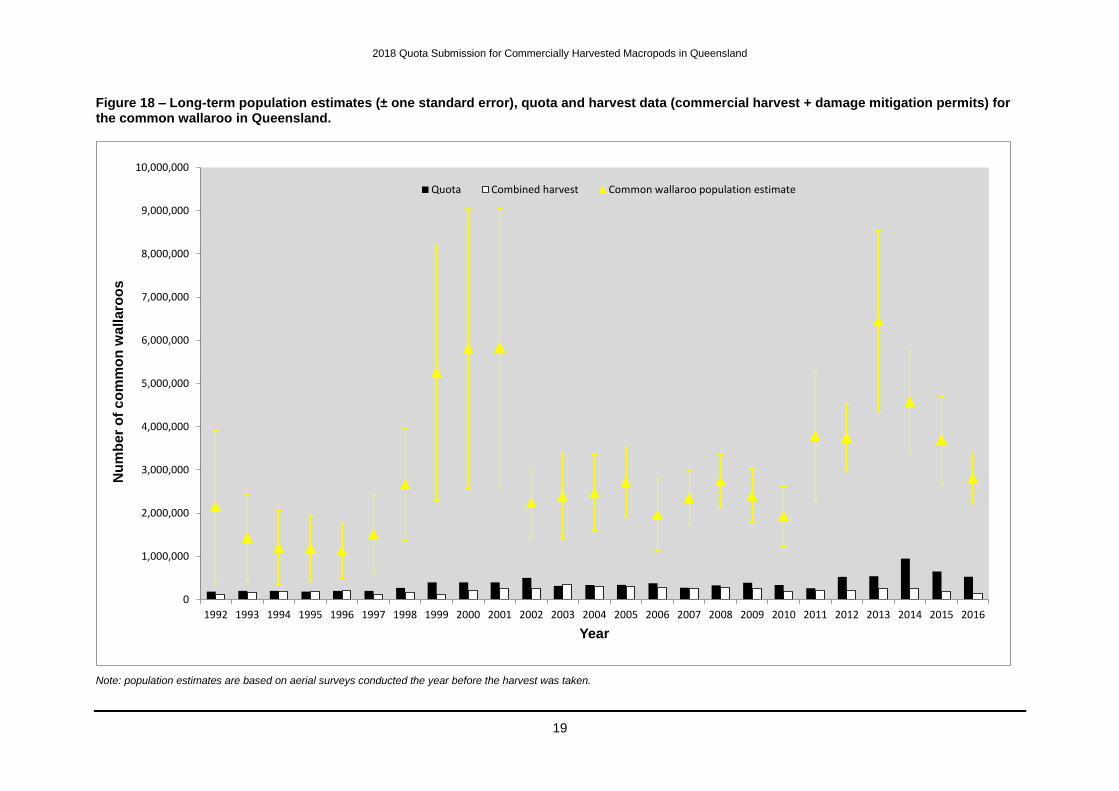
Figure 18 – Long-term population estimates (± one standard error), quota and harvest data (commercial harvest + damage mitigation permits) for the common wallaroo in Queensland.
Note: population estimates are based on aerial surveys conducted the year before the harvest was taken.
0
1,000,000
2,000,000
3,000,000
4,000,000
5,000,000
6,000,000
7,000,000
8,000,000
9,000,000
10,000,000
1992 1993 1994 1995 1996 1997 1998 1999 2000 2001 2002 2003 2004 2005 2006 2007 2008 2009 2010 2011 2012 2013 2014 2015 2016
Nu
mb
er
of
co
mm
on
wa
lla
roo
s
Year
Quota Combined harvest Common wallaroo population estimate

2018 Quota Submission for Commercially Harvested Macropods in Queensland
20
As previously outlined, there has been no consistent decline in the populations of the three commercially harvested species since 1992 (figures 16 to 18). Of these species, the eastern grey kangaroo is consistently most abundant across the harvest zones, followed by the red kangaroo. Common wallaroos are the least numerous. Population estimates for all three species are in excess of one million across the harvest zones.
As quotas are set as a constant proportion of the populations, they fluctuate as population estimates fluctuate (figures 16 to 18). However, numerous factors influence harvest rates for commercial macropods. These include population levels, market forces, environmental conditions and access by harvesters. As a consequence, there is no clear pattern or trend in the proportion of the quota harvested since 1992.
Review of the 2016 harvest
Dealer returns for the year 2016 indicate that there were 896,144 macropods taken in Queensland, which represents 22.9% of the overall combined quota. Of the 896,144 animals harvested, there were 251,778 red kangaroos, 528,547 eastern grey kangaroos and 115,819 common wallaroos harvested (table 4). Quotas for individual species in each harvest zone were not exceeded in 2016, the maximum commercial take as a percentage of the approved quota of 31.2% being for eastern greys in the central zone (tables 4 to 7).
Table 4 – Total harvest in 2016
Species Population estimate 2015
Quota 2016 Harvest take 2016
% quota used 2016
% population harvested 2016
Red kangaroo
7,061,200 1,335,950 251,778 18.8% 3.6%
Eastern grey kangaroo
15,406,700 2,055,250 528,547 25.7% 3.4%
Common wallaroo
3,694,100
525,500 115,819 22.0% 3.1%
Total
26,162,000
3,916,700 896,144 22.9% 3.4%
Note: population estimates are based on aerial surveys conducted in 2015, which were used to set the 2016 quota.
Table 5 – Harvest of red kangaroos in 2016
Zone Population estimate 2015
Quota 2016 Harvest take 2016
% quota utilised 2016
% population harvested 2016
Central 6,298,150 1,259,650 240,857 19.1% 3.8%
Eastern 171,500 17,150 2,360 13.8% 1.4%
Western 591,550 59,150 8,561 14.5% 1.4%
Total 7,061,200 1,335,950 251,778 18.8% 3.6%
Note: population estimates are based on aerial surveys conducted in 2015, which were used to set the 2016 quota.

2018 Quota Submission for Commercially Harvested Macropods in Queensland
21
Table 6 – Harvest of eastern grey kangaroos in 2016
Note: population estimates are based on aerial surveys conducted in 2015, which were used to set the 2016 quota.
Table 7 – Harvest of common wallaroos in 2016
Zone Population estimate 2015
Quota 2016 Harvest take 2016
% quota utilised 2016
% population harvested 2016
Central 3,130,200 469,550 110,699 23.6% 3.5%
Eastern 559,400 55,950 5,120 9.2% 0.9%
Western 4,500 0 - - -
Total 3,694,100 525,500
115,819 22.0% 3.1%
Note: population estimates are based on aerial surveys conducted in 2015, which were used to set the 2016 quota.
Sex ratio by species and zone
Commercial harvest is typically biased towards males (figure 20) as they are usually larger and heavier than females. In 2016, the total harvest for each species comprised between 95.7% and 99.9% males. Data gathered throughout 2016 indicates 3.4% of the overall harvest was female (figure 19).
Zone Population estimate 2015
Quota 2016 Harvest take 2016
% quota utilised 2016
% population harvested 2016
Central 10,291,600 1,543,750 481,666 31.2% 4.7%
Eastern 5,115,100 511,500 46,881 9.2% 0.9%
Western 0 0 - - 0.0%
Total 15,406,700 2,055,250 528,547 25.7% 3.4%

2018 Quota Submission for Commercially Harvested Macropods in Queensland
22
Figure 19 - Proportion of 2016 harvest, male and female by species
Figure 20 – Overall sex ratio from 2006 to 2016 (percentages rounded to the nearest whole number).
Red kangaroo Grey kangaroo Common wallaroo Total
Male 241,051 509,076 115,818 865,945
Female 10,727 19,471 1 30,199
95.7%
96.3%
99.99%
96.6%
4.3% 3.7% 0.01%3.4%
0
100,000
200,000
300,000
400,000
500,000
600,000
700,000
800,000
900,000
1,000,000
Nu
mb
er
of
mac
rop
od
s
Species
27
.5% 2
6.1
%
23
.4% 2
1.5
%
21
.5%
21
.6%
23
.8%
27
.5% 2
7% 2
7.6
%
26
.5%
17
%
11
%
13
% 8%
7.3
% 4.1
%
3.3
%
4%
3.4
%
0
500,000
1,000,000
1,500,000
2,000,000
2,500,000
19
97
19
98
19
99
20
00
20
01
20
02
20
03
20
04
20
05
20
06
20
07
20
08
20
09
20
10
20
11
20
12
20
13
20
14
20
15
20
16
Nu
mb
er
of
har
vest
ed
mac
rop
od
s
Year
Male Female

2018 Quota Submission for Commercially Harvested Macropods in Queensland
23
Harvest update for 2017
The total number of tags issued up to 31 May 2017 was 683,400. A comparison of tag sales and harvest returns in relation to quotas in each zone is given in Table 8. The number of tags produced does not exceed the maximum quota for each species in each zone therefore it is not possible for the commercial harvest quotas to be over allocated. Given the low percentage of the quota that has currently been issued in tags, it is unlikely quotas will be met for any species in any zone. The 2017 harvest will be comprehensively reported on in the 2017 annual report, due for release in March 2018.
Table 8 – Tags issued and reported harvest for 2017 at 31 May.
Species Harvest zone 2017 sustainable use quota (rounded to the nearest 50)
Tags issued to 31 May 2017
Reported harvest to 31 May 2017
Red kangaroo Central 1,027,500 167,850 104,756
Eastern 14,500 2,600 483
Western 48,600 5,550 2,588
Eastern grey kangaroo
Central 1,216,800 272,400 179,049
Eastern 587,400 31,800 14,578
Western NA NA NA
Common wallaroo
Central 330,850 95,150 59,150
Eastern 55,250 5,200 1,120
Western 4,700 1,050 410
The extent of non-commercial harvest mortality
There are many forms of macropod mortality outside of the commercial harvest. It is possible for DES to collect and report data on three forms of non-commercial harvest mortality which can be considered when determining commercial quotas. These include Damage Mitigation Permits (DMPs), licensed recreational harvest and disease outbreak mortality.
Damage to primary production
DMPs are issued by DES where macropods are causing demonstrable damage to primary production. The issuing of these permits is limited to a maximum of 2% of the population estimate for each species in each zone. It is a condition of the permit that macropods are taken in accordance with the requirements of the National Code of Practice for the Humane Shooting of Kangaroos and Wallabies for Non-commercial Purposes. Uptake of DMPs is below the available quota (figure 21) and has decreased since 2015 (figure 22).

2018 Quota Submission for Commercially Harvested Macropods in Queensland
24
Figure 21 – Macropod quota and take for DMP in 2017.
Note: Figures are as recorded on 14 September 2017
Figure 22 – Macropods taken under a DMP 2006–2016.
Red kangaroo Eastern grey kangaroo Common wallaroo
Quota 115,373 279,859 56,103
Take 23,828 78,649 12,604
0
50,000
100,000
150,000
200,000
250,000
300,000
Nu
mb
er
of
mac
rop
od
s
Species
2008 2009 2010 2011 2012 2013 2014 2015 2016
Red kangaroo 16,610 13,182 4,802 3,464 8,427 20,910 46,492 103,393 60,730
E G kangaroo 30,237 22,234 15,380 11,269 18,663 78,678 169,631 248,719 167,066
Common wallaroo 19,895 14,423 11,900 5,930 9,195 24,533 51,112 67,246 21,420
0
50,000
100,000
150,000
200,000
250,000
300,000
Nu
mb
er
of
mac
rop
od
s
Year

2018 Quota Submission for Commercially Harvested Macropods in Queensland
25
Disease outbreak mortality and its significance
Following local media reports from Longreach in October 2016 Biosecurity Queensland sent a team to Noonbah station to investigate potential macropod deaths. After 2 days of extensive searching no evidence was found of any recent macropod mortalities. No incidence of significant disease mortalities have been recorded for macropod populations in Queensland during 2017. Whilst the winter of 2016 was wetter than average above average temperatures, extremely dry conditions, have continued across majority of the commercial harvest zones in 2017. Most of the local government areas within the harvest zones have been drought declared for over three years. These conditions reduce the available feed for all grazing species including macropods. The main areas to experience a significant reduction in macropod numbers is in the west of the state and for common wallaroos the central north.
The last disease related non-harvest mortality event recorded in Queensland macropod populations was in March 2010. Localised disease related mortalities for some commercially harvested species were recorded in the south-west of the state from the New South Wales border to just north of Quilpie in the Paroo and Bulloo river systems. Investigation and surveillance over the weeks following the reports established that the deaths were very limited and restricted to small areas only. This was documented in the 2011 Quota Submission for Queensland. The aerial surveys conducted in 2011 showed that in the year following the reported mortalities, macropod populations had increased indicating that the reported mortalities in 2010 did not have a significant effect on macropod populations in the area.
Licensed recreational wildlife harvesting licence (macropods)
The recreational macropod harvest in Queensland is centred on the same three species as the commercial harvest and runs for the same harvest period. The recreational harvesting of these macropods is regulated through:
Environment Protection and Biodiversity Conservation Act 1999
Nature Conservation Act 1992
o Nature Conservation (Administration) Regulation 2006 (current to September 2017)
o Nature Conservation (Administration) Regulation 2017 (current from September 2017)
o Nature Conservation (Wildlife Management) Regulation 2006
o Nature Conservation (Wildlife) Regulation 2006
o Nature Conservation (Macropod) Conservation Plan 2005 (current to September 2017)
o Nature Conservation (Macropod) Conservation Plan 2017 (current from September 2017)
o Nature Conservation (Macropod Harvest Period) Notice
Animal Care and Protection Act 2001.
A person holding a Commercial Wildlife Harvesting Licence (macropods) cannot hold a Recreational Wildlife Harvesting Licence (macropods). The harvest is restricted to a maximum of 50 tags per licence holder during a harvest period. The recreational harvest of macropods in Queensland is small with a total of 1,049 tags issued in 2017 to 23 Licence holders (Recreational Wildlife Harvesting Licence) (figures current at 31 August 2017).
2017 is the last year Recreational Wildlife Harvesting Licences (macropods) will be issued as they have been combined with the Commercial Wildlife Harvesting Licence (macropods) in the Nature Conservation (Macropod) Conservation Plan 2017. From 2018 onwards a Macropod Harvesting Licence will be required to harvest macropods for commercial or personal use.

2018 Quota Submission for Commercially Harvested Macropods in Queensland
26
Proportion of the population not subject to harvesting
Commercial harvesting of macropods can only occur in three harvest zones in Queensland. Cape York Peninsula and the south east corner of Queensland are designated Non-harvest zones (figure 23). Within the three commercial harvest zones macropods cannot be harvested within National Parks, States Forests, Regional Parks, Timber Reserves and Forest Reserves. Table 9 outlines the size of these land tenures within the commercial harvest zones (current in 2017).
Figures 23 to 25 show the general distribution of each of the commercially harvested macropods in relation to the population estimate regions. Eastern grey kangaroos are only harvested in the eastern and western harvest zones (figure 24). Red kangaroos are harvested in the western and central harvest zones and in the north of the eastern harvest zone (figure 23). Common wallaroos have the broadest distribution (figure 25) throughout Queensland and can be harvested in the central, eastern and western zones.
Table 9 – Area of land tenures within the Queensland commercial harvest zones where harvesting of macropods is not permitted.
Western harvest zone km2
Central harvest zone km2
Eastern harvest zone km2
Total km2
National Park 21,450 11,778 16,255 49,483
State Forest NA 10,788 16,254 27,042
Regional Park 1,048 167 1,365 2,580
Forest Reserve NA NA 225 225
Timber Reserve 79 451 121 651
Total km2 22,577 23,184 34,220 79,981

2018 Quota Submission for Commercially Harvested Macropods in Queensland
27
Figure 23 – Red kangaroo Macropus rufus distribution.

2018 Quota Submission for Commercially Harvested Macropods in Queensland
28
Figure 24 – Eastern grey kangaroo Macropus giganteus distribution.

2018 Quota Submission for Commercially Harvested Macropods in Queensland
29
Figure 25 – Common wallaroo (Macropus robustus) distribution.

2018 Quota Submission for Commercially Harvested Macropods in Queensland
30
Rainfall trends
Rainfall across western Queensland in 2016 was above average with the second wettest winter recorded since 1912 (figures 26 & 27). Extensive flooding occurred in some parts of the harvest zones. Temperatures were above average across the state throughout the year with April and May being the hottest ever recorded. The first half of 2017 has been warmer than average and dry for much of the harvest zones. Drought declarations continue across the majority of areas where macropod harvesting occurs (figure 28).
Much of the commercial harvest zones have now been drought declared for five consecutive years. Despite the ongoing drought conditions sufficient rainfall has occurred in some parts of the harvest zones over the last 12 months to produce feed for macropods. The population estimate for eastern grey kangaroos in the central north region was below the 1.5 SD trigger point in 2017. However the overall population estimates are similar to 2016 with no dramatic decline or increase observed in any of the harvest zones. Given the continued dry conditions the potential exists for macropod densities to decrease dramatically like they did in 2002 (figure 26) across the harvest zones.
Figure 26 Estimated macropod populations plotted with annual rainfall totals from Queensland from 1992 to 2016.
0
5
10
15
20
25
30
35
40
0
200
400
600
800
1000
1200
19
92
19
93
19
94
19
95
19
96
19
97
19
98
19
99
20
00
20
01
20
02
20
03
20
04
20
05
20
06
20
07
20
08
20
09
20
10
20
11
20
12
20
13
20
14
20
15
20
16
Es
tim
ate
d m
ac
rop
od
po
pu
lati
on
in
mil
lio
ns
Qld
an
nu
al
rain
fall
in
mm
Year

2018 Quota Submission for Commercially Harvested Macropods in Queensland
31
Figure 27 – Queensland rainfall totals (mm) from 1 September 2016 to 31 August 2017.

2018 Quota Submission for Commercially Harvested Macropods in Queensland
32
Figure 28 – Queensland drought declarations at 1 July 2017.
2018 Quota Submission for Commercially Harvested Macropods in Queensland
33
Summary and conclusion
The proposed quotas for the 2018 commercial macropod harvest in Queensland have been formulated by following an established methodology, which is largely based on constant proportions of population estimates and monitoring of long-term population trends. Population estimates are derived from representative aerial surveys across the harvest zones that are informed by the best available science. Other factors considered in the setting of the 2018 commercial harvest quotas include a review of previous harvests, extent of non-commercial harvest, proportion of the population not subject to harvesting, non-commercial harvest mortality and its significance, and rainfall trends.
Long-term trend data relating to population size since 1992, when Queensland began an annual program of helicopter surveys, demonstrates there has been no consistent increase or decline in the populations of red kangaroos, eastern grey kangaroos or common wallaroos in Queensland. However, populations do fluctuate over time. Population estimates for all species indicate that numbers over 1,000,000 occur in the harvest area. Thus, current harvest rates can be viewed as not having a long-term detrimental impact on populations.
Since regionalisation of the Queensland commercial macropod harvest was introduced in 2003, an estimate of macropod population size in the eastern and western zones has been made. The model used to estimate these populations is based on a small sample area and the reduced sampling effort is reflected in a conservative quota. This model was updated in 2012 to incorporate almost a decade of survey data and to generate trigger points for the commercial quota allocation. The population estimates in the eastern and western zones are a function of both the new model and the survey data for 2017.
Population estimates have decreased marginally for eastern grey kangaroos in the eastern zone but increased overall in the central zone in 2017. However in the central zone north the eastern grey population estimate is below a predetermined trigger point and the quota for this region has been halved for 2018. The red kangaroo population estimate for the central and eastern zones increased slightly since the 2016 surveys. Common wallaroo population estimates decreased in the central zone but increased significantly in the eastern zone. The western zone was not surveyed in 2017. Overall combined totals for all three species remained similar to 2016 across the state.
For the 2016 commercial harvest no quotas were exceeded, with the maximum percentage of quota utilised, being 31.2% for eastern kangaroos in the central zone. Sex ratios from harvest data continue to be biased towards males with the overall percentage of females harvested below 4%. Thus, the last completed harvest period provides no indication of adverse pressure on populations that would influence proposed quotas.
For the 2017 harvest period up to 31 May, 5.3% of the available quota for red kangaroos in the western zone had been harvested with 3.3% of the quota harvested in the eastern, and 10.2% in the central zones respectively. For eastern grey kangaroos, 14.7% of the quota was harvested in the central and 2.5% in the eastern zones respectively. For common wallaroos, the highest percentage of quota harvested was 17.9% in the central zone, with 2% harvested in the eastern zone and 8.7% in the western zone. Given these figures, it is unlikely that quotas will be met for each species in each zone in 2017.
Usage of DMPs in 2016 were below the 2% of the population estimate quota for all species for all zones. The current percentages for usage of DMP quotas for 2017 are below the new quota limit of 2%.
The three commercially harvested macropod species are protected from harvesting within the harvest area through national parks and state forests. These ‘refuges’ occur in patches throughout the distributional ranges of all three species. Macropods are further protected from harvest in Queensland within the non-harvest zones.
Overall numbers of commercially harvested macropods in Queensland harvest zones has remained relatively stable over the last 12 months. The majority of the harvest zones are drought declared and macropod numbers overall have decreased slightly. Should the widespread dry conditions continue throughout the state it is possible that observed macropod numbers will decrease again in 2018.

2018 Quota Submission for Commercially Harvested Macropods in Queensland
34
References Anon. 2012. Wildlife Trade Management Plan for Export—Commercially Harvested Macropods – 2013–2017. Queensland Parks and Wildlife Service; Brisbane.
Anon. 2002. Macropod Commercial Quota Submission for 2002. Queensland Parks and Wildlife Service; Brisbane.
Buckland, S.T., Anderson, D.R., Burnham, K.P., and J.L. Laake. 1993. Distance Sampling: Estimating Abundance of Biological Populations. Chapman and Hall; London.
Cairns, S.C., Lollback, G.W., Payne, N. 2008. Design of aerial surveys for population estimation and the management of macropods in the Northern Tablelands of New South Wales, Australia. Wildlife Research 35: 331–339.
Caughley, G., Shepard, N. and G. Short. 1987. Kangaroos, their ecology and management in the sheep rangelands of Australia. Cambridge University Press; Cambridge.
Clancy, T.F., Edwards, G.P., Pople, A.R. and G.W. Maag. 1994. The 1993 surveys of the commercially harvested species of macropod in Queensland. Internal Report to Conservation Strategy Branch, Queensland Parks and Wildlife Service; Brisbane.
Clancy, T.F., Pople, A.R., and L.A. Gibson. 1997. Comparison of helicopter line transects with walked line transects for estimating densities of kangaroos. Wildlife Research 24: 397–409.
Hacker,R., McLeod, S., Druhan, J., Tenhumberg, B. and U. Pradhan. 2002. Managing Kangaroos in the Murray-Darling Basin. Technical Report to the Murray-Darling Basin Commission; Canberra.
Pople, A.R., Cairns, S.C., Clancy, T.F., Grigg, G.C., Beard, L.A. and C.J. Southwell. 1998. Comparison of surveys of kangaroos in Queensland using helicopters and fixed-wing aircraft. The Rangeland Journal 20: 92–103.
Pople, A.R. 2006. Modelling the spatial and temporal dynamics of kangaroo populations for harvest management. Final report to the Department of Environment and Heritage; Canberra.

2018 Quota Submission for Commercially Harvested Macropods in Queensland
35
Appendixes
Appendix 1 Summary of the methodology for population monitoring and quota derivation for Queensland
Aerial surveys
Since 1992, the Queensland Government has conducted an annual program of aerial surveys by helicopter to directly monitor populations of the three large macropod species covered by the Wildlife Trade Management Plan for Export—Commercially Harvested Macropods 2013–2017. This method employs line transect methodology (Buckland et al.1993), which is significantly more robust to variations in sightability than standard fixed-wing methods and provides more accurate and precise population estimates (Clancy et al. 1997). A detailed description of the methodology employed in these surveys is provided in Clancy et al. (1997).
Surveys are conducted over 22 fixed monitor blocks, covering an area of 136,000km2 (Figure 1) or 25% of the original fixed-wing survey area sampled by the Australian National Parks and Wildlife Service (ANPWS) between 1984 and 1995. In each helicopter survey block, between two to eight east-west running 50–90km transect lines have been placed systematically 10km apart. Sampling intensity within each block is approximately 2.5%.
The placement of the original 10 of the 22 survey blocks used in this monitoring program was designed to provide appropriate coverage of representative densities of macropods over the core harvest area of 630,000km2 (Pople et al. 1998). In response to the introduction of regional management to Queensland in 2003, a further 12 survey blocks were added to provide broader coverage of the entire harvest area and to ensure all bioregions were sampled. Placement of these new survey blocks was optimised using fixed-wing survey data collected across the harvest zone during 2001. These surveys provided data to reassess the representativeness of the existing helicopter monitor blocks and to investigate alternative scenarios for future survey design. Analysis of these data in combination with harvest data has led to improved stratification of the survey area and hence increased the power to extrapolate data from survey monitor blocks to other regions in the harvest zone. These investigations were conducted in collaboration with the University of Queensland as part of the Australian Research Council (ARC) funded ROOSPIRT Linkage project (Pople et al. 2006).
No correction factors are applied to surveys of eastern grey and red kangaroos as comparisons of ground and aerial surveys conducted by Clancy et al. (1997) concluded that the helicopter line transect technique is both accurate and precise in determining population densities for both these species over a range of habitats, seasons and densities. Whilst the method is less accurate for common wallaroos there are still close correspondences between the results of helicopter surveys and those of ground counts. Estimates derived from ground surveys for common wallaroo density are approximately 1.9–2.0 times that recorded for helicopter surveys. Accordingly, since 1998, the Queensland Government has applied a conservative correction factor of 1.2 to the wallaroo density estimates derived from helicopter surveys. In 2011, this conservative correction factor has been increased to 1.85 in line with that used in New South Wales.
Frequency and coverage of aerial surveys
Due to the costs and logistics associated with conducting helicopter aerial surveys over 22 monitor blocks, not all monitor blocks are surveyed on an annual basis. To ensure adequate coverage of the harvest area in Queensland and to enable accurate tracking of population trends, all blocks are surveyed at least once every two years. Decisions on the frequency and coverage of the aerial survey program were based on analyses completed by the University of Queensland as part of the ARC funded ROOSPIRT Linkage project. This redesign of the monitoring program also sought to introduce a level of bioregional stratification to provide for improved potential to monitor populations at that scale as a possible prelude to the introduction of further harvest zones in Queensland.
The main feature of the current monitoring program is the establishment of pairs of closely correlated monitor blocks within each of the bioregions. The process of pairing monitor blocks was based on linear modelling that examined the relationships between macropod population densities, rainfall and harvest off-take for all monitoring blocks within each bioregion. The process of pairing blocks and the development and refinement of these linear models enables the frequency of monitoring of blocks to

2018 Quota Submission for Commercially Harvested Macropods in Queensland
36
be reduced without compromising the efficacy of the monitoring program. Using this approach monitoring blocks with bioregional pairs will be monitored on a rotating basis with each block being subject to surveys every two years.
Linear models utilising data on rainfall, harvest off-take and population rates of increase for the monitored block within a pair are then used to predict population changes in the unmonitored block of the pair. The models are refined annually as further data is collated and enhancements are made to the modelling process. In the situation where there is only a single monitor block within a bioregion or where a monitor block samples a unique macropod community, such as the Blackall block which contains moderate densities of all three species and particularly high densities of common wallaroo, these blocks are sampled annually. In order to calibrate the models and to provide a benchmark of the states’ macropod populations, a survey of the complete set of 22 monitor blocks will be completed every five years. The table below summarises the current stratification, pairing and sampling frequency for all 22 of the fixed aerial survey monitor blocks used in the Queensland monitoring program.
Due to the significantly lower macropod densities and associated lower harvest densities recorded historically from the eastern and western harvest zones, these two zones are not surveyed with the same intensity as the central harvest zone. Within both the eastern and western harvest zones, population density estimates are based on helicopter aerial surveys of three monitor blocks established in 2004 and monitored on a two yearly rotation. The results are used in association with data derived from fixed-wing aerial surveys conducted over parts of these zones during 2001 to adjust approximations of the population rates of increase calculated by comparing fixed-wing survey data from 1981–82, 1984 and 2001 with the most recent helicopter aerial survey data and past ground surveys completed in equivalent habitats.
Population estimation
Population estimates are calculated by extrapolating the mean monitor block densities to a larger harvest area of 1,097,410km2 for eastern grey kangaroos, 1,105,587km2 for red kangaroos and 1,104,222km2 for common wallaroos. To improve precision and remove bias in density estimates used in the calculation of population sizes and their standard errors, the data collected since 2003 have been stratified (Buckland et al. 1993) by observer and bioregion. Helicopter surveys are conducted with two observers, which results in twice the sampling intensity as one observer. To account for differences between observers, the data was post-sampling stratified by applying ‘goodness of fit’ models to the data from each observer using the computer program ‘Distance’ (Buckland et al. 1993). ‘Distance’ was then used to obtain an overall macropod density estimate for the survey block. The survey blocks were stratified by bioregion, and their weighted (by sampling intensity) density estimates used to calculate population sizes for the harvest area according to the methods and calculations outlined in Clancy et al. 1994 and 1997. For all species, stratification of the data by observer and bioregion has not significantly changed the population size estimate but has reduced the standard error associated with that estimate. However, with common wallaroos the standard errors associated with the population estimate remain high due to the high variability in densities across the state.
Quota derivation
Sustainable harvest quotas are calculated using a fixed proportion of the estimated macropod populations within the Queensland harvest area. The proportions used vary between species and are adjusted across the harvest zones in relation to the margins of error present in population estimates. The maximum proportions used for each species are 15% of populations for eastern grey kangaroos and common wallaroos and 20% of the population for red kangaroos. These maximum proportions are only applied to populations within the central harvest zone where survey effort is greatest and hence confidence limits for population estimates are within acceptable limits. In both the eastern and western harvest zones more conservative harvest proportions of 10% for all three species are applied. These sustainable-use harvest proportions are based on research and modelling undertaken by Caughley et al. (1987) and Hacker et al. (2002) and are currently accepted by the scientific community, the Queensland Department of Environment and Science and the Commonwealth Department of Sustainability, Environment, Water, Population and Communities for determining state quota limits.

2018 Quota Submission for Commercially Harvested Macropods in Queensland
37
Stratification, pairing and sampling frequency for fixed aerial survey monitor blocks in Queensland
Harvest zone Bioregion Monitor block Years 1 and 3
Years 2 and 4
Year 5
Central Brigalow Belt South
Injune
Taroom
Westmar
Roma
Mulga Lands Charleville
Cunnamulla
Bollon
Quilpie
Hungerford
Mitchell Grass Down
Blackall
Winton
Longreach
Julia Creek
Hughenden
Desert Uplands Barcaldine
Channel Country Windorah
Eastern Not stratified Inglewood
Emerald
Charters Towers
Western Not stratified Duchess
Cloncurry
Cloncurry

2014 Quota Submission for Commercially Harvested Macropods in Queensland
38
Appendix 2 Densities per km2 of the commercially harvested macropod species 2004–2017
Eastern grey kangaroo
Block 2004 2005 2006 2007 2008 2009 2010 2011 2012 2013 2014 2015 2016 2017
Barcaldine 20.61 13.17 22.77 17.65 23.15 29.50 12.871 23.92 24.09 44.10 24.96 19.31 14.71 13.65
Blackall 7.57 7.10 6.22 7.51 8.28 11.19 7.082 6.08 9.87 19.41 10.59 8.75 5.29 4.97
Bollon 25.66 25.31 30.53 31.74 30.143 47.2 32.01 24.95 27.58
Charleville 17.51 19.91 15.96 12.05 11.20 12.95 12.229 28.11 25.12 26.77 11.77 8.4 10.47 9.32
Charters Towers TTttTTTowersTowers
1.63 5.02 5.33 5.568 3.37 3.14 2.01 1.53
Cloncurry 0.01 0.16 0.02 0.214 0.012 0.07 0.00 0.06
Cunnamulla 13.20 9.97 11.44 11.642 32.82 41.04 35.87 18.73
Duchess 0.00 0.00 0.00 0.00 0.00 0.00 0.00 0.00
Emerald 3.95 3.41 4.05 5.035 2.75 7.01 5.29 7.88
Hughenden 0.77 0.58 1.16 0.97 0.795 0.53 1.17 1.41 1.01
Hungerford 1.16 1.10 0.77 0.94 0.651 2.20 4.00 3.79 3.36
Inglewood 8.72 18.62 9.75 12.326 29.10 32.73 49.88 42.02
Injune 13.53 18.85 18.62 6.82 16.599 17.75 31.32 22.52 40.62
Julia Creek 1.08 0.87 1.05 0.76 0.276 0.28 0.84 0.84 0.2
Longreach 9.05 8.48 6.63 6.61 6.129 18.07 20.17 5.25 3.85
Quilpie 1.86 0.97 1.42 2.795 1.57 3.61 4.65 2.66
Roma 25.05 24.98 25.46 25.12 23.43 19.298 27.16 40.56 32.23 31.74
Taroom 8.12 13.37 8.44 7.87 7.362 14.98 13.24 12.65 8.19
Westmar 25.53 23.17 21.18 22.083 37.25 62.54 77.9 66.07
Windorah 1.58 2.69 1.14 1.39 2.39 1.26 0.858 2.68 1.24 1.80 0.79 1.02 2.13 1.34
Winton 4.86 2.98 3.74 4.78 2.432 3.57 6.61 5.79 4.46

2018 Quota Submission for Commercially Harvested Macropods in Queensland
39
Red kangaroo
Block 2004 2005 2006 2007 2008 2009 2010 2011 2012 2013 2014 2015 2016 2017
Barcaldine 6.07 4.07 11.07 6.72 9.03 9.83 7.58 10.05 7.83 12.30 9.2 16.24 8.54 8.25
Blackall 3.99 3.29 4.55 3.78 6.45 7.24 4.70 12.37 14.17 17.47 10.35 11.58 9.69 8.52
Bollon 4.13 8.87 8.35 11.16 9.90 7.78 7.27 9.83 8.87
Charleville 4.55 5.48 7.36 9.57 7.58 8.47 6.46 14.69 5.53 7.03 4.97 5.06 6.32 3.75
Charters Towers
0.02 0.05 0.00 0.70 0.24 0.21 0.62 0.59
Cloncurry 2.14 4.18 6.17 3.01 3.34 5.91 4.06 3.45
Cunnamulla 3.54 4.59 9.02 10.65 18.27 28.76 27.29 16.54
Duchess 2.92 0.87 1.78 0.85 0.71 0.82 1.66 1.61
Emerald 0.00 0.00 0.00 0.02 0.05 0.00 0.00 0.00
Hughenden 1.97 1.59 1.59 1.29 0.92 2.22 2.67 1.52 2.62
Hungerford 1.04 2.57 3.90 4.41 2.60 7.01 8.75 9.7 9.83
Inglewood 0.00 0.00 0.00 0.50 0.00 0.00 0.00 0.00
Injune 1.02 0.14 0.05 0.72 0.00 0.86 0.04 0.00 0.11
Julia Creek 4.08 5.13 4.91 5.39 3.16 3.30 8.10 5.6 4.58
Longreach 9.53 11.86 11.33 14.71 12.24 14.43 19.26 4.79 15.90
Quilpie 2.19 1.39 5.13 2.06 4.70 9.80 9.51 12.27
Roma 2.19 1.62 2.54 2.66 2.37 2.26 3.47 5.02 2.83 2.96
Taroom 0.02 0.37 0.00 0.00 0.00 0.00 0.00 0.00 0.00
Westmar 0.97 0.59 0.55 1.14 1.49 1.14 2.28 4.69
Windorah 4.42 4.52 7.32 4.48 9.85 12.62 6.67 10.47 10.77 11.84 8.11 12.29 12.16 16.95
Winton 3.69 5.02 5.62 6.05 3.32 4.44 9.73 16.98 8.57
2018 Quota Submission for Commercially Harvested Macropods in Queensland
40
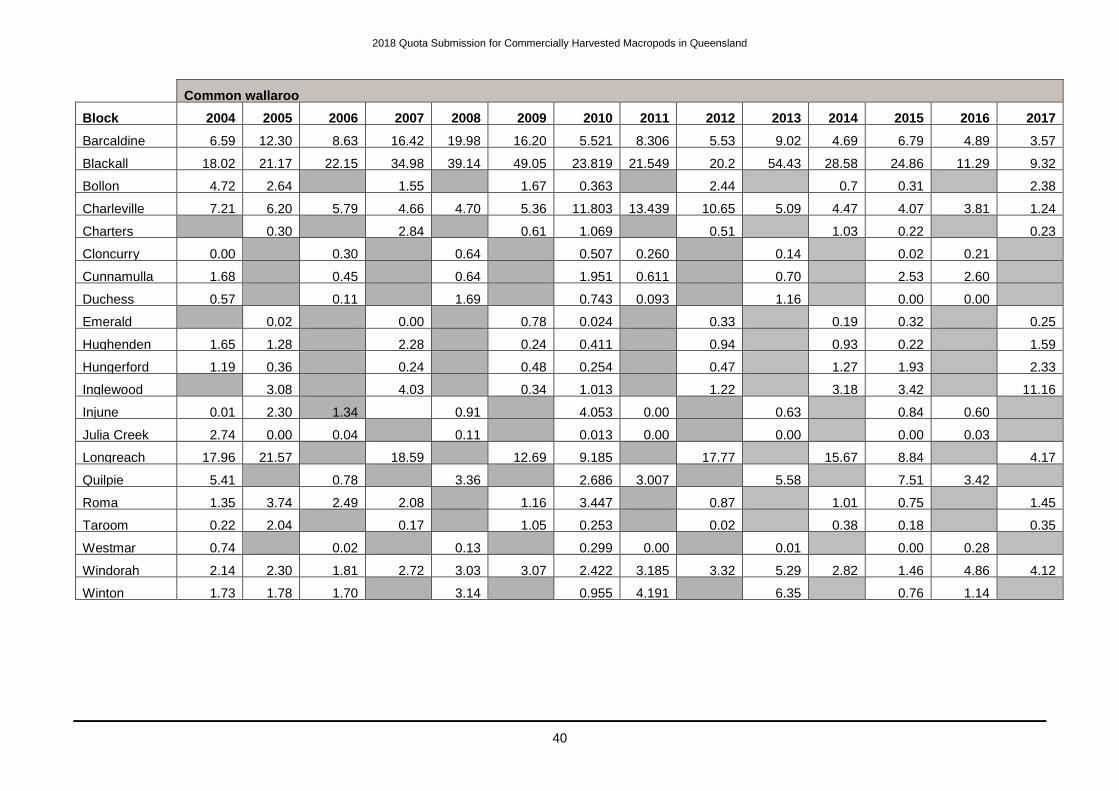
Common wallaroo
Block 2004 2005 2006 2007 2008 2009 2010 2011 2012 2013 2014 2015 2016 2017
Barcaldine 6.59 12.30 8.63 16.42 19.98 16.20 5.521 8.306 5.53 9.02 4.69 6.79 4.89 3.57
Blackall 18.02 21.17 22.15 34.98 39.14 49.05 23.819 21.549 20.2 54.43 28.58 24.86 11.29 9.32
Bollon 4.72 2.64 1.55 1.67 0.363 2.44 0.7 0.31 2.38
Charleville 7.21 6.20 5.79 4.66 4.70 5.36 11.803 13.439 10.65 5.09 4.47 4.07 3.81 1.24
Charters Towers
0.30 2.84 0.61 1.069 0.51 1.03 0.22 0.23
Cloncurry 0.00 0.30 0.64 0.507 0.260 0.14 0.02 0.21
Cunnamulla 1.68 0.45 0.64 1.951 0.611 0.70 2.53 2.60
Duchess 0.57 0.11 1.69 0.743 0.093 1.16 0.00 0.00
Emerald 0.02 0.00 0.78 0.024 0.33 0.19 0.32 0.25
Hughenden 1.65 1.28 2.28 0.24 0.411 0.94 0.93 0.22 1.59
Hungerford 1.19 0.36 0.24 0.48 0.254 0.47 1.27 1.93 2.33
Inglewood 3.08 4.03 0.34 1.013 1.22 3.18 3.42 11.16
Injune 0.01 2.30 1.34 0.91 4.053 0.00 0.63 0.84 0.60
Julia Creek 2.74 0.00 0.04 0.11 0.013 0.00 0.00 0.00 0.03
Longreach 17.96 21.57 18.59 12.69 9.185 17.77 15.67 8.84 4.17
Quilpie 5.41 0.78 3.36 2.686 3.007 5.58 7.51 3.42
Roma 1.35 3.74 2.49 2.08 1.16 3.447 0.87 1.01 0.75 1.45
Taroom 0.22 2.04 0.17 1.05 0.253 0.02 0.38 0.18 0.35
Westmar 0.74 0.02 0.13 0.299 0.00 0.01 0.00 0.28
Windorah 2.14 2.30 1.81 2.72 3.03 3.07 2.422 3.185 3.32 5.29 2.82 1.46 4.86 4.12
Winton 1.73 1.78 1.70 3.14 0.955 4.191 6.35 0.76 1.14
Recommended