2018PHYSICIANCENSUS
SUMMARY REPORT
October 2019

2473 physicians provided patient care in Vermont in 2018.
• They were 2339 MDs and 134 DOs.
• This includes 347 in telemedicine and 167 who provide patient care in Vermont less than 4 hours per week.
• This does not include another 46 working in Vermont on a locum tenens basis.
• This also does not include another 1112 who renewed their Vermont license in 2018 but were not providingpatient care in Vermont at that time.
2Vermont Department of Health 2018 Physician Census

2473 physicians provided patient care in Vermont in 2018.
• 39% (957) of the physicians were female, 61% male.
• 41% have worked in Vermont less than 10 years, and 32% have worked in Vermont 20 or more years.
• 33% attended medical school and/or completed residency training at the University of Vermont.
3Vermont Department of Health 2018 Physician Census

25% of physicians (615) worked mainly in primary care.
• 12% (291) in family practice• 6% (142) in primary care internal medicine• 3% (72) in obstetrics and gynecology• 4% (110) in pediatric primary care
4Vermont Department of Health 2018 Physician Census

There were 435.9 primary care physicianFull Time Equivalents (FTEs) in 2018.
• That is 69.6 FTEs per 100,000 population statewide- a significant drop since 2016
5Vermont Department of Health 2018 Physician Census

75% of physicians (1858) worked mainly in specialty care.
•4% (109) in anesthesiology•8% (195) in emergency medicine•5% (119) hospitalists•11% (265) in specialty internal medicine• 8% (191) in psychiatry• 11% (265) in radiology (including tele-radiology)• 7% (169) in surgery (59 general, 77 orthopedic)•22% (545) other specialties (including 27 in dermatology, 56 neurology, 50 ophthalmology, 95 pathology, 61 pediatric specialists, 23 urology)
6Vermont Department of Health 2018 Physician Census

Specialty care has grown rapidly over timewhile primary care has slowly declined.
0
200
400
600
800
1000
1998 2000 2002 2004 2006 2008 2010 2012 2014 2016 2018
Physician FTEs Over Time
Specialty Care
Primary Care
Excluding radiology, pathology and telemedicine
7Vermont Department of Health 2018 Physician Census

There were 19 fewer primary care physiciansin 2018, as compared with 2008.
There was a net decrease of 33 physicians in primary care internal medicine, and 3 in obstetrics and gynecology.There was a net increase of 12 in family medicine, and 5 in pediatric primary care.
8Vermont Department of Health 2018 Physician Census
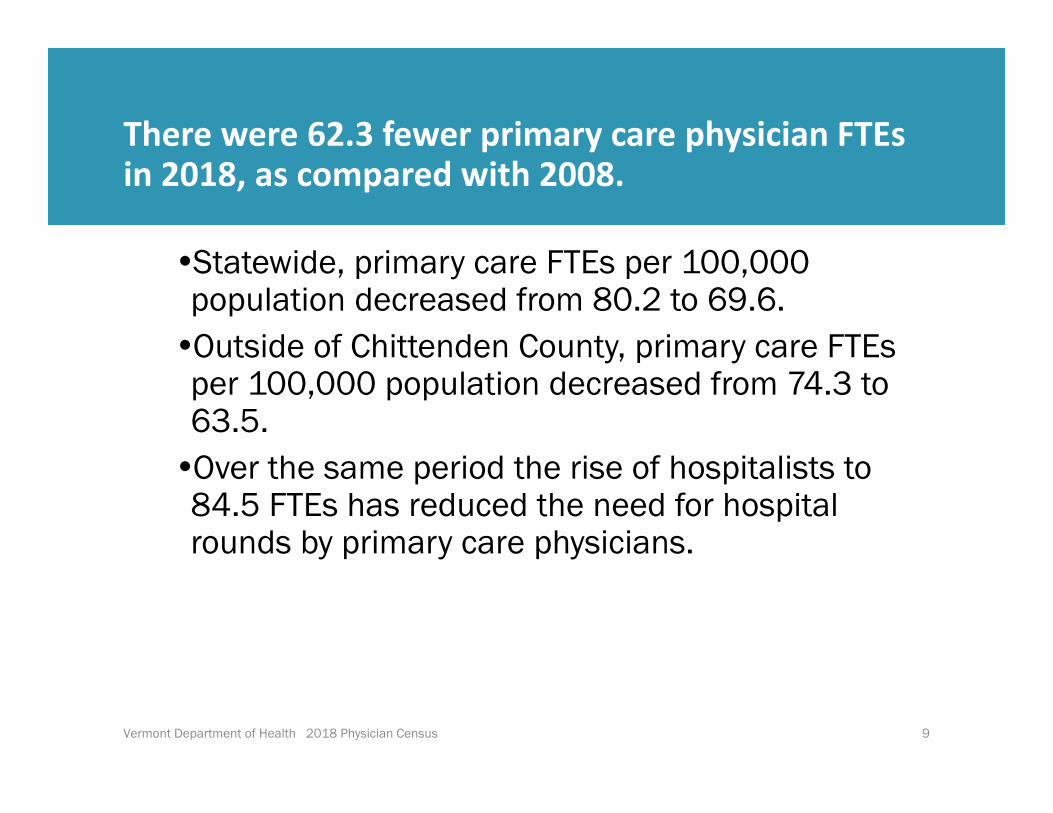
There were 62.3 fewer primary care physician FTEsin 2018, as compared with 2008.
Statewide, primary care FTEs per 100,000 population decreased from 80.2 to 69.6.Outside of Chittenden County, primary care FTEs per 100,000 population decreased from 74.3 to 63.5.Over the same period the rise of hospitalists to 84.5 FTEs has reduced the need for hospital rounds by primary care physicians.
9Vermont Department of Health 2018 Physician Census

21 fewer physicians provided 32.7 fewer primary care FTEs in 2018, as compared with 2016.
There was a net increase of 2.8 FTEs in OB/gyn, but a decrease of 11.9 FTEs in family medicine, 16.7 FTEs in primary care internal medicine, and 6.9 FTEs in pediatrics.
Statewide, primary care FTEs per 100,000 population decreased from 75.0 to 69.6.
Outside of Chittenden County, primary care FTEs per 100,000 population decreased, from 69.1 to 63.5.
10Vermont Department of Health 2018 Physician Census

There were 659 more specialty care physiciansin 2018 than in 2008.
Not counting radiology and pathology*, there were 481 more specialists, and 114.0 more specialty care FTEs, in 2018 vs. 2008.
FTE increases were especially large in hospitalists and emergency medicine
There were FTE decreases in specialty internal medicine, psychiatry, and orthopedic surgery.
11Vermont Department of Health 2018 Physician Census
* Many radiologists and pathologists practice via telemedicine, and FTEs cannot be determined

There were 312 more specialty care physiciansin 2018 than in 2016.
Not counting radiology and pathology*, there were 190 more specialists, and 15.5 more specialty care FTEs , in 2018 vs. 2016.
Although there was a net increase in total specialty care FTEs, there were decreases in some specialties, mostly in specialty internal medicine and orthopedic surgery.
12Vermont Department of Health 2018 Physician Census
* Many radiologists and pathologists practice via telemedicine, and FTEs cannot be determined

29% of all physicians are over 60 years old.
• In 7 of 14 counties, at least 41% of the primary care physicians were over age 60
• 26% of specialists were over age 60, including:• 47% of psychiatrists• 32% of ophthalmologists• 31% of general surgeons• 30% of pediatric specialists
13Vermont Department of Health 2018 Physician Census

18% of physicians are under 40 and 29% over 60.
< 35 35‐39 40‐44 45‐49 50‐54 55‐59 60‐64 65+Count 132 320 302 344 311 353 368 343Percent 5% 13% 12% 14% 13% 14% 15% 14%
0%
5%
10%
15%
20%
Percen
t of P
hysician
s
14Vermont Department of Health 2018 Physician Census

Physicians are generally older in 2018 vs. 2008.
< 35 35‐39 40‐44 45‐49 50‐54 55‐59 60‐64 65+2008 4% 12% 14% 17% 20% 14% 10% 9%2018 5% 13% 12% 14% 13% 14% 15% 14%
0%
5%
10%
15%
20%
Percen
t of P
hysician
s
15Vermont Department of Health 2018 Physician Census

54% of primary care physicians, including 72% of pediatricians and 71% of OB/GYNs, are female.
16Vermont Department of Health 2018 Physician Census
Family Practice Internal Medicine Ob/Gyn PediatricsMale 159 71 21 31Female 132 71 51 79
0
50
100
150
200
250
300
Prim
ary
Care
Phy
sici
ans
Male
Female

Most specialty care physicians are male.
17Vermont Department of Health 2018 Physician Census
Anesth-esiology
EmergencyMedicine Hospitalist Internal
Medicine Psychiatry Radiology Surgery(all) all other
Male 80 145 70 198 107 186 140 307Female 29 50 49 67 84 79 29 237
0
100
200
300
400
500
Num
ber o
f phy
sici
ans
Specialty Care by GenderMaleFemale

Physicians are highly concentratedin Chittenden County.
18Vermont Department of Health 2018 Physician Census
ADD BEN CAL CHI ESS FRA GI LAM ORA ORL RUT WAS WDM WDRSpecialty Care 26.9 54.7 25.6 436 0.3 36.9 0 20.3 19.6 25.3 86.3 84.1 56.9 59.2Primary Care 24.4 30.5 19.6 142.5 1.3 29.6 1.9 16 17.1 15.4 29.1 41.2 32 34.6
0
250
500
FTEs
Full Time Equivalents (FTEs) by County
Specialty Care
Primary Care

Several counties have a shortage of primary care physicians relative to their population.
19Vermont Department of Health 2018 Physician Census
ADD BEN CAL CHI ESS FRA GI LAM ORA ORL RUT WAS WDM WDRratio 66.1 85.5 64.7 86.6 21.6 59.9 26.9 63.4 59.1 57.2 49.6 70.8 74.9 62.7
0
20
40
60
80
100
FTEs
per
10
0,0
00
pop
ulat
ion
Primary Care FTE to Population Ratios by County

Several counties have a shortage of primary care physicians relative to their population.
20Vermont Department of Health 2018 Physician Census
3000:1 equals about 33 FTEs per 100,000 population

Primary Care FTE to Population Ratios: 2016 and 2018
ADD BEN CAL CHI ESS FRA GI LAM ORA ORL RUT WAS WDM WDR2016 66.3 86.3 69.1 92.1 29.2 54.7 25.6 70.9 57.3 57.0 60.9 77.8 90.3 76.32018 66.1 85.5 64.7 86.6 21.6 59.9 26.9 63.4 59.1 57.2 49.6 70.8 74.9 62.7
0
20
40
60
80
100
FTEs per 100,000
pop
ulation
20162018
21Vermont Department of Health 2018 Physician Census

33% of physicians (41% of primary care) attended medical school or residency training at UVM.
VT NH NewEngland
MidAtlantic South Central West Canada Other
ForeignMedical School 21% 3% 10% 21% 14% 14% 6% 3% 9%Residency 20% 6% 17% 20% 10% 12% 10% 2% 1%
0%
5%
10%
15%
20%
25%
Percen
t of P
hysician
s
Location of TrainingMedical School
Residency
22Vermont Department of Health 2018 Physician Census

52% of the physicians have been in practice20 years or more (in Vermont or elsewhere).
23Vermont Department of Health 2018 Physician Census
< 1 yr 1-2 yrs 3-4 yrs 5-9 yrs 10-14yrs
15-19yrs
20-24yrs
25-29yrs
30-34yrs 35+ yrs
Primary Care 2% 10% 8% 14% 12% 12% 12% 11% 10% 9%Specialty Care 6% 12% 10% 16% 16% 12% 10% 8% 5% 6%
0%
5%
10%
15%
20%
Perc
ent o
f phy
sici
ans
Years Worked in VermontPrimary Care
Specialty Care

Average patient care hours per week:32 overall, 23 for ages 65 and older.
< 30 hrs / wk 30 ‐ 39 hrs / wk 40+ hrs / wkCount 782 403 771Percent 40% 21% 39%
0%
10%
20%
30%
40%
50%
Percen
t of p
hysician
s
24Vermont Department of Health 2018 Physician Census

15% of primary care physicians are planning toretire or reduce hours in Vermont within 12 Months.
Family Practice InternalMedicine Ob/Gyn Pediatrics
Reduce Hours 10% 6% 10% 9%Retire / Leave 6% 9% 6% 5%
0%
5%
10%
15%
20%
Percen
t of p
hysician
s
Reduce Hours
Retire / Leave
25Vermont Department of Health 2018 Physician Census
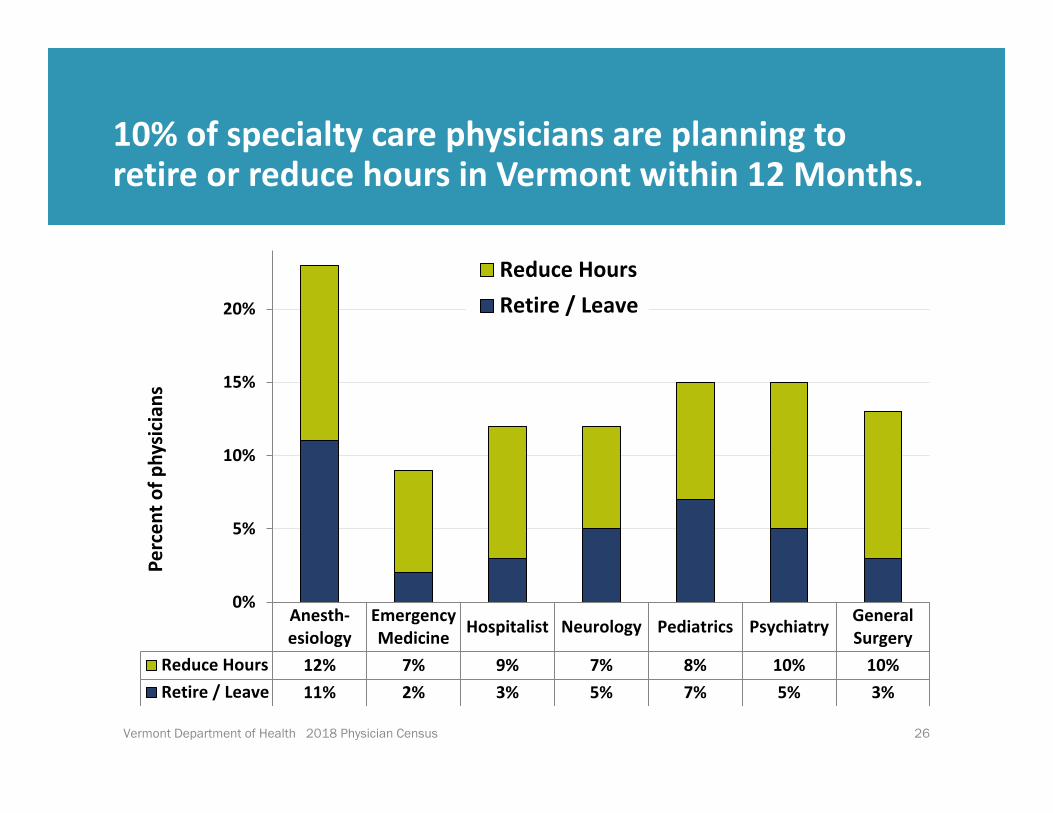
10% of specialty care physicians are planning toretire or reduce hours in Vermont within 12 Months.
Anesth‐esiology
EmergencyMedicine Hospitalist Neurology Pediatrics Psychiatry General
SurgeryReduce Hours 12% 7% 9% 7% 8% 10% 10%Retire / Leave 11% 2% 3% 5% 7% 5% 3%
0%
5%
10%
15%
20%
Percen
t of p
hysician
s
Reduce HoursRetire / Leave
26Vermont Department of Health 2018 Physician Census

Some primary care physicians, especially internists,are not accepting new patients.
27Vermont Department of Health 2018 Physician Census
Family Practice InternalMedicine Ob/Gyn Pediatrics
New Patients 80% 58% 100% 96%New Medicaid Pts 75% 53% 97% 96%New Medicare Pts 76% 56% 94%
0%
20%
40%
60%
80%
100%
% accep
ting ne
w patients
New Patients New Medicaid Pts New Medicare Pts

Some specialists, especially psychiatrists,are not accepting new patients.
28Vermont Department of Health 2018 Physician Census
Anesthesiology InternalMedicine Psychiatry Surgery (all)
New Patients 100% 99% 85% 98%New Medicaid Pts 98% 98% 77% 98%New Medicare Pts 98% 98% 76% 96%
0%
20%
40%
60%
80%
100%
% accep
ting ne
w patients
New Patients New Medicaid Pts New Medicare Pts

Primary care acceptance of new patients varies by county.
ADD BEN CAL CHI ESS FRA GI LAM ORA ORL RUT WAS WDM WDRNew Patients 89% 77% 79% 75% 63% 83% 100% 84% 88% 100% 99% 87% 84% 97%New Medicaid Pts 86% 77% 79% 67% 63% 83% 99% 78% 88% 100% 92% 87% 83% 90%New Medicare Pts 78% 70% 72% 63% 59% 66% 100% 83% 83% 94% 94% 86% 80% 96%
0%
20%
40%
60%
80%
100%
% accep
ting ne
w patients
New Patients New Medicaid Pts New Medicare Pts
29Vermont Department of Health 2018 Physician Census

Primary care acceptance of new patients varies by county.
30Vermont Department of Health 2018 Physician Census

Primary care physicians communicate with patients electronically more often than specialists do.
31Vermont Department of Health 2018 Physician Census
Use email Feel it is beneficialPrimary Care 73% 60%Specialty Care 42% 39%
0%
20%
40%
60%
80%
100%
% o
f phy
sici
ans
Electronic Communication with Patients
Primary Care
Specialty Care

Comparison of Selected Physician Data, 2000‐2018
32Vermont Department of Health 2018 Physician Census
* providing patient care in Vermont** FTEs not computed for pathology, radiology, and telemedicine
2000 2008 2010 2014 2016 2018
Total active * physicians 1480 1833 1877 1933 2182 2473
Percent female 26% 31% 33% 38% 38% 39%
Primary care physicians 585 634 628 636 636 615
% accepting new patients 80% 80% 83% 82% 84% 81%
accepting new Medicaid patients 73% 69% 72% 76% 78% 78%
accepting new Medicare patients 74% 69% 69% 72% 75% 74%
Primary care physician FTEs 472.2 498.2 492.1 476.9 468.6 435.9
PC Internal Medicine FTEs 128.5 126.5 120.7 114.3 110.0 93.3
PC FTEs per 100,000 Population 77.6 80.2 78.6 76.1 75.0 69.6
Specialist physicians 895 1199 1249 1297 1546 1858
Specialist physician FTEs ** 621.3 818.1 843.7 836.1 916.6 932.1

For more information, contact:
33Vermont Department of Health 2018 Physician Census
• Moshe BranerResearch and StatisticsDept. of Health108 Cherry St.Burlington VT 05401
• Phone: (802) 865-7703• Email: [email protected]• Web: www.healthvermont.gov
Recommended