2018 Long Range Transportation Plan Update: Technical Memorandums
March 2018
Prepared by

A Citizen’s Guide to Missouri’s Transportation Future: Long Range Transportation Plan Update i
TABLE OF CONTENTS Section 1: Missouri 2018 Long Range Transportation Plan ................................................................................ 1
Section 2: Goals, Objectives and Performances Measures ................................................................................ 3
2.1 History ......................................................................................................................................................... 4
2.1.1 Previous Long Range Plan Goal Development ................................................................................. 4
2.1.2 Missouri State Freight Plan Goal Development ............................................................................... 4
2.1.3 Environmental Responsibility ........................................................................................................... 5
2.2 Public Outreach ........................................................................................................................................... 6
2.3 Goals and Objectives ................................................................................................................................... 8
2.4 Performance Measurement ...................................................................................................................... 11
2.4.1 Tracker Performance Measures ..................................................................................................... 11
2.4.2 Linking the LRTP and Tracker’s Seven Tangible Results ................................................................. 12
2.4.3 Federal Performance Measures and Partner Coordination ........................................................... 14
2.5 System Performance Report ..................................................................................................................... 16
2.5.1 Safety Targets ................................................................................................................................. 16
2.5.2 Safety Performance Report ............................................................................................................ 17
Section 3: Transportation System ....................................................................................................................21
3.1 Roads and Bridges ..................................................................................................................................... 21
3.2 Transit ........................................................................................................................................................ 22
3.3 Aviation ..................................................................................................................................................... 23
3.4 Rail ............................................................................................................................................................. 23
3.5 Waterways ................................................................................................................................................. 24
3.6 Bicycle and Pedestrian .............................................................................................................................. 25
Section 4: Transportation Trends ....................................................................................................................26
4.1 Demographics ............................................................................................................................................ 27
4.1.1 Population Projections through 2040 ............................................................................................ 27
4.1.2 Population Trend One – An Aging Population ............................................................................... 28
4.1.3 Population Trend Two – Concentration of Population and County Trends ................................... 29
4.1.4 Population Trends by MoDOT Districts .......................................................................................... 30
4.2 Economics and Employment ..................................................................................................................... 31
4.2.1 Gross State Product Trend Is Steady .............................................................................................. 31
4.2.2 Fuel Prices Have Dropped and Remained Steady .......................................................................... 32
A Citizen’s Guide to Missouri’s Transportation Future: Long Range Transportation Plan Update ii
4.2.3 Employment ................................................................................................................................... 33
4.2.4 Personal Income and Poverty Statistics ......................................................................................... 35
4.3 Freight and the Economy .......................................................................................................................... 36
4.3.1 Freight Projections ......................................................................................................................... 36
4.3.2 Freight Movement by Mode .......................................................................................................... 36
4.3.2.1 Truck Freight ...................................................................................................................... 36
4.3.2.2 Freight Rail ......................................................................................................................... 37
4.3.2.3 Ports and Waterways ........................................................................................................ 37
4.3.2.4 Air Freight .......................................................................................................................... 38
4.4 Travel Trends ............................................................................................................................................. 38
4.4.1 Roadway ......................................................................................................................................... 38
4.4.1.1 Recent State VMT Trends .................................................................................................. 38
4.4.1.2 Fuel Efficiency and Revenue Impact .................................................................................. 39
4.4.1.3 Vehicle Ownership............................................................................................................. 40
4.4.1.4 Licensed Drivers ................................................................................................................ 42
4.4.1.5 Commuting Patterns ......................................................................................................... 43
4.4.2 Public Transit .................................................................................................................................. 43
4.4.3 Passenger Rail ................................................................................................................................ 44
4.4.4 Air Travel ........................................................................................................................................ 44
4.5 Transportation Implications ...................................................................................................................... 44
Section 5: Autonomous and Connected Vehicle Technology ............................................................................45
5.1 Uncertainty in Adoption and Resulting Influences .................................................................................... 45
5.2 Current Industry Activities ......................................................................................................................... 47
5.2.1 Manufacturers ................................................................................................................................ 48
5.2.1.1 Automated Shuttles ........................................................................................................... 48
5.2.2 Non‐traditional Entrants ................................................................................................................ 48
5.3 Federal Efforts ........................................................................................................................................... 49
5.3.1 Legislation ...................................................................................................................................... 49
5.3.2 USDOT ITS JPO Research ................................................................................................................ 50
5.3.2.1 Connected Vehicle Pilot Program ...................................................................................... 50
5.3.2.2 Automated Vehicle Proving Grounds ................................................................................ 51
5.4 State Activities ........................................................................................................................................... 52
5.4.1 Smart Belt Coalition ....................................................................................................................... 53

A Citizen’s Guide to Missouri’s Transportation Future: Long Range Transportation Plan Update iii
5.4.2 AASHTO .......................................................................................................................................... 53
5.5 Emerging Research and Other Issues ........................................................................................................ 54
5.5.1 Preparation and Planning Efforts ................................................................................................... 55
5.5.2 Market Adoption/Penetration Studies and Research .................................................................... 56
5.5.3 Other Issues and Concerns ............................................................................................................. 57
5.6 State of the Practice Takeaways ............................................................................................................... 58
5.7 Missouri’s Preparedness for AV/CV Market Adoption .............................................................................. 59
5.8 Informational Interviews ........................................................................................................................... 59
5.9 Interview Summaries ................................................................................................................................. 60
5.9.1 Highlighted Findings ....................................................................................................................... 60
5.9.2 Current Missouri Activities ............................................................................................................. 61
5.9.2.1 Road to Tomorrow ............................................................................................................ 61
5.9.2.2 SPaT Challenge .................................................................................................................. 62
5.9.2.3 Automated Crash Attenuator Truck Pilot .......................................................................... 62
5.9.2.4 Mid‐America Regional Council / KINETIC‐KC ..................................................................... 62
5.9.2.5 East‐West Gateway Council of Governments ................................................................... 62
5.9.2.6 City of Springfield .............................................................................................................. 63
5.9.3 Additional Discussions and Observations ...................................................................................... 63
5.10 Market Penetration and Acceptance Thresholds .................................................................................... 63
5.10.1 Thresholds .................................................................................................................................... 68
5.10.1.1 Low Market Penetration (<15% of new vehicles sold or retrofitted; under 10% of fleet)
....................................................................................................................................................... 68
5.10.1.2 Medium Market Penetration (More than 15%; less than 50% of new vehicles sold or
retrofitted; up to 25% of fleet) ...................................................................................................... 69
5.10.1.3 High Market Penetration (Greater than 50% of new vehicles sold or retrofitted; more
than 25% of total vehicle fleet) ..................................................................................................... 70
5.11 AV/CV Workshop ..................................................................................................................................... 70
5.11.1 MoDOT Leadership Encourages Dialogue to Promote Efficient Implementation of AV/CV
Technology .............................................................................................................................................. 70
5.11.2 Workshop Participants Suggest Path for Future Activities .......................................................... 71
5.12 Predictive Analytics ................................................................................................................................. 72
Section 6: Transportation Funding and Needs .................................................................................................73
6.1 Funded Needs ............................................................................................................................................ 73
6.1.1 State Roads and Bridges Funded Needs ........................................................................................ 74
A Citizen’s Guide to Missouri’s Transportation Future: Long Range Transportation Plan Update iv
6.1.2 Multimodal Funded Needs ............................................................................................................. 75
6.2 Unfunded Needs ........................................................................................................................................ 77
6.2.1 Improve Bridge Conditions ............................................................................................................. 78
6.2.2 Improve Road Conditions ............................................................................................................... 79
6.2.3 MoDOT Maintenance and Operations ........................................................................................... 79
6.2.4 Invest in Projects that Increase Economic Growth and Improve Safety ........................................ 80
6.2.5 Major Interstate Reconstruction .................................................................................................... 81
6.2.6 Improve Multimodal Transportation Options ................................................................................ 82
6.2.7 Long‐Term Uncertainty .................................................................................................................. 83
Appendix A: Key Resources .............................................................................................................................. 1
Reports .............................................................................................................................................................. 1
U.S. Department of Energy ....................................................................................................................... 1
Navigant .................................................................................................................................................... 1
Eno Foundation ......................................................................................................................................... 1
RAND ......................................................................................................................................................... 1
Morgan Stanley ......................................................................................................................................... 2
Newsletters ....................................................................................................................................................... 2
Websites ............................................................................................................................................................ 2
Appendix B: Definitions.................................................................................................................................... 1
Automated ........................................................................................................................................................ 1
Autonomous ...................................................................................................................................................... 1
Connected ......................................................................................................................................................... 1
Self‐Driving ........................................................................................................................................................ 1
Driverless ........................................................................................................................................................... 1
Appendix C: Original Equipment Manufacturers’ Detailed Announcements ..................................................... 1
General Motors ................................................................................................................................................. 1
Ford ................................................................................................................................................................... 1
Honda ................................................................................................................................................................ 1
Toyota Motor Corporation ................................................................................................................................ 1
Hyundai ............................................................................................................................................................. 2
Tesla Motors ...................................................................................................................................................... 2
Renault‐Nissan .................................................................................................................................................. 2
Fiat Chrysler/BMW ............................................................................................................................................ 3
A Citizen’s Guide to Missouri’s Transportation Future: Long Range Transportation Plan Update v
Volvo .................................................................................................................................................................. 3
Others ................................................................................................................................................................ 3
Partnerships ...................................................................................................................................................... 3
Appendix D: Federal Activities ......................................................................................................................... 1
Appendix E: STATE ACTIVITIES .......................................................................................................................... 1
Arizona............................................................................................................................................................... 1
California ........................................................................................................................................................... 1
Colorado ............................................................................................................................................................ 1
Connecticut ....................................................................................................................................................... 2
Florida ................................................................................................................................................................ 2
Georgia .............................................................................................................................................................. 3
Kansas ................................................................................................................................................................ 3
Michigan ............................................................................................................................................................ 3
Minnesota ......................................................................................................................................................... 3
Nevada ............................................................................................................................................................... 4
North Carolina ................................................................................................................................................... 4
Ohio ................................................................................................................................................................... 4
Oregon ............................................................................................................................................................... 5
Pennsylvania ...................................................................................................................................................... 5
Tennessee .......................................................................................................................................................... 6
Texas .................................................................................................................................................................. 6
Washington, D.C. ............................................................................................................................................... 6
Wisconsin .......................................................................................................................................................... 6
Appendix F: INTERvIEW QUEsTIONS ................................................................................................................. 1
Appendix G: Av/CV Workshop participants ...................................................................................................... 1
Appendix H: Workshop Poll Questions and Results .......................................................................................... 1
Appendix I: Breakout group discussion summary ............................................................................................. 1
Group 1 .............................................................................................................................................................. 1
Group 2 .............................................................................................................................................................. 2
Group 3 .............................................................................................................................................................. 3
Group 4 .............................................................................................................................................................. 4
Group 5 .............................................................................................................................................................. 5
Group 6 .............................................................................................................................................................. 6

A Citizen’s Guide to Missouri’s Transportation Future: Long Range Transportation Plan Update vi
Group 7 .............................................................................................................................................................. 8
Group 8 .............................................................................................................................................................. 9
References ....................................................................................................................................................... 1
Trends ................................................................................................................................................................ 1
Autonomous and Connected Vehicles .............................................................................................................. 3

A Citizen’s Guide to Missouri’s Transportation Future: Long Range Transportation Plan Update 1
SECTION 1: MISSOURI 2018 LONG RANGE TRANSPORTATION PLAN The Missouri 2018 Long Range Transportation Plan (LRTP), A Citizen’s Guide to Missouri’s Transportation Future,
is a performance‐based plan. It provides strategic direction to align transportation investment decisions with
performance outcomes, to address transportation needs and demands amid steady population growth and
declining revenues due to inflation and rising fuel economy.
The 2018 LRTP addresses the statewide planning requirements under the federal surface transportation acts –
Moving Ahead for Progress in the 21st Century Act (MAP‐21) and the Fixing America’s Surface Transportation
(FAST) Act. MAP‐21 created a streamlined, performance‐based and multimodal program to address the many
challenges facing the U.S. transportation system. These challenges include improving safety, maintaining
infrastructure in a state of good repair, reducing traffic congestion, improving efficiency of the system and
freight movement, protecting the environment and reducing delays in project delivery. The FAST Act maintains a
focus on safety, largely keeps the existing highway‐related program structure, continues efforts to streamline
project delivery and creates a new dedicated source of federal dollars for freight projects.
The 2018 LRTP was developed through a collaborative process with MPOs and regional planning commissions
(RPCs), as well as city, county, transit, stakeholders and private company officials. Based on this input, the 2018
LRTP guides planning and programming decisions for the development, management and operation of
Missouri’s transportation system over the next 25 years.
During the 2018 LRTP update process, the following five Technical Memorandums were developed:
► Goals, Objectives and Performance Measures – The 2018 LRTP establishes goals and objectives that create
a strategic direction to address Missouri’s transportation needs and demands. For more than a decade,
MoDOT has been on the forefront of transportation performance management through its use of Tracker,
MoDOT’s performance management tool. This technical memorandum provides a review of the federal and
state goals, objectives and performance measures included in the 2018 LRTP.
► Transportation System – Missouri’s transportation system includes a vast network of highways, bridges,
buses, airports, railroads, waterways, biking and pedestrian paths. It is counted on to safely and reliably
connect people with family, jobs and services; businesses with suppliers and customers, students with
schools and visitors with destinations. This technical memorandum describes the components that make up
the transportation system Missourians enjoy today.
► Transportation Trends – The face of Missouri – and transportation – is changing. One in five Missourians is
over the age of 65; three out of every four citizens reside in the 25 largest counties by population, and 27
counties have a population under 10,000. This technical memorandum examines transportation implications
to population and employment projections and trends; freight movement, projections and trends; and
roadway, transit, passenger rail and aviation travel trends.
► Autonomous and Connected Vehicle Technology – The future of transportation will bring improvements to
technology in both passenger movement and freight movement including autonomous or connected
vehicles. The introduction of these types of vehicles on the highway system could dramatically change the
needs of the capital spending to accommodate these changes. This memo documents efforts that are
currently in place in Missouri, including perceived concerns with respect to these technologies. A discussion

A Citizen’s Guide to Missouri’s Transportation Future: Long Range Transportation Plan Update 2
was included on the possible effects of autonomous and connected vehicle (AV/CV) technology on MoDOT
at certain market penetration levels, divided amongst functional areas at high, medium and low market
penetrations.
► Transportation Funding and Needs – The long‐term future of transportation funding and needs is uncertain.
Changes in technology, freight movements and development patterns will have significant impacts over the
next 25 years. Given these uncertainties, this technical memorandum documents MoDOT’s 25‐year modal
needs and a financial forecast using trend information and anticipated revenues and expenditures.

A Citizen’s Guide to Missouri’s Transportation Future: Long Range Transportation Plan Update 3
SECTION 2: GOALS, OBJECTIVES AND PERFORMANCES MEASURES Missouri’s 2018 LRTP establishes goals and objectives that create the LRTP’s strategic direction. A goal is a broad statement that defines a desired end state when the plan is implemented. An objective is a specific, measurable statement that supports the achievement of a goal. Goals and objectives provide a foundation for the development of performance measures and establish the strategic direction that will drive investment decisions. The 2018 LRTP builds upon the goals and objectives established in the 2014 LRTP.
For more than a decade, MoDOT has been on the forefront of transportation performance management through its use of Tracker, MoDOT’s performance management tool. The federal transportation bills – MAP‐21 and the FAST Act – include requirements for states, MPOs and public transit agencies related to transportation performance management and performance‐based planning and programming. In addition, the Federal Highway Administration (FHWA) and the Federal Transit Administration (FTA) finalized regulations informing state DOTs, MPOs and public transit agencies on the MAP‐21 requirements.
MAP‐21 established a performance and outcome‐based program. The objective is for transportation agencies to invest resources in projects that collectively will make progress toward achieving the following seven national goals:
► Safety – to achieve a significant reduction in traffic fatalities and serious injuries on all public roads
► Infrastructure Condition – to maintain the highway infrastructure asset system in a state of good repair
► Congestion Reduction – to achieve a significant reduction in congestion on the National Highway System
► System Reliability – to improve the efficiency of the surface transportation system
► Freight Movement and Economic Vitality – to improve the national freight network, strengthen the ability
of rural communities to access national and international trade markets and support regional economic
development
► Environmental Sustainability – to enhance the performance of the transportation system while protecting
and enhancing the natural environment
► Reduced Project Delivery Delays – to reduce project costs, promote jobs and the economy and expedite the
movement of people and goods by accelerating project completion through eliminating delays in the project
development and delivery process, including reducing regulatory burdens and improving agencies’ work
practices
This technical section provides a review of the federal and state goals, objectives and performance measures
included in the 2018 LRTP.
A Citizen’s Guide to Missouri’s Transportation Future: Long Range Transportation Plan Update 4
2.1 History 2.1.1 Previous Long Range Plan Goal Development
The 2014 LRTP goals were developed through conversations with thousands of Missourians. During the development of the 2014 LRTP, citizens were challenged to think about the components of Missouri’s complex transportation system and consider the right set of questions to determine how best to proceed as a state. Some of the questions considered included:
► How do we keep Missourians safe?
► How do we balance the wants and needs of everyone across of the state?
► How do we support agribusiness and other industries that help drive our state’s growth?
► How do we stay ahead of the curve and invest in projects that will help our state 20 years from now, not just
today?
► How do we stay competitive on a global scale?
► How do we meet the needs of a diverse population?
► How do we maintain our system, build new infrastructure and invest in all modes of transportation?
► How do we attract and retain businesses and our most important asset – our people?
► How do we embrace the needs of private companies, local governments, interest groups and citizens?
► And, how do we do all of this with a shrinking funding source?
Based on this citizen‐driven process, the following four transportation goals were finalized as part of the 2014 LRTP.
► Take care of the transportation system and services we enjoy today
► Keep all travelers safe, no matter the mode of transportation
► Invest in projects that spur economic growth and create jobs
► Give Missourians better transportation choices
2.1.2 Missouri State Freight Plan Goal Development
MoDOT recognizes the importance of freight transportation in contributing to the economic vitality and competitiveness of the State of Missouri. Making smart investments in the freight transportation system provides better options for Missouri businesses to get products to both domestic and global markets. An improved freight transportation system will also lower transportation costs and create jobs.
With the help of hundreds of key stakeholders, MoDOT developed a State Freight Plan in 2014 to make sure freight continues to move smoothly. The plan provides a better understanding of Missouri’s existing freight transportation system, establishes goals and strategies for updating the system over the next 10+ years, guides future investments in freight transportation and prioritizes freight projects that would provide the most benefits. MoDOT collaborated with freight partners and identified these four freight goals in the 2014 State Freight Plan, all of which were incorporated in the 2018 LRTP:
A Citizen’s Guide to Missouri’s Transportation Future: Long Range Transportation Plan Update 5
► Maintenance – Maintain the freight system in good condition by keeping highways and bridges in good
condition and support the maintenance of railways, waterways, airports and multimodal connections.
► Safety – Improve safety on the freight system by decreasing the number and severity of crashes involving
commercial vehicles and improve safety at railroad crossings.
► Economy – Support economic growth and competitiveness in the State through strategic improvements to
the freight system.
► Connectivity and Mobility – Improve the connectivity and mobility of the freight system by reducing
congestion and increasing reliability on the roadways; support improved efficiency of rails, waterways and
airports; and improve connections between freight modes.
2.1.3 Environmental Responsibility
Transportation has an impact on the environment. From the consideration of transportation needs through the maintenance and operation of the existing system and services, MoDOT strives to avoid, minimize or mitigate impacts and be a good steward of the environment. MoDOT strives not just to meet the requirements of environmental laws, but to do the right thing by keeping the environment clean and minimizing impacts to our precious resources. MoDOT has taken action to link environmental and transportation planning. MoDOT partners with a variety of state and federal environmental resource agencies including the Missouri Department of Natural Resources, Missouri Department of Conservation, Missouri State Historic Preservation Office, Missouri State Emergency Management Agency, Natural Resources Conservation Service, U.S. Fish and Wildlife Service, U.S. Environmental Protection Agency and U.S. Army Corps of Engineers, to maintain, or assist one of these agencies in maintaining an inventory of environmental and historic resources in the state. This partnership helps transportation decision makers avoid or minimize impacts to resources early in project planning. Further, MoDOT meets as needed with these agencies to seek their input on transportation needs as they are being evaluated and scoped and to partner in the environmental studies and permitting for planned projects. MoDOT also uses environmentally friendly construction methods to deliver projects that limit the impact of our transportation system on the natural and human environment. MoDOT has a Storm Water Pollution Prevention Plan (SWPPP) to assist with the design, implementation and maintenance of erosion and sediment control measures on construction projects as well as maintenance operations. It is MoDOT’s responsibility to implement control measures to minimize the release of sediment and pollutants into nearby waterways. Discharges from MoDOT operations are regulated under a general land disturbance permit from the Missouri Department of Natural Resources. MoDOT is committed to protecting the environment through implementation of best management practices to maintain water quality. Similarly, MoDOT takes actions to reduce its carbon footprint by implementing changes that increase the miles‐per‐gallon rating of MoDOT fleet vehicles and to reduce energy usage at our facilities. Moving forward, MoDOT will continue to research and implement new techniques, products and technologies that will help them get even better at keeping the environment clean and protect cultural resources. MoDOT will follow its TS4 (Transportation Separate Stormwater Sewer System) permit requirements and will continue to collaborate with municipalities in meeting their MS4 (Municipal Separate Storm Sewer Systems) requirements. MoDOT will build upon and strengthen its partnerships with natural resource agencies to make even better transportation decisions that limit the impact to the environment. Further, MoDOT is committed to expanding the use of recycled materials in its construction projects and supporting non‐motorized travel options. Finally, MoDOT will seek out new strategies to reduce our energy consumption and carbon footprint.
A Citizen’s Guide to Missouri’s Transportation Future: Long Range Transportation Plan Update 6
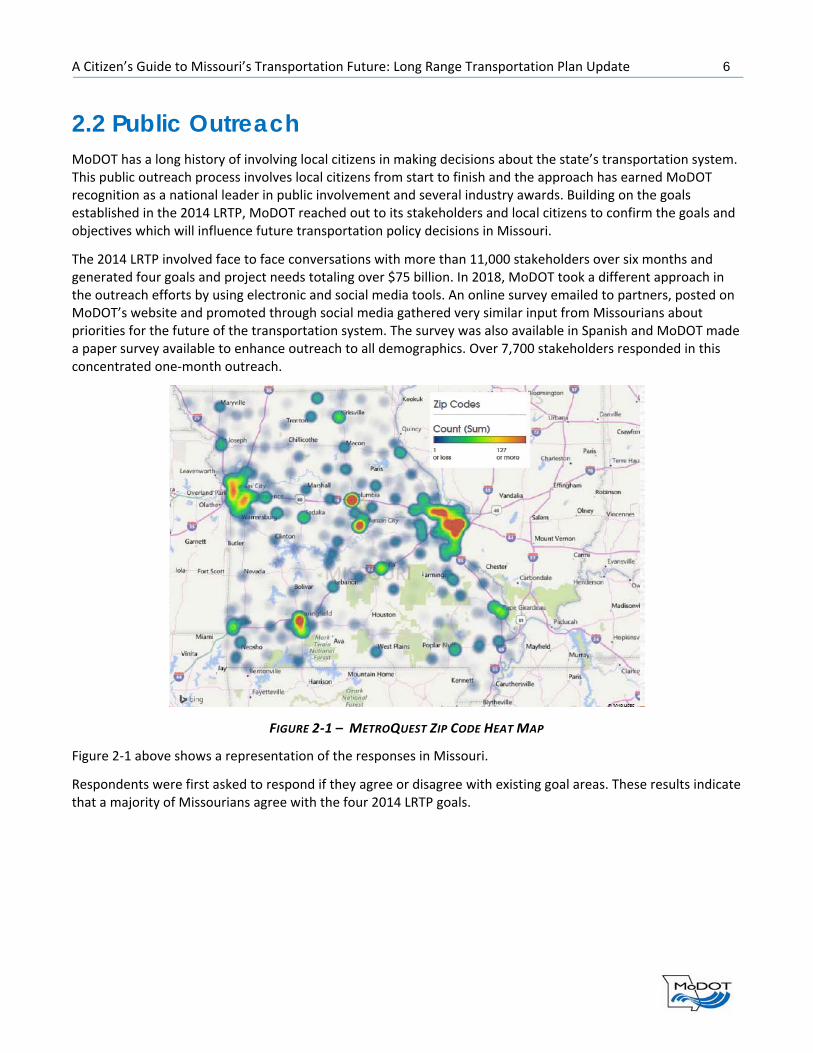
2.2 Public Outreach MoDOT has a long history of involving local citizens in making decisions about the state’s transportation system. This public outreach process involves local citizens from start to finish and the approach has earned MoDOT recognition as a national leader in public involvement and several industry awards. Building on the goals established in the 2014 LRTP, MoDOT reached out to its stakeholders and local citizens to confirm the goals and objectives which will influence future transportation policy decisions in Missouri.
The 2014 LRTP involved face to face conversations with more than 11,000 stakeholders over six months and generated four goals and project needs totaling over $75 billion. In 2018, MoDOT took a different approach in the outreach efforts by using electronic and social media tools. An online survey emailed to partners, posted on MoDOT’s website and promoted through social media gathered very similar input from Missourians about priorities for the future of the transportation system. The survey was also available in Spanish and MoDOT made a paper survey available to enhance outreach to all demographics. Over 7,700 stakeholders responded in this concentrated one‐month outreach.
Figure 2‐1 above shows a representation of the responses in Missouri.
Respondents were first asked to respond if they agree or disagree with existing goal areas. These results indicate that a majority of Missourians agree with the four 2014 LRTP goals.
FIGURE 2‐1 – METROQUEST ZIP CODE HEAT MAP
A Citizen’s Guide to Missouri’s Transportation Future: Long Range Transportation Plan Update 7
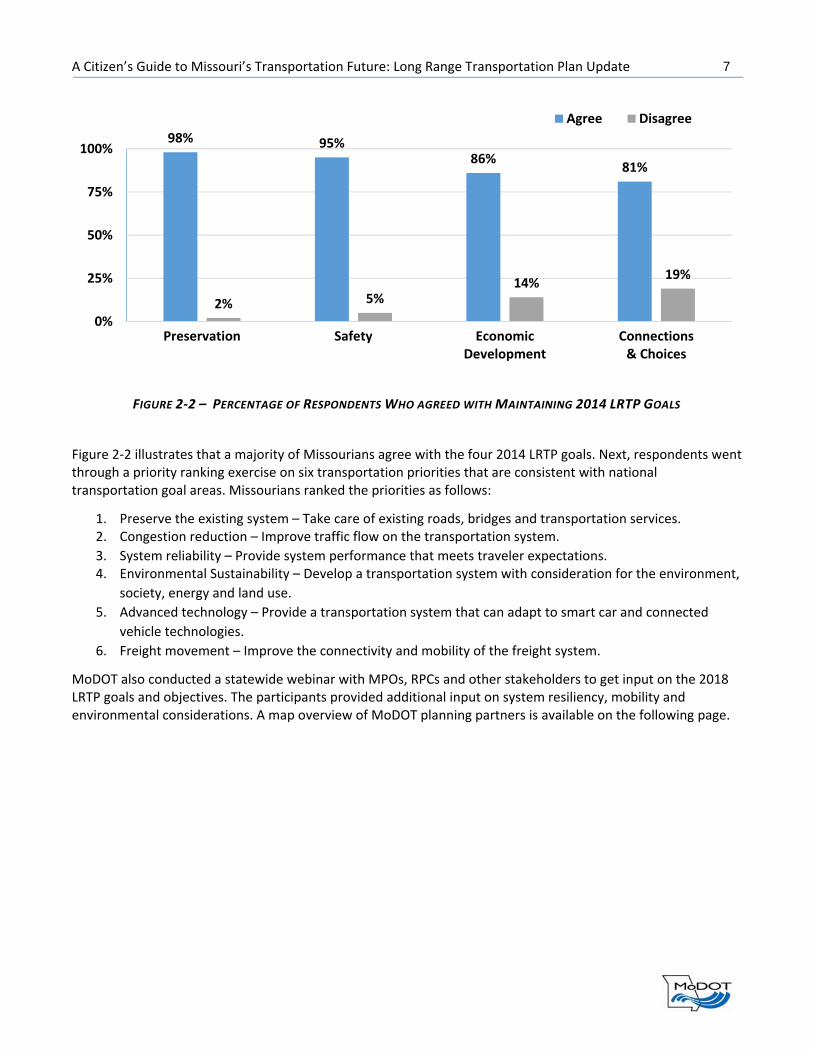
Figure 2‐2 illustrates that a majority of Missourians agree with the four 2014 LRTP goals. Next, respondents went through a priority ranking exercise on six transportation priorities that are consistent with national transportation goal areas. Missourians ranked the priorities as follows:
1. Preserve the existing system – Take care of existing roads, bridges and transportation services. 2. Congestion reduction – Improve traffic flow on the transportation system.
3. System reliability – Provide system performance that meets traveler expectations. 4. Environmental Sustainability – Develop a transportation system with consideration for the environment,
society, energy and land use.
5. Advanced technology – Provide a transportation system that can adapt to smart car and connected
vehicle technologies.
6. Freight movement – Improve the connectivity and mobility of the freight system.
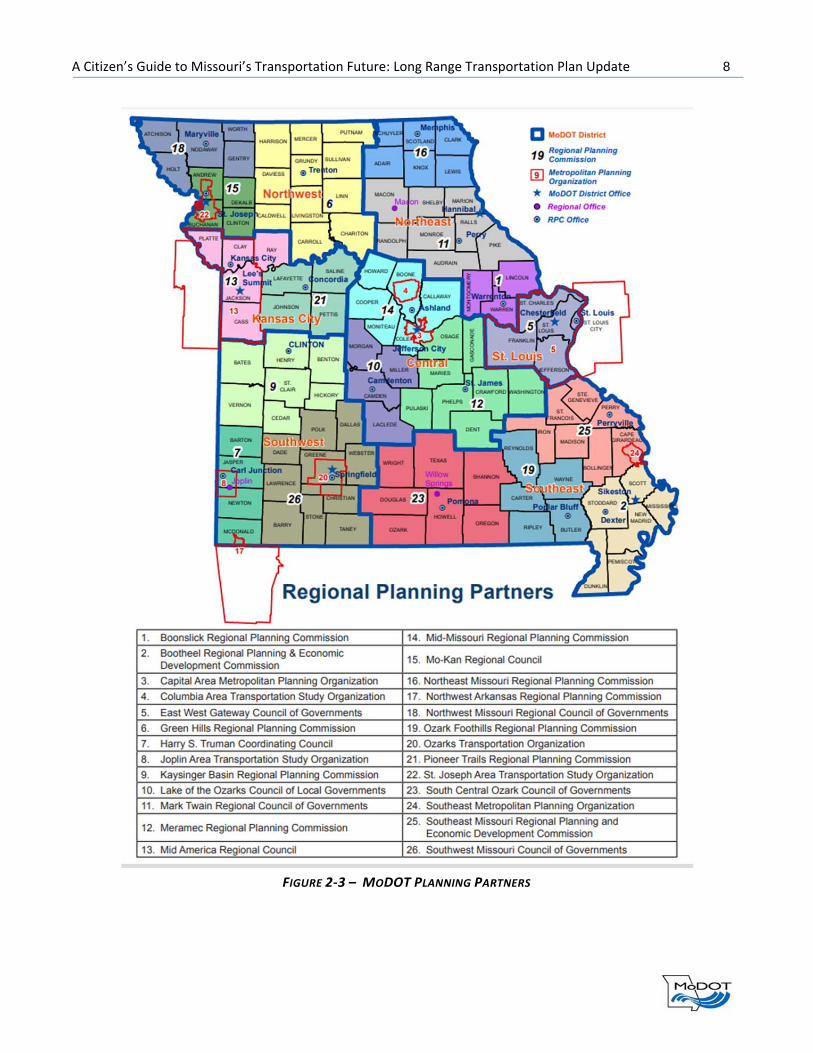
MoDOT also conducted a statewide webinar with MPOs, RPCs and other stakeholders to get input on the 2018 LRTP goals and objectives. The participants provided additional input on system resiliency, mobility and environmental considerations. A map overview of MoDOT planning partners is available on the following page.
98% 95%86%
81%
2% 5%14%
19%
0%
25%
50%
75%
100%
Preservation Safety EconomicDevelopment
Connections& Choices
Agree Disagree
FIGURE 2‐2 – PERCENTAGE OF RESPONDENTS WHO AGREED WITH MAINTAINING 2014 LRTP GOALS
A Citizen’s Guide to Missouri’s Transportation Future: Long Range Transportation Plan Update 8
FIGURE 2‐3 – MODOT PLANNING PARTNERS

A Citizen’s Guide to Missouri’s Transportation Future: Long Range Transportation Plan Update 9
2.3 Goals and Objectives The extensive public outreach concluded with Missourians wanting to keep the four goals established in the 2014 LRTP, adding a new goal to improve reliability and reduce congestion on Missouri’s transportation system. The five 2018 LRTP goals are:
► Take care of the transportation system and services we enjoy today
► Keep all travelers safe, no matter the mode of transportation
► Invest in projects that spur economic growth and create jobs
► Give Missourians better transportation choices
► Improve reliability and reduce congestion on Missouri’s transportation system
Several new objectives related to technology improvements, environmental stewardship and improvements in system reliability and project delivery are included in the 2018 LRTP. These updated goals and objectives address Missourians’ transportation priorities, prepare MoDOT for new and emerging transportation technologies, are aligned with the freight plan goals and cover the seven national goals set by Congress in MAP‐21 and the FAST Act.
Goal Take care of the transportation system and services we enjoy today
Objectives ► Establishing condition and service goals for components of Missouri’s transportation system ► Securing dependable funding to support the current system and services for each mode of
transportation ► Continuing to explore technology and developing business practices that result in lower costs to
stretch funding for more improvements ► Preserving the existing system while avoiding and mitigating negative impacts to the environment
Goal Keep all travelers safe, no matter the mode of transportation
Objectives ► Increasing safety belt usage ► Decreasing distracted driving ► Investing in system wide safety improvements that reduce roadway fatalities and serious injuries ► Providing safer, secure links and connection points between various transportation modes ► Expanding partnerships with safety advocates around the state to identify and implement safety
improvements ► Supporting automated and connected vehicle technology advancements ► Expanding use of innovative work zone warning and protection devices ► Increasing access and providing protection for bicyclists and pedestrians
TABLE 2‐1 – GOALS AND OBJECTIVES

A Citizen’s Guide to Missouri’s Transportation Future: Long Range Transportation Plan Update 10
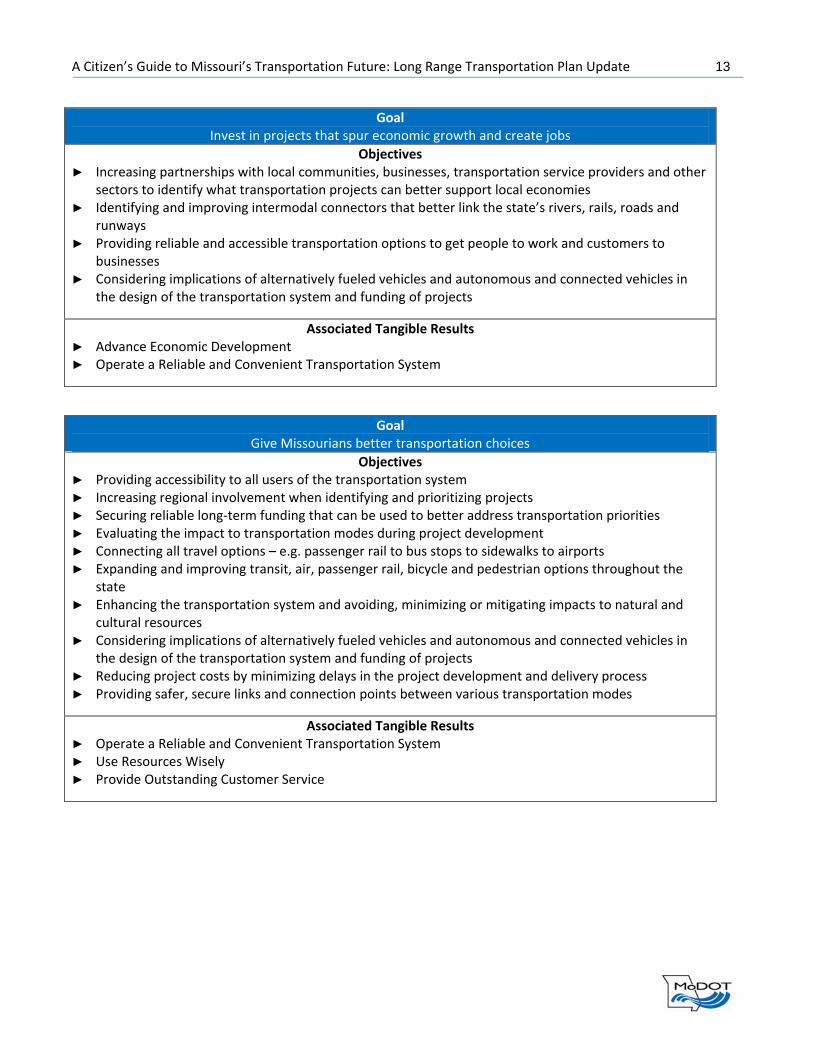
Goal Invest in projects that spur economic growth and create jobs
Objectives ► Increasing partnerships with local communities, businesses, transportation service providers and
other sectors to identify what transportation projects can better support local economies ► Identifying and improving intermodal connectors that better link the state’s rivers, rails, roads and
runways ► Providing reliable and accessible transportation options to get people to work and customers to
businesses ► Considering implications of alternatively fueled vehicles and autonomous and connected vehicles
in the design of the transportation system and funding of projects
Goal Give Missourians better transportation choices
Objectives ► Providing accessibility to all users of the transportation system ► Increasing regional involvement when identifying and prioritizing projects ► Securing reliable long‐term funding that can be used to better address transportation priorities ► Evaluating the impact to transportation modes during project development ► Connecting all travel options – e.g. passenger rail to bus stops to sidewalks to airports ► Expanding and improving transit, air, passenger rail, bicycle and pedestrian options throughout the
state ► Enhancing the transportation system and avoiding, minimizing or mitigating impacts to natural and
cultural resources ► Considering implications of alternatively fueled vehicles and autonomous and connected vehicles
in the design of the transportation system and funding of projects ► Reducing project costs by minimizing delays in the project development and delivery process ► Providing safer, secure links and connection points between various transportation modes
Goal Improve reliability and reduce congestion on Missouri’s transportation system
Objectives ► Establishing service goals for Missouri’s transportation system ► Taking a practical approach to highway system capacity expansion, given financial constraints ► Eliminating freight bottlenecks at key locations ► Facilitating ongoing movement of people and goods across the state system during incidents
affecting traffic flow ► Providing improvements to connectivity and mobility of the freight system ► Supporting improved efficiency of rail, waterways and airports ► Improving connections between freight modes ► Providing reliable and accessible transportation options to get people to work and customers to
businesses ► Utilizing the latest technology to monitor and improve traffic congestion ► Stabilize funding for MoDOT maintenance and operations services

A Citizen’s Guide to Missouri’s Transportation Future: Long Range Transportation Plan Update 11
2.4 Performance Measurement 2.4.1 Tracker Performance Measures
Since 2005, MoDOT has been a national leader in performance
measurement processes through tracking performance by Tangible Results
via Tracker, MoDOT’s performance management tool. Since its inception,
MoDOT has achieved significant improvements in projects and processes by
implementing a performance management approach. Tracker is the
quarterly performance reporting publication at MoDOT.
MoDOT built Tracker around Tangible Results. These are outcomes the public expects, and they guide MoDOT decision‐making. MoDOT uses a range of performance measures to focus and encourage progress in achieving these Tangible Results.
Fig. 2‐4 illustrates MoDOT’s values and tangible results within three focus areas of Safety, Service and Stability.
The following performance results provide a snapshot from the January 2018 Tracker results:
► Safety – Number of fatalities decreased 25 percent from 2005 to 2016. Trend has seen an increase in fatalities from 757 in 2013 to 947 in 2016.
► Pavement – Percent of major highways in good condition increased 1.6 percent from 88.5 percent in 2012 to 90.1 percent in 2016.
► Bridges – The number of poor condition bridges increased from 817 in 2012 to 883 in 2016.
► Customer Satisfaction – Percent of overall customer satisfaction remains consistent at 83 percent in 2011 and 2017.
The MoDOT Tracker is
updated quarterly and is
available online.
FIGURE 2‐4 – MODOT VALUES AND TANGIBLE RESULTS

A Citizen’s Guide to Missouri’s Transportation Future: Long Range Transportation Plan Update 12
2.4.2 Linking the LRTP and Tracker’s Seven Tangible Results
As shown in Table 2‐2, the 2018 LRTP goals and objectives are aligned with Missourian’s transportation priorities and MoDOT’s seven Tangible Results.
Goal Take care of the transportation system and services we enjoy today
Objectives ► Establishing condition and service goals for components of Missouri’s transportation system ► Securing dependable funding to support the current system and services for each mode of
transportation ► Continuing to explore technology and developing business practices that result in lower costs to stretch
funding for more improvements ► Preserving the existing system while avoiding and mitigating negative impacts to the environment
Associated Tangible Results ► Keep Roads and Bridges in Good Condition ► Deliver Transportation Solutions of Great Value ► Use Resources Wisely
Goal Keep all travelers safe, no matter the mode of transportation
Objectives ► Increasing safety belt usage ► Decreasing distracted driving ► Investing in system wide safety improvements that reduce roadway fatalities and serious injuries ► Providing safer, secure links and connection points between various transportation modes ► Expanding partnerships with safety advocates around the state to identify and implement safety
improvements ► Supporting automated and connected vehicle technology advancements ► Expanding use of innovative work zone warning and protection devices ► Increasing access and providing protection for bicyclists and pedestrians
Associated Tangible Results ► Keep Customers and Ourselves Safe
TABLE 2‐2 – GOALS, OBJECTIVES AND TANGIBLE RESULTS
A Citizen’s Guide to Missouri’s Transportation Future: Long Range Transportation Plan Update 13
Goal Invest in projects that spur economic growth and create jobs
Objectives ► Increasing partnerships with local communities, businesses, transportation service providers and other
sectors to identify what transportation projects can better support local economies ► Identifying and improving intermodal connectors that better link the state’s rivers, rails, roads and
runways ► Providing reliable and accessible transportation options to get people to work and customers to
businesses ► Considering implications of alternatively fueled vehicles and autonomous and connected vehicles in
the design of the transportation system and funding of projects
Associated Tangible Results ► Advance Economic Development ► Operate a Reliable and Convenient Transportation System
Goal Give Missourians better transportation choices
Objectives ► Providing accessibility to all users of the transportation system ► Increasing regional involvement when identifying and prioritizing projects ► Securing reliable long‐term funding that can be used to better address transportation priorities ► Evaluating the impact to transportation modes during project development ► Connecting all travel options – e.g. passenger rail to bus stops to sidewalks to airports ► Expanding and improving transit, air, passenger rail, bicycle and pedestrian options throughout the
state ► Enhancing the transportation system and avoiding, minimizing or mitigating impacts to natural and
cultural resources ► Considering implications of alternatively fueled vehicles and autonomous and connected vehicles in
the design of the transportation system and funding of projects ► Reducing project costs by minimizing delays in the project development and delivery process ► Providing safer, secure links and connection points between various transportation modes
Associated Tangible Results ► Operate a Reliable and Convenient Transportation System ► Use Resources Wisely ► Provide Outstanding Customer Service

A Citizen’s Guide to Missouri’s Transportation Future: Long Range Transportation Plan Update 14
Goal Improve reliability and reduce congestion on Missouri’s transportation system
Objectives ► Establishing service goals for Missouri’s transportation system ► Taking a practical approach to highway system capacity expansion, given financial constraints ► Eliminating freight bottlenecks at key locations ► Facilitating ongoing movement of people and goods across the state system during incidents affecting
traffic flow ► Providing improvements to connectivity and mobility of the freight system ► Supporting improved efficiency of rail, waterways and airports ► Improving connections between freight modes ► Providing reliable and accessible transportation options to get people to work and customers to
businesses ► Utilizing the latest technology to monitor and improve traffic congestion ► Stabilize funding for MoDOT maintenance and operations services
Associated Tangible Results ► Operate a Reliable and Convenient Transportation System ► Deliver transportation solutions of great value ► Advance economic development
2.4.3 Federal Performance Measures and Partner Coordination
Federal surface transportation legislation, beginning with MAP‐21 in 2012 and continuing in the FAST Act in 2015, established performance requirements for states, MPOs and public transit agencies. These requirements covered:
► Gathering data for national performance measures ► Performance target setting by state DOTs, MPOs and transit agencies ► Coordination between state DOTs, MPOs and public transit agencies ► Reporting on performance
MoDOT has a well‐developed framework working closely with its MPOs, RPCs and public transit agencies. MoDOT first met with the Missouri MPOs to discuss the MAP‐21 transportation performance management provisions in November 2012, right after MAP‐21 became law. MoDOT demonstrated the partner collaboration website to the MPOs to facilitate the sharing of resources between the DOT and the MPOs. In addition, MoDOT communicated with MPOs through webinars, training sessions, website and email as needed, e.g. Notices of Proposed Rulemaking (NPRM) releases, final rules webinars, guidance and new resources. MoDOT initiated monthly MAP‐21 partner collaboration webinars in February 2015 to help partners understand the new requirements and coordinate across state lines for the bi‐state MPOs. MoDOT invited DOT staff from Arkansas, Kansas and Illinois along with regional FHWA and FTA staff from those states to participate. MoDOT’s RPCs are now included since data is a frequent topic of the webinars. The partner collaboration webinars focus on the implementation of the new requirements such as target setting coordination, MPO best practices, data sharing, new tools available from MoDOT and other state and federal partners. MoDOT, other state DOTs and MPOs present new information with regular updates on the status of the performance management rules.

A Citizen’s Guide to Missouri’s Transportation Future: Long Range Transportation Plan Update 15
As a result of these webinars, the structure has been created to implement the new requirements in an open and collaborative environment. With FTA, FHWA, state DOTs and MPOs attending the webinars, the opportunity exists to learn from each other. Working relationships have been strengthened as well as established in some cases. Not just the MPOs and RPCs benefit from the webinars, but also the state DOTs, as they have the opportunity to ask questions of each other and share ideas. Table 2‐3 shows the FHWA performance measures for safety, infrastructure condition (bridge and pavement) and system performance, freight, congestion and air quality based on the final rulemaking as well as the FTA measures for transit assets.
PM 1. Safety
Number of fatalities
Number of serious injuries
Fatalities per 100 million vehicle miles traveled
Serious injuries per 100 million vehicle miles traveled
Non‐motorized fatalities and serious injuries
PM 2. Bridge Percentage of National Highway System bridges classified as in good condition
Percentage of National Highway System bridges classified as in poor condition
PM 2. Pavement
Percentage of pavement on the Interstate System in good condition
Percentage of pavement on the non‐Interstate National Highway System in good condition
Percentage of pavement on the Interstate System in poor condition
Percentage of pavement on the non‐Interstate National Highway System in poor condition
PM 3. System Performance,
Freight Movement and Air Quality
Percent of person‐miles traveled on the Interstate System that are reliable
Percent of person‐miles traveled on the non‐Interstate National Highway System that are reliable
Percentage of the Interstate System mileage providing for reliable truck travel times
Annual hours of peak‐hour excessive delay per capita
Percent of non‐single occupant vehicle (SOV) travel
On‐road mobile source emissions reduction
FTA Transit Asset Management Performance Measures
The percentage of revenue vehicles (by type) that exceed the useful life benchmark (ULB)
The percentage of non‐revenue service vehicles (by type) that exceed the ULB
The percentage of facilities (by group) that are rated less than 3.0 on the Transit Economic Requirements Model (TERM) Scale
The percentage of track segments (by mode) that have performance restrictions
TABLE 2‐3 – FEDERAL PERFORMANCE MEASURES (PM)

A Citizen’s Guide to Missouri’s Transportation Future: Long Range Transportation Plan Update 16
A seventh performance measure was identified in PM3 – the greenhouse gas (GHG) measure. FHWA has
published a notice of proposed rulemaking in which it proposes to repeal requirements for tracking and
reporting GHG emissions from the NHS. The GHG measure would require state DOTs and MPOs to track changes
in tailpipe carbon dioxide (CO2) emissions on the NHS, set emission reduction targets and submit performance
reports related to the measure. FHWA plans to issue a Final Rule in spring 2018 announcing its decision on
whether to repeal, retain, or revise the measure. MoDOT does not support requiring any new national
performance measures not originally not mandated by statute.
2.5 System Performance Report 2.5.1 Safety Targets
FAST Act/MAP‐21 is the first transportation reauthorization bill requiring target setting coordination between state DOTs, MPOs and transit agencies on national performance measures. As shown in Table 2‐4, targets were coordinated by MoDOT with MPOs, FHWA and National Highway Traffic Safety Administration for five safety performance measures using five‐year rolling averages for calendar year 2018. The most recent measures and targets for Missouri are identified in the state’s Highway Safety Improvement Program (HSIP) report and the Highway Safety Plan (HSP), approved in November 2017.
Source: MoDOT
Safety is MoDOT’s primary goal for Missouri citizens and MoDOT workers so everyone goes home safe every
day. MoDOT’s 2016‐2020 Strategic Highway Safety Plan (SHSP) titled Missouri’s Blueprint – A Partnership
Toward Zero Deaths serves as the strategic plan for agencies and organizations working to improve roadway
safety and reduce fatalities and serious injuries on Missouri’s transportation system. The Blueprint identifies
emphasis areas and corresponding strategies safety partners have agreed have the most potential to save lives
and reduce injuries. The Blueprint takes a holistic approach to improving safety by considering countermeasures
from the four “E’s”: education, enforcement, engineering, and emergency services. The Missouri Coalition for
Roadway Safety (MCRS) leads the implementation of these efforts alongside a number of safety partners
including MPOs, RPCs, community leaders, health care providers, legislators, educators, law enforcement,
emergency responders, engineers and concerned citizens. The ultimate goal of the Blueprint is to have zero
traffic fatalities in Missouri. An interim goal of 700 or fewer fatalities by 2020 has been identified to help
evaluate the efforts and strategies implemented. Using the same collaborative approach in developing the new
Blueprint goals, MoDOT coordinated with planning partners on these safety targets.
Performance Measure
5‐Year Rolling Average
(2012‐2016)
5‐Year Rolling Average Statewide Target for CY2018
Number of Fatalities 834 858
Fatality Rate per 100 Million VMT 1.173 1.163
Number of Serious Injuries 4,877 4,559
Serious Injury Rate per 100 Million VMT 6.884 6.191
Number of Non‐Motorized Fatalities and Serious Injuries 431 432
TABLE 2‐4 – SAFETY PERFORMANCE MEASURES AND TARGETS

A Citizen’s Guide to Missouri’s Transportation Future: Long Range Transportation Plan Update 17
2.5.2 Safety Performance Report
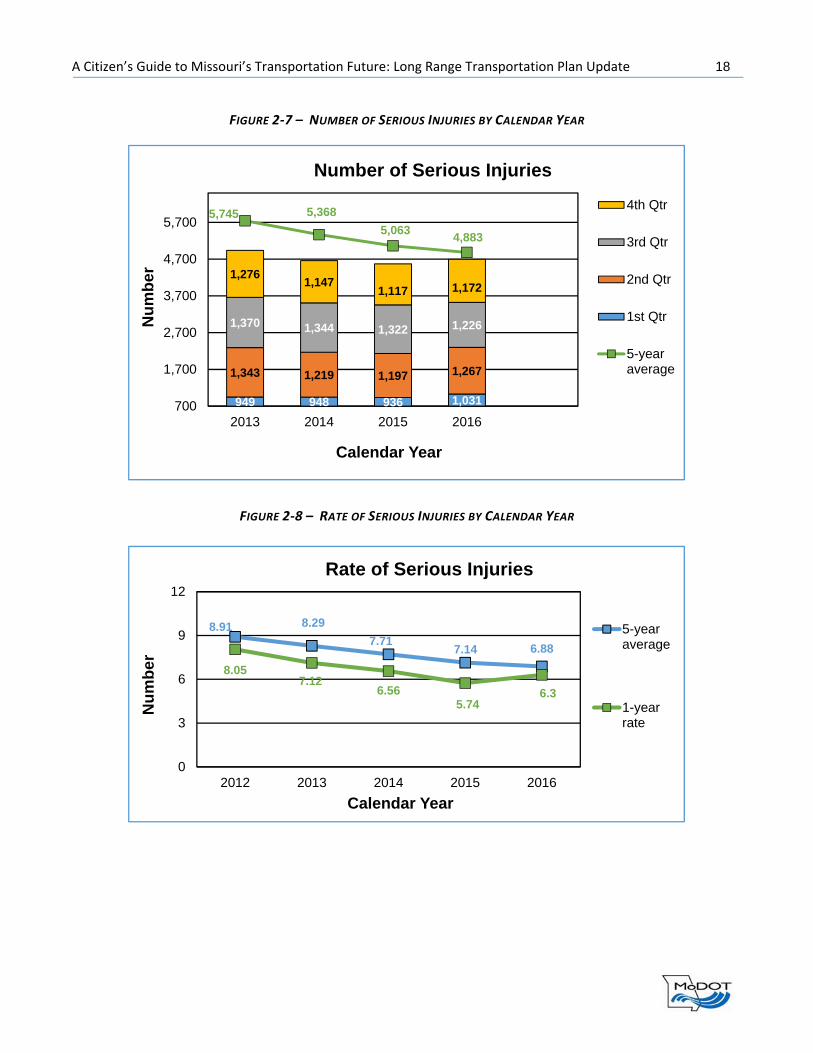
Missouri has seen a 25 percent reduction in fatalities from 2005‐2016, from 1,257 in 2005 to 947 in 2016. In recent years however, Missouri has seen an increase in fatalities from 757 in 2013 to 947 in 2016. The graphs below depict the safety data on fatalities and serious injuries.
140 146 168 202
195 205 216219
219 199238
283
203 216248 243
757 766870 947
814 791801 833
0
200
400
600
800
1,000
2013 2014 2015 2016
Nu
mb
er
Calendar Year
Number of Fatalities
4th Qtr
3rd Qtr
2nd Qtr
1st Qtr
5-yearaverage
1.21
1.091.08
1.21
1.271.24
1.18
1.14 1.151.17
1.141.10
1.08
1.13
1.00
1.10
1.20
1.30
1.40
2012 2013 2014 2015 2016
Nu
mb
er
Calendar Year
Rate of Fatalities 1-yearrate
5-yearaverage
Nationalaverage
FIGURE 2‐5 – NUMBER OF FATALITIES BY CALENDAR YEAR
FIGURE 2‐6 – RATE OF FATALITIES BY CALENDAR YEAR
A Citizen’s Guide to Missouri’s Transportation Future: Long Range Transportation Plan Update 18
949 948 936 1,031
1,343 1,219 1,197 1,267
1,370 1,344 1,322 1,226
1,2761,147
1,117 1,172
5,745 5,368
5,0634,883
700
1,700
2,700
3,700
4,700
5,700
2013 2014 2015 2016
Nu
mb
er
Calendar Year
Number of Serious Injuries
4th Qtr
3rd Qtr
2nd Qtr
1st Qtr
5-yearaverage
FIGURE 2‐7 – NUMBER OF SERIOUS INJURIES BY CALENDAR YEAR
8.91 8.29
7.717.14 6.88
8.057.12
6.565.74
6.3
0
3
6
9
12
2012 2013 2014 2015 2016
Nu
mb
er
Calendar Year
Rate of Serious Injuries
5-yearaverage
1-yearrate
FIGURE 2‐8 – RATE OF SERIOUS INJURIES BY CALENDAR YEAR
A Citizen’s Guide to Missouri’s Transportation Future: Long Range Transportation Plan Update 19
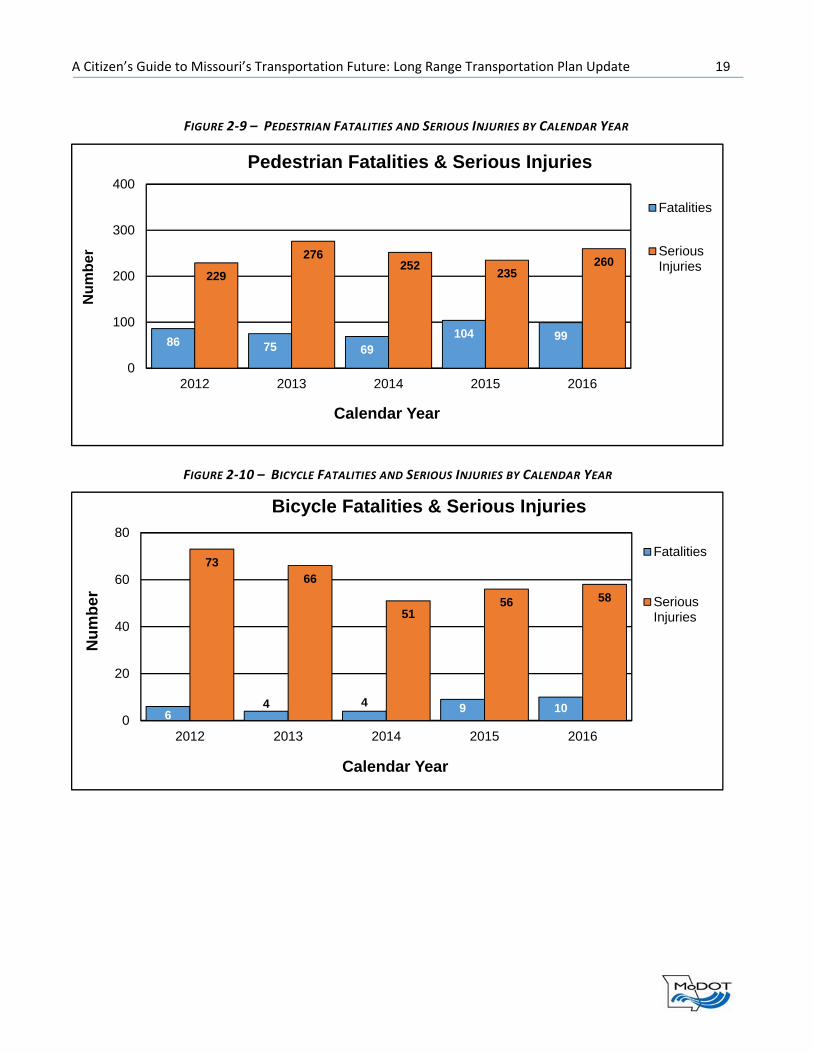
86 75 69104 99
229
276252
235260
0
100
200
300
400
2012 2013 2014 2015 2016
Nu
mb
er
Calendar Year
Pedestrian Fatalities & Serious Injuries
Fatalities
SeriousInjuries
64 4 9 10
7366
5156 58
0
20
40
60
80
2012 2013 2014 2015 2016
Nu
mb
er
Calendar Year
Bicycle Fatalities & Serious Injuries
Fatalities
SeriousInjuries
FIGURE 2‐9 – PEDESTRIAN FATALITIES AND SERIOUS INJURIES BY CALENDAR YEAR
FIGURE 2‐10 – BICYCLE FATALITIES AND SERIOUS INJURIES BY CALENDAR YEAR
A Citizen’s Guide to Missouri’s Transportation Future: Long Range Transportation Plan Update 20
MoDOT looks for systemic safety issues and determines what can be done to mitigate them. MoDOT engages in significant public outreach efforts using four key disciplines of traffic safety: engineering, enforcement, education and emergency response. While these efforts have proven to save lives, the safety of Missouri’s roadways continues to decline due to driver behaviors.
Between 2014‐2016, 63 percent of drivers and occupants killed in
Missouri crashes were unrestrained. Properly wearing a seat belt or
using a child restraint is the single most effective way to prevent death
and reduce injury in a crash, yet only 84 percent of Missourians use seat
belts, which places Missouri 40th in the nation.
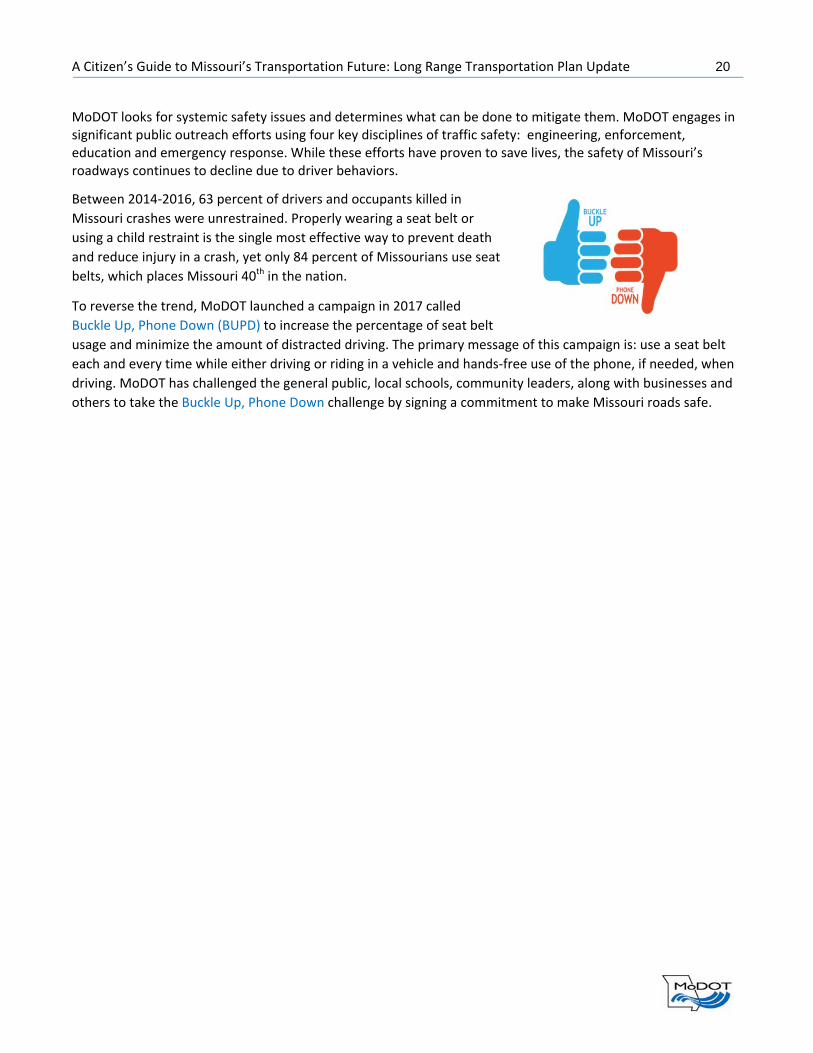
To reverse the trend, MoDOT launched a campaign in 2017 called
Buckle Up, Phone Down (BUPD) to increase the percentage of seat belt
usage and minimize the amount of distracted driving. The primary message of this campaign is: use a seat belt
each and every time while either driving or riding in a vehicle and hands‐free use of the phone, if needed, when
driving. MoDOT has challenged the general public, local schools, community leaders, along with businesses and
others to take the Buckle Up, Phone Down challenge by signing a commitment to make Missouri roads safe.
A Citizen’s Guide to Missouri’s Transportation Future: Long Range Transportation Plan Update 21
SECTION 3: TRANSPORTATION SYSTEM Missouri’s transportation system includes a vast network of highways, bridges, buses, airports, railroads, waterways, biking and pedestrian paths. It is counted on to safely and reliably connect people with family, jobs and services, businesses with suppliers and customers, students with schools and visitors with destinations.
This section describes the components that make up the transportation system that Missourian’s enjoy today.
3.1 Roads and Bridges Missouri has the seventh largest state highway system in the United States, totaling 33,856 miles. Each day, 130
million miles are driven and 1.1 million tons of freight are hauled on this system. Missouri’s highway network
includes interstates, major routes, minor routes and low volume routes. Interstates and major routes include
just 5,517 of the 33,856 miles of highway in Missouri, but account for 76 percent of the travel. Missouri’s minor
routes make up the largest group of state highways, accounting for 17,450 miles of the state system. About 22
percent of travel occurs on these routes. The final tier of Missouri highways is the low volume routes, each of
which carry less than 400 vehicles per day and serve local transportation needs. The low volume routes total
10,889 miles accounting for about one‐third of the state system. Travel on these routes is less than two percent
of all state highway travel.
Over the last decade, MoDOT has focused on improving and maintaining the interstates and major routes and
approximately ninety percent of these routes are in good condition. Eighty percent of minor routes and seventy‐
four percent of low volume routes are in good condition.
Roadway Classification Current Condition (% Good)
Interstate & Major Routes (National Highway System) 90%
Minor Routes 80%
Low Volume Routes 70%
Source: MoDOT
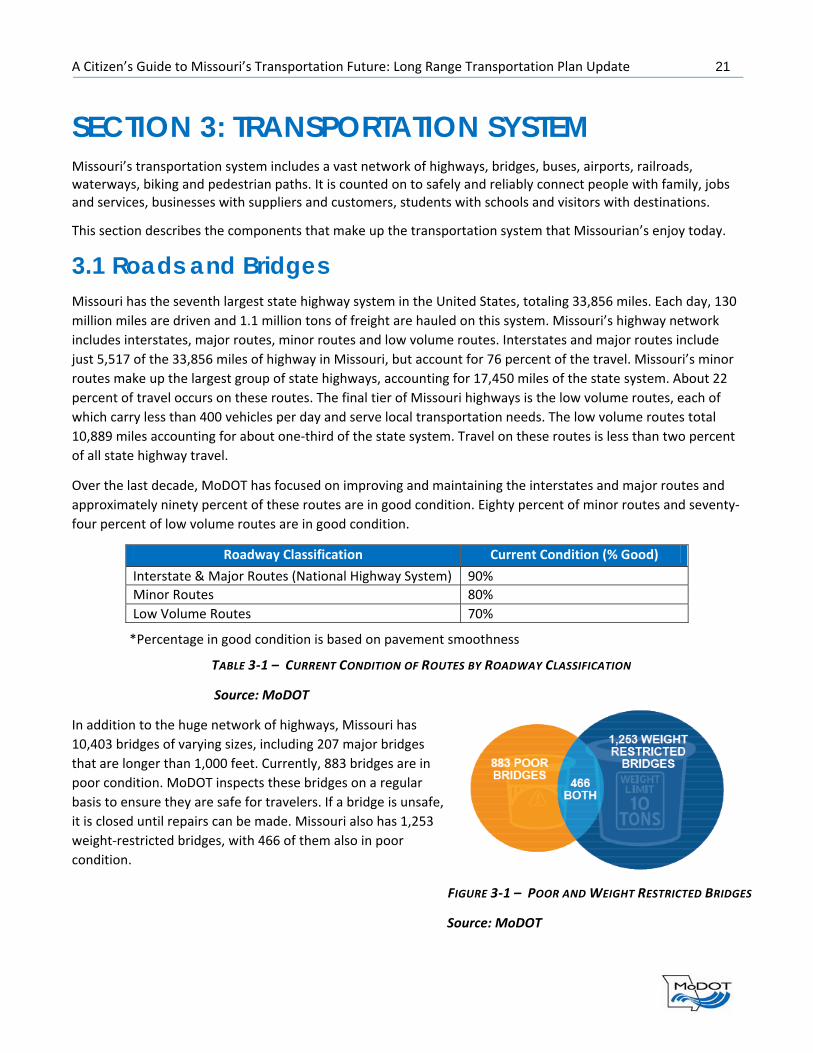
In addition to the huge network of highways, Missouri has
10,403 bridges of varying sizes, including 207 major bridges
that are longer than 1,000 feet. Currently, 883 bridges are in
poor condition. MoDOT inspects these bridges on a regular
basis to ensure they are safe for travelers. If a bridge is unsafe,
it is closed until repairs can be made. Missouri also has 1,253
weight‐restricted bridges, with 466 of them also in poor
condition.
FIGURE 3‐1 – POOR AND WEIGHT RESTRICTED BRIDGES
Source: MoDOT
*Percentage in good condition is based on pavement smoothness
TABLE 3‐1 – CURRENT CONDITION OF ROUTES BY ROADWAY CLASSIFICATION
A Citizen’s Guide to Missouri’s Transportation Future: Long Range Transportation Plan Update 22
Missouri also has a large network of local roadways. These local systems include 23,000 miles of city streets,
74,000 miles of county roads and nearly 14,000 bridges. Although these facilities are maintained under the
jurisdiction of local city and county governments, the state partners with these entities ensure the overall
roadway system is safe, maintained and well‐connected.
3.2 Transit Public transportation are those shared passenger services that are used by the general public as an alternative
to driving, and in some cases, owning a personal vehicle. There are a variety of public transit methods in
Missouri, including buses, vans, light rail and streetcars. Larger cities in Missouri offer the public a wider variety
of public transit options with greater frequency. In Missouri, there are seven urban areas with local
transportation systems: Columbia, Jefferson City, Joplin, Kansas City, Springfield, St. Joseph and St. Louis.
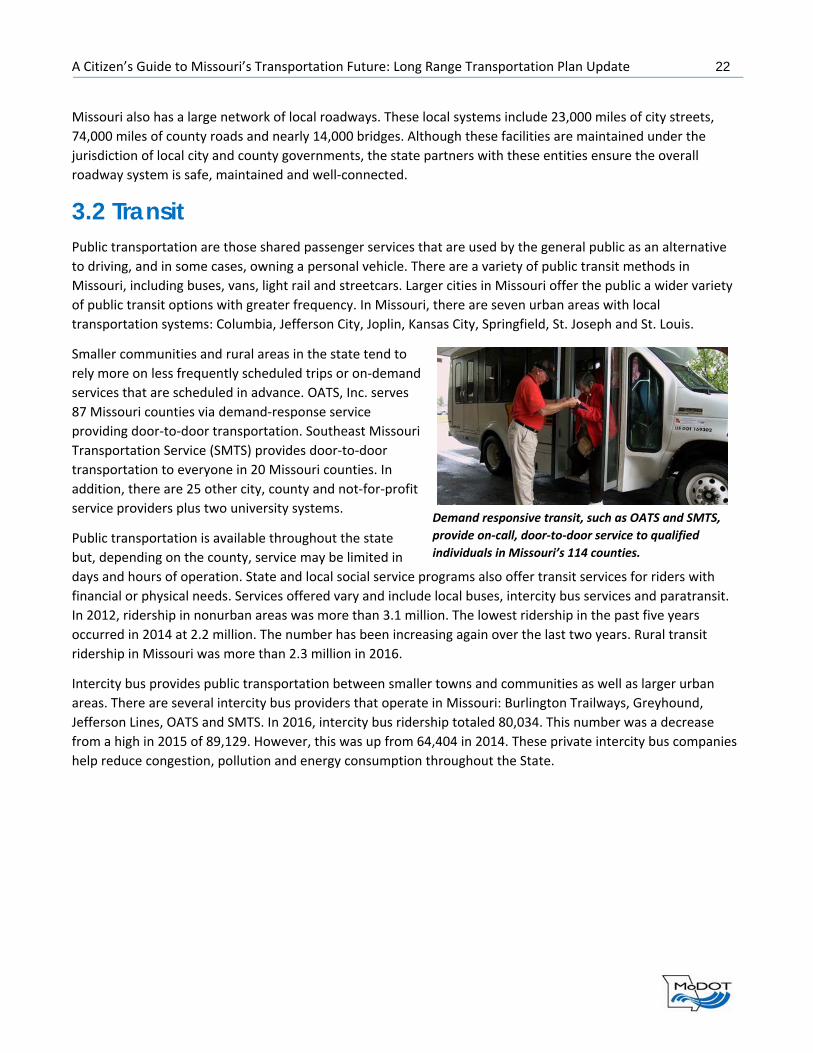
Smaller communities and rural areas in the state tend to
rely more on less frequently scheduled trips or on‐demand
services that are scheduled in advance. OATS, Inc. serves
87 Missouri counties via demand‐response service
providing door‐to‐door transportation. Southeast Missouri
Transportation Service (SMTS) provides door‐to‐door
transportation to everyone in 20 Missouri counties. In
addition, there are 25 other city, county and not‐for‐profit
service providers plus two university systems.
Public transportation is available throughout the state
but, depending on the county, service may be limited in
days and hours of operation. State and local social service programs also offer transit services for riders with
financial or physical needs. Services offered vary and include local buses, intercity bus services and paratransit.
In 2012, ridership in nonurban areas was more than 3.1 million. The lowest ridership in the past five years
occurred in 2014 at 2.2 million. The number has been increasing again over the last two years. Rural transit
ridership in Missouri was more than 2.3 million in 2016.
Intercity bus provides public transportation between smaller towns and communities as well as larger urban
areas. There are several intercity bus providers that operate in Missouri: Burlington Trailways, Greyhound,
Jefferson Lines, OATS and SMTS. In 2016, intercity bus ridership totaled 80,034. This number was a decrease
from a high in 2015 of 89,129. However, this was up from 64,404 in 2014. These private intercity bus companies
help reduce congestion, pollution and energy consumption throughout the State.
Demand responsive transit, such as OATS and SMTS,
provide on‐call, door‐to‐door service to qualified
individuals in Missouri’s 114 counties.

A Citizen’s Guide to Missouri’s Transportation Future: Long Range Transportation Plan Update 23
3.3 Aviation Missouri is also home to nearly 505 aviation facilities that are
both publicly and privately‐owned airports, heliports, seaplane
bases and grass landing strips. Of those, 122 facilities are
publicly owned.
In 2016, 12.8 million passengers boarded flights at one of the
nine commercial airports in Missouri. Two of the nine
commercial airports – St. Louis Lambert International and
Kansas City International – offer national and international
flights. Kansas City International has four all‐cargo carriers,
including DB Schenker, DHL, FedEx and UPS servicing shipping
needs for western Missouri and eastern Kansas. St. Louis
Lambert has three all‐cargo carriers, including DHL, FedEx and
UPS serving eastern Missouri and western Illinois. Missouri
airports transport more than 170,000 tons of freight cargo by
air each year. The following six airports also offer airport travel
service: Branson, Cape Girardeau, Columbia, Joplin, Kirksville
and Waynesville‐St. Robert Regional.
There are 36 airports in Missouri, including the previously
mentioned nine commercial airports that have runways over 5,000 feet and the ability to accommodate
corporate and business aviation passenger service. There are a total of 113 general aviation airports that do not
have scheduled passenger service but provide important connections for agricultural, medical, law enforcement,
emergency response and recreational activities.
3.4 Rail Rail is a major part of the freight transportation system in Missouri and plays a significant role in the state’s
economy. A substantial portion of the freight moving into, out of
and through Missouri is carried on trains. In 2011, 8.2 million rail
cars carried 458.1 million tons of freight valued at $465 billion
representing 38.6% of the total value of goods shipped in the
state. In 2016, the total rail freight tonnage decreased to 352
million tons. The primary commodities originating in Missouri are
food products, farm products, intermodal containers, chemicals,
motor vehicles and parts.
Missouri has a significant freight rail infrastructure with six Class I
rail lines. Kansas City is the second largest rail hub in the nation,
with St. Louis coming in third. Missouri has over 4,200 miles of
track. In addition to the six Class I rail lines, there are five short line railroads that serve the state.
Passenger rail provides an alternative to the congested I‐70 corridor between St. Louis and Kansas City, as well
as the opportunity to travel nationally. Amtrak operates two national passenger train routes in Missouri:
Missouri Aviation – By the Numbers Total Aviation Facilities – 505 Publicly‐Owned Facilities – 122 Business Capable Airports – 36 Commercial Airports – 9 International Airports – 2 Total 2016 Enplanements – 12.8 million Total 2016 Freight Tonnage – 186,000 tons The 12.8 million enplanements in 2016 were an increase from 11.9 million in 2015, 11.7 million in 2014, and 11.6 million in 2013 and 2012. The 2016 freight tonnage stayed flat at 186,000 compared to 2015, and was down from 196,000 tons in 2014 and 198,000 tons in 2013.
Missouri’s Freight Rail – Providing National Connections A significant percentage (40%) of the freight in Missouri is moved by rail. It is projected that rail freight will increase in the future, reinforcing the role of Missouri as a connector state in our nation’s freight network.

A Citizen’s Guide to Missouri’s Transportation Future: Long Range Transportation Plan Update 24
Southwest Chief which operates between Chicago and Los Angeles with service in Missouri from Kansas
City across northern Missouri to Ft. Madison, Iowa
Texas Eagle providing connections between Chicago and San Antonio with service in Missouri from St.
Louis south through Poplar Bluff heading to Little Rock
The Amtrak state route, the Missouri River Runner, runs between Union Station in St. Louis and Union Station in
Kansas City with stops in Kirkwood, Washington, Hermann, Jefferson City, Sedalia, Warrensburg, Lee’s Summit
and Independence. The state of Missouri sponsors this service.
The Missouri River Runner travels twice a day between St. Louis and Kansas City. In 2013, a second bridge was
constructed over the Osage River in Central Missouri, eliminating one of the worst bottlenecks and improving
performance on the Missouri River Runner trains. This route had an average 87 percent on‐time performance in
2017 and an average 86 percent on‐time performance in 2016. Ridership on the Missouri River Runner in 2017
was nearly 171,000, which is a decrease since the high of 197,000 in 2013
3.5 Waterways Missouri waterways move an average of $12.5 billion in cargo annually. The State has 1,050 miles of navigable
rivers, including 500 miles of the Mississippi River and 550 miles of the Missouri River. Missouri statute allows
for the formation of port authorities and MoDOT’s waterways unit assists authorized cities and counties in
forming port authorities to foster local economic development. MoDOT assists in capital and administrative
funding, along with other technical assistance. A total of 14 public port authorities and more than 200 private
ports can be found along Missouri’s waterways. There are eight active ports; six of the eight shipped product in
2016. There are six developing ports, two of which do not currently have a public port facility.
Commodities transported by barge on the Missouri River include agricultural products, chemicals such as
fertilizers and petroleum products and manufactured goods such as building materials. The Mississippi River
continues to be a key transportation option for a variety of agricultural products as well as other bulk materials
such as chemicals and building materials.
In 2011, ports in Missouri moved 49.9 million tons of freight. This value decreased to 40 million tons in 2016. In
2030, the forecast is for 63.3 million tons of freight to be transported via waterways in Missouri. This would
amount to a cumulative increase of 26.9 percent or 1.3 percent annually. The value of this freight is expected to
increase to $15.4 billion by 2030 which amounts to a cumulative increase of 23.1 percent or 1.1 percent
annually.
Missouri has four nationally designated marine highways. Designated marine highways receive preferential
treatment for federal assistance from the U.S. Maritime Administration (MARAD). The marine highway system
has been designated to expand use of the nation’s waterways to relieve congestion and reduce emissions from
other modes of transportation.

A Citizen’s Guide to Missouri’s Transportation Future: Long Range Transportation Plan Update 25
Marine highways serving Missouri include:
M‐29 connecting the Upper Missouri River from Kansas City to Sioux City, Iowa
M‐70 covering the Missouri River from Kansas City to St. Louis
M‐35 was recently approved and covers the Upper Mississippi River from the Twin Cities to St. Louis
M‐55 connecting the Illinois River from Chicago to St. Louis and then the Mississippi River from St. Louis
to the Gulf of Mexico
Missouri also offers six toll ferry services, five of which cross the Mississippi River and one crossing the Current River. The six ferries are at Akers, Winfield, Golden Eagle, Grafton, Ste. Genevieve and Dorena. Three of the ferry services, those at Akers, Ste. Genevieve and Dorena, are publicly supported.
3.6 Bicycle and Pedestrian Bicycle and pedestrian facilities provide alternative transportation options for those who are not able to drive or
choose not to drive. These facilities often include sidewalks, shoulders or lanes adjacent to moving vehicles
along the road, crosswalks and trail systems. These facilities are managed by a variety of entities from cities and
counties, to MoDOT.
Missouri has six cross‐country bicycle routes, each of which is a small part of a much longer national bicycle
route, plus one cross‐state route, the Katy Trail. The six national routes include:
FIGURE 3‐3 – MISSOURI’S CROSS‐STATE BICYCLE
Source: MoDOT 2014 LRTP
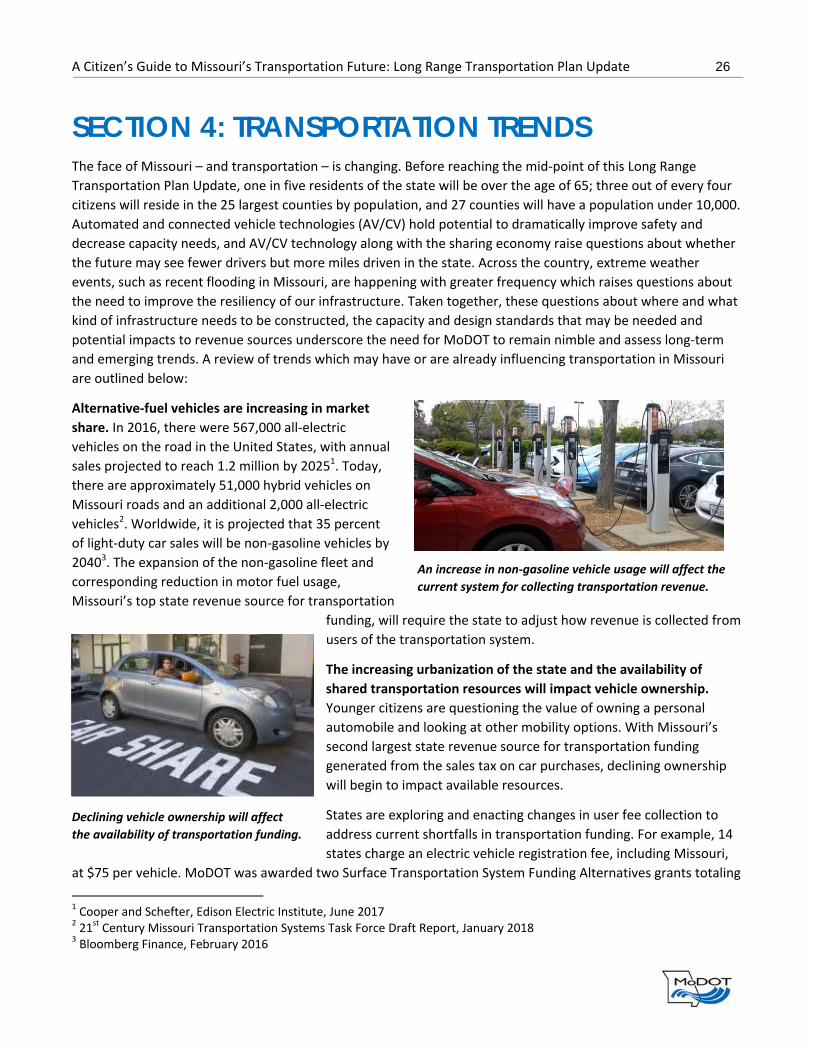
A Citizen’s Guide to Missouri’s Transportation Future: Long Range Transportation Plan Update 26
SECTION 4: TRANSPORTATION TRENDS The face of Missouri – and transportation – is changing. Before reaching the mid‐point of this Long Range
Transportation Plan Update, one in five residents of the state will be over the age of 65; three out of every four
citizens will reside in the 25 largest counties by population, and 27 counties will have a population under 10,000.
Automated and connected vehicle technologies (AV/CV) hold potential to dramatically improve safety and
decrease capacity needs, and AV/CV technology along with the sharing economy raise questions about whether
the future may see fewer drivers but more miles driven in the state. Across the country, extreme weather
events, such as recent flooding in Missouri, are happening with greater frequency which raises questions about
the need to improve the resiliency of our infrastructure. Taken together, these questions about where and what
kind of infrastructure needs to be constructed, the capacity and design standards that may be needed and
potential impacts to revenue sources underscore the need for MoDOT to remain nimble and assess long‐term
and emerging trends. A review of trends which may have or are already influencing transportation in Missouri
are outlined below:
Alternative‐fuel vehicles are increasing in market
share. In 2016, there were 567,000 all‐electric
vehicles on the road in the United States, with annual
sales projected to reach 1.2 million by 20251. Today,
there are approximately 51,000 hybrid vehicles on
Missouri roads and an additional 2,000 all‐electric
vehicles2. Worldwide, it is projected that 35 percent
of light‐duty car sales will be non‐gasoline vehicles by
20403. The expansion of the non‐gasoline fleet and
corresponding reduction in motor fuel usage,
Missouri’s top state revenue source for transportation
funding, will require the state to adjust how revenue is collected from
users of the transportation system.
The increasing urbanization of the state and the availability of
shared transportation resources will impact vehicle ownership.
Younger citizens are questioning the value of owning a personal
automobile and looking at other mobility options. With Missouri’s
second largest state revenue source for transportation funding
generated from the sales tax on car purchases, declining ownership
will begin to impact available resources.
States are exploring and enacting changes in user fee collection to
address current shortfalls in transportation funding. For example, 14
states charge an electric vehicle registration fee, including Missouri,
at $75 per vehicle. MoDOT was awarded two Surface Transportation System Funding Alternatives grants totaling
1 Cooper and Schefter, Edison Electric Institute, June 2017 2 21st Century Missouri Transportation Systems Task Force Draft Report, January 2018 3 Bloomberg Finance, February 2016
An increase in non‐gasoline vehicle usage will affect the
current system for collecting transportation revenue.
Declining vehicle ownership will affect
the availability of transportation funding.

A Citizen’s Guide to Missouri’s Transportation Future: Long Range Transportation Plan Update 27
$3 million to study the implementation of a new registration fee schedule based on estimated miles per gallon.
The intended purpose is to offset loss of revenue per mile of fuel tax during transition to alternative fuel fleet.
Two states, California and Oregon, are implementing pilot programs to switch to road user charges in lieu of gas
taxes and 10 other states have enacted legislation to explore road user charges.
The remainder of this memo focuses on trends occurring within Missouri.
4.1 Demographics 4.1.1 Population Projections through 2040
Missouri’s average growth rate was above 0.5 percent from 2001 to 2010, and since has topped out at 0.33
percent (Figure 4‐1). Missouri is projected to continue to grow during the next 20 years, with a total population
approaching 6.4 million people in 2040, as compared to 6.1 million in 20164. The projected growth rate remains
positive, but at a slower rate in comparison to the population projections developed as recently as four years
ago and included in the LRTP. Missouri’s net population increase will be primarily attributable to natural
increase (births minus deaths), with slight gains in net migration.
4 University of Virginia Demographics Research Group, May 2016
Missouri Population Change and Net Migration
FIGURE 4‐1 – SOURCE: MISSOURI CENSUS DATA CENTER: UNIVERSITY OF MISSOURI OFFICE OF SOCIAL AND
ECONOMIC DATA ANALYSIS
Population Chan
ge
Year

A Citizen’s Guide to Missouri’s Transportation Future: Long Range Transportation Plan Update 28
This makes for differences in planning compared to high population growth regions/states.
The projected population growth will continue to increase vehicle miles traveled (VMT) on roadways across the
state. For the foreseeable future, the personal vehicle will remain the choice for travel in the state. Roadway
congestion, safety and maintenance will continue to be transportation concerns.
4.1.2 Population Trend One – An Aging Population
The percentage of Missourians over 65 years
old is projected to increase considerably over
the next 16 years, from 15 percent of the
population in 2014 to 21 percent in 2030.
Missouri’s Office of Administration, Division of
Budget and Planning, projects ten counties will
have greater than 30 percent of their
population over 65 by 2030. Figure 4‐2 shows
the projections, by county, of the percentage of
citizens over the age of 65.
The number of Missourians over 80 is projected
to grow from 232,000 in 2010 to more than
438,000, 6.8 percent of the overall population,
by 2040. The aging population is more likely to
want or need to use transportation options
beyond single occupancy vehicles. According to
the research in, Driving Life Expectancy of
Persons Aged 70 Years and Older in the United
States, on average, seniors outlive
their ability to drive safely by 7 to
10 years5, making options such as
transit and AV/CV and American
with Disabilities Act (ADA)
compliant pedestrian access a
necessity to maintain an
independent lifestyle.
The aging population will likely
have an impact on travel demand.
FHWA findings indicate that per‐
person trips of those 65 or older
fell six percent from 2001 to 20096.
Forecasts for VMT per capita
among drivers 65 and older are
5 Foley, et al. American Journal of Public Health, 2002 6 Blumenberg et al. 2013
FIGURE 4‐3 – SOURCE: UNIVERSITY OF VIRGINIA DEMOGRAPHICS RESEARCH GROUP
FIGURE 4‐2 – SOURCE: MISSOURI OFFICE OF ADMINISTRATION

A Citizen’s Guide to Missouri’s Transportation Future: Long Range Transportation Plan Update 29
projected to fall by seven percent by 2050 compared to 20007.
The aging population will require the state to explore options to provide mobility to address the needs of older
citizens who elect to stop or reduce their driving. Older drivers who continue to operate a motor vehicle often
require an increasing emphasis in road safety devices, including more visible pavement markings and larger
lettering on roadway signage. The added number of older drivers will make highway maintenance and visibility a
focus for investing in the transportation system.
4.1.3 Population Trend Two – Concentration of Population and County Trends
Since the 1900s, population in urban
areas has increased from 36 to 70
percent and all projections suggest
the pattern will continue. Missouri, as
with most states, will continue to see
a migration of people moving from
rural areas to urbanized locations.
Information from the Missouri Census
Data Center suggests the population
will continue to move toward urban
areas, with higher population gains
anticipated in the suburbs. Recent
migration trends indicate that the
next 30 years will bring large growth
in the suburban counties surrounding
Kansas City, St. Louis and Springfield,
with significant declines continuing in
the rural areas, most notably north of
U.S. Route 36 and in the south‐central
area of the state. Declining
populations provide an increased
challenge to invest in the farm‐to‐
market system in rural areas which
may suggest new revenue options to be considered.
Census projections indicate the 10 fastest growing counties are within the boundaries of Metropolitan Planning
Areas including Cape Girardeau, Columbia, Kansas City, Springfield and St. Louis. Current growth patterns
indicate suburban areas and adjacent rural areas will be the primary locations of population increase. The MPOs
in Kansas City and St. Louis are adopting strategies to prioritize transportation system improvements that assist
with increasing population density in their regions. Regardless of the success of policies to increase population
densities, travel will still increase in urbanized areas, likely increasing traffic during peak travel times and
extending periods of recurring congestion.
7 McGuckin and Section 1909 Commission Staff, 2007
FIGURE 4‐4 – SOURCE: MISSOURI CENSUS DATA CENTER

A Citizen’s Guide to Missouri’s Transportation Future: Long Range Transportation Plan Update 30
4.1.4 Population Trends by MoDOT Districts
The continued concentration of population in more urban areas is clearly illustrated when reviewing census
projections associated with each of the seven MoDOT districts. MoDOT’s Northwest, Southeast, and St. Louis
Districts are projected to see a decline population percentage by 2030. The Central, Southwest, and Kansas City
Districts are expected to see population share increases ranging from one to two percent. Figure 4‐5 depicts the
percentage of the overall state population by MoDOT District in 2000 and projected percentage in 2030.
FIGURE 4‐5 – SOURCE: MISSOURI OFFICE OF ADMINISTRATION

A Citizen’s Guide to Missouri’s Transportation Future: Long Range Transportation Plan Update 31
4.2 Economics and Employment 4.2.1 Gross State Product Trend Is Steady
Missouri’s Gross State Product (GSP) has had a nominal growth rate of 3.2 percent over the past five years (2012
to 2016), with a chained or inflation‐adjusted growth rate, averaging 1.06 percent over the same period. The
GSP is defined as the total amount of dollars created by the state’s economy and is a primary measure of basic
wealth and reflection of business activity in the state.
FIGURE 4‐6 – SOURCE: MISSOURI ECONOMIC RESEARCH AND INFORMATION CENTER

A Citizen’s Guide to Missouri’s Transportation Future: Long Range Transportation Plan Update 32
The GSP’s tie to business activity is often a key component in the level of transportation activity in the state. The
generally weak economic conditions in the state beginning in 2007 and extending into 2012 correspond to
periods of slow or declining periods of VMT.
4.2.2 Fuel Prices Have Dropped and Remained Steady
Missouri had a wild ride with the price of fuel beginning in 2011 and extending through most of 2014. The 2011
to 2014 period saw the per gallon price for regular gas topping at $4 for brief periods in portions of the state,
fluctuating daily and remaining above $2.80 per gallon. Beginning in the fourth quarter of 2014, except for a
brief spike during the second quarter of 2015, the price per gallon for regular gas has steadied and averaged
around $2.35 per gallon during the last 30 months8. The return of lower fuel prices in 2014 spurred an increase
in travel with VMT growing by more than two percent in 2014 when compared to 2013. The pattern has
continued in 2015 when VMT increased by 1.43 percent over 2014, and in 2016 when VMT increased by 2.92
percent over 2015. Despite the rebound in VMT growth, fuel tax receipts remain lower than 2005.
8 U.S Energy Information Center, 2016
FIGURE 4‐7 – SOURCE: MISSOURI ECONOMIC RESEARCH AND INFORMATION CENTER
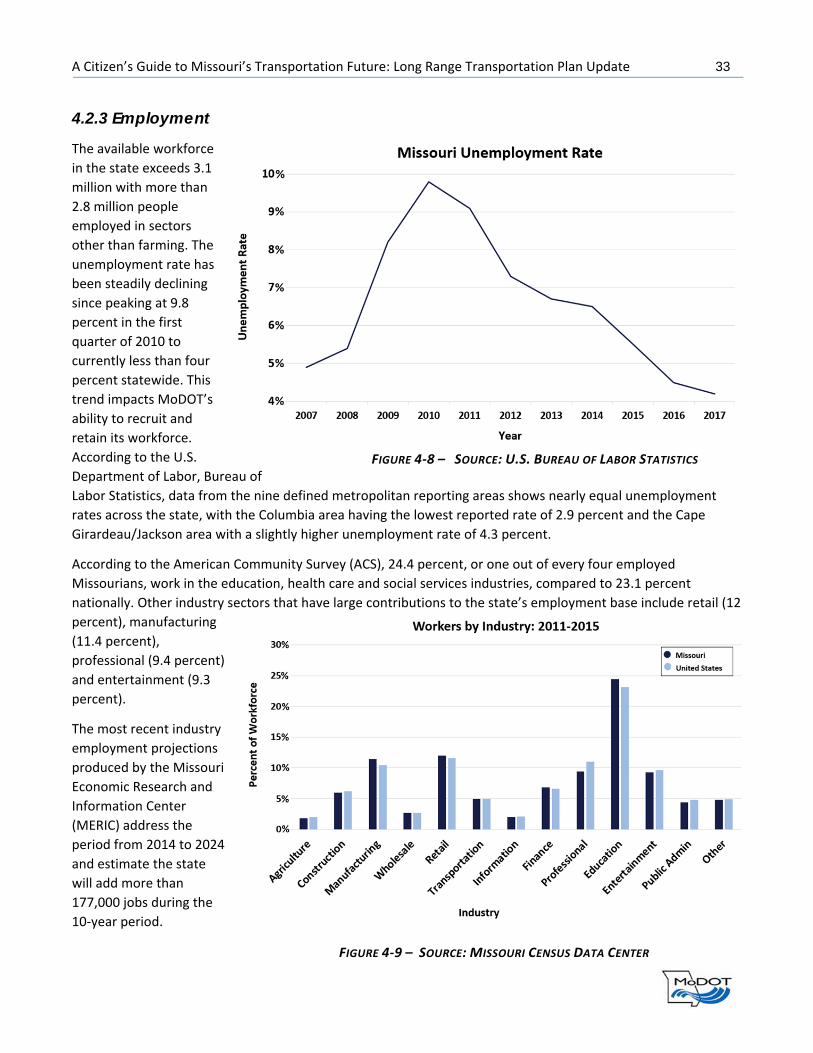
A Citizen’s Guide to Missouri’s Transportation Future: Long Range Transportation Plan Update 33
4.2.3 Employment
The available workforce
in the state exceeds 3.1
million with more than
2.8 million people
employed in sectors
other than farming. The
unemployment rate has
been steadily declining
since peaking at 9.8
percent in the first
quarter of 2010 to
currently less than four
percent statewide. This
trend impacts MoDOT’s
ability to recruit and
retain its workforce.
According to the U.S.
Department of Labor, Bureau of
Labor Statistics, data from the nine defined metropolitan reporting areas shows nearly equal unemployment
rates across the state, with the Columbia area having the lowest reported rate of 2.9 percent and the Cape
Girardeau/Jackson area with a slightly higher unemployment rate of 4.3 percent.
According to the American Community Survey (ACS), 24.4 percent, or one out of every four employed
Missourians, work in the education, health care and social services industries, compared to 23.1 percent
nationally. Other industry sectors that have large contributions to the state’s employment base include retail (12
percent), manufacturing
(11.4 percent),
professional (9.4 percent)
and entertainment (9.3
percent).
The most recent industry
employment projections
produced by the Missouri
Economic Research and
Information Center
(MERIC) address the
period from 2014 to 2024
and estimate the state
will add more than
177,000 jobs during the
10‐year period.
FIGURE 4‐8 – SOURCE: U.S. BUREAU OF LABOR STATISTICS
FIGURE 4‐9 – SOURCE: MISSOURI CENSUS DATA CENTER

A Citizen’s Guide to Missouri’s Transportation Future: Long Range Transportation Plan Update 34
The health care and social assistance sector, with a projected 56,919 added jobs, is the largest sector by number
of added employment opportunities. When combined with growth in the accommodation and food service
sector, two out of every five new employment opportunities will be generated by these two sectors. With many
of these positions often at an entry level, employee access to reliable transportation options will need to be
considered by transportation decision makers.
Figure 4‐10 illustrates the largest employment sectors in the state and anticipated employment changes over
the next 10 years.
FIGURE 4‐10 – SOURCE: MISSOURI ECONOMIC RESEARCH AND INFORMATION CENTER

A Citizen’s Guide to Missouri’s Transportation Future: Long Range Transportation Plan Update 35
4.2.4 Personal Income and Poverty Statistics
The real median income in Missouri was
reported at $50,238 in 2015, an increase
of 7.38 percent over the prior three
years. Real median income hit a peak in
2008 of $51,593 and hit a recent low of
$46,786 in 2012, before beginning to
recover over the past three years.
Purchasing power in 2015 was $1,355
below the 2008 peak.
According to the U.S. Census Bureau,
15.6 percent of the state’s population
lived below the poverty level at some
point during the previous 12 months.
For many in this category it becomes
increasingly difficult to get to and from a
job, or seek a prospective job, with
limited transportation choices. Low‐
income individuals are likely to have
only one or no vehicles available and
those in rural areas have limited public
transit options.
Outside the City of St. Louis, the
counties with the highest poverty rates
are all located in rural areas, primarily in
the extreme southeast and along the
southern border of the state.
FIGURE 4‐11 – SOURCE: MISSOURI COMMUNITY ACTION AGENCY

A Citizen’s Guide to Missouri’s Transportation Future: Long Range Transportation Plan Update 36
4.3 Freight and the Economy 4.3.1 Freight Projections
Missouri’s central location, highway system size and connectivity between all transportation modes are a top
strength for moving freight. More than 600 million tons of freight were shipped within, from, or to Missouri in
2011, with the number expected to top one billion by 2030. With 52 percent of Missouri’s economic output and
46 percent of the overall employment tied directly or indirectly to freight operations, a critical element of the
Long Range Transportation Plan should focus on keeping freight and the economy moving9.
4.3.2 Freight Movement by Mode
Freight movement is vital to the economic health of the state and continuing to build on the strengths of the
system and improving upon weaknesses are critical. It is important to maintain a vision for the future that
supports freight movement.
4.3.2.1 Truck Freight Truck movements account for 49 percent of the total freight tonnage and are forecasted to increase 55.5
percent by 2030. Non‐metallic minerals (21 percent, e.g. coal, salt, clay, aggregates), farm products (16 percent),
food or kindred products (11 percent); and secondary traffic (17 percent, e.g. mixed shipments containing
consumer goods) comprise 65 percent of the total tonnage moved by truck.
9 Missouri Freight Plan, 2014
FIGURE 4‐12 – SOURCE: MISSOURI FREIGHT PLAN

A Citizen’s Guide to Missouri’s Transportation Future: Long Range Transportation Plan Update 37
4.3.2.2 Freight Rail Freight rail moves 45 percent of the total freight tonnage through the state and is forecasted to increase 19
percent by 2030. Coal represents nearly half (48.9 percent) of the rail freight tonnage transported in the state.
Other commodities that contribute to the freight tonnage moved through the state include food and food‐
related products (7 percent), chemicals or similar products (8 percent), mixed shipments (8 percent) and farm
products (8 percent).
4.3.2.3 Ports and Waterways Missouri’s ports and waterways moved 49.9 million tons of freight in 2011 and usage is projected to increase
26.9 percent by 2030. Coal (25 percent), farm products (22 percent) and non‐metallic minerals (18 percent, e.g.
sand, rock, salt, or gravel) are the primary commodities moved on the waterways.
FIGURE 4‐13 – SOURCE: MISSOURI FREIGHT PLAN
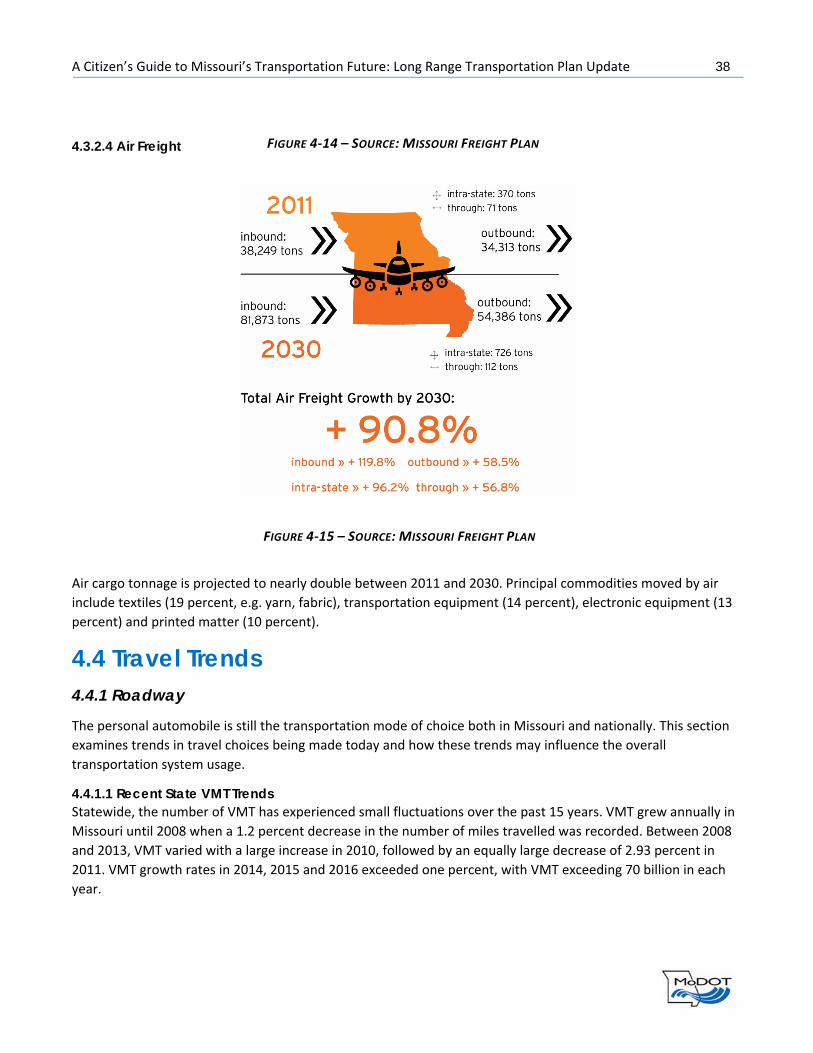
A Citizen’s Guide to Missouri’s Transportation Future: Long Range Transportation Plan Update 38
4.3.2.4 Air Freight
Air cargo tonnage is projected to nearly double between 2011 and 2030. Principal commodities moved by air
include textiles (19 percent, e.g. yarn, fabric), transportation equipment (14 percent), electronic equipment (13
percent) and printed matter (10 percent).
4.4 Travel Trends 4.4.1 Roadway
The personal automobile is still the transportation mode of choice both in Missouri and nationally. This section
examines trends in travel choices being made today and how these trends may influence the overall
transportation system usage.
4.4.1.1 Recent State VMT Trends Statewide, the number of VMT has experienced small fluctuations over the past 15 years. VMT grew annually in
Missouri until 2008 when a 1.2 percent decrease in the number of miles travelled was recorded. Between 2008
and 2013, VMT varied with a large increase in 2010, followed by an equally large decrease of 2.93 percent in
2011. VMT growth rates in 2014, 2015 and 2016 exceeded one percent, with VMT exceeding 70 billion in each
year.
FIGURE 4‐14 – SOURCE: MISSOURI FREIGHT PLAN
FIGURE 4‐15 – SOURCE: MISSOURI FREIGHT PLAN

A Citizen’s Guide to Missouri’s Transportation Future: Long Range Transportation Plan Update 39
4.4.1.2 Fuel Efficiency and Revenue Impact
The per‐gallon user tax on fuel is the state’s largest source of revenue. It is a flat rate, remaining at 17 cents
regardless of fuel price change, and is the fourth lowest in the nation10. The trend toward more fuel efficient or
all‐electric vehicles, when coupled with projections that Missouri VMT will likely continue to trend upward
through 204011, indicates there will be increased demand on Missouri’s system while less fuel tax is being
generated per mile traveled. This will have significant impact on the Missouri State Road Trust Fund as well as
the Federal Highway Trust Fund12.
Since 1975, National Corporate Average Fuel Economy (CAFE) standards have been established with the goal to
reduce energy consumption of cars and light duty trucks. Fuel efficiency standards continue to increase and, in
2012, the CAFE average was set at 54.5 miles‐per‐gallon (mpg) for new cars and light duty trucks produced by
model year 2025. As more fuel‐efficient vehicles are introduced into the rolling stock across the state, overall
fuel demand will likely decrease.
Additionally, the market for all‐electric vehicles continues to grow. As noted, some projections indicate that 35
percent of light‐duty car sales worldwide will be non‐gasoline vehicles by 204013. Many prominent automakers
have also made recent public commitments to produce more electric vehicles14, and transportation network
companies are increasingly looking to deploy electric autonomous vehicle fleets15. The potential exist for a
major shift toward fuel efficient vehicles if Operational Equipment Manufacturers (OEMs) can reduce pricing
significantly, such as with new battery technology.
10 21st Century Missouri Transportation System Task Force Report, January 2018 11 21st Century Missouri Transportation System Task Force Report, January 2018 12 21st Century Missouri Transportation System Task Force Report, January 2018 13 Bloomberg Finance, February 2016
14 21st Century Missouri Transportation System Task Force Report, January 2018 15 Lyft, June 2014
FIGURE 4‐16 – SOURCE: FHWA
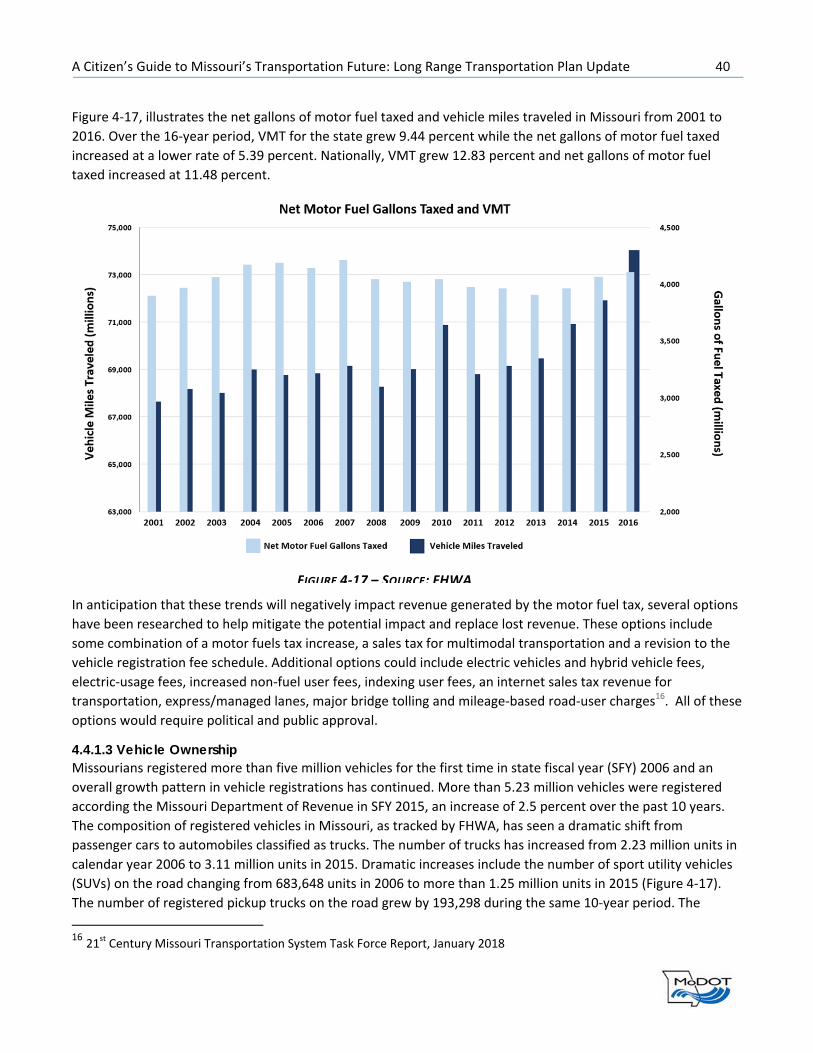
A Citizen’s Guide to Missouri’s Transportation Future: Long Range Transportation Plan Update 40
Figure 4‐17, illustrates the net gallons of motor fuel taxed and vehicle miles traveled in Missouri from 2001 to
2016. Over the 16‐year period, VMT for the state grew 9.44 percent while the net gallons of motor fuel taxed
increased at a lower rate of 5.39 percent. Nationally, VMT grew 12.83 percent and net gallons of motor fuel
taxed increased at 11.48 percent.
In anticipation that these trends will negatively impact revenue generated by the motor fuel tax, several options
have been researched to help mitigate the potential impact and replace lost revenue. These options include
some combination of a motor fuels tax increase, a sales tax for multimodal transportation and a revision to the
vehicle registration fee schedule. Additional options could include electric vehicles and hybrid vehicle fees,
electric‐usage fees, increased non‐fuel user fees, indexing user fees, an internet sales tax revenue for
transportation, express/managed lanes, major bridge tolling and mileage‐based road‐user charges16. All of these
options would require political and public approval.
4.4.1.3 Vehicle Ownership Missourians registered more than five million vehicles for the first time in state fiscal year (SFY) 2006 and an
overall growth pattern in vehicle registrations has continued. More than 5.23 million vehicles were registered
according the Missouri Department of Revenue in SFY 2015, an increase of 2.5 percent over the past 10 years.
The composition of registered vehicles in Missouri, as tracked by FHWA, has seen a dramatic shift from
passenger cars to automobiles classified as trucks. The number of trucks has increased from 2.23 million units in
calendar year 2006 to 3.11 million units in 2015. Dramatic increases include the number of sport utility vehicles
(SUVs) on the road changing from 683,648 units in 2006 to more than 1.25 million units in 2015 (Figure 4‐17).
The number of registered pickup trucks on the road grew by 193,298 during the same 10‐year period. The
16 21st Century Missouri Transportation System Task Force Report, January 2018
FIGURE 4‐17 – SOURCE: FHWA

A Citizen’s Guide to Missouri’s Transportation Future: Long Range Transportation Plan Update 41
increased percentage of vehicles classified as trucks more than offsets the reduction of the 453,672 registered
cars. The trend towards more registered pickup trucks and SUVs in the state has moderated the impact
increasing fuel efficiency had in reducing the gallons of taxed fuel sold in the state.
The use of car sharing services such as ZipCar and Enterprise Leasing CarShare, are gaining popularity. In 2014,
approximately 19,115 car share vehicles were in service across the United States, serving 996,000 members17.
Car sharing services are currently available at university campuses including the University of Missouri‐
Columbia, Stephens College, St. Louis University, Webster University, Washington University and Maryville
University along with general availability in larger metropolitan areas.
17 Transportation Sustainability Research Center, University of California, Berkeley
FIGURE 4‐18 – SOURCE: FHWA
Registered Vehicles in Missouri

A Citizen’s Guide to Missouri’s Transportation Future: Long Range Transportation Plan Update 42
4.4.1.4 Licensed Drivers In 2015, Missouri had more than 4.2 million licensed drivers, equaling 69 percent of the state’s total population
eligible to become a licensed operator. Younger citizens eligible to apply for and receive an operating permit are
obtaining licenses at a lower rate. As recently as 2006, 78 percent of those in the 16‐to‐24 age group had a
motor vehicle operating license. The trend for licensure in this age group has been steadily declining and, in
2015, 72.3 percent of the state’s residents in this age group had obtained an operating license. The trend does
not carry past the age of 25, when the percent of Missourians over 25 have obtained a driver’s license climbs to
85.6 percent. Figure 4‐18 shows the declining trend of 16‐to‐24‐year‐old Missouri residents who are licensed
motor vehicle operators.
FIGURE 4‐19 – SOURCE: FHWA

A Citizen’s Guide to Missouri’s Transportation Future: Long Range Transportation Plan Update 43
4.4.1.5 Commuting Patterns Personal vehicle travel is the
preferred commuting choice in
the state. Approximately 81.6
percent of those who commute
to work do so alone in a
personal vehicle, with another
9.3 percent using carpooling in a
personal vehicle. The percentage
of commuters traveling alone
has risen 1.1 percent between
2000 and 2010 and increased by
0.2 percent since 2011.
The percentage of Missourians
who work from home increased
to 4.4 percent, up slightly from
4.2 percent in 2011 and nearly
one percentage point from
2000. This increase is likely tied
to improved communication
technologies and advances in
decentralized computing.
Other commuting modes, including walking and use of public transit, have held steady over the past 15 years.
Two percent of commuters reported they walked to work and 1.5 percent use public transit. The number of
commuters who cycle to work has increased from 0.1 percent to 0.26 percent from 2000 to 2015.
Compared to national trends, Missourians commute alone at a rate of more than five percent above the
national average and commute by public transit at a rate of 3.6 percent less than the national average.
Regardless of travel mode, Missourians average 23.2 minutes of travel time to work.
4.4.2 Public Transit
Less than two percent of Missourians use public transit for commuting compared to the national average of five
percent. A well‐functioning public transit system is vital to those who do not have an automobile and rely on
public transportation to get to work, school, shopping, or other locations. The latest American Community
Survey (ACS) data for Missouri reported 7.4 percent of the households in the state have no automobile available.
After averaging more than 60 million transit passengers statewide from 2012 to 2015, ridership on the public
transit systems in Missouri reached 62.5 million in 2017. The popularity of the streetcar returning to Kansas City,
as evidenced by more than one million riders served in the first six months of 2017 and potential for system
expansion, could boost transit ridership.
The increasing population in urbanized areas, added number of citizens over 65 years of age and desire of
younger travelers to have transportation options, are indicators that ridership demand could increase for public
transit and/or AV/CV options.
FIGURE 4‐20 – SOURCE: MISSOURI CENSUS DATA CENTER
A Citizen’s Guide to Missouri’s Transportation Future: Long Range Transportation Plan Update 44
4.4.3 Passenger Rail
Beginning in 2007, passenger rail ridership across the state was on a steady continuous increase and peaked
with 197,000 trips provided on Missouri sponsored trains in 2013. The number of passengers has been trending
downward and 172,000 trips were taken on Missouri‐sponsored trains in 2016, likely due to lower fuel prices.
Although on‐time performance has improved and other amenities such as Wi‐Fi have been added, ongoing track
work has impacted passenger rail ridership.
4.4.4 Air Travel
Missouri has 505 aviation facilities, of which 122 are publicly owned. According to the Bureau of Transportation
Statistics, air travel in Missouri has remained steady with approximately 12.8 million passengers in 2016 and an
average of 11.7 million passengers over the past five years. St. Louis Lambert International Airport (STL) was the
32nd busiest airport in the United States in 2016 with just under 6.5 million enplaned passengers, followed
closely by Kansas City International Airport (MCI) as the 38th busiest airport with slightly more than five million
enplaned passengers. The Springfield‐Branson National Airport (SGF) is the third busiest airport in the state and,
in 2016, enplaned 950,000 passengers. All three of the major airports in the state are designated as Foreign
Trade Zones to facilitate international trade.
Missouri has four commercial airports designated by the FAA as Essential Air Service, located in Cape Girardeau
(CGI), Ft. Leonard Wood (TBN), Joplin (JLN) and Kirksville (IRK). The Essential Air Service designation provides
federal subsidies to certified air carriers maintaining a minimal level of passenger flight service. While these four
locations serve fewer passengers than other airports in the state, alterations in the federal program supporting
Essential Air Service could result in users at these locations using automobile travel to access air service.
4.5 Transportation Implications Emerging trends including an aging population, increasing urbanization, a younger population, the sharing
economy and advanced technology may combine in ways that significantly alter transportation needs. The
configuration and location of highway system capacity and investment to develop and maintain all kinds of
infrastructure to adopt advancing technologies are likely to require evaluation of investment priorities.
Continuing trends including an anticipated 55 percent growth in truck freight between 2011 and 203018,
commuters overwhelmingly preferring to drive alone in private automobiles to and from work, and increasing
VMT provided fuel prices remain at or near existing rates, will continue to be the most significant influencing
factors on the use of the transportation system. Key additions to address highway safety, system capacity,
addressing freight system bottlenecks that tie up goods movement and maintaining or improving the condition
of the existing infrastructure will continue to drive the evaluation of investment priorities for the near term.
18 Missouri Freight Plan, 2014

A Citizen’s Guide to Missouri’s Transportation Future: Long Range Transportation Plan Update 45
SECTION 5: AUTONOMOUS AND CONNECTED VEHICLE TECHNOLOGY While the introduction of AV/CV promises massive safety, economic and social benefits, the institutional
challenges cannot be ignored. Addressing liability concerns, infrastructure readiness and policy form the core of
this responsibility, but there are also substantial needs in planning, infrastructure funding and maintenance to
consider. As people and goods move and interact with infrastructure in new ways, policy makers need tools to
facilitate the safe and efficient incorporation of AV/CV technology. Future requirements of the transportation
system require a clear understanding of what services are currently available, what will be required in the future
and the timeframe associated with those requirements.
This section presents a snapshot of the current state of the practice in AV/CV and provides a series of
appendices detailing information. Appendix A provides a summary of key resources that support state decision
making with respect to AV/CV planning. Appendix B provides definitions of common terms used throughout.
This section also provides a general overview of ongoing and announced activities undertaken by the federal
government, state departments of transportation (DOT), private automobile manufacturers and technology
companies. In addition, this section discusses crucial issues MoDOT needs to be cognizant of, related to
implementation and deployment of these emerging technologies. This document is not intended to be an
exhaustive review of these activities and efforts, but rather provides the context for long range planning.
Detailed appendices provide additional supporting materials. This document is presented as a companion effort
to the LRTP update, addressing concerns related to the uncertain future of transportation technology.
5.1 Uncertainty in Adoption and Resulting Influences For decades, the U.S. Department of Transportation (USDOT), private companies, intelligent transportation
system (ITS) equipment providers, academic institutions and automobile manufacturers have researched and
tested vehicles that sense the environment around them in order to operate independently and/or
communicate directly with other vehicles and with infrastructure to enhance automation and connectivity. This
research promises technology that can fundamentally alter mobility of people and goods. These changes are
already altering the operational characteristics of transportation and improving safety and operations.
The overall impact and implementation timeframe of AV/CV technology on Missouri’s transportation system
and communities is uncertain. However, what is known is that the technological changes are likely to happen
faster than the ability of government to react to them, making it imperative that planning for those changes
start now.

A Citizen’s Guide to Missouri’s Transportation Future: Long Range Transportation Plan Update 46
To provide a consistent framework for discussing vehicle automation, the Society of Automotive Engineers (SAE)
established a six‐level classification system for automation, scored on a scale from 0 to 5 and shown in detail in
the text callout box.
Many of today’s production vehicles are capable of driver
assistance (Level 1), typically through the use of adaptive
cruise control to adjust speed based on following distance.
A small number of vehicles also incorporate an active lane‐
keeping assist feature in a way that makes them capable of
partial automation (Level 2). Notwithstanding the potential
for and reality of driver distraction, both of these levels
assume that the human driver continues to actively
monitor the driving environment.
The introduction of conventional cars and trucks capable of
operating without this active monitoring will represent a
significant technical and conceptual leap. This threshold
between partial automation (Level 2) and conditional
automation (Level 3) corresponds to the line that several
U.S. states have drawn between non‐automated and
automated vehicles. Because of its assumption that the
human driver will resume actively driving shortly after
being prompted to do so, conditional automation raises
particularly difficult issues of human‐machine interaction
that have not been satisfactorily resolved.
Levels 4 and 5 may operate on the basis of inputs solely
from vehicle‐embarked sensors (self‐sensing) or via a
combination of self‐sensor input and inputs from sensors
embarked on other vehicles and infrastructure that are
communicated to the vehicle in near real‐time. The
connected vehicle and connected infrastructure approach
requires available data transmission frequencies, low‐
latency, trusted, secure and fail‐safe data transmission
protocols and harmonized data syntax that ensure safe
interoperability.
While the SAE framework provides some clarity on levels of
automation, it does not address all the terms in popular use
by the media and the public, such as “self‐driving” or
“driverless.”
SAE Levels of Automation
Level 0 – No Automation: The full‐time performance by the human driver of all aspects of the dynamic driving task, even when enhanced by warning or intervention systems
Level 1 – Driver Assistance: The driving mode‐specific execution by a driver assistance system of either steering or acceleration/deceleration using information about the driving environment and with the expectation that the human driver performs all remaining aspects of the dynamic driving task
Level 2 – Partial Automation: The driving mode‐specific execution by one or more driver assistance systems of both steering and acceleration/deceleration using information about the driving environment and with the expectation that the human driver performs all remaining aspects of the dynamic driving task
Level 3 – Conditional Automation: The driving mode‐specific performance by an automated driving system of all aspects of the dynamic driving task with the expectation that the human driver will respond appropriately to a request to intervene
Level 4 – High Automation: The driving mode‐specific performance by an automated driving system of all aspects of the dynamic driving task, even if a human driver does not respond appropriately to a request to intervene
Level 5 – Full Automation: The full‐time performance by an automated driving system of all aspects of the dynamic driving task under all roadway and environmental conditions that can be managed by a human driver
A Citizen’s Guide to Missouri’s Transportation Future: Long Range Transportation Plan Update 47
5.2 Current Industry Activities This section includes detailed information about a variety of manufacturers and companies working in the
AV/CV industry. This section provides a general industry orientation and provides some structure to differentiate
original equipment manufacturers (OEMs) and aftermarket solutions. The industry is particularly dynamic as
new entrants emerge and older ones advance or are surpassed.
A particularly dynamic environment exists in the industry related to connectivity and automation. Dozens of
acquisitions, announcements, projections and partnerships have emerged. This section provides recent
information on the published announcements of manufacturers, forward‐looking product information and a
sampling of acquisitions and partnership arrangements and is limited to applications in personal and commercial
vehicles.
A summary of the current status of the industry is noted below; see Appendix C for individual manufacturer
details and announcements.
► All major automobile manufacturers have embraced advanced driver assistance systems. Lane departure
warnings, adaptive cruise control, lane centering, automatic braking, parking assistance, blind spot
monitoring and other driver assistance systems are becoming standard packages on nearly all makes and
models.
► Not all major manufacturers are bullish on automation, but most are. Ford, General Motors, Tesla, Nissan,
Honda, Toyota and others have embraced automation. Ford has even announced its long‐term focus to
become a mobility provider, as opposed to simply a vehicle manufacturer. Porsche, Ferrari and Bentley
executives have embraced advanced driver assistance systems but denounced a move to automation.
► Timelines vary, but Renault‐Nissan, Ford, Chevrolet, Fiat Chrysler, Volkswagen, Honda, Toyota, Volvo and
others anticipate releasing highly automated vehicles before 2025. 2020‐2021 seems to be a regularly
reported target, but some activities may be more aggressive based on testing and market
adoption/demands.
► The influence of non‐traditional actors, including but not limited to Tesla, Waymo, Baidu, Apple and other
smaller firms pushes the market. Bold proclamations and announcements are pushing the industry forward.
Companies have announced aggressive timelines, moved forward with tentative testing plans and approvals
and skirted hastily passed policies and legislation.
► The industry is dynamic as consolidations, partnerships, acquisitions and startups regularly enter
discussions. Ford purchased startup firm Drive.ai. General Motors acquired Cruise Automation and
pronounced a self‐driving vehicle in short order. Toyota invested heavily in light detection and ranging
(LiDAR) capabilities and launched a research institute and capital fund for new vehicle technologies.
Motorola, AT&T, Nokia, NVDIA and other communications providers have developed partnerships for
vehicle connectivity and platforms for automation.
For the purposes of this discussion, this section is divided into two primary subsections—traditional
manufacturers that provide vehicles and non‐traditional entrants that provide add‐on equipment, functionality,
sensors, cameras, software and other elements that enable AV/CV technologies. The latter group is broad and
includes communications services, infrastructure developers, fleet operators, commercial vehicle applications
A Citizen’s Guide to Missouri’s Transportation Future: Long Range Transportation Plan Update 48
(including platooning), shared mobility services providers and consulting firms.
5.2.1 Manufacturers
Automobile manufacturers provide marketable vehicles to the driving public. They have established distribution
channels, dealership networks and service programs. Brand loyalty, financing terms and other incentives provide
exposure and market dominance. Manufacturers have a tremendous lead and a large incentive to maintain
market dominance. Much has been written about the potential demise of traditional automobile sales models,
personal ownership and production cycles. In many cases, this has included predictions that the “Big 3”
(Chrysler, General Motors and Ford) and their Japanese and European counterparts would be relegated to an
industrial graveyard by failing to adapt to emerging technologies. These large companies, however, all have
autonomous research initiatives and, in some cases, are rebranding themselves. It should be noted that new
focus on changing power sources could disrupt sales more than automation. Continuing pressure to develop
alternative fuel sources, including electric and biofuels, could have a larger impact on vehicle production than
AV/CV technologies.
Commercial vehicles remain a likely area for initial and early implementation. Labor costs, driver shortages and
overall efficiencies related to hours of service limitations, encourage development of commercial vehicle
applications. These demands are for both private yard operations and long haul operations.
Many manufacturers already offer advanced driver assistance systems that allow automated driving to a limited
extent and others will soon follow. These advanced driver assistance systems include lane‐departure warnings,
automated braking, adaptive cruise control and other features designed to augment controlled driving.
5.2.1.1 Automated Shuttles Several companies have begun to produce automated shuttles. These vehicles typically operate in low‐speed
environments on defined corridors. Minnesota recently selected technologies by EasyMile, a French company
specializing in driverless technology, for testing. EasyMile’s Transdev EZ10 driverless shuttle was also recently
tested in Atlanta, Georgia and demonstrated at the New Orleans Convention Center in Louisiana. A six‐month
lease deployment is also underway in Arlington, Texas, near the Dallas Cowboys and Texas Rangers stadiums.
Navya Technologies is a two‐year‐old company based in Lyon, France. Navya announced plans to build an
assembly plant in Ann Arbor, Michigan, where it hopes to build 20 vehicles by the end of 2017. Navya is
currently being tested in two dozen college and university campus environments and recently was used in Las
Vegas, Nevada. (A small incident with a commercial truck, caused by a human driver error, is under investigation
with the National Transportation Safety Board.)
5.2.2 Non-traditional Entrants
Several technology companies are exploring production and operation of driverless vehicles, including Waymo
(formerly Google/Alphabet), Apple and Baidu. Almotive and Nauto also provide technology platforms to support
automated and self‐driving vehicles.
There are many firms that are critical participants, including Intel, NVIDIA, Panasonic, Cruise Automation and
others too numerous to name.
One of the emerging areas for planning and preparedness are shifts in vehicle ownership and mobility. Vehicle
automation is likely to encourage the development of automated taxi services and large fleets. Lyft, Uber,
nuTonomy and others are exploring this platform. Fractional ownerships, subscriptions services, mobility as a

A Citizen’s Guide to Missouri’s Transportation Future: Long Range Transportation Plan Update 49
service (MaaS) and other models may emerge.
In addition to the independent entrants to the AV/CV market, dozens of partnerships have developed as
companies vie for market share and emerging technologies. Hundreds of millions of dollars have been invested
by major vehicle manufacturers in technology companies such as Cruise Automation, Argo AI, Mobileye, Intel
and Mobvoi, to name just a few. In addition, manufacturers are establishing partnerships with companies such
as Lyft and Uber to cover the service side of the market.
5.3 Federal Efforts 5.3.1 Legislation
The U.S. Senate Committee on Commerce, Science and Transportation recently approved the American Vision
for Safer Transportation through Advancement of Revolutionary Technologies (AV START) Act. The AV START Act
follows similar legislation that was passed by the House: The Safely Ensuring Lives Future Development and
Research in Vehicle Evolution (SELF DRIVE) Act (H.R. 3388). The two legislative proposals have comparable
objectives and structures. Both are intended to preserve the existing regulatory approach to vehicle safety while
making modest changes to accommodate the new technologies. The basic mechanism under both proposals for
promoting AV in the short‐term is to allow the National Highway Traffic Safety Administration (NHTSA) to issue
an increasing number of “exemptions” from existing federal motor vehicle safety standards. The AV START Act
would allow exemptions for up to 15,000 self‐driving cars in the first year of the law, 40,000 in the second year
and 80,000 per year thereafter. Both the Senate and House bills would facilitate AV testing by allowing
automakers and developers of automated driving systems to conduct testing.
Both legislative proposals recognize that longer term regulatory changes are needed, and that more information
will be needed to adopt appropriate longer‐term rules. The AV START Act instructs the director of the USDOT’s
Volpe Center to study areas where existing safety standards may conflict with AV technologies and to propose
changes to be addressed in subsequent rulemaking. The AV START Act also creates two advisory committees:
The Highly Automated Vehicles Technical Committee and the Highly Automated Vehicles Data Access Advisory
Committee. These committees will study and make recommendations on performance standards and data
access and sharing. The Act further creates a Consumer Education Working Group to identify strategies to
educate consumers on automated driving systems.
An important and high‐profile issue addressed by both legislative proposals is the allocation of regulatory
responsibility between federal and state governments. The existing regulatory structure is preserved, with the
federal government responsible for vehicle design and the states responsible for driver and vehicle licensing. But
the distinction between vehicle and driver can be blurred with AV. To avoid a patchwork of state regulations of
AV, both legislative proposals would expressly preempt state legislative and regulatory activity in certain areas
related to AV development and deployment. Under the Senate’s AV START Act, state legislation and regulation
are broadly preempted as they relate to AV in the areas of system safety, data recording, cyber security, human‐
machine interface, crashworthiness, the capabilities of automated vehicles or systems, post‐crash behavior, the
programming of vehicles to meet existing traffic laws and automation function. Like the SELF DRIVE Act, the AV
START Act also preserves the existing rule that compliance with a federal safety standard does not exempt a
person from common law liability under state law.

A Citizen’s Guide to Missouri’s Transportation Future: Long Range Transportation Plan Update 50
5.3.2 USDOT ITS JPO Research
The USDOT Intelligent Transportation Systems Joint Project Office (ITS JPO) is conducting significant research in
the area of AV/CV. AV research includes development of AV policy plans, review of federal motor vehicle safety
standards, the impacts of AV/CV technology on insurance and liability, analysis of current state and local
legislation concerning AV/CV technology, safety analysis of implementation and many other highly technical
studies concerning the integration of AV/CV technologies into the national transportation system. Further
information is also available at the CV program website.
NHTSA’s A Vision for Safety replaces the Federal Automated Vehicle Policy released in 2016. This updated policy
framework offers a path forward for the safe deployment of automated vehicles by:
► Encouraging new entrants and ideas that deliver safer vehicles
► Making Department regulatory processes more nimble to help match the pace of private sector innovation
► Supporting industry innovation and encouraging open communication with the public and with stakeholders
Some key aspects of the new version include:
► NHTSA reaffirmed its enforcement authority concerning safety‐related defects in motor vehicles and their
equipment extends and applies equally to current and emerging advanced driver systems
► The guidance is voluntary, with no compliance requirement or new enforcement mechanism
► The focus remains on SAE Levels 3 through 5
► Companies are encouraged to design their systems following established best practices for cyber vehicle
physical systems (while vehicle cyber security is one of the 12 design elements, the guidance does not
include privacy as an element)
► NHTSA encourages use of “voluntary safety self‐assessments” prior to testing and deployment, but there is
no requirement
► NHTSA does not encourage the states to codify this guidance and seeks to delineate the traditional
regulatory roles of NHTSA (i.e., regulating motor vehicles and their equipment) and the states (i.e.,
regulating the human driver and most aspects of motor vehicle operation)
The new guidance clarifies that federal approval is not needed for safety assessment.
5.3.2.1 Connected Vehicle Pilot Program On September 1, 2016, the USDOT awarded three cooperative agreements collectively worth more than $45
million to initiate a design/build/test phase of the Connected Vehicle Pilot Deployment Program in three sites:
Wyoming, New York City and Tampa, Florida. Sponsored by the USDOT ITS JPO, the CV Pilot Deployment
Program is a national effort to deploy, test and operationalize cutting‐edge mobile and roadside technologies
and enable multiple CV applications. These innovative technologies and applications have the potential for
immediate beneficial impacts. The technologies are designed to save lives, improve personal mobility, enhance
economic productivity, reduce environmental impacts and transform public agency operations. Over the past 12
months, each site has prepared a comprehensive deployment concept to ensure a rapid and efficient CV
capability roll‐out. Now the three sites will embark on a new 20‐month phase to design, build and test the
nation's most complex and extensive deployment of integrated wireless in‐vehicle, mobile device and roadside
technologies.

A Citizen’s Guide to Missouri’s Transportation Future: Long Range Transportation Plan Update 51
Wyoming
The Wyoming CV pilot will use dedicated short‐range communications (DSRC) based applications that leverage
vehicle‐to‐vehicle (V2V) and vehicle‐to‐infrastructure (V2I) connectivity to support a flexible range of services
such as advisories, roadside alerts and dynamic travel guidance for freight and passenger travel.
New York City
The New York City pilot aims to improve the safety of travelers and pedestrians in the city through the
deployment of CV technologies. This objective directly aligns with the city’s Vision Zero initiative, which began in
2014 to reduce the number of fatalities and injuries resulting from traffic crashes. Led by the New York City DOT,
the pilot aims to reduce crash frequency and severity, manage vehicle speeds (to the regulatory limit) and
evaluate the benefits of deploying CV technology in a dense urban environment with frequent interactions
among the participating vehicles.
Tampa
The Tampa pilot aims to transform the experience of automobile drivers, transit riders and pedestrians in
downtown Tampa by preventing crashes, enhancing traffic flow, improving transit trip times and reducing
greenhouse gas emissions. The Tampa pilot will equip buses, streetcars and privately owned vehicles with CV
technology, which will enable them to communicate vital information with each other and transportation
infrastructure elements. Pedestrians will also participate by downloading and using a smartphone app.
5.3.2.2 Automated Vehicle Proving Grounds The USDOT designated 10 automated vehicle proving grounds in January 2017. The designations are designed to
encourage the testing of new automated vehicle technologies in a variety of settings and contexts. The proving
grounds are:
► City of Pittsburgh and the Thomas D. Larson Pennsylvania Transportation Institute
► Texas AV Proving Grounds Partnership (Texas Transportation Institute)
► U.S. Army Aberdeen Test Center in Maryland
► American Center for Mobility at Willow Run in Michigan
► Contra Costa Transportation Authority and GoMentum Station in California
► San Diego Association of Governments
► Iowa City Area Development Group
► University of Wisconsin‐Madison
► Central Florida Automated Vehicle Partners
► North Carolina Turnpike Authority
To date, the proving grounds have seen limited activity. The American Center for Mobility and the City of
Pittsburgh has hosted several demonstrations and on‐the‐road testing. Other facilities also provide a variety of
testing services. The designations create a “community of practice” around safe testing and deployment.

A Citizen’s Guide to Missouri’s Transportation Future: Long Range Transportation Plan Update 52
5.4 State Activities Realizing that autonomous technology is fast approaching, many states have enacted legislation, policies or
codified practices with respect to preparing for AV/CV. Some have been identified as lead states, including
California, Michigan, Florida and Nevada, but many others also have passed legislation or initiated organizational
practices to begin work in this field.
Since 2012, 41 states and Washington, D.C., have considered autonomous vehicle legislation, according to the
National Conference of State Legislatures (NCSL). Twenty‐one have passed laws and governors in three states
have issued executive orders regarding autonomous vehicles. The status of current legislative activity is shown
in Figure 5‐1 below:
FIGURE 5‐1: AV/CV LEGISLATIVE SUMMARY (SOURCE: NCSL)
In addition to legislative action, many states have ongoing research and deployment interests in AV/CV
technology. Much of this activity involves steering committees, pilot programs, definitions and oversight groups.
In general, the activities include the following:
► Establishing the definition of “autonomous” as it relates to vehicles operating on the transportation network
► Allowing or supporting the testing of AV on state highways with the associated testing requirements
► Addressing the liability associated with testing and insurance limits for testers
► Establishing pilot programs for testing specific AV/CV technologies
► Encouraging operations of driverless vehicles on highways and urban routes
Further detail of individual state activities can be seen in Appendix E.
Enacted
Executive Order
States with Enacted Autonomous Vehicle Legislation

A Citizen’s Guide to Missouri’s Transportation Future: Long Range Transportation Plan Update 53
5.4.1 Smart Belt Coalition
Several states have realized both the complexity of the AV/CV technology and the need to make these
technologies seamless across the country. PennDOT, Pennsylvania Turnpike, Ohio DOT, the Ohio Turnpike and
Michigan DOT jointly formed the Smart Belt Coalition—a collaboration with transportation agencies and
universities in Pennsylvania, Ohio and Michigan to focus on AV/CV initiatives. The coalition brings together
leaders on these technologies to support research, testing, policy, funding pursuits and deployment, as well as
to share data and provide unique opportunities for private‐sector testers. The partnership will also allow the
states to share research and resources, allowing the region to be more competitive with other parts of the
country when trying to attract investment and jobs in the emerging industry.
5.4.2 AASHTO
The American Association of State Highway and Transportation Officials (AASHTO), a national association of
state level highway and transportation departments, has considered emerging AV/CV technologies under a
variety of efforts during the past two decades. The AASHTO Footprint Analysis and the Connected Vehicle
Reference Implementation Architecture (CVRIA) are two primary activities. The footprint was developed by
AASHTO in partnership with the USDOT and Transport Canada to set a policy foundation for CV environments
and guide the process towards the following set of desired outcomes:
► Clear description of the value of and justification for deployment for the public, as well as key state and local
planners and transportation decision makers
► Compilation of possible needs of priority applications (data, communications, infrastructure, etc.)
► Generic development concepts that connect potential applications and operating conditions to required
infrastructure
► State and local funding strategies and implementation scenarios that are harmonized with national policy, as
it is developed
► Timelines and activities for deploying infrastructure across state and local agencies
► Cost estimates for development, operations and maintenance
► Estimated requirements for workforce training and the development of policy and guidance
► Implementation challenges and noted institutional issues that may create difficulties for successful
implementation
The CVRIA is also a rich source of existing stakeholder input and deployment information. The CVRIA provides a
framework from which all of the potential CV applications and interfaces can be identified and analyzed as
potential candidates for further standardization. The availability of so much data and information brings new
players into the auto‐mobility space, fundamentally changing the landscape. Wireless carriers, insurers, ride‐
sharing platforms, municipalities and others capturing drive data now think about their business differently.
AASHTO’s Committee on Transportation System Operations (CTSO) activities have also included the
development of the Signal Phasing and Timing (SPaT) Challenge, which seeks to deploy DSRC infrastructure with
SPaT broadcast in at least one corridor (approximately 20 signalized intersections) in each of the 50 states by
January 2020.

A Citizen’s Guide to Missouri’s Transportation Future: Long Range Transportation Plan Update 54
5.5 Emerging Research and Other Issues Several national and international research studies have been conducted in the past decade. These studies
provide a number of important lessons and key opportunities for knowledge transfer. The largest state‐
sponsored program is offered through the National Cooperative Highway Research Program (NCHRP) Project 20‐
102, which establishes an open‐ended series of research and outreach endeavors related to state and local
efforts in AV/CV adoption. A research roadmap was adopted in 2014 to guide the project selection and
performance. The roadmap focuses on seven key initiatives for AV/CV readiness:
► Structure and Organization ► Political Leadership Engagement ► Changes to Laws and Motor Vehicle Codes ► Long Range Transportation Plans ► Mobility and Access Improvements ► Pilot Projects and Research ► Outreach/In‐Reach Strategy
To date, the following efforts have been initiated or completed under NCHRP Project 20‐102:
► Strategic communications plan for NCHRP Project 20‐102. Develops a strategic plan to communicate efforts
underway.
► Policy and planning actions to internalize societal impacts of AV/CV systems into market decisions. Identifies
challenges to market‐based deployment of AV/CV systems and evaluates possible policy/planning actions to
address this.
► Impacts of regulations and policies on AV/CV technology introduction in transit operations. Develops a primer
on regulatory and policy landscape of transit system planning, development, funding and operations to identify
where policy changes are necessary to accommodate AV/CV.
► Challenges to AV/CV application in truck freight operations. Identifies key issues and challenges in the
regulatory, policy and operations landscape of freight system operations and where policy strategies are
necessary to accommodate AV.
► Road markings for machine vision. Investigates the correlations between machine vision performance and
pavement markings. Factors to be considered include pavement marking presence, contrast, retro‐reflectivity,
uniformity and vehicle speed.
► Implications of automation for motor vehicle codes. Develops recommendations for harmonizing motor vehicle
laws and regulations related to AV/CV.
► Dedicating lanes for priority or exclusive use by AV/CV. Develops guidance on the conditions that appear to be
amenable to dedicating lanes for AV/CV users and what policy actions are needed.
► Providing support to the introduction of AV/CV impacts into regional transportation planning and modeling
tools. Provides support to state DOTs and MPOs in the form of guidelines and information related to updates
needed in their modeling and forecasting tools to account for impacts of AV/CV.
► Roadway classifications. Builds upon the road classification system developed by Colorado DOT and expands its
potential for use nationally.

A Citizen’s Guide to Missouri’s Transportation Future: Long Range Transportation Plan Update 55
5.5.1 Preparation and Planning Efforts
Perhaps the primary area where government and the public sector can provide influence is in the preparation
and planning efforts to accommodate emerging vehicle technologies. Cities are already experimenting with new
policies, programs and partnerships to address the rise of shared mobility. States have different levels of
responsibility. This section provides an overview of several emerging issues in preparation and planning, with
some discussion necessary between state, local, MPOs and the private sector.
Regardless of government level, planners and engineers need enhanced knowledge, training, skills and
adaptable tools to meet the expectations of the general public and provide stewardship for the public’s
transportation assets.
There are several recommendations emerging from prior studies, many of which offer a basic roadmap to AV/CV
policy. There are transit impacts, as well as infrastructure considerations. Studies have clearly identified several
planning priorities for policymakers to consider. In no particular order, they include:
► Establish a steering committee. To provide some focal point, states should identify a task group of key state
leaders, including representatives from the planning, operations, design, freight, enforcement, licensing,
revenue and safety disciplines. Many states have adopted these committee formats to begin to structure
their responses to changes in vehicle technologies.
► Monitor ongoing activities and developments. The dynamic nature of the industry, as evidenced by the
rapid and frequent announcements of advances in the manufacturing and software development, coupled
with pilot activities, requires states to remain informed. Consider participation in national and regional
activities, including ITS America, Transportation Research Board activities and automotive manufacturer
associations.
► Consider implementing congestion pricing. To ensure that AV/CV use supports public objectives and
provides mechanisms to reduce congestion, some officials may consider a dynamic road pricing plan that
varies by origin, destination, number of passengers, congestion and household income. This can be done
through a combination of proven policy tools such as congestion pricing, zone pricing, variable tolls and
vehicle miles traveled fees.
► Leverage technology to enhance mobility. Cities and states should work with transit agencies and private
companies to adopt smartcards, open data and universal apps to allow riders to compare, book and pay for
trips that combine buses, trains, bikes and ride‐sharing vehicles. This will match customers with the most
efficient travel choices and determine a clear cost of mobility.
► Prioritize and modernize modern transit. Many believe that the role of transit will evolve as AVs and shared
mobility become increasingly widespread. Transit agencies, and the states that support them, could focus on
high‐frequency, high‐capacity services in dense urban corridors (such as rail, bus rapid transit), provide first‐
and last‐mile connections through driverless shuttles and expand kiss‐and‐rides/mobility hubs. These
approaches combine existing providers with emerging market players.
► Plan for mixed‐use, car‐light neighborhoods and connections. AVs have the potential to unlock demand for
living and working in mixed‐use neighborhoods in both urban and suburban settings. They also could
provide opportunities for changes to traditional lane widths, curve radii, sightlines/clear zones and signage
requirements. State policies will help shape this, but many cities may need to adopt new approaches to
zoning requirements and local traffic control. To shape this demand, cities might need to plan for and
incentivize mixed‐use development, overhaul parking requirements and reevaluate new public transit
projects.

A Citizen’s Guide to Missouri’s Transportation Future: Long Range Transportation Plan Update 56
► Encourage adaptable parking. Less demand for parking means fewer parking spaces, especially in city
centers and along main corridors. Parking garages could be designed with housing or office conversion and
include level floors, higher ceiling heights and centralized ramps. On‐street parking could be removed to
allow additional travel lanes or incorporate drop off zones.
5.5.2 Market Adoption/Penetration Studies and Research
The public acceptance of AV/CV technology changes rapidly and varies substantially across different regions of
the U.S. This section discusses some of the primary market adoption studies to date.
Morgan Stanley (2016) declared complete autonomous capability should be expected on the market by 2022,
followed by massive market penetration as soon as 2026, with the vehicles we know today entirely extinct in
another 20 years (one fleet generation). This analysis is exceedingly uncertain, with others expressing much
longer timeframes (see Litman 2016, Row 2015, Simonite 2016). But regardless of expected adoption horizons,
transportation agencies need to pay close attention to rapidly evolving technologies to account for potential
changes in activity and land use in modeling and traffic analysis, to stage certain infrastructure investments, to
understand how regulations such as on‐site parking requirements and access points can and will be altered and
to facilitate adoption of new technologies through strategic investments.
Numerous studies and surveys indicate the disparity of current opinions on the use of AV/CV technology. In
general, the major concerns seem to be in the areas of safety and cyber security. One survey found that more
than half of U.S. drivers feel less safe about sharing the road with a self‐driving vehicle (Automobile Alliance of
America 2016). By comparing the cost of owning a car to the cost of using a ride‐sourcing vehicle, such as Uber
or Lyft, this study was able to calculate how many people would give up their cars and at what point.
A survey by the American International Group (AIG) described ease of driving and lower insurance premiums as
compelling benefits. This survey found that 41 percent of survey respondents were uncomfortable sharing the
road with driverless vehicles, while 42 percent were generally comfortable with it (Insurance Journal, 2017).
According to the AIG study, a major stumbling block to acceptance is the perceived security of the vehicles.
Seventy‐five percent of respondents expressed concern that fully driverless vehicles, and even autos with
autonomous features (emergency braking, lane‐departure avoidance, etc.), are susceptible to hackers taking
control. Sixty‐seven percent worry that a cyber breach could expose personal data the vehicle may acquire, such
as credit card information, when and where drivers travel and internet connections made from the vehicle.
Other concerns included information such as whom the driver had in the vehicle and the potential for private
conversations to be recorded.
On the positive side, respondents were asked to select up to three perceived benefits of driverless vehicles. The
most appealing benefits included:
► Easier/less stressful transportation (44 percent) ► Increased road safety (42 percent) ► Lower insurance costs (39 percent)
Another study showed the importance of age in this discussion. According to J.D. Power’s U.S. Tech Choice
Studies, which surveyed consumers who bought or leased a new vehicle in the past five years, one of the biggest
factors to consumers’ acceptance of autonomous vehicle technology is their age. J.D. Power’s 2017 study found
43 percent of millennial and post‐millennial consumers were supportive of full self‐driving vehicles, compared to
A Citizen’s Guide to Missouri’s Transportation Future: Long Range Transportation Plan Update 57
only seven percent of baby boomers.
An Insurance Information Institute Pulse survey conducted in May 2016 found 55 percent of consumers said
they would not ride in an autonomous vehicle.
5.5.3 Other Issues and Concerns
The following lists key issues related to pavement preservation, parking requirements, maintenance and other
infrastructure concerns:
► Pavements. Pavement rutting is a chief concern for pavement management efforts in an era of highly
automated vehicles. Vehicles continually occupying the same track will induce rutting on infrastructure.
Addressing this issue will likely require monitoring and software adjustments.
► Parking. A land use related benefit of greater autonomy and connectivity is an ability to provide beneficial
re‐use of surfaces and structures dedicated to parking. If vehicles do not need to be staged, there is an
increased ability to use these areas for other activities. The transition is expected to be slow, as fleet mix
characteristics dictate much of what transpires.
► Pavement markings. According to Tesla’s CEO and other industry experts, emerging sensors rely on
adequate (and consistent) pavement markings to provide lane positioning and other information. In other
developed countries, greater standardization of road signs and markings make it easier for autonomous
vehicles to navigate. At present, it’s unknown what factors in pavement markings are important to
autonomous driving machine vision equipped vehicles, further complicating the issue.
► Maintenance and work zones. The temporary nature of delays and lane reassignments proves vexing for
vehicles expecting consistent lane positions. The vast majority of states do not have databases detailing real
time maintenance activities.
► Cyber security. Traditionally, transportation infrastructure has been built on closed, proprietary systems.
Today, agencies are increasingly moving toward more digitized, connected transportation infrastructure.
However, as more agencies move toward more connected infrastructure (traffic signals, road sensors,
transit, rail, bus port, airport systems, etc.), cybercriminals are increasingly able to attack not only the
information technology, but also the operational technology that runs those systems. Cybercriminals could
potentially cause significant disruptions by shutting down public transit services, altering traffic signals or
otherwise remotely operating pieces of transportation infrastructure. In addition, concerns increase that
private vehicles could become targets of remote operation and targets for acquisition of personal
information through the vehicles’ connection to the internet.
► Liability and insurance. Liability issues remain a key concern for AV/CV transition. A need for liability
coverage will exist, but automobile manufacturers, parts suppliers or possibly even governments would
emerge as responsible parties. As the industry finds a new normal, some types of policies, property damage
for example, might be reduced to near no cost. It should be noted that the insurance industry is state‐
regulated, with each state having its own set of rules and regulations for auto insurance (and, by default, for
automated vehicles). A larger federal role could change the landscape for state insurance commissions

A Citizen’s Guide to Missouri’s Transportation Future: Long Range Transportation Plan Update 58
► Fleet turnover. A mixed fleet of human‐controlled and automated vehicles remains one of the largest
concerns for implementation. There is a danger in the transition period that requires careful policy
consideration. The average age of a passenger vehicle in the U.S. is about 11.4 years. An analysis by
FleetCarma estimated that it would take 18 years to replace 50 percent of the fleet. Even assuming the most
positive market trends, the fleet will turn over slowly and inhibit quickly capturing the benefits of
automation. As illustrated in Figure 5‐2, 2035 or 2040 seems a realistic horizon, even with technologies
coming on line in 2020.
FIGURE 5‐2: FLEETCARMA ANALYSIS OF MODEL TURNOVER FOR REGULATIONS (FLEETCARMA, 2015)
According to the Alliance of Automobile Manufacturers, in 2015, Missouri’s average vehicle age was 11.9 years,
about six percent higher than the national average.
5.6 State of the Practice Takeaways Whether the continued expansion and implementation of connected and highly automated vehicles is an
evolution coming gradually or a revolution coming rapidly, this technological advancement will likely be
transformational for state transportation agencies and the traveling public. Its long‐term impact on our daily
lives, the safety of our citizens and the environments in which we live and work will likely redefine our society
and be more impactful than almost any technology that has come before. Mobility options will change
dramatically.
Some key next steps for Missouri to consider include:
► Establish a steering committee to focus further activities and monitor updated information. From an
organizational perspective, including representatives from a variety of stakeholder groups would be useful.
► Consider establishing an annual forum or conversation with industry partners, planning partners and
university representatives. In addition to the formal guiding group, an annual forum will allow momentum
to develop and identify progress gained.
► Identify current legislative barriers. A formal analysis of existing barriers or impediments is likely needed to
couple with truck platooning, automated vehicle testing and revenue considerations.
Dec 2015 New law gets passed
2024‐2025 All vehicles in showroom comply.
Late 2019 First vehicle in showroom complies.
Late 2033 50% of all vehicles in the market comply
Fleet Turnover
Average vehicle turnover 11.4 years
from model mid‐point
Design Time
OEM design/ manufacturing 3.5 years
Model Turnover
“All‐new” model release 5‐6 years)
Automation Timeline
A Citizen’s Guide to Missouri’s Transportation Future: Long Range Transportation Plan Update 59
► Consider pilot efforts. Many states have launched small pilot efforts to deploy the technologies currently
available in limited settings. Some possible examples include medical complexes, amusement parks, festival
shuttles and professional sports venues.
► Consider a market study. National studies show a portion of the market acceptability for these new
technologies. A Missouri‐specific study would be valuable to identify areas where technologies are likely to
be adopted more quickly. This also will allow some specific tailoring of resources and outreach efforts.
5.7 Missouri’s Preparedness for AV/CV Market Adoption The deployment of AV/CV technologies on the transportation system promises many changes in how we move
people and goods throughout the nation. Transformational changes appear likely in most areas of
transportation, including infrastructure development, land use, traffic volumes, modeling, safety, vehicle
ownership, operations, maintenance, data sharing and funding.
The total impacts of AV/CV and other technologies on Missouri’s
transportation system are uncertain, including when the changes
will occur. However, it is important that MoDOT begins to
consider these technologies and account for their requirements
and impacts as part of the LRTP process.
To begin this conversation, a series of interviews were conducted
with MoDOT staff to determine what efforts are currently in place
and what concerns are perceived with respect to this technology.
In addition, the consultant team also prepared a summary of
expected thresholds for critical planning and decision making
related to these emerging technologies.
The results of these interviews and the findings of the threshold
analysis are summarized in this section. These findings also
include a discussion of possible effects of AV/CV technology on MoDOT at certain market penetration levels,
divided amongst functional areas at high, medium and low market penetrations
5.8 Informational Interviews To prepare a background summary and state of the practice within Missouri surrounding the issues of emerging
technologies, six interviews were completed in September 2017. These interviews focused on Missouri DOT staff
in a range of practice areas. In addition, a representative from the Mid‐America Regional Council (MARC) in
Kansas City was interviewed. These interviews were used to guide a statewide workshop on automated and
connected vehicle technologies. Prior to the interview, each subject was provided a list of questions that had
been approved by the MoDOT project team. These questions were administered via telephone interviews in
September 2017.
The following individuals were selected for interviews.
► Tom Blair. Tom is the St. Louis District Engineer and was the key point of contact for the Department’s Road
to Tomorrow initiatives.
MoDOT AV/CV Preparedness In general, MoDOT staff are eagerly anticipating the emergence of new vehicle technologies for the transportation system. While few changes to current job responsibilities were noted, MoDOT staff recognizes a broad range of potential changes and revised responsibilities in the future activities. Missouri has the 7th largest network of paved roads under its responsibility but ranks near the bottom in revenues per mile.

A Citizen’s Guide to Missouri’s Transportation Future: Long Range Transportation Plan Update 60
► Julie Stotlemeyer. Julie is the Assistant State Design Engineer and has been active in national
Transportation Systems Management and Operations (TSMO) initiatives.
► Michael DeMers. Michael is the Innovative Partnerships and Alternative Funding Director and part of the
Executive Management team.
► Travis Koestner. Travis is the Southwest District Engineer, based in Springfield, Missouri.
► Jon Nelson. Jon is Traffic Liaison Engineer and was on the Road to Tomorrow team. His background includes
experience with the highway design, traffic and highway safety areas.
► Amanda Graor. Amanda, the only non‐MoDOT participant, is a principal planner with MARC and leads their
connected and automated vehicle activities. She also is deeply engaged in MARC’s KINETIC‐KC activities.
KINETIC has sponsored a series of forums to help the community better understand and prepare for the
future of transportation.
The interviews are summarized in Section 4.9.
5.9 Interview Summaries According to interview participants, before the Road to Tomorrow initiative, little directed attention or focused
effort in emerging technologies was evident in Missouri. The appointment of an Innovative Partnerships and
Alternative Funding Director to MoDOT’s executive leadership team was also identified as a critical step in
advancing discussions focused on emerging and potentially transformative technologies. This section provides
general observations from the interviews.
5.9.1 Highlighted Findings
“We need a strategy. Need to actually move forward and instead of getting pushed in a direction; the DOT
should be reaching out and leading efforts.”
“Bringing all the pieces together is vital. Operational strategies, freight plans and other plans all need to be
coordinated.”
“We have a tendency to pull to the Interstate corridors, but how does this work on Main Street or
Independence Avenue?”
► INFRASTRUCTURE The most commonly cited infrastructure investment needs relate to pavement markings
and communications infrastructure. Pavement markings were identified as a critical need while there
remains much discussion on communications frequency standards and types. Participants identified a need
to better understand the infrastructure needs and the willingness of the industry to help support better
infrastructure, especially markings and signage. There is limited information about how to consider these
investments in a proactive manner or even what the public investment needs to be.

A Citizen’s Guide to Missouri’s Transportation Future: Long Range Transportation Plan Update 61
► RESOURCES AND TRAINING There is a desire to learn from other states. Most participants indicated
Missouri does not need to be a leader (citing California, Michigan, Nevada and Pennsylvania as leading
states). Many use the available information prepared by AASHTO and others. Discussions on social media
groups and through the broader of AASHTO community are crucial.
► BARRIERS Several respondents noted Missouri’s deep‐seated skepticism as the “Show Me” state as a barrier
to adoption, especially in more rural areas. There also is some concern about Missouri’s slightly older than
average vehicle fleet. Missouri’s average vehicle fleet has an age of 12 years (compared to 11 nationally).
Internally, the discussions focused on a general interest and desire to be engaged in this area. It was
recommended MoDOT define a clear leadership position be taken on these technologies. A good first step
will be identifying an internal steering committee and leadership team.
► CRITICAL PARTNERS Interview subjects generally supported a broad cross section of partners be engaged in
developing statewide efforts, with particular emphasis on the private industry partners, original equipment
manufacturers and private network operators. The state’s planning partners, in Metropolitan Planning
Organizations, cities, transit providers and traditional stakeholders should also be engaged. According to the
interviewed participants for the December 2017 workshop, the insurance industry, transportation advocates
and consultant partners should also be invited.
► GROUND BRANDING EFFORT IN SAFETY MESSAGES First and foremost, the expanded use and deployment
of automated vehicle technologies needs to focus on safety. All interview subjects identified the safety
impact as the primary reason to advance discussions on these technologies. Dealing with increased
distracted driving is a challenge for both enforcement and safety professionals alike. Education, engineering
and enforcement campaigns have limited impacts. Secondary impacts, including better transportation
efficiency, will serve some audiences well.
► SUPPORT FOR TRUCK PLATOONING There is substantial interest in truck platooning as a key connected
vehicle technology. Interviews discussed the possibility of using platooning technologies. Legislative efforts
will likely need to engage a cross section of stakeholders to advance legislation allowing platooning.
► SUPPORT PILOT TESTS. Interview participants strongly supported the expansion of testing and pilot
deployments in the state. It was noted many pilots receive very positive feedback and can help feed the
further expansion and adoption of these technologies. MARC, in particular, has expressed interest in these
types of pilot deployments.
5.9.2 Current Missouri Activities
Like most states, Missouri has been active in some areas related to technology planning.
5.9.2.1 Road to Tomorrow The Road to Tomorrow initiative, starting in 2015, aimed to develop ideas to improve the Interstate 70 corridor
and other key operational activities for MoDOT. The intent was to discover how to add value to the MoDOT
transportation system, enhance funding streams and prepare MoDOT to integrate 21st century technologies
into the existing transportation system and services. The efforts generated a series of innovations for further
exploration and provided dozens of opportunities for community outreach and engagement.

A Citizen’s Guide to Missouri’s Transportation Future: Long Range Transportation Plan Update 62
5.9.2.2 SPaT Challenge The Signal Phasing and Timing (SPaT) Challenge promotes the use of connected vehicle corridors in particular
areas. Sponsored by the National Operations Center of Excellence (NOCoE), the NOCoE challenged state and
local public‐sector transportation infrastructure owners and operators to cooperate together to achieve
deployment of DSRC infrastructure with SPaT broadcasts in at least one corridor or network (approximately 20
signalized intersections) in each of the 50 states by January 2020.
5.9.2.3 Automated Crash Attenuator Truck Pilot Under the Road to Tomorrow activities, MoDOT is engaged in the development and pilot of a driverless crash
attenuator truck for use in work zones. Modeled after the successful testing in Colorado, the use of a driverless
crash attenuator truck decreases the risks of injury to MoDOT work crews. The Kansas City District is turning to
technological advances by testing driverless truck mounted attenuators in slow‐moving work zones, like
roadway striping and sweeping operations.
5.9.2.4 Mid-America Regional Council / KINETIC-KC All respondents identified the Kansas City region and MARC as leaders in the discussions on vehicle automation.
MARC has participated in the Smart Cities application submitted by the City of Kansas City and advanced
discussions further through the KINETIC program – a series of forums to help the community better understand
and prepare for the future of transportation. These have included a range of technology transformative
discussions, the most recent including a discussion on the intersection of public policy and automated vehicles.
In addition, MARC has initiated a series of discussions with their stakeholders around:
► Travel Demand Management and System Performance – How can we anticipate changes in travel demand
and travel behavior that may result from widespread adoption of AVs? How can we maximize the safety
benefits AVs promise?
► Infrastructure, Planning and Investment – What new infrastructure systems and standards may be needed
to support AVs? What new planning tools and processes will be needed to prepare for successful regional
integration of AVs? What impacts are AVs likely to have on traditional transportation funding sources and
what new revenue opportunities might they create?
► Data Management and Cybersecurity – What new partnerships, capacities and strategies will the public and
private sectors need to securely manage and share AV‐related data?
► Environment and Land Use – What changes in travel behavior may lead to changes in development
patterns? How can AVs be deployed in ways that support compact, efficient development? How can AVs
reduce the negative environmental impacts of transportation?
► Equitable Access and Mobility Services – How can AVs be deployed to equitably serve the needs of people
and communities with transportation disadvantages?
► Economic and Workforce Opportunity – What opportunities and risks might AVs create for regional industry
clusters, workforce and economic competitiveness?
► Certification, Liability and Insurance – How might AVs impact these issues, particularly for local area
governments?
5.9.2.5 East-West Gateway Council of Governments In June, the East‐West Gateway completed the St. Louis Region Emerging Transportation Technology Strategic
Plan. This plan included discussion on a series of emerging trends, including connected and automated vehicles.
The plan includes ten guiding principles related to technology, ranging from system preservation to economic

A Citizen’s Guide to Missouri’s Transportation Future: Long Range Transportation Plan Update 63
development. Three strategic goals for technology include harnessing positive impacts from technology,
addressing potential negative impacts and supporting the region to be a laboratory for innovation. The plan
addressed several implications of emerging technologies and identified strengths, weaknesses, opportunities
and threats associated with existing activities.
5.9.2.6 City of Springfield Two respondents also identified key activities in the City of Springfield as possible fertile ground for continuing
pilots and activities. A combination of engaged public sector officials and positive engagement from the local
residents has already allowed technology investments in transportation.
5.9.3 Additional Discussions and Observations
The informational interviews also included discussion on other transformational technologies and discussions,
including the revenue impacts of increased vehicle powertrain changes (electrification); the potential Hyperloop
pilots; and solar roadways installations.
Interview participants identified cybersecurity and general privacy concerns as key barriers for MoDOT and
general market adoption.
5.10 Market Penetration and Acceptance Thresholds To accommodate changes in emerging vehicle technologies and their influences on the Missouri infrastructure
systems, decision makers need to consider thresholds or triggers for investment decisions. Timely and
appropriate infrastructure policy and investment decisions should be tied to the adoption levels of highly
automated and connected vehicles, among other factors. This section provides broad parameters and guidance
for market penetration based on high, medium and low adoption rates. There remains much uncertainty on the
expected time frames for widespread market adoption – some optimistic projections show as much as 25
percent market adoption of level 4 technology by 2025 with others pushing that time horizon to 2030 or 2040
(and some analysis even disputes these timeframes). There is a great degree of uncertainty, however, consumer
acceptance and overall market analysis generally shows highly automated and fully self‐driving vehicles will be
available to consumers within the next decade.
Table 5‐1 below provides an overview of possible activities, actions, relative cost and a discussion of market
acceptance. Additional details are provided in the next section entitled “Thresholds”.
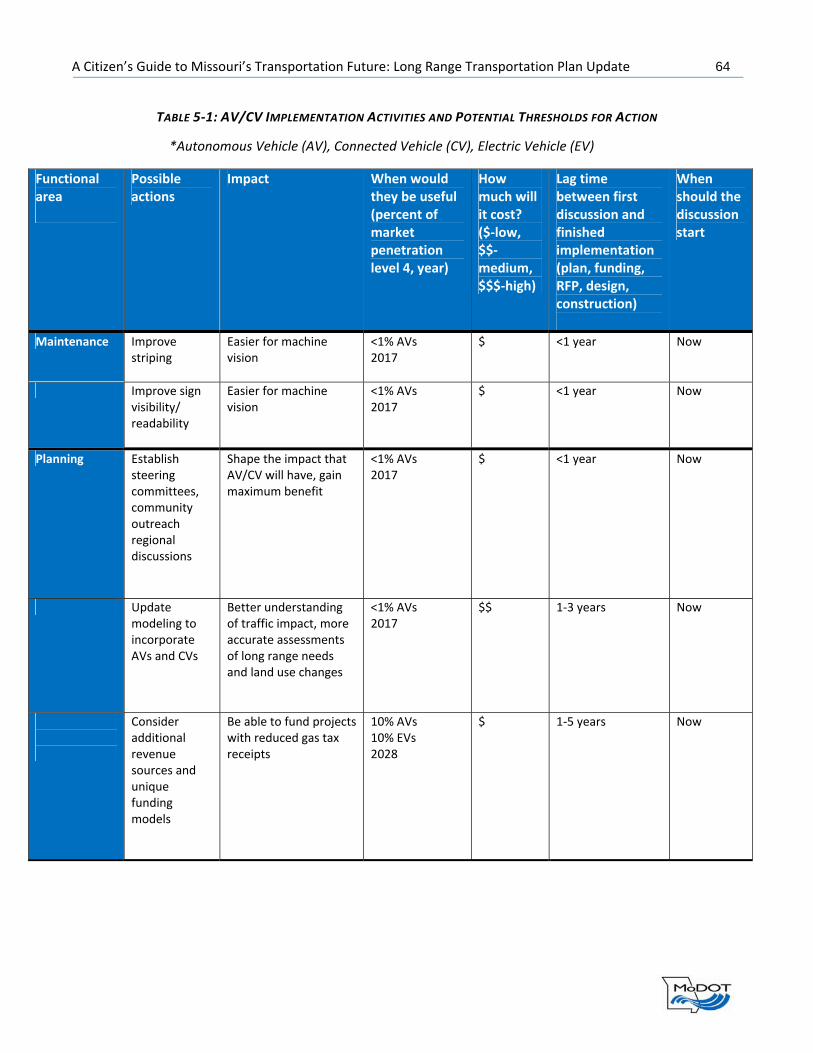
A Citizen’s Guide to Missouri’s Transportation Future: Long Range Transportation Plan Update 64
TABLE 5‐1: AV/CV IMPLEMENTATION ACTIVITIES AND POTENTIAL THRESHOLDS FOR ACTION
Functional area
Possible actions
Impact When would they be useful (percent of market penetration level 4, year)
How much will it cost? ($‐low, $$‐medium, $$$‐high)
Lag time between first discussion and finished implementation (plan, funding, RFP, design, construction)
When should the discussion start
Maintenance Improve striping
Easier for machine vision
<1% AVs 2017
$ <1 year Now
Improve sign visibility/ readability
Easier for machine vision
<1% AVs 2017
$ <1 year Now
Planning Establish steering committees, community outreach regional discussions
Shape the impact that AV/CV will have, gain maximum benefit
<1% AVs 2017
$ <1 year Now
Update modeling to incorporate AVs and CVs
Better understanding of traffic impact, more accurate assessments of long range needs and land use changes
<1% AVs 2017
$$ 1‐3 years Now
Consider additional revenue sources and unique funding models
Be able to fund projects with reduced gas tax receipts
10% AVs 10% EVs 2028
$ 1‐5 years Now
*Autonomous Vehicle (AV), Connected Vehicle (CV), Electric Vehicle (EV)

A Citizen’s Guide to Missouri’s Transportation Future: Long Range Transportation Plan Update 65
Functional area
Possible actions
Impact When would they be useful (percent of market penetration level 4, year)
How much will it cost? ($‐low, $$‐medium, $$$‐high)
Lag time between first discussion and finished implementation (plan, funding, RFP, design, construction)
When should the discussion start
Consider new and innovative transit options
Low speed AVs and ride hailing can expand traditional pedestrian sheds for transit. AV/CV capable of greater performance improvements on highways than arterials. This could make traffic worse in downtowns if not considered
30% AVs 2035
$$ ‐ $$$ 8‐15 years 1 – 5 years
Operations Consider retraining and continuing education
As new technologies develop, new skill sets will be required. Keeping people updated and having retraining programs for jobs that will be replaced by AV will assist in continued economic development and growth
5% CVs 2020
$ <1 – 3 years Now
Advanced data collection
Better and less expensive modeling efforts, potential partnerships with private data providers
<1% AVs 2017
$ ‐ $$ 1‐20 years Now

A Citizen’s Guide to Missouri’s Transportation Future: Long Range Transportation Plan Update 66
Functional area
Possible actions
Impact When would they be useful (percent of market penetration level 4, year)
How much will it cost? ($‐low, $$‐medium, $$$‐high)
Lag time between first discussion and finished implementation (plan, funding, RFP, design, construction)
When should the discussion start
Operations/ Construction/ Design
Ensure communication between all infrastructure assets
Allowing centralized control and communication of signals and variable message signs etc. allows for more coordinated effective handling of unusual events. A building block for CV technologies
<1% AVs 2017
$$ 2‐10 years Now
Invest in advanced communication network
A better existing communication network will allow for flexibility and rapid implementation of V2I technology and applications. They are also a potential short‐term revenue source
5% CVs $$ 2‐10 years Now
Construction/ Maintenance/ Operations
Inventory and communicate work zones and MOT plans precisely to vehicles
Allows AVs to be able to better handle the unusual situations to expand their operational domains
10% AVs 2028
$ ‐ $$ 1‐5 years 5‐10 years
Design/ Construction
Consider pavement design standards for rutting
AVs could be more consistent in lane placement and increase wear on select pavement sections
15% AVs (trucks will likely implement AV technology faster than general market) 2030
$$ 2‐10 years 2‐5 years

A Citizen’s Guide to Missouri’s Transportation Future: Long Range Transportation Plan Update 67
Functional area
Possible actions
Impact When would they be useful (percent of market penetration level 4, year)
How much will it cost? ($‐low, $$‐medium, $$$‐high)
Lag time between first discussion and finished implementation (plan, funding, RFP, design, construction)
When should the discussion start
Legislative Review existing legislation to determine any impediments to AV and consider exceptions/ exemptions
Ensures laws affecting AV deployment are as intended, and not unnecessarily restricting them
<1% 2017
$ <1 Now
Consider additional laws based on AV performance
Alternative speed limits, altered following distances and different signaling technology can potentially benefit AVs impact on congestion and safety
5% AVs 2025
$ 1‐5 years Now
Planning/ Legislation
Consider policies and impacts around zero occupancy trips
Excessive zero occupancy trips and circling can increase VMT which can negatively impact the environment and congestion
10% AVs 2025
$ <1‐3 years 3‐5 years
Design Consider safety zones/ shoulder availability to accommodate AV safety fallback state
Allows for an AV safety fall back state to pull over if there is a minor malfunction, reduces impact of failures or crashes
10% AVs 2025
$ ‐ $$ 1‐10 years 2‐5 years
Review structural loading base on vehicle following distances
Ensure safety 15% AVs 2030
$ 0‐2 years Now‐new construction 5‐10 years (retrofit)
Separate AV lane
Increased efficiency and narrower lanes to utilize less ROW
30% AVs 2035
$$ ‐ $$$ 5‐15 years 3‐5 years

A Citizen’s Guide to Missouri’s Transportation Future: Long Range Transportation Plan Update 68
Functional area
Possible actions
Impact When would they be useful (percent of market penetration level 4, year)
How much will it cost? ($‐low, $$‐medium, $$$‐high)
Lag time between first discussion and finished implementation (plan, funding, RFP, design, construction)
When should the discussion start
Implement additional separation or visibility measures for vulnerable road users
Providing barrier separation or broadcasting pedestrian and bicycle locations can increase the probability of detection and time for reaction of AVs when interacting with vulnerable road users and increase their safety
25‐30% AVs (level 4 not likely to include high speed urban operations before this) 2030
$$ 1‐5 years 5‐10 years
Change parking requirements
Reduced prime space required for parking, more developable land and ROW. Drop off areas become more important than parking
25% AVs 2035
$ 1‐10 years 5‐10 years
Consider altered geometry
AVs can react faster which alters effective stopping sight distance. CVs can coordinate and communicate, which alters effective stopping sight distance as well as merging and weaving distances
25‐50% AVs >90% CVs 2040
$ 6 ‐15 years 10+ years
5.10.1 Thresholds
To assist in long range planning efforts and identify potential infrastructure investment horizons, this section
identifies three threshold levels for market adoption. A summary of possible infrastructure investments tied to
high, medium and low market penetration for highly automated vehicles follows.
5.10.1.1 Low Market Penetration (<15% of new vehicles sold or retrofitted; under 10% of fleet) Low market penetration is relatively similar to the existing status quo. Planning forecasts are based on typical
housing and employment decisions, with trips assigned in a traditional manner. Infrastructure decisions remain
based on the same criteria as now. Limited increased demand for pavement markings and connectivity will be
evident as the fleet mix is not altered substantially. As such, maintenance remains a priority; guardrails,
shoulders, vegetation management, winter maintenance and pavement repair continue in a similar manner to
today. Pedestrian and bicycle accommodations and clear markings are important to encourage appropriate
behaviors for both vehicles and vulnerable roadway users.

A Citizen’s Guide to Missouri’s Transportation Future: Long Range Transportation Plan Update 69
Connectivity will be included on a small number of vehicles. It is worth considering ways to relay the data
collected by connected vehicles back to the general public; variable message signs, websites and existing
traveler information programs may be leveraged to disperse this information. Basic information, including travel
times, traffic conditions and routing, will likely be heavily influenced by private or application‐based
technologies. Smartphone applications will allow for much faster adoption and implementation of some
connected vehicle technologies. Limited deployments of autonomous vehicles, including low‐speed shuttles,
limited geofenced transportation network provider services and truck platoons will require some consideration.
With respect to commercial vehicle operations, demand for truck parking areas, potential platoon staging areas
and traveler information will be in high demand.
Missouri should expect to move through the low market penetration scenario by the end of 2025. As
manufacturers bring vehicles to market in the early 2020s, early‐adopting consumers will likely move quickly.
5.10.1.2 Medium Market Penetration (More than 15%; less than 50% of new vehicles sold or retrofitted; up to 25% of fleet) Medium penetration levels will require additional consideration for maintenance and planning decision making.
At this level, the consumer demand for network connectivity and consistent performance is critical. As noted
previously, lane markings, work zone information and machine‐readable signage and communication will be
immensely valuable. At this level of market adoption, some classification system is crucial for MoDOT’s roadway
network. Each public roadway will need to be clearly identified as to its level of service for connected and highly
automated vehicles. Current efforts to develop a national classification system could influence this
categorization and planning staff should consider its application in Missouri.
Planning decisions will need to include consideration for exclusive lanes, narrowed lane widths, parking,
signalization, holding lanes and turning lanes and a host of other infrastructure investments. Fleet mix will
become the critical issue for decision makers as more than half of the vehicles will remain reliant on existing
technologies – although it is projected that even in this scenario, driver assistance technologies will become
more standardized (including lane keeping, automated braking, obstacle identification and blind spot
monitoring).
The medium market penetration tier will also introduce a number of challenges for the traveling public. Urban
and rural differences are likely to be magnified – roadways in the urban areas, and lower travel speeds may see
a range of vehicles – from low speed shuttles to automated fleets/taxi services. Truck platoons or automated
commercial delivery vehicles can also be expected. Changes to employment locations and availability of fleets
during peak hours will emerge as planning and land use issues. Signal phasing and corridor or general operations
management will require substantial investment in emerging technology, with communications standards and
multi‐jurisdictional cooperation becoming essential. Other investments MoDOT would need to consider in the
medium penetration scenario could include:
► Variable messaging equipment and signage – reduced investment
► Increased or enhanced shoulder availability for automated vehicle disengagements
► Pedestrian and bicycle accommodations and conflict areas
► Customer service options for motorist assist programs
► Structural analysis for bridges based on vehicle loadings and following distance
For planning purposes, the medium market penetration is mostly likely to arrive by 2030. Projects expected to

A Citizen’s Guide to Missouri’s Transportation Future: Long Range Transportation Plan Update 70
be completed after 2030 should include the above infrastructure considerations.
5.10.1.3 High Market Penetration (Greater than 50% of new vehicles sold or retrofitted; more than 25% of total vehicle fleet) At high market penetration levels, critical investment decisions begin to accelerate rapidly. A strong need could
emerge for dedicated lanes or networks for highly automated vehicles. Consumers will expect interoperability at
all levels (urban and rural; high volume and low volume roadways). As with the low and medium penetration
levels, pavement markings, signage and communication of work zone information will remain essential.
The higher market adoption levels will require nearly all planning decisions to be made based on an expectation
of advancing to 100 percent penetration of the vehicle fleet. Several infrastructure investments will need to be
reconsidered, including but not limited to, lane widths, geometry, pavement designs and structural analysis.
Interchange design including potential shortened acceleration and deceleration lanes will need to be considered
for future activities. Fleet mix will be the critical safety issue as older technologies remain on the roadways in
the transition periods. It is anticipated fewer conflicts arise between vulnerable roadway users in the high
scenario as technology expectations and behaviors are clarified.
From a connectivity perspective, information on weather, pavement and traffic conditions will need to be
broadcast and available. The responsibility for providing this information is likely to be a mixture of public and
private sources, including crowdsourced information collected through application‐based systems. It is unlikely a
large public investment in connected vehicle technologies will be necessary.
The high market penetration target of 50 percent of new vehicle sales is probable by 2030. The fleet mix will
likely approach 50 percent or greater of the total vehicle fleet by 2035‐2040. After 2040, transportation planners
should anticipate nearly all vehicles operating as highly automated vehicles. As such, nearly all decision making
and traffic projection considerations used today will require modification.
5.11 AV/CV Workshop To begin developing a common understanding and possible approaches for AV/CV technology preparedness,
MoDOT convened a workshop in Columbia, Missouri, on December 7, 2017. The workshop was structured to
discuss the future of AV/CV deployments, including critical infrastructure needs and the overall impacts the
technology could have on transportation.
The goals of the workshop were to examine current and emerging technologies, gather input on the actions
required to facilitate implementation of AV/CV technology and discuss the responsibilities of state and local
officials in developing policies and regulations to facilitate a smooth transition.
Participants included MoDOT staff, representatives of local planning agencies, regulators, auto industry
representatives and law enforcement officials. Appendix G includes the list of registered participants.
5.11.1 MoDOT Leadership Encourages Dialogue to Promote Efficient Implementation of AV/CV Technology
Director McKenna opened the workshop by welcoming the participants and stating the purpose of the workshop
was not to solve all the issues associated with the coming changes in technology, but to start a dialogue and
provide a framework for future work. Those thoughts were echoed by MoDOT Chief Engineer, Ed Hassinger.
Michael DeMers followed with a discussion of vehicle technology changes and the evolution of self‐driving cars.
A Citizen’s Guide to Missouri’s Transportation Future: Long Range Transportation Plan Update 71
His presentation focused on the classification of self‐driving cars, the availability of vehicles, including the
market release announcements of several manufacturers and the expected rate of market penetration. He also
discussed electrification of the future fleet and the possible effect on current revenue sources, such as fuel
taxes.
Julie Lorenz, Burns & McDonnell, provided an overview of possible impacts from AV/CV technology on issues
such as safety, highway capacity and land use and conducted a series of “live polls” to collect input from
participants. The questions and responses are provided in Appendix H.
5.11.2 Workshop Participants Suggest Path for Future Activities
Participants were asked to work in breakout groups to discuss the roles, impacts and responsibilities of the
public and private sector in successfully implementing AV/CV technology. Questions included:
1. Based on what you have heard, what do you think are the key issues for public sector leaders?
2. What happens if we do nothing?
3. Who should be at the discussion table that isn’t here now?
4. Are there other areas of concern that you have?
5. Potential state activities (e.g., education, engagement, encourage research, facilitate discussions and
regional collaboration)
6. Potential local agency activities (intra‐regional collaboration, peer exchanges, facilitate local
discussions)
7. What role might the private sector play?
A representative sample of breakout group comments were reported back to the larger group during the
facilitated discussions. Table flip charts were collected and the content transcribed. The transcript from all
groups is included in Appendix I.
Through group discussions about roles and responsibilities and the potential impacts of AV/CV technology, and
responses attendees provided through live polling, it is clear AV/CV technology will have a wide impact on the
future of transportation and society in general. The technology is expected to impact nearly every aspect of life
in the future. Attendees identified there will be a need to update the transportation infrastructure and a need to
make sure any AV/CV‐related legislation passed in Missouri is consistent with national and regional efforts.
Continued discussion will be important to make sure Missouri is positioned to take advantage of future
developments in AV/CV technology. While MoDOT may not lead the charge to promote AV/CV technology,
workshop participants saw MoDOT as a leader in promoting and facilitating future conversations.
Results of the breakout sessions clearly indicate participants anticipate AV/CV technology having a significant
impact on the future of transportation and on society in general. Because this technology will impact nearly
every aspect of life in the future, it is essential that many viewpoints be included in future conversations.
Participants also identified that there will be a need to update the transportation infrastructure and a need to
make sure AV/CV‐related legislation passed in Missouri is consistent with national and regional efforts.
Overall, the need to continue a discussion on AV/CV technology was clearly identified to avoid confusion and to
ensure Missouri was positioned to take advantage of future developments in these technologies. Participants
indicated that MoDOT is seen as a leader in promoting and facilitating the conversation about AV/CV
technology.
A Citizen’s Guide to Missouri’s Transportation Future: Long Range Transportation Plan Update 72
5.12 Predictive Analytics As computing powers increase, predictive analytics enable transportation agencies to better mine and process
the large volumes of information that automated and connected vehicles will produce. Today’s navigation
systems, mapping applications, and similar on‐board location services also provide opportunities to improve the
planning process. The potential shared information – amongst vehicles, between infrastructure components or
with the public agency itself – can be used to provide for more effective incident management as well.
Leveraging predictive analytics generated from AV/CV, and those data items produced by cellular network
providers, provide benefits to law enforcement, public safety, and other industries and services associated with
transportation activity. Data collected from public transportation providers, coupled with the information made
available from connected vehicles, can be captured to help plan and manage transportation
networks. Investments in data processing and data analysis, and data related positions, would encourage more
seamless operations today and allow for improved preparedness for tomorrow’s transformational technologies.
Leveraging this data will allow drivers to be informed of potential problems before they even occur. AV/CV will
provide mobile sensing across the entire transportation network. Information about roadway conditions that
can be extrapolated based on past trends to determine where a delay is likely. Google maps already provides
this information at a basic level by providing average traffic speeds and commute time at any given time of
day. With more sensors and more information available from connected vehicles as well as connected
infrastructure those predictions can become more accurate and precise. Connected vehicles will be able to
sense temperature and road conditions, to provide advanced warnings to drivers about dangerous
areas. Vehicles can be routed to alternate roadways earlier if there is a high likelihood for a certain road to
flood, ice, or in some other way become treacherous given current or imminent weather conditions. This
advanced knowledge would allow drivers to take more efficient routes and avoid areas with an unusually high
likelihood of an incident during that particular trip. The driving behavior of the vehicle itself would also be able
to be leveraged to benefit other travelers. For example, if there is an incident of hard braking, that information
could be transmitted upstream to provide warnings. This is the same concept that is currently employed through
variable message signs and at work zones, but it has the potential to be more accurate and direct, and in turn
more effective when implemented in conjunction with autonomous and connected vehicles.

A Citizen’s Guide to Missouri’s Transportation Future: Long Range Transportation Plan Update 73
SECTION 6: TRANSPORTATION FUNDING AND NEEDS The long‐term future of transportation funding and needs is uncertain. Changes in technology, freight
movements and development patterns will have significant impacts during the 2018‐2045 time horizon. Given
these uncertainties, MoDOT has developed a financial forecast using trend information and anticipated
revenues and expenditures through the plan horizon of 2045.
The long‐term financial forecast continues to show transportation funding remains challenging in Missouri. For
the 2018‐2045 time period, revenues are estimated to grow at an average rate of 1.4 percent each year.
Unfortunately, inflation is expected to grow at 2.5 percent each year, which reduces the purchasing power of
available funds. In total, the purchasing power of transportation revenues during the 2018‐2045 horizon
declines 30 percent.
This section provides transportation system funding and needs through 2045 in 2017‐dollar figures.
FIGURE 6‐1 – PROJECTED REVENUE AVAILABLE
6.1 Funded Needs Missouri’s inflation‐adjusted transportation revenue for 2018‐2045 totals $61 billion, which averages $2.2 billion
each year. As shown on the next page, nearly two‐thirds of the revenue comes from state user fees and one‐
third from federal revenue. A small fraction is estimated to come from Missouri’s General Revenue Fund, which
receives revenue from the state’s income tax and general sales tax.
The $2.2 billion of revenue is distributed into five “buckets” for various transportation purposes as determined
by state and federal laws. Each bucket has a unique blend of state and federal revenue, as depicted by the red,
$0
$500
$1,000
$1,500
$2,000
$2,500
$3,000
$3,500
$4,000
2018
2019
2020
2021
2022
2023
2024
2025
2026
2027
2028
2029
2030
2031
2032
2033
2034
2035
2036
2037
2038
2039
2040
2041
2042
2043
2044
2045
Millions
2018‐2045 Projected Revenue Available
$86.8 Billion Total Revenue Available
$61.0 Billion Inflation‐Adjusted Revenue Available
(30% Loss of Purchasing Power)
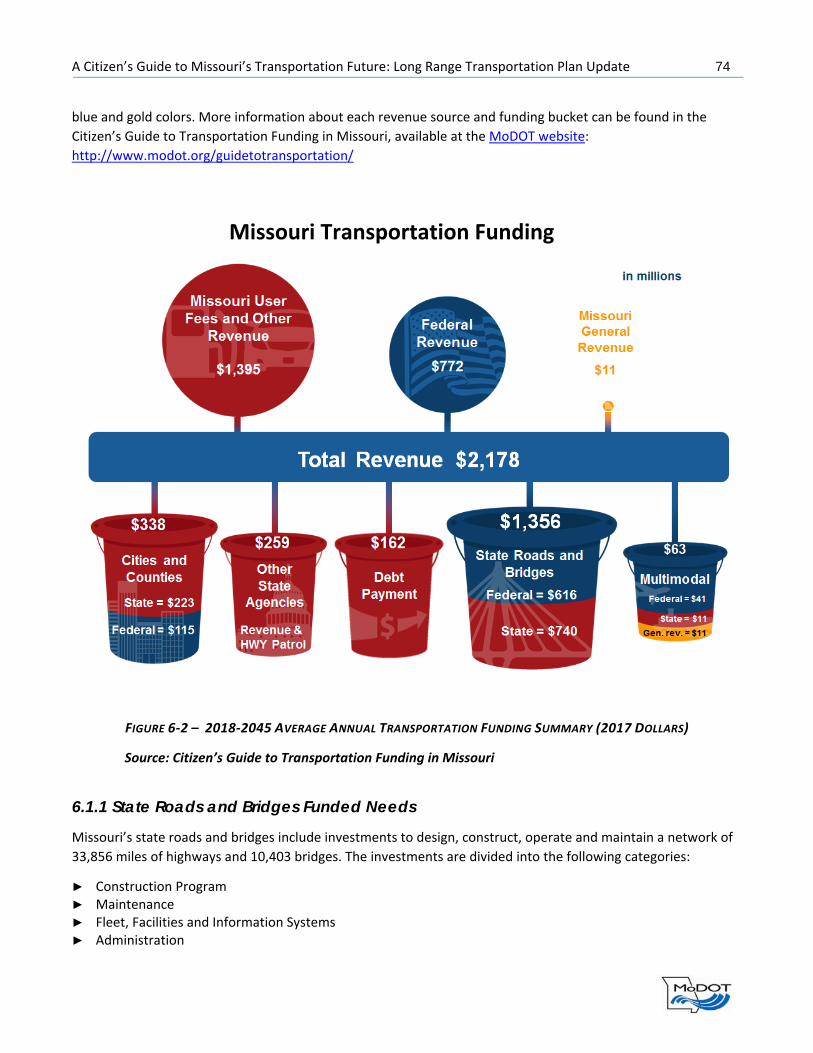
A Citizen’s Guide to Missouri’s Transportation Future: Long Range Transportation Plan Update 74
blue and gold colors. More information about each revenue source and funding bucket can be found in the
Citizen’s Guide to Transportation Funding in Missouri, available at the MoDOT website:
http://www.modot.org/guidetotransportation/
FIGURE 6‐2 – 2018‐2045 AVERAGE ANNUAL TRANSPORTATION FUNDING SUMMARY (2017 DOLLARS)
Source: Citizen’s Guide to Transportation Funding in Missouri
6.1.1 State Roads and Bridges Funded Needs
Missouri’s state roads and bridges include investments to design, construct, operate and maintain a network of
33,856 miles of highways and 10,403 bridges. The investments are divided into the following categories:
► Construction Program ► Maintenance ► Fleet, Facilities and Information Systems ► Administration
Missouri Transportation Funding

A Citizen’s Guide to Missouri’s Transportation Future: Long Range Transportation Plan Update 75
From 2018‐2045, MoDOT anticipates annual investments for state roads and bridges averaging $1.4 billion.
Figure 6‐3 illustrates the distribution of the total anticipated investments in each of the categories.
FIGURE 6‐3 – 2018‐2045 AVERAGE ANNUAL STATE ROADS AND BRIDGES INVESTMENTS (2017 DOLLARS)
Source: Citizen’s Guide to Transportation Funding in Missouri
The construction program is the largest area of investment, averaging $806 million per year. These funds are
focused on project investments that preserve the existing pavement and bridge conditions, with limited funding
available for improving safety, freight, congestion, non‐motorized transportation and major roadway
reconstruction.
Maintenance spending averages $433 million per year to fund services performed by MoDOT employees such as
plowing snow, mowing and minor highway repairs.
Fleet, facilities and information systems spending averages $73 million per year to cover the costs of purchasing
MoDOT’s fleet of trucks, construction and maintaining MoDOT’s buildings and providing information technology
to perform MoDOT’s maintenance and engineering functions.
Administration spending averages $59 million per year for MoDOT support services like human resources,
accounting, legal and customer service.
6.1.2 Multimodal Funded Needs
Multimodal refers to non‐highway modes of transportation including transit, aviation, railroads and waterways.
The majority of transportation revenue is constitutionally required to be spent on state roads and bridges,
leaving limited funds to support these services and facilities. Unlike roads and bridges, the State does not own
the multimodal facilities, but instead administers the funding and provides oversight for multimodal
806
433
73 59
$0
$100
$200
$300
$400
$500
$600
$700
$800
$900
ConstructionProgram
Maintenance Fleet, Facilities andInformation Systems
Administration
Investment (m
illions)
Anticipated Transportation Investments
Investment Area
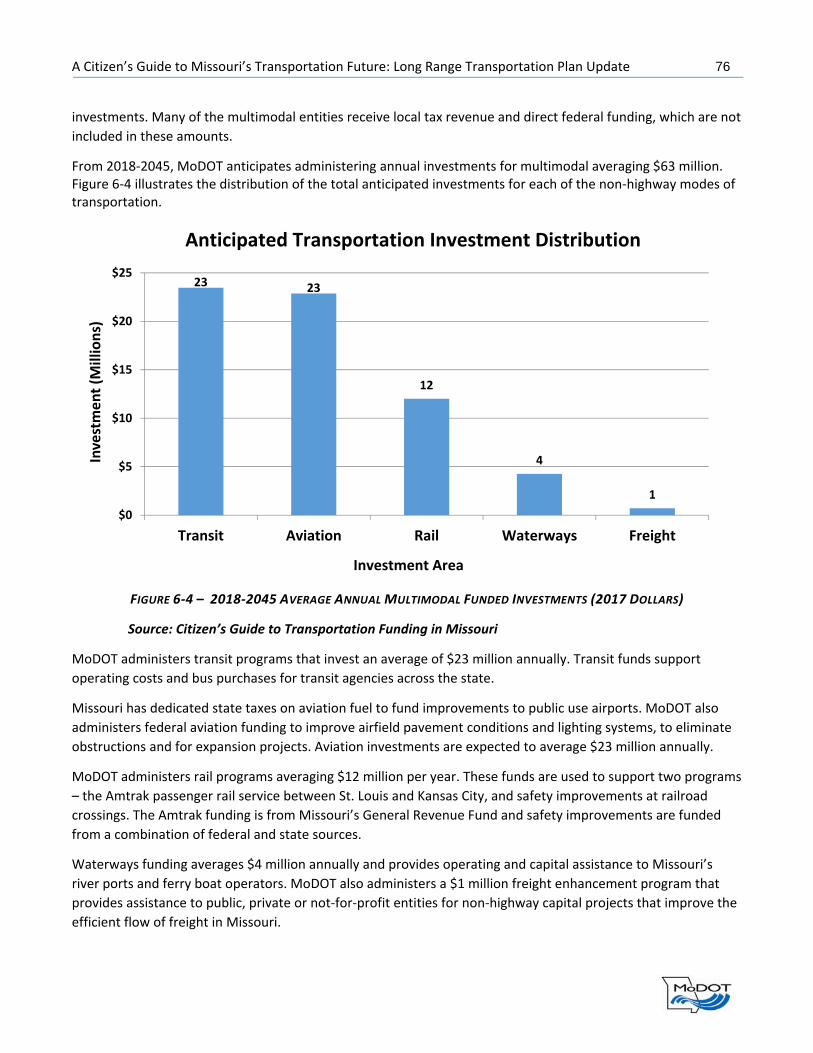
A Citizen’s Guide to Missouri’s Transportation Future: Long Range Transportation Plan Update 76
investments. Many of the multimodal entities receive local tax revenue and direct federal funding, which are not
included in these amounts.
From 2018‐2045, MoDOT anticipates administering annual investments for multimodal averaging $63 million. Figure 6‐4 illustrates the distribution of the total anticipated investments for each of the non‐highway modes of transportation.
FIGURE 6‐4 – 2018‐2045 AVERAGE ANNUAL MULTIMODAL FUNDED INVESTMENTS (2017 DOLLARS)
Source: Citizen’s Guide to Transportation Funding in Missouri
MoDOT administers transit programs that invest an average of $23 million annually. Transit funds support
operating costs and bus purchases for transit agencies across the state.
Missouri has dedicated state taxes on aviation fuel to fund improvements to public use airports. MoDOT also
administers federal aviation funding to improve airfield pavement conditions and lighting systems, to eliminate
obstructions and for expansion projects. Aviation investments are expected to average $23 million annually.
MoDOT administers rail programs averaging $12 million per year. These funds are used to support two programs
– the Amtrak passenger rail service between St. Louis and Kansas City, and safety improvements at railroad
crossings. The Amtrak funding is from Missouri’s General Revenue Fund and safety improvements are funded
from a combination of federal and state sources.
Waterways funding averages $4 million annually and provides operating and capital assistance to Missouri’s
river ports and ferry boat operators. MoDOT also administers a $1 million freight enhancement program that
provides assistance to public, private or not‐for‐profit entities for non‐highway capital projects that improve the
efficient flow of freight in Missouri.
23 23
12
4
1
$0
$5
$10
$15
$20
$25
Transit Aviation Rail Waterways Freight
Investment (M
illions)
Anticipated Transportation Investment Distribution
Investment Area

A Citizen’s Guide to Missouri’s Transportation Future: Long Range Transportation Plan Update 77
6.2 Unfunded Needs Missouri’s four transportation goals were identified in the 2014 plan through extensive public input. These four
goals have been confirmed in this 2018 public engagement process with the addition of a fifth, new goal.
► Take care of the transportation system and services we enjoy today ► Keep all travelers safe, no matter the mode of transportation ► Give Missourians better transportation choices ► Invest in projects that spur economic growth and create jobs ► Improve reliability and reduce congestion on Missouri’s transportation system
Given the current funding resources, most of the anticipated revenue will address maintaining and preserving
the existing system in the current condition. The 2014 plan identified over $75 billion of specific needs and
projects from Missourians, many of which still remain unfunded. Working with planning partners and
stakeholders across the state, these needs and projects have been categorized into groupings of unfunded, high‐
priority transportation needs. Figure 6‐5 illustrates these needs by category.
FIGURE 6‐5 – HIGH‐PRIORITY UNFUNDED ANNUAL TRANSPORTATION NEEDS (2017 DOLLARS)
Source: Citizen’s Guide to Transportation Funding in Missouri
High‐Priority Transportation Needs
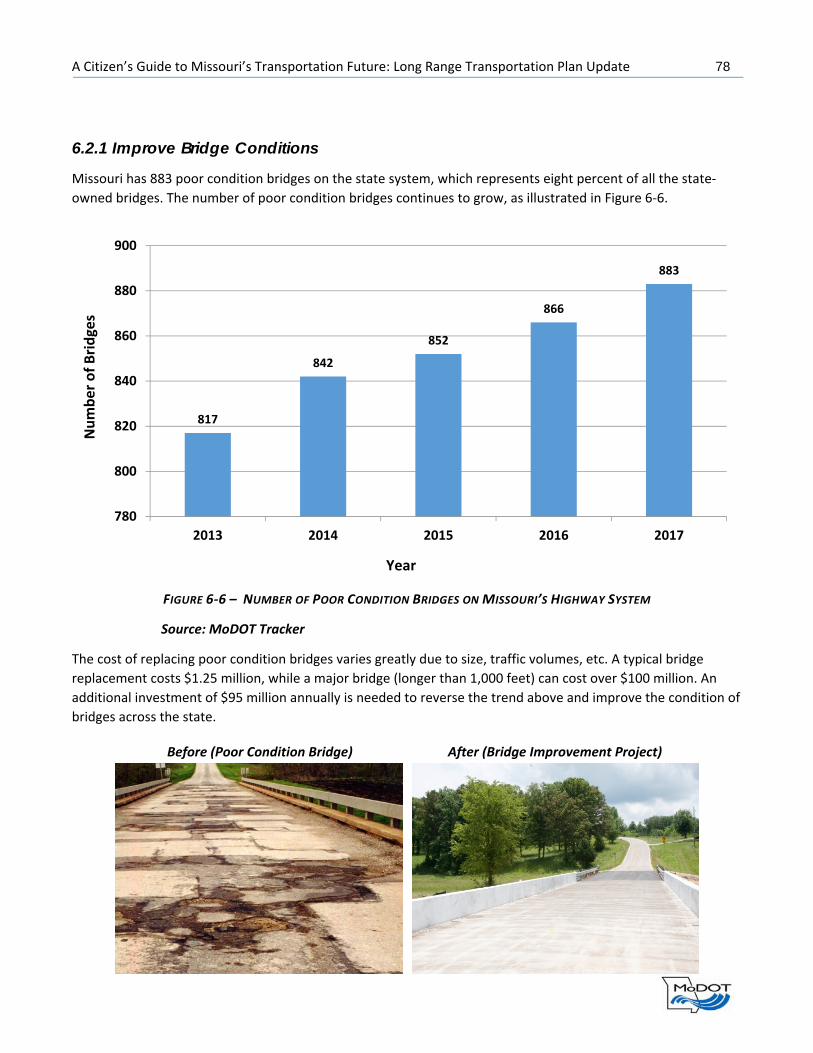
A Citizen’s Guide to Missouri’s Transportation Future: Long Range Transportation Plan Update 78
6.2.1 Improve Bridge Conditions
Missouri has 883 poor condition bridges on the state system, which represents eight percent of all the state‐
owned bridges. The number of poor condition bridges continues to grow, as illustrated in Figure 6‐6.
FIGURE 6‐6 – NUMBER OF POOR CONDITION BRIDGES ON MISSOURI’S HIGHWAY SYSTEM
Source: MoDOT Tracker
The cost of replacing poor condition bridges varies greatly due to size, traffic volumes, etc. A typical bridge
replacement costs $1.25 million, while a major bridge (longer than 1,000 feet) can cost over $100 million. An
additional investment of $95 million annually is needed to reverse the trend above and improve the condition of
bridges across the state.
Before (Poor Condition Bridge) After (Bridge Improvement Project)
817
842
852
866
883
780
800
820
840
860
880
900
2013 2014 2015 2016 2017
Year
Number of Bridges

A Citizen’s Guide to Missouri’s Transportation Future: Long Range Transportation Plan Update 79
6.2.2 Improve Road Conditions
Missouri has the seventh largest state highway system in the nation, which is a tremendous asset, but requires
ongoing maintenance to maintain a state of good repair. Based on 2016 data, Missouri’s roads are in the
following condition (based on smoothness) as illustrated by Table 6‐1.
TABLE 6‐1 – SUMMARY OF MISSOURI HIGHWAY CONDITIONS (2016 RATINGS))
MoDOT has made significant investments since 2005 to improve and maintain the interstate and major road
conditions; however, funding for minor and low volume routes is not adequate to improve and maintain their
condition across the state. An additional investment of $50 million per year is needed to improve the condition
of these routes.
6.2.3 MoDOT Maintenance and Operations
MoDOT employs 3,000+ field employees throughout the State to operate and maintain the transportation
system. MoDOT provides maintenance and operations support for the highway system, including:
► Pavement repairs and
sealing
► Winter operations
► Bridge maintenance
► Striping
► Traffic signs and signals
► Mowing
► Flood/road closures
► Ditches/drainage
► Litter and debris removal
► Incident response
► Customer calls
► Dead animal removal
► Driveway maintenance
► Permits
► Vegetation control
Route Type Percent of Roads in Good Condition
Interstate Routes (National Highway System) 93%
Major Routes (National Highway System) 89%
Minor Routes 80%
Low Volume Routes 70%
Before (Poor Condition Route) After (Resurfacing Project)
*Percentage in good condition is based on pavement smoothness

A Citizen’s Guide to Missouri’s Transportation Future: Long Range Transportation Plan Update 80
The number one focus of operations is roadway maintenance. An additional investment of $25 million annually
is needed to stabilize funding for these services.
6.2.4 Invest in Projects that Increase Economic Growth and Improve Safety
Many communities across the state have identified specific projects for this category, including new or improved
interchanges, adding shoulders with rumble stripes and adding lanes to the current system. In addition to
economic growth benefits, these projects modernize the system and improve safety and reliability. Current
funding is not available for the majority of these needs. An additional annual investment of $250 million per
year is needed to begin making these improvements.
Shared 4‐Lane Road 4‐Lane Road with Median Guard Cable
Interchange Improvement Roadway with Rumble Stripe
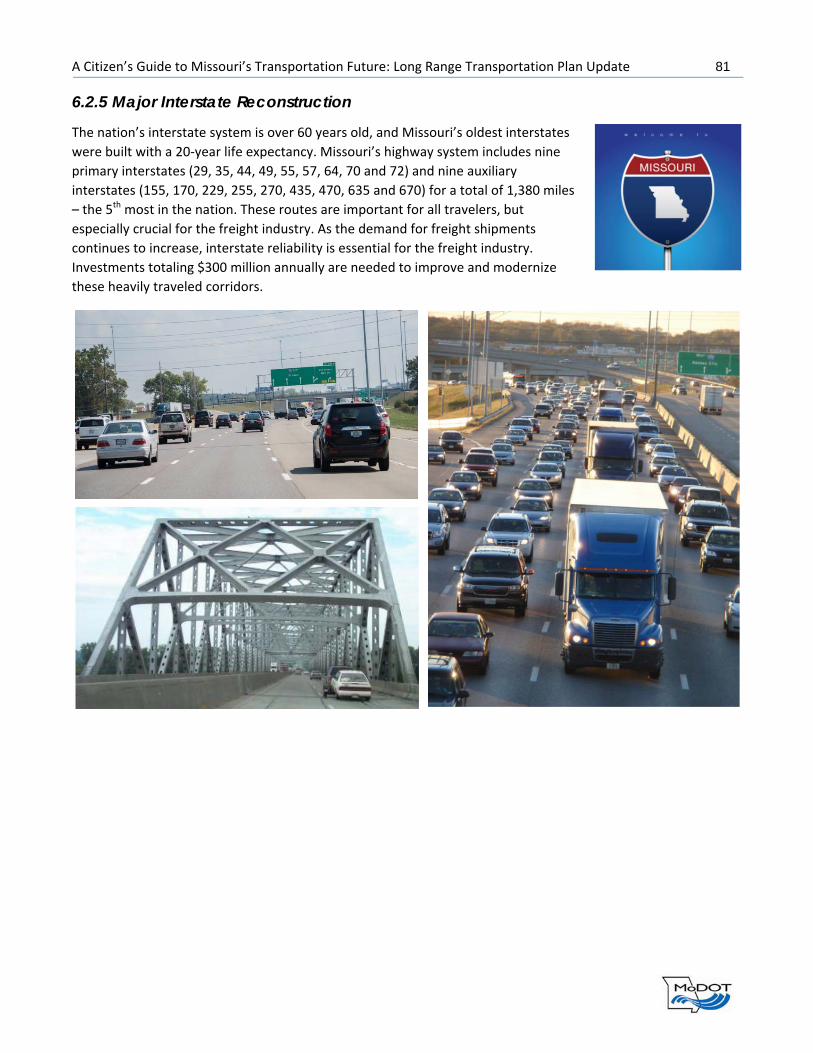
A Citizen’s Guide to Missouri’s Transportation Future: Long Range Transportation Plan Update 81
6.2.5 Major Interstate Reconstruction
The nation’s interstate system is over 60 years old, and Missouri’s oldest interstates
were built with a 20‐year life expectancy. Missouri’s highway system includes nine
primary interstates (29, 35, 44, 49, 55, 57, 64, 70 and 72) and nine auxiliary
interstates (155, 170, 229, 255, 270, 435, 470, 635 and 670) for a total of 1,380 miles
– the 5th most in the nation. These routes are important for all travelers, but
especially crucial for the freight industry. As the demand for freight shipments
continues to increase, interstate reliability is essential for the freight industry.
Investments totaling $300 million annually are needed to improve and modernize
these heavily traveled corridors.
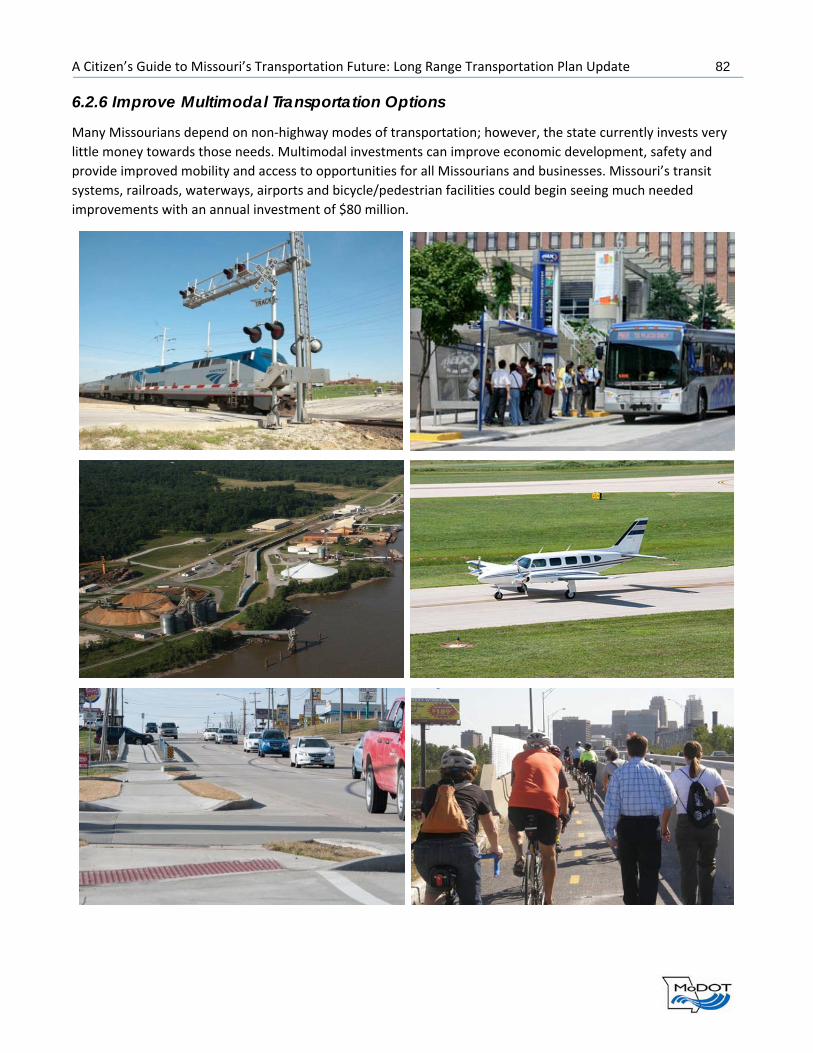
A Citizen’s Guide to Missouri’s Transportation Future: Long Range Transportation Plan Update 82
6.2.6 Improve Multimodal Transportation Options
Many Missourians depend on non‐highway modes of transportation; however, the state currently invests very
little money towards those needs. Multimodal investments can improve economic development, safety and
provide improved mobility and access to opportunities for all Missourians and businesses. Missouri’s transit
systems, railroads, waterways, airports and bicycle/pedestrian facilities could begin seeing much needed
improvements with an annual investment of $80 million.

A Citizen’s Guide to Missouri’s Transportation Future: Long Range Transportation Plan Update 83
6.2.7 Long-Term Uncertainty
The future of transportation will bring improvements to technology in both passenger movement and freight
movement including autonomous or connected vehicles. The introduction of these types of vehicles on the
highway system could dramatically change the needs of the capital spending to accommodate these changes.
Though the exact impacts on the transportation system and project needs is unknown, it is anticipated there will
be tradeoffs in the spending. For example, technology changes will increase the need for spending on
technology and line striping improvements but may allow for less spending on traditional safety and expansion
improvements.
Given these uncertainties, the unfunded needs will most likely evolve toward the latter half of this planning
horizon. Though the spending areas may be different to accommodate new technology or changes in
demographics and preferences, the total transportation spending to address the transportation needs is
expected to remain the same – $825 million per year (2017 dollars). Based on this assumption, the total
unfunded transportation needs total $825 million per year, which totals $23.1 billion for the 28‐year horizon of
this plan (2018‐2045).
Unfunded Transportation Needs
*Represents MoDOT‐administered programs only
TABLE 6‐2 – SUMMARY OF FUNDED AND UNFUNDED NEEDS 2018‐2045 (2017 DOLLARS IN MILLIONS)
Annual 2018‐2045 Total
Total Funded Needs $1,434 $40,152
Highway and Bridge $1,371 $38,388
Construction Program $806 $22,568
Maintenance $433 $12,124
Fleet, Facilities and Information Systems $73 $2,044
Administration $59 $1,652
Multimodal* $63 $1,764
Transit $23 $644
Aviation $23 $644
Rail $12 $336
Waterways $4 $112
Freight $1 $28
High‐Priority Unfunded Needs $825 $23,100
Improve Bridge Conditions $95 $2,660
Improve Road Conditions $50 $1,400
MoDOT Maintenance and Operations $25 $700
Economic Growth and Safety Projects $275 $7,700
Major Interstate Reconstruction $300 $8,400
Multimodal Projects $80 $2,240
Total Needs $2,259 $63,252

A Citizen’s Guide to Missouri’s Transportation Future: Long Range Transportation Plan Update A-1
APPENDIX A: KEY RESOURCES Reports Several key resources have been released by a variety of public and private organizations. This section provides
a few highlights relevant to Missouri’s current Long Range Transportation Plan update.
U.S. Department of Energy
In 2015, the U.S. Department of Energy produced a Technology Assessment on Automated and Connected
Vehicles. In the report, the authors held that AV/CV would greatly decrease the energy consumption of personal
transport due to platooning, efficient driving and routing and rightsizing. The report also explored some
catalysts for additional vehicle uses and vehicle miles traveled.
https://energy.gov/sites/prod/files/2015/11/f27/QTR2015‐8A‐Connected‐Automated‐Vehicles.pdf
Navigant
Navigant publishes a ranking of 18 manufacturers and rates them on 10 criteria related to implementation of
AV/CV: vision, go‐to market strategy, partners, production strategy, technology, sales, marketing and
distribution, product capability, product quality and reliability, product portfolio and staying power. Using
Navigant’s methodology, companies are profiled, rated and ranked to provide an objective assessment of their
relative strengths and weaknesses in the global market for automated driving systems. An executive summary is
available at https://www.navigantresearch.com/research/navigant‐research‐leaderboard‐report‐automated‐
driving.
Eno Foundation
Preparing a Nation for Autonomous Vehicles: Opportunities, Barriers and Policy Recommendations (2013) is the
second annual William P. Eno Research Paper, a competitive paper competition among Eno’s Leadership
Development Conference Fellows. Authored by Daniel Fagnant, a Ph.D. candidate at the University of Texas at
Austin, and Kara M. Kockelman, an engineering professor at the University of Texas at Austin, the paper focuses
on the changes and benefits autonomous vehicles could bring to the nation’s transportation system. Barriers to
implementation, liabilities, security and data privacy are also discussed, as well as the impacts and interactions
with other components of the current transportation system.
Eno also published a summary of key policy drivers for automation in 2013.
RAND
The RAND Corporation has published several reports assessing policy and planning strategies at the state,
regional and local levels. This includes a project under the aforementioned NCHRP 20‐102 series.
RAND’s most extensive report on vehicle automation was released in 2016 and featured guidance for policy
makers. Autonomous Vehicle Technology: A Guide for Policymakers explores policy issues, communications,
regulation and standards and liability issues raised by the technology and concludes with some tentative
guidance for policy makers, guided largely by the principle that the technology should be allowed and perhaps
encouraged when it is superior to an average human driver.

A Citizen’s Guide to Missouri’s Transportation Future: Long Range Transportation Plan Update A-2
Morgan Stanley
Morgan Stanley Blue Papers involve collaboration from analysts, economists and strategists to address long‐
term, structural business changes that are reshaping economies and industries. As part of their research,
Morgan Stanley produced “Global Investment Implications of Auto 2.0” in 2016 that provided a framework for
comparing how automotive technologies might be adopted across the various countries. They have also
produced several presentations reflecting expected outcomes and building a market driven case for continuing
investment. In 2013, Morgan Stanley predicted complete autonomous capability to be available in 2018‐2022.
The focus is on potential cost savings, estimated at over $1.3 trillion in the U.S. alone. Morgan Stanley has also
regularly focused on the societal impacts in other industries, including media, software, insurance, medical and
lodging.
Newsletters A newsletter, proctored by Dr. Alain Kornhauser at Princeton University, providing news and commentary. Smart
Driving Cars. https://lists.princeton.edu/cgi‐bin/wa?SUBED1=SmartDrivingCars&A=1.
A newsletter, produced by the T‐SET at Carnegie Mellon University, providing digests of news items on
automation and shared mobility.
A newsletter, produced by ITS America, providing news items on advanced technologies and policies in
transportation. ITS America Smart Brief.
http://r.smartbrief.com/resp/jvmSCudYAGDajBzaCiejdbCicNlcRZ?format=standard
Websites State summaries of activity, updated regularly by the National Conference of State Legislatures.
http://www.ncsl.org/research/transportation/autonomous‐vehicles‐self‐driving‐vehicles‐enacted‐
legislation.aspx#additional
A primer on the key companies and leaders in the advancement of emerging vehicle technologies:
https://www.slideshare.net/Altimeter/the‐race‐to‐2021‐the‐state‐of‐autonomous‐vehicles‐and‐a‐whos‐who‐of‐
industry‐drivers
Center for Automotive Research (CAR) Publications ‐ Connected Vehicle Technology (http://www.cargroup.org/?module=Publications&filter%5Bcat%5D=7)
Intelligent Transportation Systems Joint Program Office ‐ Connected Vehicles
University of Michigan Transportation Research Institute ‐ Connected Vehicle Technology
http://www.businessinsider.com/companies‐making‐driverless‐cars‐by‐2020‐2016‐10/#bmw‐will‐introduce‐its‐
self‐driving‐cars‐in‐china‐in‐2021‐5

A Citizen’s Guide to Missouri’s Transportation Future: Long Range Transportation Plan Update B-1
APPENDIX B: DEFINITIONS Automated An automated vehicle performs certain tasks to assist driver behavior. Often used in reference to vehicle
systems (i.e., an automated vehicle system rather than an automated vehicle). However, an automated vehicle
is any vehicle with one or more automated systems.
Autonomous An autonomous car is a vehicle that can guide itself without human input for some period of time and in some
operational environments. It is used synonymously with driverless, self‐driving and highly autonomous vehicle
(HAV). The SAE levels of autonomy are used when more specificity is required, or the conditions of autonomy
are explicitly explained.
Connected A connected vehicle includes equipment that connects the devices to other devices within the car/vehicles and
or devices, networks and services outside the car including other cars, home, office or infrastructure. Connected
vehicles currently can use a range of services for connection, including wi‐fi, radio signals, dedicated short range
communications, Bluetooth and cellular.
Self-Driving Self‐driving cars allow drivers to take their hands off the wheel and feet off the pedals in some driving environments at some times. It may or may not have completely automated processes and expect some degree of human intervention.
Driverless Driverless vehicles drive themselves the whole way from some origins to some destinations over some routes at
some times and, as such, can operate completely empty with no human on‐board in those situations. The key
aspect of these technologies is that they operate and share the existing streets and roadways with conventional
human‐operated cars, trucks, buses, bicycles, pedestrians, etc. Driverless fundamentally disrupts the mobility
system by enabling the provision of high‐quality demand responsive mobility to essentially everyone,
revolutionizing the efficiency and executions of the distribution of goods at substantially more affordable cost
and, in the process substantially reducing (>50 percent) energy consumption and pollution and substantially
reducing congestion (Kornhauser 2017).

A Citizen’s Guide to Missouri’s Transportation Future: Long Range Transportation Plan Update C-1
APPENDIX C: ORIGINAL EQUIPMENT MANUFACTURERS’ DETAILED ANNOUNCEMENTS General Motors General Motors has not laid out a specific timeline for its self‐driving cars, but the company has made it clear
that they are proceeding to a self‐driving vehicle future. On June 13, 2017, General Motors revealed that it had
mass‐produced 130 units of next‐generation automated Chevrolet Bolt electric vehicles (EVs) for testing
purposes. With this, the company claimed to be the first automaker to mass‐produce autonomous vehicles.
General Motors is testing 50 cars in three cities: San Francisco, California; Scottsdale, Arizona; and Detroit,
Michigan.
General Motors also made an investment in Lyft, the ride‐sharing services provider, and launched its on‐demand
mobility services brand, Maven.
Ford Ford CEO Mark Fields told CNBC that Ford plans to have a, “Level 4 vehicle in 2021, no gas pedal, no steering
wheel and the passenger will never need to take control of the vehicle in a predefined area.” To support this
effort, Ford manages a website at https://corporate.ford.com/innovation/autonomous‐2021.html to detail its
Ford Smart Mobility effort—its plan to be a leader in autonomy, connectivity, mobility, customer experience and
analytics. To accelerate their efforts, Ford has partnered with Velodyne, SAIPS, Nirenberg Neuroscience LLC and
Civil Maps.
Ford was the first manufacturer to test within the MCity facility at the University of Michigan and expects to
have 90 Fusion hybrids in its autonomous vehicle test fleet by 2018. Ford’s Fusion Hybrid Autonomous Research
Vehicles also will be used to deliver pizzas to Domino’s customers in Ann Arbor who agree to be a part of this
testing program. Results are pending.
Honda Honda’s long‐stated goal is to have cars that can at least drive themselves on highways (SAE Level 3 automation)
by 2020. When Tokyo hosts the Summer Olympics in 2020, Japan hopes to make that a showcase of
technological prowess, including vehicle automation. Honda has been one of the more cautious automakers
when it comes to self‐driving cars, according to Navigant.
Honda is targeting 2025 for Level 4 automation.
Toyota Motor Corporation Since the 1990s, Toyota has engaged in automated driving technology research and development. According to
a 2016 report by the Intellectual Property and Science division of Thomson Reuters, Toyota holds more patents
in the automated vehicle field than any other company.

A Citizen’s Guide to Missouri’s Transportation Future: Long Range Transportation Plan Update C-2
Toyota’s Mobility Teammate Concept is their design concept to understand the relationship between humans
and cars. In January 2016, Toyota established a new company, Toyota Research Institute, Inc., as a base to boost
research and development into artificial intelligence technology and will invest some $1 billion over the coming
years.
Hyundai Hyundai is working on self‐driving vehicles with more of a focus on affordability. In an announcement, Hyundai
claims it is, “developing its own autonomous vehicle operating system with the goal of using a lot less computing
power.” This will result in a low‐cost platform, which can be installed in future Hyundai models the average
consumer can afford.
Hyundai’s HDA2 system is considered a Level 2 autonomous feature, similar to Tesla’s Autopilot. The software
handles speed and stops in highway driving conditions, and also handles changing to a crossroad, entering a
junction and merging onto a main road automatically when a driver indicates intent to do so using a turn signal.
Hyundai showcased its self‐driving technologies beyond level 2 at the Pyeongchang 2018 Winter Olympics.
Tesla Motors Tesla Motors provided the first software‐delivered driver‐assisted system with its Autopilot function on its line
of automobiles. To date, Tesla is the only manufacturer that has broadly released automated features that
include both hands‐free and feet‐free controls. Since 2014, Tesla has been collecting data from its vehicles to
consistently improve its Autopilot system. Tesla also was the subject of the industry’s first fatality, as a driver in
Florida was killed in a collision when the Autopilot feature was enabled.
Tesla unveiled an electric commercial truck in November.
Renault-Nissan Renault‐Nissan expanded a partnership with Microsoft to help advance the company’s autonomous car efforts.
Renault‐Nissan plans to release 10 different automated cars by 2020, using its “Safety Shield” and “Pro‐pilot”
packages to provide driver assistance and self‐driving in certain settings.
Nissan’s “Intelligent Mobility” initiative focuses on three things: how vehicles are powered, how they are driven
and how they are integrated into society.
Nissan became the first big player to declare it had no hope of making a car that could handle the whole world
on its own. Nissan plans to use flesh‐and‐blood humans in remote call centers to guide troubled AVs around
confusing situations, like construction zones. The company proposes its operators will use cars’ built‐in sensors
and cameras to guide vehicles through confusing situations. “We will always need the human in the loop,”
Nissan's Silicon Valley research head Maarten Sierhuis told WIRED magazine in December 2016.

A Citizen’s Guide to Missouri’s Transportation Future: Long Range Transportation Plan Update C-3
Fiat Chrysler/BMW In May 2016, Fiat Chrysler began to collaborate with Google/Waymo. Under this collaboration, Fiat Chrysler
produced about 100 Chrysler Pacifica hybrids to test Google’s self‐driving technology. It completed this
production in December 2016, and these vehicles are currently part of Waymo’s test fleet in Arizona.
In June 2017, Fiat Chrysler announced that it would join a BMW‐led consortium to develop self‐driving car
technology, with an aim of producing fully automated vehicles by 2021.
Volvo Volvo was the first manufacturer to announce it will accept the liability if one of its autonomous cars crashes
when driving itself. The Swedish company currently is testing its Drive Me program in Gothenberg, Sweden, with
volunteer participants. Volvo has also announced an investment with Uber to develop automated fleet
technologies. Their current technology allows for “unsupervised” driving in limited settings.
Volvo is also a partner on the European Union’s AdaptIVe project, which will develop automated driving
functions for daily traffic. The project addresses legal issues that might impact successful market introduction.
Others Jaguar Land Rover announced its intentions to begin testing its vehicle‐to‐vehicle and vehicle‐to‐infrastructure
technology in 2018. Korean manufacturer Kia is launching a sub‐brand, Drive Wise, and recently received testing
permission in Nevada. Mazda has not announced a date or information, but has pledged to develop more
advanced assistance systems in future model years. Mercedes has embraced driver assistance technologies but
has not announced a timeline for moving to self‐driving features.
Partnerships ► General Motors acquired tech start‐up Cruise Automation to accelerate its autonomous vehicle
development in March 2016. Cruise Automation was founded in 2013 in San Francisco and is known for its
highway automated systems for vehicles. ► Ford and Lyft have announced a new partnership that will, “help both companies progress toward a more
affordable, dependable and accessible transportation future,” using self‐driving vehicles, according to Sherif
Marakby, Ford Vice President, Autonomous Vehicles and Electrification. In an article with Medium.com,
Marakby said that the companies will leverage their strengths in their respective fields—such as Ford's
experience with autonomous vehicle technology development and large‐scale manufacturing, Lyft's network
of customers, a growing demand for rides and strong knowledge of transportation flow within cities and
both companies' experience with fleet management and big data—to, “effectively share information to help
make the best decisions for the future.” Ford also invested over $1 billion in an artificial intelligence startup
company, Argo AI. ► Samsung announced two major pieces of news in September 2017. It launched the Samsung Automotive
Innovation Fund, a $300 million fund to back startups and other interesting bets in the automotive market
and, as a first investment out of that fund, Samsung made a nearly $90 million investment in TTTech, an
Austria‐based developer of platforms and safety software for connected cars, alongside a corresponding
investment from automobile manufacturer Audi.

A Citizen’s Guide to Missouri’s Transportation Future: Long Range Transportation Plan Update C-4
► Samsung acquired Harman, an auto and audio product maker, in November 2016 and announced a strategic
initiative to develop connected‐car technology.
► Volvo entered into a $300 million joint venture with Uber to develop next‐generation autonomous driving
cars. Volvo is providing the physical vehicles for Uber’s self‐driving tests.
► Fiat Chrysler signed a memorandum of understanding with BMW Group, Mobileye and Intel, which would
allow all these companies to work together to speed up their autonomous vehicle development program.
► Baidu announced in early July that more than 50 companies, including Ford, Daimler, NVIDIA, Intel,
Microsoft and popular LiDAR‐supplier Velodyne, have joined its Apollo self‐driving car platform.
► Volkswagen invested $180 million in smart car technology provider Mobvoi.
► In June 2017, Applied Research Associates, Inc., acquired Neya Systems to bring advanced artificial
intelligence, perception sensors and automation technologies to personal and military off‐road vehicles.
► Volvo announced a self‐driving joint venture with Swedish supplier Autoliv in January 2017. Labeled Zenuity,
the joint venture targets driver assist systems by 2019, also making them available to other automakers.
► Bosch and Mercedes announced a partnership in April 2017 to develop Level 4 and Level 5 automated
systems.
Waymo began as the Google Self‐Driving Car project in 2009. In 2017, Waymo launched its early rider program
in Phoenix, Arizona, to use its fleet of Chrysler Pacifica minivans for mobility services.
Waymo’s test vehicles have driven approximately 3,000,000 miles in automated modes across test sites in
California, Arizona, Texas and Washington.
In June 2017, CEO Tim Cook confirmed that Apple is working on the autonomous systems behind driverless cars.
“Project Titan” was Apple’s code name for a potential automated vehicle project; however, Apple’s efforts now
seem focused on software development. Apple was awarded a test certificate in April 2017 to use a version of
its software.
Baidu’s Autonomous Driving Unit (ADU) aims to develop vehicles capable of sensing and navigating without
human input. ADU is part of Baidu’s Intelligent Driving Group, combining Baidu’s Autonomous Driving Unit,
Intelligent Vehicle Unit and CarLife with a mission to accelerate auto industry upgrade in artificial intelligence
applications. Baidu is testing in California’s GoMentum Station.
Faraday Future is headquartered in Los Angeles and has been linked to manufacturing plans for electric
automated vehicles. As of August 2017, production plans have not emerged and a leased facility in Central
California is being considered.
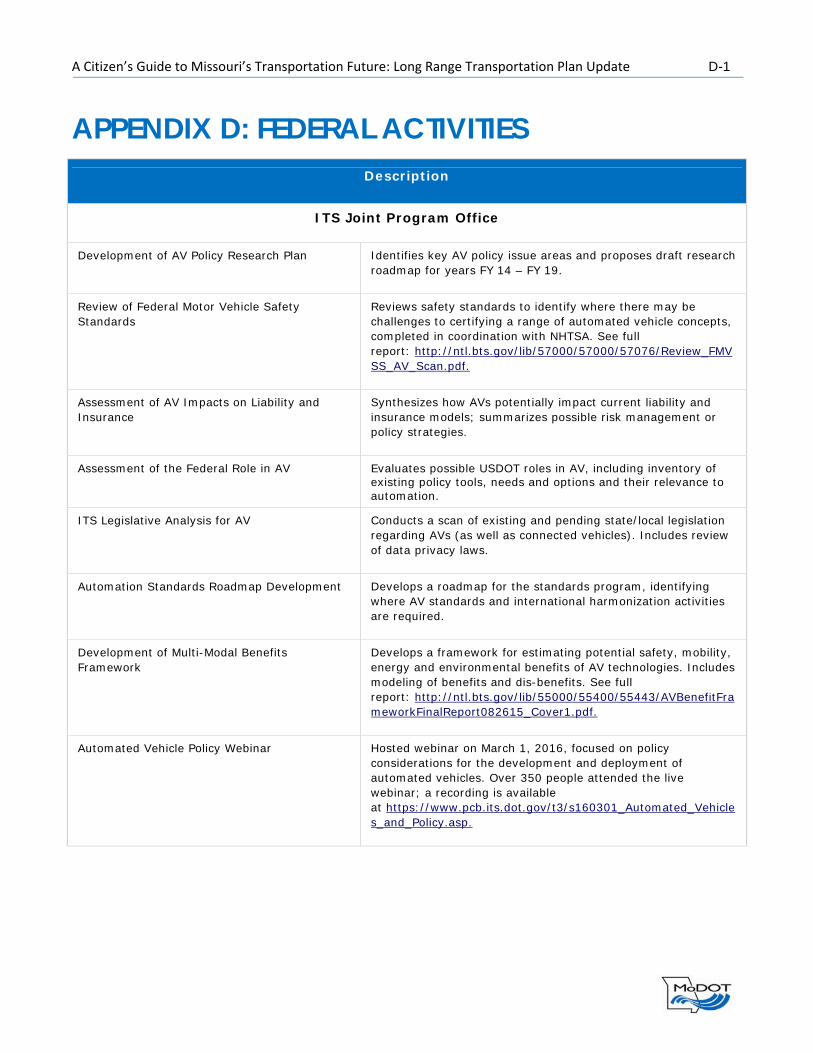
A Citizen’s Guide to Missouri’s Transportation Future: Long Range Transportation Plan Update D-1
APPENDIX D: FEDERAL ACTIVITIES Description
ITS Joint Program Office
Development of AV Policy Research Plan Identifies key AV policy issue areas and proposes draft research roadmap for years FY 14 – FY 19.
Review of Federal Motor Vehicle Safety Standards
Reviews safety standards to identify where there may be challenges to certifying a range of automated vehicle concepts, completed in coordination with NHTSA. See full report: http://ntl.bts.gov/lib/57000/57000/57076/Review_FMVSS_AV_Scan.pdf.
Assessment of AV Impacts on Liability and Insurance
Synthesizes how AVs potentially impact current liability and insurance models; summarizes possible risk management or policy strategies.
Assessment of the Federal Role in AV Evaluates possible USDOT roles in AV, including inventory of existing policy tools, needs and options and their relevance to automation.
ITS Legislative Analysis for AV Conducts a scan of existing and pending state/local legislation regarding AVs (as well as connected vehicles). Includes review of data privacy laws.
Automation Standards Roadmap Development Develops a roadmap for the standards program, identifying where AV standards and international harmonization activities are required.
Development of Multi-Modal Benefits Framework
Develops a framework for estimating potential safety, mobility, energy and environmental benefits of AV technologies. Includes modeling of benefits and dis-benefits. See full report: http://ntl.bts.gov/lib/55000/55400/55443/AVBenefitFrameworkFinalReport082615_Cover1.pdf.
Automated Vehicle Policy Webinar Hosted webinar on March 1, 2016, focused on policy considerations for the development and deployment of automated vehicles. Over 350 people attended the live webinar; a recording is available at https://www.pcb.its.dot.gov/t3/s160301_Automated_Vehicles_and_Policy.asp.
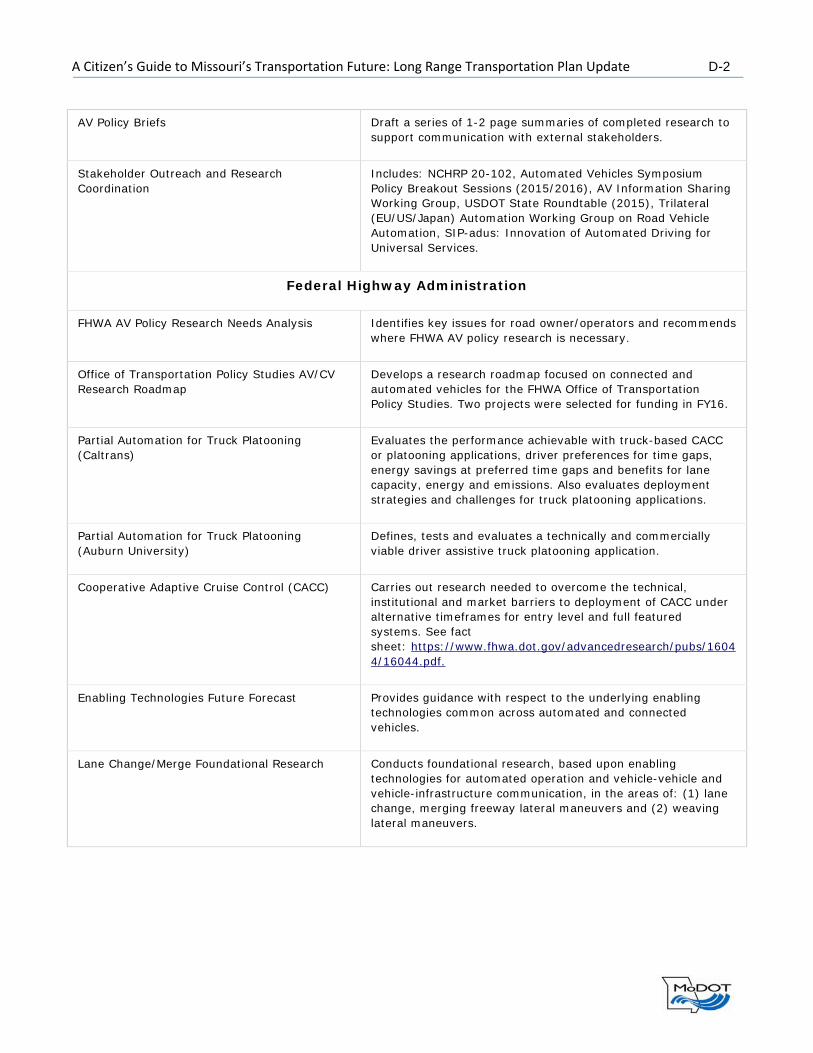
A Citizen’s Guide to Missouri’s Transportation Future: Long Range Transportation Plan Update D-2
AV Policy Briefs Draft a series of 1-2 page summaries of completed research to support communication with external stakeholders.
Stakeholder Outreach and Research Coordination
Includes: NCHRP 20-102, Automated Vehicles Symposium Policy Breakout Sessions (2015/2016), AV Information Sharing Working Group, USDOT State Roundtable (2015), Trilateral (EU/US/Japan) Automation Working Group on Road Vehicle Automation, SIP-adus: Innovation of Automated Driving for Universal Services.
Federal Highway Administration
FHWA AV Policy Research Needs Analysis Identifies key issues for road owner/operators and recommends where FHWA AV policy research is necessary.
Office of Transportation Policy Studies AV/CV Research Roadmap
Develops a research roadmap focused on connected and automated vehicles for the FHWA Office of Transportation Policy Studies. Two projects were selected for funding in FY16.
Partial Automation for Truck Platooning (Caltrans)
Evaluates the performance achievable with truck-based CACC or platooning applications, driver preferences for time gaps, energy savings at preferred time gaps and benefits for lane capacity, energy and emissions. Also evaluates deployment strategies and challenges for truck platooning applications.
Partial Automation for Truck Platooning (Auburn University)
Defines, tests and evaluates a technically and commercially viable driver assistive truck platooning application.
Cooperative Adaptive Cruise Control (CACC) Carries out research needed to overcome the technical, institutional and market barriers to deployment of CACC under alternative timeframes for entry level and full featured systems. See fact sheet: https://www.fhwa.dot.gov/advancedresearch/pubs/16044/16044.pdf.
Enabling Technologies Future Forecast Provides guidance with respect to the underlying enabling technologies common across automated and connected vehicles.
Lane Change/Merge Foundational Research Conducts foundational research, based upon enabling technologies for automated operation and vehicle-vehicle and vehicle-infrastructure communication, in the areas of: (1) lane change, merging freeway lateral maneuvers and (2) weaving lateral maneuvers.

A Citizen’s Guide to Missouri’s Transportation Future: Long Range Transportation Plan Update D-1
Automated Speed Harmonization – Prototyping and Testing
Develops, tests and evaluates an automated speed harmonization application, whereby speed recommendations are provided to automated vehicle systems in order to optimize network performance and smooth the operation of the traffic stream. See full report: https://www.fhwa.dot.gov/publications/research/operations/16023/16023.pdf.
Driver Acceptance of Vehicle Automation Applications
Examines critical human factors issues such as workload, situational awareness and distraction for Level 1 automation applications. Specific research areas include: (1) create virtual simulation environment on Level 1 automation applications and conduct human factors experiments; and (2) conduct test track or closed course experiments to validate simulations and expand dataset.
Universal Automated Community Transport Develops the foundational research and concept development for first mile/last mile mobility. The vision for these applications includes travelers with and without disabilities including those with mobility, hearing, vision and cognitive disabilities and the ability to accommodate their needs (wheelchairs, strollers etc.).
National Highway Traffic Safety Administration
Automated Vehicle Policy Development Agency statement that provides preliminary guidance to states regarding AVs and discusses agency research and subsequent updates. See: http://www.nhtsa.gov/Research/Crash+Avoidance/Automated+Vehicles.
American Association of Motor Vehicle Administrators (AAMVA) AV Best Practices Working Group
Develops best practices guide for member jurisdictions in regulating AVs and driver testing (this project is being funded by NHTSA but conducted by AAMVA).
Human Factors Evaluation of Level 2 and Level 3 Automated Driving Concepts
Investigated user interactions with Level 2 and Level 3 partially automated vehicles. See concepts of operation document: http://www.nhtsa.gov/DOT/NHTSA/NVS/Crash%20Avoidance/Technical%20Publications/2014/812044_HF-Evaluation-Levels-2-3-Automated-Driving-Concepts-f-Operation.pdf. See full report: http://www.nhtsa.gov/DOT/NHTSA/NVS/Crash%20Avoidance/Technical%20Publications/2015/812182_HumanFactorsEval-L2L3-AutomDrivingConcepts.pdf.
Functional Safety Assessment of Generic Electric Power Steering Systems with Active Steering and Four-Wheel Steering Features
Produces a functional safety description of the combined lateral and longitudinal control system, focused on lane centering, which is specific to the NHTSA definitions of levels 2 to 4 automated vehicle systems. This project focuses on automated lane centering systems operating during normal-driving and crash-imminent situations.

A Citizen’s Guide to Missouri’s Transportation Future: Long Range Transportation Plan Update D-2
Target Crash Populations for Automated Vehicles
Determines the target crash population that will provide a basis for the estimation of potential safety benefits from the deployment of automated vehicle concept functions at NHTSA's automation levels 2-4.
Naturalistic Study of L2 Automated Vehicle Functions
Establishes an initial understanding of automated vehicle operability through a naturalistic study of cutting-edge, near market-ready or market-ready automated vehicle functions that could be classified as Level 2 by NHTSA definitions.
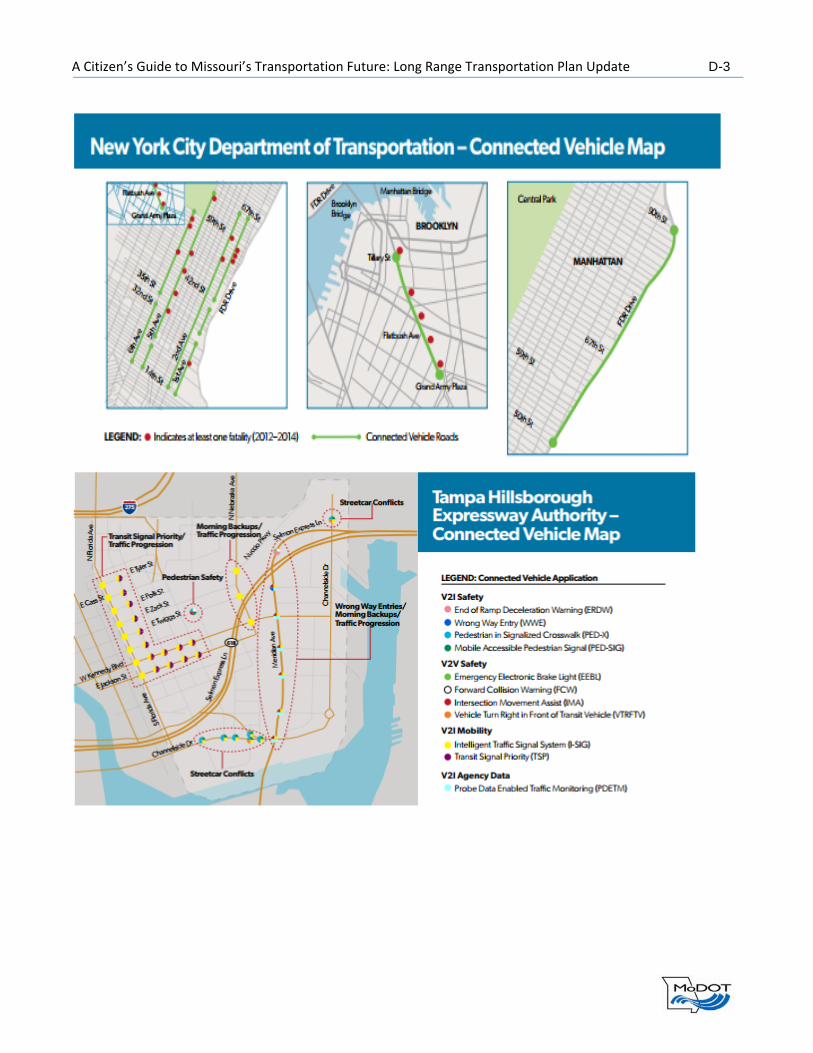
A Citizen’s Guide to Missouri’s Transportation Future: Long Range Transportation Plan Update D-3
A Citizen’s Guide to Missouri’s Transportation Future: Long Range Transportation Plan Update E-1
APPENDIX E: STATE ACTIVITIES Arizona An executive order signed in August 2015 directed agencies to, “undertake any necessary steps to support the
testing and operation of self‐driving vehicles on public roads within Arizona.” The governor also ordered the
enabling of pilot programs at selected universities and developed rules. The order established a Self‐Driving
Vehicle Oversight Committee within the governor’s office. “Arizona’s oversight group has met just twice in the
last year, and found no reason to suggest any new rules or restrictions on autonomous vehicles, so long as they
follow traffic laws,” the Arizona Republic reported in June. “The group found no need to suggest legislation to
help the deployment.”
Waymo is testing extensively in Chandler and Phoenix, Arizona. Waymo’s October announcement provides the
possibility of a commercial ride sharing service in Chandler using driverless vehicles yet in 2018.
California California was the first state to pass comprehensive automated driving legislation requiring licensure and overall
analysis. The initial law requires the California Highway Patrol to adopt safety standards and performance
requirements to ensure the safe operation and testing of autonomous vehicles, as defined, on the public roads
in this state. The law also permits autonomous vehicles to be operated or tested on the public roads in California
pending the adoption of safety standards and performance requirements.
The state recently issued revised guidance on the topic. After meeting resistance initially, the California
Department of Motor Vehicles is changing its rules to allow companies to test autonomous vehicles without a
driver behind the wheel—and to let the public use autonomous vehicles.
More details on California’s regulations are available at
https://www.dmv.ca.gov/portal/wcm/connect/f0a611ed‐9579‐44a3‐ac0b‐
85d9508f53d9/15DayExpressTerms.pdf?MOD=AJPERES.
Colorado The vision of Colorado’s RoadX program is to make the state a national leader in partnerships and use of
innovative technology and data for crash‐free, injury‐free, delay‐free travel. More details on RoadX are available
at https://www.codot.gov/programs/roadx.
A major goal of RoadX is to enable and accelerate the adoption of AV/CV technology. One key element of this
strategy was the development of a Connected Road Classification System (CRCS). Colorado’s CRCS includes six
levels:
► Level 1: Unpaved and/or non‐striped roads designed to a minimum level of standard of safety and mobility.
► Level 2: Paved roads designed to AASHTO’s standards with standard signage. There is not ITS equipment or
infrastructure to collect connected vehicle data (dedicated short‐range radio). Access to cellular date service
may be available.

A Citizen’s Guide to Missouri’s Transportation Future: Long Range Transportation Plan Update E-2
► Level 3: There is ITS equipment operated by a Traffic Operations Center and/or one‐way electronic data
share between DOT/vehicle/user and/or mixed use lanes.
► Level 4: Roadway or specific lane has adaptive ITS equipment (smart signals for vehicles, highway lighting
that turns on for vehicles, etc.) with Traffic Operations Center override and/or two‐way data share between
DOT/vehicle/user and/or lanes designated for vehicle Levels 3 and 4 only.
► Level 5: (Advance Guideway System) roadway or specific lane(s) designed for vehicle Level 4 only with
additional features that may include inductive charging, advance/enhanced data sharing, etc. Additionally,
no roadside signs are needed, as all roadway information is directed to vehicles’ on‐board systems.
► Level 6: All lanes on a roadway designed for only vehicle Level 4 systems—no signs, signals or striping
needed.
The CRCS allows for consistent expectations for manufacturers and the traveling public. It is currently being
considered for nation‐wide adoption through an NCHRP study under the 20‐102 series.
In addition to these activities, Colorado has used an automated crash truck in work zones. The state supported
and monitored an automated truck in partnership with the now‐Uber‐acquired company Otto. Colorado’s most
recent Transportation Summit was held October 23, 2017.
Connecticut Connecticut’s approved legislation (signed in June 2017) on AV/CV defines terms including “fully autonomous
vehicle,” “automated driving system” and “operator.” It requires the development of a pilot program for up to
four municipalities for the testing of fully autonomous vehicles on public roads in those municipalities and
specifies the requirements for testing, including having an operator seated in the driver’s seat and providing
proof of insurance of at least $5 million. Connecticut also established a task force to study fully autonomous
vehicles. The study must include an evaluation of NHTSA’s standards regarding state responsibility for regulating
AVs, an evaluation of laws, legislation and regulations in other states, recommendations on how Connecticut
should legislate and regulate AVs and an evaluation of the pilot program.
The Connecticut task force has not yet met.
Florida Florida was one of the first three states to pass automated vehicle legislation. The Florida regulations define
“autonomous vehicle” and “autonomous technology” and declare legislative intent to encourage the safe
development, testing and operation of motor vehicles with autonomous technology on public roads of the state
and finds that the state does not prohibit or specifically regulate the testing or operation of autonomous
technology in motor vehicles on public roads.
Florida authorizes any person who possesses a valid driver’s license to operate an autonomous vehicle,
specifying that the person who causes the vehicle’s autonomous technology to engage is the operator. Florida
also required a study on the use and safe operation of driver‐assistive truck platooning technology and allows
for a pilot project upon conclusion of the study.
The Tampa Hillsborough Expressway Authority (THEA) was selected as a pilot site by the USDOT and the
University of Central Florida has been engaged in the Central Florida Automated Vehicle Partners designated
proving grounds.

A Citizen’s Guide to Missouri’s Transportation Future: Long Range Transportation Plan Update E-3
Florida has also sponsored a series of summits on vehicle automation, including national and international
speakers. Approximately 350 people attend the annual summits. The 2017 summit was held November 14‐15 in
Tampa, Florida.
Georgia Georgia passed legislation in May to allow self‐driving cars on public roads. The Atlanta Regional Commission
convened a summit in September including over 300 officials and transportation experts to discuss future
mobility in Georgia and the Atlanta region.
Kansas Kansas is working on task forces with the Missouri DOT and has provided some framework for potential
legislative activity around connectivity and truck platooning. Kansas is deeply engaged with the Mid‐America
Regional Council (Kansas City) to develop initiatives to encourage pilot and demonstration activities.
Michigan Michigan allows wide testing and operation of autonomous vehicles under certain conditions, including
allowance for operations without a person in the vehicle. Michigan’s legislation also specifies that the following
distance requirements of 500 feet do not apply to vehicles in a platoon.
Michigan has invested heavily in MCity, a campus of urban simulated environments for testing and piloting
automated technologies. MCity is a 32‐acre space that has highways, roads, fire hydrants and mannequin
pedestrians. Connected car prototypes maneuvering through MCity interact with these elements as well as with
virtual vehicles and hazards.
Backed by Toyota and AT&T, the American Center for Mobility at Willow Run also constructed an area of roads,
a cellular network and a cloud service for automakers to test autonomous vehicles. The Center has been
officially designated as one of ten proving grounds.
Michigan is also a participant in the Smart Belt Coalition.
Minnesota Minnesota Go, a collaborative vision for transportation, offered a set of strategies for incorporating autonomous
vehicles in its planning processes. The Statewide Multimodal Transportation Plan included discussion on
unmanned aerial systems as well as connected and automated vehicles.
Recently, MnDOT chose EasyMile to lead its autonomous shuttle bus pilot project. MnDOT announced in June
2017 that it will begin testing the use of an autonomous shuttle bus in a cold weather climate. The project will
include a controlled demonstration at MnROAD, MnDOT’s pavement test track facility. A live test was also
conducted during the week of the 2018 Super Bowl.
Minnesota also prepared a document in 2015 that assessed existing laws and regulations in Minnesota that
would be affected by changing in‐vehicle technologies.

A Citizen’s Guide to Missouri’s Transportation Future: Long Range Transportation Plan Update E-4
Nevada Nevada was the first state to pass legislation expressly related to automated vehicles. Their legislation permits
use of mobile devices for persons in a legally operating autonomous vehicle and defines that these persons are
deemed not to be operating a motor vehicle for the purposes of law. Nevada requires an autonomous vehicle
that is being tested on a highway to meet certain conditions and provides that the manufacturer of a vehicle
that has been converted to be an autonomous vehicle by a third party is immune from liability for certain
injuries to a human operator. It also requires proof of insurance.
Nevada defines terms including “driver‐assistive platooning technology,” “fully autonomous vehicle” and
“automated driving system.” Their approach allows the use of driver‐assistive platooning technology and
preempts local regulation. It specifies that the following distance requirement does not apply to a vehicle using
platooning technology.
Nevada has been the site of several commercial vehicle tests of automated technologies, including Daimler
platooning and Peloton technologies. The state also sponsored a week‐long test of a Navya Arma shuttle on the
Las Vegas strip in January. Legislation passed in the summer of 2017 also authorized additional research and
testing of automated technologies for 2018.
Nevada recently invested in the creation of a research institute, the Advanced Center for Transportation
Mobility, a private sector, university and government partnership.
North Carolina The North Carolina Turnpike Authority was designated as a proving ground in 2016. The North Carolina DOT, in
response to rapid advancements in vehicle technology, is undertaking a study to understand what actions,
activities and processes are required to prepare the state for autonomous vehicles. The study, to be completed
by early 2018, includes measures necessary to successfully implement autonomous vehicle technology, including
any legislative changes, and also addresses complications or liabilities that could arise by allowing autonomous
vehicle technology.
Ohio Ohio has been engaged in several activities to promote both connected and automated vehicle research and
deployment. Ohio has designated 35 miles of four‐lane, limited access highway as a Smart Mobility Corridor.
This corridor includes high‐capacity fiber optic cable to instantaneously link researchers and traffic monitors
with data from embedded and wireless sensors along the roadway. The $15 million investment will support the
state’s Smart Mobility Initiative, a collaborative effort between Ohio DOT, the Ohio Department of Public Safety,
Wright‐Patterson Air Force Base, Case Western Reserve University, University of Cincinnati, University of
Dayton, Wright State University, The Ohio State University, Transportation Research Center and the Ohio
Turnpike and Infrastructure Commission.
The state has also begun a branded DriveOhio initiative. This campaign calls for promotion of vehicle
communication technology.
A Citizen’s Guide to Missouri’s Transportation Future: Long Range Transportation Plan Update E-5
The Ohio Transportation Research Center received an initial $45 million investment from the state and Ohio
State University for expansion of the center’s 540‐acre SMART Center, a state‐of‐the‐art hub for autonomous
and connected vehicle research.
Columbus won the Smart City Challenge in 2016. The project drew an initial investment of $50 million, including
a $40 million grant from the USDOT and an additional $10 million from Vulcan, Inc. The city will also match that
investment with more than $360 million in pledges from public and private sector partners, according to
information from the city. While not all of the investment relates to transportation initiatives, there is a
substantial amount of activity underway.
Ohio is also a participant in the Smart Belt Coalition.
Oregon Oregon appointed a Connected, Automated and Electric Vehicles Advisor to lead efforts to attract and test
advanced vehicles in the state. The city of Portland has also announced its own municipal specific initiative and
developed an Autonomous Vehicles Policy Statement and is currently reviewing responses to a request for
information about deployment testing.
Pennsylvania Pennsylvania recently passed legislation to provide highly automated vehicle testing. PennDOT has also drafted
a strategic plan for AV/CV and hosted statewide workshops on the subject. PennDOT assembled an Autonomous
Vehicle Policy Task Force to prepare draft legislative policy recommendations for the testing of automated
vehicles in Pennsylvania. The task force is made up of a diverse and comprehensive set of stakeholders,
including representatives from federal, state and local government, law enforcement, technology companies,
higher education, manufacturers, motorists, trucking groups and academic research institutions. The final policy
will be drafted in such a manner that it encourages and attracts associated automated vehicle business in
Pennsylvania without compromising public safety.
In addition, PennDOT selected an on‐call consultant to provide additional support for connected and automated
vehicle deployments, evaluations and demonstrations. PennDOT is piloting an autonomous shuttle service in
Middletown, Pennsylvania. The proposed pilot will allow for an autonomous shuttle to connect four
transportation hubs: Harrisburg International Airport, the Pennsylvania State University‐Harrisburg campus, the
new Middletown Station served by Amtrak and downtown Middletown.
The city of Pittsburgh and Penn State University’s Thomas D. Larson Pennsylvania Transportation Institute were
designated as a joint test site and proving grounds by USDOT. PennDOT is also a participant in the Smart Belt
Coalition.

A Citizen’s Guide to Missouri’s Transportation Future: Long Range Transportation Plan Update E-6
Tennessee Tennessee passed legislation that allows a motor vehicle to be operated by, or to be equipped with, an
integrated electronic display visible to the operator while the motor vehicle's autonomous technology is
engaged and redefines “autonomous technology” for purposes of preemption. Tennessee also defined “driving
mode” and “dynamic driving task.” The legislation also widely defines an automated driving system as on par
with human controlled vehicles.
Texas Texas passed legislation that allows the use of a connected braking system to maintain the appropriate distance
between vehicles and specifies that “connected braking system” means a system by which the braking of one
vehicle is electronically coordinated with the braking system of a following vehicle.
Their legislation also defines a number of terms, including “automated driving system,” “automated motor
vehicle,” “entire dynamic driving task” and “human operator” and preempts local regulation of automated
motor vehicles and automated driving systems.
Austin, Texas, has been the site of several Waymo‐sponsored driving tests. The Texas Transportation Institute is
also actively engaged in connected and automated vehicle work. Texas is the home to a USDOT‐designated
automated vehicle proving ground.
Washington, D.C. Washington, D.C. defines “autonomous vehicle” as “a vehicle capable of navigating District roadways and
interpreting traffic‐control devices without a driver actively operating any of the vehicle’s control systems.” It
requires a human driver “prepared to take control of the autonomous vehicle at any moment” and restricts
conversion to recent vehicles, and addresses liability of the original manufacturer of a converted vehicle. D.C.
has also joined a coalition of international cities to produce a set of principles and tools that cities can use to
plan for driverless technologies.
Wisconsin Wisconsin established a special committee to recommend a coordinated effort on how best to advance testing
and operation of AV/CV. The committee is chaired by the Wisconsin DOT Secretary and includes members
representing the state legislature, public agencies, law enforcement, auto manufacturers, trucking, motorcycles
and other sectors. They have held two meetings focused on initial strategies to advance testing and pilot efforts.
A Citizen’s Guide to Missouri’s Transportation Future: Long Range Transportation Plan Update F-1
APPENDIX F: INTERVIEW QUESTIONS The following questions were asked of interview participants:
1. How has the introduction of new technologies influenced your day to day activities? Medium to long term
planning? What changes are you considering moving forward?
2. What do you see as the major changes you would need to make today to accommodate new in‐vehicle
technology? What infrastructure investments do you believe will need to be made?
3. What resources are available to you to assist in your knowledge development on this subject? What sources
do you currently use for gathering information?
4. Many authors and experts have predicted a variety of barriers to public sector preparedness. These include
market adoption, policy, liability and privacy concerns. What barriers do you see as the primary challenges
for MoDOT?
5. Who do you see as the necessary participants in developing a statewide strategy?
6. What message do you see as the primary focus for MoDOT’s AV/CV planning efforts? Is it a safety
focus? Will travel demand (better capacity, shoulder usage, general efficiency) sell with the traveling public?
7. Is there a corridor/location that you believe would be ready for pilot efforts?
8. Are there other observations that you have or items that we need to discuss

A Citizen’s Guide to Missouri’s Transportation Future: Long Range Transportation Plan Update G-1
APPENDIX G: AV/CV WORKSHOP PARTICIPANTS Name Organization
Alex Wassman Missouri Department of Transportation
Amanda Graor Mid‐America Regional Council
Andy Popp Missouri Department of Economic Development Division of Energy
Andy Thomason Ozarks Transportation Organization
Angela Nelson Missouri Department of Insurance
Ashley Buechter Missouri Department of Transportation
Ben Reeser Missouri Department of Transportation
Bobby Cottam Burns & McDonnell
Caitlin Zibers St. Joseph MPO
Carlos Sun University of Missouri
Chance Long St. Joseph MPO
Charlie Nemmers University of Missouri
Cheryl Ball Missouri Department of Transportation
Chris Redline Missouri Department of Transportation
Christine Murray Greater Kansas City Chamber of Commerce
David Wyman Missouri Department of Transportation
Ed Hassinger Missouri Department of Transportation
Jason Bittner Applied Research Associates
Jay Bledsoe Applied Research Associates
Jay Wunderlich Missouri Department of Transportation
Jeff Carroll High Street Consulting Group
Jeff Glenn Mercury Alliance
Jen Harper Missouri Department of Transportation
Jenni Jones Missouri Department of Transportation
Jerica Holtsclaw Missouri Department of Transportation
John Cauwenbergh Missouri Department of Transportation
Jon Nelson Missouri Department of Transportation
Julie Lorenz Burns & McDonnell
Julie Stotlemeyer Missouri DOT
Justin Wagner Missouri Department of Transportation
Karen Miller Missouri Department of Transportation
Kim Burton Missouri Public Service Commission
Kimberly Bonhart UPS
Leah Christian City of Columbia/Columbia Area Transportation Study Organization
Lisa LeMaster Missouri Department of Transportation
Luke Holtschneider Missouri Department of Economic Development
Luke Reed Missouri Department of Transportation
Machelle Watkins Missouri Department of Transportation

A Citizen’s Guide to Missouri’s Transportation Future: Long Range Transportation Plan Update G-2
Mark Croarkin Missouri Department of Transportation
Matthew Volz HDR
Michael DeMers Missouri Department of Transportation
Mike Right AAA‐Auto Club of Missouri
Mitch Skov Columbia Area Transportation Study Organization (CATSO)
Nicole hood Missouri Department of Transportation
Paige Kempker Missouri Department of Transportation
Patrick McKenna Missouri Department of Transportation
Paula Gough Missouri Department of Transportation
Peter Koeppel East‐West Gateway Council of Governments
Randy Johnson Missouri Department of Transportation
Raymond Webb MARC
Scott Marion Missouri Department of Transportation
Sonya Pointer East‐West Gateway Council of Governments
Steve Witte Missouri Insurance Coalition
Tom Blair Missouri Department of Transportation
Tom Crawford Missouri Trucking Association
Tony Reinhart Ford Motor Company
Travis Koestner Missouri Department of Transportation

A Citizen’s Guide to Missouri’s Transportation Future: Long Range Transportation Plan Update H-1
APPENDIX H: WORKSHOP POLL QUESTIONS AND RESULTS

A Citizen’s Guide to Missouri’s Transportation Future: Long Range Transportation Plan Update H-2
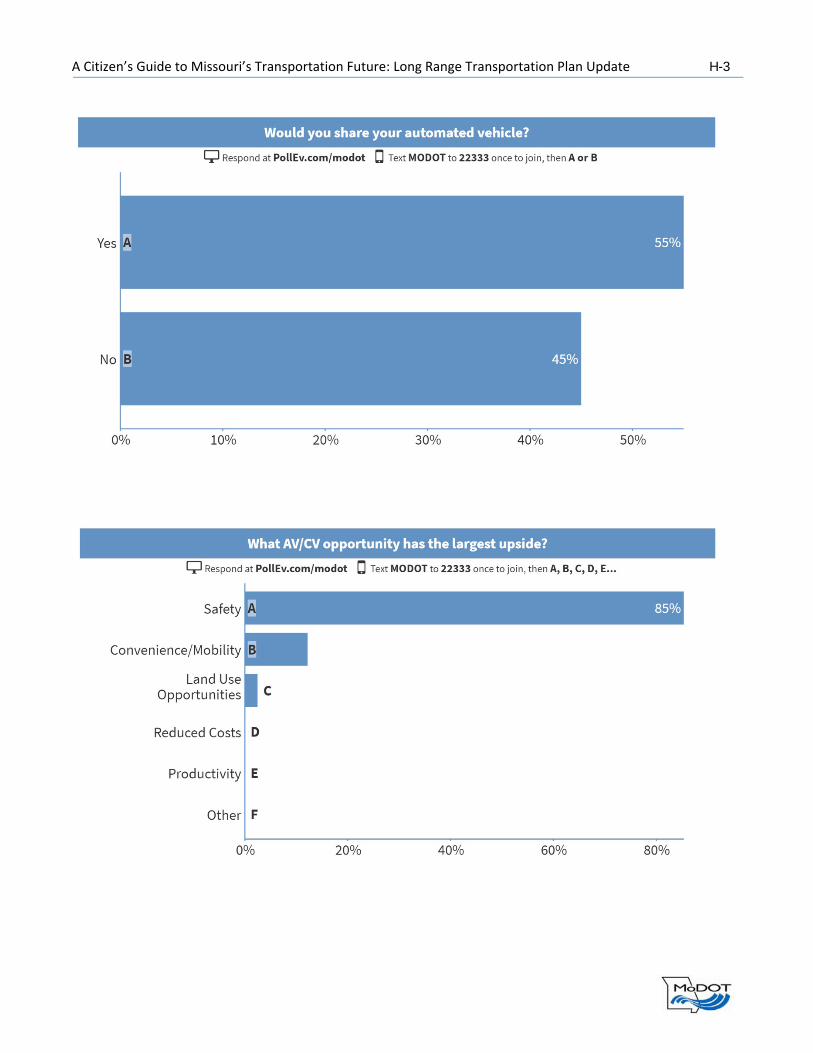
A Citizen’s Guide to Missouri’s Transportation Future: Long Range Transportation Plan Update H-3

A Citizen’s Guide to Missouri’s Transportation Future: Long Range Transportation Plan Update H-4

A Citizen’s Guide to Missouri’s Transportation Future: Long Range Transportation Plan Update H-5

A Citizen’s Guide to Missouri’s Transportation Future: Long Range Transportation Plan Update I-1
APPENDIX I: BREAKOUT GROUP DISCUSSION SUMMARY This appendix provides the responses recorded on individual flip charts during the workshop.
Group 1 Based on what you have heard, what do you think are the key issues for public sector leaders?
► Legislation/policy
► Cost
► Knowing their role
► Can’t lose sight of basic infrastructure investments (striping, fiber, ITS, signals)
► Uniformity and how to handle disconnects
► How to publicly have a position, when you could be negatively impacting industry (people losing jobs)
► How and when to be ready
What happens if we do nothing?
► More lives lost
► People and businesses leave Missouri
► Continue to be last
► Private sector investments may not benefit the overall policy
► Lack of coordination/chaos
Who should be at discussion table that isn’t here now?
► Public health
► Politicians
► Media
► Constituents
► Ride share groups
► Youth/students
► Feds
Are there other areas of concern that you have?
► Buy in of voters
► Fear of change
► Personal financial capacity
► Social interaction
► Cybersecurity
Potential State Activities
► Legislation
► Piloting
► Deployment
► Early adoption
► AV/CV committee
A Citizen’s Guide to Missouri’s Transportation Future: Long Range Transportation Plan Update I-2
► Partner with universities, technology and public
► Coordinate with other states
► Ensure good quality stripes, practical and focused infrastructure investments
► Be open to new ideas
Potential Local Agency Activities
► Coordinate with state on technology deployments
► Share perspective, educate at local Transportation Advisory Committee meetings
► Provide test/pilot areas
► Use their lobbying power
► Promote shared transportation
► Be open to new ideas
What role might the private sector play?
► Financing/investment
► Tell us what you need
► Brain power
► Use lobbying power
► Market
► Lead the way
► Tell us when too much
► Promote consistency nationwide
► Be open
Group 2 Based on what you have heard, what do you think are the key issues for public sector leaders?
► Fed vs. state regulations
► Liability
► Privacy
► Cybersecurity
► Who pays for upgrades? (social and infrastructure)
► What to spend Money on?
What happens if we do nothing?
► Disconnect between states
► Economic development issues
► Being left behind
Who should be at the table that isn’t here now?
► Car manufacturers
► Transit operators
► People with mobility issues
► Politicians

A Citizen’s Guide to Missouri’s Transportation Future: Long Range Transportation Plan Update I-3
Are there other areas of concern that you have?
► Who pays for it?
► Decrease in jobs in driving sector
► Increase in ownership (non‐drivers utilize cars)
► Phasing in of AV/CV
Potential State Activities
► Passing legislation
► Start to prepare
► Partner with other states
► Engage manufacturers
► Create AV/CV committee
► Keep up with changes
Potential Local activities
► Participate with state activities
► Invest in Smart infrastructure
What role might the private sector play?
► Share data
► Allow testing on private land/space
Group 3 Based on what you have heard, what do you think are the key issues for public sector leaders?
► Timing
► Infrastructure
► Boundaries/state lines
► Standardization/consistency
Local agencies?
► Remove barriers
► Planning partners
► Public transportation
► Private sector activities
► Security public and private
► Continued research
► Keep discussion going
► Help shape legislation
What happens if we do nothing?
► Loss of revenue/jobs
► Loss of options
► If you don’t know the rules, not going to play
► Safety concerns

A Citizen’s Guide to Missouri’s Transportation Future: Long Range Transportation Plan Update I-4
Who should participate?
► Private industry
► General motoring public
► Diverse drivers
► Manufacturers
Other areas of concern
► Liability/insurance
► Loss of driver skills
► Autonomous /non‐AV compatibility
► Community vehicle…who is responsible?
► Local vs. non‐local commutes…are they different?
► Unique environmental reactions (e.g. crash, weather, road work)
Next steps
► Bring all partners together
► Legislation in partnership with OEMS, insurance, law enforcement, department of revenue
► Buy in from stakeholders
► Continue collaboration with other states
► Identify potential test sites
► Determine fiscal impacts
Group 4 Based on what you have heard, what do you think are the key issues for public sector leaders?
► Funding
► Connectivity standards
► Clarity of direction “we don’t know”
► Typical vehicle age – 12 years – time to saturate
► Inconsistent legislation
What happens if we do nothing?
► Need liability coverage to move forward
► Will be left out without uniform laws
► State liability/regulatory Fed technology
► Won’t realize benefits
Who should be at the table that isn’t here now?
► Insurance
► Auto makers
► Legislators
► Special interest groups – Uber, Lyft, labor, mass transit, unions, public, investors
► Public agencies/planners
► Everyone?
► Federal safety/buyout program?
A Citizen’s Guide to Missouri’s Transportation Future: Long Range Transportation Plan Update I-5
Other areas of concern
► Special interest resistance
► Too much government help
► Partnership – support for deployment
► Stuff we don’t know
► Technology failure/loss of connection
Potential State Activities
► State legislative direction
Liability
Enabling legislation
► Too early for public education?
► Pay attention to industry
Potential Local Activities
► Community surveys/discussion/education
► Local legislation to enable support (try not to block it)
► Gauge community outlook
What role might the private sector play?
► Education, most important player
► Funding/investment
► Collaborative support
► Technology integration
Group 5 Based on what you have heard, what do you think are the key issues for public sector leaders?
► Workforce of government/Department of Transportations
► Level of knowledge
► Unfunded mandates
► Public relations campaign
► Regulations (federal and state)
► Economic impacts (who wins, who loses…. equity)
What happens if we do nothing?
► Litigation
► Economically left behind
► (“dumb cars”)
► Lives still lost/no reduction in fatalities
Who should be at table that isn’t here now?
► United States Department of Transportation
► Legal experts
► Department of Public Safety
► Local public agencies
► Department of Insurance

A Citizen’s Guide to Missouri’s Transportation Future: Long Range Transportation Plan Update I-6
► Department of Revenue
► Attorney General’s Office
Other concerns
► Weather
► Transition from level 4 to 5
► Rate of adoption
► Decreased employment
► Transportation infrastructure investment less
► Electrical power available?
► How safe does AV/CV have to be?
► Crime reduction
► Just World Hypothesis
Potential State Activities
► Continue to get educated on our role
► Framework legislation
► Pilot/test on Department of Transportation fleet
► Key partner meetings
► Converse with other states
► Research on industry
► Testing and deployment technologies
Potential Local Activities
► Replicate state on smaller scale
What role might the private sector play?
► Compete within framework established
► Public buy in
► Educate public/state/local planning agencies/etc.
Group 6 Based on what you have heard, what do you think are the key issues for public sector leaders?
► Privacy
► Patchwork of regulations
► Revenue concerns
► Land use
► Unknown
► Love of vehicle ownership
What happens if we do nothing?
► Problems during transition
► Compounded dangers of mixed technology
► Impede private investment
► Dangers of lagging regulation
A Citizen’s Guide to Missouri’s Transportation Future: Long Range Transportation Plan Update I-7
Who should be at the table that isn’t here now?
► Insurance companies
► Local elected
► Very young/very old drivers
► Tech infrastructure folks
► Opposition
Privacy advocates
Professional drivers
Taxi/transit
► Rail operators
Other areas of concern
► Equity concerns
► Transition time of fleet
► Money to pay for it
► Looking at a “complete” system
► Cyber security
► How do we react when it fails?
Potential State Activities
► Legislative outline
► Education of topic
► Continue to facilitate discussion – provide the forum
► State agency outreach/cooperation
► Connect and encourage research among academic, public, private
Potential Local Activities
► Collaboration between stakeholders
► Willing to learn between regions
► Debunk the myths
► Stakeholder identification
► Move forward without losing individuality
► Identify the priorities/projects
► Plan for the AV/CV future
What role might the private sector play?
► Pull together the industries that are succeeding with this
► Part of it all
► Identify the needs for success

A Citizen’s Guide to Missouri’s Transportation Future: Long Range Transportation Plan Update I-8
Group 7 Based on what you have heard, what do you think are the key issues for public sector leaders?
► Presentation heavily slanted to consequences and impacts vs. opportunity
► Mobility, aging/disabled mobility
► Balance positive and negative impacts
► Public
perceptions and educate them
acceptance
► Human error and cost to society …fiscally and physically
► Legislation at federal level with national standards
With funding for Department of Transportations
► Do I buy a car or cost to use AV system?
► What can Missouri do at state level?
Pilot projects (support and legislation)
Testing
Move from policy to implementation
► Federal government isn’t keeping up at federal level, so states doing patchwork of legislation
► Push back from private industry that may lose money from this technology
► Long‐term plan for trucking industry
► Where does liability fall?
► Statewide AV taskforce/alliance
► Expand partnership to increase education and awareness
► Public meetings to solicit feedback, input, acceptance, etc.
What happens if we do nothing?
► Private sector moves forward w/o us so may deploy unsafe vehicles
► Lose ability to shape how it is used economically
► Not being innovative
► No decrease in fatalities
Who should be at table that isn’t here now?
► Original Equipment Manufacturers
► Department of Transportations
► Legislators
► Insurance regulators
► Uber/Lyft
► AARP
► Law enforcement
► Teamsters/truckers
► Landowners/real estate developers
► City/local councils
► Trial attorneys

A Citizen’s Guide to Missouri’s Transportation Future: Long Range Transportation Plan Update I-9
Other areas of concern
► Burden of ownership
► Burden of consequences if not done
► Missouri is a rural state and technology is not available in all areas (no phone service)
► Impacts to rural areas
Helps with mobility
Helps with connectivity and cell service
► Missouri has a lot of low volume roads so conflict with urban vs. rural
► Kansas and other states have task forces and are moving forward
► Get energy utilities involved
Potential Local activities
► Identify applications for potential pilot programs/implementation
Urban locations
Ride sharing/commuter programs
► Promote interest in participation to industry
► Coordinate conversations and understanding among
Local agencies and officials
MPOs and RPCs
Multiple jurisdictions
Inclusion of AV/CV consideration in project prioritization (AV/CV set aside)
What role might the Private Sector play?
► Indicate data needs/testing needs
► Information sharing from other regions
► Informing legislators
Group 8 Based on what you have heard, what do you think are the key issues for public sector leaders?
► Liability environment will change
Driver’s insurance coverage
Purchasing – current loan so impact to financial institutions
Health insurance impacts
Court cases
Accidents down, but other accidents will happen with snow, ice, etc. and transition before all are ACV
► Lending institutions need to be part of discussion
Public officials
► Design of road design and land use
► Buildout of congestion?
► Police shift – if enforcement down do they become more focused
► Sprawl

A Citizen’s Guide to Missouri’s Transportation Future: Long Range Transportation Plan Update I-10
More labor available
► Automated school busses?
Benefit to rural
Workforce change
► Transit use
Will it go down if people can just use AV and work on way to work?
► Infrastructure in place – especially in rural areas, how do we do this cost effectively?
► Court cases
► Liability changes to
► MoDOT grows
Increase in electrical engineers
Decrease in civil engineers
► Amtrak, greyhound – industry disruption – people choose to “drive” instead of fly because they can visit, not
as tiring
What happens if we do nothing?
► Freight/economic development bypasses MO since other states allow it
► Confusion to other state’s drivers crossing Mo
► Safety – driver’s expectations are vehicle will take care of it – more accidents here
► Will people choose to avoid stopping, just get through?
Other concerns
► Licensing/ permitting run by businesses (like a cab)
Cab vs. Uber model has tax implications to a city
► Licensing – is there a minimum age to be alone in a car?
Who needs a driver’s license?
Who should be at the table that isn’t here now?
► Logistics sector
► Council of Supply Chain Management Professionals
► How are companies looking to use for freight delivery?
Other areas of concern
► Industry standards – federal guidance for architecture of infrastructure
Potential State activities
► Create advanced task force (steering committee)
State and local
► Regional committee (experts)
► Education
Local governments
Citizens
► Universities
A Citizen’s Guide to Missouri’s Transportation Future: Long Range Transportation Plan Update I-11
Research
Workforce/college education
► Legislative – identify legal and regulatory impacts
Potential Local agencies activities
► Regional task forces
► Reach out to “local groups” and networks
(OATS, taxi companies, chapters of national organizations)
What role might the private sector play?
► Consultants (engineering and information technology)
► Insurance companies and financial institutions, potential capital for companies and bonding
► Original Equipment Manufacturers and dealerships/other companies
► After‐market products
► Trucking (how using technology)
► Freight

A Citizen’s Guide to Missouri’s Transportation Future: Long Range Transportation Plan Update R-1
REFERENCES Trends Electric Vehicle Sales Information
Plug‐in Electric Vehicle Sales Forecast Through 2025, June 2017. The Edison Foundation Institute for Electric
Innovation.
http://www.edisonfoundation.net/iei/publications/Documents/IEI_EEI%20PEV%20Sales%20and%20Infrastructu
re%20thru%202025_FINAL%20(2).pdf
Projected 2040 Electrical Vehicle Market Share, February 2016. Bloomberg New Energy Finance.
https://about.bnef.com/blog/electric‐vehicles‐to‐be‐35‐of‐global‐new‐car‐sales‐by‐2040/#_ftnref2
21st Century Missouri Transportation Systems Task Force Draft Report, January 2018. Missouri General
Assembly. https://house.mo.gov/billtracking/bills181/commit/rpt1723/Transportation.pdf
Demographics
National Population Projects, May 2016. University of Virginia Weldon Cooper Center for Public Service
Demographics Research Group. http://demographics.coopercenter.org/national‐population‐projections/
2000‐2001 to 2015‐2016 Population Change and Migration. Missouri Census Data Center published by the
University of Missouri Office of Social and Economic Data Analysis. https://census.missouri.edu/population‐
change/
Age Group Population per Decade – 2010 to 2040. University of Virginia Weldon Cooper Center for Public Service
Demographics Research Group. http://demographics.coopercenter.org/national‐population‐projections/
Percent Population over 65 by County. State of Missouri Office of Administration Division of Budget and
Planning. https://oa.mo.gov/budget‐planning/demographic‐information/population‐projections/2000‐2030‐
projections
Missouri Population Change by County Between 2011 and 2016. Missouri Census Data Center published by the
University of Missouri Office of Social and Economic Data Analysis. https://census.missouri.edu/population‐
change/
Population Trends by MoDOT District. Missouri Census Data Center published by the University of Missouri Office
of Social and Economic Data Analysis. https://census.missouri.edu/population‐change/
Economic and Employment
Missouri Gross State Product 2002 – 2016. Missouri Department of Economic Development, Missouri Economic
and Research Information Center (MERIC). https://www.missourieconomy.org/indicators/gsp/index.stm
Monthly Motor Gasoline Regular Grade Retail Price. United States Energy Information Administration.
https://www.eia.gov/petroleum/data.php#prices
Unemployment Rate from January 2007 to January 2017. United States Department of Labor, Bureau of Labor
A Citizen’s Guide to Missouri’s Transportation Future: Long Range Transportation Plan Update R-2
Statistics. https://www.bls.gov/data/#employment
Worker by Industry from 2011 to 2015. Missouri Census Data Center published by the University of Missouri
Office of Social and Economic Data Analysis.
https://census.missouri.edu/acs/profiles/report.php?period=5&year=2015&g=04000US29|01000US
Long Term 2014 to 2024 Industry Employment Projections. Missouri Department of Economic Development,
Missouri Economic and Research Information Center (MERIC).
https://www.missourieconomy.org/occupations/occ_proj.stm
Real Median Income in Missouri. Missouri Census Data Center published by the University of Missouri Office of
Social and Economic Data Analysis.
https://census.missouri.edu/acs/profiles/report.php?period=5&year=2015&g=04000US29|01000US
2015 Poverty Statistics by County. Missouri Community Action Network.
http://www.communityaction.org/missouri‐poverty‐facts/
Freight
2030 Freight Movement by Mode. Missouri Department of Transportation Missouri State Freight Plan.
http://www.modot.org/othertransportation/freight/FreightPlan.htm
Travel Trends
Missouri VMT Trends from 2001 through 2015. United States Department of Transportation, Federal Highway
Administration, Office of Highway Policy Information.
https://www.fhwa.dot.gov/policyinformation/statistics.cfm
21st Century Missouri Transportation Systems Task Force Draft Report, January 2018. Missouri General
Assembly. https://house.mo.gov/billtracking/bills181/commit/rpt1723/Transportation.pdf
Corporate Average Fuel Economy Standards through 2026. National Highway Traffic Safety Administration
Summary of Fuel Economy Performance. NHTSA Summary of Fuel Economy Performance, NHTSA MY2017-2025 Factsheet
Missouri Vehicle Ownership from 2000 to 2015. United States Department of Transportation, Federal Highway
Administration, Office of Highway Policy Information.
https://www.fhwa.dot.gov/policyinformation/statistics.cfm
Lyft Climate Impact Goals. https://blog.lyft.com/posts/2017/6/14/lyft‐climate‐impact‐goals
Missouri Households and Vehicle Ownership. Missouri Census Data Center published by the University of
Missouri Office of Social and Economic Data Analysis.
https://census.missouri.edu/acs/profiles/report.php?period=5&year=2015&g=04000US29|01000US
Licensed Operators in Missouri. United States Department of Transportation, Federal Highway Administration,
Office of Highway Policy Information. https://www.fhwa.dot.gov/policyinformation/statistics.cfm
Commuting Patterns. Missouri Census Data Center published by the University of Missouri Office of Social and
Economic Data Analysis.
A Citizen’s Guide to Missouri’s Transportation Future: Long Range Transportation Plan Update R-3
https://census.missouri.edu/acs/profiles/report.php?period=5&year=2015&g=04000US29|01000US
Public Transit Ridership. Missouri Department of Transportation Tracker Report.
http://www.modot.org/about/tracker_archive/documents/Tracker_PDF_April17/Chapter5.pdf
Passenger Rail Ridership. Missouri Department of Transportation Tracker Report.
http://www.modot.org/about/tracker_archive/documents/Tracker_PDF_April17/Chapter5.pdf
Air Travel Passengers. Missouri Department of Transportation Tracker Report.
http://www.modot.org/about/tracker_archive/documents/Tracker_PDF_April17/Chapter5.pdf
Autonomous and Connected Vehicles Anderson, J. M., et al. (2014), Autonomous Vehicle Technology A Guide for Policymakers, RAND Corporation
(www.rand.org); at www.rand.org/content/dam/rand/pubs/research_reports/RR400/RR443‐1/RAND_RR443‐
1.pdf.
Automobile Alliance of America. Missouri. Your State Facts. https://autoalliance.org/in‐your‐
state/MO/pdf/?export.
Bittner, J (2016), The Good and Bad News on Incorporating Automated and Connected Vehicles in Small‐ and Medium‐Sized Communities. Presentation to the TRB Tools of the Trade Conference. Coburn, D, H. , Dane Jaques, Anthony J. LaRocca and Stephen Richer (Senate Commerce, Science, and
Transportation Committee’s AV START Act Advances), Oct 11 2017
https://www.lexology.com/library/detail.aspx?g=2ad11d12‐768e‐4c41‐8a99‐27539ddd3949.
Litman, T (2016), Autonomous Vehicle Implementation Predictions: Implications for Transport Planning, September 2016. http://www.vtpi.org/avip.pdf. Morgan Stanley Blue Paper (2013), Autonomous Cars Self‐Driving the New Auto Industry Paradigm.
Morgan Stanley Blue Paper (2016), Global Investment Implications of Auto 2.0.
National Conference of State Legislatures (2017), States with Enacted Vehicle Legislation.
http://www.ncsl.org/research/transportation/autonomous‐vehicles‐self‐driving‐vehicles‐enacted‐
legislation.aspx.
Organization for Economic Co‐operation and Development (2015), Automated and Autonomous Driving:
Regulation under Uncertainty.
Parrish, K. (2015), http://schedule.sxsw.com/2015/events/event_IAP37302. [Online] Available at:
http://schedule.sxsw.com/2015/events/event_IAP37302.
Row, S (2013), The Future of Transportation: Connected Vehicles to Driverless Vehicles…What Does It Mean To Me? ITE Journal (www.ite.org), Vol. 83, No. 10, pp. 24‐25. Simonite, T (2016), Prepare to be Underwhelmed by 2021’s Autonomous Cars: Ford, Uber, and BMW Promise Fully Self‐Driving Cars in Five Years—But They Will Probably Only Work in Very Limited Areas, MIT Technology
A Citizen’s Guide to Missouri’s Transportation Future: Long Range Transportation Plan Update R-4
Review (www.technologyreview.com); at www.technologyreview.com/s/602210/prepare‐to‐be‐underwhelmed‐by‐2021s‐autonomous‐cars. Smith, B. W. (2014a), Automated Vehicles Are Probably Legal in the United States. Texas A&M Law Journal, Volume 1. Smith, B. W. (2014b), A Legal Perspective on Three Misconceptions in Vehicle Automation. In: G. a. B. S. Meyer,
ed. Road Vehicle Automation Lecture Notes in Mobility. s.l.:Springer.
Smith, B. W. (2014c), Proximity‐Driven Liability. Georgetown Law Journal, Issue 102.
USDOT Federal Automated Vehicles Policy (2016), https://www.transportation.gov/AV. Williams, K\ and Bittner, Jason (2013), Transportation Planning Considerations for Automated Vehicles.
Prepared for the Tampa Hillsborough Expressway Authority.
Recommended