2018 FINRA Annual Financial Report

Contents
A Message From the President and CEO 1
Management Report on Operations 4
Investment Committee Report 15
Audit Committee Report 18
Management Compensation Committee Report 20
Management Report on Internal Control Over Financial Reporting 24
Report of Independent Registered Public Accounting Firm 25
FINRA 2018 Consolidated Financial Statements:
Consolidated Balance Sheets 26
Consolidated Statements of Operations 28
Consolidated Statements of Comprehensive (Loss) Income 29
Consolidated Statements of Changes in Equity 30
Consolidated Statements of Cash Flows 31
Notes to Consolidated Financial Statements 33
FINRA Board of Governors 65
FINRA Officers 65
FINRA Corporate Offices 66
FINRA District Offices 66
FINRA Market Regulation Regional Offices 67
FINRA Dispute Resolution Regional Offices 67
FINRA 2018 Annual Financial Report 1
For 80 years, FINRA has served a unique and vital role in the U.S. financial regulatory structure as a not-for-profit, self-regulatory organization (SRO) whose operations are funded by industry fees—not taxpayer dollars. Performing this role effectively requires that FINRA prudently manage its finances to ensure we can appropriately fund our mission of protecting investors and promoting market integrity in a manner that supports vibrant capital markets.
Our Financial Guiding Principles (the Principles) outline how we seek to do just that: fund our mission, manage expenses responsibly, maintain reasonable member firm fees, use fine monies to promote compliance and improve markets, and sustain appropriate financial reserves. We first published the Principles in January 2018 to underscore our commitment to financial transparency, and they were reaffirmed by the FINRA Board of Governors in December. These Principles build on a long-standing practice—dating back to at least 1960—of publishing an Annual Financial Report. With the publication of this year’s report, we once again outline our financial operations for the prior year in accordance with U.S. generally accepted accounting principles (GAAP).
Financial Operations and Use of Fine Monies in 2018 As described in the 2018 Annual Financial Report, FINRA’s operating revenues increased 3.5 percent to $857.4 million in 2018, while expenses for 2018 decreased slightly as we continued to closely manage our spending. Overall, we reported a net loss of $68.7 million for the year, driven primarily by an operating loss of $29.2 million, coupled with investment losses and other expenses of $39.5 million. By way of context, over the last five years we have reported cumulative net income of $120.1 million, as well as an average annual decrease in expenses of 0.4 percent. FINRA continues to maintain a strong balance sheet to support its operations, with approximately $1.5 billion in equity (net assets) as of December 31, 2018. The key drivers of last year’s financial performance are discussed more fully in the Annual Financial Report.
A MESSAGE FROM THE PRESIDENT AND CEO
Robert W. Cook | President and Chief Executive Officer

2 FINRA 2018 Annual Financial Report
Our Financial Guiding Principles provide that FINRA only use fine monies it collects for specific purposes—such as capital initiatives that enable improved oversight of and compliance by member firms—and only with the approval of the FINRA Board of Governors or the Finance, Operations and Technology Committee. FINRA released its public Report on Use of 2018 Fine Monies in April, which details the Board-approved initiatives that were supported by 2018 fine monies.
2019 BudgetTo further promote the financial transparency called for in the Financial Guiding Principles, FINRA also recently began releasing a forward-looking annual budget summary. FINRA’s 2019 Annual Budget Summary was published earlier this year, together with comparable financial data, and outlines how FINRA plans to deploy its resources to meet its varied and complex regulatory responsibilities in 2019 in accordance with the Principles.
As described more fully in the budget summary, we project our expenses will again exceed our operating revenues in 2019. However, FINRA will not increase member fees in 2019, marking the sixth consecutive year without a fee increase. Instead, we are again budgeting for a potential drawdown, if necessary, on our financial reserves to fund our regulatory operations. While drawing down our reserves may result in net losses, this measure is part of a longer-term plan to reduce reserves before increasing member firm fees. It will become necessary to increase member fees once reserves have been reduced to the level targeted by FINRA’s Board pursuant to the Financial Guiding Principles.
By managing our expenses responsibly, monitoring and planning for reasonable member fee levels, and sustaining appropriate reserves, FINRA continues to plan for the long-term financial sustainability of the organization and its ability to meet the regulatory challenges ahead.
Robert W. CookPresident and Chief Executive Officer
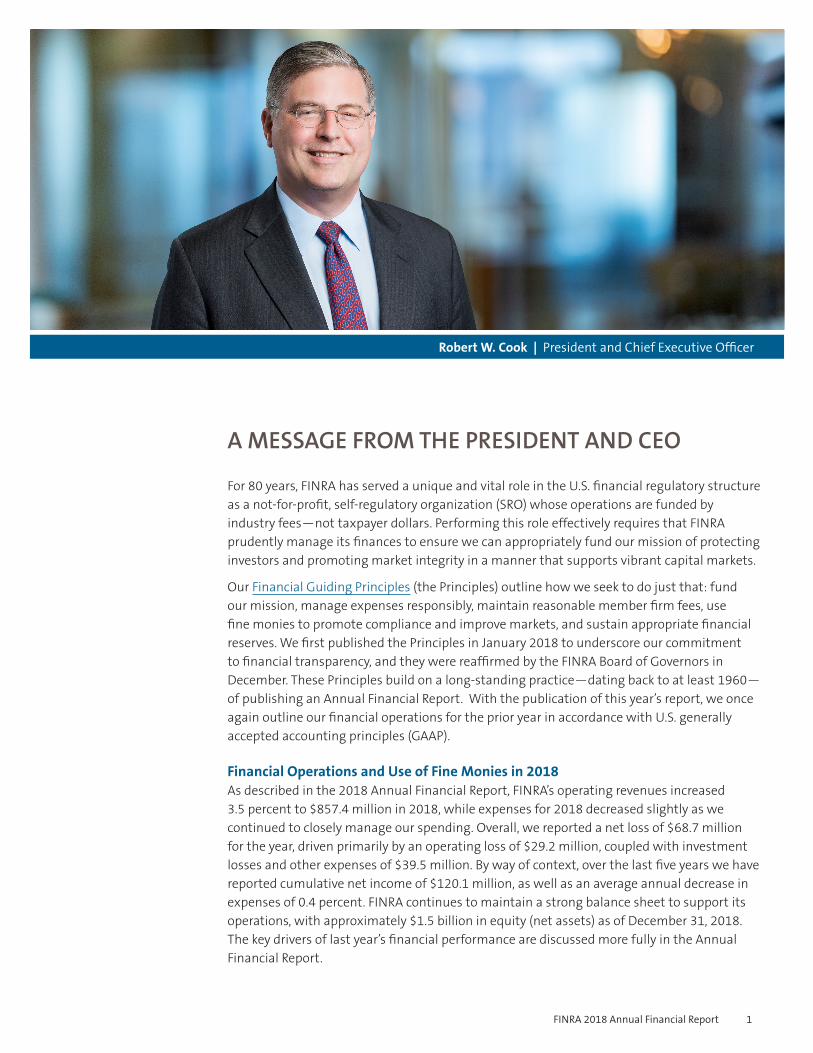
FINRA plays an essential role in the oversight of U.S. broker-dealers.We promote market integrity in a manner that supports the important role
our capital markets play in the U.S. financial systems.
We protect investors from bad actors.
Coordinating closely with the SEC and other federal and state regulators is an important part of our regulatory work.
We work to keep investors informed.
Our technology looks across markets to
detect potential fraud.
We processed 66.7 billion market events on average every day in 2018.
More than 6,300 exams and reviews conducted in 2018
$61.0 million in fines
$25.5 million in restitution to harmed investors
16 firms expelled
472 brokers suspended
386 brokers barred
FINRA Investor Education Foundation Committed $115 million+ for financial capability and fraud prevention initiatives since inception
Securities Helpline for Seniors Facilitated the return of $6.6 million in voluntary reimbursements to senior investors from April 2015 through April 2019
919 FRAUD AND INSIDER TRADING CASES
referred to the SEC and other federal or state law
enforcement agencies for prosecution

4 FINRA 2018 Annual Financial Report
Management Report on Operations
Who We AreThe Financial Industry Regulatory Authority, Inc.® (FINRA®) is a not-for-profit self-regulatory organization (SRO) authorized by federal law to help protect investors and ensure the fair and honest operation of securities markets. Under the oversight of the U.S. Securities and Exchange Commission (SEC), we regulate the activities of U.S. broker-dealers and perform market regulation pursuant to our own statutory responsibility and under contract for certain exchanges.
Our MissionOur core mission is to provide investor protection and promote market integrity through comprehensive and effective regulation of the broker-dealer industry.
Our Regulatory ModelTo carry out its mission, FINRA uses a multi-pronged approach that includes regulation, rulemaking, transparency and education:
Member Supervision—monitors and examines for member firm compliance with applicable statutes and rules.
Market Regulation—conducts automated surveillance, examinations and investigations of trading activity in U.S. equities, options and fixed income markets.
Enforcement—investigates possible misconduct and brings disciplinary actions for violations of industry rules and regulations.
Fraud Detection—centralizes FINRA’s review of allegations of serious fraud and significant investor harm, analyzes trading activity across U.S. markets for evidence of insider trading, and analyzes tips and complaints of possible fraud or other misconduct that are submitted to FINRA’s Whistleblower hotline or mailbox.
Rulemaking and Guidance—assists in adopting and interpreting rules applicable to securities firms and brokers, and evaluates the potential impacts of FINRA’s rulemaking on all market participants. FINRA solicits comment on its proposed rules from its member firms, investors and other interested parties, and, with limited exceptions, all FINRA rules must be approved by the SEC.
Registration and Disclosure—operates FINRA’s utilities to register and test securities industry personnel and provides those same services under contract for the benefit of investment advisers and mortgage brokers.
FINRA 2018 Annual Financial Report 5
Further description of FINRA’s statutory responsibilities, as well as its responsibilities under contract for certain exchanges, can be found in Note 1, “Organization and Nature of Operations,” to the consolidated financial statements.
This Management Report should be read in connection with the consolidated financial statements and accompanying notes included elsewhere in this Annual Financial Report. The 2018 consolidated financial statements reflect the activities of FINRA and its consolidated subsidiaries, collectively referred to as “we,” “our,” “us,” “FINRA” or the “Company” throughout this Management Report. As of and for the years ended December 31, 2018 and 2017, FINRA’s primary consolidated subsidiaries are FINRA Regulation, Inc. and the Foundation.
Our consolidated financial statements are prepared in conformity with U.S. generally accepted accounting principles (U.S. GAAP). Under U.S. GAAP, we are required to adopt accounting principles and make estimates and judgments to develop amounts reported in the consolidated financial statements and accompanying notes.
We describe our significant accounting policies in Note 2, “Summary of Significant Accounting Policies,” Note 5, “Fair Value Measurement,” and Note 7, “Employee Benefit Liabilities,” to the consolidated financial statements.
Market Transparency—operates facilities that disseminate real-time and historical market information for over-the-counter (OTC) trading in the equity and fixed income markets, and maintains the databases FINRA uses to oversee OTC securities.
Dispute Resolution—operates a dispute resolution forum for investors, brokerage firms and their registered employees, and administers arbitrations and mediations.
Advertising Regulation—oversees compliance with rules intended to ensure that member firm communications to the public are fair, balanced and not misleading.
Corporate Financing—oversees compliance with rules intended to prevent fraudulent private placements by member firms and ensure underwriting compensation is fair.
Investor Education—provides investors with financial tools and resources; and through the FINRA Investor Education Foundation® (the Foundation), FINRA supports important research and financial education initiatives.
FINRA’s Board of Governors (Board) and its committees meet multiple times throughout the year to review the operations, risks and challenges associated with the furtherance of FINRA’s mission. These committees include the Audit Committee; Regulatory Policy Committee; Regulatory Operations Oversight Committee; Finance, Operations and Technology Committee (Finance Committee); Management Compensation Committee; and Executive Committee.
6 FINRA 2018 Annual Financial Report
RESULTS OF OPERATIONS
Summary of Operations
The following table provides a summary of our financial results on a U.S. GAAP basis for the two years ended December 31,2018. Years Ended December 31,
2018 2017 (in millions)
Operating revenues $ 857.4 $ 828.1Fines 61.0 64.9 Net activity assessment revenues 0.1 —Net revenues 918.5 893.0
Expenses (975.3) (992.3)Interest and dividend income 27.6 26.0Operating loss (29.2) (73.3)
Net realized and unrealized investment (losses) gains (51.1) 32.6Equity (losses) earnings from other investments 12.0 83.9Other expense (0.4) (1.6)Net (loss) income $ (68.7) $ 41.6
We reported a net loss of $68.7 million in 2018 versus net income of $41.6 million in 2017, a decrease of $110.3 millionyear over year. Our net loss of $68.7 million was driven by an operating loss of $29.2 million coupled with investmentlosses and other expenses of $39.5 million. An increase in operating revenues, combined with a decline in expenses, led toa decrease in our year-over-year operating loss. Our investment portfolio (the Portfolio) experienced losses for the year,which were modest relative to broader equity market declines. A more detailed look at our operating results follows.
Management Report on Operations (continued)
OPERATING REVENUES
Operating Revenues($ in millions)
2018 2017
Contract Services
User
Regulatory
$466.1
$296.3
$95.0
$857.4$828.1
$439.0
$290.9
$98.2
Operating Revenues By Type – 2018
Regulatory,54%User,
35%
Contract services,11%
COMMENTARY: 2018 – 2017
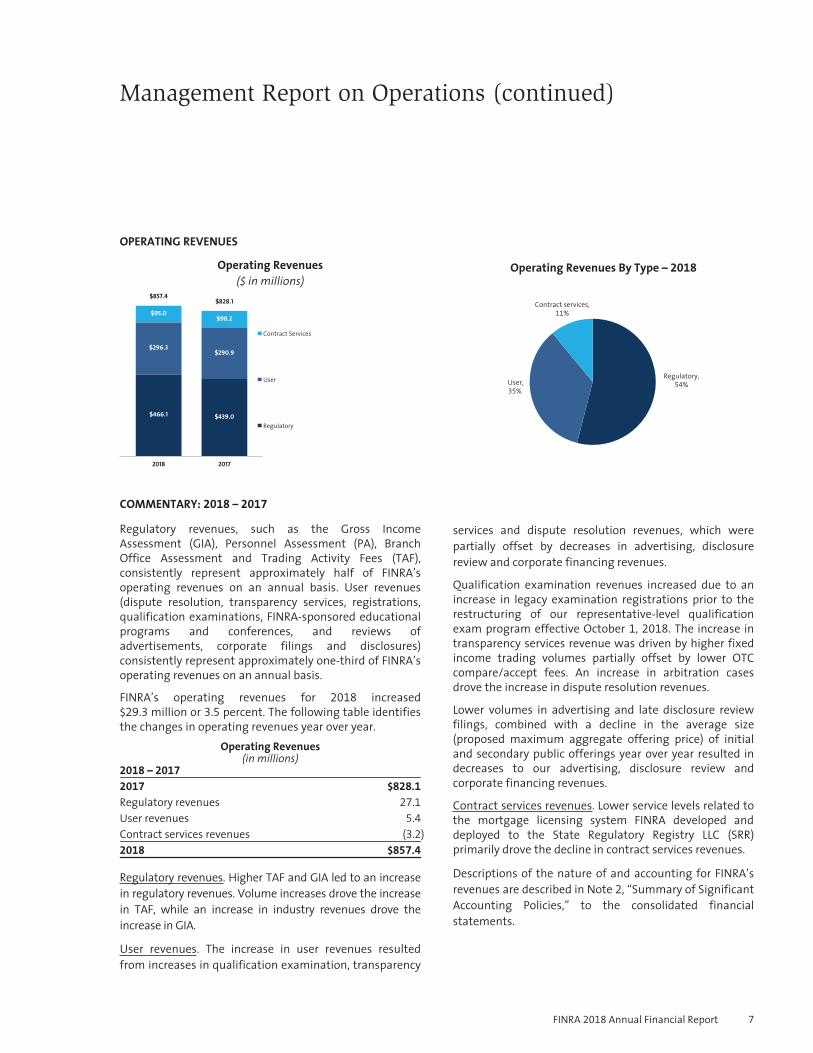
Regulatory revenues, such as the Gross IncomeAssessment (GIA), Personnel Assessment (PA), BranchOffice Assessment and Trading Activity Fees (TAF),consistently represent approximately half of FINRA’soperating revenues on an annual basis. User revenues(dispute resolution, transparency services, registrations,qualification examinations, FINRA-sponsored educationalprograms and conferences, and reviews ofadvertisements, corporate filings and disclosures)consistently represent approximately one-third of FINRA’soperating revenues on an annual basis.
FINRA’s operating revenues for 2018 increased$29.3 million or 3.5 percent. The following table identifiesthe changes in operating revenues year over year.
Operating Revenues(in millions)
2018 – 2017
2017 $828.1
Regulatory revenues 27.1
User revenues 5.4
Contract services revenues (3.2)
2018 $857.4
Regulatory revenues. Higher TAF and GIA led to an increasein regulatory revenues. Volume increases drove the increasein TAF, while an increase in industry revenues drove theincrease in GIA.
User revenues. The increase in user revenues resultedfrom increases in qualification examination, transparency
services and dispute resolution revenues, which werepartially offset by decreases in advertising, disclosurereview and corporate financing revenues.
Qualification examination revenues increased due to anincrease in legacy examination registrations prior to therestructuring of our representative-level qualificationexam program effective October 1, 2018. The increase intransparency services revenue was driven by higher fixedincome trading volumes partially offset by lower OTCcompare/accept fees. An increase in arbitration casesdrove the increase in dispute resolution revenues.
Lower volumes in advertising and late disclosure reviewfilings, combined with a decline in the average size(proposed maximum aggregate offering price) of initialand secondary public offerings year over year resulted indecreases to our advertising, disclosure review andcorporate financing revenues.
Contract services revenues. Lower service levels related tothe mortgage licensing system FINRA developed anddeployed to the State Regulatory Registry LLC (SRR)primarily drove the decline in contract services revenues.
Descriptions of the nature of and accounting for FINRA’srevenues are described in Note 2, “Summary of SignificantAccounting Policies,” to the consolidated financialstatements.
FINRA 2018 Annual Financial Report 7
Management Report on Operations (continued)
EXPENSES
Expenses($ in millions)
2018 2017
Depreciation andamortization
Compensation andbenefits
Professional and contractservices
General andadministrativeComputer operations anddata communications
Occupancy
$975.3 $992.3
$692.0$689.3
$134.5$53.7$43.1$38.3
$148.6$51.7$47.7
$15.4$16.4 $36.9
Expenses By Type – 2018
Compensation and benefits,
71%
Computer operations and data communications, 5%
Professional and contractservices,
14%
Occupancy, 4%
General and administrative, 4%
Depreciation andamortization,
2%
COMMENTARY: 2018 – 2017
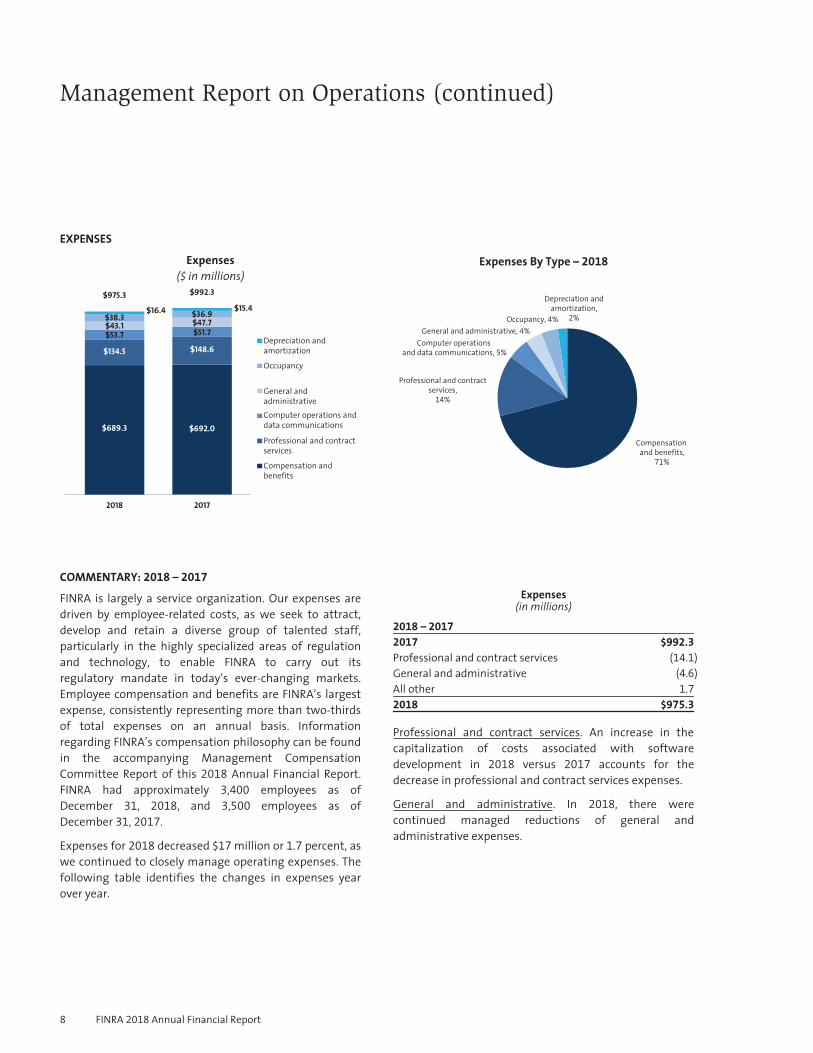
FINRA is largely a service organization. Our expenses aredriven by employee-related costs, as we seek to attract,develop and retain a diverse group of talented staff,particularly in the highly specialized areas of regulationand technology, to enable FINRA to carry out itsregulatory mandate in today’s ever-changing markets.Employee compensation and benefits are FINRA’s largestexpense, consistently representing more than two-thirdsof total expenses on an annual basis. Informationregarding FINRA’s compensation philosophy can be foundin the accompanying Management CompensationCommittee Report of this 2018 Annual Financial Report.FINRA had approximately 3,400 employees as ofDecember 31, 2018, and 3,500 employees as ofDecember 31, 2017.
Expenses for 2018 decreased $17 million or 1.7 percent, aswe continued to closely manage operating expenses. Thefollowing table identifies the changes in expenses yearover year.
Expenses(in millions)
2018 – 2017
2017 $992.3
Professional and contract services (14.1)
General and administrative (4.6)
All other 1.7
2018 $975.3
Professional and contract services. An increase in thecapitalization of costs associated with softwaredevelopment in 2018 versus 2017 accounts for thedecrease in professional and contract services expenses.
General and administrative. In 2018, there werecontinued managed reductions of general andadministrative expenses.
8 FINRA 2018 Annual Financial Report
Management Report on Operations (continued)
INVESTMENT RETURNS
Traditionally, FINRA has relied on the investment returns from its balance sheet to fund operating expenditures in excessof its annual revenues in any given year. FINRA’s Portfolio, which we also refer to as our financial reserves, lost 2.3 percentin 2018 compared to an 8.8 percent return in 2017. Although the Portfolio lost 2.3 percent, this loss is modest relative toseveral common market indices and standard portfolios of equities and bonds.
Additional information regarding the Portfolio, strategy and returns can be found in the accompanying InvestmentCommittee Report of this 2018 Annual Financial Report. Descriptions of the nature of and accounting for FINRA’sinvestments are described in Note 2, “Summary of Significant Accounting Policies,” and Note 4, “Investments,” to theconsolidated financial statements.
RESTITUTION AND FINES
FINRA is dedicated to investor protection and market integrity through effective and efficient regulation of broker-dealers.One of FINRA’s tools for achieving this objective is vigorous, fair and effective enforcement of our member firms’compliance with securities laws and regulations.
When a member firm or registered representative engages in misconduct, restitution for harmed customers is our highestpriority, although there are many cases in which it is not practical. Restitution may be ordered when an investor hassuffered a quantifiable loss due to misconduct. The calculation of restitution is based on the actual amount of the harmsustained by the investor, as demonstrated by evidence. We ordered restitution to harmed investors of $25.5 millionduring 2018. Restitution is assessed separately from fines and has no impact on how or when we use fine money.Restitution is payable to the harmed party and has no effect on our financial position.
When a member firm or registered representative engages in misconduct, we also assess whether a sanction should beimposed in order to discourage similar conduct by the firm, registered representative or others. When we impose fines, theamounts are based on the facts and circumstances of the misconduct and the principles set forth in the FINRA SanctionGuidelines. The National Adjudicatory Council (NAC), which is composed of industry and non-industry members, continuesto maintain the FINRA Sanction Guidelines for use by the various bodies adjudicating FINRA disciplinary decisions, includingHearing Panels and the NAC itself, in determining appropriate remedial sanctions. FINRA publishes the FINRA SanctionGuidelines so that member firms, associated persons and their counsel may become more familiar with the types ofdisciplinary sanctions that may be applicable to various violations.
Fines are not based on revenue considerations, and we do not establish any minimum amount of fines that must be issuedfor purposes of our annual budget. These monies are not considered in determining employee compensation and benefits.The total amount of fines decreased by $3.9 million in 2018 to $61 million.
FINRA’s use of fine monies is governed by FINRA’s Financial Guiding Principles (Principles), which we published in January2018 to provide more transparency about how we manage our financial resources to ensure we fulfill our regulatoryresponsibilities and further our mission. FINRA’s Board reaffirmed the Principles in December 2018. As the Principlesdescribe, FINRA accounts for fine monies separately, and any use of such monies is approved, separately from otherexpenditures, by the Board or its Finance Committee. The Board or its Finance Committee may authorize the use of finemonies only for one of four enumerated purposes: (1) capital/initiatives or non-recurring strategic expenditures thatpromote more effective and efficient regulatory oversight by FINRA (including leveraging technology and data in a securemanner) or that enable improved compliance by member firms; (2) activities to educate investors, promote compliance bymember firms through education, compliance resources or similar projects, or ensure our employees are highly trained inthe markets, products and businesses we regulate; (3) capital initiatives required by new legal, regulatory or auditrequirements; or (4) replenishing reserves in years where such reserves drop below levels reasonably appropriate topreserve FINRA’s long-term ability to fund its regulatory obligations.
In accordance with the Principles, in April 2019, FINRA issued a separate detailed report covering all projects for which finemonies were used in 2018.
FINRA 2018 Annual Financial Report 9
Management Report on Operations (continued)
BALANCE SHEET
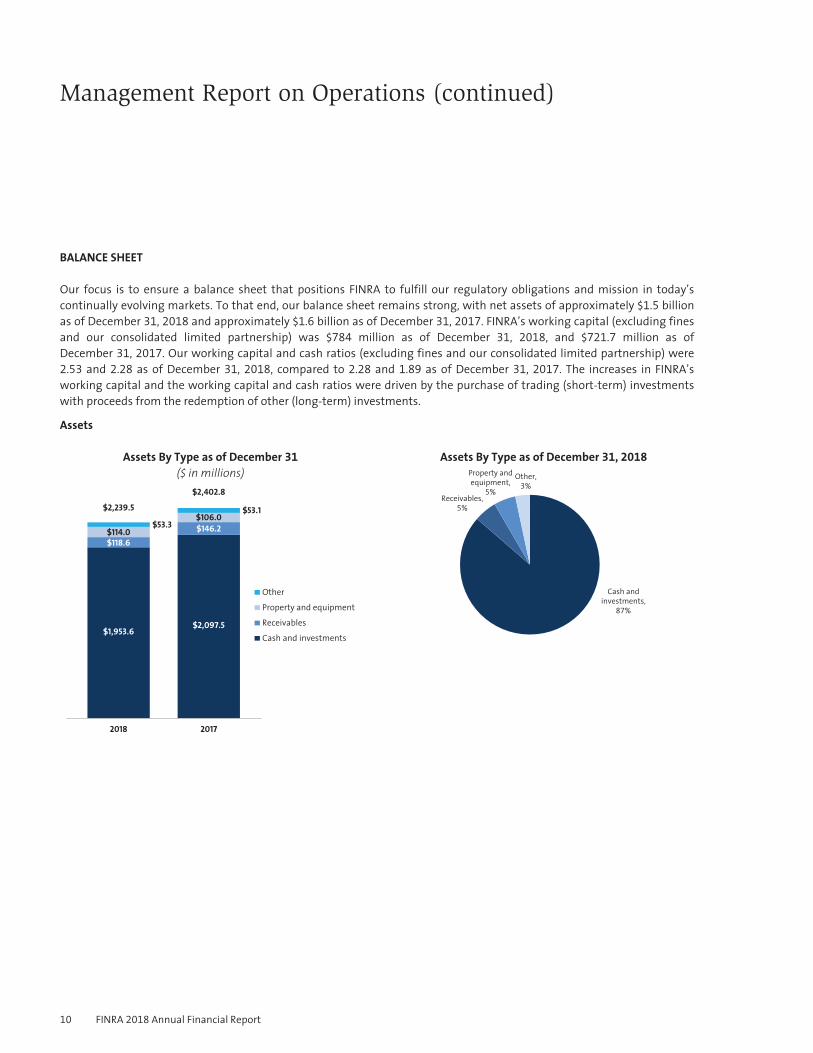
Our focus is to ensure a balance sheet that positions FINRA to fulfill our regulatory obligations and mission in today’scontinually evolving markets. To that end, our balance sheet remains strong, with net assets of approximately $1.5 billionas of December 31, 2018 and approximately $1.6 billion as of December 31, 2017. FINRA’s working capital (excluding finesand our consolidated limited partnership) was $784 million as of December 31, 2018, and $721.7 million as ofDecember 31, 2017. Our working capital and cash ratios (excluding fines and our consolidated limited partnership) were2.53 and 2.28 as of December 31, 2018, compared to 2.28 and 1.89 as of December 31, 2017. The increases in FINRA’sworking capital and the working capital and cash ratios were driven by the purchase of trading (short-term) investmentswith proceeds from the redemption of other (long-term) investments.
Assets
Assets By Type as of December 31
($ in millions)
Cash and investments
Receivables
Property and equipment
Other
2018 2017
$1,953.6
$2,239.5
$118.6$114.0
$53.3
$2,097.5
$2,402.8
$146.2$106.0 $53.1
Assets By Type as of December 31, 2018
Property andequipment,
5%Receivables,
5%
Other,3%
Cash andinvestments,
87%
10 FINRA 2018 Annual Financial Report
Management Report on Operations (continued)
Assets (continued)
COMMENTARY: 2018 – 2017
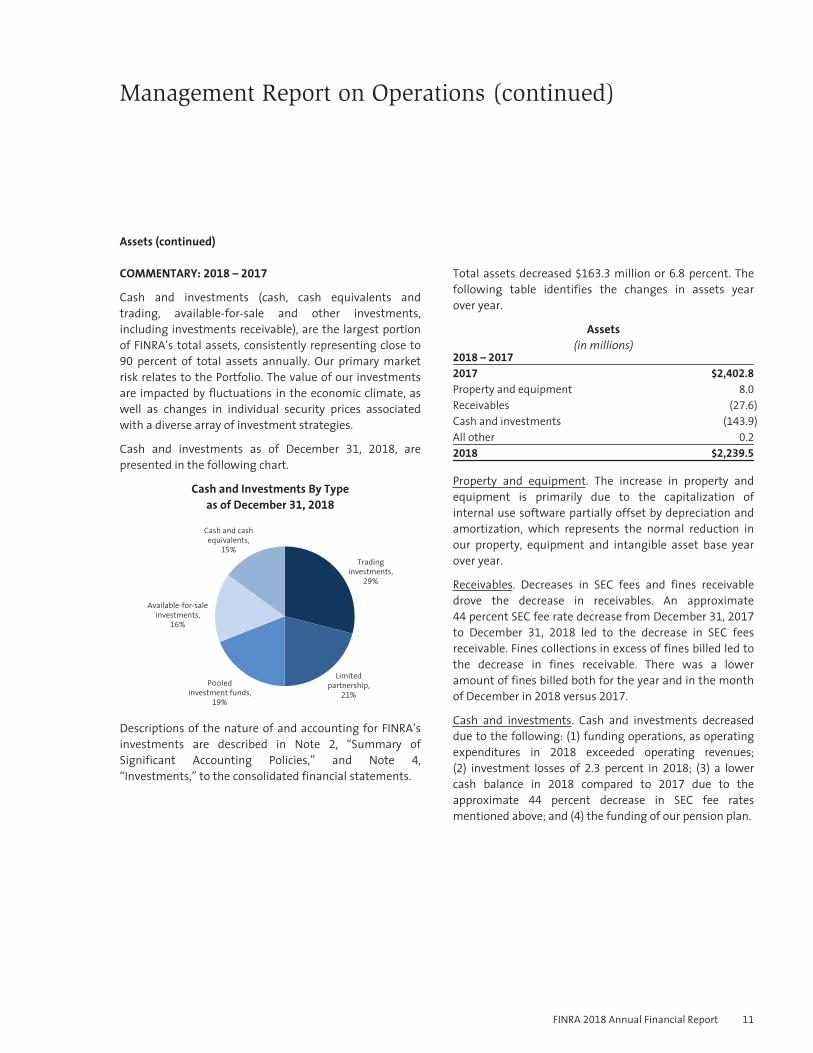
Cash and investments (cash, cash equivalents andtrading, available-for-sale and other investments,including investments receivable), are the largest portionof FINRA’s total assets, consistently representing close to90 percent of total assets annually. Our primary marketrisk relates to the Portfolio. The value of our investmentsare impacted by fluctuations in the economic climate, aswell as changes in individual security prices associatedwith a diverse array of investment strategies.
Cash and investments as of December 31, 2018, arepresented in the following chart.
Cash and Investments By Typeas of December 31, 2018
Tradinginvestments,
29%
Limitedpartnership,
21%
P00ledinvestment funds,
19%
Available-for-saleinvestments,
16%
Cash and cashequivalents,
15%
Descriptions of the nature of and accounting for FINRA’sinvestments are described in Note 2, “Summary ofSignificant Accounting Policies,” and Note 4,“Investments,” to the consolidated financial statements.
Total assets decreased $163.3 million or 6.8 percent. Thefollowing table identifies the changes in assets yearover year.
Assets(in millions)
2018 – 2017
2017 $2,402.8
Property and equipment 8.0
Receivables (27.6)
Cash and investments (143.9)
All other 0.2
2018 $2,239.5
Property and equipment. The increase in property andequipment is primarily due to the capitalization ofinternal use software partially offset by depreciation andamortization, which represents the normal reduction inour property, equipment and intangible asset base yearover year.
Receivables. Decreases in SEC fees and fines receivabledrove the decrease in receivables. An approximate44 percent SEC fee rate decrease from December 31, 2017
to December 31, 2018 led to the decrease in SEC feesreceivable. Fines collections in excess of fines billed led tothe decrease in fines receivable. There was a loweramount of fines billed both for the year and in the monthof December in 2018 versus 2017.
Cash and investments. Cash and investments decreaseddue to the following: (1) funding operations, as operatingexpenditures in 2018 exceeded operating revenues;(2) investment losses of 2.3 percent in 2018; (3) a lowercash balance in 2018 compared to 2017 due to theapproximate 44 percent decrease in SEC fee ratesmentioned above; and (4) the funding of our pension plan.
FINRA 2018 Annual Financial Report 11
Management Report on Operations (continued)
Liabilities
Liabilities By Type as of December 31
($ in millions)
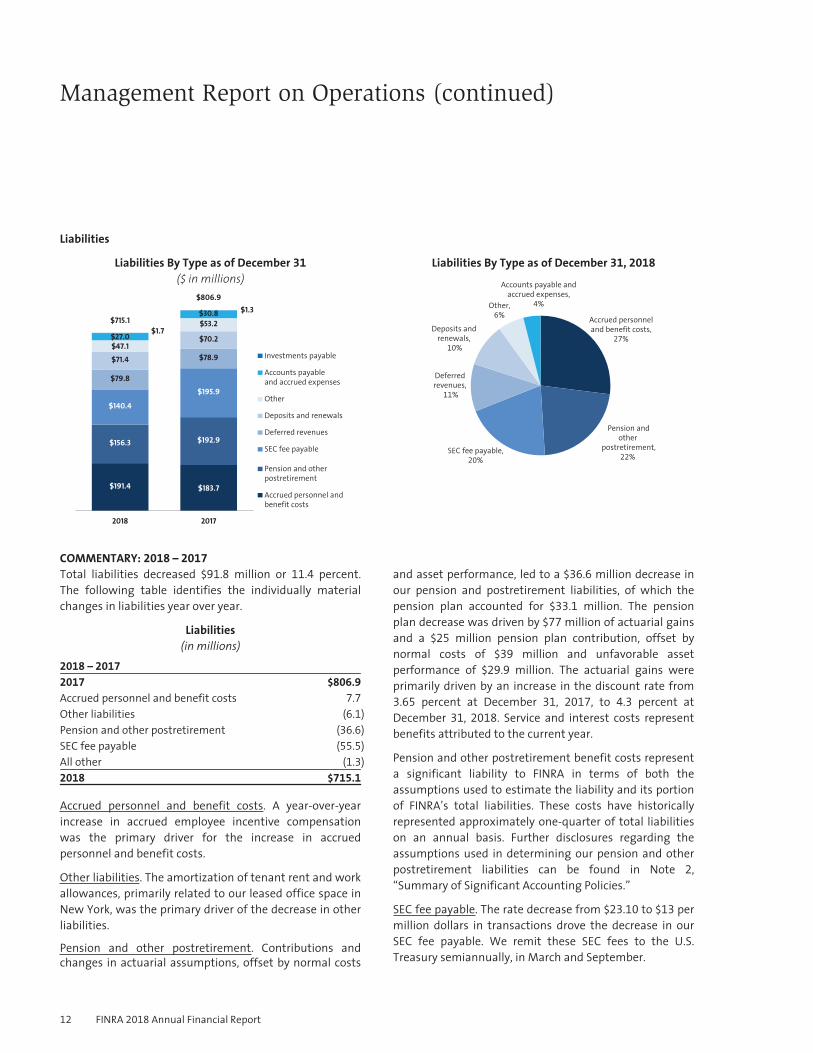
$715.1
$806.9
2018 2017
Other
Deferred revenues
Pension and other postretirement
Investments payable
$191.4 $183.7
$156.3 $192.9
$195.9
$78.9
$70.2$53.2$30.8 $1.3
$140.4
$79.8
$71.4$47.1$27.0 $1.7
Accrued personnel and benefit costs
SEC fee payable
Deposits and renewals
Accounts payable and accrued expenses
Liabilities By Type as of December 31, 2018
Other,6%
Deferred revenues,
11%
SEC fee payable,20%
Pension andother
postretirement,22%
Accrued personneland benefit costs,
27%
Deposits and renewals,
10%
Accounts payable andaccrued expenses,
4%
COMMENTARY: 2018 – 2017
Total liabilities decreased $91.8 million or 11.4 percent.The following table identifies the individually materialchanges in liabilities year over year.
Liabilities(in millions)
2018 – 2017
2017 $806.9
Accrued personnel and benefit costs 7.7
Other liabilities (6.1)
Pension and other postretirement (36.6)
SEC fee payable (55.5)
All other (1.3)
2018 $715.1
Accrued personnel and benefit costs. A year-over-yearincrease in accrued employee incentive compensationwas the primary driver for the increase in accruedpersonnel and benefit costs.
Other liabilities. The amortization of tenant rent and workallowances, primarily related to our leased office space inNew York, was the primary driver of the decrease in otherliabilities.
Pension and other postretirement. Contributions andchanges in actuarial assumptions, offset by normal costs
and asset performance, led to a $36.6 million decrease inour pension and postretirement liabilities, of which thepension plan accounted for $33.1 million. The pensionplan decrease was driven by $77 million of actuarial gainsand a $25 million pension plan contribution, offset bynormal costs of $39 million and unfavorable assetperformance of $29.9 million. The actuarial gains wereprimarily driven by an increase in the discount rate from3.65 percent at December 31, 2017, to 4.3 percent atDecember 31, 2018. Service and interest costs representbenefits attributed to the current year.
Pension and other postretirement benefit costs representa significant liability to FINRA in terms of both theassumptions used to estimate the liability and its portionof FINRA’s total liabilities. These costs have historicallyrepresented approximately one-quarter of total liabilitieson an annual basis. Further disclosures regarding theassumptions used in determining our pension and otherpostretirement liabilities can be found in Note 2,“Summary of Significant Accounting Policies.”
SEC fee payable. The rate decrease from $23.10 to $13 permillion dollars in transactions drove the decrease in ourSEC fee payable. We remit these SEC fees to the U.S.Treasury semiannually, in March and September.
12 FINRA 2018 Annual Financial Report
Management Report on Operations (continued)
LIQUIDITY AND CAPITAL RESOURCES
Liquidity is the ongoing ability to fund asset growth and business operations and meet contractual obligations throughunrestricted access to funding at reasonable market rates. Liquidity management involves forecasting fundingrequirements and maintaining sufficient working capital to meet business needs and accommodate fluctuations in assetand liability levels due to changes in business operations or unanticipated events. We primarily rely on operating cashflows to fund current and future operations.
We maintain a seasonal unsecured line of credit agreement with the option to borrow up to $150 million at the LIBORDaily Floating Rate plus 0.45 percent (2.83 percent at December 31, 2018). This line of credit was available to us fromFebruary 1, 2019 to May 31, 2019. The line of credit provides us with a mechanism to fund operations prior to the annualbilling of the GIA and PA in April, and the subsequent receipt of those funds, without having to make redemptions fromthe Portfolio. As of December 31, 2018, and December 31, 2017, no amounts were outstanding under this line of credit.
The Portfolio is governed by a policy based on the degree of risk deemed appropriate for FINRA assets by the Board asapplied to its investment objectives. FINRA’s Investment Committee, whose members have extensive background andexperience in the investment community, provides overall guidance and advice in determining the appropriate policy andallocation for the Portfolio. As of December 31, 2018, our investments remained liquid, with 77 percent available in 60
days or less. Additional information regarding the Portfolio can be found in the accompanying Investment CommitteeReport of this 2018 Annual Financial Report.
ENTERPRISE RISK MANAGEMENT
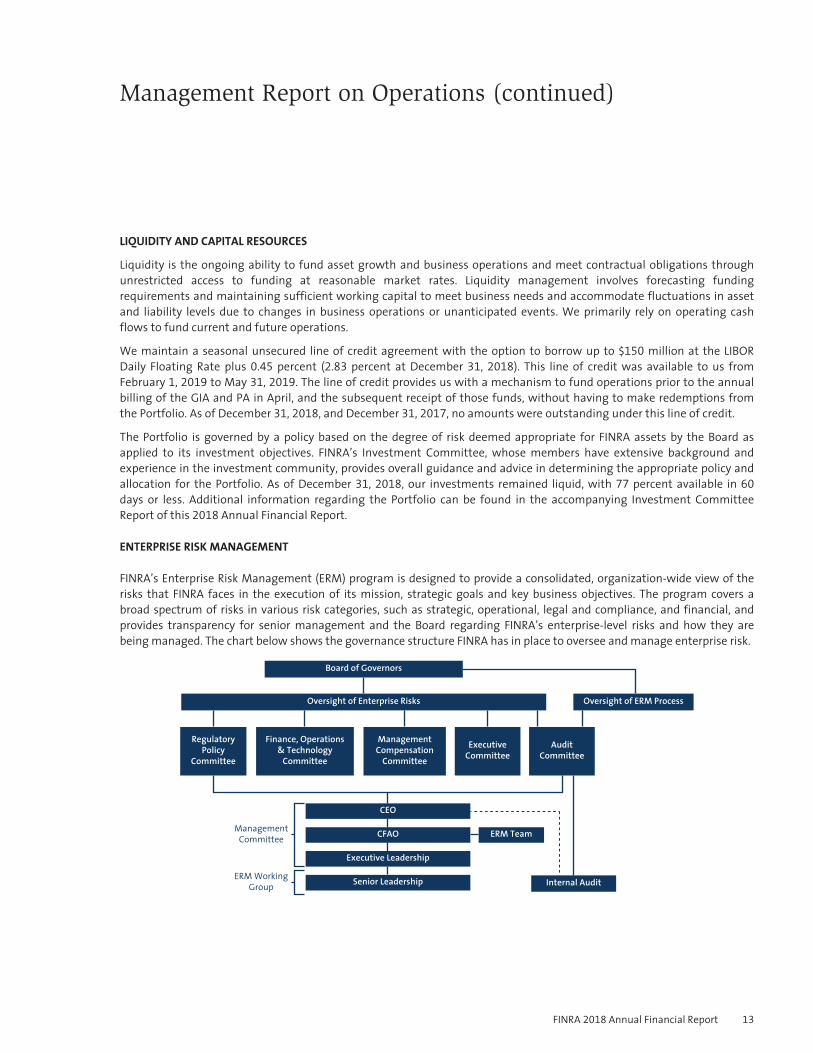
FINRA’s Enterprise Risk Management (ERM) program is designed to provide a consolidated, organization-wide view of therisks that FINRA faces in the execution of its mission, strategic goals and key business objectives. The program covers abroad spectrum of risks in various risk categories, such as strategic, operational, legal and compliance, and financial, andprovides transparency for senior management and the Board regarding FINRA’s enterprise-level risks and how they arebeing managed. The chart below shows the governance structure FINRA has in place to oversee and manage enterprise risk.
ManagementCommittee
Board of Governors
Oversight of Enterprise Risks
RegulatoryPolicy
Committee
Finance, Operations& Technology
Committee
ManagementCompensation
Committee
ERM Team
Internal Audit
ExecutiveCommittee
CEO
CFAO
Executive Leadership
Senior Leadership
AuditCommittee
Oversight of ERM Process
ERM WorkingGroup
FINRA 2018 Annual Financial Report 13
Management Report on Operations (continued)
The Board oversees the ERM program, with oversight of the ERM process delegated to the Audit Committee and theprimary oversight for each enterprise risk assigned to a specific Board committee, with support by other committees andworking groups as the need arises.
Where Board committees are assigned primary risk oversight responsibility, those committees meet to review and discussthe assigned enterprise risk with the designated risk owners, including factors impacting the risk, risk response, and risktolerances and metrics.
Executive support and oversight of ERM is effected through the Management Committee, composed of the ChiefExecutive Officer (CEO), Chief Financial and Administrative Officer (CFAO) and other senior executives across theorganization. Additionally, an ERM Working Group brings together senior managers across FINRA to provide freshperspectives and support. FINRA’s Internal Audit Department serves the ERM program in an advisory capacity.
CYBER AND INFORMATION SECURITY
FINRA operates a comprehensive security program designed to mitigate cyber and physical information security threatsand ensure compliance with applicable data privacy regulations and laws. We base our program upon industry bestpractices, and are guided by federal and international standards, and data privacy laws and regulations. Cybersecurity andinformation security breach risks are integrated into FINRA’s ERM program.
Specifically, FINRA’s information-security practices and operational controls include leading practices such as a formalsecurity assessment program used to evaluate vendor, partner and third-party security practices, and real-time logging,monitoring and alerting of security events.
FINRA’s adoption of cloud technology provides numerous benefits, such as access to best-of-breed security solutions madeavailable by the cloud provider’s scale of operations. Another benefit is our ability to use micro-segmentation, or puttingeach server into a security zone of one, which dramatically reduces attack surface area. Cloud technology also enables usto focus on the automation and tools necessary to raise the compliance bar and simplify controls.
FINRA information technology systems are subject to numerous mandatory and voluntary inspections including, but notlimited to, the following:
Ô regular vulnerability scans;Ô application code analysis and security testing using automated scans, dynamic testing and manual attack
techniques to identify application-level vulnerabilities;Ô periodic independent, third-party penetration tests and application security assessments;Ô annual inspections conducted by the SEC;Ô an annual Service Organization Control (SOC) 2 Type II Assessment; andÔ annual assessments by our Internal Audit department.
14 FINRA 2018 Annual Financial Report
Investment Committee ReportYear Ended December 31, 2018
FINRA’s investment portfolio*, also referred to as our financial reserves, originally derived from the sale of Nasdaq thatculminated in 2006, is overseen by the Investment Committee, a standing committee of FINRA, and managed to preserveprincipal and support our regulatory operations. FINRA has a set of Financial Guiding Principles that establish a goal ofmaintaining investment balances equal to at least one year of expenditures. Distributions from the portfolio are subject toprior approval by the Board of Governors (Board), and may be used to defer member firm fee increases or make up cashflow losses, among other uses.
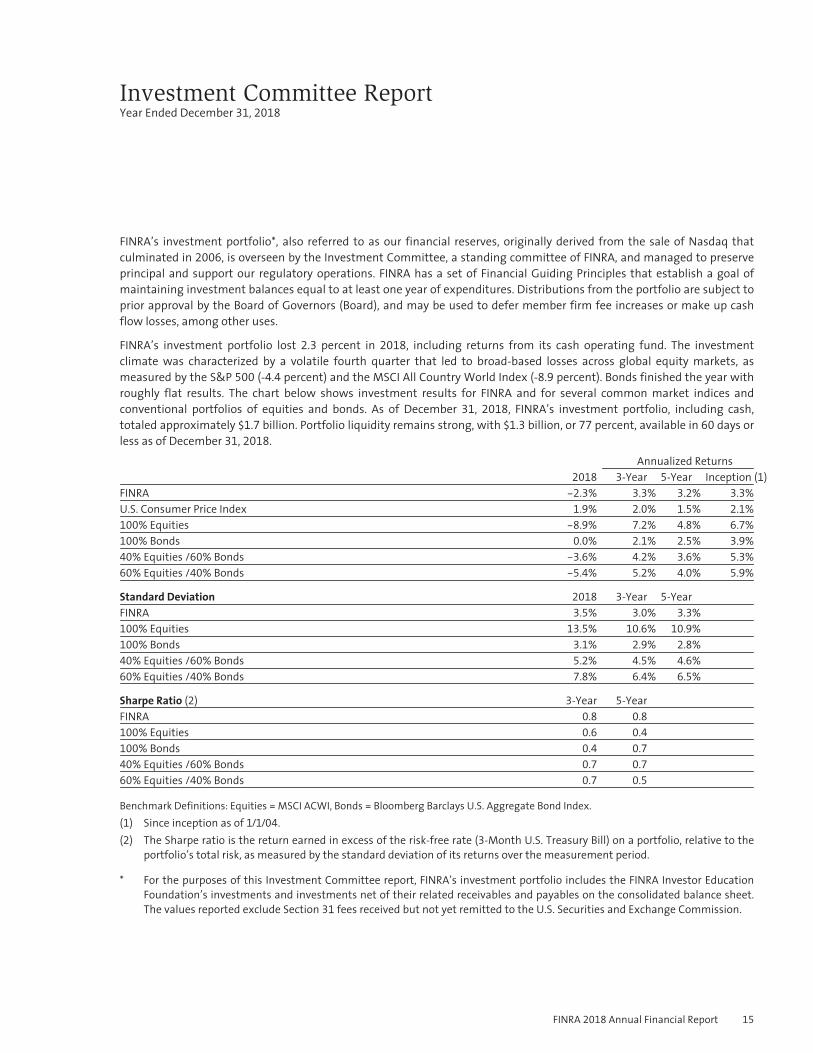
FINRA’s investment portfolio lost 2.3 percent in 2018, including returns from its cash operating fund. The investmentclimate was characterized by a volatile fourth quarter that led to broad-based losses across global equity markets, asmeasured by the S&P 500 (-4.4 percent) and the MSCI All Country World Index (-8.9 percent). Bonds finished the year withroughly flat results. The chart below shows investment results for FINRA and for several common market indices andconventional portfolios of equities and bonds. As of December 31, 2018, FINRA’s investment portfolio, including cash,totaled approximately $1.7 billion. Portfolio liquidity remains strong, with $1.3 billion, or 77 percent, available in 60 days orless as of December 31, 2018.
Annualized Returns2018 3-Year 5-Year Inception (1)
FINRA -2.3% 3.3% 3.2% 3.3%
U.S. Consumer Price Index 1.9% 2.0% 1.5% 2.1%
100% Equities -8.9% 7.2% 4.8% 6.7%
100% Bonds 0.0% 2.1% 2.5% 3.9%
40% Equities /60% Bonds -3.6% 4.2% 3.6% 5.3%
60% Equities /40% Bonds -5.4% 5.2% 4.0% 5.9%
Standard Deviation 2018 3-Year 5-YearFINRA 3.5% 3.0% 3.3%
100% Equities 13.5% 10.6% 10.9%
100% Bonds 3.1% 2.9% 2.8%
40% Equities /60% Bonds 5.2% 4.5% 4.6%
60% Equities /40% Bonds 7.8% 6.4% 6.5%
Sharpe Ratio (2) 3-Year 5-YearFINRA 0.8 0.8
100% Equities 0.6 0.4
100% Bonds 0.4 0.7
40% Equities /60% Bonds 0.7 0.7
60% Equities /40% Bonds 0.7 0.5
Benchmark Definitions: Equities = MSCI ACWI, Bonds = Bloomberg Barclays U.S. Aggregate Bond Index.(1) Since inception as of 1/1/04.(2) The Sharpe ratio is the return earned in excess of the risk-free rate (3-Month U.S. Treasury Bill) on a portfolio, relative to the
portfolio’s total risk, as measured by the standard deviation of its returns over the measurement period.
* For the purposes of this Investment Committee report, FINRA’s investment portfolio includes the FINRA Investor EducationFoundation’s investments and investments net of their related receivables and payables on the consolidated balance sheet.The values reported exclude Section 31 fees received but not yet remitted to the U.S. Securities and Exchange Commission.
FINRA 2018 Annual Financial Report 15
Investment Committee Report (continued)
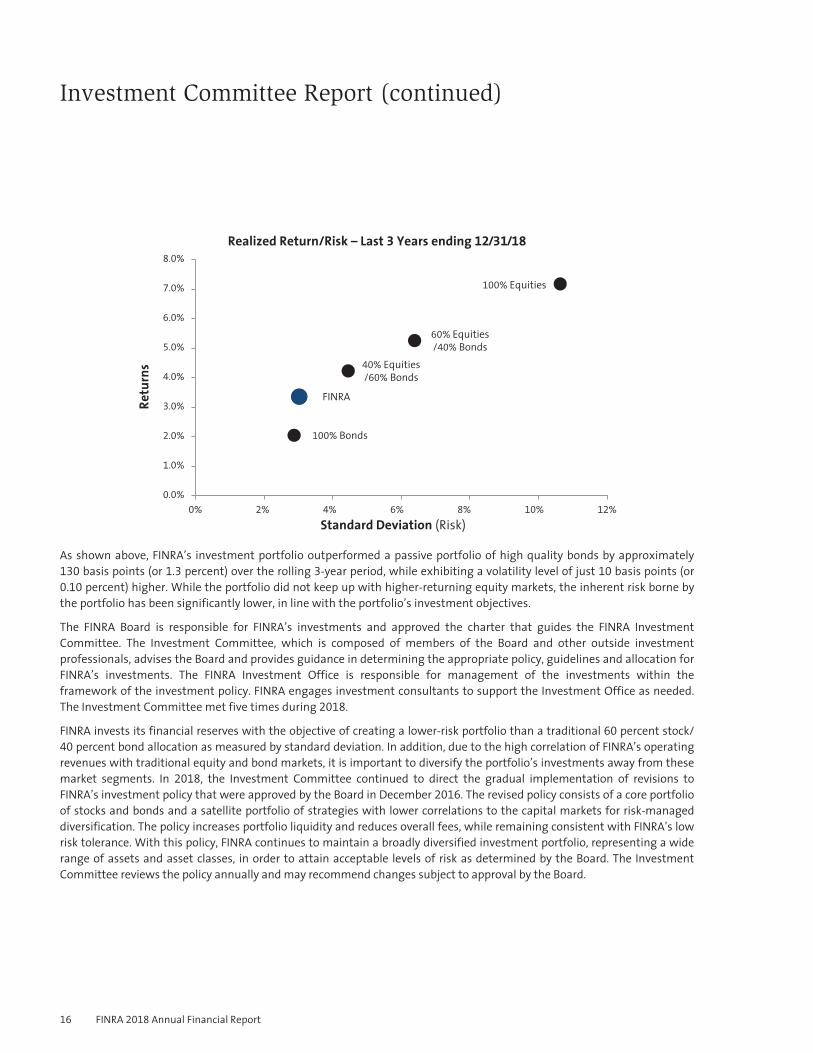
Realized Return/Risk – Last 3 Years ending 12/31/18
FINRA
100% Equities
100% Bonds
60% Equities/40% Bonds
40% Equities/60% Bonds
0.0%
1.0%
2.0%
3.0%
4.0%
5.0%
6.0%
7.0%
8.0%
0% 2% 4% 6% 8% 10% 12%
Retu
rns
Standard Deviation (Risk)
As shown above, FINRA’s investment portfolio outperformed a passive portfolio of high quality bonds by approximately130 basis points (or 1.3 percent) over the rolling 3-year period, while exhibiting a volatility level of just 10 basis points (or0.10 percent) higher. While the portfolio did not keep up with higher-returning equity markets, the inherent risk borne bythe portfolio has been significantly lower, in line with the portfolio’s investment objectives.
The FINRA Board is responsible for FINRA’s investments and approved the charter that guides the FINRA InvestmentCommittee. The Investment Committee, which is composed of members of the Board and other outside investmentprofessionals, advises the Board and provides guidance in determining the appropriate policy, guidelines and allocation forFINRA’s investments. The FINRA Investment Office is responsible for management of the investments within theframework of the investment policy. FINRA engages investment consultants to support the Investment Office as needed.The Investment Committee met five times during 2018.
FINRA invests its financial reserves with the objective of creating a lower-risk portfolio than a traditional 60 percent stock/40 percent bond allocation as measured by standard deviation. In addition, due to the high correlation of FINRA’s operatingrevenues with traditional equity and bond markets, it is important to diversify the portfolio’s investments away from thesemarket segments. In 2018, the Investment Committee continued to direct the gradual implementation of revisions toFINRA’s investment policy that were approved by the Board in December 2016. The revised policy consists of a core portfolioof stocks and bonds and a satellite portfolio of strategies with lower correlations to the capital markets for risk-manageddiversification. The policy increases portfolio liquidity and reduces overall fees, while remaining consistent with FINRA’s lowrisk tolerance. With this policy, FINRA continues to maintain a broadly diversified investment portfolio, representing a widerange of assets and asset classes, in order to attain acceptable levels of risk as determined by the Board. The InvestmentCommittee reviews the policy annually and may recommend changes subject to approval by the Board.
16 FINRA 2018 Annual Financial Report
Investment Committee Report (continued)
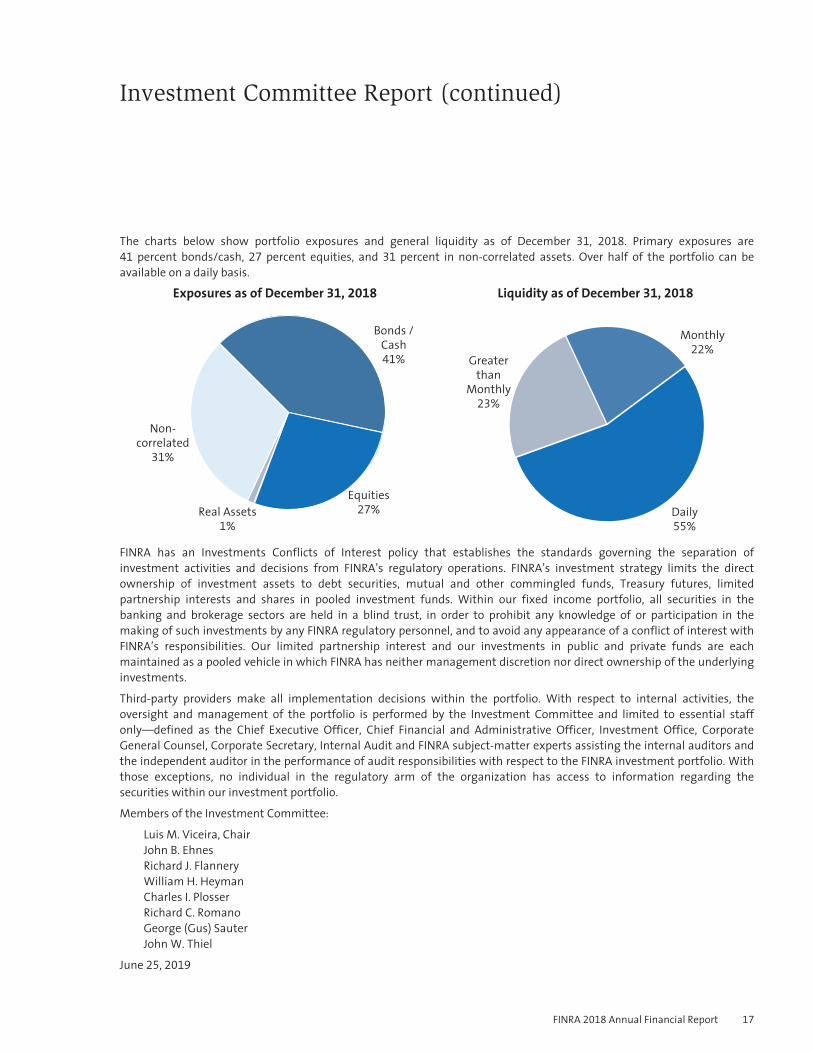
The charts below show portfolio exposures and general liquidity as of December 31, 2018. Primary exposures are41 percent bonds/cash, 27 percent equities, and 31 percent in non-correlated assets. Over half of the portfolio can beavailable on a daily basis.
Exposures as of December 31, 2018 Liquidity as of December 31, 2018
Bonds /Cash41%
Equities27%Real Assets
1%
Non-correlated
31%
Monthly22%
Daily55%
Greaterthan
Monthly23%
FINRA has an Investments Conflicts of Interest policy that establishes the standards governing the separation ofinvestment activities and decisions from FINRA’s regulatory operations. FINRA’s investment strategy limits the directownership of investment assets to debt securities, mutual and other commingled funds, Treasury futures, limitedpartnership interests and shares in pooled investment funds. Within our fixed income portfolio, all securities in thebanking and brokerage sectors are held in a blind trust, in order to prohibit any knowledge of or participation in themaking of such investments by any FINRA regulatory personnel, and to avoid any appearance of a conflict of interest withFINRA’s responsibilities. Our limited partnership interest and our investments in public and private funds are eachmaintained as a pooled vehicle in which FINRA has neither management discretion nor direct ownership of the underlyinginvestments.
Third-party providers make all implementation decisions within the portfolio. With respect to internal activities, theoversight and management of the portfolio is performed by the Investment Committee and limited to essential staffonly—defined as the Chief Executive Officer, Chief Financial and Administrative Officer, Investment Office, CorporateGeneral Counsel, Corporate Secretary, Internal Audit and FINRA subject-matter experts assisting the internal auditors andthe independent auditor in the performance of audit responsibilities with respect to the FINRA investment portfolio. Withthose exceptions, no individual in the regulatory arm of the organization has access to information regarding thesecurities within our investment portfolio.
Members of the Investment Committee:
Luis M. Viceira, ChairJohn B. EhnesRichard J. FlanneryWilliam H. HeymanCharles I. PlosserRichard C. RomanoGeorge (Gus) SauterJohn W. Thiel
June 25, 2019
FINRA 2018 Annual Financial Report 17
Audit Committee ReportYear Ended December 31, 2018
The Audit Committee of the Board of Governors (Board) assists the Board in fulfilling its responsibility for Board oversightof the quality and integrity of the accounting, auditing and financial reporting practices of FINRA in accordance with theCharter adopted by the Board.
Each member of the Audit Committee is an independent director as defined by the U.S. Securities and ExchangeCommission’s (SEC) Rule 10A-3 under the Securities Exchange Act of 1934, Listing Standards Relating to AuditCommittees. In addition, the Audit Committee and Board have determined that Leslie F. Seidman and Eileen K. Murray areaudit committee financial experts, as defined by the SEC.
During 2018, the Audit Committee met seven times.
The Charter and the By-Laws of FINRA make the Chief Audit Executive directly responsible to the Audit Committee. In allmaterial respects, the Charter complies with standards applicable to publicly-owned companies. (The Charter for theFINRA Audit Committee is available at: www.finra.org/about/audit-committee-charter.)
Additionally, the Charter gives the Audit Committee responsibility for monitoring the independence of the independentauditor, recommending the appointment of the independent auditor for approval by the Board, ensuring sufficient scopeof independent auditor activities to perform an adequate financial statement audit and ensuring the independent auditoris fairly and appropriately compensated for its effort. The Charter makes clear that the independent auditor is accountableto the Audit Committee and the Board, as representatives of the members and the public. In addition, the AuditCommittee discusses significant areas of the audit engagement with the independent auditor, with and withoutmanagement present, as needed.
In discharging its oversight responsibility, the Audit Committee reviewed the assessments of audit risk and the audit plansof both the independent and internal auditors. The Audit Committee also discussed with management, the internalauditors, and the independent auditor the quality and adequacy of FINRA’s internal controls and the internal auditorganization, responsibilities, budget and staffing.
In conducting its formal annual assessment of the independent auditor, Audit Committee considerations include, but arenot limited to, the following factors: (i) the most recent results from surveys conducted by management regarding theperformance of the independent auditor, incorporating audit quality, the experience of the engagement team,reasonableness of audit cost, Public Company Accounting Oversight Board (PCAOB) inspection results of the independentauditor and the ongoing strength of the independent audit firm’s reputation; (ii) the length of time the firm has served asFINRA’s independent auditor; and (iii) the timeliness of the independent auditor in escalating issues and reporting resultsto and answering questions proposed by the Audit Committee.
The lead audit partner, having primary responsibility for the audit, rotates off the engagement every five years, and theAudit Committee is involved in the selection of the lead audit partner. The current lead audit partner was appointed inJuly 2016.
Ernst & Young LLP (EY) has served as FINRA’s auditor since 1986.
18 FINRA 2018 Annual Financial Report
Audit Committee Report (continued)
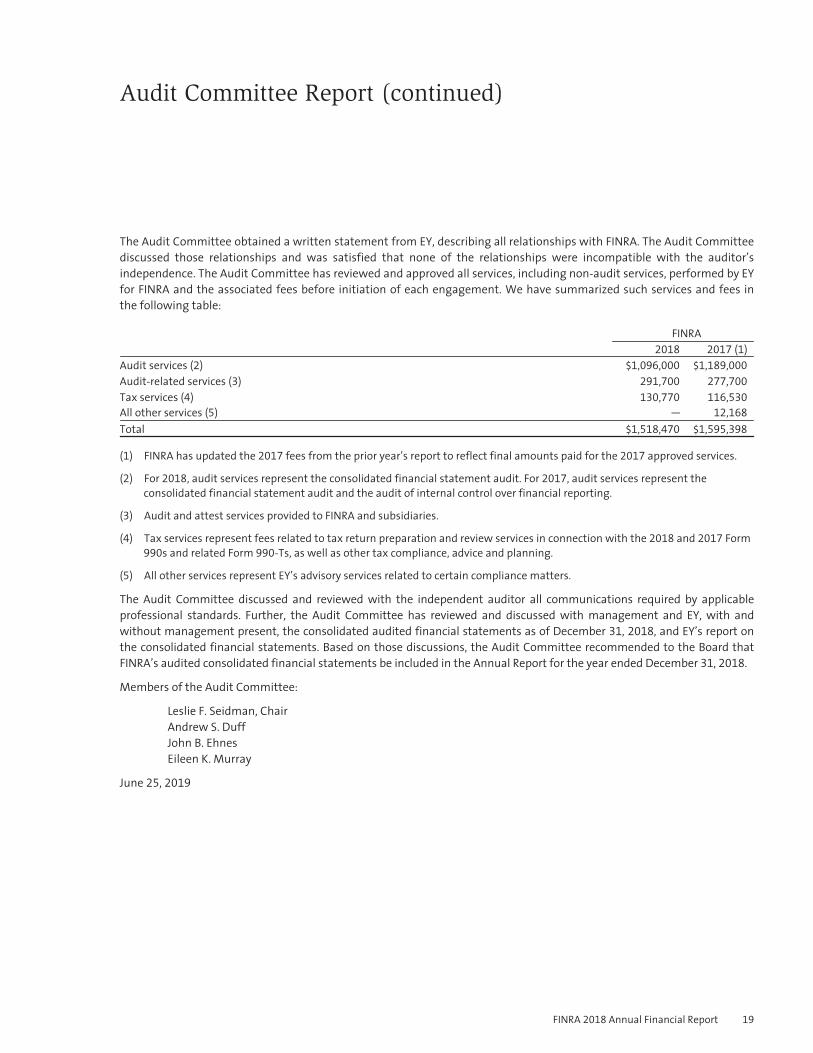
The Audit Committee obtained a written statement from EY, describing all relationships with FINRA. The Audit Committeediscussed those relationships and was satisfied that none of the relationships were incompatible with the auditor’sindependence. The Audit Committee has reviewed and approved all services, including non-audit services, performed by EYfor FINRA and the associated fees before initiation of each engagement. We have summarized such services and fees inthe following table:
FINRA2018 2017 (1)
Audit services (2) $1,096,000 $1,189,000
Audit-related services (3) 291,700 277,700
Tax services (4) 130,770 116,530
All other services (5) — 12,168
Total $1,518,470 $1,595,398
(1) FINRA has updated the 2017 fees from the prior year’s report to reflect final amounts paid for the 2017 approved services.
(2) For 2018, audit services represent the consolidated financial statement audit. For 2017, audit services represent theconsolidated financial statement audit and the audit of internal control over financial reporting.
(3) Audit and attest services provided to FINRA and subsidiaries.
(4) Tax services represent fees related to tax return preparation and review services in connection with the 2018 and 2017 Form990s and related Form 990-Ts, as well as other tax compliance, advice and planning.
(5) All other services represent EY’s advisory services related to certain compliance matters.
The Audit Committee discussed and reviewed with the independent auditor all communications required by applicableprofessional standards. Further, the Audit Committee has reviewed and discussed with management and EY, with andwithout management present, the consolidated audited financial statements as of December 31, 2018, and EY’s report onthe consolidated financial statements. Based on those discussions, the Audit Committee recommended to the Board thatFINRA’s audited consolidated financial statements be included in the Annual Report for the year ended December 31, 2018.
Members of the Audit Committee:
Leslie F. Seidman, ChairAndrew S. DuffJohn B. EhnesEileen K. Murray
June 25, 2019
FINRA 2018 Annual Financial Report 19
Management Compensation Committee ReportYear Ended December 31, 2018
FINRA Compensation Philosophy
FINRA’s compensation philosophy is a pay-for-performance model that seeks to achieve pay levels in line with thecompetitive market while meeting the objectives of attracting, developing and retaining high-performing individuals whoare capable of achieving our mission, and to provide rewards commensurate with individual contributions and FINRA’soverall performance. This philosophy applies to employees at all levels within the organization.
Benchmarking
FINRA strives to be competitive with the external market when establishing starting pay rates, annual incentives andsalary structures. A number of external sources are leveraged to compile market data to establish these structures. FINRAuses specific position survey data to evaluate skill sets and benchmarks the compensation paid to internal talent todetermine whether compensation is comparable to the price that those skills would command on the open market.Ultimately, in assessing how to price staff positions, FINRA places an emphasis foremost on the demands andcompetitiveness of each job to ensure that FINRA is paying equitably for skills, expertise and performance level within theoverall context of remaining comparable to the market.
Defining the relevant employment market for competitive compensation benchmarking purposes is a significantchallenge for FINRA due to the scarcity of natural comparisons, the uniqueness of functions performed, the need forspecialized expertise in financial services and securities law and a constantly changing environment underheightened scrutiny.
As part of its compensation philosophy, FINRA has determined that its competitive compensation positioning for allemployees should be considered against a broad section of financial services and capital market companies, as this is themost likely sector from which FINRA will recruit talent, and that would recruit talent away from the Company. FINRA alsobenchmarks against general industry positions and law departments for jobs that are not unique to the financial servicesindustry. FINRA recognizes that it does not provide fully competitive opportunities, particularly in the equity/long-termincentive area, when compared to certain global investment and securities firms. As a result, benchmarking for keyexecutives will follow the same philosophy but with ranges geared to offset the lack of long-term incentives.
Executive Compensation
The Management Compensation Committee (the Committee), which is composed solely of public members of the Boardof Governors (Board), is responsible for approving salary levels and incentive compensation ranges for top-level executives.The Committee determines the incentive compensation awards based on actual performance. In determining salary andincentive compensation, management and the Committee consider operational, strategic and financial factors in additionto individual performance. The salary and incentive compensation recommendations for the CEO are reviewed andapproved by the Board annually. The Committee met five times during 2018.
20 FINRA 2018 Annual Financial Report
Management Compensation Committee Report (continued)
The Committee has the sole right and responsibility to hire and terminate a compensation consultant. In 2018, as in pastyears, the Committee engaged Mercer, Inc. (Mercer), an independent third-party compensation consultant, to prepare acompensation study, which included objective analysis of current compensation levels and benchmarking usinginformation from a comparable segment of the market for key executives. To ensure the independence of Mercer:
Ô throughout the year, Mercer reported directly and exclusively to the Committee;Ô no Mercer employee was hired by FINRA;Ô Mercer provided no significant services, other than compensation consulting services, to FINRA;Ô any interaction between Mercer and FINRA executive management was limited to discussions on behalf of the
Committee and information that was presented to the Committee for approval; andÔ fees paid to Mercer for compensation consulting services were reasonable and in line with industry standards.
In determining a benchmarking strategy for key executives, financial services organizations (broker-dealers, investmentbanks, Federal Reserve banks, commercial banks, insurance companies, exchanges and regulators) were determined to bethe most relevant group for comparison purposes. The Committee and Mercer engaged in substantial research andconsideration of the functions and operations of several potential comparisons as well as general competitive conditions.Ultimately, the Committee approved a benchmarking process for key executives that focused on the following sources:
Ô A public comparison group comprising a blend of financial services organizations engaged in brokerage orother related banking activities.
Ô Public exchanges and regulators.Ô Financial services industry survey data.
The Committee will routinely review the aforementioned sources in determining annual salary andincentive compensation.
FINRA 2018 Annual Financial Report 21
Management Compensation Committee Report (continued)
Summary Compensation Table
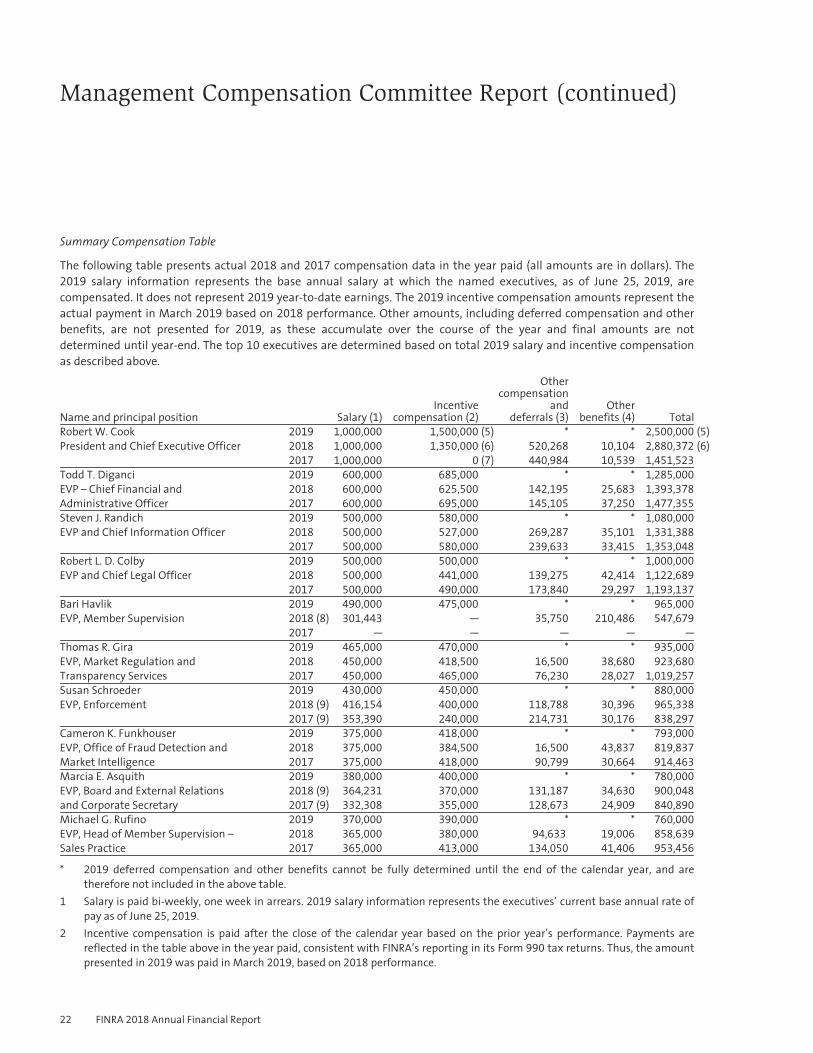
The following table presents actual 2018 and 2017 compensation data in the year paid (all amounts are in dollars). The2019 salary information represents the base annual salary at which the named executives, as of June 25, 2019, arecompensated. It does not represent 2019 year-to-date earnings. The 2019 incentive compensation amounts represent theactual payment in March 2019 based on 2018 performance. Other amounts, including deferred compensation and otherbenefits, are not presented for 2019, as these accumulate over the course of the year and final amounts are notdetermined until year-end. The top 10 executives are determined based on total 2019 salary and incentive compensationas described above.
Name and principal position Salary (1)Incentive
compensation (2)
Othercompensation
anddeferrals (3)
Otherbenefits (4) Total
Robert W. Cook 2019 1,000,000 1,500,000 (5) * * 2,500,000 (5)
President and Chief Executive Officer 2018 1,000,000 1,350,000 (6) 520,268 10,104 2,880,372 (6)
2017 1,000,000 0 (7) 440,984 10,539 1,451,523
Todd T. Diganci 2019 600,000 685,000 * * 1,285,000
EVP – Chief Financial and 2018 600,000 625,500 142,195 25,683 1,393,378
Administrative Officer 2017 600,000 695,000 145,105 37,250 1,477,355
Steven J. Randich 2019 500,000 580,000 * * 1,080,000
EVP and Chief Information Officer 2018 500,000 527,000 269,287 35,101 1,331,388
2017 500,000 580,000 239,633 33,415 1,353,048
Robert L. D. Colby 2019 500,000 500,000 * * 1,000,000
EVP and Chief Legal Officer 2018 500,000 441,000 139,275 42,414 1,122,689
2017 500,000 490,000 173,840 29,297 1,193,137
Bari Havlik 2019 490,000 475,000 * * 965,000
EVP, Member Supervision 2018 (8) 301,443 — 35,750 210,486 547,679
2017 — — — — —
Thomas R. Gira 2019 465,000 470,000 * * 935,000
EVP, Market Regulation and 2018 450,000 418,500 16,500 38,680 923,680
Transparency Services 2017 450,000 465,000 76,230 28,027 1,019,257
Susan Schroeder 2019 430,000 450,000 * * 880,000
EVP, Enforcement 2018 (9) 416,154 400,000 118,788 30,396 965,338
2017 (9) 353,390 240,000 214,731 30,176 838,297
Cameron K. Funkhouser 2019 375,000 418,000 * * 793,000
EVP, Office of Fraud Detection and 2018 375,000 384,500 16,500 43,837 819,837
Market Intelligence 2017 375,000 418,000 90,799 30,664 914,463
Marcia E. Asquith 2019 380,000 400,000 * * 780,000
EVP, Board and External Relations 2018 (9) 364,231 370,000 131,187 34,630 900,048
and Corporate Secretary 2017 (9) 332,308 355,000 128,673 24,909 840,890
Michael G. Rufino 2019 370,000 390,000 * * 760,000
EVP, Head of Member Supervision – 2018 365,000 380,000 94,633 19,006 858,639
Sales Practice 2017 365,000 413,000 134,050 41,406 953,456
* 2019 deferred compensation and other benefits cannot be fully determined until the end of the calendar year, and aretherefore not included in the above table.
1 Salary is paid bi-weekly, one week in arrears. 2019 salary information represents the executives’ current base annual rate ofpay as of June 25, 2019.
2 Incentive compensation is paid after the close of the calendar year based on the prior year’s performance. Payments arereflected in the table above in the year paid, consistent with FINRA’s reporting in its Form 990 tax returns. Thus, the amountpresented in 2019 was paid in March 2019, based on 2018 performance.
22 FINRA 2018 Annual Financial Report
Management Compensation Committee Report (continued)
3 Other compensation and deferrals include earnings and accruals in supplemental executive retirement plans, which are notavailable to all employees. Mr. Diganci, Mr. Gira and Mr. Funkhouser participate in FINRA’s supplemental defined benefitretirement plan, which is now closed to new participants. The remaining listed executives are participants in thesupplemental defined contribution retirement plan. Other compensation and deferrals also include payments and accrualsfor multi-year retention arrangements as well as employer-funded 401(k) matching contributions and the accrual of benefitsin FINRA’s employee retirement plans. The 401(k) and retirement plans are generally available to all employees.
4 Other benefits include taxable and non-taxable benefits such as employer-paid health, life and disability insurance, whichare generally available to all employees. They also include parking, travel subsidies, tax gross-ups and other miscellaneousfringe benefits.
5 In 2019, Mr. Cook contributed $150,000 of his 2018 incentive compensation (less estimated taxes payable by him) to theFINRA Investor Education Foundation. After consideration of this contribution, Mr. Cook’s total salary and incentivecompensation for 2019 is effectively $2,350,000.
6 In 2018, Mr. Cook contributed $675,000 of his 2017 incentive compensation (less estimated taxes payable by him) to theFINRA Investor Education Foundation. After consideration of this contribution, Mr. Cook’s total compensation for 2018 waseffectively $2,205,372.
7 Mr. Cook was eligible for but declined to accept incentive compensation for 2016.8 The 2018 compensation for Ms. Havlik represents a partial year of employment.9 The year-over-year increase in compensation for these individuals is driven by their promotion to Executive Vice President
during 2017.
Components of Compensation
Direct Compensation
Ô Base salaries consist of job-grade structures to provide for appropriate flexibility in hiring and retention. Actualsalaries are based on job content, performance and relevant experience levels, and may fall above or belowcompetitive levels.
Ô Incentive compensation is an additional “at-risk” compensation that is performance-based and determined inrelation to individual achievements and FINRA’s overall performance. The size of the actual award varies basedon goal achievement, performance, grade level and degree of responsibility within the organization. Ifawarded, it is paid as a lump sum in the following year.
Indirect Compensation
Ô Supplemental retirement benefits are provided for top executives and are either defined benefit or definedcontribution based on employment start date. These plans are non-qualified and are based on salary, officerlevel and, depending on officer level, a portion of incentive compensation.
Ô Employee and family health, life and other insurance, pension and 401(k) deferral and matching programs,health club subsidies and other benefits are generally available to all employees. Additionally, certainexecutives receive miscellaneous taxable fringe benefits that may include parking, travel subsidies and similarminor items.
Members of the Management Compensation Committee:
Rochelle B. Lazarus, ChairWilliam H. HeymanEileen K. MurrayHillary SaleLuis M. Viceira
June 25, 2019
FINRA 2018 Annual Financial Report 23
Management Report on Internal Control Over FinancialReporting
FINRA management is responsible for the preparation and integrity of the consolidated financial statements appearing inour annual report. The consolidated financial statements were prepared in conformity with U.S. generally acceptedaccounting principles (U.S. GAAP) and include amounts based on management’s estimates and judgments. FINRAmanagement is also responsible for establishing and maintaining adequate internal control over financial reporting andfor the assessment of the effectiveness of internal control over financial reporting. Internal control over financial reportingis a process designed by management to provide reasonable assurance regarding the reliability of financial reporting andthe preparation of financial statements in accordance with U.S. GAAP.
FINRA maintains a system of internal control that is designed to provide reasonable assurance as to the fair and reliablepreparation and presentation of the consolidated financial statements, as well as to safeguard assets from unauthorizeduse or disposition that could have a material effect on the consolidated financial statements. FINRA’s internal control overfinancial reporting includes written policies and procedures that 1) pertain to the maintenance of records that, inreasonable detail, accurately and fairly reflect the transactions and dispositions of FINRA’s assets; 2) provide reasonableassurance that transactions are recorded as necessary to permit preparation of consolidated financial statements inaccordance with U.S. GAAP, and that receipts and expenditures of FINRA are being made only in accordance withauthorizations of FINRA’s management and governors; and 3) provide reasonable assurance regarding prevention ortimely detection of unauthorized acquisition, use or disposition of FINRA’s assets that could have a material effect on theconsolidated financial statements.
Because of its inherent limitations, internal control over financial reporting may not prevent or detect misstatements dueto error or fraud, including the possibility of the circumvention or overriding of controls. Projections of any evaluation ofeffectiveness to future periods are subject to the risk that controls may become inadequate because of changes inconditions, or that the degree of compliance with the policies or procedures may deteriorate.
Under the supervision of the President and Chief Executive Officer and the Chief Financial and Administrative Officer,FINRA’s management assessed the effectiveness of FINRA’s internal control over financial reporting as of December 31,2018. This evaluation included, among other things, reviews of the documentation of controls, evaluations of the designeffectiveness of controls and reviews of evidence supporting the operating effectiveness of controls. Based on thisassessment, we conclude that FINRA maintained effective internal control over financial reporting as of December 31, 2018.
June 25, 2019
Robert W. CookPresident and Chief Executive Officer
Todd T. DiganciExecutive Vice President – Chief Financial andAdministrative Officer
24 FINRA 2018 Annual Financial Report
Report of Independent Registered Public Accounting Firm
To the Board of Governors ofFinancial Industry Regulatory Authority, Inc.
Opinion on the Financial Statements
We have audited the accompanying consolidated balance sheets of the Financial Industry Regulatory Authority, Inc. (FINRAor the Company) as of December 31, 2018 and 2017, the related consolidated statements of operations, comprehensiveincome, changes in equity and cash flows for the years then ended, and the related notes (collectively referred to as the“consolidated financial statements”). In our opinion, the consolidated financial statements present fairly, in all materialrespects, the financial position of FINRA at December 31, 2018 and 2017, and the results of its operations and its cashflows for the years then ended in conformity with U.S. generally accepted accounting principles.
Basis for Opinion
These financial statements are the responsibility of FINRA’s management. Our responsibility is to express an opinion onFINRA’s financial statements based on our audits. We are required to be independent with respect to FINRA in accordancewith the relevant ethical requirements relating to our audits.
We conducted our audits in accordance with the auditing standards of the Public Company Accounting Oversight Board(United States) and in accordance with auditing standards generally accepted in the United States of America. Thosestandards require that we plan and perform the audit to obtain reasonable assurance about whether the financialstatements are free of material misstatement, whether due to error or fraud. The Company is not required to have, norwere we engaged to perform, an audit of its internal control over financial reporting. As part of our audits we are requiredto obtain an understanding of internal control over financial reporting but not for the purpose of expressing an opinion onthe effectiveness of the Company’s internal control over financial reporting. Accordingly, we express no such opinion.
Our audits included performing procedures to assess the risks of material misstatement of the financial statements,whether due to error or fraud, and performing procedures that respond to those risks. Such procedures includedexamining, on a test basis, evidence regarding the amounts and disclosures in the financial statements. Our audits alsoincluded evaluating the accounting principles used and significant estimates made by management, as well as evaluatingthe overall presentation of the financial statements. We believe that our audits provide a reasonable basis for our opinion.
We have served as FINRA’s auditor since 1986.
Tysons, VirginiaJune 25, 2019
FINRA 2018 Annual Financial Report 25
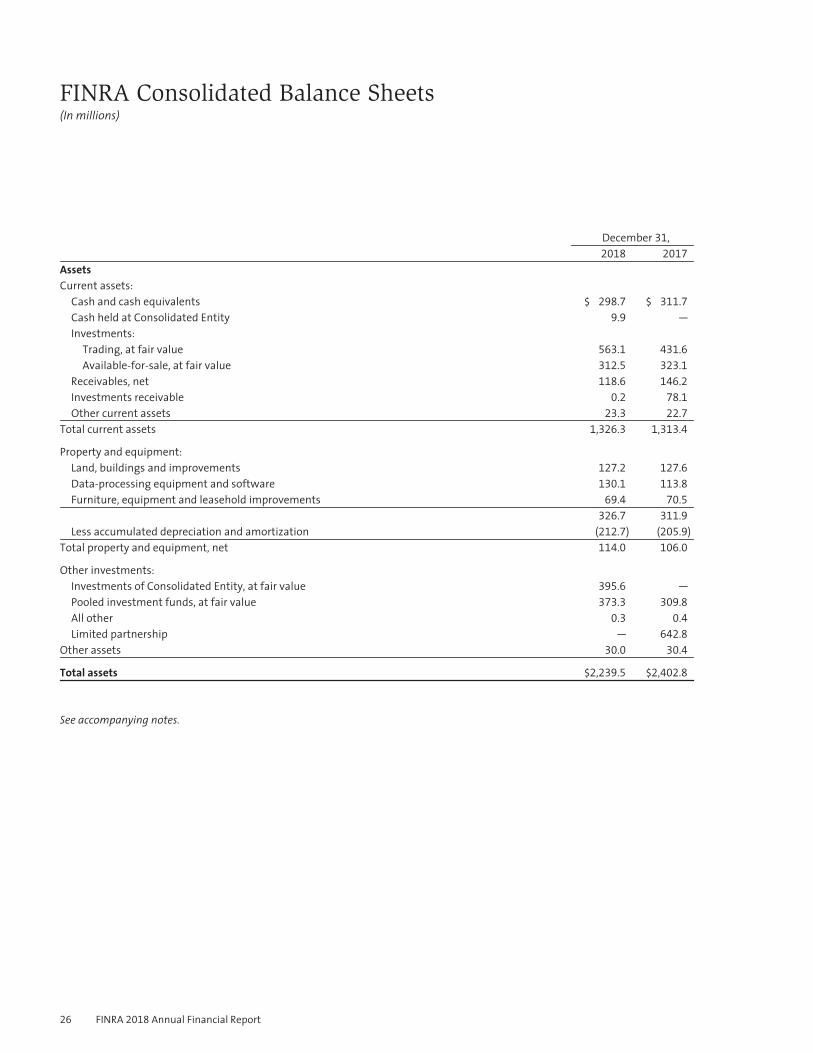
FINRA Consolidated Balance Sheets(In millions)
December 31,2018 2017
AssetsCurrent assets:
Cash and cash equivalents $ 298.7 $ 311.7
Cash held at Consolidated Entity 9.9 —
Investments:Trading, at fair value 563.1 431.6
Available-for-sale, at fair value 312.5 323.1
Receivables, net 118.6 146.2
Investments receivable 0.2 78.1
Other current assets 23.3 22.7
Total current assets 1,326.3 1,313.4
Property and equipment:Land, buildings and improvements 127.2 127.6
Data-processing equipment and software 130.1 113.8
Furniture, equipment and leasehold improvements 69.4 70.5
326.7 311.9
Less accumulated depreciation and amortization (212.7) (205.9)
Total property and equipment, net 114.0 106.0
Other investments:Investments of Consolidated Entity, at fair value 395.6 —
Pooled investment funds, at fair value 373.3 309.8
All other 0.3 0.4
Limited partnership — 642.8
Other assets 30.0 30.4
Total assets $2,239.5 $2,402.8
See accompanying notes.
26 FINRA 2018 Annual Financial Report
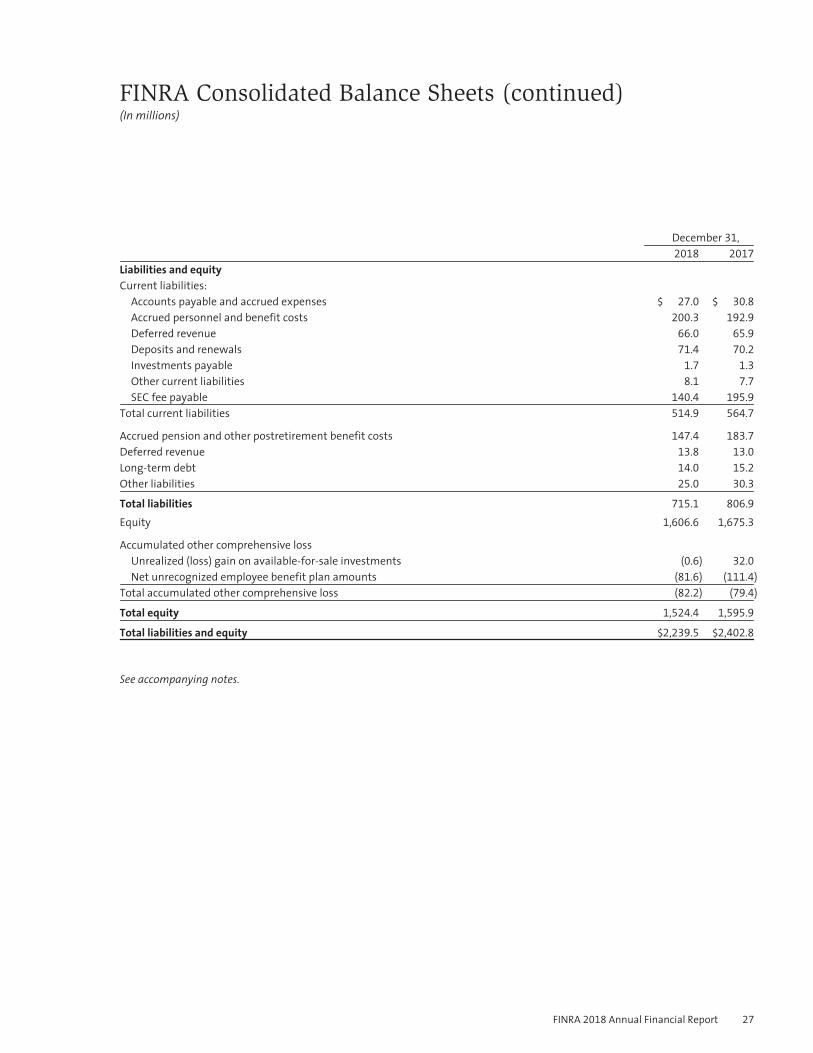
FINRA Consolidated Balance Sheets (continued)(In millions)
December 31,
2018 2017
Liabilities and equityCurrent liabilities:
Accounts payable and accrued expenses $ 27.0 $ 30.8
Accrued personnel and benefit costs 200.3 192.9
Deferred revenue 66.0 65.9
Deposits and renewals 71.4 70.2
Investments payable 1.7 1.3
Other current liabilities 8.1 7.7
SEC fee payable 140.4 195.9
Total current liabilities 514.9 564.7
Accrued pension and other postretirement benefit costs 147.4 183.7
Deferred revenue 13.8 13.0
Long-term debt 14.0 15.2
Other liabilities 25.0 30.3
Total liabilities 715.1 806.9
Equity 1,606.6 1,675.3
Accumulated other comprehensive lossUnrealized (loss) gain on available-for-sale investments (0.6) 32.0
Net unrecognized employee benefit plan amounts (81.6) (111.4)
Total accumulated other comprehensive loss (82.2) (79.4)
Total equity 1,524.4 1,595.9
Total liabilities and equity $2,239.5 $2,402.8
See accompanying notes.
FINRA 2018 Annual Financial Report 27
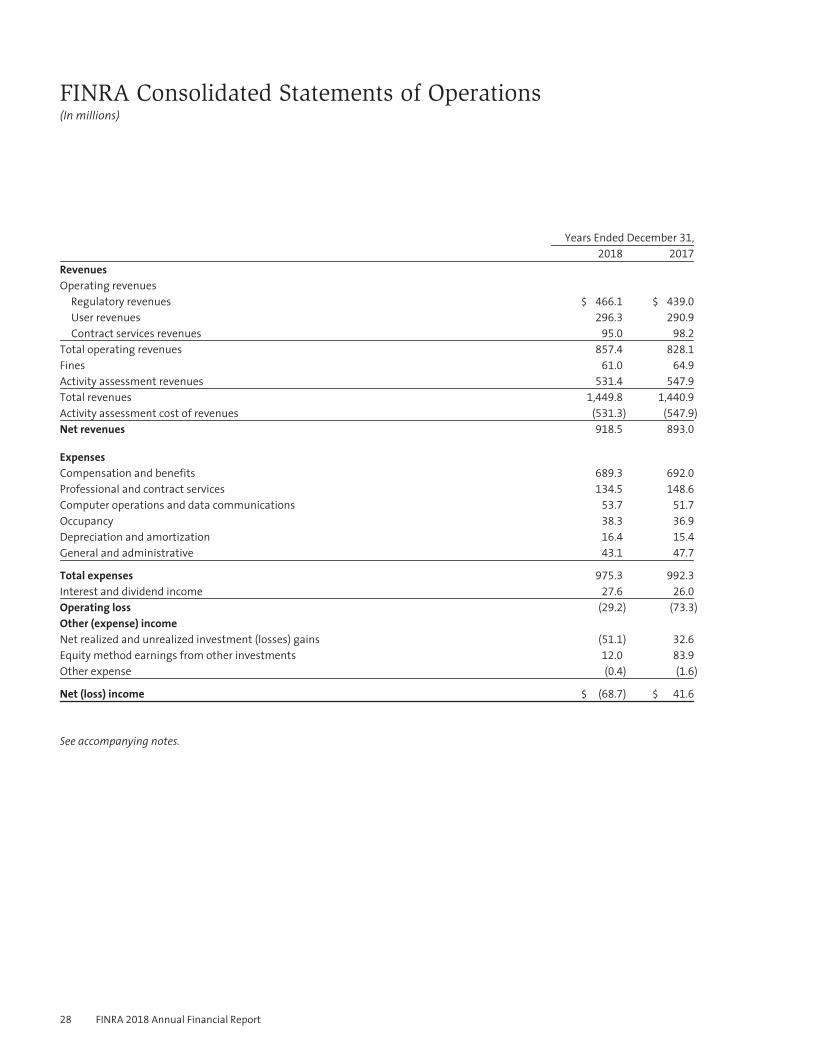
FINRA Consolidated Statements of Operations(In millions)
Years Ended December 31,
2018 2017
RevenuesOperating revenues
Regulatory revenues $ 466.1 $ 439.0
User revenues 296.3 290.9
Contract services revenues 95.0 98.2
Total operating revenues 857.4 828.1
Fines 61.0 64.9
Activity assessment revenues 531.4 547.9
Total revenues 1,449.8 1,440.9
Activity assessment cost of revenues (531.3) (547.9)
Net revenues 918.5 893.0
ExpensesCompensation and benefits 689.3 692.0
Professional and contract services 134.5 148.6
Computer operations and data communications 53.7 51.7
Occupancy 38.3 36.9
Depreciation and amortization 16.4 15.4
General and administrative 43.1 47.7
Total expenses 975.3 992.3
Interest and dividend income 27.6 26.0
Operating loss (29.2) (73.3)
Other (expense) incomeNet realized and unrealized investment (losses) gains (51.1) 32.6
Equity method earnings from other investments 12.0 83.9
Other expense (0.4) (1.6)
Net (loss) income $ (68.7) $ 41.6
See accompanying notes.
28 FINRA 2018 Annual Financial Report
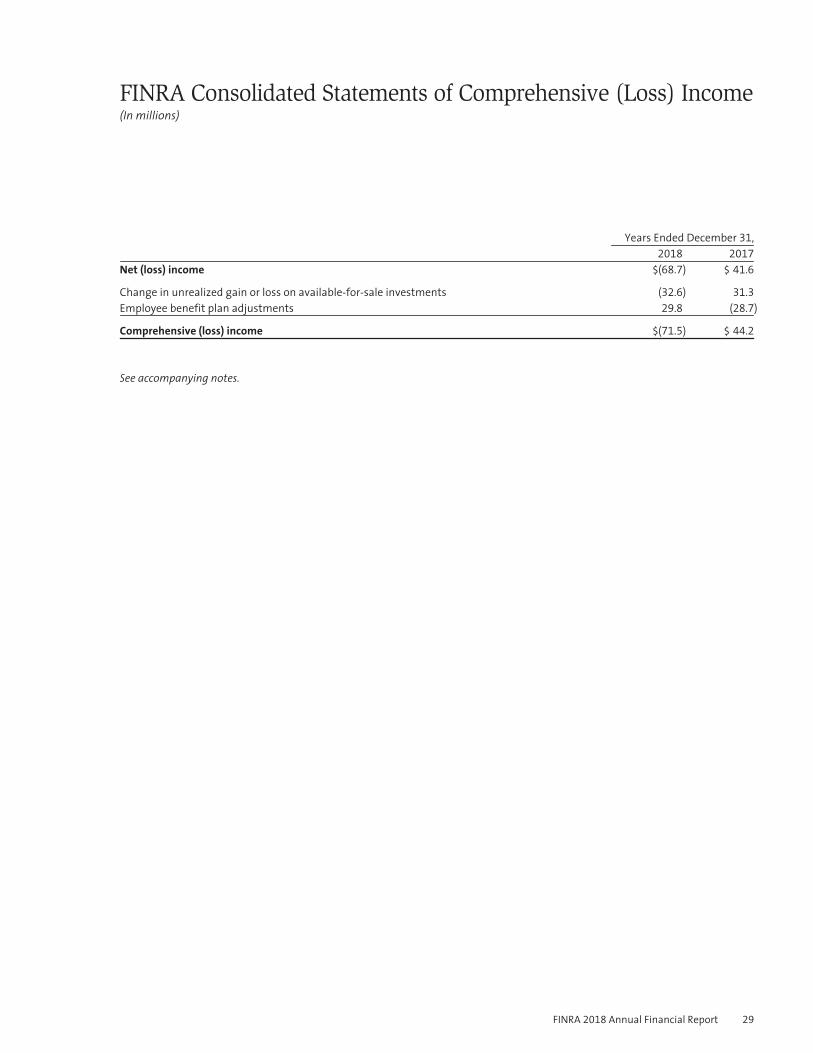
FINRA Consolidated Statements of Comprehensive (Loss) Income(In millions)
Years Ended December 31,
2018 2017
Net (loss) income $(68.7) $ 41.6
Change in unrealized gain or loss on available-for-sale investments (32.6) 31.3
Employee benefit plan adjustments 29.8 (28.7)
Comprehensive (loss) income $(71.5) $ 44.2
See accompanying notes.
FINRA 2018 Annual Financial Report 29
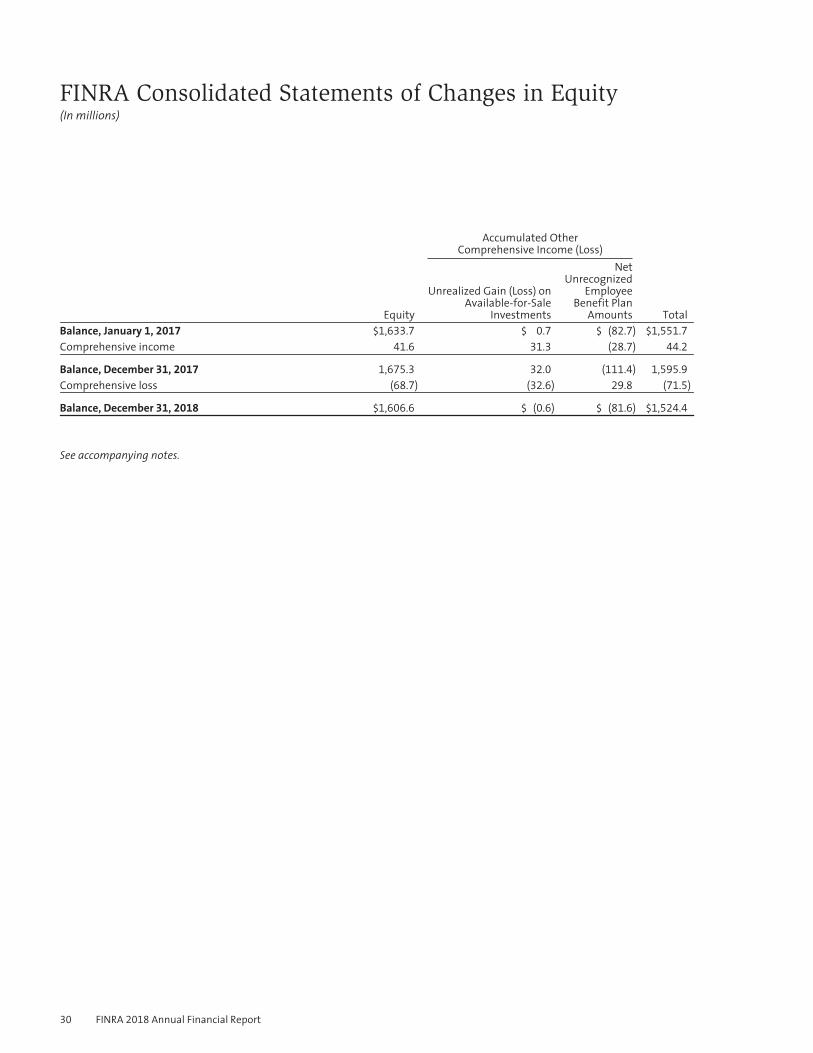
FINRA Consolidated Statements of Changes in Equity(In millions)
Accumulated OtherComprehensive Income (Loss)
Equity
Unrealized Gain (Loss) onAvailable-for-Sale
Investments
NetUnrecognized
EmployeeBenefit Plan
Amounts TotalBalance, January 1, 2017 $1,633.7 $ 0.7 $ (82.7) $1,551.7
Comprehensive income 41.6 31.3 (28.7) 44.2
Balance, December 31, 2017 1,675.3 32.0 (111.4) 1,595.9
Comprehensive loss (68.7) (32.6) 29.8 (71.5)
Balance, December 31, 2018 $1,606.6 $ (0.6) $ (81.6) $1,524.4
See accompanying notes.
30 FINRA 2018 Annual Financial Report
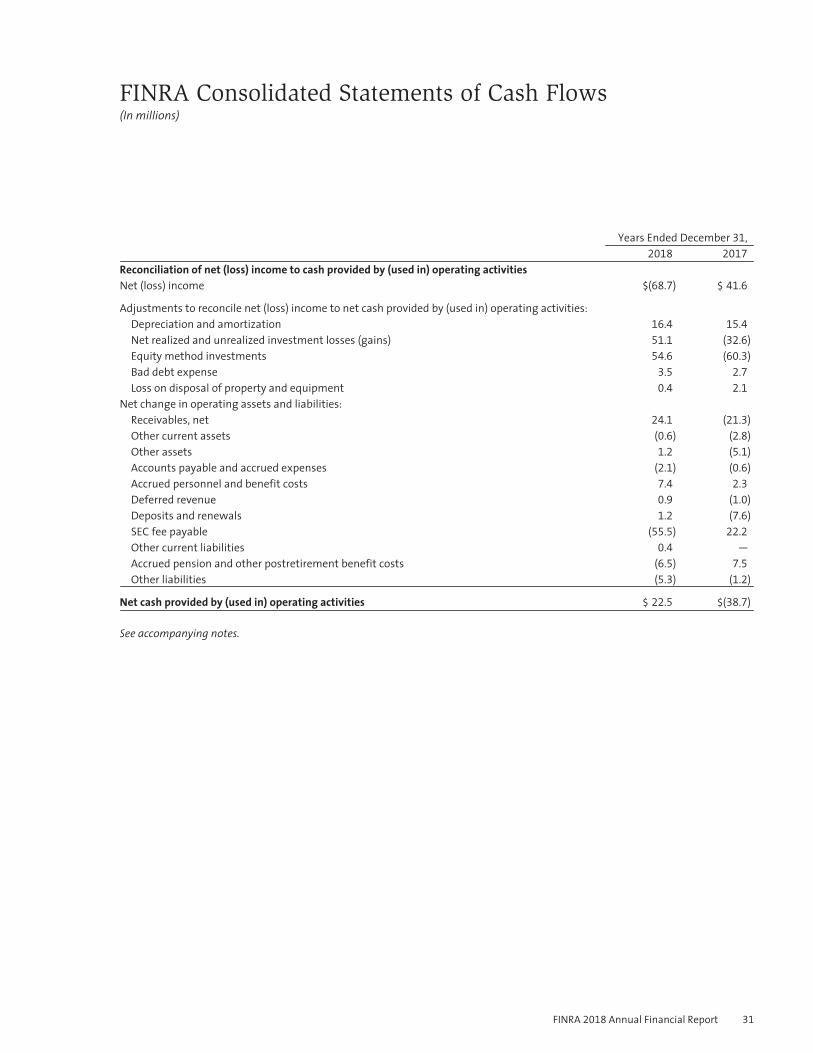
FINRA Consolidated Statements of Cash Flows(In millions)
Years Ended December 31,2018 2017
Reconciliation of net (loss) income to cash provided by (used in) operating activitiesNet (loss) income $(68.7) $ 41.6
Adjustments to reconcile net (loss) income to net cash provided by (used in) operating activities:Depreciation and amortization 16.4 15.4
Net realized and unrealized investment losses (gains) 51.1 (32.6)
Equity method investments 54.6 (60.3)
Bad debt expense 3.5 2.7
Loss on disposal of property and equipment 0.4 2.1
Net change in operating assets and liabilities:Receivables, net 24.1 (21.3)
Other current assets (0.6) (2.8)
Other assets 1.2 (5.1)
Accounts payable and accrued expenses (2.1) (0.6)
Accrued personnel and benefit costs 7.4 2.3
Deferred revenue 0.9 (1.0)
Deposits and renewals 1.2 (7.6)
SEC fee payable (55.5) 22.2
Other current liabilities 0.4 —
Accrued pension and other postretirement benefit costs (6.5) 7.5
Other liabilities (5.3) (1.2)
Net cash provided by (used in) operating activities $ 22.5 $(38.7)
See accompanying notes.
FINRA 2018 Annual Financial Report 31
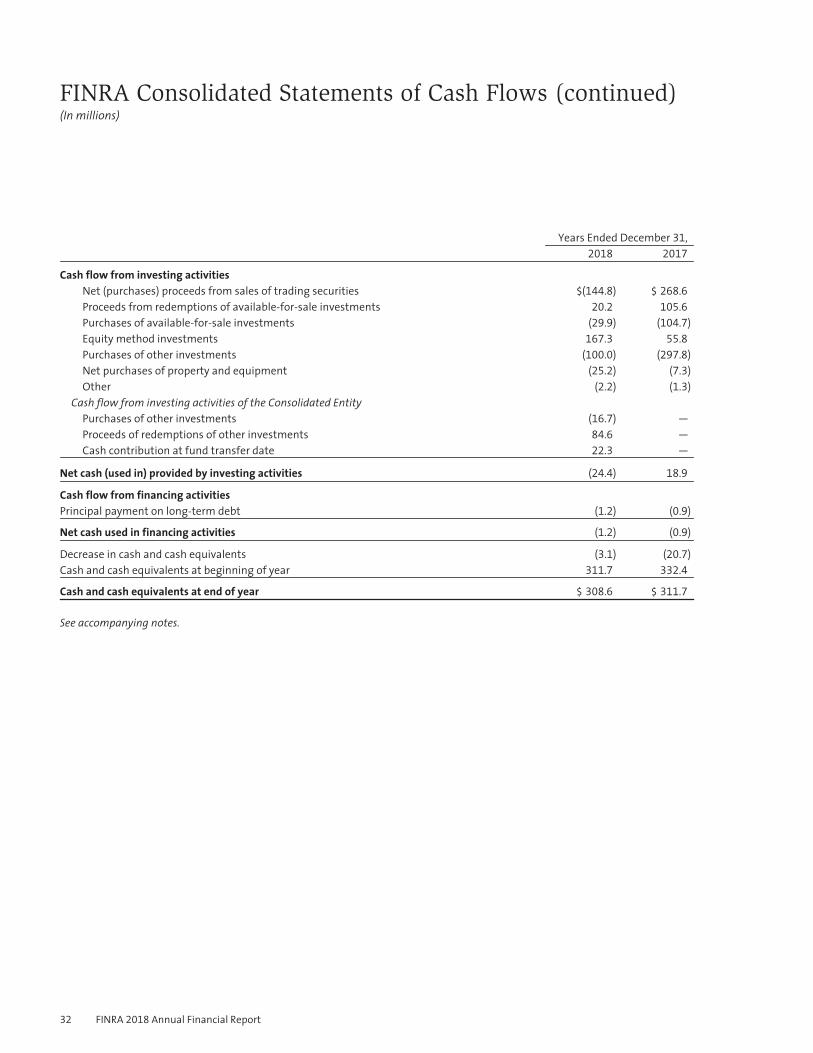
FINRA Consolidated Statements of Cash Flows (continued)(In millions)
Years Ended December 31,2018 2017
Cash flow from investing activitiesNet (purchases) proceeds from sales of trading securities $(144.8) $ 268.6
Proceeds from redemptions of available-for-sale investments 20.2 105.6
Purchases of available-for-sale investments (29.9) (104.7)
Equity method investments 167.3 55.8
Purchases of other investments (100.0) (297.8)
Net purchases of property and equipment (25.2) (7.3)
Other (2.2) (1.3)
Cash flow from investing activities of the Consolidated EntityPurchases of other investments (16.7) —
Proceeds of redemptions of other investments 84.6 —
Cash contribution at fund transfer date 22.3 —
Net cash (used in) provided by investing activities (24.4) 18.9
Cash flow from financing activitiesPrincipal payment on long-term debt (1.2) (0.9)
Net cash used in financing activities (1.2) (0.9)
Decrease in cash and cash equivalents (3.1) (20.7)
Cash and cash equivalents at beginning of year 311.7 332.4
Cash and cash equivalents at end of year $ 308.6 $ 311.7
See accompanying notes.
32 FINRA 2018 Annual Financial Report
FINRA 2018 Notes to Consolidated Financial Statements
1. ORGANIZATION AND NATURE OF OPERATIONS
References to the terms “we,” “our,” “us,” “FINRA” or the “Company” used throughout these Notes to ConsolidatedFinancial Statements refer to the Financial Industry Regulatory Authority, Inc. (FINRA), a Delaware corporation, and itswholly owned subsidiaries. FINRA wholly owns the following significant subsidiaries: FINRA Regulation, Inc. (FINRA REG)and the FINRA Investor Education Foundation (the Foundation). The Foundation is a tax-exempt membership corporationincorporated in the State of Delaware, with FINRA as the sole member.
We are a self-regulatory organization (SRO) for brokerage firms doing business with the public in the United States. Weregulate the activities of U.S. broker-dealers and perform market regulation pursuant to our own statutory responsibilityand under contract for certain exchanges. Our statutory regulatory functions include examinations of securities firms,continuous surveillance of markets, reviews of fraud allegations and disciplinary actions against firms and registeredrepresentatives. FINRA’s examination process is risk-based, meaning our approach for identifying firms for examination isbased upon risk, scale and scope of firm operations. We conduct examinations to determine whether firms are incompliance with federal securities law and FINRA rules, as well as in response to investor complaints, terminations ofbrokerage employees for cause, arbitrations and referrals from other regulators. FINRA operates unique equity and optionscross-market surveillance programs. Employing advanced technology, these programs collect and integrate trading dataacross exchanges and alternative trading systems to detect potential market manipulation and other rule violations. Weprovide a heightened and expedited review of allegations of serious fraud and consolidate recognized expertise inexpedited fraud detection and investigation to prevent further harm to investors. We bring disciplinary actions againstfirms and their employees that may result in sanctions including censures, fines, suspensions and, in egregious cases,expulsions or bars from the industry. In appropriate cases, we require firms and individuals to provide restitution toharmed investors and often impose other conditions on a firm’s business to prevent repeated wrongdoing.
We perform market regulation services under contract for the New York Stock Exchange LLC (NYSE), NYSE Arca, Inc. (NYSEArca), NYSE American, LLC (NYSE American), NYSE Chicago, Inc. (NYSE Chicago), NYSE National, Inc. (NYSE National), TheNasdaq Stock Market LLC (Nasdaq), Nasdaq BX, Inc. (Boston), Nasdaq PHLX LLC (Philadelphia), Nasdaq ISE, LLC, NasdaqGEMX, LLC, Nasdaq MRX, LLC, Cboe Global Markets, Inc. (the Cboe, C2, BZX, BYX, EDGA and EDGX exchanges, collectivelyreferred to as Cboe), The Investors Exchange (IEX), the Boston Options Exchange, LLC (BOX), the Miami InternationalSecurities Exchange, LLC (MIAX Options), MIAX EMERALD LLC (MIAX EMERALD), and MIAX PEARL LLC (MIAX PEARL). We alsoregulate the over-the-counter (OTC) securities markets for listed and unlisted equities and the OTC markets for corporatebonds, Treasury Securities, asset-backed instruments, certain government agency instruments, municipal securities andother fixed income instruments.
We provide arbitration and mediation services to assist in the resolution of monetary and business disputes between andamong investors, broker-dealers and individual brokers. We also provide dispute resolution services for several exchangesthrough contractual agreements, thereby offering consistent procedures and the uniformity of a single forum for theresolution of securities-industry related disputes.
We provide technology-driven registration, testing and continuing education, and other regulatory services, as well asoperational and support services to firms, other SROs, the U.S. Securities and Exchange Commission (SEC), the NorthAmerican Securities Administrators Association, state regulators, the investing public, the Conference of State BankSupervisors and its wholly owned subsidiary, the State Regulatory Registry LLC (SRR). We continue to enhanceBrokerCheck®, a free tool that helps investors research the professional backgrounds of current and former FINRA-registered brokerage firms and brokers, as well as investment adviser firms and representatives.
We are committed to ensuring that investors and market participants have access to market information, so they canmore effectively assess securities prices and valuations, through the management and operation of FINRA’s OTC markettransparency facilities. These facilities include the Trade Reporting and Compliance Engine® (TRACE®) for fixed income
FINRA 2018 Annual Financial Report 33
FINRA 2018 Notes to Consolidated Financial Statements
1. ORGANIZATION AND NATURE OF OPERATIONS (CONTINUED)
securities, the OTC Reporting FacilityTM (ORFTM) and OTC Bulletin Board® (OTCBB®) for equity securities not listed on anexchange and the Trade Reporting Facilities® (TRFs®), operated in partnership with NYSE and Nasdaq, for OTC trading inequity securities that are listed on an exchange. In this capacity, we provide the public and professionals with timely tradeinformation for equity and debt securities and quotes for certain equity securities.
The Foundation empowers underserved Americans with the knowledge, skills and tools to make sound financial decisionsthroughout life. The Foundation accomplishes this mission through educational programs and research that helpconsumers achieve their financial goals and that protect them in a complex and dynamic world.
2. SUMMARY OF SIGNIFICANT ACCOUNTING POLICIES
BASIS OF PRESENTATION
The accompanying consolidated financial statements are prepared in accordance with U.S. generally accepted accountingprinciples (U.S. GAAP) and include the accounts of the Company, its wholly owned subsidiaries and the Consolidated Entity.
During 2018, we transferred all of our interest in a Limited Partnership (the Limited Partnership) to the ConsolidatedEntity, a variable interest entity (VIE) for which the Company is the primary beneficiary. The Limited Partnership wasaccounted for under the equity method. We account for the Consolidated Entity as an investment company that followsthe industry specialized basis of accounting established by U.S. GAAP.
All intercompany balances and transactions have been eliminated in consolidation.
RECLASSIFICATIONS
FINRA has reclassified certain amounts from the prior year to conform to the 2018 presentation. Specifically, amountspreviously classified as transparency services, dispute resolution or other revenues are now classified as user revenues inthe consolidated statements of operations and accompanying notes to the financial statements.
USE OF ESTIMATES
The preparation of these consolidated financial statements requires management to make estimates and assumptions,including estimates of fair value of investments, valuation of investments and assumptions related to our benefit plans,and the estimated service periods related to our recognition of certain revenue, that affect the amounts reported in theconsolidated financial statements and accompanying notes. Actual results could materially differ from those estimates.
CONSOLIDATION
FINRA consolidates any VIE in which it is deemed to be the primary beneficiary and reflects the assets, liabilities, revenues,expenses and cash flows of the consolidated VIE on the consolidated financial statements. An entity is determined to bethe primary beneficiary if it holds a controlling financial interest. A controlling financial interest is defined as (a) the powerto direct the activities of a VIE that most significantly impact the entity’s economic performance; and (b) the obligation toabsorb losses of the entity or the right to receive benefits from the entity that could potentially be significant to the VIE.The consolidation guidance requires an analysis to determine (a) whether an entity in which the Company holds a variableinterest is a VIE; and (b) whether the Company’s involvement, through holding interests directly or indirectly in the entityor contractually through other variable interests such as management and performance-based fees, would give it acontrolling financial interest. Performance of that analysis requires the exercise of judgment.
The Company determines whether it is the primary beneficiary of a VIE at the time it becomes involved with a VIE andreconsiders that conclusion at each reporting date. In evaluating whether the Company is the primary beneficiary, FINRA
34 FINRA 2018 Annual Financial Report
FINRA 2018 Notes to Consolidated Financial Statements
2. SUMMARY OF SIGNIFICANT ACCOUNTING POLICIES (CONTINUED)
evaluates its economic interests in the entity held either directly by the Company or indirectly through related parties. Theconsolidation analysis can generally be performed qualitatively; however, if it is not readily apparent that the Company isnot the primary beneficiary, a quantitative analysis may also be performed.
Investments and redemptions (either by the Company, affiliates of the Company or third parties) or amendments to thegoverning documents of a VIE could affect an entity’s status as a VIE or the determination of the primary beneficiary. At eachreporting date, the Company assesses whether it is the primary beneficiary and will consolidate or deconsolidate accordingly.
CASH AND CASH EQUIVALENTS
Cash and cash equivalents include demand cash, cash held in banks and all non-restricted, highly liquid investments withmaturities of 90 days or less when acquired.
Additionally, cash held at the Consolidated Entity may include overnight investments and money market funds held withfinancial institutions. As of December 31, 2018, the Consolidated Entity held no cash and cash equivalents in foreigncurrencies. Cash held at the Consolidated Entity represents cash that may only be used to settle obligations of theConsolidated Entity. Although not legally restricted, this cash is not available to fund the general liquidity needs of FINRA.
INVESTMENTS
Debt and Marketable Equity Securities
At the time of purchase, we classify individual debt and marketable equity securities as trading, available-for-sale orheld-to-maturity based on the type of security and our intent and ability to sell or to hold the securities. We havedesignated our investments in debt and marketable equity securities as either trading or available-for-sale. Tradingsecurities are carried at fair value, with changes in fair value recorded as a component of net realized and unrealizedinvestment (losses) gains in the consolidated statements of operations. We present cash flows from purchases and salesof trading securities as investing activities based on the nature and purpose for which the securities were acquired. Werecord available-for-sale securities at fair value and recognize temporary changes in fair value as unrealized (losses) gainsas a separate component of other comprehensive (loss) income.
Fair value is determined based on quoted market prices, when available, or on estimates provided by external pricingsources or dealers who make markets in such securities. Realized gains and losses on sales of securities are included inearnings using the average cost method. Investment receivables or payables relate to security trades and otherinvestment redemptions or purchases executed on or prior to the balance sheet date, but not yet settled, as we followtrade-date accounting.
Other Investments
Investments held in the Consolidated Entity include pooled investment vehicles without a readily determinable fair value.These investments are generally valued at the most recent net asset value per unit or capital account information fromthe general partners of such vehicles. Investment transactions are accounted for on a trade-date basis. For the purposes ofdetermining net realized gains and losses, the Consolidated Entity uses a specific identification methodology.
FINRA elected the fair value option for its investments in pooled investment funds to better reflect the value of theseinvestments. Such election is irrevocable and applied on a financial instrument by financial instrument basis at initialrecognition. These pooled investment funds calculate net asset value per share (or its equivalent) as the investmentaccount value in the absence of readily ascertainable market values to determine fair value. Interest and dividends arerecorded when reported to us.
FINRA 2018 Annual Financial Report 35
FINRA 2018 Notes to Consolidated Financial Statements
2. SUMMARY OF SIGNIFICANT ACCOUNTING POLICIES (CONTINUED)
During the time FINRA invested in a limited partnership, it was accounted for under the equity method. The application ofthe equity method to the limited partnership, including our related equity earnings (losses), retained the investmentcompany accounting applied by such a fund.
Other-Than-Temporary Impairment
FINRA periodically monitors and evaluates the realizability of its available-for-sale and equity method investments. Whenassessing realizability, including other-than-temporary declines in value, we consider such factors as intent to hold, theextent of the decline in value, the duration of unrealized losses, the potential for recovery in the near term and theprobability that we will sell an equity method investment at an amount different from the net asset value of ourownership interest. We also review the financial statements of our equity method investments for potential indicators ofimpairment. If events and circumstances indicate that a decline in the value of these assets has occurred and is deemedother-than-temporary, the carrying value of the investment is reduced to its fair value and the impairment is chargedto earnings.
RECEIVABLES, NET
The Company’s receivables are primarily concentrated with FINRA-registered firms, associated persons and exchanges. Theconsolidated financial statements present receivables net of an allowance for uncollectible accounts. As of December 31,2018 and 2017, an allowance for uncollectible accounts of $9.9 million and $11 million, respectively, was presented in theaccompanying consolidated balance sheets within receivables, net. We calculate the allowance based on the age, source ofthe underlying receivable and past collection experience. We maintain the allowance at a level that management believesto be sufficient to absorb estimated losses inherent in our accounts receivable portfolio. The allowance as of December 31,2018 and 2017, primarily related to fines and arbitration activities. The allowance is increased by the provision for baddebts, which is charged against operating results and decreased by the amount of charge-offs, net of recoveries. We basethe amount charged against operating results on several factors, including a periodic assessment of the collectibility ofeach account. In circumstances where a specific firm’s inability to meet its financial obligations is known (e.g., bankruptcyfilings), we record a specific provision for bad debts to reduce the receivable to the amount we reasonably believe willbe collected.
PROPERTY AND EQUIPMENT
FINRA records property and equipment at cost less accumulated depreciation. We expense repairs and maintenance costsas incurred. We calculate depreciation and amortization as follows:Asset category Depreciation/amortization method Estimated useful livesBuildings and improvements Straight-line 10 to 40 yearsData-processing equipment and software Straight-line 2 to 5 yearsFurniture and equipment Straight-line 5 to 10 years
Leasehold improvements Straight-lineShorter of term of lease or usefullife of improvement
Depreciation and amortization expense for property and equipment totaled $11.4 million and $11.8 million for 2018 and2017, respectively.
SOFTWARE COSTS
FINRA capitalizes internal use software development costs incurred during the application development stage. Softwarecosts incurred prior to or subsequent to the application development stage are charged to expense as incurred. We
36 FINRA 2018 Annual Financial Report
FINRA 2018 Notes to Consolidated Financial Statements
2. SUMMARY OF SIGNIFICANT ACCOUNTING POLICIES (CONTINUED)
capitalize significant purchased application software and operational software programs that are an integral part ofhardware, and amortize them using the straight-line method over their estimated useful life, generally three to five years.We expense all other purchased software as incurred.
Unamortized capitalized software development costs of $18 million as of December 31, 2018, were included in theconsolidated balance sheets within total property and equipment, net. There were $5.7 million and $5.5 million of netadditions to capitalized software related to 2018 and 2017. Amortization of capitalized internal use software costs totaled$2.6 million and $1.0 million related to 2018 and 2017 and was included in depreciation and amortization in theconsolidated statements of operations.
IMPAIRMENT OF LONG-LIVED ASSETS
We review our long-lived assets for impairment whenever facts and circumstances indicate that long-lived assets or otherassets may be impaired. If indicators are present, we perform an evaluation of recoverability that compares the estimatedfuture, undiscounted cash flows associated with the asset to the asset’s carrying amount. If the evaluation fails therecoverability test, we would then prepare a discounted cash flow analysis to estimate fair value and the amount of anyimpairment. In 2018 and 2017, there were no indicators of long-lived asset impairment, and no impairment chargeswere recognized.
DEFERRED REVENUE
Deferred revenue represents cash received for which we have not yet provided the related services. Included in deferredrevenue is the unearned portion of mediation fees, arbitration fees, registration fees and firm application fees. Werecognize revenue from the upfront initial components of these fees on a straight-line basis over estimatedservice periods.
The following chart reflects our estimated service periods and the basis for those estimated service periods for eachdeferred fee:Fee type Service period Estimation basisMediation fees 4 months Average duration of a mediation caseArbitration fees 14 months Average duration of an arbitration caseRegistration fees 4 years Average time individuals spend at a single firmFirm application fees 13 years Average lifespan for all member firms
The estimated service period for firm application fees, based on historical experience, is 13 years as of December 31, 2018,and 12 years as of December 31, 2017. The change in estimated service period represents a change in accounting estimatethat did not have a material effect on FINRA’s consolidated statements of operations.
DEPOSIT AND RENEWAL LIABILITIES
FINRA’s deposit and renewal liabilities primarily represent deposits into our Central Registration Depository (CRD®) system.FINRA-registered firms use these deposits to pay for services, including registration fees charged by states and other SROs.
REVENUE RECOGNITION AND COST OF REVENUE
Revenues are generally measured by an exchange of values and recognized when: (1) there is persuasive evidence of anarrangement; (2) services have been rendered and payment has been contractually earned; (3) the fee is fixed ordeterminable; and (4) collectability is reasonably assured.
FINRA 2018 Annual Financial Report 37
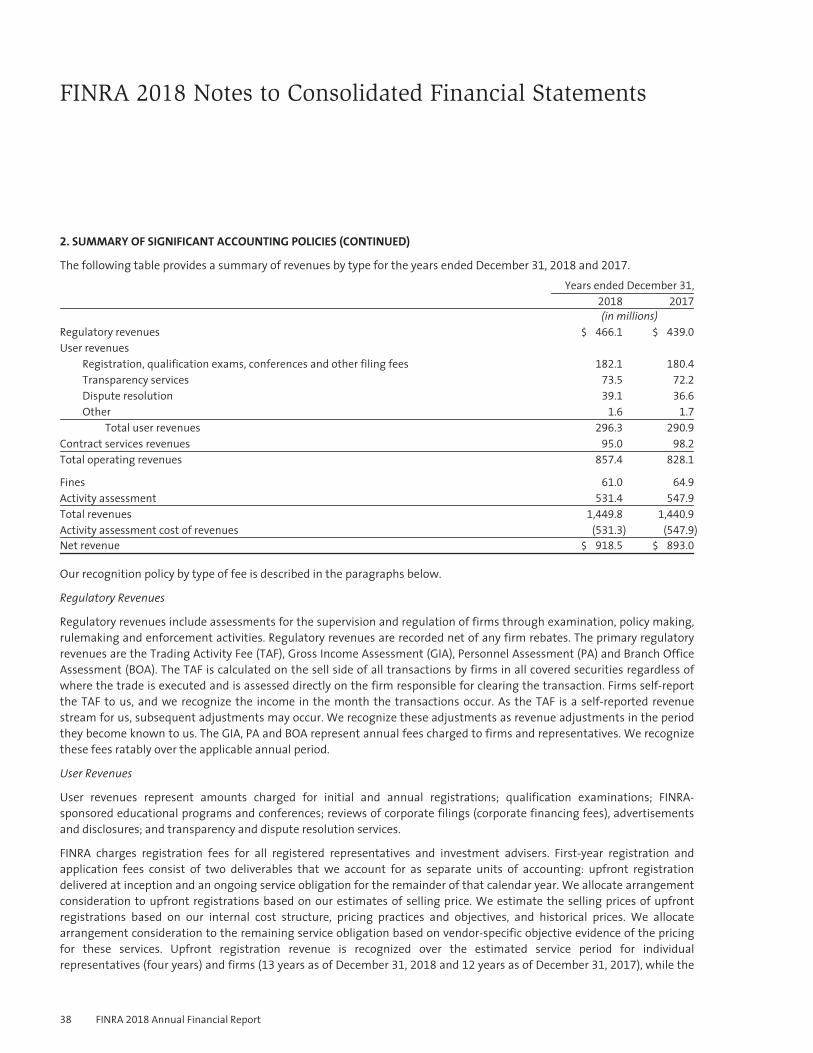
FINRA 2018 Notes to Consolidated Financial Statements
2. SUMMARY OF SIGNIFICANT ACCOUNTING POLICIES (CONTINUED)
The following table provides a summary of revenues by type for the years ended December 31, 2018 and 2017.Years ended December 31,
2018 2017
(in millions)Regulatory revenues $ 466.1 $ 439.0
User revenuesRegistration, qualification exams, conferences and other filing fees 182.1 180.4
Transparency services 73.5 72.2
Dispute resolution 39.1 36.6
Other 1.6 1.7
Total user revenues 296.3 290.9
Contract services revenues 95.0 98.2
Total operating revenues 857.4 828.1
Fines 61.0 64.9
Activity assessment 531.4 547.9
Total revenues 1,449.8 1,440.9
Activity assessment cost of revenues (531.3) (547.9)
Net revenue $ 918.5 $ 893.0
Our recognition policy by type of fee is described in the paragraphs below.
Regulatory Revenues
Regulatory revenues include assessments for the supervision and regulation of firms through examination, policy making,rulemaking and enforcement activities. Regulatory revenues are recorded net of any firm rebates. The primary regulatoryrevenues are the Trading Activity Fee (TAF), Gross Income Assessment (GIA), Personnel Assessment (PA) and Branch OfficeAssessment (BOA). The TAF is calculated on the sell side of all transactions by firms in all covered securities regardless ofwhere the trade is executed and is assessed directly on the firm responsible for clearing the transaction. Firms self-reportthe TAF to us, and we recognize the income in the month the transactions occur. As the TAF is a self-reported revenuestream for us, subsequent adjustments may occur. We recognize these adjustments as revenue adjustments in the periodthey become known to us. The GIA, PA and BOA represent annual fees charged to firms and representatives. We recognizethese fees ratably over the applicable annual period.
User Revenues
User revenues represent amounts charged for initial and annual registrations; qualification examinations; FINRA-sponsored educational programs and conferences; reviews of corporate filings (corporate financing fees), advertisementsand disclosures; and transparency and dispute resolution services.
FINRA charges registration fees for all registered representatives and investment advisers. First-year registration andapplication fees consist of two deliverables that we account for as separate units of accounting: upfront registrationdelivered at inception and an ongoing service obligation for the remainder of that calendar year. We allocate arrangementconsideration to upfront registrations based on our estimates of selling price. We estimate the selling prices of upfrontregistrations based on our internal cost structure, pricing practices and objectives, and historical prices. We allocatearrangement consideration to the remaining service obligation based on vendor-specific objective evidence of the pricingfor these services. Upfront registration revenue is recognized over the estimated service period for individualrepresentatives (four years) and firms (13 years as of December 31, 2018 and 12 years as of December 31, 2017), while the
38 FINRA 2018 Annual Financial Report
FINRA 2018 Notes to Consolidated Financial Statements
2. SUMMARY OF SIGNIFICANT ACCOUNTING POLICIES (CONTINUED)
remaining service obligation revenue is recognized ratably over the related remaining annual period. While the pricingmodel currently in use captures all critical variables, unforeseen changes due to external market forces may result in therevision to some of our inputs. These modifications may result in the allocation of consideration in future periods thatdiffers from the allocation presently in use. Absent a significant change in the pricing inputs, future changes in the pricingmodel are not expected to materially impact our allocation of arrangement consideration.
Qualification fees consist of examination and continuing education fees. We recognize qualification fees as we administerexaminations or continuing education programs. FINRA-sponsored meeting and conference fees include fees paid byfinancial services industry participants for participating in our educational programs. We recognize these fees when theprogram or conference takes place. Advertising fees are charged for our review of firms’ communications to ensure thatthey are fair, balanced and not misleading. We recognize advertising fees as revenue when our review is complete.Corporate financing fees are charged for our review of proposed public offerings. We recognize corporate financing feeswhen our review is completed. FINRA requires the timely disclosure of regulatory actions, liens and judgments, amongother things, and charges a fee to review the disclosures to determine whether an applicant is subject to a statutorydisqualification or whether the applicant may present a regulatory risk for the firm and customers. FINRA recognizes thesedisclosure review fees when our review is complete.
Transparency services revenues represent amounts charged for the use of TRACE, our fixed income market real-time pricereporting and dissemination service, as well as the ORF service for the reporting of trades and comparison in certain OTCequity securities. TRACE fees include market data fees, as well as fees charged on secondary market transactions in eligiblefixed income securities reported to us. The OTCBB is a regulated quotation service in which fees are charged for a variety ofservices related to the display of real-time quotes in OTC equity securities that are eligible for quotation on the OTCBB. Inaddition, fees are earned for the sale of market data from the OTCBB and the ORF. We recognize transparency servicesrevenues as the transactions occur or when the market data is sold.
FINRA earns fees during the arbitration and mediation processes. Certain arbitration fees, such as initial, counterclaim,cross-claim and other filing fees, and surcharge fees, relate to the entire period covered by an arbitration case, and arerecognized as revenue over the average duration of an arbitration case (14 months). Mediation filing fees are recognizedover the average duration of a mediation case (four months). All other arbitration- and mediation-related fees, such aspre-hearing and hearing processing fees, adjournment fees, hearing session fees and mediation session fees, which areevent-driven, are recognized as the service is provided.
Contract Services Revenues
Contract services revenues represent amounts charged for regulatory services provided primarily to the NYSE markets, theNasdaq markets, the Cboe markets and other exchanges, as well as the TRFs, for services including surveillance reviews,investigations, examinations and the disciplinary process. Contract services revenues also include fees for the mortgagelicensing system FINRA developed and deployed to SRR. We recognize contract services revenues as the services areprovided according to the terms and timeframes associated with each individual contract.
Fines
Fines represent sanctions for rule violations. FINRA recognizes fine revenue upon issuance of a written consent ordisciplinary decision. We do not view fines as part of our operating revenues. FINRA limits the use of fine monies to capitalexpenditures and regulatory and other projects reported to and approved by our Finance, Operations and TechnologyCommittee or Board of Governors (Board).
FINRA 2018 Annual Financial Report 39
FINRA 2018 Notes to Consolidated Financial Statements
2. SUMMARY OF SIGNIFICANT ACCOUNTING POLICIES (CONTINUED)
Activity Assessment Revenues and Cost of Revenues
FINRA, as an SRO, pays certain fees and assessments to the SEC pursuant to Section 31 of the Securities Exchange Act of 1934.These fees are designed to recover costs incurred by the government for the supervision and regulation of securities marketsand securities professionals, and are calculated based on the aggregate dollar amount of sales of covered securities transactedby or through any firm other than on a national securities exchange. Such covered transactions are reported to us through theTRFs and ORF. We remit these SEC fees to the U.S. Treasury semiannually, in March and September.
We recover the cost of the Section 31 fees and assessments through an activity assessment, charged to thefirm responsible for clearing the transaction, based on the aggregate dollar amount of sales of coveredsecurities transacted by or through any firm other than on a national securities exchange. The assessments billed tosecurities firms are recognized when the transactions are reported. As of December 31, 2018 and 2017, we had$36.0 million and $50.3 million, respectively, of SEC fee receivables presented in the accompanying consolidated balancesheets within receivables, net. FINRA, as the primary obligor to the SEC, reports the activity assessment on a gross basiswithin revenues. Amounts due to the SEC are reported as a cost of revenue. We report amounts pending remittance to theSEC in SEC fee payable in the accompanying consolidated balance sheets.
Activity assessment revenues and cost of revenues are driven by third-party providers and securities firms reportingactivity in a complete, accurate and timely manner. As a result, subsequent adjustments may occur. We recognize anyresulting activity assessment adjustments in the period they become known to us.
Interest and Dividend Income
FINRA recognizes interest income from cash, trading investments and available-for-sale investments as it is earned.Dividend income is recognized on the ex-dividend date. Interest and dividend income from the Consolidated Entity isaccounted for in the same manner.
CLOUD COMPUTING COSTS
We account for our cloud computing arrangement as a service contract and expense applicable costs as incurred. As ourhosting arrangement does not give us the contractual right to the software at any time during the hosting period withoutpenalty, we are not deemed to have a software license. Cloud computing costs totaled $19.9 million and $18.8 million forthe years ended December 31, 2018 and 2017, respectively, and were included in computer operations and datacommunications in the consolidated statements of operations.
PENSION AND OTHER POSTRETIREMENT LIABILITIES
FINRA provides two non-contributory defined benefit pension plans for the benefit of eligible employees. Thenon-contributory defined benefit plans consist of a qualified Employees Retirement Plan (ERP) and a non-qualifiedSupplemental Executive Retirement Plan (SERP). Both plans are now closed to new participants. We also offer access toretiree medical coverage for eligible retirees and their dependents. Eligible retirees pay the full premium cost to beenrolled in the Company’s retiree medical coverage. Additionally, we provide a Retiree Medical Savings Plan to help ourretirees offset health care premiums during retirement. Under the Retiree Medical Savings Plan, employer-funded definedcontribution Retiree Medical Accounts are created for eligible employees and fixed annual credits are applied to thoseaccounts for each year of FINRA service beginning at age 40.
In calculating the expense and liability related to all of the abovementioned plans, we use several statistical and otherfactors, which attempt to anticipate future events. Key factors include assumptions about the expected rates of return onplan assets and the discount rate as determined by FINRA, within certain guidelines, as well as assumptions regarding
40 FINRA 2018 Annual Financial Report
FINRA 2018 Notes to Consolidated Financial Statements
2. SUMMARY OF SIGNIFICANT ACCOUNTING POLICIES (CONTINUED)
future salary increases, mortality, turnover, retirement ages and the medical expense trend rate. We consider marketconditions, including changes in investment returns and interest rates, in making these assumptions. The discount rateused in the calculations is developed using a composite yield curve analysis based on a portfolio of high-quality,non-callable, marketable bonds. We determine the long-term rate of return based on analysis of historical and projectedreturns as prepared by our actuary and external investment consultant. FINRA’s Pension/401(k) Plan Committee (thePension Committee) reviews and advises FINRA management on both the expected long-term rate of return and thediscount rate assumptions. Amortization of net gain or loss included in accumulated other comprehensive income (loss)reflects a corridor based on 10 percent of the greater of the projected benefit obligation or the market-related value ofplan assets as of the beginning of the plan year, and is included as a component of net periodic pension cost.
The actuarial assumptions that we use in determining pension and other postretirement liabilities and expenses maydiffer materially from actual results due to changing market and economic conditions, as well as early withdrawals byterminating plan participants. While we believe that the assumptions used are appropriate, differences in actualexperience or changes in assumptions related to the ERP may materially affect our financial position. A 25 basis-pointincrease (decrease) in the discount rate assumption as of December 31, 2018, would cause the ERP projected benefitobligation to decrease (increase) by approximately $18.5 million.
INCOME TAXES
FINRA and FINRA REG are tax-exempt organizations under Internal Revenue Code (IRC) Section 501(c)(6). The Foundation isa tax-exempt organization under IRC Section 501(c)(4). However, unrelated business income activities are taxed at normalcorporate rates to the extent that they result in taxable net income. We determine deferred tax assets and liabilities basedon differences between the financial statement carrying amounts and the tax basis of existing assets and liabilities(i.e., temporary differences). We measure these assets and liabilities at the enacted rates that we expect will be in effectwhen we will realize these differences. We also determine deferred tax assets based on the amount of net operating losscarryforwards. If necessary, we establish a valuation allowance to reduce deferred tax assets to the amount that is morelikely than not to be realized.
The Consolidated Entity has elected to be taxed as a Partnership for U.S. federal tax purposes. FINRA is responsible forreporting income or loss from the Consolidated Entity, to the extent required by the federal and state income tax laws, forincome tax purposes.
CONCENTRATION OF CREDIT RISK
Financial instruments that potentially subject us to concentrations of credit risk consist of cash and cash equivalents,trading investments, other investments and accounts receivable. We do not require collateral on thesefinancial instruments.
We maintain cash and cash equivalents in excess of federally insured limits, principally with financial institutions locatedin the U.S. Risk on accounts receivable is reduced by the number of entities comprising our member firm base and throughongoing evaluation of collectability of amounts owed to us. We use outside investment managers to manage ourinvestment portfolio and a custody agent, a publicly traded company headquartered in New York, to hold ourtrading securities.
We maintain a broadly diversified investment portfolio, representing a wide range of assets and asset classes, in order toattain acceptable levels of risk and return. FINRA’s investment portfolio consists of investments in predominantlyinvestment grade debt securities, mutual and commingled funds containing equity securities and other investments. TheFoundation’s investment portfolio consists of commingled funds and a pooled investment fund.
FINRA 2018 Annual Financial Report 41
FINRA 2018 Notes to Consolidated Financial Statements
2. SUMMARY OF SIGNIFICANT ACCOUNTING POLICIES (CONTINUED)
The Company attempts to minimize credit risk by monitoring the creditworthiness of the financial institutions with whichit transacts business.
As of December 31, 2018, substantially all of the Consolidated Entity’s cash, investments in securities and amounts duefrom brokers are positions with and amounts due from its clearing brokers. Risks with respect to the Consolidated Entityinclude market risk as a result of changes in the market or fair value of a particular financial instrument, and credit riskfrom the potential loss should the counterparties fail to perform pursuant to the terms of their obligations. TheConsolidated Entity minimizes these risks by carrying out investment transactions through established and reputableinstitutions.
RECENT ACCOUNTING PRONOUNCEMENTS
In May 2014, the Financial Accounting Standards Board (FASB) issued Accounting Standards Update (ASU) 2014-09,Revenue from Contracts with Customers (Topic 606). The ASU provides that a company recognize revenue when it transferspromised goods or services to customers in an amount that reflects the consideration to which the company expects to beentitled in exchange for those goods or services. Accordingly, companies will need to use more judgment and make moreestimates, which may include identifying performance obligations in the contract, estimating the amount of variableconsideration to include in the transaction price and allocating the transaction price to each separate performanceobligation. In August 2015, the FASB issued ASU 2015-14, Revenue from Contracts with Customers (Topic 606): Deferral ofthe Effective Date, which deferred the effective date of the new standard by one year. In 2016 and 2017, the FASBcontinued to issue various technical improvements through various ASUs, including principal versus agent considerations,identifying performance obligations and licensing. FINRA adopted this ASU on January 1, 2019. As a result of adopting theASU, on January 1, 2019, we expect to recognize a cumulative increase to equity of approximately $20 million, whichrepresents the release of previously deferred initial fees that no longer qualify for deferral under the ASU.
In January 2016, the FASB issued ASU 2016-01, Financial Instruments—Overall (Subtopic 825-10): Recognition andMeasurement of Financial Assets and Financial Liabilities. The ASU eliminates the available-for-sale classification of equityinvestments and requires entities to measure equity investments that do not result in consolidation and are notaccounted for under the equity method at fair value and recognize any changes in fair value in net income. The ASU shouldbe applied by means of a cumulative-effect adjustment to the balance sheet as of the beginning of the fiscal year ofadoption. FINRA adopted this ASU on January 1, 2019, and accordingly, all of our equity investments previously classifiedas available-for-sale investments will be measured at fair value with changes in fair value recognized in net income for2019. The adoption of this ASU is not expected to have a material impact on our consolidated financial statements.
In August 2016, the FASB issued ASU 2016-15, Statement of Cash Flows (Topic 230): Classification of Certain Cash Receiptsand Cash Payments, which clarifies how entities should classify certain cash receipts, such as distributions received fromequity method investees, and cash payments on the statement of cash flows. The ASU must be applied retrospectively toall periods presented but may be applied prospectively from the earliest date practicable if retrospective application wouldbe impracticable. FINRA adopted this ASU on January 1, 2019, and it is not expected to have a material impact on ourconsolidated financial statements.
In February 2016, the FASB issued ASU 2016-02, Leases. The ASU requires lessees to put most leases on their balancesheets but recognize expenses on their statements of operations in a manner similar to today’s accounting. The ASU alsoeliminates today’s real estate-specific provisions for all entities. For lessors, the ASU modifies the classification criteria andthe accounting for sales-type and direct financing leases. The ASU is effective for FINRA on January 1, 2020. Early adoptionis permitted; however, we do not intend to early adopt the ASU. We are currently completing a diagnostic assessment ofthe ASU based on our current inventory of leases. We are planning to elect the additional transition option, which allows
42 FINRA 2018 Annual Financial Report
FINRA 2018 Notes to Consolidated Financial Statements
2. SUMMARY OF SIGNIFICANT ACCOUNTING POLICIES (CONTINUED)
entities to not apply the new leases standard in the comparative period they present in their financial statements in theyear of adoption. We are currently assessing the impact that the ASU will have on our consolidated financial statements.
In July 2016, the FASB issued the final guidance on credit losses, ASU 2016-13, Financial Instruments—Credit Losses(Topic 326): Measurement of Credit Losses on Financial Instruments, which will significantly change how entities willmeasure credit losses for most financial assets and certain other instruments that are not measured at fair value throughnet income. Entities will be required to use a new forward-looking “expected loss” model and record an allowance that,when deducted from the amortized cost basis of the financial asset, presents the net amount expected to be collected onthe financial asset. This approach will apply to most financial assets measured at amortized cost and certain otherinstruments, including trade and other receivables, loans, held-to-maturity debt securities, net investments in leases andoff-balance-sheet credit exposures. The ASU will also require significantly more disclosures to be made in an entity’sfinancial statements. In November 2018, the FASB issued ASU 2018-19, Codification Improvements to Topic 326, FinancialInstruments—Credit Losses, which aligned the implementation date for nonpublic entities’ annual financial statementswith the implementation date for their interim financial statements and thereby deferring the initial effective date by oneyear. As a result of ASU 2018-19, FINRA plans to adopt the new credit loss guidance on January 1, 2022. Early adoption ispermitted; however, we do not intend to early adopt the ASU. We are currently assessing the potential impact that theASU will have on our consolidated financial statements.
The following accounting pronouncements were also recently issued:
Ô ASU No. 2018-14, Compensation—Retirement Benefits—Defined Benefit Plans—General (Subtopic 715-20):Disclosure Framework—Changes to the Disclosure Requirements for Defined Benefit Plans; effective for FINRA in2021;
Ô ASU No. 2018-13, Fair Value Measurement (Topic 820): Disclosure Framework—Changes to the DisclosureRequirements for Fair Value Measurement; effective for FINRA in 2020;
Ô ASU No. 2016-16, Income Taxes (Topic 710): Intra-Entity Transfers of Assets Other Than Inventory; effective forFINRA in 2019;
Ô ASU No. 2017-06, Plan Accounting: Defined Benefit Pension Plans (Topic 960), Defined Contribution PensionPlans (Topic 962), Health and Welfare Benefit Plans (Topic 965): Employee Benefit Plan Master Trust Reporting (aconsensus of the Emerging Issues Task Force), effective for FINRA in 2019; and
Ô ASU No. 2017-07, Compensation—Retirement Benefits (Topic 715): Improving the Presentation of Net PeriodicPension Cost and Net Periodic Postretirement Benefit Cost, effective for FINRA in 2019.
We have assessed these pronouncements and determined that they do not have any material impact on our consolidatedresults of operations or financial position, and they will be adopted as of their future effective date.
The following accounting pronouncements have been adopted by FINRA with no material effect on our consolidatedfinancial statements:
Ô ASU No. 2015-02, Consolidations (Topic 810): Amendments to the Consolidation Analysis, effective for FINRA in2017;
Ô ASU No. 2015-07, Fair Value Measurement (Topic 820): Disclosures for Investments in Certain Entities ThatCalculate Net Asset Value per Share (or Its Equivalent)—a consensus of the FASB Emerging Issues Task Force;effective in 2017, but early adopted in 2015; and
Ô ASU No. 2015-17, Income Taxes (Topic 740): Balance Sheet Classification of Deferred Taxes; effective in 2018,but early adopted in 2015.
FINRA 2018 Annual Financial Report 43
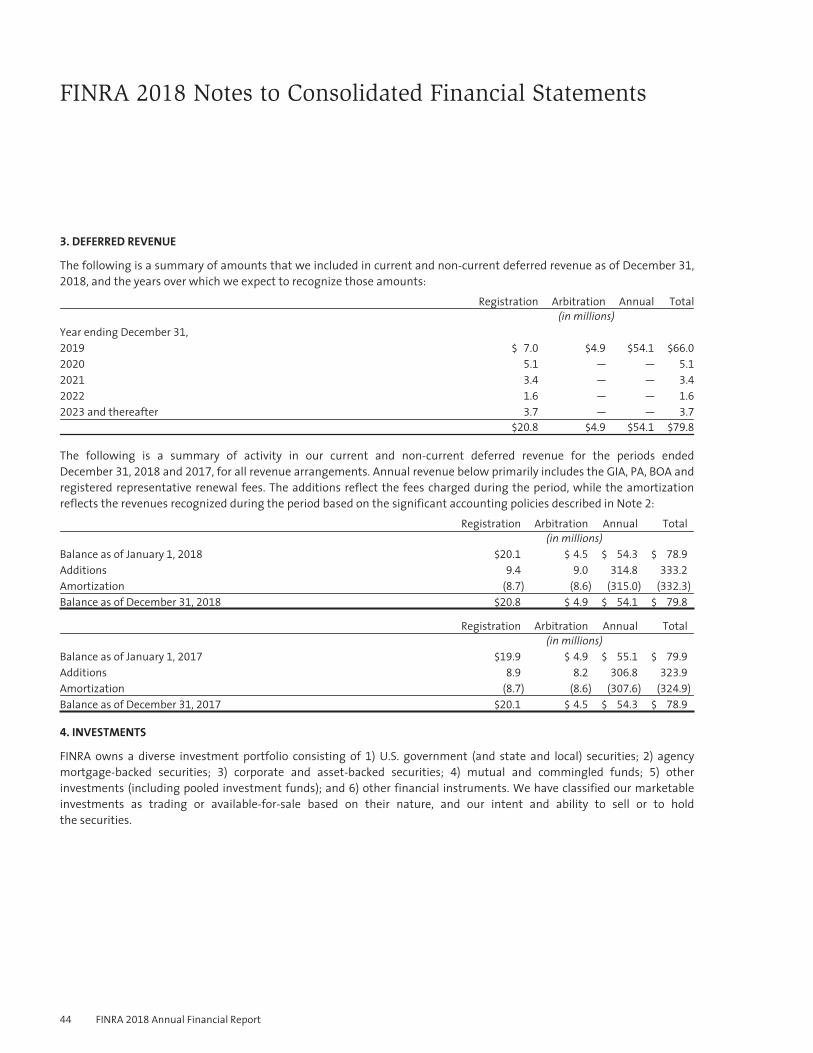
FINRA 2018 Notes to Consolidated Financial Statements
3. DEFERRED REVENUE
The following is a summary of amounts that we included in current and non-current deferred revenue as of December 31,2018, and the years over which we expect to recognize those amounts:
Registration Arbitration Annual Total(in millions)
Year ending December 31,2019 $ 7.0 $4.9 $54.1 $66.0
2020 5.1 — — 5.1
2021 3.4 — — 3.4
2022 1.6 — — 1.6
2023 and thereafter 3.7 — — 3.7
$20.8 $4.9 $54.1 $79.8
The following is a summary of activity in our current and non-current deferred revenue for the periods endedDecember 31, 2018 and 2017, for all revenue arrangements. Annual revenue below primarily includes the GIA, PA, BOA andregistered representative renewal fees. The additions reflect the fees charged during the period, while the amortizationreflects the revenues recognized during the period based on the significant accounting policies described in Note 2:
Registration Arbitration Annual Total(in millions)
Balance as of January 1, 2018 $20.1 $ 4.5 $ 54.3 $ 78.9
Additions 9.4 9.0 314.8 333.2
Amortization (8.7) (8.6) (315.0) (332.3)
Balance as of December 31, 2018 $20.8 $ 4.9 $ 54.1 $ 79.8
Registration Arbitration Annual Total(in millions)
Balance as of January 1, 2017 $19.9 $ 4.9 $ 55.1 $ 79.9
Additions 8.9 8.2 306.8 323.9
Amortization (8.7) (8.6) (307.6) (324.9)
Balance as of December 31, 2017 $20.1 $ 4.5 $ 54.3 $ 78.9
4. INVESTMENTS
FINRA owns a diverse investment portfolio consisting of 1) U.S. government (and state and local) securities; 2) agencymortgage-backed securities; 3) corporate and asset-backed securities; 4) mutual and commingled funds; 5) otherinvestments (including pooled investment funds); and 6) other financial instruments. We have classified our marketableinvestments as trading or available-for-sale based on their nature, and our intent and ability to sell or to holdthe securities.
44 FINRA 2018 Annual Financial Report
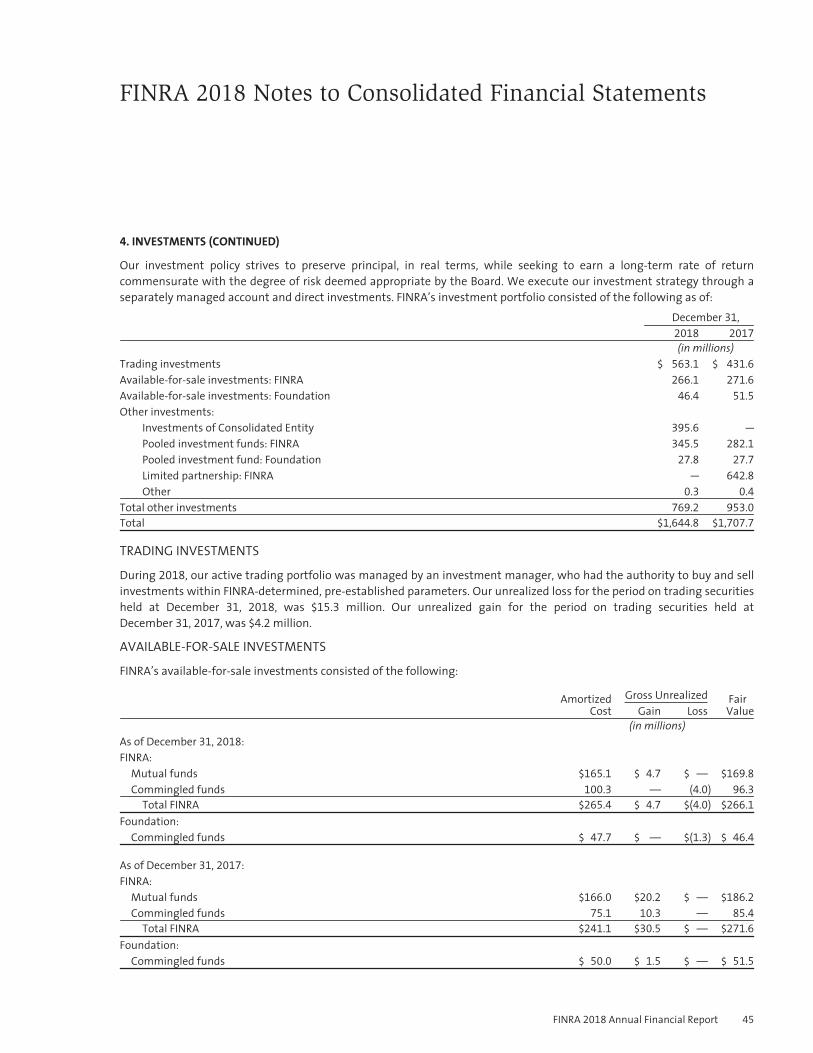
FINRA 2018 Notes to Consolidated Financial Statements
4. INVESTMENTS (CONTINUED)
Our investment policy strives to preserve principal, in real terms, while seeking to earn a long-term rate of returncommensurate with the degree of risk deemed appropriate by the Board. We execute our investment strategy through aseparately managed account and direct investments. FINRA’s investment portfolio consisted of the following as of:
December 31,2018 2017
(in millions)Trading investments $ 563.1 $ 431.6
Available-for-sale investments: FINRA 266.1 271.6
Available-for-sale investments: Foundation 46.4 51.5
Other investments:Investments of Consolidated Entity 395.6 —
Pooled investment funds: FINRAPooled investment fund: Foundation
345.5
27.8
282.1
27.7
Limited partnership: FINRA — 642.8
Other 0.3 0.4
Total other investments 769.2 953.0
Total $1,644.8 $1,707.7
TRADING INVESTMENTS
During 2018, our active trading portfolio was managed by an investment manager, who had the authority to buy and sellinvestments within FINRA-determined, pre-established parameters. Our unrealized loss for the period on trading securitiesheld at December 31, 2018, was $15.3 million. Our unrealized gain for the period on trading securities held atDecember 31, 2017, was $4.2 million.
AVAILABLE-FOR-SALE INVESTMENTS
FINRA’s available-for-sale investments consisted of the following:
AmortizedCost
Gross Unrealized FairValueGain Loss
(in millions)As of December 31, 2018:FINRA:
Mutual funds $165.1 $ 4.7 $ — $169.8
Commingled funds 100.3 — (4.0) 96.3
Total FINRA $265.4 $ 4.7 $(4.0) $266.1
Foundation:Commingled funds $ 47.7 $ — $(1.3) $ 46.4
As of December 31, 2017:FINRA:
Mutual funds $166.0 $20.2 $ — $186.2
Commingled funds 75.1 10.3 — 85.4
Total FINRA $241.1 $30.5 $ — $271.6
Foundation:Commingled funds $ 50.0 $ 1.5 $ — $ 51.5
FINRA 2018 Annual Financial Report 45
FINRA 2018 Notes to Consolidated Financial Statements
4. INVESTMENTS (CONTINUED)
For 2018 and 2017, gross investment gains recognized from our investments in mutual and commingled funds, includingamounts reclassified from unrealized gains and losses in accumulated other comprehensive income (loss), were as follows:
2018 2017
(in millions)Gross investment gains recognized $1.9 $9.1
Amounts reclassified from accumulated other comprehensive income (loss) 1.9 1.2
For 2018 and 2017, there were no gross investment losses recognized from our investments in mutual and commingledfunds.
Other-Than-Temporary Declines in Fair Value
In 2018 and 2017, we did not record any impairment charges related to our mutual and commingled funds. As ofDecember 31, 2018 and 2017, we did not identify any events or circumstances that would indicate the value of our mutualand commingled funds should be impaired. Should there be any impairment charges related to other-than-temporarydeclines in the fair value of available-for-sale investments, they would be reflected in net realized and unrealizedinvestment (losses) gains in the consolidated statements of operations.
Temporary Declines in Fair Value
As of December 31, 2018, FINRA had two commingled investments that have been in a continuous unrealized loss positionfor less than 12 months with a fair value of $96.3 million, reflecting unrealized losses of $4 million. As of December 31,
2017, FINRA had no available-for-sale investments with aggregate unrealized losses. As of December 31, 2018, theFoundation had two commingled investments that have been in a continuous unrealized loss position for less than 12
months with a fair value of $46.4 million, reflecting unrealized losses of $1.3 million. As of December 31, 2017, theFoundation had no available-for-sale investments with aggregate unrealized losses.
OTHER INVESTMENTS
In 2018, our other investments consist of investments of the Consolidated Entity and pooled investment funds for whichthe fair value option has been elected. In 2017, our other investments consisted of an investment in one limitedpartnership accounted for under the equity method and pooled investment funds for which the fair value option hasbeen elected.
46 FINRA 2018 Annual Financial Report
FINRA 2018 Notes to Consolidated Financial Statements
4. INVESTMENTS (CONTINUED)
Consolidated Entity, Investments of the Consolidated Entity and Limited Partnership
On July 1, 2018, FINRA transferred all of its interest from the Limited Partnership to the Consolidated Entity. FINRA’s pro-ratashare of the Limited Partnership’s cash and underlying investments were transferred in-kind at fair value to the ConsolidatedEntity, which represented our equity interest on July 1, 2018. No gain or loss was recognized. The objective of theConsolidated Entity is to maximize risk-adjusted returns over the long-term horizon through potential investment in a widearray of investments and strategies. As of December 31, 2018, FINRA holds a 100 percent equity interest in the ConsolidatedEntity, and the general partner of the Consolidated Entity is fully independent of FINRA management and its Board. Thefollowing table summarizes 2018 and 2017 activity related to the Limited Partnership and the Consolidated Entity.
LimitedPartnership
ConsolidatedEntity
(in millions)Balance, January 1, 2017 $ 692.6 $ —
Equity earnings 81.9 —
Redemptions (131.7) —
Balance, December 31, 2017 642.8 —
Equity earnings 12.0 —
Redemptions (156.0) —
Transfer of interest on July 1, 2018 (498.8) 498.8
Investment losses — (16.0)
Redemptions — (156.0)
Balance, December 31, 2018 $ — $ 326.8
As of December 31, 2018, the carrying value of the net assets and liabilities of the Consolidated Entity were $326.8 million,which represented its maximum risk of loss as of that date. The assets of the Consolidated Entity primarily consisted ofcash and investments, while the liabilities primarily represented accrued expenses of the Consolidated Entity. The assetsof the Consolidated Entity may be used only to settle obligations of the Consolidated Entity. In addition, there is norecourse to the Company for the Consolidated Entity’s liabilities.
FINRA 2018 Annual Financial Report 47
FINRA 2018 Notes to Consolidated Financial Statements
4. INVESTMENTS (CONTINUED)
Investments held by the Consolidated Entity, summarized below, primarily consist of limited partnerships managed by theinvestment manager of the Consolidated Entity, as well as hedge funds, private equity funds or similar investmentvehicles managed by external managers directly or through subsidiary funds that are controlled by the investmentmanager of the Consolidated Entity. These investments are included in other investments in the accompanyingconsolidated balance sheets. The Consolidated Entity’s net assets consist primarily of its investments accounted for at fairvalue; the majority of the Consolidated Entity’s fair value measurements are based on the estimates made by the generalpartner of the Consolidated Entity. The investment strategy of these limited partnerships is multi-strategy.
Fair value as ofDecember 31, 2018
Fair value as apercentage of
investments ofConsolidated Entity as of
December 31, 2018
(in millions)Investments of Consolidated EntityNorth America
HighVista Master Fund Limited Partnership $137.2 34.7%HVS Clarendon I Limited Partnership 81.3 20.5%
Other 177.1 44.8%
Total investments (1) (cost $410.4 million) $395.6 100.0%
(1) Total investments included the amount liquidated on January 1, 2019 in order to satisfy the $78 million redemption requesteffective December 31, 2018. The redemption transaction that was recorded by FINRA and the Consolidated Entity as aredemption receivable and payable, respectively, has been eliminated upon consolidation.
As of December 31, 2018, no underlying investment held by these limited partnerships had a fair value that exceeded 5%of FINRA’s total consolidated equity.
Realized and unrealized gains and losses on the Consolidated Entity’s investments were included in net realized andunrealized investment (losses) gains in the consolidated statement of operations. Unrealized gains or losses result fromchanges in the fair value of these investments. Upon disposition of an investment, unrealized gains or losses are reversedand an offsetting realized gain or loss is recognized in the current period. As of December 31, 2018, the net change inunrealized depreciation on the Consolidated Entity’s investments held was $14.8 million, and net realized gains from thedisposition of investments were $1.2 million.
As of December 31, 2017, the Limited Partnership investment represented a variable interest in an investment limitedpartnership, whose general partner was fully independent of FINRA management and its Board. The purpose of theLimited Partnership was to maximize risk-adjusted returns over the long term by investing in a highly diversified assetallocation strategy. The nature of the Limited Partnership included investments in equity, fixed income, real assets andalternative investments. As of December 31, 2017, the maximum exposure to loss related to the Limited Partnership waslimited to $642.8 million, the carrying amount of the investment, due to the legal structure and design of this partnership.We did not have outstanding capital commitments, guarantees or any other liquidity arrangements with this partnership.Our ownership interest in this partnership was 69.7 percent at December 31, 2017.
The Limited Partnership investment was included in other investments in the consolidated balance sheets as ofDecember 31, 2017. The gains, including those earned prior to the aforementioned transfer in 2018, were included inequity method earnings from other investments in the consolidated statements of operations.
We did not recognize any impairment charges on our equity method investments for the years ended December 31, 2018
and 2017.
48 FINRA 2018 Annual Financial Report
FINRA 2018 Notes to Consolidated Financial Statements
4. INVESTMENTS (CONTINUED)
Pooled Investment Funds
FINRA and the Foundation invest in pooled investment funds for which the fair value option was elected. The followingtable summarizes the activity related to the pooled investment funds for both FINRA and the Foundation as ofDecember 31, 2018 and 2017.
Pooledinvestment
funds:FINRA
Pooledinvestment
funds:Foundation Total
(in millions)Balance, January 1, 2017 $ — $ — $ —Purchases 270.0 27.9 297.9
Net gains (losses) from changes in fair value 12.1 (0.2) 11.9
Balance, December 31, 2017 282.1 27.7 $309.8
Purchases 100.0 — 100.0
Net (losses) gains from changes in fair value (36.6) 0.1 (36.5)
Balance, December 31, 2018 $345.5 $27.8 $373.3
The aggregate carrying amounts of these investments were included in other investments in the consolidated balancesheets. Net gains (losses) from changes in fair value on these investments were included in net realized and unrealized(losses) gains in the consolidated statements of operations. No interest and dividends were recorded.
5. FAIR VALUE MEASUREMENT
The Company considers cash and cash equivalents, trading and available-for-sale investments, receivables, investmentsreceivable and investments payable to be its financial instruments. The carrying amounts reported in the consolidatedbalance sheets for these financial instruments equal or closely approximate fair value.
U.S. GAAP defines fair value as the price that would be received upon the sale of an asset or paid to transfer a liability in anorderly transaction between market participants as of the measurement date (i.e., an exit price).
U.S. GAAP prioritizes the level of market price observability used in measuring assets and liabilities at fair value. There are anumber of factors that impact market price observability, including the type of assets and liabilities, and the specificcharacteristics of the assets and liabilities. Assets and liabilities with prices that are readily available, actively quoted or forwhich fair value can be measured from actively quoted prices generally will have a higher degree of market priceobservability and less degree of judgment used in measuring fair value.
Assets and liabilities measured at fair value are classified into one of the following categories:
Level 1 Quoted prices (unadjusted) in active markets for identical assets or liabilities that the entity has the abilityto access as of the measurement date.
Level 2 Inputs other than quoted prices included within Level 1 that are observable for the asset or liability, eitherdirectly or indirectly, through corroboration with observable data.
Level 3 Unobservable inputs, such as internally developed pricing models for the asset or liability due to little or nomarket activity for the asset or liability.
In certain cases, the inputs used to measure fair value may fall into different levels of the fair value hierarchy. In suchcases, an asset or liability’s level within the fair value hierarchy is based on the lowest level input that is significant to thefair value measurement. The assessment of significance of a particular input to the fair value measurement in its entiretyrequires judgment and factors specific to the asset or liability.
FINRA 2018 Annual Financial Report 49
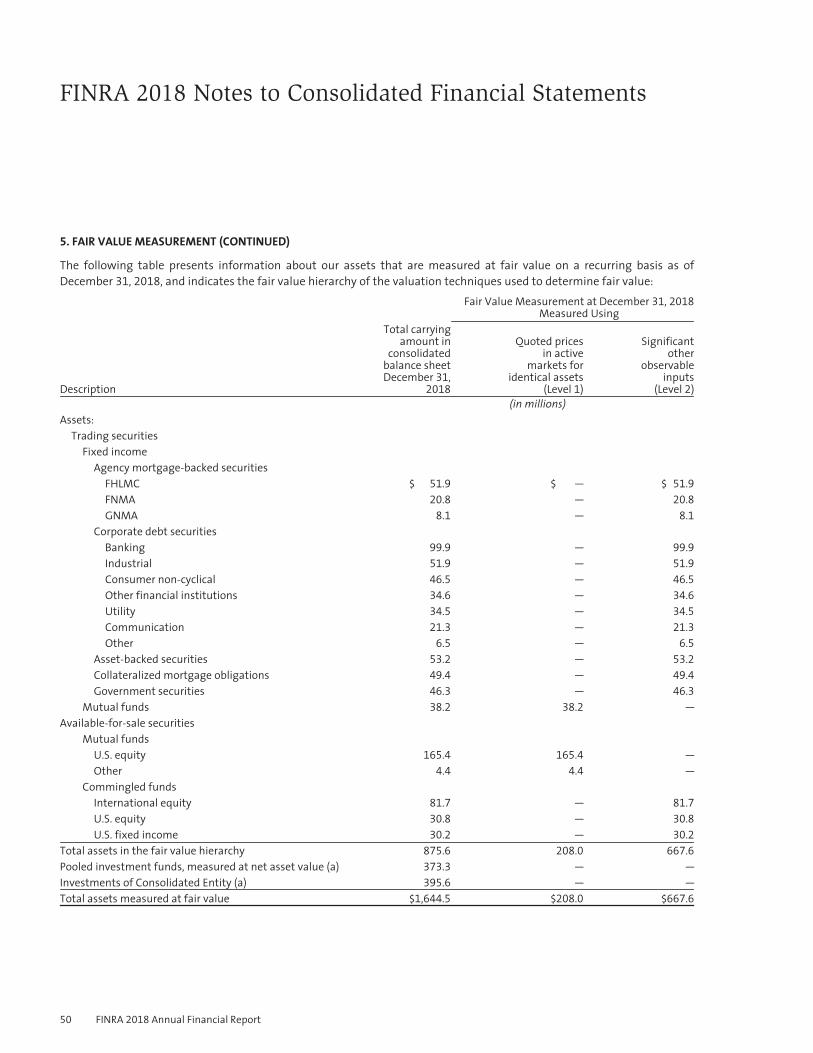
FINRA 2018 Notes to Consolidated Financial Statements
5. FAIR VALUE MEASUREMENT (CONTINUED)
The following table presents information about our assets that are measured at fair value on a recurring basis as ofDecember 31, 2018, and indicates the fair value hierarchy of the valuation techniques used to determine fair value:
Fair Value Measurement at December 31, 2018
Measured Using
Description
Total carryingamount in
consolidatedbalance sheetDecember 31,
2018
Quoted pricesin active
markets foridentical assets
(Level 1)
Significantother
observableinputs
(Level 2)(in millions)
Assets:Trading securities
Fixed incomeAgency mortgage-backed securities
FHLMC $ 51.9 $ — $ 51.9
FNMA 20.8 — 20.8
GNMA 8.1 — 8.1
Corporate debt securitiesBanking 99.9 — 99.9
Industrial 51.9 — 51.9
Consumer non-cyclical 46.5 — 46.5
Other financial institutions 34.6 — 34.6
Utility 34.5 — 34.5
Communication 21.3 — 21.3
Other 6.5 — 6.5
Asset-backed securities 53.2 — 53.2
Collateralized mortgage obligations 49.4 — 49.4
Government securities 46.3 — 46.3
Mutual funds 38.2 38.2 —
Available-for-sale securitiesMutual funds
U.S. equity 165.4 165.4 —
Other 4.4 4.4 —
Commingled fundsInternational equity 81.7 — 81.7
U.S. equity 30.8 — 30.8
U.S. fixed income 30.2 — 30.2
Total assets in the fair value hierarchy 875.6 208.0 667.6
Pooled investment funds, measured at net asset value (a) 373.3 — —
Investments of Consolidated Entity (a) 395.6 — —
Total assets measured at fair value $1,644.5 $208.0 $667.6
50 FINRA 2018 Annual Financial Report
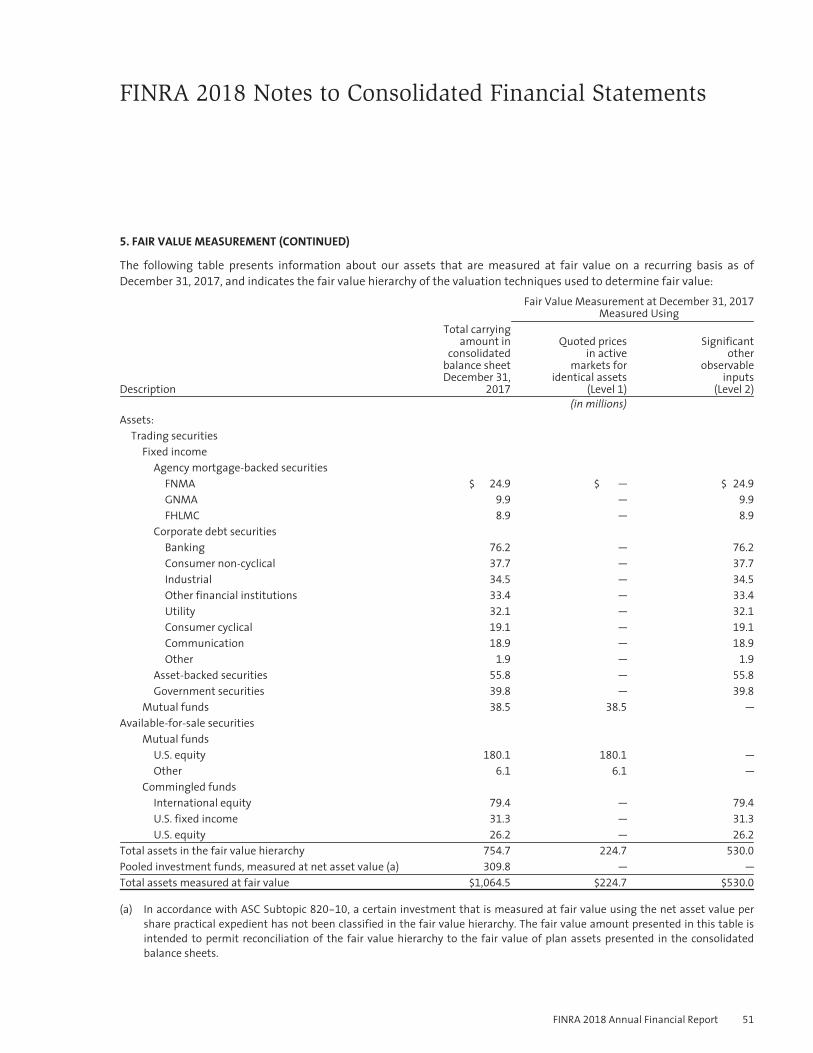
FINRA 2018 Notes to Consolidated Financial Statements
5. FAIR VALUE MEASUREMENT (CONTINUED)
The following table presents information about our assets that are measured at fair value on a recurring basis as ofDecember 31, 2017, and indicates the fair value hierarchy of the valuation techniques used to determine fair value:
Fair Value Measurement at December 31, 2017
Measured Using
Description
Total carryingamount in
consolidatedbalance sheetDecember 31,
2017
Quoted pricesin active
markets foridentical assets
(Level 1)
Significantother
observableinputs
(Level 2)(in millions)
Assets:Trading securities
Fixed incomeAgency mortgage-backed securities
FNMA $ 24.9 $ — $ 24.9
GNMA 9.9 — 9.9
FHLMC 8.9 — 8.9
Corporate debt securitiesBanking 76.2 — 76.2
Consumer non-cyclical 37.7 — 37.7
Industrial 34.5 — 34.5
Other financial institutions 33.4 — 33.4
Utility 32.1 — 32.1
Consumer cyclical 19.1 — 19.1
Communication 18.9 — 18.9
Other 1.9 — 1.9
Asset-backed securities 55.8 — 55.8
Government securities 39.8 — 39.8
Mutual funds 38.5 38.5 —
Available-for-sale securitiesMutual funds
U.S. equity 180.1 180.1 —
Other 6.1 6.1 —
Commingled fundsInternational equity 79.4 — 79.4
U.S. fixed income 31.3 — 31.3
U.S. equity 26.2 — 26.2
Total assets in the fair value hierarchy 754.7 224.7 530.0
Pooled investment funds, measured at net asset value (a) 309.8 — —
Total assets measured at fair value $1,064.5 $224.7 $530.0
(a) In accordance with ASC Subtopic 820-10, a certain investment that is measured at fair value using the net asset value pershare practical expedient has not been classified in the fair value hierarchy. The fair value amount presented in this table isintended to permit reconciliation of the fair value hierarchy to the fair value of plan assets presented in the consolidatedbalance sheets.
FINRA 2018 Annual Financial Report 51
FINRA 2018 Notes to Consolidated Financial Statements
5. FAIR VALUE MEASUREMENT (CONTINUED)
The Company invests in pooled investment funds for which the fair value option has been elected. These investmentsare offshore feeder funds in a “master-feeder” structure, and substantially all of their capital is invested in theirrespective master funds. The master funds’ investment objectives generally include producing risk-adjusted returnswhile maintaining low correlation to traditional markets by taking long and short positions in major equities, fixedincome, currencies and commodities markets offering a high level of liquidity. These investments generally have aredemption notice period between three to 30 days, and shares may be redeemed on a semimonthly or a monthlybasis. We do not have any outstanding capital commitments related to these investments.
Additionally, the investments held in the Consolidated Entity consist of limited partnerships managed by theinvestment manager of the Consolidated Entity as well as hedge funds, private equity funds or similar investmentvehicles. These investments generally employ a multi-strategy investment strategy. The fair value of the investmentsof the Consolidated Entity is measured at net asset value on the balance sheet date. The investment manager of theConsolidated Entity has a valuation committee consisting of its key officers and select members of the investmentoperations team for the investment manager. The valuation committee reviews and approves valuations for allinvestments for which the third-party administrator is unable to obtain a price independently. The ConsolidatedEntity had unfunded commitments through its investment in limited partnerships of $46.8 million as of December 31,2018. Capital calls will be funded with available cash held by the Consolidated Entity or by liquidating investments ofthe Consolidated Entity, as needed. The underlying investments held by these limited partnerships may be subject tovarious levels of liquidity restrictions.
As of December 31, 2018 and 2017, we had no investments categorized in Level 3 of the fair value hierarchy.
Changes in the fair value of trading securities and other investments measured at net asset value are recorded as acomponent of net realized and unrealized investment (losses) gains in the consolidated statements of operations.Temporary changes in the fair value of available-for-sale securities are recognized as unrealized gains as a separatecomponent of other comprehensive income (loss).
For the years ended December 31, 2018 and 2017, there were no transfers between Level 1, Level 2 or Level 3 of the fairvalue hierarchy.
The following is a description of the valuation methodologies used for financial assets measured at fair value on arecurring basis and the general classification of these instruments pursuant to the fair value hierarchy.
Fixed Income
All of our fixed income securities classified as trading securities are priced using the services of third-party pricing vendors.These vendors utilize evaluated and industry-accepted pricing models that vary by asset class and incorporate marketinputs such as available trade, bid and other market information to determine the fair value of the securities. Accordingly,the valuation of these securities is categorized in Level 2 of the fair value hierarchy.
We independently validate the fair value measurement of our trading securities to determine that the assigned fair valuesare appropriate. To validate pricing information received, our policy is to employ a variety of procedures throughout theyear, including comparing information received to other pricing sources and performing independent price checks.
Mutual Funds
All of the mutual funds classified as trading securities, which consist of funds invested in domestic bonds, as well asdomestic and international equities, relate to our defined contribution SERP for senior officers and deferred compensationplan for officers under the provisions of Section 457(b) of the IRC.
52 FINRA 2018 Annual Financial Report
FINRA 2018 Notes to Consolidated Financial Statements
5. FAIR VALUE MEASUREMENT (CONTINUED)
The Company also invests in mutual funds that are classified as available-for-sale investments based on our intent andability to sell or to hold these investments. One mutual fund investment, related to our closed defined benefit SERPobligation, consists of a life-cycle fund focused on asset allocation through investments in other mutual funds, primarily inbonds with the remainder in equities. Additionally, we have a domestic mutual fund that invests in high-qualitycompanies that have both the ability and the commitment to grow their dividends over time.
These investments are valued at the publicly quoted net asset value per share which is computed as of the close of businesson the balance sheet date. Accordingly, the valuation of these securities is categorized in Level 1 of the fair value hierarchy.
Commingled Funds
All of our commingled funds are classified as available-for-sale investments based on our intent and ability to sell or tohold these investments. Our commingled funds employ a variety of strategies, including domestic and internationalequities and domestic fixed income securities.
These investments are valued at the quoted net asset value per unit, computed as of the close of business on the balancesheet date. Units of these investments are valued daily and a unit-holder’s ability to transact in the funds’ units occursdaily; however, units are not traded on an active exchange. As the fair value per unit is readily determinable, the valuationof these securities is categorized in Level 2 of the fair value hierarchy.
6. INCOME TAXES
FINRA and FINRA REG are tax-exempt organizations under IRC Section 501(c)(6). The Foundation is a tax-exemptorganization under IRC Section 501(c)(4).
Unrelated Business Income
Unrelated business income activities are taxed at normal corporate rates to the extent that they have taxable net income.Our unrelated business activities consist primarily of mortgage licensing services provided under our contract with SRR,certain external client exams and other consulting services.
NASD Holding, Inc. (NAHO), a wholly owned taxable subsidiary of FINRA prior to its liquidation in 2005, had net operatinglosses (NOLs) to which FINRA, as the parent organization, succeeded. The related deferred tax asset resulting from thetransfer of the NAHO NOLs to FINRA was measured at $20.5 million based on federal tax rates then in effect, and FINRArecorded a valuation allowance equal to that amount. Aside from the NAHO NOLs, FINRA’s deferred tax asset is primarilycomposed of losses related to other contractual work performed in the past. The deferred tax asset, which remains entirelyreserved, is remeasured each period at rates expected to be in effect in the future period that the asset is used. As ofDecember 31, 2018 and 2017, FINRA had federal unrelated business loss carryforwards of $49.4 million and $51.3 million,respectively, which are scheduled to expire beginning in 2022 through 2028.
FINRA 2018 Annual Financial Report 53
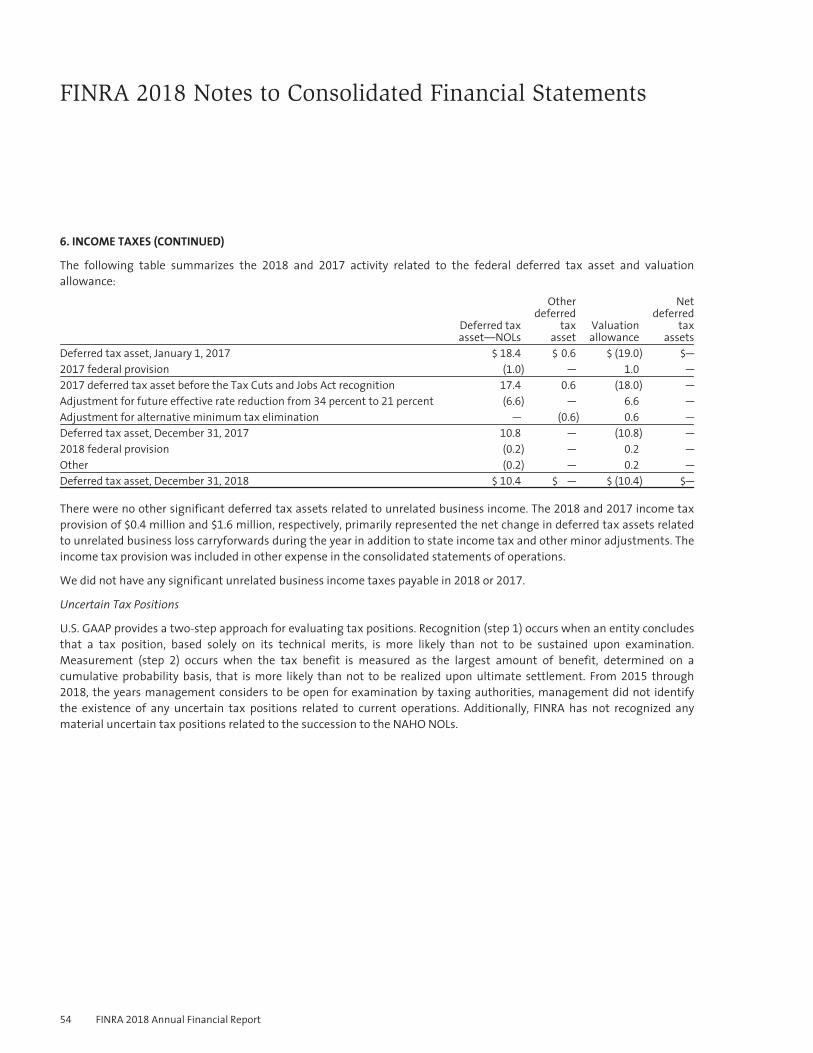
FINRA 2018 Notes to Consolidated Financial Statements
6. INCOME TAXES (CONTINUED)
The following table summarizes the 2018 and 2017 activity related to the federal deferred tax asset and valuationallowance:
Deferred taxasset—NOLs
Otherdeferred
taxasset
Valuationallowance
Netdeferred
taxassets
Deferred tax asset, January 1, 2017 $ 18.4 $ 0.6 $ (19.0) $—
2017 federal provision (1.0) — 1.0 —
2017 deferred tax asset before the Tax Cuts and Jobs Act recognition 17.4 0.6 (18.0) —
Adjustment for future effective rate reduction from 34 percent to 21 percent (6.6) — 6.6 —
Adjustment for alternative minimum tax elimination — (0.6) 0.6 —
Deferred tax asset, December 31, 2017 10.8 — (10.8) —
2018 federal provision (0.2) — 0.2 —
Other (0.2) — 0.2 —
Deferred tax asset, December 31, 2018 $ 10.4 $ — $ (10.4) $—
There were no other significant deferred tax assets related to unrelated business income. The 2018 and 2017 income taxprovision of $0.4 million and $1.6 million, respectively, primarily represented the net change in deferred tax assets relatedto unrelated business loss carryforwards during the year in addition to state income tax and other minor adjustments. Theincome tax provision was included in other expense in the consolidated statements of operations.
We did not have any significant unrelated business income taxes payable in 2018 or 2017.
Uncertain Tax Positions
U.S. GAAP provides a two-step approach for evaluating tax positions. Recognition (step 1) occurs when an entity concludesthat a tax position, based solely on its technical merits, is more likely than not to be sustained upon examination.Measurement (step 2) occurs when the tax benefit is measured as the largest amount of benefit, determined on acumulative probability basis, that is more likely than not to be realized upon ultimate settlement. From 2015 through2018, the years management considers to be open for examination by taxing authorities, management did not identifythe existence of any uncertain tax positions related to current operations. Additionally, FINRA has not recognized anymaterial uncertain tax positions related to the succession to the NAHO NOLs.
54 FINRA 2018 Annual Financial Report
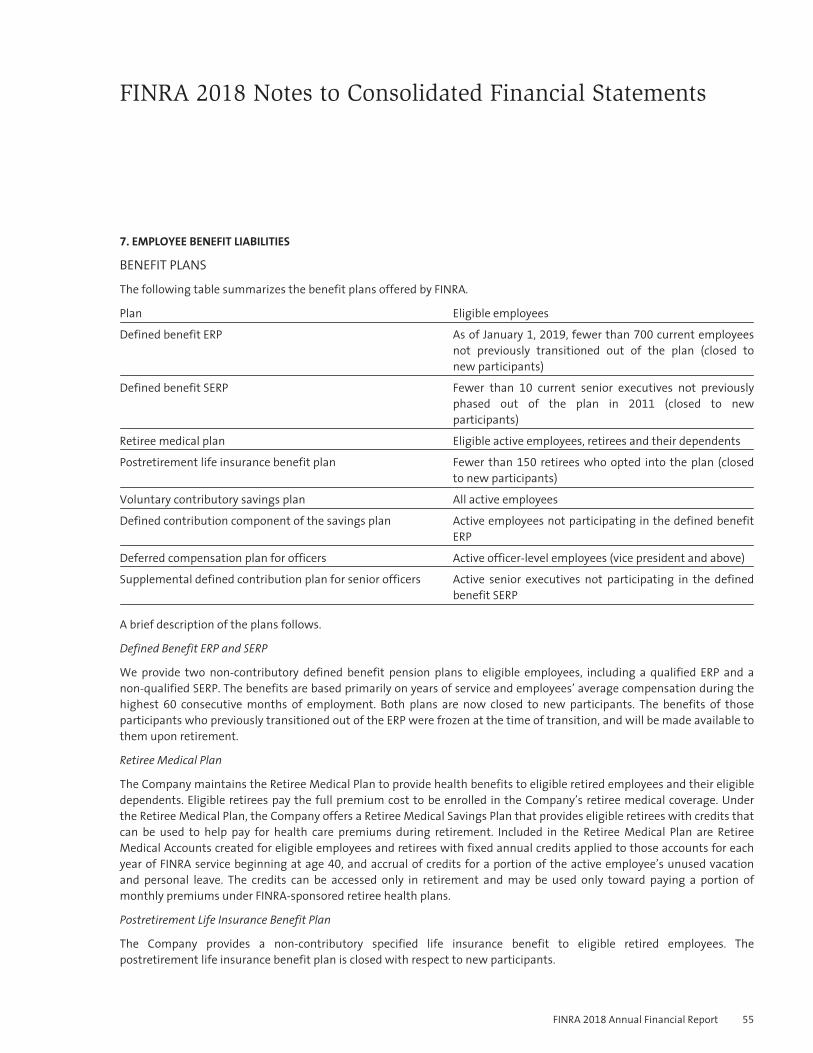
FINRA 2018 Notes to Consolidated Financial Statements
7. EMPLOYEE BENEFIT LIABILITIES
BENEFIT PLANS
The following table summarizes the benefit plans offered by FINRA.
Plan Eligible employees
Defined benefit ERP As of January 1, 2019, fewer than 700 current employeesnot previously transitioned out of the plan (closed tonew participants)
Defined benefit SERP Fewer than 10 current senior executives not previouslyphased out of the plan in 2011 (closed to newparticipants)
Retiree medical plan Eligible active employees, retirees and their dependents
Postretirement life insurance benefit plan Fewer than 150 retirees who opted into the plan (closedto new participants)
Voluntary contributory savings plan All active employees
Defined contribution component of the savings plan Active employees not participating in the defined benefitERP
Deferred compensation plan for officers Active officer-level employees (vice president and above)
Supplemental defined contribution plan for senior officers Active senior executives not participating in the definedbenefit SERP
A brief description of the plans follows.
Defined Benefit ERP and SERP
We provide two non-contributory defined benefit pension plans to eligible employees, including a qualified ERP and anon-qualified SERP. The benefits are based primarily on years of service and employees’ average compensation during thehighest 60 consecutive months of employment. Both plans are now closed to new participants. The benefits of thoseparticipants who previously transitioned out of the ERP were frozen at the time of transition, and will be made available tothem upon retirement.
Retiree Medical Plan
The Company maintains the Retiree Medical Plan to provide health benefits to eligible retired employees and their eligibledependents. Eligible retirees pay the full premium cost to be enrolled in the Company’s retiree medical coverage. Underthe Retiree Medical Plan, the Company offers a Retiree Medical Savings Plan that provides eligible retirees with credits thatcan be used to help pay for health care premiums during retirement. Included in the Retiree Medical Plan are RetireeMedical Accounts created for eligible employees and retirees with fixed annual credits applied to those accounts for eachyear of FINRA service beginning at age 40, and accrual of credits for a portion of the active employee’s unused vacationand personal leave. The credits can be accessed only in retirement and may be used only toward paying a portion ofmonthly premiums under FINRA-sponsored retiree health plans.
Postretirement Life Insurance Benefit Plan
The Company provides a non-contributory specified life insurance benefit to eligible retired employees. Thepostretirement life insurance benefit plan is closed with respect to new participants.
FINRA 2018 Annual Financial Report 55
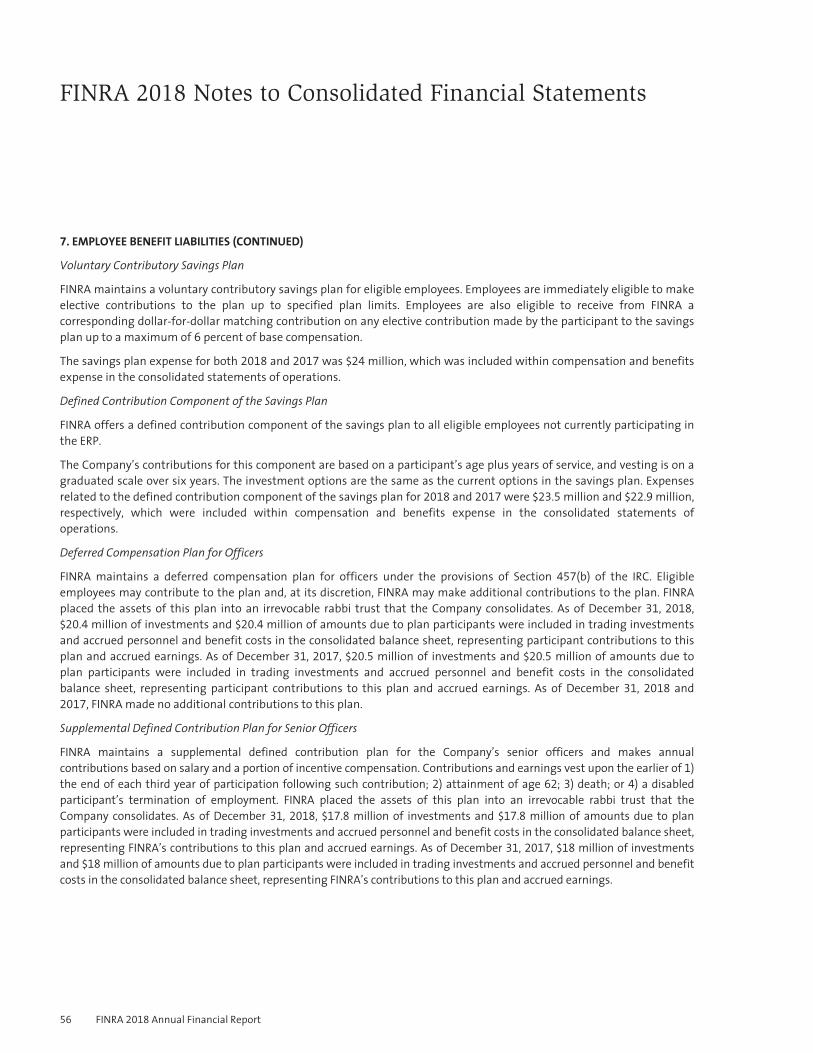
FINRA 2018 Notes to Consolidated Financial Statements
7. EMPLOYEE BENEFIT LIABILITIES (CONTINUED)
Voluntary Contributory Savings Plan
FINRA maintains a voluntary contributory savings plan for eligible employees. Employees are immediately eligible to makeelective contributions to the plan up to specified plan limits. Employees are also eligible to receive from FINRA acorresponding dollar-for-dollar matching contribution on any elective contribution made by the participant to the savingsplan up to a maximum of 6 percent of base compensation.
The savings plan expense for both 2018 and 2017 was $24 million, which was included within compensation and benefitsexpense in the consolidated statements of operations.
Defined Contribution Component of the Savings Plan
FINRA offers a defined contribution component of the savings plan to all eligible employees not currently participating inthe ERP.
The Company’s contributions for this component are based on a participant’s age plus years of service, and vesting is on agraduated scale over six years. The investment options are the same as the current options in the savings plan. Expensesrelated to the defined contribution component of the savings plan for 2018 and 2017 were $23.5 million and $22.9 million,respectively, which were included within compensation and benefits expense in the consolidated statements ofoperations.
Deferred Compensation Plan for Officers
FINRA maintains a deferred compensation plan for officers under the provisions of Section 457(b) of the IRC. Eligibleemployees may contribute to the plan and, at its discretion, FINRA may make additional contributions to the plan. FINRAplaced the assets of this plan into an irrevocable rabbi trust that the Company consolidates. As of December 31, 2018,$20.4 million of investments and $20.4 million of amounts due to plan participants were included in trading investmentsand accrued personnel and benefit costs in the consolidated balance sheet, representing participant contributions to thisplan and accrued earnings. As of December 31, 2017, $20.5 million of investments and $20.5 million of amounts due toplan participants were included in trading investments and accrued personnel and benefit costs in the consolidatedbalance sheet, representing participant contributions to this plan and accrued earnings. As of December 31, 2018 and2017, FINRA made no additional contributions to this plan.
Supplemental Defined Contribution Plan for Senior Officers
FINRA maintains a supplemental defined contribution plan for the Company’s senior officers and makes annualcontributions based on salary and a portion of incentive compensation. Contributions and earnings vest upon the earlier of 1)the end of each third year of participation following such contribution; 2) attainment of age 62; 3) death; or 4) a disabledparticipant’s termination of employment. FINRA placed the assets of this plan into an irrevocable rabbi trust that theCompany consolidates. As of December 31, 2018, $17.8 million of investments and $17.8 million of amounts due to planparticipants were included in trading investments and accrued personnel and benefit costs in the consolidated balance sheet,representing FINRA’s contributions to this plan and accrued earnings. As of December 31, 2017, $18 million of investmentsand $18 million of amounts due to plan participants were included in trading investments and accrued personnel and benefitcosts in the consolidated balance sheet, representing FINRA’s contributions to this plan and accrued earnings.
56 FINRA 2018 Annual Financial Report
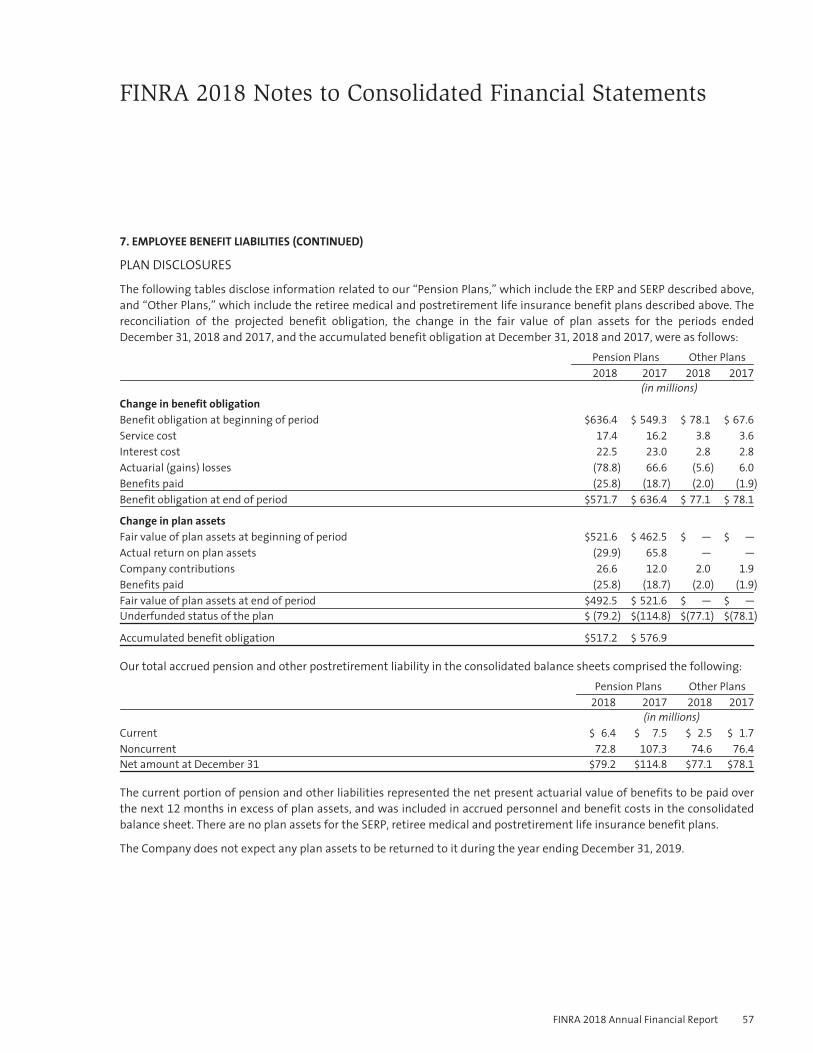
FINRA 2018 Notes to Consolidated Financial Statements
7. EMPLOYEE BENEFIT LIABILITIES (CONTINUED)
PLAN DISCLOSURES
The following tables disclose information related to our “Pension Plans,” which include the ERP and SERP described above,and “Other Plans,” which include the retiree medical and postretirement life insurance benefit plans described above. Thereconciliation of the projected benefit obligation, the change in the fair value of plan assets for the periods endedDecember 31, 2018 and 2017, and the accumulated benefit obligation at December 31, 2018 and 2017, were as follows:
Pension Plans Other Plans2018 2017 2018 2017
(in millions)Change in benefit obligationBenefit obligation at beginning of period $636.4 $ 549.3 $ 78.1 $ 67.6
Service cost 17.4 16.2 3.8 3.6
Interest cost 22.5 23.0 2.8 2.8
Actuarial (gains) losses (78.8) 66.6 (5.6) 6.0
Benefits paid (25.8) (18.7) (2.0) (1.9)
Benefit obligation at end of period $571.7 $ 636.4 $ 77.1 $ 78.1
Change in plan assetsFair value of plan assets at beginning of period $521.6 $ 462.5 $ — $ —
Actual return on plan assets (29.9) 65.8 — —
Company contributions 26.6 12.0 2.0 1.9
Benefits paid (25.8) (18.7) (2.0) (1.9)
Fair value of plan assets at end of period $492.5 $ 521.6 $ — $ —
Underfunded status of the plan $ (79.2) $(114.8) $(77.1) $(78.1)
Accumulated benefit obligation $517.2 $ 576.9
Our total accrued pension and other postretirement liability in the consolidated balance sheets comprised the following:Pension Plans Other Plans
2018 2017 2018 2017
(in millions)Current $ 6.4 $ 7.5 $ 2.5 $ 1.7
Noncurrent 72.8 107.3 74.6 76.4
Net amount at December 31 $79.2 $114.8 $77.1 $78.1
The current portion of pension and other liabilities represented the net present actuarial value of benefits to be paid overthe next 12 months in excess of plan assets, and was included in accrued personnel and benefit costs in the consolidatedbalance sheet. There are no plan assets for the SERP, retiree medical and postretirement life insurance benefit plans.
The Company does not expect any plan assets to be returned to it during the year ending December 31, 2019.
FINRA 2018 Annual Financial Report 57
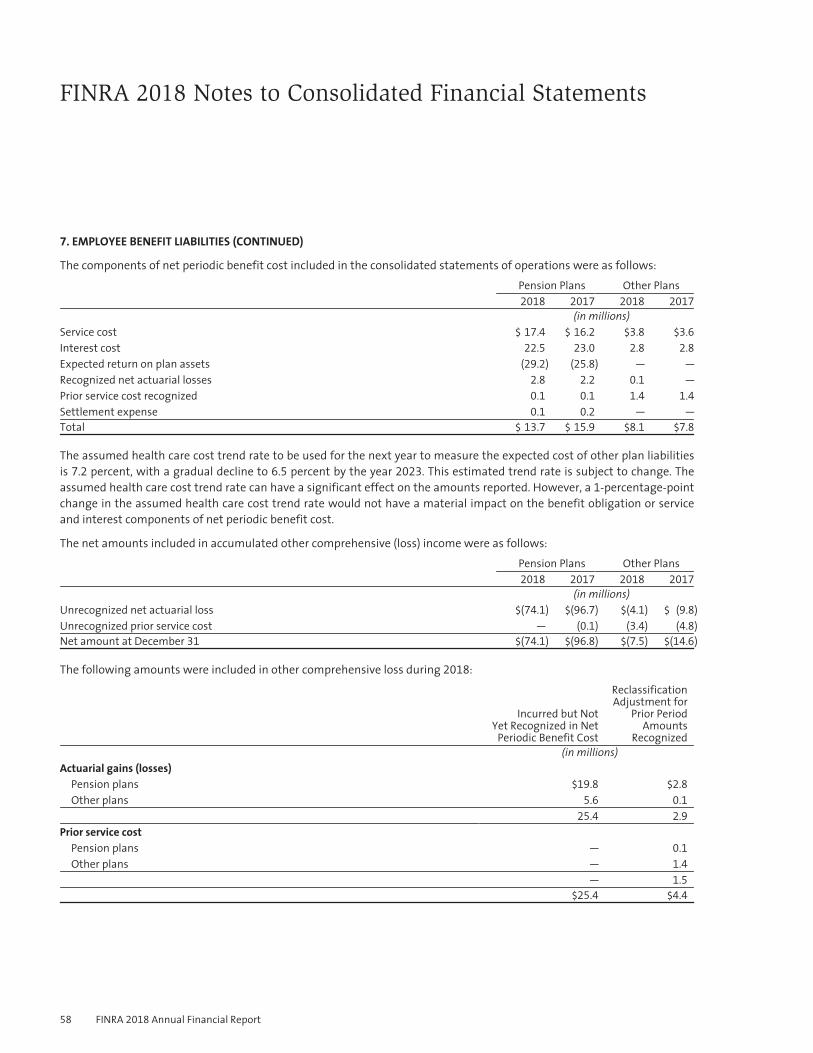
FINRA 2018 Notes to Consolidated Financial Statements
7. EMPLOYEE BENEFIT LIABILITIES (CONTINUED)
The components of net periodic benefit cost included in the consolidated statements of operations were as follows:Pension Plans Other Plans2018 2017 2018 2017
(in millions)Service cost $ 17.4 $ 16.2 $3.8 $3.6
Interest cost 22.5 23.0 2.8 2.8
Expected return on plan assets (29.2) (25.8) — —
Recognized net actuarial losses 2.8 2.2 0.1 —
Prior service cost recognized 0.1 0.1 1.4 1.4
Settlement expense 0.1 0.2 — —
Total $ 13.7 $ 15.9 $8.1 $7.8
The assumed health care cost trend rate to be used for the next year to measure the expected cost of other plan liabilitiesis 7.2 percent, with a gradual decline to 6.5 percent by the year 2023. This estimated trend rate is subject to change. Theassumed health care cost trend rate can have a significant effect on the amounts reported. However, a 1-percentage-pointchange in the assumed health care cost trend rate would not have a material impact on the benefit obligation or serviceand interest components of net periodic benefit cost.
The net amounts included in accumulated other comprehensive (loss) income were as follows:Pension Plans Other Plans2018 2017 2018 2017
(in millions)Unrecognized net actuarial loss $(74.1) $(96.7) $(4.1) $ (9.8)
Unrecognized prior service cost — (0.1) (3.4) (4.8)
Net amount at December 31 $(74.1) $(96.8) $(7.5) $(14.6)
The following amounts were included in other comprehensive loss during 2018:
Incurred but NotYet Recognized in Net
Periodic Benefit Cost
ReclassificationAdjustment for
Prior PeriodAmounts
Recognized(in millions)
Actuarial gains (losses)Pension plans $19.8 $2.8
Other plans 5.6 0.1
25.4 2.9
Prior service costPension plans — 0.1
Other plans — 1.4
— 1.5
$25.4 $4.4
58 FINRA 2018 Annual Financial Report
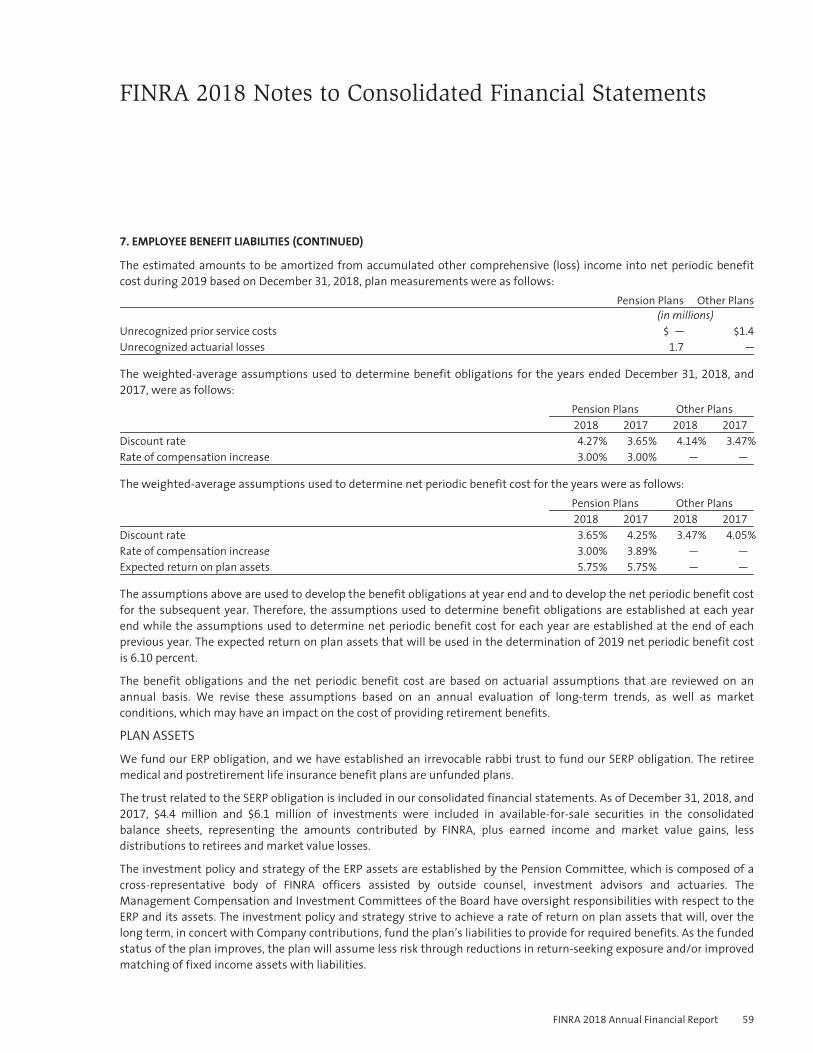
FINRA 2018 Notes to Consolidated Financial Statements
7. EMPLOYEE BENEFIT LIABILITIES (CONTINUED)
The estimated amounts to be amortized from accumulated other comprehensive (loss) income into net periodic benefitcost during 2019 based on December 31, 2018, plan measurements were as follows:
Pension Plans Other Plans(in millions)
Unrecognized prior service costs $ — $1.4
Unrecognized actuarial losses 1.7 —
The weighted-average assumptions used to determine benefit obligations for the years ended December 31, 2018, and2017, were as follows:
Pension Plans Other Plans2018 2017 2018 2017
Discount rate 4.27% 3.65% 4.14% 3.47%
Rate of compensation increase 3.00% 3.00% — —
The weighted-average assumptions used to determine net periodic benefit cost for the years were as follows:Pension Plans Other Plans2018 2017 2018 2017
Discount rate 3.65% 4.25% 3.47% 4.05%
Rate of compensation increase 3.00% 3.89% — —
Expected return on plan assets 5.75% 5.75% — —
The assumptions above are used to develop the benefit obligations at year end and to develop the net periodic benefit costfor the subsequent year. Therefore, the assumptions used to determine benefit obligations are established at each yearend while the assumptions used to determine net periodic benefit cost for each year are established at the end of eachprevious year. The expected return on plan assets that will be used in the determination of 2019 net periodic benefit costis 6.10 percent.
The benefit obligations and the net periodic benefit cost are based on actuarial assumptions that are reviewed on anannual basis. We revise these assumptions based on an annual evaluation of long-term trends, as well as marketconditions, which may have an impact on the cost of providing retirement benefits.
PLAN ASSETS
We fund our ERP obligation, and we have established an irrevocable rabbi trust to fund our SERP obligation. The retireemedical and postretirement life insurance benefit plans are unfunded plans.
The trust related to the SERP obligation is included in our consolidated financial statements. As of December 31, 2018, and2017, $4.4 million and $6.1 million of investments were included in available-for-sale securities in the consolidatedbalance sheets, representing the amounts contributed by FINRA, plus earned income and market value gains, lessdistributions to retirees and market value losses.
The investment policy and strategy of the ERP assets are established by the Pension Committee, which is composed of across-representative body of FINRA officers assisted by outside counsel, investment advisors and actuaries. TheManagement Compensation and Investment Committees of the Board have oversight responsibilities with respect to theERP and its assets. The investment policy and strategy strive to achieve a rate of return on plan assets that will, over thelong term, in concert with Company contributions, fund the plan’s liabilities to provide for required benefits. As the fundedstatus of the plan improves, the plan will assume less risk through reductions in return-seeking exposure and/or improvedmatching of fixed income assets with liabilities.
FINRA 2018 Annual Financial Report 59
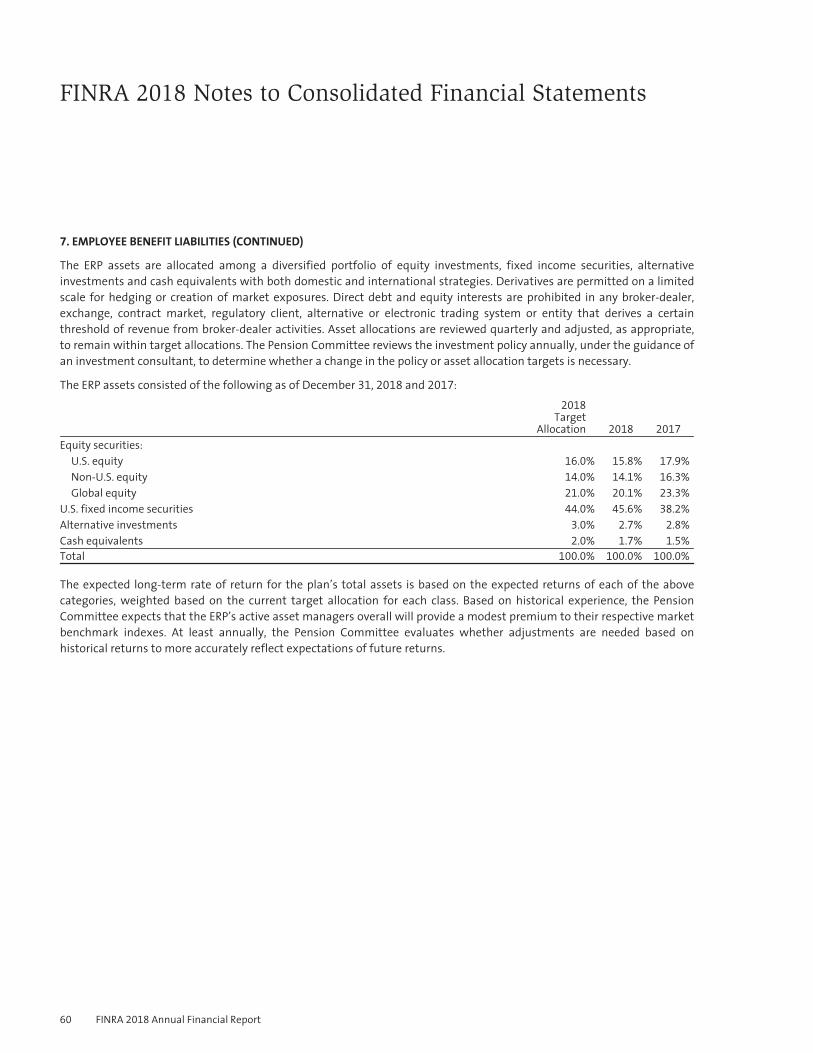
FINRA 2018 Notes to Consolidated Financial Statements
7. EMPLOYEE BENEFIT LIABILITIES (CONTINUED)
The ERP assets are allocated among a diversified portfolio of equity investments, fixed income securities, alternativeinvestments and cash equivalents with both domestic and international strategies. Derivatives are permitted on a limitedscale for hedging or creation of market exposures. Direct debt and equity interests are prohibited in any broker-dealer,exchange, contract market, regulatory client, alternative or electronic trading system or entity that derives a certainthreshold of revenue from broker-dealer activities. Asset allocations are reviewed quarterly and adjusted, as appropriate,to remain within target allocations. The Pension Committee reviews the investment policy annually, under the guidance ofan investment consultant, to determine whether a change in the policy or asset allocation targets is necessary.
The ERP assets consisted of the following as of December 31, 2018 and 2017:2018
TargetAllocation 2018 2017
Equity securities:U.S. equity 16.0% 15.8% 17.9%
Non-U.S. equity 14.0% 14.1% 16.3%
Global equity 21.0% 20.1% 23.3%
U.S. fixed income securities 44.0% 45.6% 38.2%
Alternative investments 3.0% 2.7% 2.8%
Cash equivalents 2.0% 1.7% 1.5%
Total 100.0% 100.0% 100.0%
The expected long-term rate of return for the plan’s total assets is based on the expected returns of each of the abovecategories, weighted based on the current target allocation for each class. Based on historical experience, the PensionCommittee expects that the ERP’s active asset managers overall will provide a modest premium to their respective marketbenchmark indexes. At least annually, the Pension Committee evaluates whether adjustments are needed based onhistorical returns to more accurately reflect expectations of future returns.
60 FINRA 2018 Annual Financial Report
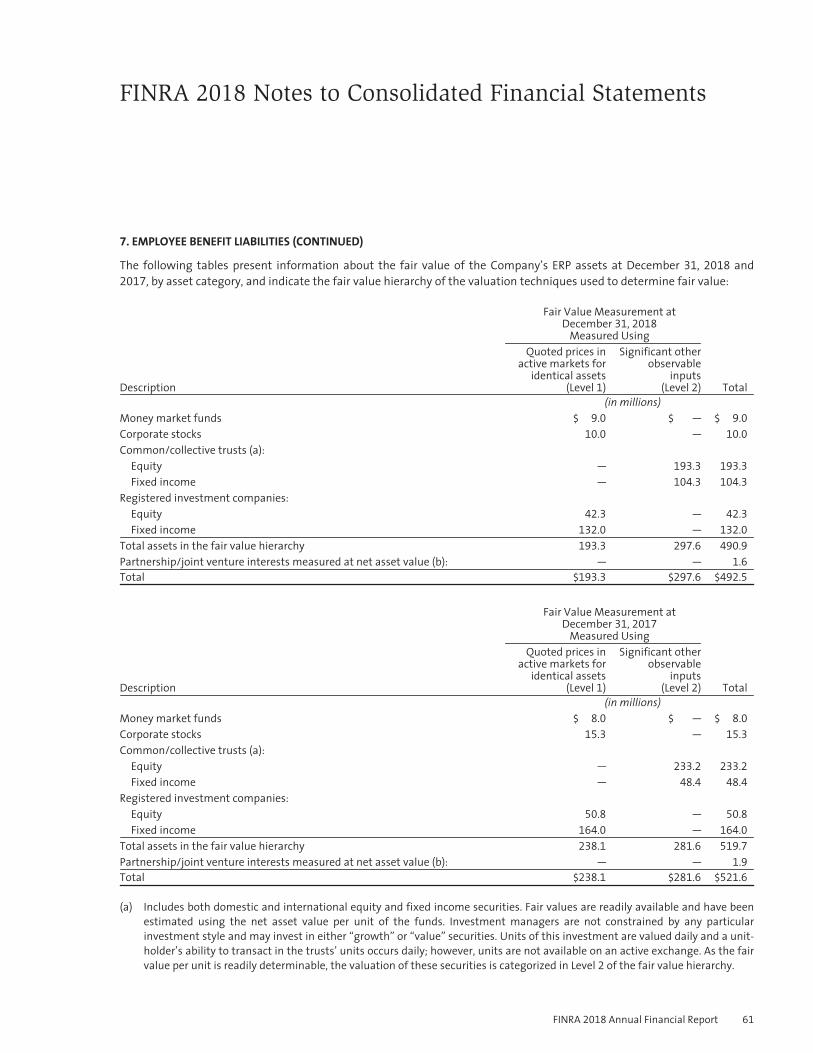
FINRA 2018 Notes to Consolidated Financial Statements
7. EMPLOYEE BENEFIT LIABILITIES (CONTINUED)
The following tables present information about the fair value of the Company’s ERP assets at December 31, 2018 and2017, by asset category, and indicate the fair value hierarchy of the valuation techniques used to determine fair value:
Fair Value Measurement atDecember 31, 2018
Measured Using
Description
Quoted prices inactive markets for
identical assets(Level 1)
Significant otherobservable
inputs(Level 2) Total
(in millions)Money market funds $ 9.0 $ — $ 9.0
Corporate stocks 10.0 — 10.0
Common/collective trusts (a):Equity — 193.3 193.3
Fixed income — 104.3 104.3
Registered investment companies:Equity 42.3 — 42.3
Fixed income 132.0 — 132.0
Total assets in the fair value hierarchy 193.3 297.6 490.9
Partnership/joint venture interests measured at net asset value (b): — — 1.6
Total $193.3 $297.6 $492.5
Fair Value Measurement atDecember 31, 2017
Measured Using
Description
Quoted prices inactive markets for
identical assets(Level 1)
Significant otherobservable
inputs(Level 2) Total
(in millions)Money market funds $ 8.0 $ — $ 8.0
Corporate stocks 15.3 — 15.3
Common/collective trusts (a):Equity — 233.2 233.2
Fixed income — 48.4 48.4
Registered investment companies:Equity 50.8 — 50.8
Fixed income 164.0 — 164.0
Total assets in the fair value hierarchy 238.1 281.6 519.7
Partnership/joint venture interests measured at net asset value (b): — — 1.9
Total $238.1 $281.6 $521.6
(a) Includes both domestic and international equity and fixed income securities. Fair values are readily available and have beenestimated using the net asset value per unit of the funds. Investment managers are not constrained by any particularinvestment style and may invest in either “growth” or “value” securities. Units of this investment are valued daily and a unit-holder’s ability to transact in the trusts’ units occurs daily; however, units are not available on an active exchange. As the fairvalue per unit is readily determinable, the valuation of these securities is categorized in Level 2 of the fair value hierarchy.
FINRA 2018 Annual Financial Report 61
FINRA 2018 Notes to Consolidated Financial Statements
7. EMPLOYEE BENEFIT LIABILITIES (CONTINUED)
(b) In accordance with ASC Subtopic 820-10, a certain investment that is measured at fair value using the net asset value pershare practical expedient has not been classified in the fair value hierarchy. The fair value amount presented in this table isintended to permit reconciliation of the fair value hierarchy to the fair value of plan assets presented in the plan disclosuressection of this footnote.
The investment included in this category is a private equity fund that invests in the natural resources and real estateindustries. The investment is nonredeemable. The fair value of the investment has been estimated using the net asset valueper share of the investment.
For the years ended December 31, 2018 and 2017, there were no transfers between Level 1, Level 2 or Level 3 of the fairvalue hierarchy.
The valuation techniques and inputs used to measure fair value of the ERP assets are consistent with the Company’svaluation procedures as disclosed in Note 5, “Fair Value Measurement.” For alternative investments, net asset value is usedas a practical expedient to measure fair value unless it is probable that an investment will be sold for a different amount.In these cases, fair value is measured based on recent observable transaction information for similar investments, theconsideration of non-binding bids from potential buyers and third-party valuations.
EXPECTED FUTURE BENEFIT PAYMENTS
We measure our plans as of the end of each fiscal year. The ERP’s funding policy is to fund at least 100 percent of the ERP’sfunding target liability as set forth by the Internal Revenue Service. In 2019, we expect to contribute $15.5 million to theERP. We do not expect to contribute to the SERP in 2019. In addition, we expect to make the following benefit payments toparticipants over the next 10 years:
Pension Plans Other Plans(in millions)
Year ending December 31,2019 $ 30.6 $ 5.1
2020 30.9 5.2
2021 29.3 5.6
2022 31.1 5.9
2023 33.4 7.9
2024 through 2028 200.9 56.4
Total $356.2 $86.1
62 FINRA 2018 Annual Financial Report
FINRA 2018 Notes to Consolidated Financial Statements
8. ACCUMULATED OTHER COMPREHENSIVE INCOME (LOSS)
The following is a summary of changes in accumulated other comprehensive income (loss) as of December 31, 2018,and 2017.
Unrealized gain(loss) on
available-for-saleinvestments
Netunrecognized
employeebenefit plan
amounts Total(in millions)
Balance, January 1, 2017 $ 0.7 $ (82.7) $ (82.0)
Other comprehensive income (loss) before reclassifications 32.5 (32.4) 0.1
Amounts reclassified from accumulated other comprehensive (income) loss (a) (1.2) 3.7 2.5
Net current-period other comprehensive income 31.3 (28.7) 2.6
Balance, December 31, 2017 32.0 (111.4) $ (79.4)
Other comprehensive (loss) income before reclassifications (30.7) 25.4 (5.3)
Amounts reclassified from accumulated other comprehensive (income) loss (a) (1.9) 4.4 2.5
Net current-period other comprehensive (loss) income (32.6) 29.8 (2.8)
Balance, December 31, 2018 $ (0.6) $ (81.6) $ (82.2)
(a) Reclassified amounts for gains (losses) on available-for-sale investments were recorded in net realized and unrealizedinvestment (losses) gains in the consolidated statements of operations—see Note 4, “Investments,” for additionalinformation. Reclassified net unrecognized employee benefit plan amounts were included as a component of net periodicbenefit cost and recorded in compensation and benefits expense in the consolidated statements of operations—see Note 7,“Employee Benefit Liabilities,” for additional information.
9. LEASES
FINRA leases certain office space and equipment in connection with its operations. The majority of these leases containescalation clauses based on increases in rent, property taxes and building operating costs. Certain of these leases alsocontain renewal options. Rent expense for operating leases was $25.8 million and $24.5 million for the years endedDecember 31, 2018, and 2017, which was included in occupancy expense in the consolidated statements of operations.
Future minimum lease payments under non-cancelable operating leases with initial or remaining terms of one year ormore consisted of the following at December 31, 2018:Year ending December 31, (in millions)2019 $ 28.8
2020 22.9
2021 8.82022 6.7
2023 6.8
Remaining years 10.8
Total minimum lease payments $ 84.8
Future minimum lease payments drop significantly in 2021 with the expiration of our lease at One Liberty Plaza inNew York City, New York.
On May 22, 2019, we executed a lease to occupy 203,583 square feet of space over a ten-year period in New York City, NewYork. The rent commencement date for the leased space is July 16, 2021. Future minimum lease payments will totalapproximately $131.3 million over the ten-year lease term.
FINRA 2018 Annual Financial Report 63
FINRA 2018 Notes to Consolidated Financial Statements
9. LEASES (CONTINUED)
On June 4, 2019, we executed a lease to occupy 48,981 square feet of space over a ten year period in Jersey City, NewJersey. The rent commencement date for the leased space is November 15, 2020. Future minimum lease payments willtotal approximately $22.4 million over the ten year lease term.
10. DEBT
FINRA maintains a seasonal unsecured line of credit agreement and has the option to borrow up to $150 million at theLIBOR Daily Floating Rate plus 0.45 percent (2.83 percent at December 31, 2018). As of December 31, 2018, andDecember 31, 2017, no line of credit amounts were outstanding. Our latest line of credit renewal commenced on February1, 2019 and expired on May 31, 2019.
As of December 31, 2018 and 2017, we had outstanding debt of $14.6 million and $15.5 million, respectively, on ourunsecured 2.99 percent fixed rate seven-year term loan related to our 2015 purchase of the Omega Building in Rockville,Maryland.
11. COMMITMENTS AND CONTINGENCIES
General Litigation
Management is not aware of any unasserted claims or assessments that would have a material adverse effect on theCompany’s financial position and the results of operations. Currently, there are certain legal proceedings pending againstus. While the outcome of any pending litigation cannot be predicted, management does not believe that any such matterwill have a material adverse effect on our business or financial position. As of December 31, 2018, there were no materialestimated losses requiring disclosure related to pending legal proceedings, because we believe that any litigationcontingency from these matters involves a chance of loss that is either remote or not reasonably possible. Such pendinglegal matters involve unspecified claim amounts, in which the respective plaintiffs seek an indeterminate amount ofdamages. The outcome of such matters is always uncertain, and unforeseen results can occur. It is possible that suchoutcomes could require us to pay damages or make other expenditures or establish accruals in amounts that we could notestimate as of December 31, 2018.
Indemnities
The general partner and investment manager of the Consolidated Entity, on behalf of the Consolidated Entity, enter intocertain contracts that contain a variety of indemnifications. The Consolidated Entity’s maximum exposure under thesearrangements is unknown. However, the Consolidated Entity has not had prior claims or losses pursuant to thesecontracts and expects any risk of loss to be remote.
12. SUBSEQUENT EVENTS
On February 27, 2019, FINRA was selected as the Plan Processor for the Consolidated Audit Trail (CAT) and the contract wasformalized the following month. As Plan Processor, FINRA is responsible for all aspects of the build, maintenance andoperation of the CAT, which will allow regulators to improve securities market surveillance by creating an extensive audittrail of trades, quotes and orders for all U.S. exchange-listed and over-the-counter equity securities across all U.S. marketsand trading venues. The CAT will also collect the same data for U.S. exchange-listed options contracts. To perform itsduties as Plan Processor for the CAT, FINRA established a new wholly-owned consolidated subsidiary, FINRA CAT, LLC, andmade a $50 million capital contribution to FINRA CAT, LLC in April 2019.
Subsequent events have been evaluated through June 25, 2019, the date these financial statements became available tobe issued. These financial statements have been approved by management, who has determined that no subsequentevent occurred that would require disclosure in the financial statements or accompanying notes.
64 FINRA 2018 Annual Financial Report
FINRA Board ofGovernors as ofMay 21, 2019William H. Heyman (Public)ChairmanThe Travelers Companies, Inc.New York, NY
Robert W. CookPresident and CEOFINRAWashington, DC
Lance F. Drummond (Public)RetiredCharlotte, NC
Andrew S. Duff (Industry)Piper Jaffray & Co.Minneapolis, MN
John (Jack) Ehnes (Public)CalSTRSWest Sacramento, CA
Stephen A. Kohn (Industry)Stephen A. Kohn &Associates, Ltd.Lakewood, CO
Brian J. Kovack (Industry)Kovack Securities, Inc.Ft. Lauderdale, FL
Rochelle B. Lazarus (Public)Ogilvy & MatherNew York, NY
Joshua S. Levine (Public)RetiredGreenwich, CT
Brigitte C. Madrian (Public)BYU Marriott School ofBusinessProvo, UT
Joseph M. Mecane (Industry)Citadel SecuritiesNew York, NY
Robert A. Muh (Industry)Sutter Securities, Inc.San Francisco, CA
Kathleen A. Murphy (Industry)Fidelity Personal InvestingBoston, MA
Eileen K. Murray (Public)Bridgewater AssociatesWestport, CT
James D. Nagengast (Industry)Securities America, Inc.LaVista, NE
Paige W. Pierce (Industry)Larimer Capital CorporationSandy, Utah
Charles I. Plosser (Public)Former President and CEO,Federal Reserve Bank ofPhiladelphiaAmelia Island, FL
Hillary A. Sale (Public)Georgetown University LawCenterWashington, DC
Timothy C. Scheve (Industry)Janney Montgomery Scott LLCPhiladelphia, PA
Leslie F. Seidman (Public)Former Chairman, FinancialAccounting Standards BoardWestport, CT
Luis M. Viceira (Public)Harvard Business SchoolBoston, MA
Elisse B. Walter (Public)Former Commissioner andChairman, U.S. Securities andExchange CommissionBethesda, MD
Amy L. Webber (Industry)Cambridge InvestmentResearch, Inc.Fairfield, IA
Susan Wolburgh Jenah (Public)Former President and CEOInvestment Industry RegulatoryOrganization of CanadaToronto, ON
FINRA Officers asof May 21, 2019
Robert W. CookPresident and Chief ExecutiveOfficer
Marcia E. AsquithExecutive Vice President, Boardand External Relations andCorporate Secretary
Richard W. BerryExecutive Vice President andDirector of Dispute Resolution
Robert L. D. ColbyExecutive Vice President andChief Legal Officer
Gene DeMaioExecutive Vice President,Options Regulation and MarketRegulation
Todd T. DiganciExecutive Vice President—ChiefFinancial and ChiefAdministrative Officer
Cameron K. FunkhouserExecutive Vice President, Officeof Fraud Detection and MarketIntelligence
Thomas R. GiraExecutive Vice President, MarketRegulation and TransparencyServices
Bari HavlikExecutive Vice President,Member Supervision
Derek W. LindenExecutive Vice President,Registration and Disclosure
Steven J. RandichExecutive Vice President andChief Information Officer
FINRA 2018 Annual Financial Report 65
Michael G. RufinoExecutive Vice President, Head ofMember Supervision—SalesPractice
Susan SchroederExecutive Vice President,Enforcement
Thomas M. SelmanExecutive Vice President,Regulatory Policy and LegalCompliance Officer
William J. WollmanExecutive Vice President,Member Regulation—RiskOversight and OperationalRegulation
FINRA CorporateOffices1735 K Street, NWWashington, DC 20006
(202) 728-8000
9509 Key West AvenueRockville, MD 20850
(301) 590-6500
9513 Key West AvenueRockville, MD 20850
(301) 590-6500
15200 Omega DriveRockville, MD 20850
(301) 258-8500
One Liberty Plaza165 BroadwayNew York, NY 10006
(212) 858-4000
Brookfield Place200 Liberty StreetNew York, NY 10281
(212) 416-0600
FINRA DistrictOfficesAtlantaOne Securities Center3490 Piedmont Road, NESuite 500
Atlanta, GA 30305
(404) 239-6100
(404) 237-9290 (fax)
Boca RatonBoca Center Tower 1
5200 Town Center CircleSuite 200
Boca Raton, FL 33486
(561) 443-8000
(561) 443-7995 (fax)
Boston99 High StreetSuite 900
Boston, MA 02110
(617) 532-3400
(617) 451-3524 (fax)
Chicago55 West Monroe StreetSuite 2600
Chicago, IL 60603
(312) 899-4400
(312) 606-0742 (fax)
Dallas12801 North Central ExpresswaySuite 1050
Dallas, TX 75243
(972) 701-8554
(972) 716-7646 (fax)
Denver4600 South Syracuse StreetSuite 1400
Denver, CO 80237
(303) 446-3100
(303) 620-9450 (fax)
Kansas City120 West 12th StreetSuite 800
Kansas City, MO 64105
(816) 421-5700
(816) 421-5029 (fax)
Long IslandTwo Jericho Plaza2nd Floor, Jericho, NY 11753
(516) 827-6100
(516) 827-6101 (fax)
Los Angeles300 South Grand AvenueSuite 1700
Los Angeles, CA 90071
(213) 229-2300
(213) 617-3299 (fax)
New Jersey581 Main StreetSuite 710
Woodbridge, NJ 07095
(732) 596-2000
(732) 596-2001 (fax)
New Orleans1100 Poydras StreetEnergy CentreSuite 850
New Orleans, LA 70163
(504) 522-6527
(504) 522-4077 (fax)
New York CityBrookfield Place200 Liberty StreetNew York, NY 10281
(212) 858-4000
(212) 858-4189 (fax)
Philadelphia1601 Market StreetSuite 2700
Philadelphia, PA 19103
(215) 665-1180
(215) 496-0434 (fax)
San Francisco100 Pine StreetSuite 1800
San Francisco, CA 94111
(415) 217-1100
(301) 527-4800 (fax)
66 FINRA 2018 Annual Financial Report
FINRA MarketRegulationRegional Offices55 West Monroe StreetSuite 2600
Chicago, IL 60603
(312) 899-4504
(312) 236-9257 (fax)
440 South LaSalle StreetSuite 3500
Chicago, IL 60605
One Liberty Plaza165 BroadwayNew York, NY 10006
(212) 858-4000
1601 Market StreetSuite 2700
Philadelphia, PA 19103
(215) 665-1180
(215) 496-0434 (fax)
FINRA DisputeResolutionRegional OfficesMidwest Region55 West Monroe StreetSuite 2600
Chicago, IL 60603
(312) 899-4440
(301) 527-4851 (fax)
Northeast RegionOne Liberty Plaza165 Broadway27th FloorNew York, NY 10006
(212) 858-4200
(301) 527-4873 (fax)
Southeast RegionBoca Center Tower 1
5200 Town Center CircleSuite 200
Boca Raton, FL 33486
(561) 416-0277
(301) 527-4868 (fax)
Western Region300 South Grand AvenueSuite 1700
Los Angeles, CA 90071
(213) 613-2680
(301) 527-4766 (fax)
FINRA 2018 Annual Financial Report 67
68 FINRA2018AnnualFinancialReport
ThisAnnualFinancialReportandtheinformationcontainedhereinisforgeneraleducationalandinformationalpurposesonly.The informationcontainedherein isonlytimelyasofthedateofthis reportandthe information,estimatesandexpressionsofjudgmenthereinaresubjecttochangewithoutnotice.TotheextentthisAnnualFinancialReportcontainsstatementsthatarenotrecitationsofhistoricalfact,suchstatementsmayconstitute“forward-lookingstatements”.Inthisrespect,thewords“estimate,”“project,”“anticipate,”“expect,”“intend,”“believe,”andsimilarexpressionsareintendedtoidentifyforward-lookingstatements.Forward-lookingstatementsarebasedoncurrentexpectationsoffutureeventsandaresubjecttorisksanduncertaintiesthatcouldcauseactualresultstodiffermateriallyfromthoseexpressedorimpliedbysuchstatements.Allforward-lookingstatementsincludedinthisSectionaremadeonlyasofthedateofthestatement,andFINRAassumesnoobligationtoupdateanyforward-lookingstatementsmadebythemasaresultofnewinformation,futureevents,orotherfactors.AlthoughFINRAtakesreasonablecaretoensurethatthe informationcontained intheAnnualFinancialReportisaccurate,theinformationisprovided“asis”andFINRAmakesnorepresentationsorwarranties,expressorimplied,regardingtheinformationcontainedherein,includingbutnotlimitedtoanywarrantiesregardingtheaccuracy,completenessortimelinessoftheinformationprovidedherein.NeitherFINRAnoranyofitsrespectiveaffiliates,directors,officers,registeredrepresentativesoremployees,noranythirdpartyvendor,willbeliableorhaveanyliability,whetherincontract,tort,strictliabilityorotherwise,foranydirect,indirect,incidental,consequential,punitiveorspecialdamagesarisingoutoforinanywayconnectedwithyouraccessoruseorinabilitytoaccessorusetheAnnualFinancialReportorrelianceonitscontent.Personsconsideringormakinginvestmentdecisionsshouldrefertotheannual,quarterlyandcurrentreports,proxystatementsandotherinformationfiledbytheprospectiveinvestmentvehiclewiththeSecuritiesand Exchange Commission (SEC) under the Securities Exchange Act of 1934, as amended. Such reports and otherinformationmaybereadandcopiedattheSEC’sPublicReferenceRoomat100FStreet,N.E.,Washington,DC20549orobtainedbymailfromthePublicReferenceRoomatprescribedrates.SuchreportsandotherinformationarealsoavailableattheSEC’s InternetWebsite,www.sec.gov.ThisAnnualFinancialReportdoesnot incorporatebyreferenceanyotherdocumentorinformation.
©Copyright2019.Financial Industry RegulatoryAuthority, Inc.All RightsReserved.FINRA is a registeredtrademark ofFinancial Industry Regulatory Authority, Inc. No portion of this document may be duplicated, republished, modified,redistributed,ormanipulatedinanyformwithoutpriorwrittenpermissionfromFINRA.


Investor protection. Market integrity. 1735 K Street NWWashington, DC20006-1506
www.finra.org© 2019 FINRA. All rights reserved.FINRA and other trademarks of the Financial Industry Regulatory Authority, Inc. may not be used without permission.19_0088.1—06/19
Recommended