2016
INSIGHT REPORT
SNPTV GUIDE
TV 2016: INSIGHT REPORT2
BROADCASTING ENVIRONMENT
national channels available to DTT viewers of which:
DIGITAL TERRESTRIAL TELEVISION (DTT) CHANNELS
11 HD
24 free channels
6 pay channels.
30
Source: CSA, CNC, DGMIC, A.C.C.e.S, SNPTV –Guide des chaînes numériques 2016
*Excluding local services and channels distributed exclusively outside mainland France.
BROADCASTING ENVIRONMENT
TV 2016: INSIGHT REPORT 3
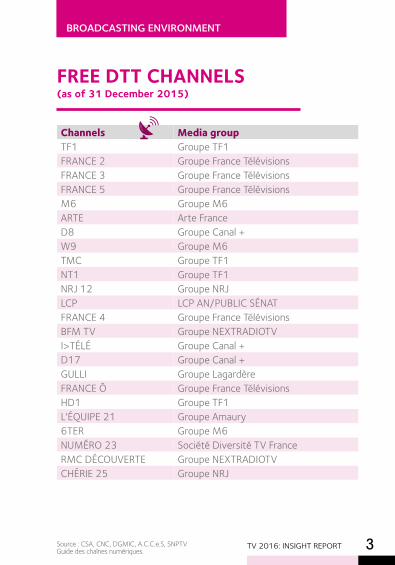
FREE DTT CHANNELS (as of 31 December 2015)
Channels Media groupTF1 Groupe TF1FRANCE 2 Groupe France TélévisionsFRANCE 3 Groupe France TélévisionsFRANCE 5 Groupe France TélévisionsM6 Groupe M6ARTE Arte FranceD8 Groupe Canal +W9 Groupe M6TMC Groupe TF1NT1 Groupe TF1NRJ 12 Groupe NRJ LCP LCP AN/PUBLIC SÉNATFRANCE 4 Groupe France TélévisionsBFM TV Groupe NEXTRADIOTVI>TÉLÉ Groupe Canal +D17 Groupe Canal +GULLI Groupe LagardèreFRANCE Ô Groupe France TélévisionsHD1 Groupe TF1L'ÉQUIPE 21 Groupe Amaury6TER Groupe M6NUMÉRO 23 Société Diversité TV FranceRMC DÉCOUVERTE Groupe NEXTRADIOTVCHÉRIE 25 Groupe NRJ
Source : CSA, CNC, DGMIC, A.C.C.e.S, SNPTVGuide des chaînes numériques.
BROADCASTING ENVIRONMENT
TV 2016: INSIGHT REPORT4
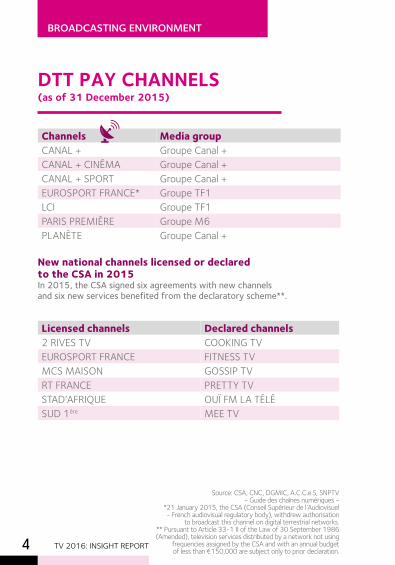
Channels Media groupCANAL + Groupe Canal +CANAL + CINÉMA Groupe Canal +CANAL + SPORT Groupe Canal +EUROSPORT FRANCE* Groupe TF1LCI Groupe TF1PARIS PREMIÈRE Groupe M6PLANÈTE Groupe Canal +
Licensed channels Declared channels2 RIVES TV COOKING TVEUROSPORT FRANCE FITNESS TVMCS MAISON GOSSIP TVRT FRANCE PRETTY TVSTAD’AFRIQUE OUÏ FM LA TÉLÉSUD 1ère MEE TV
DTT PAY CHANNELS (as of 31 December 2015)
New national channels licensed or declared to the CSA in 2015 In 2015, the CSA signed six agreements with new channels and six new services benefited from the declaratory scheme**.
Source: CSA, CNC, DGMIC, A.C.C.e.S, SNPTV - Guide des chaînes numériques -
*21 January 2015, the CSA (Conseil Supérieur de l’Audiovisuel - French audiovisual regulatory body), withdrew authorisation
to broadcast this channel on digital terrestrial networks.** Pursuant to Article 33-1 II of the Law of 30 September 1986 (Amended), television services distributed by a network not using
frequencies assigned by the CSA and with an annual budget of less than €150,000 are subject only to prior declaration.
BROADCASTING ENVIRONMENT
TV 2016: INSIGHT REPORT 5
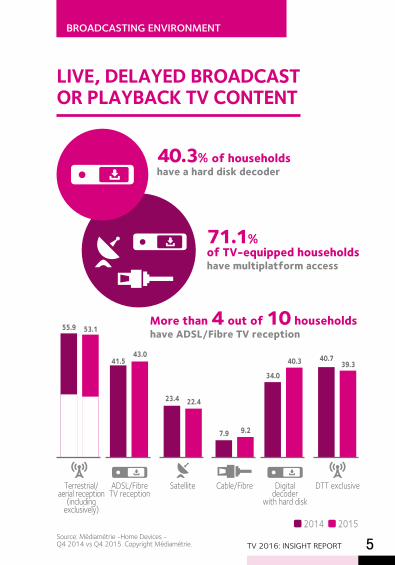
LIVE, DELAYED BROADCAST OR PLAYBACK TV CONTENT
40.3% of householdshave a hard disk decoder
71.1% of TV-equipped householdshave multiplatform access
Source: Médiamétrie -Home Devices - Q4 2014 vs Q4 2015. Copyright Médiamétrie.
9.27.9
Cable/Fibre
22.423.4
Satellite
43.041.5
ADSL/Fibre TV reception
40.3
34.0
Digital decoder
with hard disk
39.340.7
DTT exclusive
More than 4 out of 10 households have ADSL/Fibre TV reception
2014 2015
Terrestrial/ aerial reception
(including exclusively)
53.155.9
excl. 26.4
excl. 28.5
TV 2016: INSIGHT REPORT6
BROADCASTING ENVIRONMENT
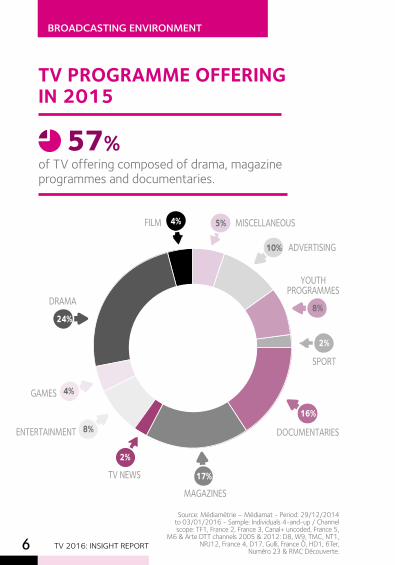
Source: Médiamétrie – Médiamat - Period: 29/12/2014 to 03/01/2016 - Sample: Individuals 4-and-up / Channel scope: TF1, France 2, France 3, Canal+ uncoded, France 5,
M6 & Arte DTT channels 2005 & 2012: D8, W9, TMC, NT1, NRJ12, France 4, D17, Gulli, France Ô, HD1, 6Ter,
Numéro 23 & RMC Découverte.
TV PROGRAMME OFFERING IN 2015
24%
2%
8%
4%
4% 5%
10%
8%
2%
16%
17%
DRAMA
TV NEWS
ENTERTAINMENT
GAMES
ADVERTISING
MISCELLANEOUS
YOUTH PROGRAMMES
SPORT
DOCUMENTARIES
MAGAZINES
FILM
of TV offering composed of drama, magazine programmes and documentaries.
57%
BROADCASTING ENVIRONMENT
TV 2016: INSIGHT REPORT 7
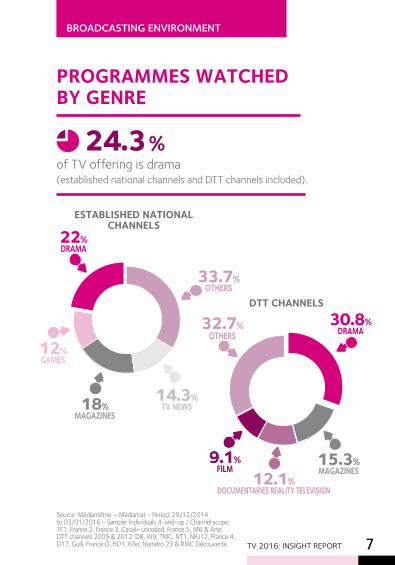
PROGRAMMES WATCHED BY GENRE
of TV offering is drama (established national channels and DTT channels included).
24.3 %
DTT CHANNELS
15.3%MAGAZINES
9.1%FILM
32.7%OTHERS
30.8%DRAMA
12.1%DOCUMENTARIES REALITY TELEVISION
18%MAGAZINES
14.3%TV NEWS
12%GAMES
22%DRAMA
33.7%OTHERS
ESTABLISHED NATIONAL CHANNELS
Source: Médiamétrie – Médiamat - Period: 29/12/2014 to 03/01/2016 - Sample: Individuals 4-and-up / Channel scope: TF1, France 2, France 3, Canal+ uncoded, France 5, M6 & ArteDTT channels 2005 & 2012: D8, W9, TMC, NT1, NRJ12, France 4, D17, Gulli, France Ô, HD1, 6Ter, Numéro 23 & RMC Découverte.
TV 2016: INSIGHT REPORT8
BROADCASTING ENVIRONMENT
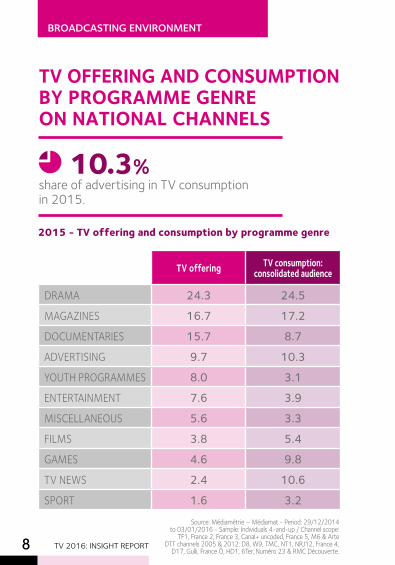
TV OFFERING AND CONSUMPTION BY PROGRAMME GENRE ON NATIONAL CHANNELS
2015 - TV offering and consumption by programme genre
share of advertising in TV consumption in 2015.
10.3%
TV offering TV consumption: consolidated audience
DRAMA 24.3 24.5
MAGAZINES 16.7 17.2
DOCUMENTARIES 15.7 8.7
ADVERTISING 9.7 10.3
YOUTH PROGRAMMES 8.0 3.1
ENTERTAINMENT 7.6 3.9
MISCELLANEOUS 5.6 3.3
FILMS 3.8 5.4
GAMES 4.6 9.8
TV NEWS 2.4 10.6
SPORT 1.6 3.2
Source: Médiamétrie – Médiamat - Period: 29/12/2014 to 03/01/2016 - Sample: Individuals 4-and-up / Channel scope:
TF1, France 2, France 3, Canal+ uncoded, France 5, M6 & ArteDTT channels 2005 & 2012: D8, W9, TMC, NT1, NRJ12, France 4,
D17, Gulli, France Ô, HD1, 6Ter, Numéro 23 & RMC Découverte.
AUDIOVISUAL PRACTICES
TV 2016: INSIGHT REPORT 9
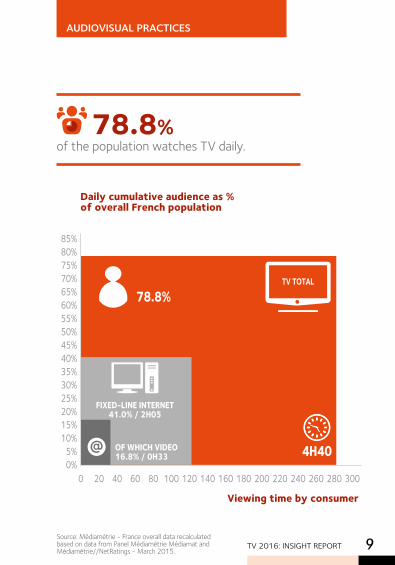
Daily cumulative audience as % of overall French population
Viewing time by consumer
4H40
TV TOTAL
FIXED-LINE INTERNET 41.0% / 2H05
85%80%75%70%65%60%55%50%45%40%35%30%25%20%15%10%
5%0%
0 20 40 60 80 100 120 140 160 180 200 220 240 260 280 300
78.8%
OF WHICH VIDEO16.8% / 0H33
Source: Médiamétrie - France overall data recalculated based on data from Panel Médiamétrie Médiamat and Médiamétrie//NetRatings - March 2015.
of the population watches TV daily.78.8%
TV 2016: INSIGHT REPORT10Source: Médiamétrie - France overall data recalculated
based on data from Panel Médiamétrie Médiamat and Médiamétrie//NetRatings - March 2015.
AUDIOVISUAL PRACTICES
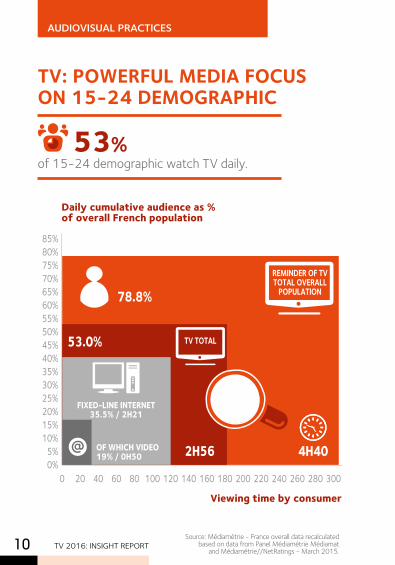
Daily cumulative audience as % of overall French population
Viewing time by consumer
4H402H56
REMINDER OF TV TOTAL OVERALL
POPULATION
TV TOTAL
FIXED-LINE INTERNET 35.5% / 2H21
85%80%75%70%65%60%55%50%45%40%35%30%25%20%15%10%
5%0%
0 20 40 60 80 100 120 140 160 180 200 220 240 260 280 300
78.8%
53.0%
OF WHICH VIDEO 19% / 0H50
TV: POWERFUL MEDIA FOCUS ON 15-24 DEMOGRAPHIC
of 15-24 demographic watch TV daily. 53%
FOCUS ON 15-24
DEMOGRAPHIC
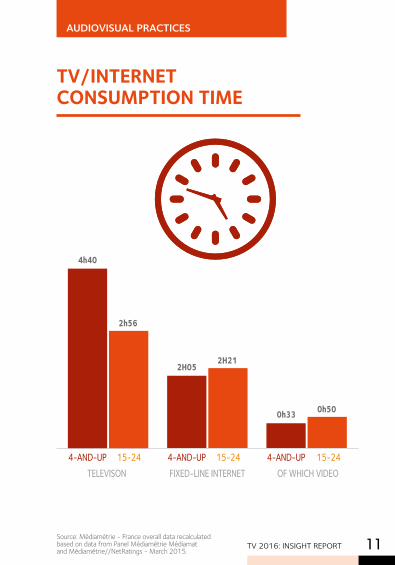
TV/INTERNET CONSUMPTION TIME
TELEVISON FIXED-LINE INTERNET OF WHICH VIDEO
0h33 0h50
2H052H21
4h40
4-AND-UP 4-AND-UP 4-AND-UP
2h56
15-24 15-24 15-24
Source: Médiamétrie - France overall data recalculated based on data from Panel Médiamétrie Médiamat and Médiamétrie//NetRatings - March 2015.
AUDIOVISUAL PRACTICES
TV 2016: INSIGHT REPORT 11
TV 2016: INSIGHT REPORT12
MEDIA PERCEPTION WORLD
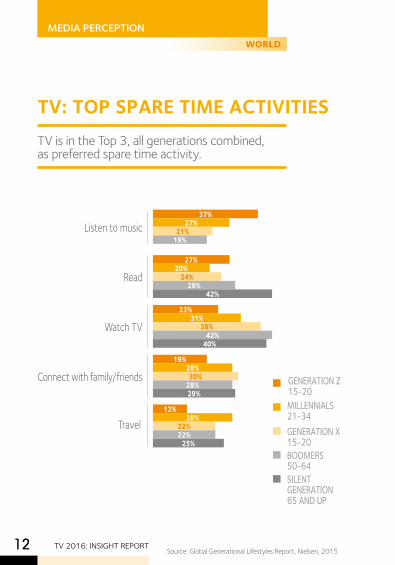
TV: TOP SPARE TIME ACTIVITIESTV is in the Top 3, all generations combined, as preferred spare time activity.
GENERATION Z15-20MILLENNIALS21-34GENERATION X15-20BOOMERS 50-64SILENT GENERATION 65 AND UP
Listen to music37%
27%21%
19%
Read27%
20%24%
29%42%
Watch TV23%
31%38%
42%40%
Connect with family/friends 19%
28%30%
28%29%
12%28%
22%22%
25%
Travel
Source: Global Generational Lifestyles Report, Nielsen, 2015.
MEDIA PERCEPTION
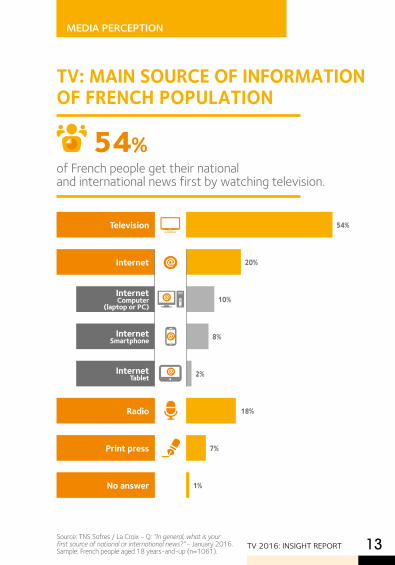
TV 2016: INSIGHT REPORT 13Source: TNS Sofres / La Croix - Q: “In general, what is your first source of national or international news?” - January 2016. Sample: French people aged 18 years-and-up (n=1061).
TV: MAIN SOURCE OF INFORMATION OF FRENCH POPULATION
of French people get their national and international news first by watching television.
54%
InternetComputer
(laptop or PC)
Print press
54%
20%
10%
8%
2%
18%
7%
1%
Television
Internet Tablet
Internet Smartphone
No answer
Radio
Internet
MEDIA PERCEPTION
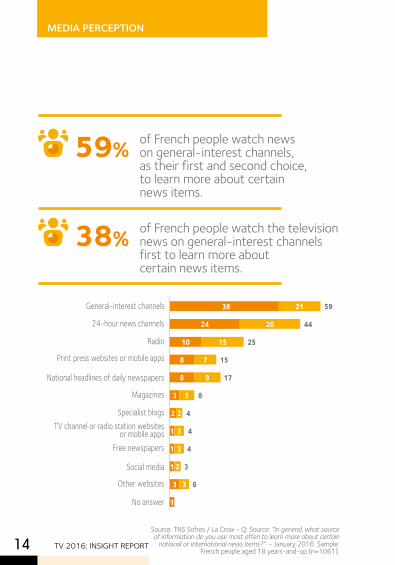
Source: TNS Sofres / La Croix - Q: Source: “In general, what source of information do you use most often to learn more about certain
national or international news items?” - January 2016. Sample: French people aged 18 years-and-up (n=1061).
of French people watch news on general-interest channels, as their first and second choice, to learn more about certain news items.
of French people watch the television news on general-interest channels first to learn more about certain news items.
59%
38%
38
24
10
8
8
3
3
2
1
1
1
1
21 59
44
25
15
17
8
4
4
4
3
6
20
15
7
9
5
2
2
3
3
3
General-interest channels
24-hour news channels
Radio
Print press websites or mobile apps
National headlines of daily newspapers
Magazines
Specialist blogsTV channel or radio station websites
or mobile apps Free newspapers
Social media
Other websites
No answer
TV 2016: INSIGHT REPORT14
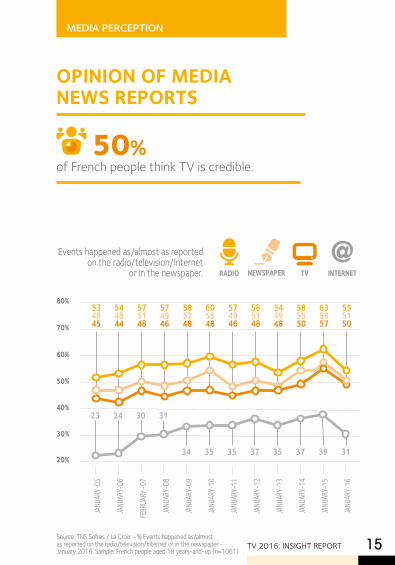
Events happened as/almost as reported on the radio/television/Internet
or in the newspaper.
JANU
ARY-
05
JANU
ARY-
06
FEBR
UARY
-07
JANU
ARY-
08
JANU
ARY-
09
JANU
ARY-
10
JANU
ARY-
11
JANU
ARY-
12
JANU
ARY-
13
JANU
ARY-
14
JANU
ARY-
15
JANU
ARY-
16
20%
30%
40%
50%
60%
80%
RADIO TVNEWSPAPER INTERNET
70%
23 24 30 31
3534 35 37 35 37 3139
534845
544844
575148
574946
585248
605548
574946
585148
544948
585550
555150
635857
OPINION OF MEDIA NEWS REPORTS
of French people think TV is credible. 50%
MEDIA PERCEPTION
TV 2016: INSIGHT REPORT 15Source: TNS Sofres / La Croix - % Events happened as/almost as reported on the radio/television/Internet or in the newspaper - January 2016. Sample: French people aged 18 years-and-up (n=1061)
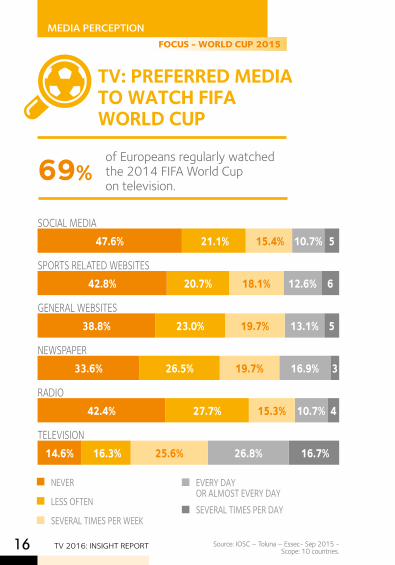
TV 2016: INSIGHT REPORT16 Source: IOSC – Toluna – Essec- Sep 2015 - Scope: 10 countries.
MEDIA PERCEPTION
of Europeans regularly watched the 2014 FIFA World Cup on television.
69%
TV: PREFERRED MEDIA TO WATCH FIFA WORLD CUP
NEVER
LESS OFTEN
SEVERAL TIMES PER WEEK
EVERY DAY OR ALMOST EVERY DAYSEVERAL TIMES PER DAY
510.7% 15.4% 21.1%47.6%
612.6%18.1%20.7%42.8%
513.1%19.7%23.0%38.8%
316.9%19.7%26.5%33.6%
410.7%15.3%27.7%42.4%
16.7%26.8%25.6% 16.3%14.6%TELEVISION
GENERAL WEBSITES
SOCIAL MEDIA
NEWSPAPER
SPORTS RELATED WEBSITES
RADIO
FOCUS - WORLD CUP 2015
MEDIA PERCEPTION FOCUS - WORLD CUP 2015
TV 2016: INSIGHT REPORT 17
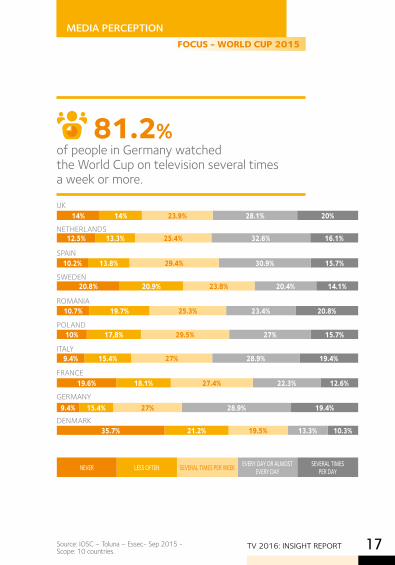
of people in Germany watched the World Cup on television several times a week or more.
81.2%
20%28.1%23.9%14%14%
16.1%32.6%25.4%13.3%12.5%
15.7%30.9%29.4%13.8%10.2%
20.8%23.4%25.3%19.7%10.7%
15.7%27%29.5%17,8%10%
19.4%28.9%27%15.4%9.4%
19.4%28.9%27%15.4%9.4%
14.1%20.4%23.8%20.9%20.8%
10.3%13.3%19.5%21.2%35.7%
SEVERAL TIMES PER DAY
EVERY DAY OR ALMOST EVERY DAYSEVERAL TIMES PER WEEKLESS OFTENNEVER
12.6%22.3%27.4%18.1%19.6%
UK
NETHERLANDS
SPAIN
SWEDEN
ROMANIA
POLAND
ITALY
FRANCE
GERMANY
DENMARK
Source: IOSC – Toluna – Essec- Sep 2015 - Scope: 10 countries.
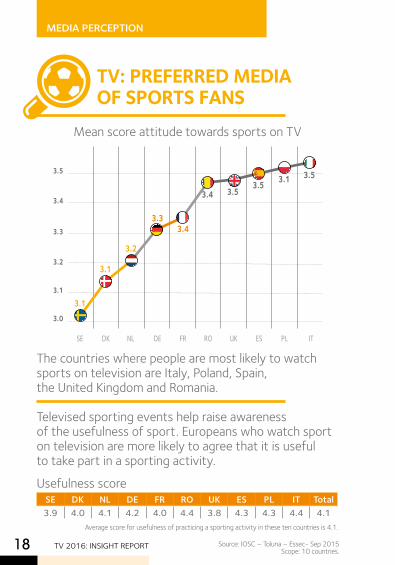
TV 2016: INSIGHT REPORT18 Source: IOSC – Toluna – Essec- Sep 2015 Scope: 10 countries.
MEDIA PERCEPTION
The countries where people are most likely to watch sports on television are Italy, Poland, Spain, the United Kingdom and Romania.
Televised sporting events help raise awareness of the usefulness of sport. Europeans who watch sport on television are more likely to agree that it is useful to take part in a sporting activity.
Usefulness score
TV: PREFERRED MEDIA OF SPORTS FANS
Average score for usefulness of practicing a sporting activity in these ten countries is 4.1.
3.5
3.4
3.3
3.2
3.1
3.0
UKNL ESSE RO PL ITFRDEDK
3.1
3.1
3.2
3.33.4
3.4 3.53.5 3.1 3.5
Mean score attitude towards sports on TV
Country
Estim
ated
marg
inal m
eans
SE DK NL DE FR RO UK ES PL IT Total 3.9 4.0 4.1 4.2 4.0 4.4 3.8 4.3 4.3 4.4 4.1
Mean score attitude towards sports on TV
TV 2016: INSIGHT REPORT 19
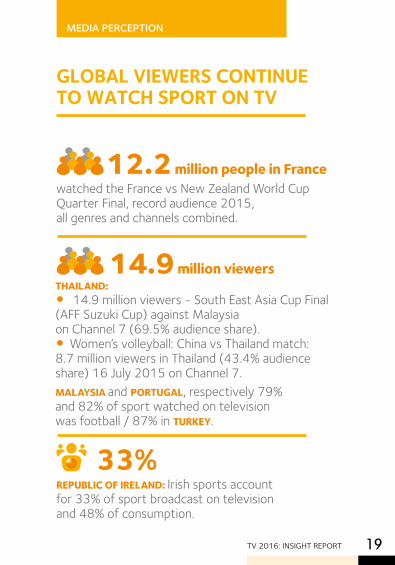
GLOBAL VIEWERS CONTINUE TO WATCH SPORT ON TV
watched the France vs New Zealand World Cup Quarter Final, record audience 2015, all genres and channels combined.
REPUBLIC OF IRELAND: Irish sports account for 33% of sport broadcast on television and 48% of consumption.
THAILAND:• 14.9 million viewers - South East Asia Cup Final (AFF Suzuki Cup) against Malaysia on Channel 7 (69.5% audience share). • Women’s volleyball: China vs Thailand match: 8.7 million viewers in Thailand (43.4% audience share) 16 July 2015 on Channel 7.MALAYSIA and PORTUGAL, respectively 79% and 82% of sport watched on television was football / 87% in TURKEY.
33%
MEDIA PERCEPTION
12.2 million people in France
14.9 million viewers
TV 2016: INSIGHT REPORT20 Source: Yearly Sport Fact 2015 - Eurodata TV Médiamétrie.
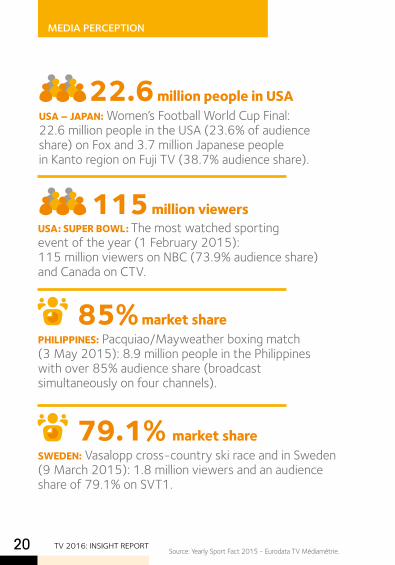
USA – JAPAN: Women’s Football World Cup Final: 22.6 million people in the USA (23.6% of audience share) on Fox and 3.7 million Japanese people in Kanto region on Fuji TV (38.7% audience share).
USA: SUPER BOWL: The most watched sporting event of the year (1 February 2015): 115 million viewers on NBC (73.9% audience share) and Canada on CTV.
22.6 million people in USA
115 million viewers
85% market share
79.1% market share
PHILIPPINES: Pacquiao/Mayweather boxing match (3 May 2015): 8.9 million people in the Philippines with over 85% audience share (broadcast simultaneously on four channels).
SWEDEN: Vasalopp cross-country ski race and in Sweden (9 March 2015): 1.8 million viewers and an audience share of 79.1% on SVT1.
MEDIA PERCEPTION
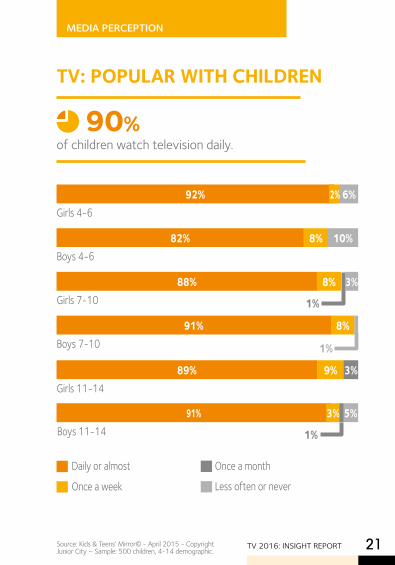
Daily or almost
Once a week
Once a month
Less often or never
Girls 11-1489% 9%
Boys 4-682% 8% 10%
1%
8%Boys 7-10
91%
1%Girls 7-1088% 8%
1%Boys 11-1491% 3% 5%
Girls 4-692% 2% 6%
3%
3%
MEDIA PERCEPTION
TV 2016: INSIGHT REPORT 21
of children watch television daily.
TV: POPULAR WITH CHILDREN
90%
Source: Kids & Teens’ Mirror© - April 2015 - Copyright Junior City – Sample: 500 children, 4-14 demographic.
TV 2016: INSIGHT REPORT22
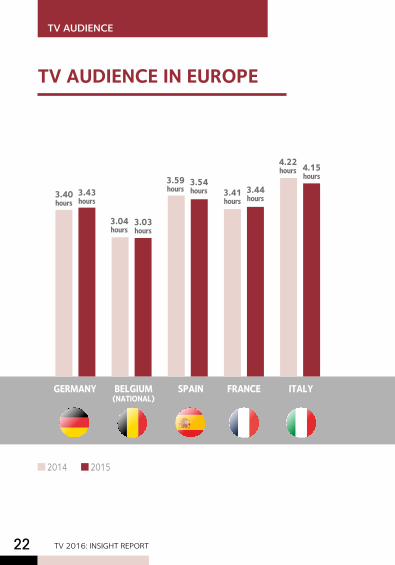
TV AUDIENCE IN EUROPE
3.43 hours
3.40 hours
GERMANY BELGIUM SPAIN FRANCE ITALY (NATIONAL)
3.04 hours
3.03 hours
3.59 hours
3.54 hours 3.41
hours3.44 hours
4.22 hours 4.15
hours
2014 2015
AUDIENCE TVTV AUDIENCE
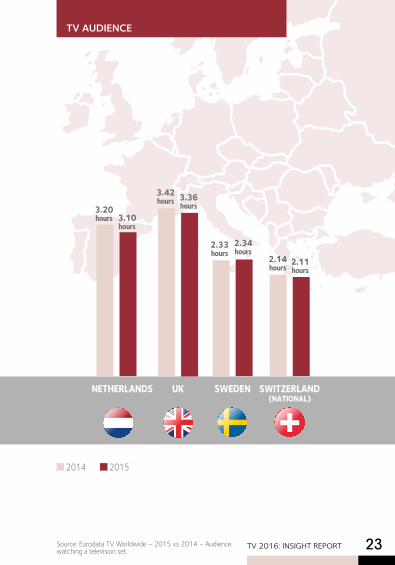
TV 2016: INSIGHT REPORT 23Source: Eurodata TV Worldwide – 2015 vs 2014 – Audience watching a television set.
2.33 hours
2.34 hours
3.20 hours 3.10
hours
3.42 hours 3.36
hours
2.14 hours
2.11 hours
NETHERLANDS UK SWEDEN SWITZERLAND (NATIONAL)
AUDIENCE TVTV AUDIENCE
2014 2015
TV 2016: INSIGHT REPORT24
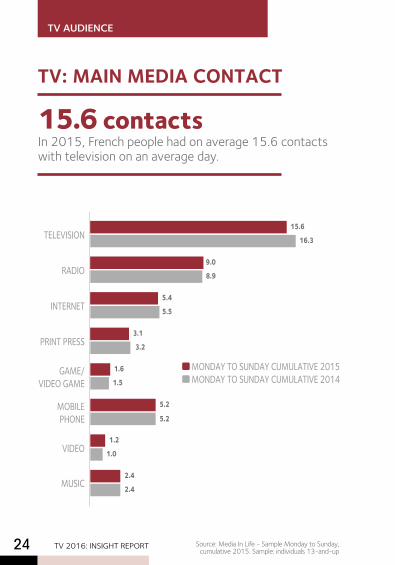
In 2015, French people had on average 15.6 contacts with television on an average day.
15.6 contacts
Source: Media In Life - Sample Monday to Sunday, cumulative 2015. Sample: individuals 13-and-up
TV: MAIN MEDIA CONTACT
MONDAY TO SUNDAY CUMULATIVE 2015 MONDAY TO SUNDAY CUMULATIVE 2014
RADIO 8.9
9.0
TELEVISION 16.3
15.6
INTERNET 5.5
3.1PRINT PRESS
1.5
1.6GAME/VIDEO GAME
1.0
1.2VIDEO
2.4
2.4MUSIC
5.2
5.2MOBILE PHONE
5.4
3.2
AUDIENCE TVTV AUDIENCE
TV 2016: INSIGHT REPORT 25
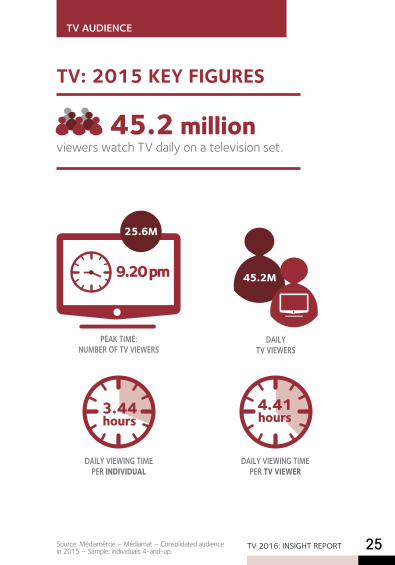
TV: 2015 KEY FIGURES
Source: Médiamétrie – Médiamat – Consolidated audience in 2015 – Sample: individuals 4-and-up.
viewers watch TV daily on a television set.45.2 million
DAILY VIEWING TIME PER TV VIEWER
3.44 hours
4.41 hours
DAILY VIEWING TIME PER INDIVIDUAL
45.2M
DAILY TV VIEWERS
9.20 pm
PEAK TIME: NUMBER OF TV VIEWERS
25.6M
AUDIENCE TVTV AUDIENCE
TV 2016: INSIGHT REPORT26
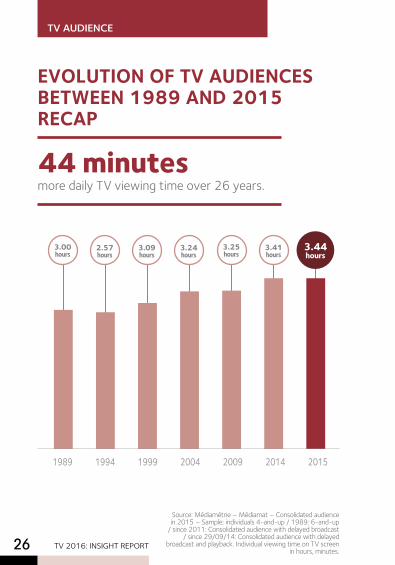
Source: Médiamétrie – Médiamat – Consolidated audience in 2015 – Sample: individuals 4-and-up / 1989: 6-and-up
/ since 2011: Consolidated audience with delayed broadcast / since 29/09/14: Consolidated audience with delayed
broadcast and playback. Individual viewing time on TV screen in hours, minutes.
EVOLUTION OF TV AUDIENCES BETWEEN 1989 AND 2015 RECAP
more daily TV viewing time over 26 years.44 minutes
1989 1994 1999 2004 2009 2014 2015
3.44hours
3.00 hours
2.57 hours
3.09 hours
3.24 hours
3.25 hours
3.41 hours
AUDIENCE TVTV AUDIENCE
TV 2016: INSIGHT REPORT 27
AUDIENCE TVTV AUDIENCE
50,0
40,0
30,0
20,0
10,0
0,0
3.00 -
3.15
AM
4.00 -
4.15
AM
5.00 -
5.15
AM
6.00 -
6.15
AM
7.00 -
7.15
AM
8.00 -
8.15 A
M
9.00 -
9.15 A
M
10.00
-10.1
5 AM
11.00
-11.1
5 AM
12.00
-12.1
5 PM
1.00 -
1.15 P
M
2.00 -
2.15 P
M
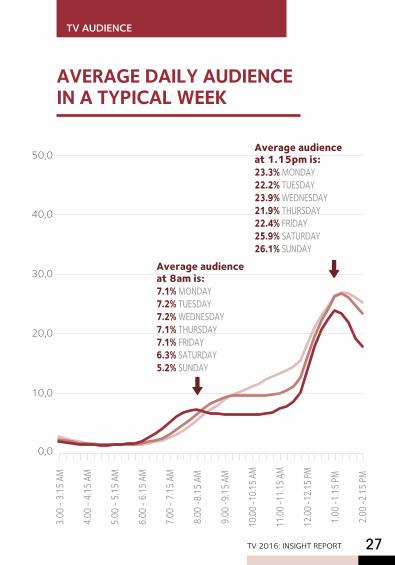
Average audience at 8am is:7.1% MONDAY7.2% TUESDAY7.2% WEDNESDAY7.1% THURSDAY7.1% FRIDAY6.3% SATURDAY5.2% SUNDAY
Average audience at 1.15pm is:23.3% MONDAY22.2% TUESDAY23.9% WEDNESDAY21.9% THURSDAY22.4% FRIDAY25.9% SATURDAY26.1% SUNDAY
AVERAGE DAILY AUDIENCE IN A TYPICAL WEEK
TV 2016: INSIGHT REPORT28
AUDIENCE TVTV AUDIENCE3.0
0 - 3.
15 PM
4.00 -
4.15
PM
5.00 -
5.15
PM
6.00 -
6.15
PM
7.00 -
7.15
PM
8.00 -
8.15
PM
9.00 -
9.15
PM
10.00
- 10.1
5 PM
11.00
- 11.1
5 PM
0.00 -
0.15
AM
1.00 -
1.15
AM
2.00 -
2.15
AM
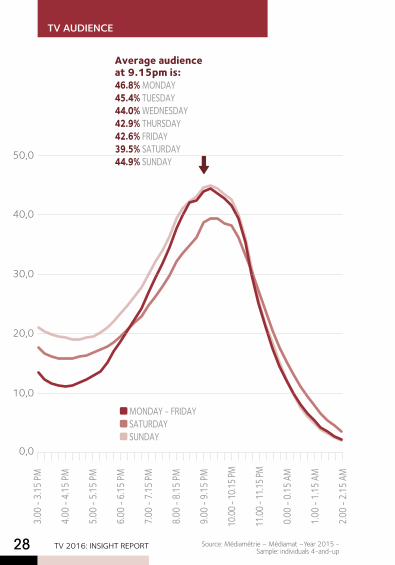
Average audience at 9.15pm is:46.8% MONDAY45.4% TUESDAY44.0% WEDNESDAY42.9% THURSDAY42.6% FRIDAY39.5% SATURDAY44.9% SUNDAY
MONDAY - FRIDAY SATURDAY SUNDAY
50,0
40,0
30,0
20,0
10,0
0,0
Source: Médiamétrie – Médiamat –Year 2015 - Sample: individuals 4-and-up
TV 2016: INSIGHT REPORT 29
AUDIENCE TVTV AUDIENCE
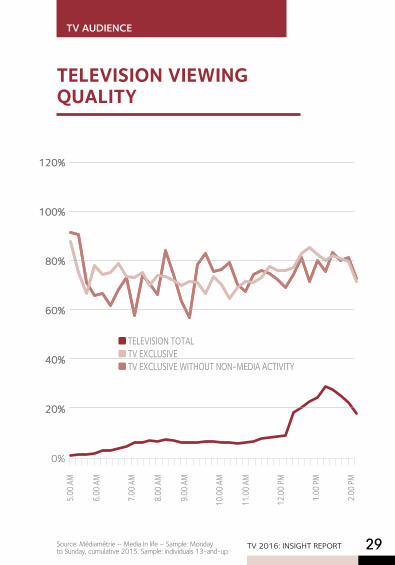
TELEVISION TOTAL TV EXCLUSIVE TV EXCLUSIVE WITHOUT NON-MEDIA ACTIVITY
5.00 A
M
6.00 A
M
7.00 A
M
8.00 A
M
9.00 A
M
10.00
AM
11.00
AM
12.00
PM
1.00 P
M
2.00 P
M
0%
20%
40%
60%
80%
120%
100%
20%
40%
60%
80%
120%
100%
TELEVISION VIEWING QUALITY
Source: Médiamétrie – Media In life – Sample: Monday to Sunday, cumulative 2015. Sample: individuals 13-and-up.
TV 2016: INSIGHT REPORT30
AUDIENCE TVTV AUDIENCE
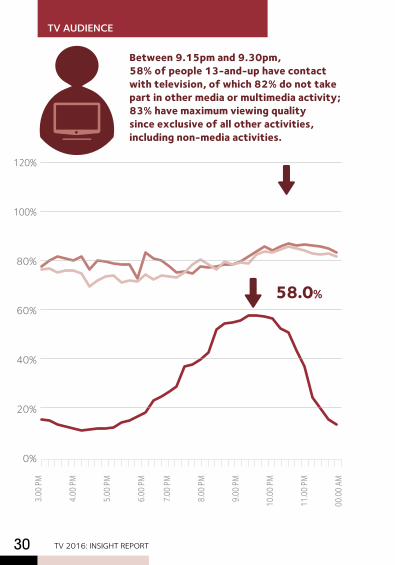
Between 9.15pm and 9.30pm, 58% of people 13-and-up have contact with television, of which 82% do not take part in other media or multimedia activity; 83% have maximum viewing quality since exclusive of all other activities, including non-media activities.
3.00 P
M
4.00 P
M
5.00 P
M
6.00 P
M
7.00 P
M
8.00 P
M
9.00 P
M
10.00
PM
11.00
PM
00.00
AM
58.0%
0%
20%
40%
60%
80%
120%
100%
ADVERTISING MARKET
TV 2016: INSIGHT REPORT 31
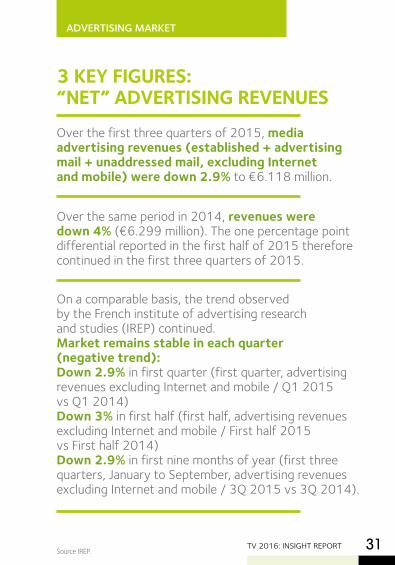
3 KEY FIGURES: “NET” ADVERTISING REVENUES
Source IREP.
Over the first three quarters of 2015, media advertising revenues (established + advertising mail + unaddressed mail, excluding Internet and mobile) were down 2.9% to €6.118 million.
Over the same period in 2014, revenues were down 4% (€6.299 million). The one percentage point differential reported in the first half of 2015 therefore continued in the first three quarters of 2015.
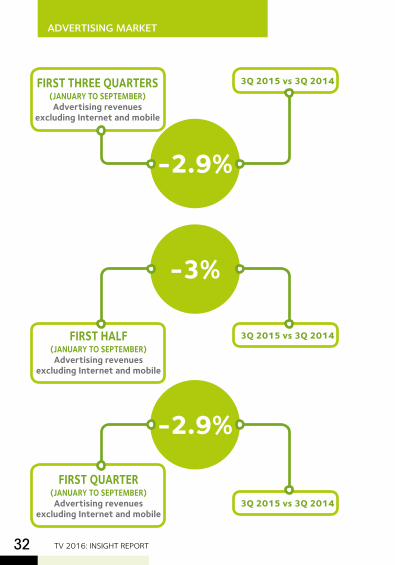
On a comparable basis, the trend observed by the French institute of advertising research and studies (IREP) continued.Market remains stable in each quarter (negative trend):Down 2.9% in first quarter (first quarter, advertising revenues excluding Internet and mobile / Q1 2015 vs Q1 2014)Down 3% in first half (first half, advertising revenues excluding Internet and mobile / First half 2015 vs First half 2014)Down 2.9% in first nine months of year (first three quarters, January to September, advertising revenues excluding Internet and mobile / 3Q 2015 vs 3Q 2014).
ADVERTISING MARKET
TV 2016: INSIGHT REPORT32
3Q 2015 vs 3Q 2014 FIRST HALF (JANUARY TO SEPTEMBER)Advertising revenues
excluding Internet and mobile
-3%
3Q 2015 vs 3Q 2014FIRST THREE QUARTERS (JANUARY TO SEPTEMBER)Advertising revenues
excluding Internet and mobile
-2.9%
3Q 2015 vs 3Q 2014
FIRST QUARTER (JANUARY TO SEPTEMBER)Advertising revenues
excluding Internet and mobile
-2.9%
TV 2016: INSIGHT REPORT 33
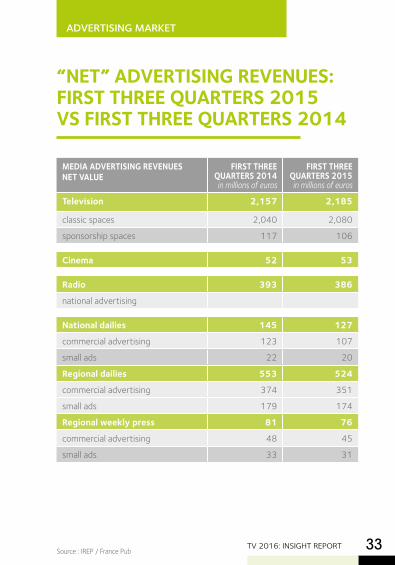
“NET” ADVERTISING REVENUES: FIRST THREE QUARTERS 2015 VS FIRST THREE QUARTERS 2014
Source : IREP / France Pub
MEDIA ADVERTISING REVENUES NET VALUE
FIRST THREE QUARTERS 2014 in millions of euros
FIRST THREE QUARTERS 2015 in millions of euros
Television 2,157 2,185
classic spaces 2,040 2,080
sponsorship spaces 117 106
Cinema 52 53
Radio 393 386
national advertising
National dailies 145 127
commercial advertising 123 107
small ads 22 20
Regional dailies 553 524
commercial advertising 374 351
small ads 179 174
Regional weekly press 81 76
commercial advertising 48 45
small ads 33 31
ADVERTISING MARKET
TV 2016: INSIGHT REPORT34* This indicator only takes into account distribution revenues
and does not include production and consulting.
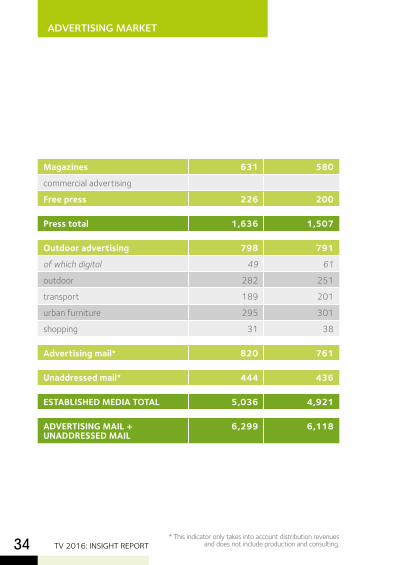
Magazines 631 580
commercial advertising
Free press 226 200
Press total 1,636 1,507
Outdoor advertising 798 791
of which digital 49 61
outdoor 282 251
transport 189 201
urban furniture 295 301
shopping 31 38
Advertising mail* 820 761
Unaddressed mail* 444 436
ESTABLISHED MEDIA TOTAL 5,036 4,921
ADVERTISING MAIL + UNADDRESSED MAIL
6,299 6,118
ADVERTISING MARKET
CROSS-MEDIA ADVERTISING MARKET
TV 2016: INSIGHT REPORT 35
CROSS-MEDIA ADVERTISING MARKET - ADVERTISING FIGURES AND TRENDS IN NET VALUE
invested by advertisers in 2015 all media combined.
€9.3 billion net (down 0.6%)
METHODOLOGICAL NOTEAdTrends combines raw data from Kantar Media with net data from France Pub. The raw/net conversion is performed monthly based on modelling that takes into account France Pub key conversion data calculated per media and per advertiser grouping. Media scope: Press excluding trade press; television excluding sponsorship; outdoor advertising only in large-format segments; urban furniture and transport; Internet (display and search); radio and cinema. These initial trends were identified based on the results from first 11 months of the year and an estimate for December 2015.
NB:
Source: Kantar Media - AdTrends.
CROSS-MEDIA ADVERTISING MARKET
TV 2016: INSIGHT REPORT36
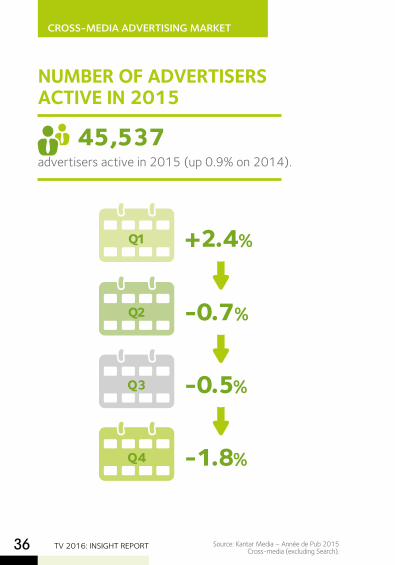
NUMBER OF ADVERTISERS ACTIVE IN 2015
advertisers active in 2015 (up 0.9% on 2014).45,537
+2.4%
-0.7%
-0.5%
-1.8%
Source: Kantar Media – Année de Pub 2015 Cross-media (excluding Search).
Q1
Q2
Q3
Q4
CROSS-MEDIA ADVERTISING MARKET
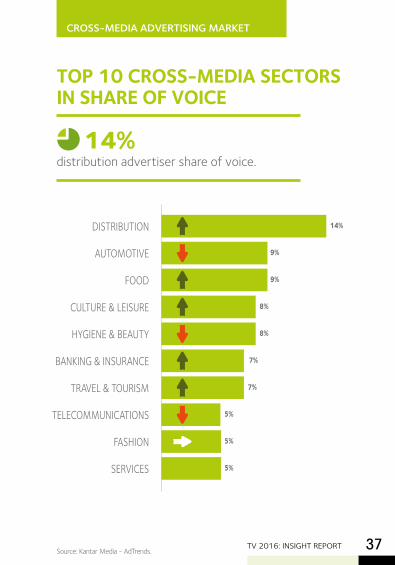
DISTRIBUTION
AUTOMOTIVE
FOOD
CULTURE & LEISURE
HYGIENE & BEAUTY
BANKING & INSURANCE
TRAVEL & TOURISM
TELECOMMUNICATIONS
FASHION
SERVICES
TOP 10 CROSS-MEDIA SECTORS IN SHARE OF VOICE
distribution advertiser share of voice.14%
TV 2016: INSIGHT REPORT 37
14%
9%
9%
8%
8%
7%
7%
5%
5%
5%
Source: Kantar Media - AdTrends.
Source : Kantar Media - Current cross-media.
ADVERTISING MARKET - TTV
TV 2016: INSIGHT REPORT38
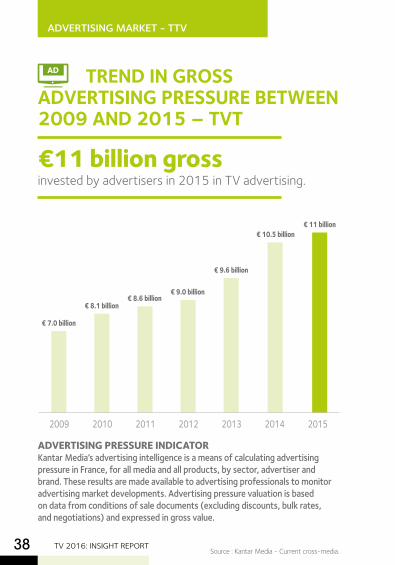
TREND IN GROSS ADVERTISING PRESSURE BETWEEN 2009 AND 2015 – TVT
2009 2010 2011 2012 2013 2014 2015
invested by advertisers in 2015 in TV advertising.€11 billion gross
AD
€ 7.0 billion
€ 8.1 billion€ 8.6 billion
€ 9.0 billion
€ 9.6 billion
€ 10.5 billion€ 11 billion
ADVERTISING PRESSURE INDICATORKantar Media’s advertising intelligence is a means of calculating advertising pressure in France, for all media and all products, by sector, advertiser and brand. These results are made available to advertising professionals to monitor advertising market developments. Advertising pressure valuation is based on data from conditions of sale documents (excluding discounts, bulk rates, and negotiations) and expressed in gross value.
ADVERTISING MARKET - TTV
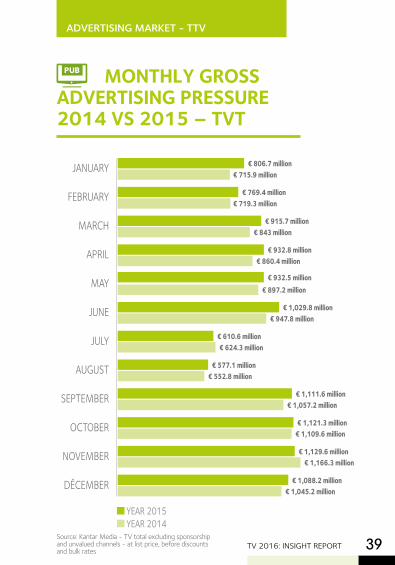
JANUARY
FEBRUARY
MARCH
APRIL
MAY
JUNE
JULY
AUGUST
SEPTEMBER
OCTOBER
NOVEMBER
DÉCEMBER
YEAR 2015 YEAR 2014
€ 715.9 million
€ 719.3 million
€ 843 million
€ 860.4 million
€ 897.2 million
€ 947.8 million
€ 624.3 million
€ 552.8 million
€ 1,057.2 million
€ 1,109.6 million
€ 1,166.3 million
€ 1,045.2 million
€ 806.7 million
€ 769.4 million
€ 915.7 million
€ 932.8 million
€ 932.5 million
€ 1,029.8 million
€ 610.6 million
€ 577.1 million
€ 1,111.6 million
€ 1,121.3 million
€ 1,129.6 million
€ 1,088.2 million
MONTHLY GROSS ADVERTISING PRESSURE 2014 VS 2015 – TVT
TV 2016: INSIGHT REPORT 39Source: Kantar Media - TV total excluding sponsorship and unvalued channels - at list price, before discounts and bulk rates
PUB
Source: Kantar Media - TV total excluding sponsorship and unvalued channels - at list price, before discounts and bulk rates.
ADVERTISING MARKET - TTV
TV 2016: INSIGHT REPORT40
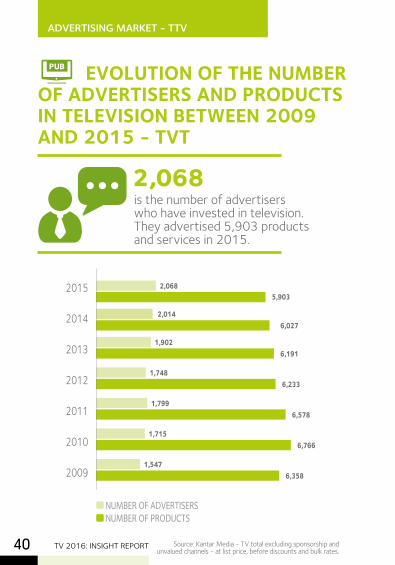
EVOLUTION OF THE NUMBER OF ADVERTISERS AND PRODUCTS IN TELEVISION BETWEEN 2009 AND 2015 - TVT
NUMBER OF ADVERTISERS NUMBER OF PRODUCTS
is the number of advertisers who have invested in television. They advertised 5,903 products and services in 2015.
2,068
2015
2014
2013
2012
2011
2010
2009
1,902
2,014
1,748
1,799
1,715
1,547
2,068
6,191
6,027
6,233
6,578
6,766
6,358
5,903
PUB
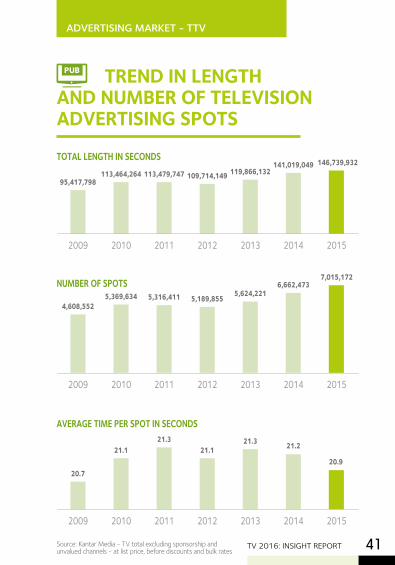
TREND IN LENGTH AND NUMBER OF TELEVISION ADVERTISING SPOTS
ADVERTISING MARKET - TTV
TV 2016: INSIGHT REPORT 41
2009 2010 2011 2012 2013 2014 2015
2009 2010 2011 2012 2013 2014 2015
2009 2010 2011 2012 2013 2014 2015
146,739,932
95,417,798113,464,264 113,479,747 109,714,149 119,866,132
141,019,049
7,015,172
20.9
4,608,552
20.7
5,369,634
21.1
5,316,411
21.3
5,189,855
21.1
5,624,2216,662,473
21.3 21.2
TOTAL LENGTH IN SECONDS
NUMBER OF SPOTS
AVERAGE TIME PER SPOT IN SECONDS
PUB
Source: Kantar Media - TV total excluding sponsorship and unvalued channels - at list price, before discounts and bulk rates
Source: Kantar Media - TV total excluding sponsorship and unvalued channels - at list price, before discounts and bulk rates
ADVERTISING MARKET - TTV
TV 2016: INSIGHT REPORT42
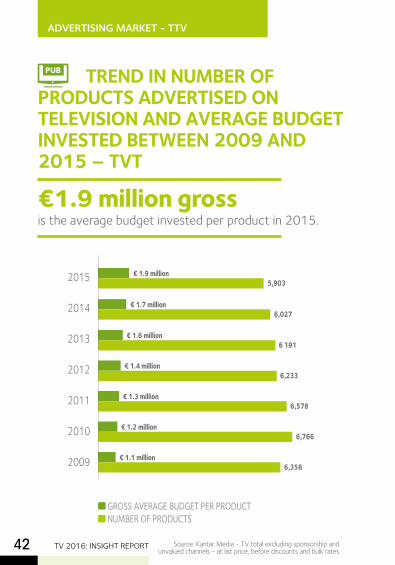
TREND IN NUMBER OF PRODUCTS ADVERTISED ON TELEVISION AND AVERAGE BUDGET INVESTED BETWEEN 2009 AND 2015 – TVT
PUB
is the average budget invested per product in 2015.€1.9 million gross
2015
2014
2013
2012
2011
2010
2009
GROSS AVERAGE BUDGET PER PRODUCT NUMBER OF PRODUCTS
€ 1.6 million
€ 1.7 million
€ 1.9 million
€ 1.4 million
€ 1.3 million
€ 1.2 million
€ 1.1 million
6 191
6,027
5,903
6,233
6,578
6,766
6,358
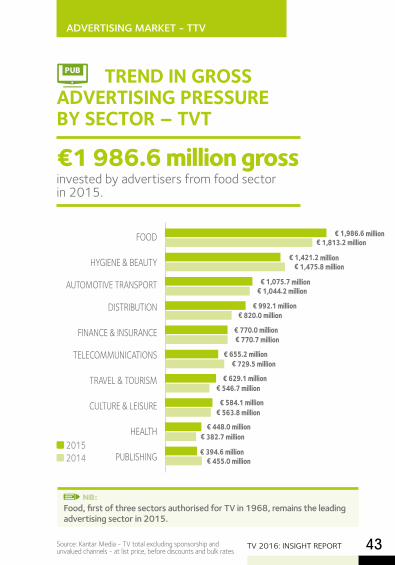
FOOD
HYGIENE & BEAUTY
AUTOMOTIVE TRANSPORT
DISTRIBUTION
FINANCE & INSURANCE
TELECOMMUNICATIONS
TRAVEL & TOURISM
CULTURE & LEISURE
HEALTH
PUBLISHING 2015 2014
€ 1,813.2 million€ 1,986.6 million
€ 1,475.8 million
€ 1,044.2 million
€ 820.0 million
€ 770.7 million
€ 729.5 million
€ 546.7 million
€ 563.8 million
€ 382.7 million
€ 455.0 million
€ 1,421.2 million
€ 1,075.7 million
€ 992.1 million
€ 770.0 million
€ 655.2 million
€ 629.1 million
€ 584.1 million
€ 448.0 million
€ 394.6 million
TREND IN GROSS ADVERTISING PRESSURE BY SECTOR – TVT
invested by advertisers from food sector in 2015.
€1 986.6 million gross
ADVERTISING MARKET - TTV
TV 2016: INSIGHT REPORT 43
Food, first of three sectors authorised for TV in 1968, remains the leading advertising sector in 2015.
NB:
Source: Kantar Media - TV total excluding sponsorship and unvalued channels - at list price, before discounts and bulk rates
PUB
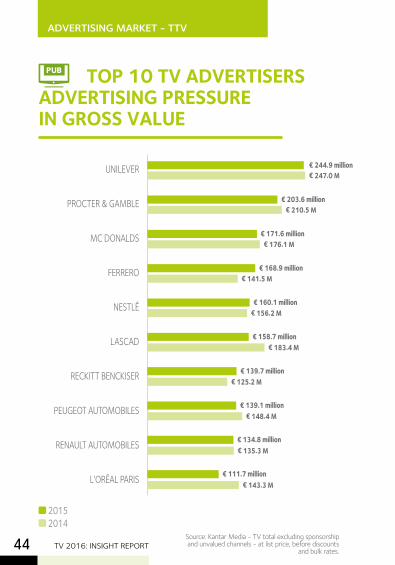
€ 247.0 M€ 244.9 million
€ 210.5 M
€ 176.1 M
€ 141.5 M
€ 156.2 M
€ 183.4 M
€ 125.2 M
€ 148.4 M
€ 135.3 M
€ 143.3 M
€ 203.6 million
€ 171.6 million
€ 168.9 million
€ 160.1 million
€ 158.7 million
€ 139.7 million
€ 139.1 million
€ 134.8 million
€ 111.7 million
Source: Kantar Media - TV total excluding sponsorship and unvalued channels - at list price, before discounts
and bulk rates.
TOP 10 TV ADVERTISERS ADVERTISING PRESSURE IN GROSS VALUE
UNILEVER
PROCTER & GAMBLE
MC DONALDS
FERRERO
NESTLÉ
LASCAD
RECKITT BENCKISER
PEUGEOT AUTOMOBILES
RENAULT AUTOMOBILES
L‘ORÉAL PARIS
2015 2014
ADVERTISING MARKET - TTV
TV 2016: INSIGHT REPORT44
PUB
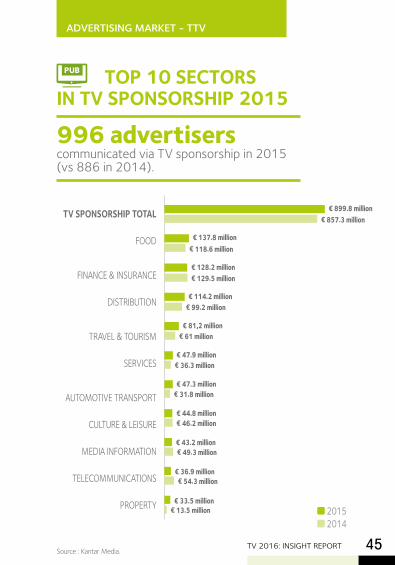
TV SPONSORSHIP TOTAL
FOOD
FINANCE & INSURANCE
DISTRIBUTION
TRAVEL & TOURISM
SERVICES
AUTOMOTIVE TRANSPORT
CULTURE & LEISURE
MEDIA INFORMATION
TELECOMMUNICATIONS
PROPERTY 2015 2014
€ 857.3 million€ 899.8 million
€ 118.6 million
€ 129.5 million
€ 99.2 million
€ 61 million
€ 36.3 million
€ 31.8 million
€ 46.2 million
€ 49.3 million
€ 54.3 million
€ 13.5 million
€ 137.8 million
€ 128.2 million
€ 114.2 million
€ 81,2 million
€ 47.9 million
€ 47.3 million
€ 44.8 million
€ 43.2 million
€ 36.9 million
€ 33.5 million
ADVERTISING MARKET - TTV
TV 2016: INSIGHT REPORT 45
communicated via TV sponsorship in 2015 (vs 886 in 2014).
996 advertisers
Source : Kantar Media.
TOP 10 SECTORS IN TV SPONSORSHIP 2015
PUB
Source: Kantar Media - TV total excluding sponsorship and unvalued channels - at list price, before discounts
and bulk rates.
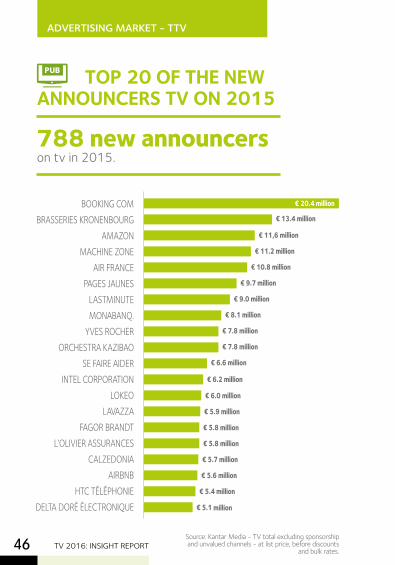
BOOKING COM BRASSERIES KRONENBOURG
AMAZON MACHINE ZONE
AIR FRANCE PAGES JAUNES
LASTMINUTE MONABANQ.
YVES ROCHER ORCHESTRA KAZIBAO
SE FAIRE AIDER INTEL CORPORATION
LOKEO LAVAZZA
FAGOR BRANDT L’OLIVIER ASSURANCES
CALZEDONIA AIRBNB
HTC TÉLÉPHONIE DELTA DORÉ ÉLECTRONIQUE
TOP 20 OF THE NEW ANNOUNCERS TV ON 2015
€ 6.2 million
€ 6.0 million
€ 5.9 million
€ 5.8 million
€ 5.8 million
€ 5.7 million
€ 5.6 million
€ 5.4 million
€ 5.1 million
€ 13.4 million
€ 11,6 million
€ 11.2 million
€ 10.8 million
€ 9.7 million
€ 9.0 million
€ 8.1 million
€ 7.8 million
€ 7.8 million
€ 6.6 million
€ 20.4 million
ADVERTISING MARKET - TTV
TV 2016: INSIGHT REPORT46
on tv in 2015.788 new announcers
PUB
Source: Kantar Media - TV total excluding sponsorship and unvalued channels - at list price, before discounts and bulk rates.
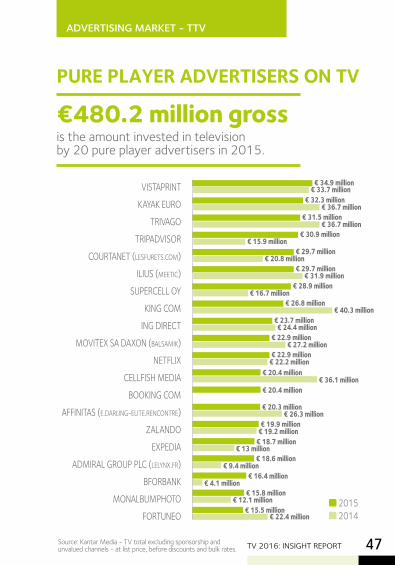
VISTAPRINT KAYAK EURO
TRIVAGO TRIPADVISOR
COURTANET (LESFURETS.COM) ILIUS (MEETIC)
SUPERCELL OY KING COM
ING DIRECT MOVITEX SA DAXON (BALSAMIK)
NETFLIX CELLFISH MEDIA
BOOKING COM AFFINITAS (E.DARLING-ELITE.RENCONTRE)
ZALANDO EXPEDIA
ADMIRAL GROUP PLC (LELYNX.FR) BFORBANK
MONALBUMPHOTO FORTUNEO
2015 2014
€ 36.1 million€ 20.4 million € 20.4 million
€ 26.3 million€ 20.3 million
€ 19.2 million€ 19.9 million
€ 13 million€ 18.7 million
€ 9.4 million€ 18.6 million
€ 4.1 million€ 16.4 million
€ 12.1 million€ 15.8 million
€ 22.4 million€ 15.5 million
€ 36.7 million€ 32.3 million
€ 36.7 million € 31.5 million
€ 15.9 million€ 30.9 million
€ 20.8 million€ 29.7 million
€ 31.9 million€ 29.7 million
€ 16.7 million€ 28.9 million
€ 40.3 million€ 26.8 million
€ 24.4 million€ 23.7 million
€ 27.2 million€ 22.9 million
€ 22.2 million€ 22.9 million
€ 33.7 million€ 34.9 million
ADVERTISING MARKET - TTV
TV 2016: INSIGHT REPORT 47
PURE PLAYER ADVERTISERS ON TV
is the amount invested in television by 20 pure player advertisers in 2015.
€480.2 million gross
TV EFFECTIVENESS
TV 2016: INSIGHT REPORT48
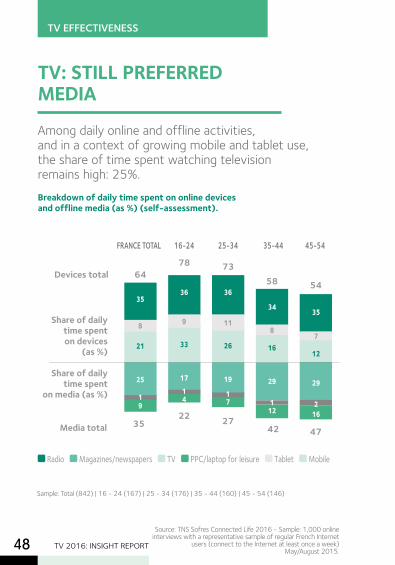
Breakdown of daily time spent on online devices and offline media (as %) (self-assessment).
TV: STILL PREFERRED MEDIA
Among daily online and offline activities, and in a context of growing mobile and tablet use, the share of time spent watching television remains high: 25%.
Source: TNS Sofres Connected Life 2016 - Sample: 1,000 online interviews with a representative sample of regular French Internet
users (connect to the Internet at least once a week) May/August 2015.
Sample: Total (842) | 16 - 24 (167) | 25 - 34 (176) | 35 - 44 (160) | 45 - 54 (146)
Radio Magazines/newspapers TV PPC/laptop for leisure Tablet Mobile
FRANCE TOTAL 16-24 25-34 35-44 45-54
Share of daily time spent on devices
(as %)
Share of daily time spent
on media (as %)
Media total 35 22
27
42 47
35
8
21
25
19
36
9
33
1714
36
11
26
19
17
35
7
12
29
216
34
8
16
29
112
Devices total 64 78
73
58
54
TV EFFECTIVENESS
TV 2016: INSIGHT REPORT 49Source: TNS Sofres Connected Life 2016 - Sample: 1,000 online interviews with a representative sample of regular French Internet users (connect to the Internet at least once a week) – May/August 2015.
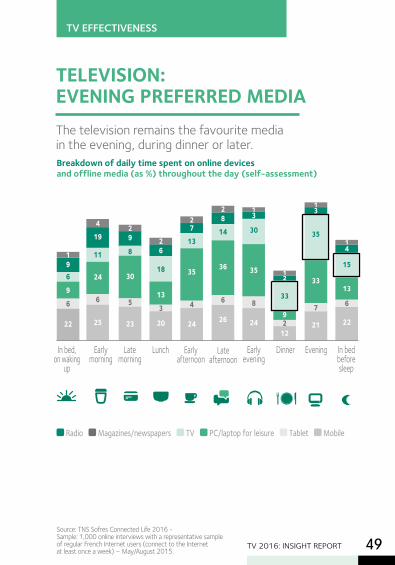
TELEVISION: EVENING PREFERRED MEDIA The television remains the favourite media in the evening, during dinner or later. Breakdown of daily time spent on online devices and offline media (as %) throughout the day (self-assessment)
Radio Magazines/newspapers TV PC/laptop for leisure Tablet Mobile
In bed, on waking
up
Early morning
Late morning
Lunch Early afternoon
Late afternoon
Early evening
Dinner Evening In bed before sleep
419
11
24
6
25
196
9
6
22
29
8
30
5
23
13
30
35
8
24
26
18
13
3
20
27
13
35
4
24
28
14
36
6
26
12
33
92
12
13
35
33
7
21
14
15
13
6
22
TV 2016: INSIGHT REPORT50Source: DENTSU AEGIS NORTH / Data2Decisions – May 2015. Sample: 914 individuals representative of the French population,
15-65 demographic, in terms of socio-demographic criteria.
TV EFFECTIVENESS
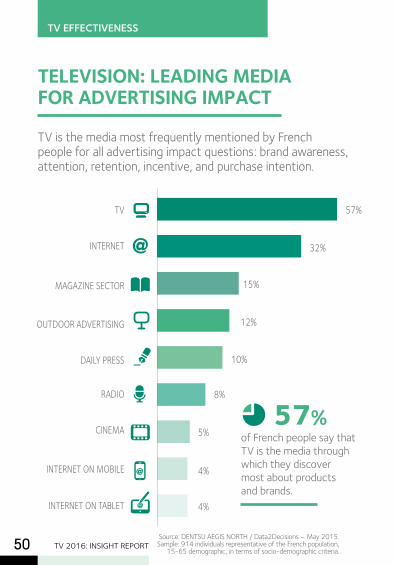
TELEVISION: LEADING MEDIA FOR ADVERTISING IMPACT
TV is the media most frequently mentioned by French people for all advertising impact questions: brand awareness, attention, retention, incentive, and purchase intention.
TV
INTERNET
MAGAZINE SECTOR
OUTDOOR ADVERTISING
DAILY PRESS
RADIO
CINEMA
INTERNET ON MOBILE
INTERNET ON TABLET
57%
32%
15%
12%
10%
8%
5%
4%
4%
of French people say that TV is the media through which they discover most about products and brands.
57%
TV 2016: INSIGHT REPORT 51
TV
OUTDOOR ADVERTISING
INTERNET
MAGAZINE SECTOR
CINEMA
RADIO
DAILY PRESS
INTERNET ON MOBILE
INTERNET ON TABLET
55%
11%
10%
8%
8%
7%
7%
3%
2%
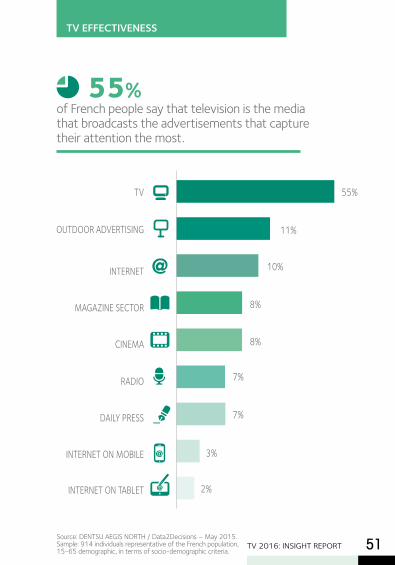
of French people say that television is the media that broadcasts the advertisements that capture their attention the most.
55%
Source: DENTSU AEGIS NORTH / Data2Decisions – May 2015. Sample: 914 individuals representative of the French population, 15-65 demographic, in terms of socio-demographic criteria.
TV EFFECTIVENESS
TV EFFECTIVENESS
TV 2016: INSIGHT REPORT52
TV
MAGAZINE SECTOR
INTERNET
ADVERTISING DISPLAY
RADIO
CINEMA
DAILY PRESS
INTERNET ON MOBILE
INTERNET ON TABLET
56%
10%
9%
8%
7%
7%
4%
3%
2%
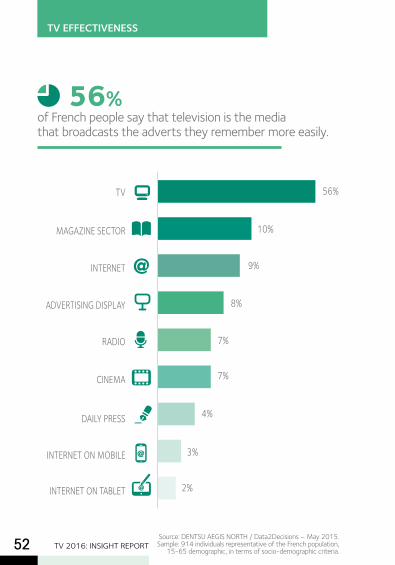
of French people say that television is the media that broadcasts the adverts they remember more easily.
56%
Source: DENTSU AEGIS NORTH / Data2Decisions – May 2015. Sample: 914 individuals representative of the French population,
15-65 demographic, in terms of socio-demographic criteria.
TV EFFECTIVENESS
TV 2016: INSIGHT REPORT 53
TV
INTERNET
MAGAZINE SECTOR
ADVERTISING DISPLAY
RADIO
CINEMA
DAILY PRESS
INTERNET ON MOBILE
INTERNET ON TABLET
40%
21%
11%
9%
7%
6%
5%
3%
2%
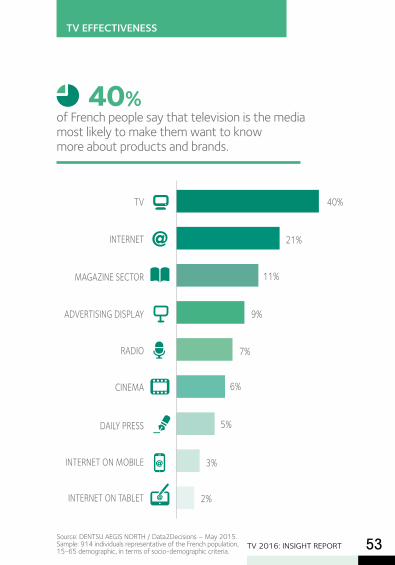
of French people say that television is the media most likely to make them want to know more about products and brands.
40%
Source: DENTSU AEGIS NORTH / Data2Decisions – May 2015. Sample: 914 individuals representative of the French population, 15-65 demographic, in terms of socio-demographic criteria.
TV EFFECTIVENESS
TV 2016: INSIGHT REPORT54
TV
INTERNET
MAGAZINE SECTOR
ADVERTISING DISPLAY
DAILY PRESS
RADIO
CINEMA
INTERNET ON MOBILE
INTERNET ON TABLET
37%
22%
10%
9%
5%
4%
4%
3%
3%
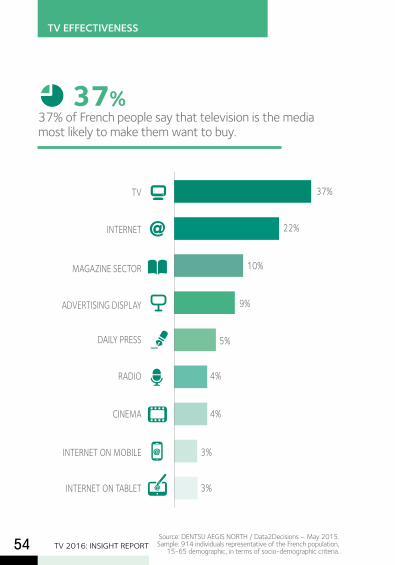
37% of French people say that television is the media most likely to make them want to buy.
37%
Source: DENTSU AEGIS NORTH / Data2Decisions – May 2015. Sample: 914 individuals representative of the French population,
15-65 demographic, in terms of socio-demographic criteria.
TV EFFECTIVENESS
TV 2016: INSIGHT REPORT 55Source: DENTSU AEGIS NORTH / Data2Decisions – May 2015. Remembers: Sample: Total population, 15-65 demographic (914 individuals). Used: Sample: Remembers seeing at least one interactive advertisement (573 individuals).
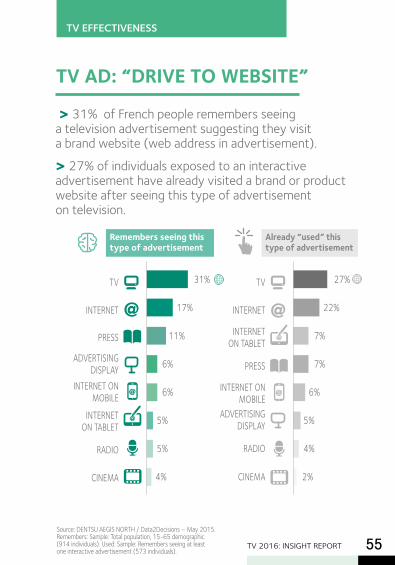
TV AD: “DRIVE TO WEBSITE”
> 31% of French people remembers seeing a television advertisement suggesting they visit a brand website (web address in advertisement).
> 27% of individuals exposed to an interactive advertisement have already visited a brand or product website after seeing this type of advertisement on television.
TV
INTERNET
PRESS
ADVERTISING DISPLAY
INTERNET ON MOBILE
INTERNET ON TABLET
RADIO
CINEMA
31%
17%
11%
6%
6%
5%
5%
4%
Remembers seeing this type of advertisement
TV
INTERNET
INTERNET ON TABLET
PRESS
INTERNET ON MOBILE
ADVERTISING DISPLAY
RADIO
CINEMA
27%
22%
7%
7%
6%
5%
4%
2%
Already “used” this type of advertisement
TV EFFECTIVENESS
TV 2016: INSIGHT REPORT56Source: DENTSU AEGIS NORTH / Data2Decisions – May 2015.
Remembers: Sample: Total population, 15-65 demographic (914 individuals). Used: Sample: Remembers seeing at least
one interactive advertisement (573 individuals).
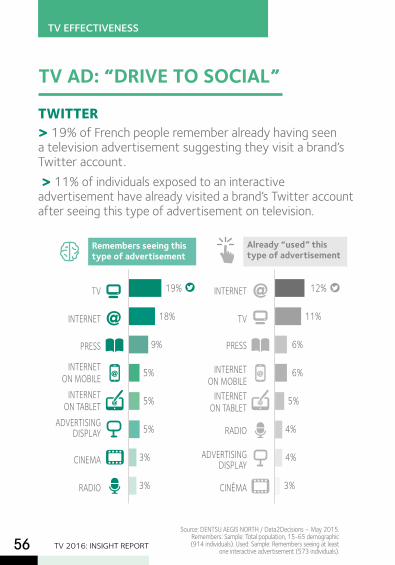
TV AD: “DRIVE TO SOCIAL”
TWITTER> 19% of French people remember already having seen a television advertisement suggesting they visit a brand’s Twitter account. > 11% of individuals exposed to an interactive advertisement have already visited a brand’s Twitter account after seeing this type of advertisement on television.
TV
INTERNET
PRESS
INTERNET ON MOBILE
INTERNET ON TABLET
ADVERTISING DISPLAY
CINEMA
RADIO
19%
18%
9%
5%
5%
5%
3%
3%
Remembers seeing this type of advertisement
INTERNET
TV
PRESS
INTERNET ON MOBILE
INTERNET ON TABLET
RADIO
ADVERTISING DISPLAY
CINÉMA
12%
11%
6%
6%
5%
4%
4%
3%
Already “used” this type of advertisement
TV EFFECTIVENESS
TV 2016: INSIGHT REPORT 57Source: DENTSU AEGIS NORTH / Data2Decisions – May 2015. Remembers: Sample: Total population, 15-65 demographic (914 individuals). Used: Sample: Remembers seeing at least one interactive advertisement (573 individuals).
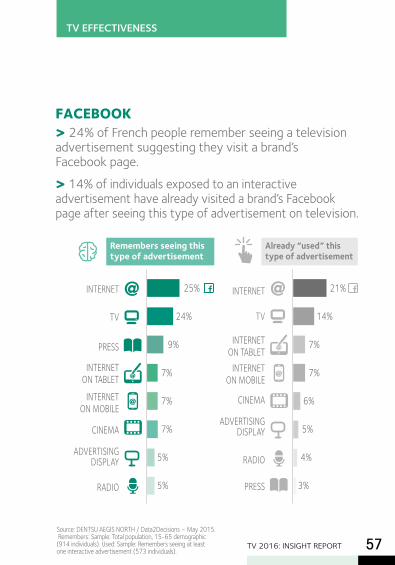
FACEBOOK> 24% of French people remember seeing a television advertisement suggesting they visit a brand’s Facebook page.> 14% of individuals exposed to an interactive advertisement have already visited a brand’s Facebook page after seeing this type of advertisement on television.
INTERNET
TV
PRESS
INTERNET ON TABLET
INTERNET ON MOBILE
CINEMA
ADVERTISING DISPLAY
RADIO
25%
24%
9%
7%
7%
7%
5%
5%
Remembers seeing this type of advertisement
INTERNET
TV
INTERNET ON TABLET
INTERNET ON MOBILE
CINEMA
ADVERTISING DISPLAY
RADIO
PRESS
21%
14%
7%
7%
6%
5%
4%
3%
Already “used” this type of advertisement
TV EFFECTIVENESS
TV 2016: INSIGHT REPORT58Source: DENTSU AEGIS NORTH / Data2Decisions – May 2015.
Remembers: Sample: Total population, 15-65 demographic (914 individuals). Used: Sample: Remembers seeing at least
one interactive advertisement (573 individuals).
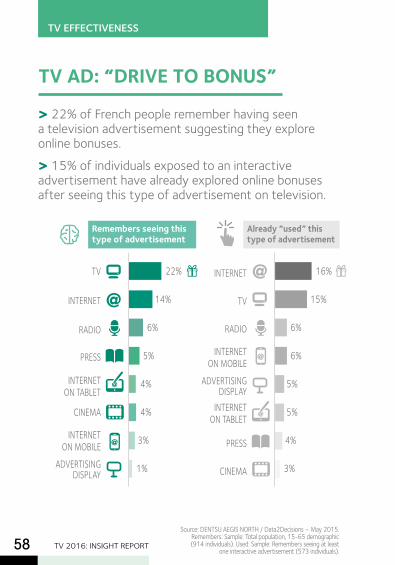
TV AD: “DRIVE TO BONUS”
> 22% of French people remember having seen a television advertisement suggesting they explore online bonuses.> 15% of individuals exposed to an interactive advertisement have already explored online bonuses after seeing this type of advertisement on television.
TV
INTERNET
RADIO
PRESS
INTERNET ON TABLET
CINEMA
INTERNET ON MOBILE
ADVERTISING DISPLAY
22%
14%
6%
5%
4%
4%
3%
1%
Remembers seeing this type of advertisement
INTERNET
TV
RADIO
INTERNET ON MOBILE
ADVERTISING DISPLAY
INTERNET ON TABLET
PRESS
CINEMA
16%
15%
6%
6%
5%
5%
4%
3%
Already “used” this type of advertisement
TV 2016: INSIGHT REPORT 59Source: DENTSU AEGIS NORTH / Data2Decisions – May 2015. Remembers: Sample: Total population, 15-65 demographic (914 individuals). Used: Sample: Remembers seeing at least one interactive advertisement (573 individuals).
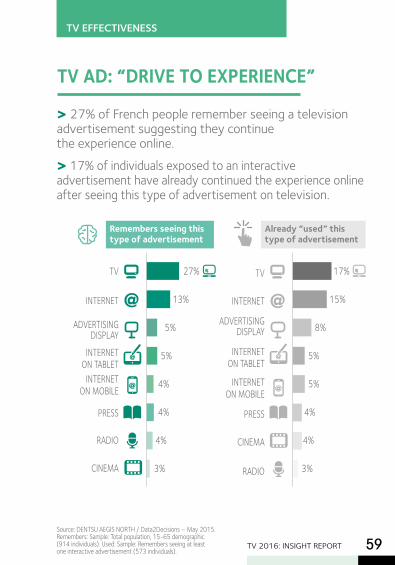
TV AD: “DRIVE TO EXPERIENCE”
> 27% of French people remember seeing a television advertisement suggesting they continue the experience online.> 17% of individuals exposed to an interactive advertisement have already continued the experience online after seeing this type of advertisement on television.
TV
INTERNET
ADVERTISING DISPLAY
INTERNET ON TABLET
INTERNET ON MOBILE
PRESS
RADIO
CINEMA
27%
13%
5%
5%
4%
4%
4%
3%
Remembers seeing this type of advertisement
TV
INTERNET
ADVERTISING DISPLAY
INTERNET ON TABLET
INTERNET ON MOBILE
PRESS
CINEMA
RADIO
17%
15%
8%
5%
5%
4%
4%
3%
Already “used” this type of advertisement
TV EFFECTIVENESS
TV 2016: INSIGHT REPORT60
Source: DENTSU AEGIS NORTH / Data2Decisions – May 2015. Remembers: Sample: Total population, 15-65 demographic (914 individuals). Used: Sample: Remembers seeing at least
one interactive advertisement (573 individuals).
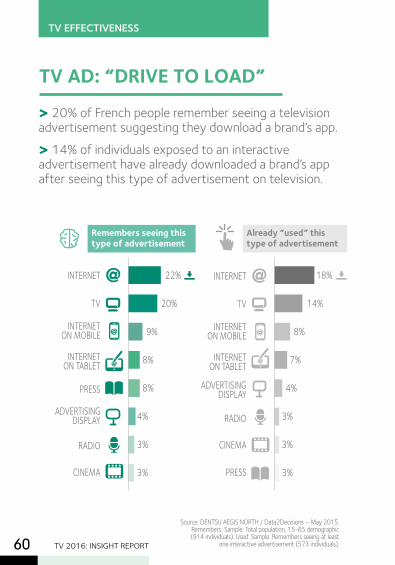
TV AD: “DRIVE TO LOAD”
> 20% of French people remember seeing a television advertisement suggesting they download a brand’s app.> 14% of individuals exposed to an interactive advertisement have already downloaded a brand’s app after seeing this type of advertisement on television.
INTERNET
TV
INTERNET ON MOBILE
INTERNET ON TABLET
PRESS
ADVERTISING DISPLAY
RADIO
CINEMA
22%
20%
9%
8%
8%
4%
3%
3%
Remembers seeing this type of advertisement
INTERNET
TV
INTERNET ON MOBILE
INTERNET ON TABLET
ADVERTISING DISPLAY
RADIO
CINEMA
PRESS
18%
14%
8%
7%
4%
3%
3%
3%
Already “used” this type of advertisement
TV EFFECTIVENESS
TV 2016: INSIGHT REPORT 61Source: DENTSU AEGIS NORTH / Data2Decisions – May 2015. Remembers: Sample: Total population, 15-65 demographic (914 individuals). Used: Sample: Remembers seeing at least one interactive advertisement (573 individuals).
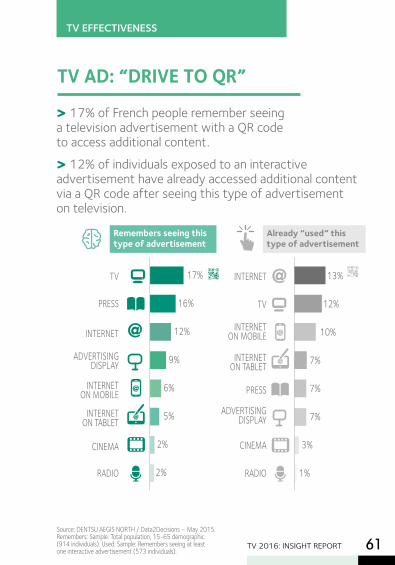
TV AD: “DRIVE TO QR” > 17% of French people remember seeing a television advertisement with a QR code to access additional content.> 12% of individuals exposed to an interactive advertisement have already accessed additional content via a QR code after seeing this type of advertisement on television.
TV
PRESS
INTERNET
ADVERTISING DISPLAY
INTERNET ON MOBILE
INTERNET ON TABLET
CINEMA
RADIO
17%
16%
12%
9%
6%
5%
2%
2%
Remembers seeing this type of advertisement
INTERNET
TV
INTERNET ON MOBILE
INTERNET ON TABLET
PRESS
ADVERTISING DISPLAY
CINEMA
RADIO
13%
12%
10%
7%
7%
7%
3%
1%
Already “used” this type of advertisement
TV EFFECTIVENESS
Source: Kids & Teens’ Mirror© - April 2015 - Copyright Junior City – Sample: 400 children, 7-14 demographic.
TV 2016: INSIGHT REPORT62
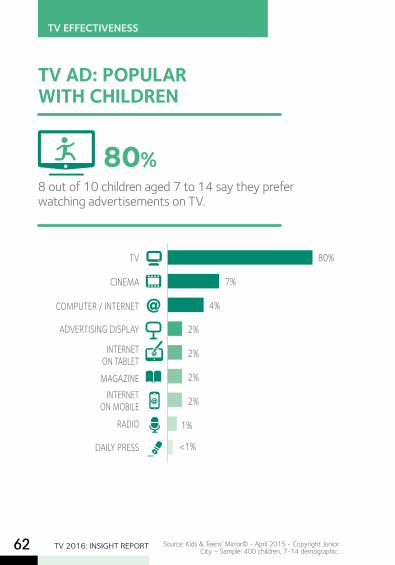
TV AD: POPULAR WITH CHILDREN
8 out of 10 children aged 7 to 14 say they prefer watching advertisements on TV.
80%
TV
CINEMA
COMPUTER / INTERNET
ADVERTISING DISPLAY
INTERNET ON TABLETMAGAZINE
INTERNET ON MOBILE
RADIO
DAILY PRESS
80%
7%
4%
2%
2%
2%
2%
1%
<1%
TV EFFECTIVENESS
TV 2016: INSIGHT REPORT 63Source: MarketingScan - Findings based on observations of Single Source TV-Purchases - Sample: 820 cases.
BEFORE CAMPAIGN DURING + AFTER CAMPAIGN
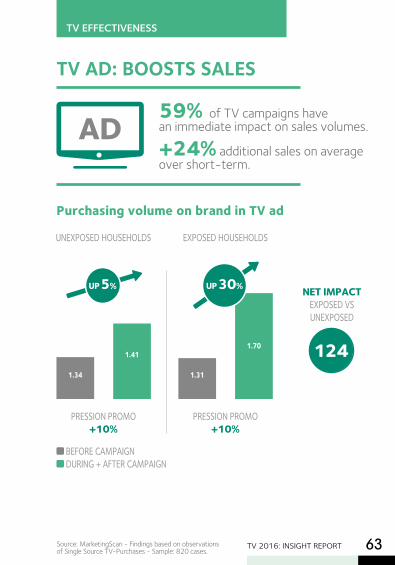
TV AD: BOOSTS SALES
Purchasing volume on brand in TV ad
59% of TV campaigns have an immediate impact on sales volumes.
+24% additional sales on average over short-term.
PRESSION PROMO+10%
PRESSION PROMO+10%
UNEXPOSED HOUSEHOLDS EXPOSED HOUSEHOLDS
1.34 1.31
1.411.70
UP 5% UP 30% NET IMPACT EXPOSED VS UNEXPOSED
124
AD
TV EFFECTIVENESS
Source: MarketingScan - Findings based on observations of Single Source TV-Purchases - Sample: 820 cases.
TV 2016: INSIGHT REPORT64
TV AD: BOOSTS SALES
AD
+29% higher impact on volumes for challenger brands compared with 18% higher for leading brands. +32% higher impact for new products.
TV EFFECTIVENESS
TV 2016: INSIGHT REPORT 65
CASES AVERAGE
at the end of 2015
at the end of 2012
% OF EFFECTIVE CAMPAIGNS
INCREASE IN PROMOTIONAL PRESSURE DURING CAMPAIGN
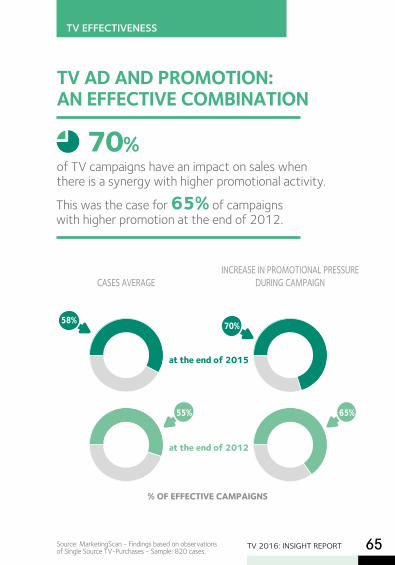
TV AD AND PROMOTION: AN EFFECTIVE COMBINATION
of TV campaigns have an impact on sales when there is a synergy with higher promotional activity.
This was the case for 65% of campaigns with higher promotion at the end of 2012.
70%
58%
55% 65%
70%
TV EFFECTIVENESS
Source: MarketingScan - Findings based on observations of Single Source TV-Purchases - Sample: 820 cases.
TV EFFECTIVENESS
TV 2016: INSIGHT REPORT66
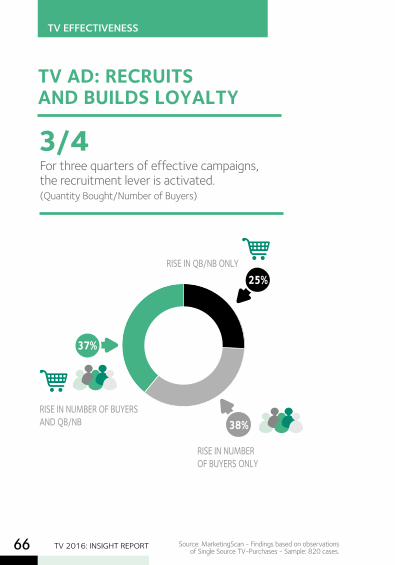
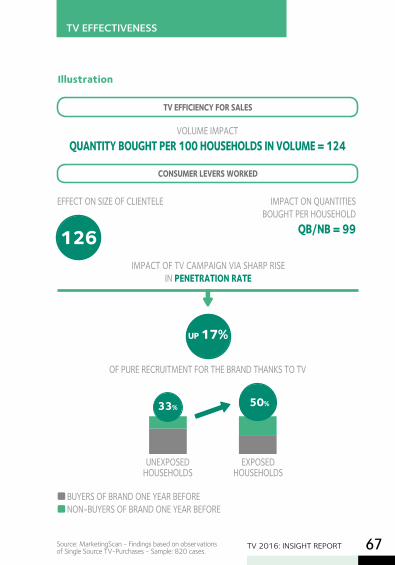
TV AD: RECRUITS AND BUILDS LOYALTY
38%
37%
25%
RISE IN NUMBER OF BUYERS ONLY
RISE IN QB/NB ONLY
RISE IN NUMBER OF BUYERS AND QB/NB
For three quarters of effective campaigns, the recruitment lever is activated. (Quantity Bought/Number of Buyers)
3/4
Source: MarketingScan - Findings based on observations of Single Source TV-Purchases - Sample: 820 cases.
TV EFFECTIVENESS
TV 2016: INSIGHT REPORT 67
BUYERS OF BRAND ONE YEAR BEFORE NON-BUYERS OF BRAND ONE YEAR BEFORE
TV EFFICIENCY FOR SALES
CONSUMER LEVERS WORKED
EFFECT ON SIZE OF CLIENTELE
OF PURE RECRUITMENT FOR THE BRAND THANKS TO TV
VOLUME IMPACT QUANTITY BOUGHT PER 100 HOUSEHOLDS IN VOLUME = 124
IMPACT OF TV CAMPAIGN VIA SHARP RISE IN PENETRATION RATE
Illustration
UP 17%
126
UNEXPOSED HOUSEHOLDS
EXPOSED HOUSEHOLDS
33% 50%
IMPACT ON QUANTITIES BOUGHT PER HOUSEHOLD
QB/NB = 99
Source: MarketingScan - Findings based on observations of Single Source TV-Purchases - Sample: 820 cases.
TV EFFECTIVENESS
TV 2016: INSIGHT REPORT68
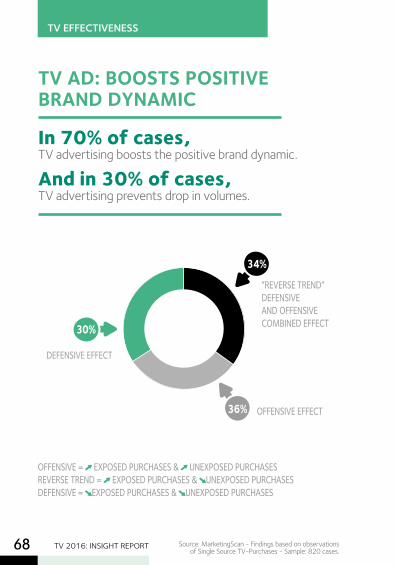
OFFENSIVE EFFECT
“REVERSE TREND” DEFENSIVE AND OFFENSIVE COMBINED EFFECT
DEFENSIVE EFFECT
OFFENSIVE = EXPOSED PURCHASES & UNEXPOSED PURCHASES REVERSE TREND = EXPOSED PURCHASES & UNEXPOSED PURCHASES DEFENSIVE = EXPOSED PURCHASES & UNEXPOSED PURCHASES
TV AD: BOOSTS POSITIVE BRAND DYNAMIC
In 70% of cases,TV advertising boosts the positive brand dynamic.
And in 30% of cases, TV advertising prevents drop in volumes.
36%
30%
34%
Source: MarketingScan - Findings based on observations of Single Source TV-Purchases - Sample: 820 cases.
TV 2016: INSIGHT REPORT 69
TV EFFECTIVENESS
Source: MarketingScan - Findings based on observations of Single Source TV-Purchases - Sample: 820 cases.
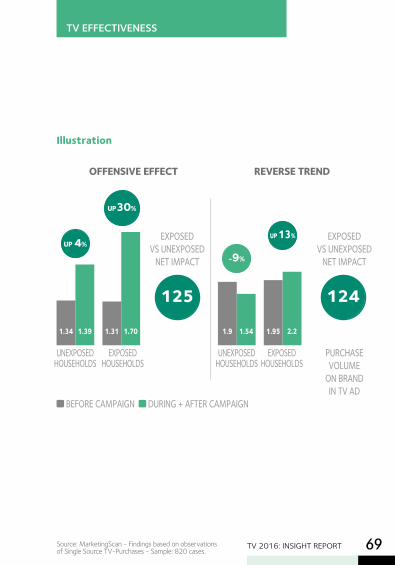
REVERSE TREND
Illustration
UNEXPOSED HOUSEHOLDS
UNEXPOSED HOUSEHOLDS
EXPOSED HOUSEHOLDS
EXPOSED HOUSEHOLDS
EXPOSED VS UNEXPOSED
NET IMPACT
EXPOSED VS UNEXPOSED
NET IMPACT
PURCHASE VOLUME
ON BRAND IN TV AD
1.34 1.9 1.541.39
UP 4%
-9%
BEFORE CAMPAIGN DURING + AFTER CAMPAIGN
1.31 1.95 2.21.70
UP30%
OFFENSIVE EFFECT
UP 13%
125 124
Source: MarketingScan - Findings based on observations of Single Source TV-Purchases - Sample: 820 cases.
TV 2016: INSIGHT REPORT70
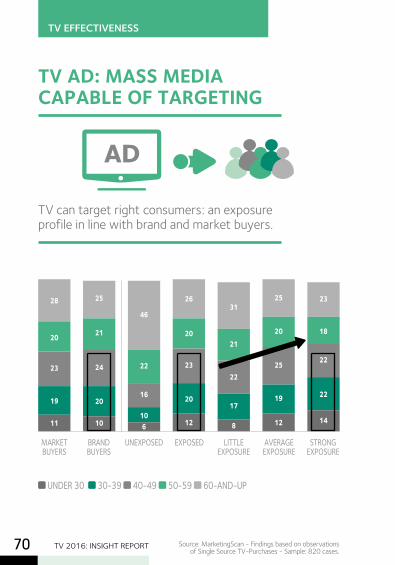
TV AD: MASS MEDIA CAPABLE OF TARGETING
TV can target right consumers: an exposure profile in line with brand and market buyers.
UNDER 30 30-39 40-49 50-59 60-AND-UP
MARKET BUYERS
BRAND BUYERS
UNEXPOSED EXPOSED LITTLE EXPOSURE
AVERAGE EXPOSURE
STRONG EXPOSURE
11
19
23
20
28
10
20
24
21
25
610
16
22
46
8
17
22
21
31
12
20
23
20
26
12
19
25
20
25
14
22
22
18
23
AD
TV EFFECTIVENESS
Source: MarketingScan - Findings based on observations of Single Source TV-Purchases - Sample: 820 cases.
TV 2016: INSIGHT REPORT 71
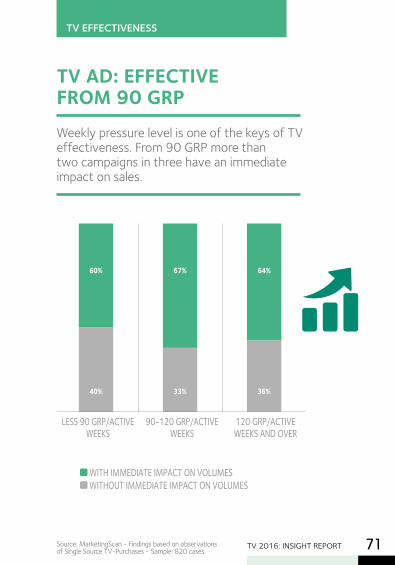
TV AD: EFFECTIVE FROM 90 GRPWeekly pressure level is one of the keys of TV effectiveness. From 90 GRP more than two campaigns in three have an immediate impact on sales.
WITH IMMEDIATE IMPACT ON VOLUMES WITHOUT IMMEDIATE IMPACT ON VOLUMES
LESS 90 GRP/ACTIVE WEEKS
90-120 GRP/ACTIVE WEEKS
120 GRP/ACTIVE WEEKS AND OVER
67%
33%
64%
36%
60%
40%
TV EFFECTIVENESS
Promotes TV advertising, including by supporting its members in general interest campaigns,
Studies TV advertising and its ongoing effectiveness for advertisers, media buying consulting firms and communications agencies,
Monitors developments in TV advertising, particularly global,
Represents its members and establish a dialogue with representative bodies for advertising players.
4
1, quai du Point du JourF-92656 Boulogne CedexFranceTél.: + 33 (0)1 41 41 43 22 Fax: + 33 (0)1 41 41 43 30www.snptv.orgcontact: [email protected]
core missions
Recommended


![La planète inconnue [24] - Free-scores.com · 24 - La planète inconnue 01-1-24 ... NO 24 - La planète inconnue p 02 . c NO 24 - La planète inconnue p 02 . c NO 24 - La planète](https://img.pdfslide.us/doc/110x75/5b158b777f8b9afb0a8ce119/la-planete-inconnue-24-free-24-la-planete-inconnue-01-1-24-no-24.jpg)