1
2016 Investor Conference Commercial & Residential Solutions Business OverviewBob SharpExecutive Vice PresidentFebruary 11, 2016
Non-GAAP Measures
In this presentation we will discuss some non-GAAP measures (denoted with an *) in talking about our company’s performance, and the reconciliation of those measures to the most comparable GAAP measures is contained within this presentation or is available at our website www.emerson.com under the investor relations tab.
Safe Harbor Statement
Our commentary and responses to your questions may contain forward-looking statements, including our outlook for the remainder of the year, and Emerson undertakes no obligation to update any such statement to reflect later developments. Factors that could cause actual results to vary materially from those discussed today include our ability to successfully complete on the terms and conditions contemplated, and the financial impact of, our strategic repositioning actions, as well as those provided in our most recent Annual Report on Form 10-K and subsequent reports as filed with the SEC.
Pro Forma Results
The financial measures contained in this presentation for the rebased Emerson and the Automation Solutions and Commercial & Residential Solutions businesses represent the businesses that are expected to remain a part of Emerson and to comprise these business groups after completion of Emerson’s portfolio repositioning actions.
2
Markets and
Customers
Brand
Business Platforms
Product Lines
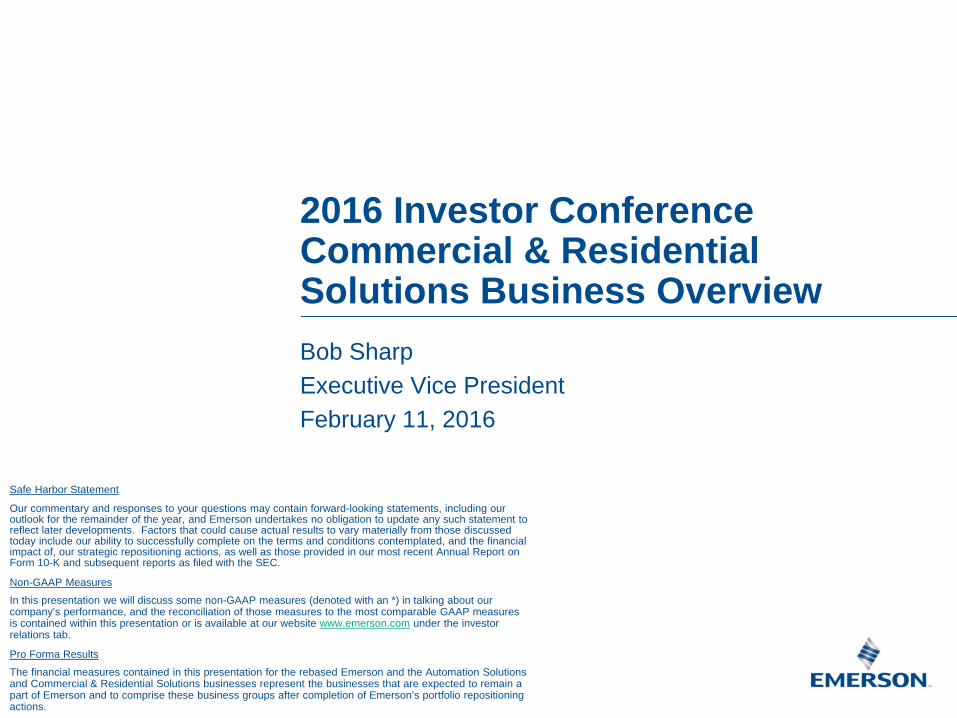
AutomationSolutions
Includes:
• Systems and Solutions• Final Control• Measurement and Analytical• Flow• Discrete and Industrial
Includes:
• Air Conditioning • Refrigeration• Electronics and Solutions• Sensors and Controls• Tools and Home Products
Industries Served:Oil and GasRefiningChemicalPowerLife Sciences
Commercial & Residential Solutions
Customer Categories:ConstructionCommercial BuildingsFood RetailFood ServiceRetail Service
Food and BevMetals and MiningWater Discrete Manuf.Fluid Automation
TransportationContractorsHomeowners
Redefine and Focus the Emerson Portfolio for Higher Growth / Higher Value Built on Foundation of Proven Businesses
$10+B $5+B
3
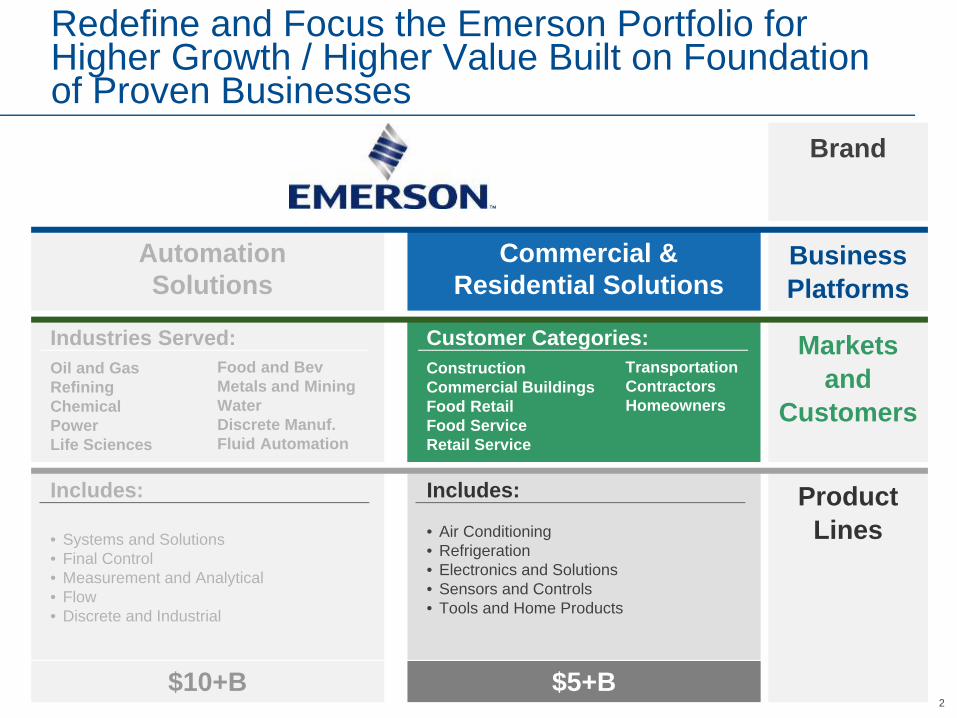
Emerson New Business Focus and Market Growth Opportunities
Near-Term Growth DriversAutomation Solutions
• Lifecycle Services• Hybrid and Discrete
Automation • Wireless Solutions • Pipeline Management• Integrated Coordination
and Control• Bolt-on Acquisitions
Commercial & Residential Solutions• Retail Solutions• Environmentally Friendly
Refrigerants• Sensors, Controls
and Connectivity• Global Disposer
Adoption• E-commerce• Bolt-on Acquisitions
Transformational OpportunitiesAutomation Solutions
• Pervasive Sensing• Digitalization of Installed
Base• Enriched Business Models
to improve Energy Management, Reliability and Safety
• Strategic Acquisitions
Commercial & Residential Solutions• Residential Solutions• Commercial Solutions• Transportation Solutions • Food Waste
to Energy• Strategic Acquisitions
Automation Solutions
$100B Potential
$10.1B $5.3B
Commercial & Residential Solutions$30BPotential
$15.4B

4
Commercial & Residential Solutions2015 Summary
2014 Pro Forma 2015 Pro Forma2014 – 2015
ChangeSales $5.4B $5.3B (1)%
EBIT $1.2B $1.2B1 (5)%
% of Sales 22.9% 22.1%1 (80) bps
ROTC 50% 45%
2015 Major Markets Served 2015 Sales by Geography
61%19%
10%
6%4%
Asia
Europe
Latin America
North America
Middle East & Africa
30%
10%
13%19%
4%3%
21%
Transport
Commercial AC
Commercial Refrigeration
Non-Residential Construction
Residential Construction
Residential AC
Other Commercial and Industrial
Note: Pro-Forma estimates assume the completion of all strategic portfolio repositioning actions1Includes $30M of Restructuring
55
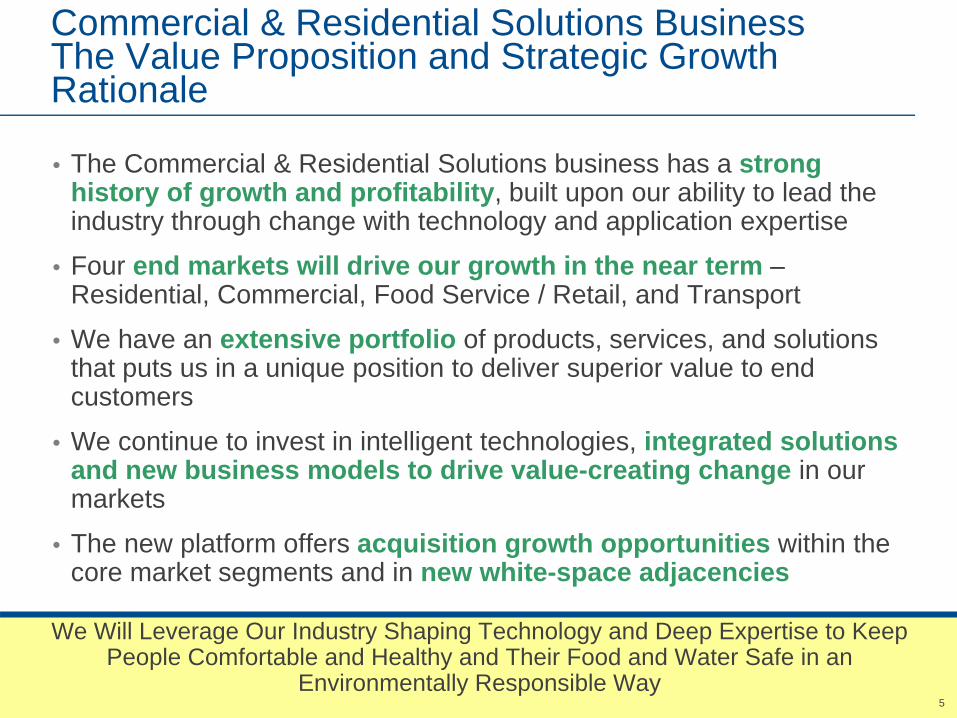
Commercial & Residential Solutions BusinessThe Value Proposition and Strategic Growth Rationale
• The Commercial & Residential Solutions business has a strong history of growth and profitability, built upon our ability to lead the industry through change with technology and application expertise
• Four end markets will drive our growth in the near term –Residential, Commercial, Food Service / Retail, and Transport
• We have an extensive portfolio of products, services, and solutions that puts us in a unique position to deliver superior value to end customers
• We continue to invest in intelligent technologies, integrated solutions and new business models to drive value-creating change in our markets
• The new platform offers acquisition growth opportunities within the core market segments and in new white-space adjacencies
We Will Leverage Our Industry Shaping Technology and Deep Expertise to Keep People Comfortable and Healthy and Their Food and Water Safe in an
Environmentally Responsible Way

6
This Slide Intentionally Omitted
7
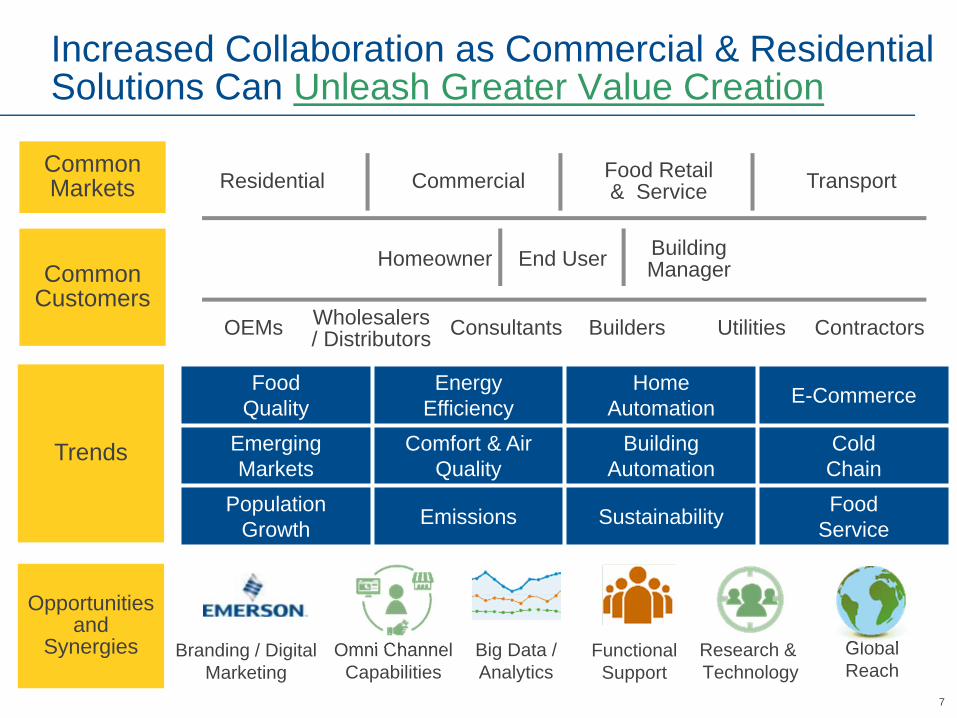
Trends
Opportunities and
Synergies Branding / Digital Marketing
Functional Support
Residential Commercial TransportFood Retail & Service
Common Markets
Common Customers
OEMs Wholesalers / Distributors Utilities ContractorsConsultants Builders
Homeowner End User Building Manager
Omni ChannelCapabilities
Big Data /Analytics
Research & Technology
GlobalReach
Food Quality
Energy Efficiency
HomeAutomation E-Commerce
EmergingMarkets
Comfort & AirQuality
BuildingAutomation
ColdChain
Population Growth Emissions Sustainability Food
Service
Increased Collaboration as Commercial & Residential Solutions Can Unleash Greater Value Creation
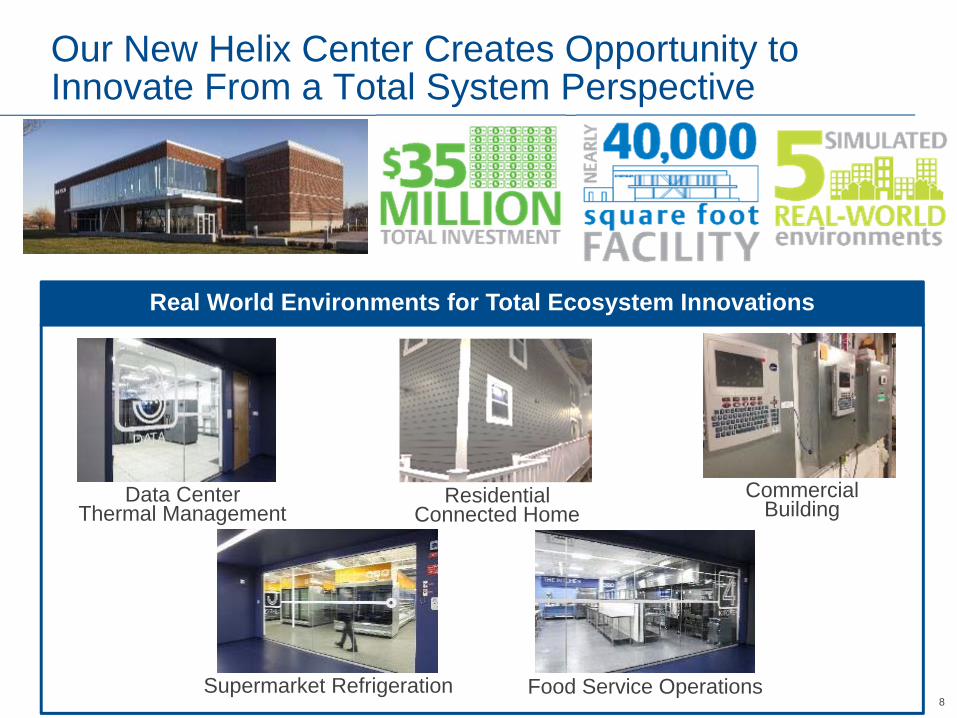
8
Residential Connected Home
Food Service OperationsSupermarket Refrigeration
Data Center Thermal Management
Commercial Building
Real World Environments for Total Ecosystem Innovations
Our New Helix Center Creates Opportunity to Innovate From a Total System Perspective

9
Understand Week 1-6
Build Team Week 3-6
IdeateWeek 7-9
PrototypeWeek 8-9
TestWeek 10
Transition Week 11-14
Innovation Process
& Timeline
5 Other Projects also in the Funnel
• Improve human comfort and its multiple dimensions, in non-uniform and dynamic environments of the home
• Force a new way of thinking about home comfort
• Diverse and outside perspectives critical to ideation
Divergent collaboration workshop with experts
in aesthetics, physiology, building, health & HVAC
18 dimensions of comfort values captured with ideas around control & wellness
Identifying best areas for refinement before new product development
Ideation Example: Home Comfort
10
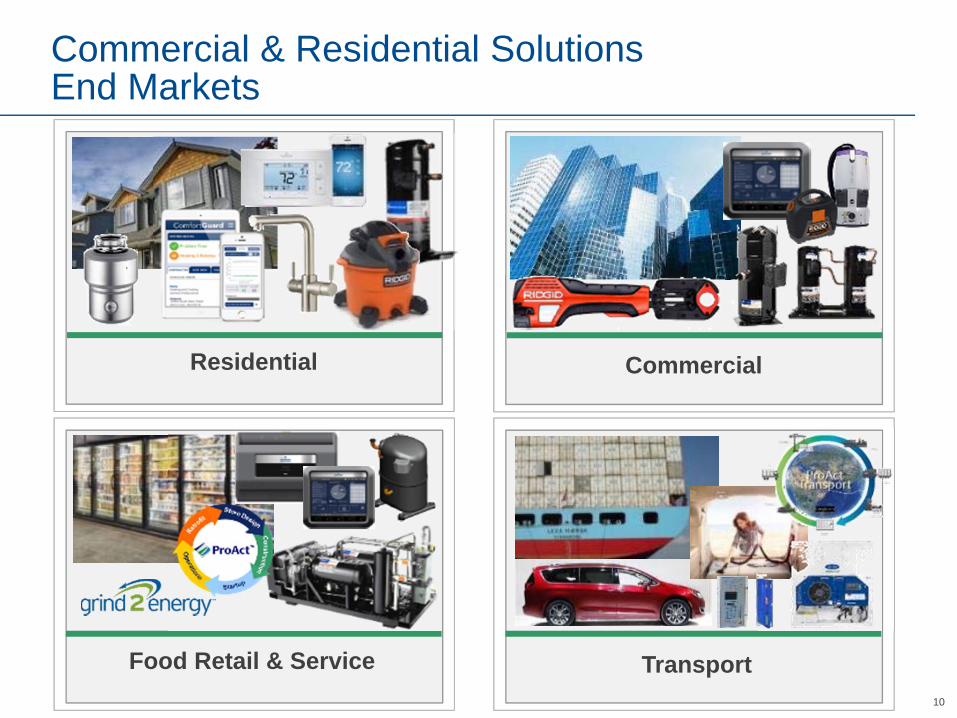
Residential
Food Retail & Service Transport
Commercial
Commercial & Residential SolutionsEnd Markets

11Source: IHS Economics and Management Assessment, 2017 – 2019 Outlook
• Air Conditioning & Heating - Energy conservation, home automation / wireless, mobile control of home comfort
• Construction - Continued trend of housing starts and consumer spending on home repair, renovation, shifting home format in emerging markets
• Air Conditioning & Heating - Emerging market growth, energy scarcity, indoor air quality, building automation
• Construction - Non-residential construction expansion modest in 2016, with growth expected in 2017
• Growth in perishable shipments by marine container
• Food safety modernization act and spoilage minimization
• Public transportation growth in emerging markets
Residential Commercial
Food Retail & Service Transport
• Sensors and real-time monitoring services
• Food safety modernization act and spoilage minimization
• Growing numbers of small format stores• Cold chain development in emerging
markets
Our End Markets Show Good Prospects for Growth Driven by Key Macro Trends
12
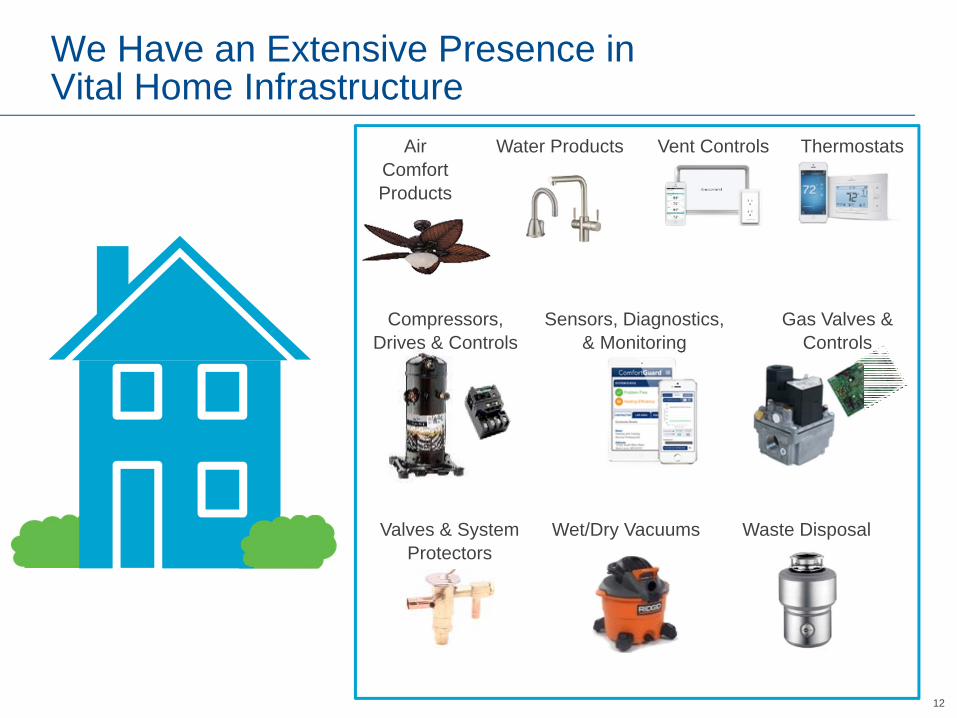
We Have an Extensive Presence in Vital Home Infrastructure
Thermostats
Wet/Dry Vacuums Waste Disposal
Water Products Vent Controls
Compressors,Drives & Controls
Sensors, Diagnostics, & Monitoring
Valves & System Protectors
Gas Valves & Controls
Air Comfort Products

13
Key Statistics Trends Emerson
134M+ Housing Units in U.S.
Temperature Control & Home Monitoring are
Top Priorities
58% of Home Energy Consumed by HVACR &
Water Heating
Home Automation Market to Reach $21B
by 2020
61% of U.S. Homes Wi-Fi Enabled; 25% of
Global Internet Usage via Wi-Fi
+30% of All Food Produced is Lost /
Wasted
Energy Efficiency
Sustainability
Population Growth
Comfort & Air Quality
Home Automation
E-Commerce
New Refrigerants
Modulated Compression &
Optimized Systems
Disposer Adoption
Connectivity & Monitoring Services
Omni Channel Presence
Zoning for Comfort
Residential MarketTrends and Opportunities

14
Changing Refrigerant Landscape Drives Significant Change in Residential Air Conditioning
• Environment: Stratospheric Ozone, Life Cycle Climate Performance
• Performance: Physical Properties, Energy
• Economics: Technology Changes, Total Cost of Ownership, Compatibility
• Safety: Toxicity, Flammability, Working Pressures
Key Considerations for Refrigerant Adoption
Global Warming Potential
Pressure
15
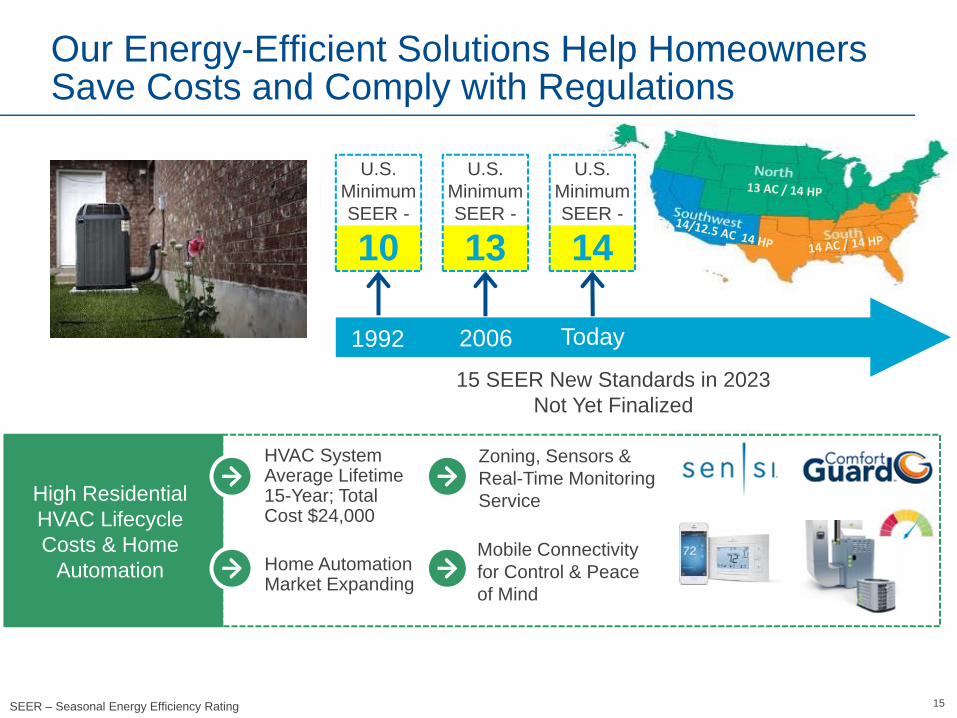
Our Energy-Efficient Solutions Help Homeowners Save Costs and Comply with Regulations
U.S. Minimum SEER -
10
15 SEER New Standards in 2023 Not Yet Finalized
1992 Today
U.S. Minimum SEER -
14
2006
U.S. Minimum SEER -
13
Mobile Connectivity for Control & Peace of Mind
Zoning, Sensors & Real-Time Monitoring ServiceHigh Residential
HVAC Lifecycle Costs & Home
Automation Home Automation Market Expanding
HVAC System Average Lifetime 15-Year; Total Cost $24,000
SEER – Seasonal Energy Efficiency Rating

1616
Developing a Residential Solution Portfolio Around Comfort As A Service
Building Foundation for Comfort As A Service Business. First Targets Are 15M Residential HVAC Service Agreements and Retail + Contractor Installations
Improve Efficiency & Comfort
Management
Improve Existing System Performance & Provide
Home Data
Contractor Productivity + User Experience
• Wi-Fi Thermostats & Modulated Venting for Increased Comfort & Efficiency
• Comprehensive Residential HVAC Monitoring Service
- 10 Sensors Quickly Installed
- 50 Algorithms Provide Real-Time System Checks
- Early Notification of Developing Problems Before Comfort Impacted
Comfort
Value

17
Online Sales to Contractors
Residential Services via Contractors & Utility Programs
HVAC Systems Through OEM Partnerships
Retail Channel to Homeowners
+250K Annual Click-Throughs
Omni-Channel Access to Residential Space
Global Engagement with Residential OEMs
18
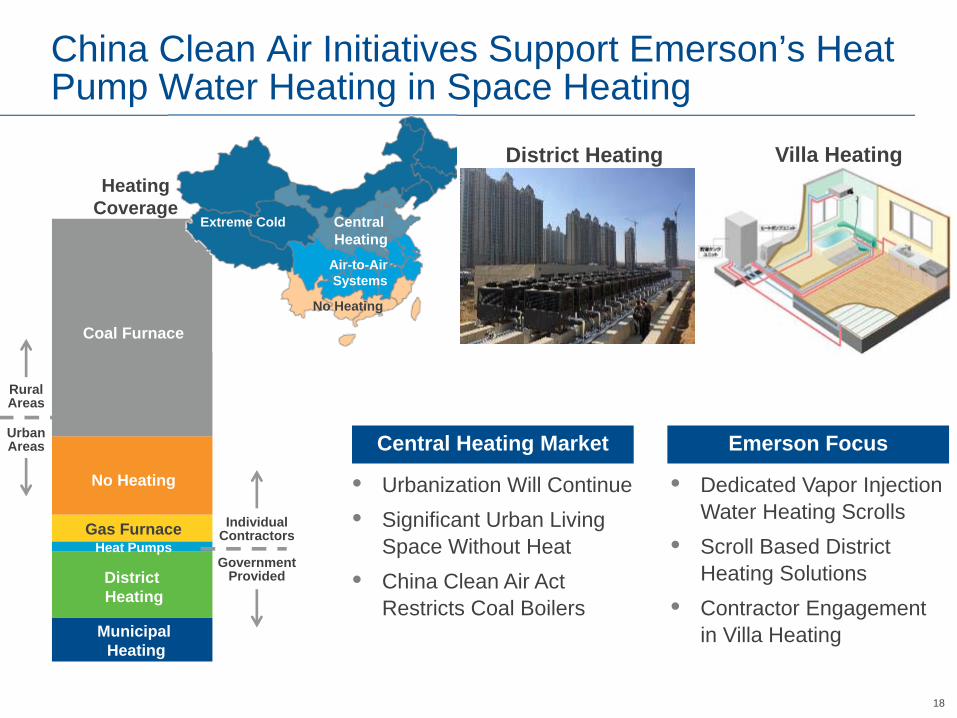
China Clean Air Initiatives Support Emerson’s Heat Pump Water Heating in Space Heating
Extreme Cold CentralHeating
Air-to-Air Systems
No Heating
District Heating
Gas Furnace
MunicipalHeating
Heating Coverage
Coal Furnace
Individual Contractors
Government Provided
Villa HeatingDistrict Heating
• Urbanization Will Continue• Significant Urban Living
Space Without Heat• China Clean Air Act
Restricts Coal Boilers
Heat Pumps
No Heating
RuralAreas
UrbanAreas
• Dedicated Vapor Injection Water Heating Scrolls
• Scroll Based District Heating Solutions
• Contractor Engagement in Villa Heating
Central Heating Market Emerson Focus
19
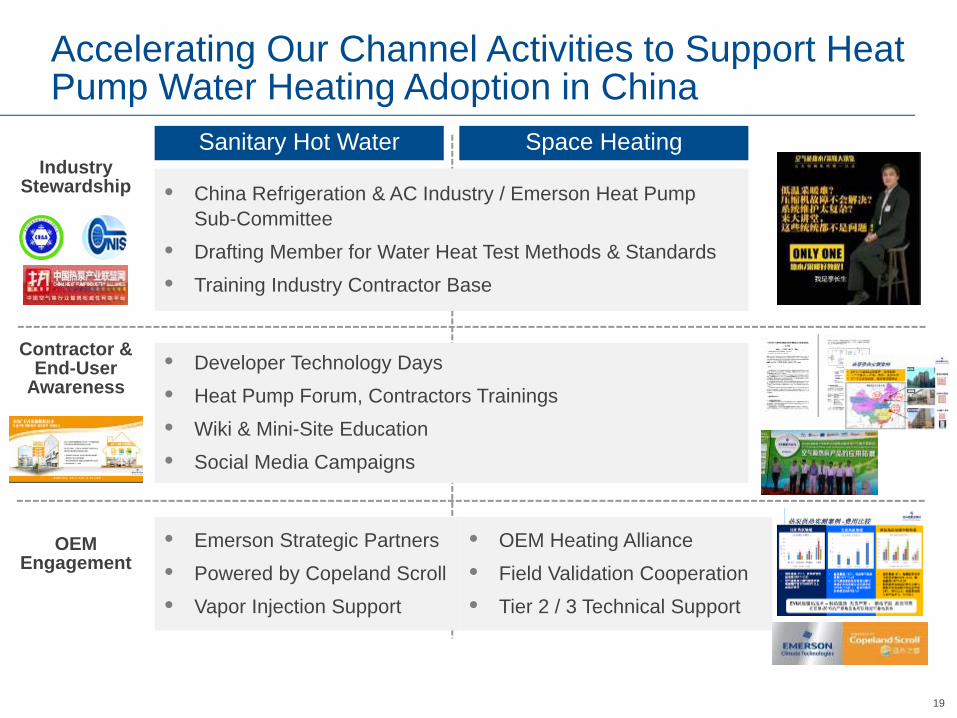
• China Refrigeration & AC Industry / Emerson Heat Pump Sub-Committee
• Drafting Member for Water Heat Test Methods & Standards• Training Industry Contractor Base
Industry Stewardship
Contractor & End-User
Awareness
OEM Engagement
• Developer Technology Days• Heat Pump Forum, Contractors Trainings• Wiki & Mini-Site Education• Social Media Campaigns
• Emerson Strategic Partners• Powered by Copeland Scroll• Vapor Injection Support
• OEM Heating Alliance• Field Validation Cooperation• Tier 2 / 3 Technical Support
Sanitary Hot Water Space Heating
Accelerating Our Channel Activities to Support Heat Pump Water Heating Adoption in China
20
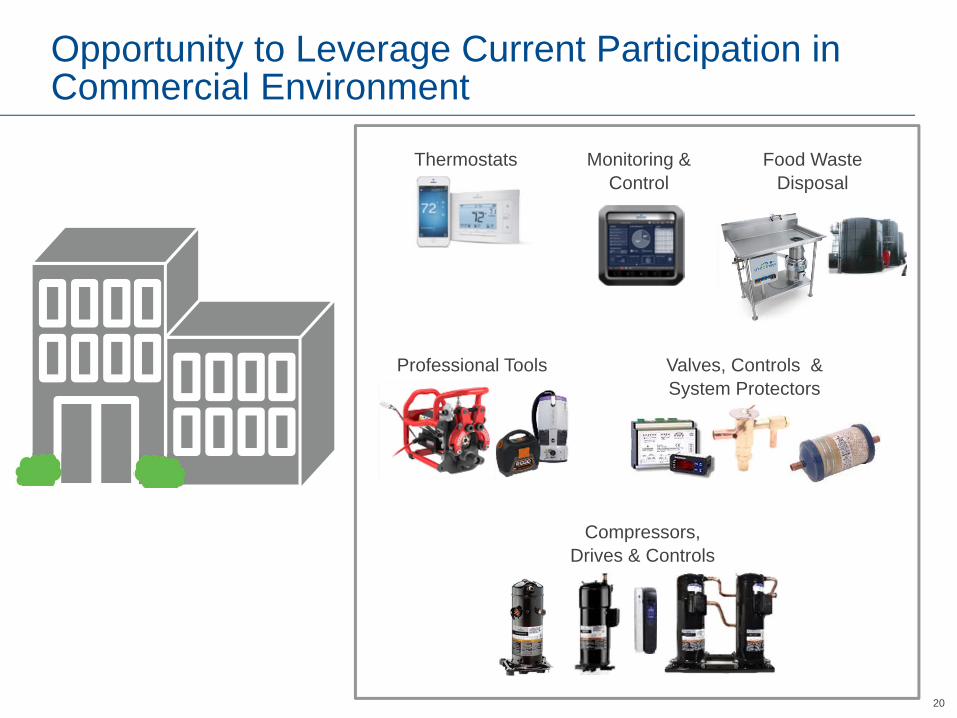
Valves, Controls & System Protectors
Compressors,Drives & Controls
Thermostats Monitoring & Control
Food Waste Disposal
Professional Tools
Opportunity to Leverage Current Participation in Commercial Environment

21
Key Statistics Trends Emerson
36% Energy Consumption from HVACR Systems & 25% from Lighting
$4B+ in Private Sector Investments
Committed for Clean Energy Innovation
Construction of Zero Energy Buildings More
than Doubled Since 2012
3% Worker Productivity Loss Due
to Poor Indoor Air Quality
Emerging Markets
Energy Efficiency & Sustainability
Building Automation
Comfort & Air Quality
E-Commerce
PopulationGrowth
New Refrigerants
Variable Speed & Modulation
Technologies
Zoning for Comfort
Efficiency Retrofits
Advanced Diagnostics
Pervasive Sensing & Facility Monitoring
Grind2Energy
New Solutions for Net Zero Goals & Air
Quality
Commercial MarketTrends and Opportunities
2222
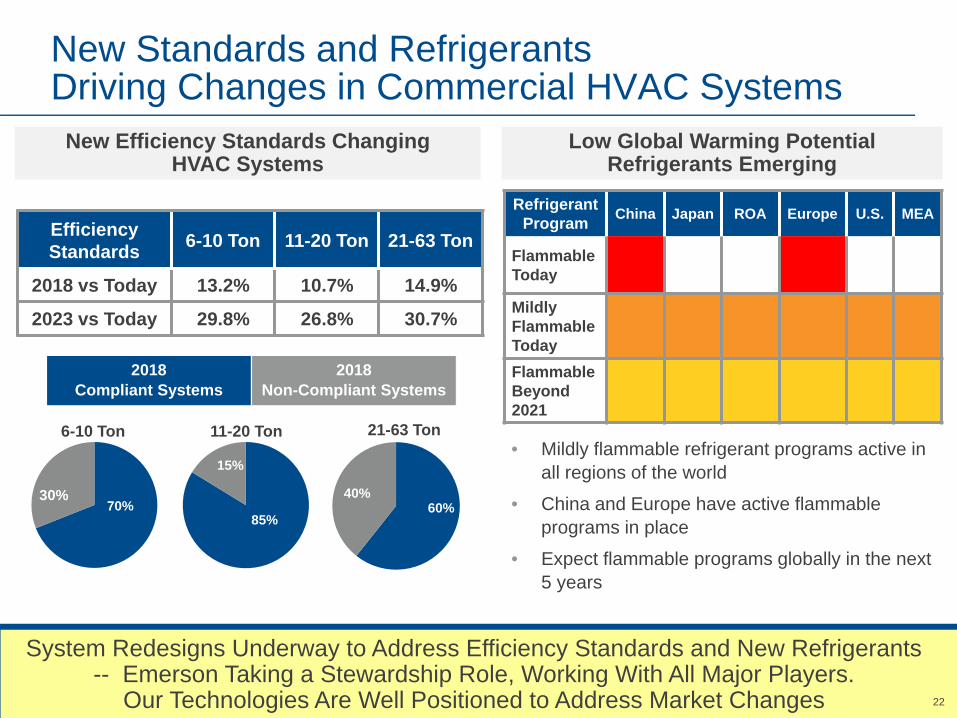
60%40%
Efficiency Standards 6-10 Ton 11-20 Ton 21-63 Ton
2018 vs Today 13.2% 10.7% 14.9%
2023 vs Today 29.8% 26.8% 30.7%
70%30%
85%
15%
2018Compliant Systems
6-10 Ton 11-20 Ton 21-63 Ton
Refrigerant Program China Japan ROA Europe U.S. MEA
FlammableToday
MildlyFlammableTodayFlammable Beyond2021
2018Non-Compliant Systems
New Efficiency Standards Changing HVAC Systems
Low Global Warming Potential Refrigerants Emerging
• Mildly flammable refrigerant programs active in all regions of the world
• China and Europe have active flammable programs in place
• Expect flammable programs globally in the next 5 years
New Standards and RefrigerantsDriving Changes in Commercial HVAC Systems
System Redesigns Underway to Address Efficiency Standards and New Refrigerants-- Emerson Taking a Stewardship Role, Working With All Major Players.
Our Technologies Are Well Positioned to Address Market Changes
2323
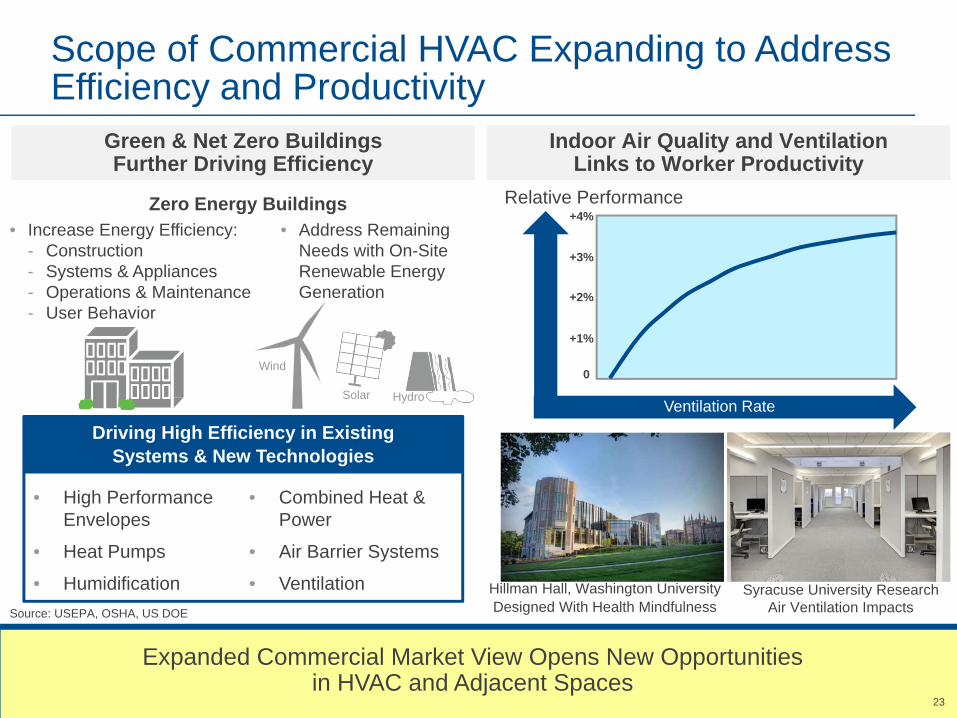
Indoor Air Quality and Ventilation Links to Worker Productivity
Expanded Commercial Market View Opens New Opportunities in HVAC and Adjacent Spaces
Hillman Hall, Washington UniversityDesigned With Health Mindfulness
Syracuse University ResearchAir Ventilation ImpactsSource: USEPA, OSHA, US DOE
Green & Net Zero Buildings Further Driving Efficiency
• High Performance Envelopes
• Combined Heat & Power
• Heat Pumps • Air Barrier Systems
• Humidification • Ventilation
Driving High Efficiency in Existing Systems & New Technologies
Zero Energy Buildings• Increase Energy Efficiency:
- Construction- Systems & Appliances- Operations & Maintenance- User Behavior
• Address Remaining Needs with On-Site Renewable Energy Generation
HydroSolar
Wind0
+1%
+2%
+3%
+4%
Ventilation Rate
Scope of Commercial HVAC Expanding to Address Efficiency and Productivity
Relative Performance
24
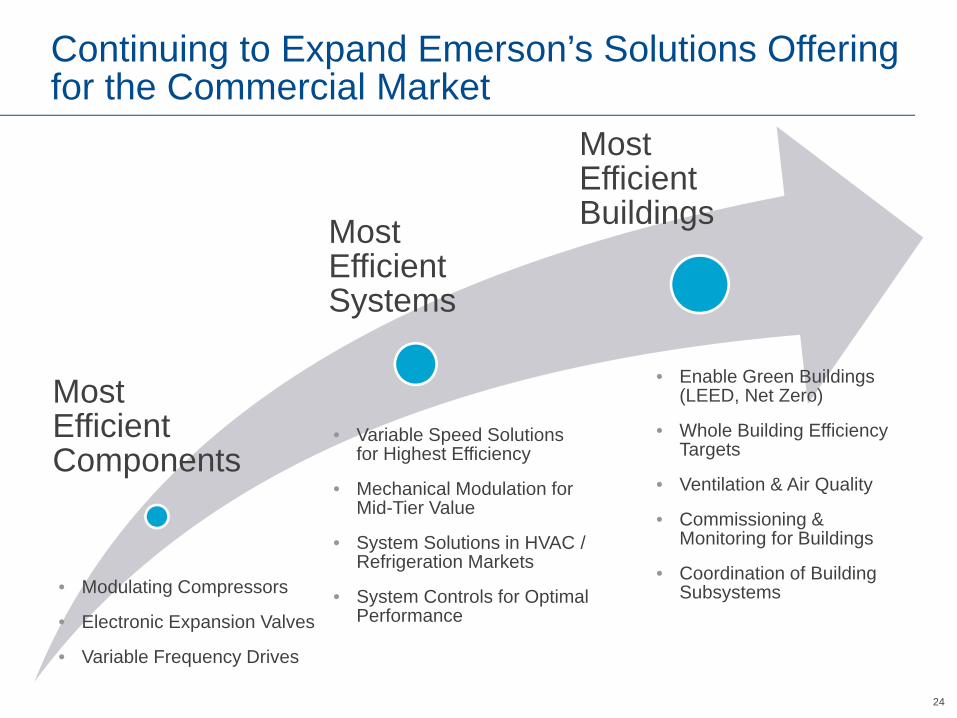
Most Efficient Components
Most Efficient Systems
Most Efficient Buildings
• Modulating Compressors
• Electronic Expansion Valves
• Variable Frequency Drives
• Variable Speed Solutions for Highest Efficiency
• Mechanical Modulation for Mid-Tier Value
• System Solutions in HVAC / Refrigeration Markets
• System Controls for Optimal Performance
• Enable Green Buildings (LEED, Net Zero)
• Whole Building Efficiency Targets
• Ventilation & Air Quality
• Commissioning & Monitoring for Buildings
• Coordination of Building Subsystems
Continuing to Expand Emerson’s Solutions Offering for the Commercial Market
25
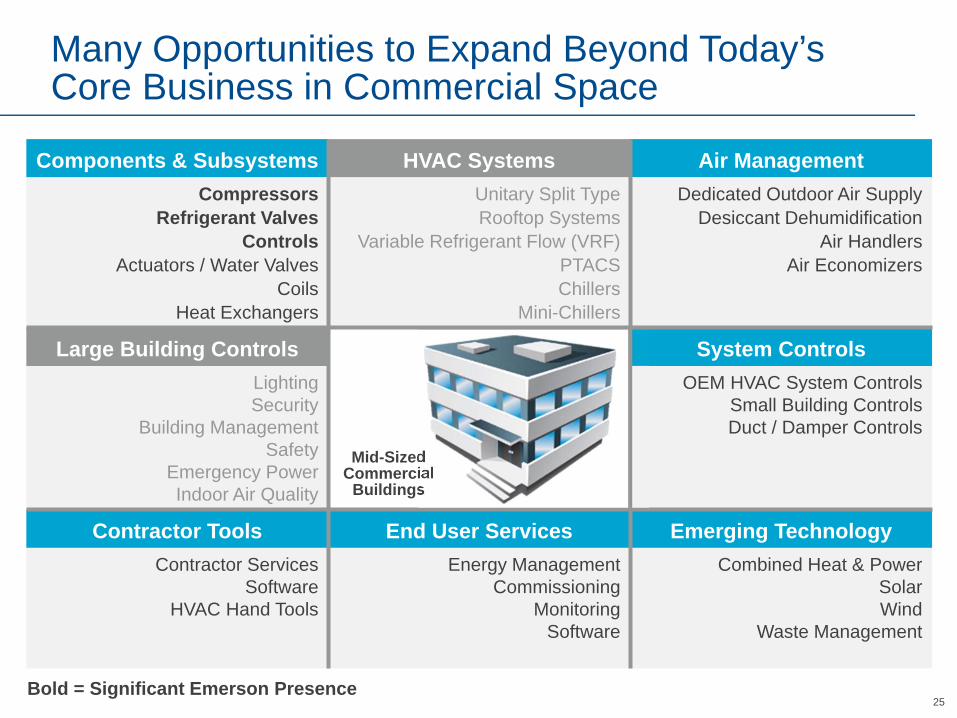
Components & Subsystems HVAC Systems Air Management Compressors
Refrigerant ValvesControls
Actuators / Water ValvesCoils
Heat Exchangers
Unitary Split TypeRooftop Systems
Variable Refrigerant Flow (VRF)PTACSChillers
Mini-Chillers
Dedicated Outdoor Air SupplyDesiccant Dehumidification
Air HandlersAir Economizers
Large Building Controls System ControlsLightingSecurity
Building ManagementSafety
Emergency PowerIndoor Air Quality
OEM HVAC System ControlsSmall Building ControlsDuct / Damper Controls
Contractor Tools End User Services Emerging TechnologyContractor Services
SoftwareHVAC Hand Tools
Energy ManagementCommissioning
MonitoringSoftware
Combined Heat & PowerSolarWind
Waste Management
Mid-Sized Commercial
Buildings
Bold = Significant Emerson Presence
Many Opportunities to Expand Beyond Today’s Core Business in Commercial Space
26
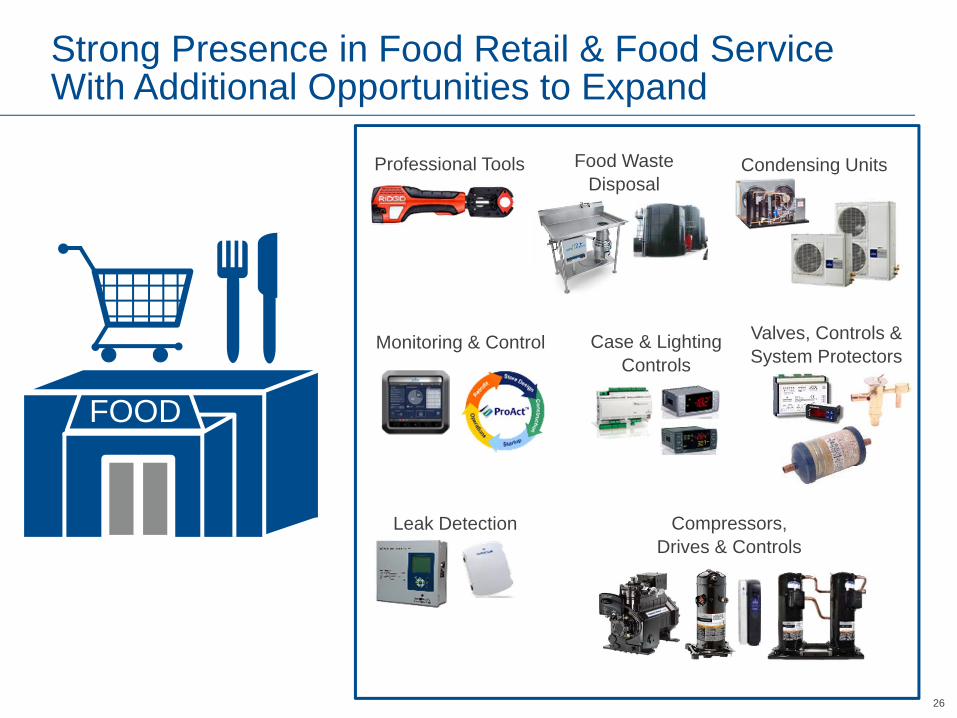
Valves, Controls & System Protectors
Compressors,Drives & Controls
Food Waste Disposal
Condensing Units
Leak Detection
Case & Lighting Controls
Monitoring & Control
Professional Tools
FOOD
Strong Presence in Food Retail & Food Service With Additional Opportunities to Expand

27
Key Statistics Trends Emerson
HVACR is 40-60% of Supermarket Energy
37K+ U.S. Supermarkets Consume
$9.4B in Energy
83% of Top 50 Retailers Testing New Refrigerants
Increasing Food Retail in Convenience Mart
Formats
Food Retailers Consume 94M kWh /
year to Protect Perishable Food
Emerging Markets
Cold Chain Development
Energy Efficiency &
Sustainability
E-Commerce
Food Quality
Food ServiceInfrastructure Monitoring & Connectivity
Grind2Energy Waste
Management
China & India Cold Chain Programs
Efficiency Retrofits
New Refrigerants & Efficiency Solutions
Increased End User &
Contractor Education
Food Retail & Food Service MarketTrends and Opportunities

28
Store Energy Consumption
0%
25%
50%
75%
100%
125%
2015 2025 2035 2045 2055
Global Warming Potential Weighted Cap
US & Developed Countries
Developing Countries
EU – F Gas
30%HVAC20%
Ref
30%Lights
20%Cooking
Each 5,000 sq. ft. store spends $62K / year on energy & maintenance
$62K / Yr
457 555
0
200
400
600
2014 2019
Site Count (K)4.0%
CAGR
% Energy Reduction Required
New Energy Regulations
Refrigerants Growth In Small Format
Helping Customers Navigate Changing Efficiency and Refrigerant Regulations Creates Opportunities
DOE Federal Minimum
-35%
-17%
-27%
2020
Reach-In20092017201020172013
Ice Walk-In
29
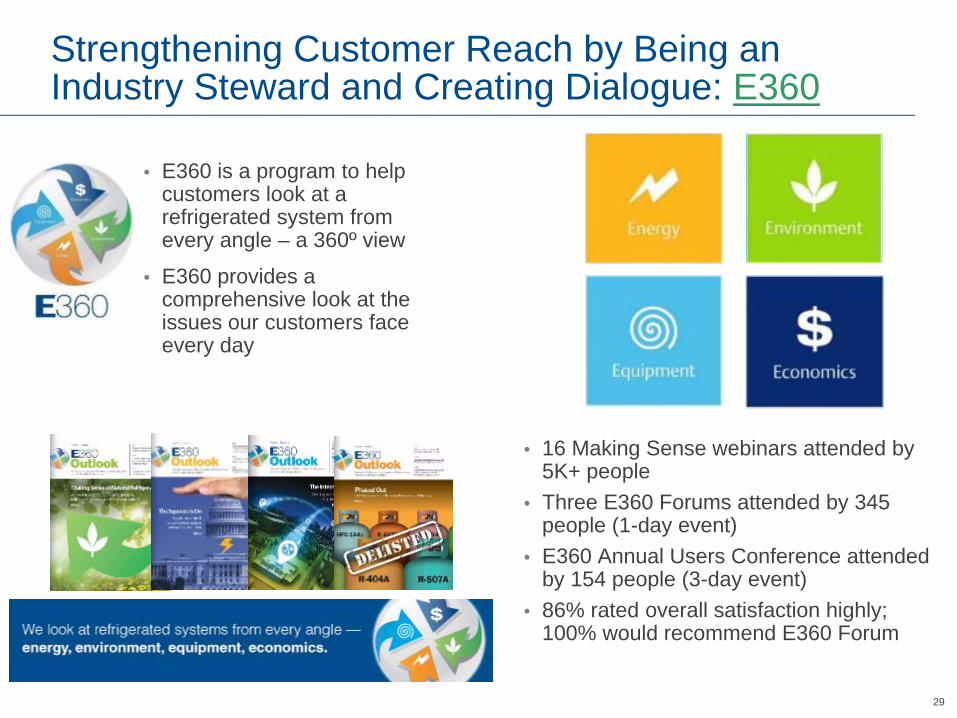
• E360 is a program to help customers look at arefrigerated system from every angle – a 360º view
• E360 provides acomprehensive look at the issues our customers face every day
• 16 Making Sense webinars attended by 5K+ people
• Three E360 Forums attended by 345 people (1-day event)
• E360 Annual Users Conference attended by 154 people (3-day event)
• 86% rated overall satisfaction highly; 100% would recommend E360 Forum
Strengthening Customer Reach by Being an Industry Steward and Creating Dialogue: E360
3030
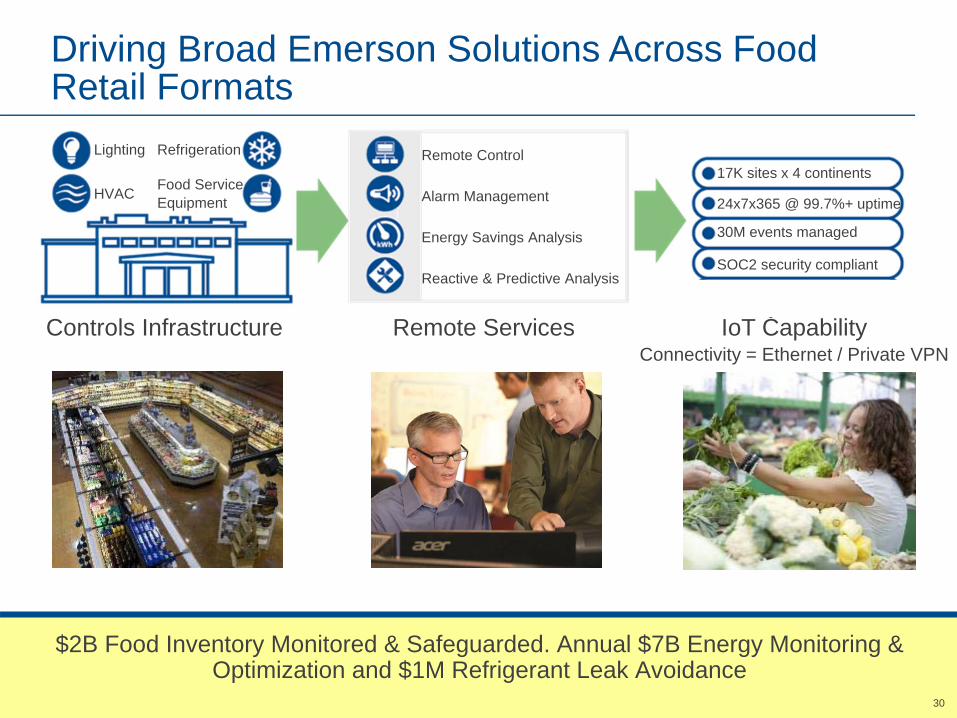
$2B Food Inventory Monitored & Safeguarded. Annual $7B Energy Monitoring & Optimization and $1M Refrigerant Leak Avoidance
Controls Infrastructure IoT CapabilityConnectivity = Ethernet / Private VPN
Remote Services
24x7x365 @ 99.7%+ uptime
17K sites x 4 continents
30M events managed
SOC2 security compliant
Remote Control
Alarm Management
Energy Savings Analysis
RefrigerationLighting
HVAC Food Service Equipment
Driving Broad Emerson Solutions Across Food Retail Formats
Reactive & Predictive Analysis

31
This Slide Intentionally Omitted
32
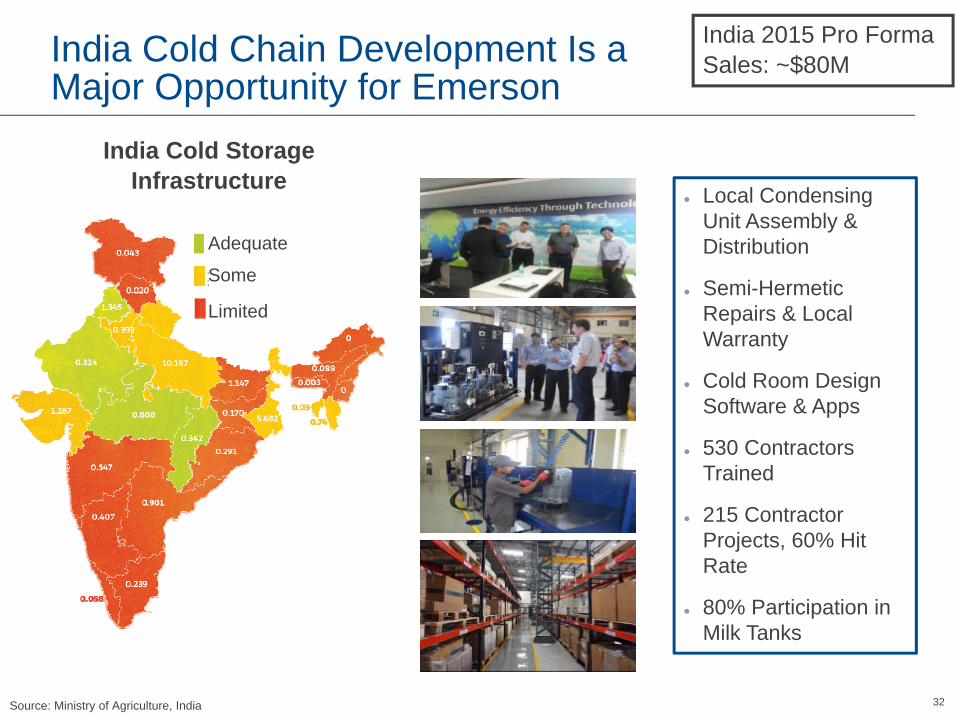
Local Condensing Unit Assembly & Distribution
Semi-Hermetic Repairs & Local Warranty
Cold Room Design Software & Apps
530 Contractors Trained
215 Contractor Projects, 60% Hit Rate
80% Participation in Milk Tanks
Source: Ministry of Agriculture, India
India Cold Storage Infrastructure
Adequate
Some
Limited
India Cold Chain Development Is a Major Opportunity for Emerson
India 2015 Pro Forma Sales: ~$80M
3333
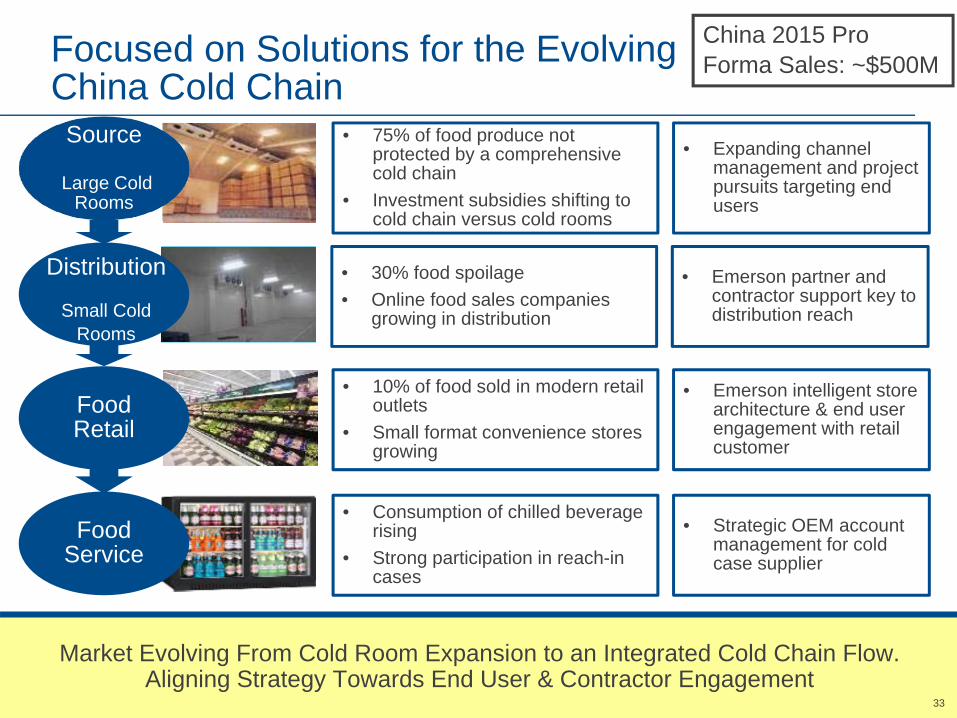
Market Evolving From Cold Room Expansion to an Integrated Cold Chain Flow. Aligning Strategy Towards End User & Contractor Engagement
Source
Large Cold Rooms
Food Retail
Food Service
• 75% of food produce not protected by a comprehensive cold chain
• Investment subsidies shifting to cold chain versus cold rooms
• 30% food spoilage • Online food sales companies
growing in distribution
• 10% of food sold in modern retail outlets
• Small format convenience stores growing
• Consumption of chilled beverage rising
• Strong participation in reach-in cases
• Expanding channel management and project pursuits targeting end users
• Emerson partner and contractor support key to distribution reach
• Emerson intelligent store architecture & end user engagement with retail customer
• Strategic OEM account management for cold case supplier
Focused on Solutions for the Evolving China Cold Chain
Distribution
Small Cold Rooms
China 2015 Pro Forma Sales: ~$500M
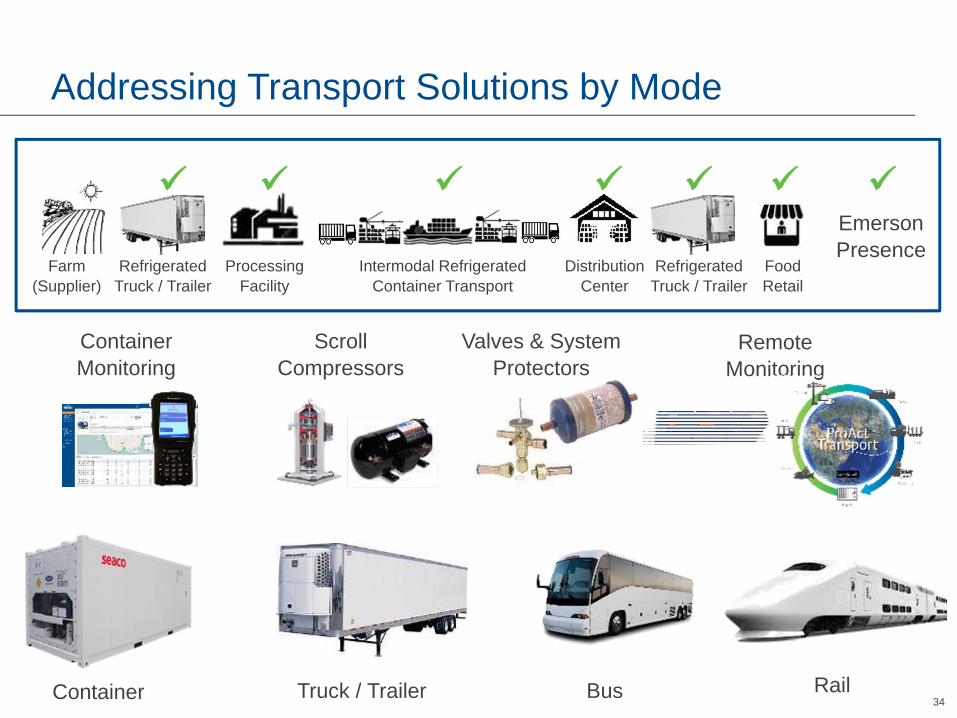
34RailBusTruck / TrailerContainer
Container Monitoring
Scroll Compressors
Valves & System Protectors
Remote Monitoring
ProcessingFacility
DistributionCenter
Intermodal RefrigeratedContainer Transport
Refrigerated Truck / Trailer
Refrigerated Truck / Trailer
Food Retail
Farm(Supplier)
Emerson Presence
Addressing Transport Solutions by Mode
35
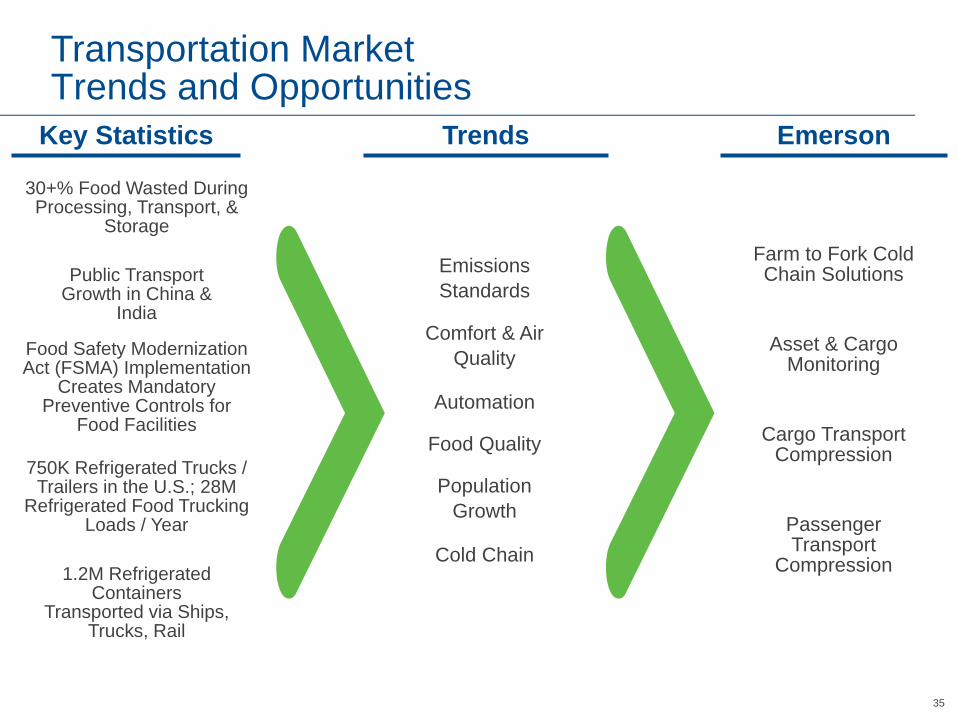
Key Statistics Trends Emerson
30+% Food Wasted During Processing, Transport, &
Storage
Public Transport Growth in China &
India
Food Safety Modernization Act (FSMA) Implementation
Creates Mandatory Preventive Controls for
Food Facilities
750K Refrigerated Trucks / Trailers in the U.S.; 28M
Refrigerated Food Trucking Loads / Year
1.2M Refrigerated Containers
Transported via Ships, Trucks, Rail
Emissions Standards
Comfort & Air Quality
Automation
Food Quality
Population Growth
Cold Chain
Asset & Cargo Monitoring
Farm to Fork Cold Chain Solutions
Cargo Transport Compression
Passenger Transport
Compression
Transportation MarketTrends and Opportunities

3636
Expanded Opportunity to Monitor Cargo to Ensure Control of Food Quality-- New U.S. Food Quality Standards in 2016
FarmSupplier
Refrigerated Truck / Trailer
Processing Facility
Intermodal Refrigerated Container Transport
Distribution Center
Refrigerated Truck / Trailer
Food Retail
Regulation Focus
Cold Chain Players
Importers Farmers Processors Distributor Transport Retail
Preventative control for human food
Produce safety rule
Foreign supplier verification
Intentional contamination mitigation
Sanitary food transport
Preventative controls for animal feed
Emerson Compression & Monitoring Focus
Emerson Focus
U.S. Food Safety Modernization Act to Control Food Quality Compliance Starts in 2016
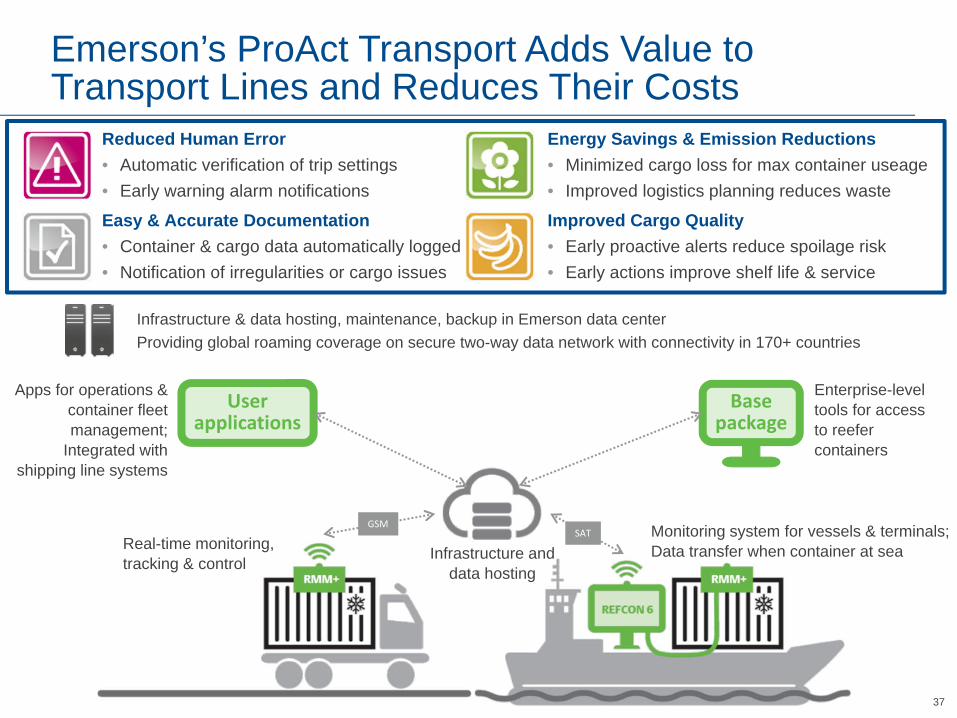
37
Easy & Accurate Documentation• Container & cargo data automatically logged• Notification of irregularities or cargo issues
Reduced Human Error• Automatic verification of trip settings• Early warning alarm notifications
Energy Savings & Emission Reductions• Minimized cargo loss for max container useage• Improved logistics planning reduces waste
Improved Cargo Quality• Early proactive alerts reduce spoilage risk• Early actions improve shelf life & service
Infrastructure & data hosting, maintenance, backup in Emerson data center Providing global roaming coverage on secure two-way data network with connectivity in 170+ countries
User applications
Base package
GSMSAT
Infrastructure and data hosting
Real-time monitoring, tracking & control
Monitoring system for vessels & terminals;Data transfer when container at sea
Enterprise-level tools for access to reefer containers
Apps for operations & container fleet management;
Integrated with shipping line systems
Emerson’s ProAct Transport Adds Value to Transport Lines and Reduces Their Costs

38
This Slide Intentionally Omitted

39
This Slide Intentionally Omitted

40
2014 Pro-Forma 2015 Pro-Forma 2016ESales $5.4B $5.3B 1-3%
Underlying Growth*EBIT $1.2B $1.2B1
% of Sales 22.9% 22.1%1 23+%1
ROTC 50% 45%
2015 Major Markets Served 2015 Sales by Geography
61%19%
10%
6%4%
Asia
Europe
Latin America
North America
Middle East & Africa
30%
10%
13%19%
4%3%
21%
Transport
Commercial AC
Commercial Refrigeration
Non-Residential Construction
Residential Construction
Residential AC
Commercial & Residential Solutions2015 Summary & 2016 Guidance
Note: Pro-Forma estimates assume the completion of all strategic portfolio repositioning actions1Includes $30M of restructuring in 2015 and ~$4M of restructuring in 2016
Other Commercial and Industrial

4141
Commercial & Residential Solutions BusinessThe Value Proposition and Strategic Growth Rationale
• The Commercial & Residential Solutions business has a strong history of growth and profitability, built upon our ability to lead the industry through change with technology and application expertise
• Four end markets will drive our growth in the near term –Residential, Commercial, Food Service / Retail, and Transport
• We have an extensive portfolio of products, services, and solutions that puts us in a unique position to deliver superior value to end customers
• We continue to invest in intelligent technologies, integrated solutions and new business models to drive value-creating change in our markets
• The new platform offers acquisition growth opportunities within the core market segments and in new white-space adjacencies
Favorable Market Conditions and Incremental Growth Opportunities Drive CAGR of 4-5% Through 2019 Timeframe

42
Non-GAAP Reconciliations
• The 2016E financial measures contained herein represent the Company’s expectations for its consolidated results including the expected full year results for the businesses that are the subject of the portfolio repositioning actions, and does not assume any gain or loss on the sale of those businesses.
• Any “pro forma” or “rebased” financial measures contained herein represent the businesses that are expected to remain part of Emerson and comprise the Automation Solutions and Commercial & Residential Solutions business groups after completion of Emerson’s portfolio repositioning actions described herein.
• Operational tax rate excludes the impact of the costs associated with the planned spinoff or sale of the network power systems business and the other strategic repositioning actions being undertaken by the Company to provide additional insight into the tax rate applicable to the Company’s ordinary on-going operations and facilitate period-to-period comparisons. Management believes that presenting operational tax rate may be more useful for investors (U.S. GAAP measures: tax rate).
• References to underlying orders in this presentation refer to the Company's trailing three-month average orders growth versus the prior year, excluding currency, acquisitions and divestitures.
43
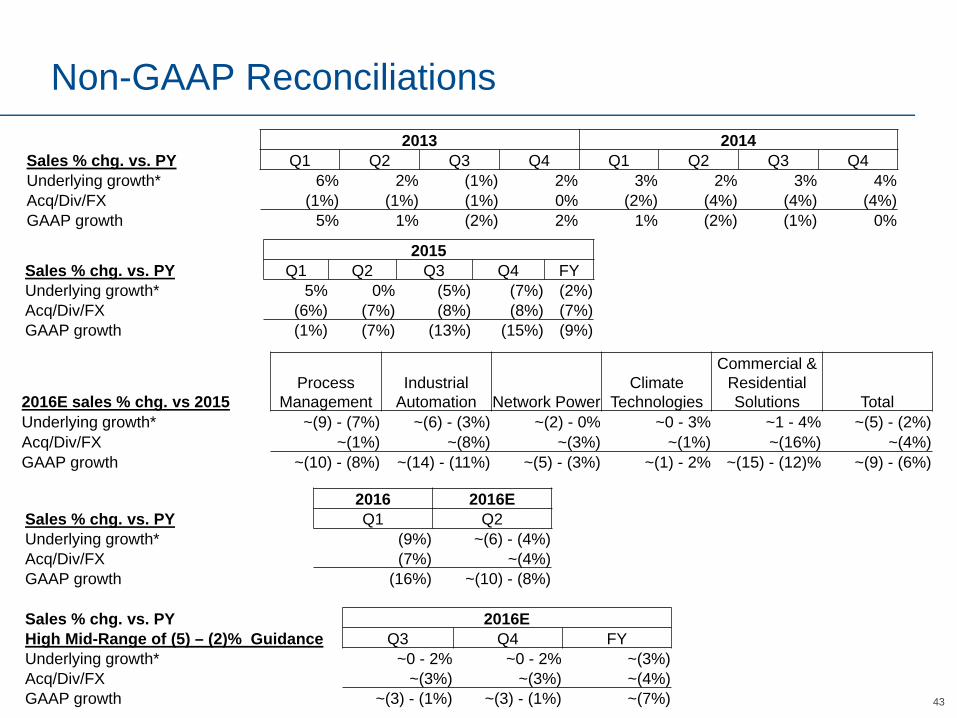
Non-GAAP Reconciliations2013 2014
Sales % chg. vs. PY Q1 Q2 Q3 Q4 Q1 Q2 Q3 Q4Underlying growth* 6% 2% (1%) 2% 3% 2% 3% 4%Acq/Div/FX (1%) (1%) (1%) 0% (2%) (4%) (4%) (4%)GAAP growth 5% 1% (2%) 2% 1% (2%) (1%) 0%
2015Sales % chg. vs. PY Q1 Q2 Q3 Q4 FYUnderlying growth* 5% 0% (5%) (7%) (2%)Acq/Div/FX (6%) (7%) (8%) (8%) (7%)GAAP growth (1%) (7%) (13%) (15%) (9%)
2016E sales % chg. vs 2015Process
ManagementIndustrial
Automation Network PowerClimate
Technologies
Commercial & Residential Solutions Total
Underlying growth* ~(9) - (7%) ~(6) - (3%) ~(2) - 0% ~0 - 3% ~1 - 4% ~(5) - (2%)Acq/Div/FX ~(1%) ~(8%) ~(3%) ~(1%) ~(16%) ~(4%)GAAP growth ~(10) - (8%) ~(14) - (11%) ~(5) - (3%) ~(1) - 2% ~(15) - (12)% ~(9) - (6%)
2016 2016ESales % chg. vs. PY Q1 Q2Underlying growth* (9%) ~(6) - (4%)Acq/Div/FX (7%) ~(4%)GAAP growth (16%) ~(10) - (8%)
Sales % chg. vs. PY 2016EHigh Mid-Range of (5) – (2)% Guidance Q3 Q4 FYUnderlying growth* ~0 - 2% ~0 - 2% ~(3%)Acq/Div/FX ~(3%) ~(3%) ~(4%)GAAP growth ~(3) - (1%) ~(3) - (1%) ~(7%)
44
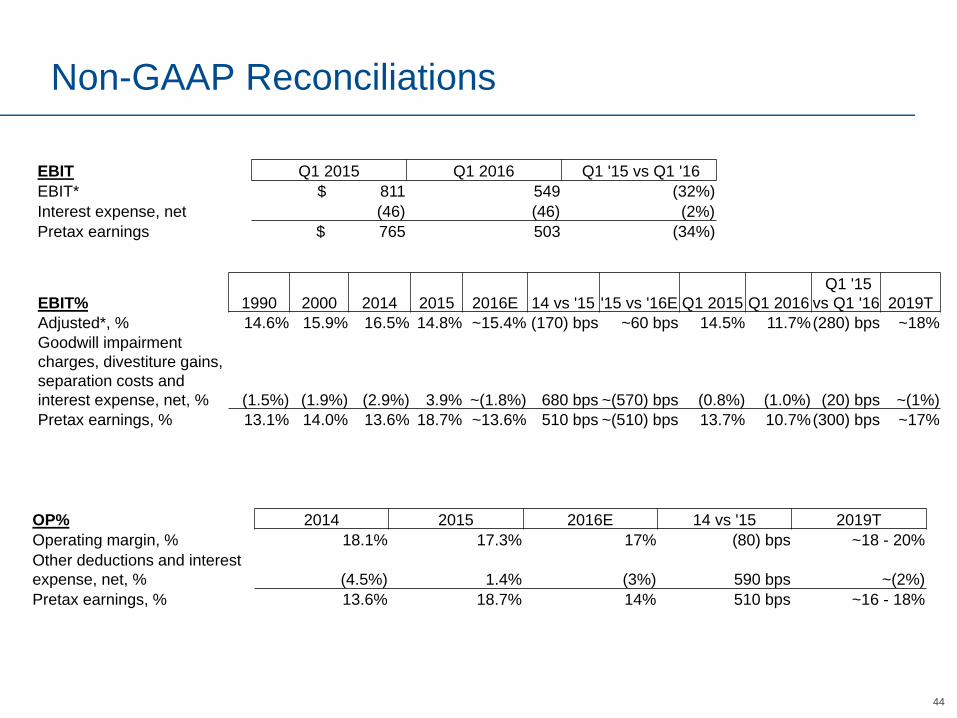
Non-GAAP Reconciliations
EBIT Q1 2015 Q1 2016 Q1 '15 vs Q1 '16EBIT* $ 811 549 (32%)Interest expense, net (46) (46) (2%)Pretax earnings $ 765 503 (34%)
EBIT% 1990 2000 2014 2015 2016E 14 vs '15 '15 vs '16E Q1 2015 Q1 2016Q1 '15
vs Q1 '16 2019TAdjusted*, % 14.6% 15.9% 16.5% 14.8% ~15.4% (170) bps ~60 bps 14.5% 11.7%(280) bps ~18%Goodwill impairment charges, divestiture gains, separation costs and interest expense, net, % (1.5%) (1.9%) (2.9%) 3.9% ~(1.8%) 680 bps ~(570) bps (0.8%) (1.0%) (20) bps ~(1%)Pretax earnings, % 13.1% 14.0% 13.6% 18.7% ~13.6% 510 bps ~(510) bps 13.7% 10.7%(300) bps ~17%
OP% 2014 2015 2016E 14 vs '15 2019TOperating margin, % 18.1% 17.3% 17% (80) bps ~18 - 20%Other deductions and interest expense, net, % (4.5%) 1.4% (3%) 590 bps ~(2%)Pretax earnings, % 13.6% 18.7% 14% 510 bps ~16 - 18%
45
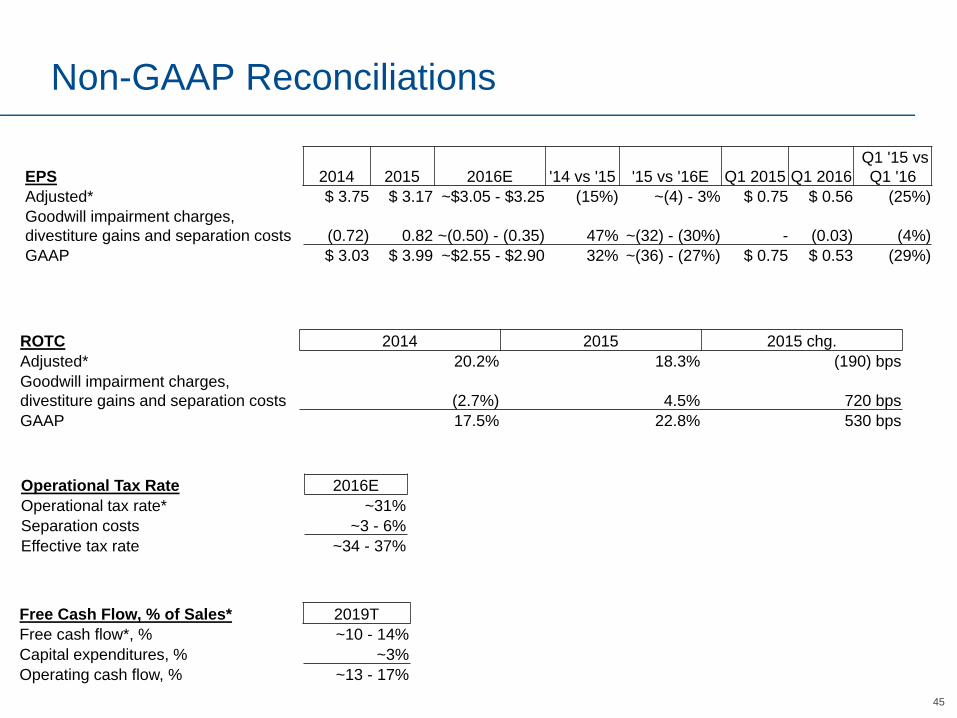
Non-GAAP Reconciliations
EPS 2014 2015 2016E '14 vs '15 '15 vs '16E Q1 2015 Q1 2016Q1 '15 vs Q1 '16
Adjusted* $ 3.75 $ 3.17 ~$3.05 - $3.25 (15%) ~(4) - 3% $ 0.75 $ 0.56 (25%)Goodwill impairment charges, divestiture gains and separation costs (0.72) 0.82 ~(0.50) - (0.35) 47% ~(32) - (30%) - (0.03) (4%)GAAP $ 3.03 $ 3.99 ~$2.55 - $2.90 32% ~(36) - (27%) $ 0.75 $ 0.53 (29%)
ROTC 2014 2015 2015 chg.Adjusted* 20.2% 18.3% (190) bpsGoodwill impairment charges, divestiture gains and separation costs (2.7%) 4.5% 720 bpsGAAP 17.5% 22.8% 530 bps
Operational Tax Rate 2016EOperational tax rate* ~31%Separation costs ~3 - 6%Effective tax rate ~34 - 37%
Free Cash Flow, % of Sales* 2019TFree cash flow*, % ~10 - 14%Capital expenditures, % ~3%Operating cash flow, % ~13 - 17%

46
Non-GAAP Reconciliations
Automation Solutions2016E
Pro FormaUnderlying* (8) - (6%)Acq./Div./FX (2%)GAAP Reported (10) - (8%)
Commercial & Residential Solutions2016E
Pro FormaUnderlying* 1 - 3%Acq./Div./FX (2%)GAAP Reported (1) - 1%
Debt / EBITDA* 2015 2016PFDebt / EBITDA, adjusted* 1.7 1.3
Impact of planned strategic actions, divestiture gains, separation costs, depreciation and amortization, interest expense, net and income taxes 0.8 0.8 Debt / Net earnings 2.5 2.1
2016 Pro forma (PF) assumes all strategic actions have been completed
Recommended