California Department of Corrections and Rehabilitation
2016 Juvenile Justice
Outcome Evaluation Report Examination of Youth Released from the
Division of Juvenile Justice in Fiscal Year 2011‐12
Office of Research February 2017
You can obtain reports by contacting the Department of Corrections and Rehabilitation at the following address:
California Department of Corrections and Rehabilitation
Office of Research, Research and Evaluation Branch
1515 S Street, Suite 221N
Sacramento, California 95811
Or
On the internet at:
http://www.cdcr.ca.gov/adult_research_branch/
CDCR Office of Research
"Providing quality research, data analysis and evaluation to implement
evidence‐based programs and practices, strengthen policy, inform
management decisions and ensure accountability."
Produced by
Center for Evidence‐Based Corrections
University of California, Irvine
California Department of Corrections and Rehabilitation
Denise Allen, Chief of Research
Kevin Grassel, Systems Software Specialist lll
This report would not have been possible without the generous support of others. Specifically, the authors would like to thank the following:
the Department of Justice for the data‐sharing agreement that allows us to examine arrests and convictions; and Ashley Gabbard, with CDCR’s
Office of Research for coordinating this work as well as staff from Center for Evidence‐Based Corrections for leading the analyses.
Permission is granted to reproduce reports.
For questions regarding the contents of this report, please contact Kevin Grassel, Office of Research

i
2016 Juvenile Justice Outcome Evaluation Report
Table of Contents
1 Introduction .......................................................................................................................................... 1
2 Evaluation Design .................................................................................................................................. 4
Objectives and Purpose of the Evaluation .................................................................................... 4
Definition of Recidivism ................................................................................................................ 4
Methods ........................................................................................................................................ 4
2.3.1 Sample Selection and Limitations ......................................................................................... 5
2.3.2 Data Sources and Analysis .................................................................................................... 5
3 Description of Release Cohort .............................................................................................................. 7
Juvenile Demographics and Characteristics .................................................................................. 7
4 Overall DJJ Youth Recidivism Rates ..................................................................................................... 10
DJJ Return .................................................................................................................................... 10
DAI Return/Commitment ............................................................................................................ 11
Any State‐Level Incarceration (Return to DJJ or Return/Commitment to DAI) .......................... 12
Arrests ......................................................................................................................................... 13
4.4.1 Arrest Rate .......................................................................................................................... 13
4.4.2 Type of Arrest ...................................................................................................................... 14
4.4.3 Count of Arrests .................................................................................................................. 15
Convictions .................................................................................................................................. 16
4.5.1 Conviction Rate ................................................................................................................... 16
4.5.2 Conviction Type ................................................................................................................... 17
4.5.3 Count of Convictions ........................................................................................................... 18
5 Rates by Type of Release .................................................................................................................... 19
6 Time to Return .................................................................................................................................... 21
7 Rates by Juvenile Demographics ......................................................................................................... 22
Gender ........................................................................................................................................ 22
Race/Ethnicity ............................................................................................................................. 22
Age at Admission ......................................................................................................................... 23
Age at Release ............................................................................................................................. 23
8 Rates by Juvenile Characteristics ........................................................................................................ 24
Juvenile Offender Type ............................................................................................................... 24
Commitment Offense Category .................................................................................................. 26

ii
2016 Juvenile Justice Outcome Evaluation Report
Commitment Offenses ................................................................................................................ 27
9 Conclusion ........................................................................................................................................... 29
Appendix A .................................................................................................................................................. 30
Demographics and Characteristics of Youth Released from DJJ by Juvenile Offender Type .................. 30
Appendix B .................................................................................................................................................. 32
Recidivism Rates for Youth Released in FY 2007‐08 through FY 2011‐12 .............................................. 32
Appendix C .................................................................................................................................................. 35
One‐Year, Two‐Year, and Three‐Year Recidivism Rates by Fiscal Year ................................................... 35
Appendix D .................................................................................................................................................. 38
Definition of Terms ................................................................................................................................. 38

iii
2016 Juvenile Justice Outcome Evaluation Report
List of Tables and Figures
Tables
Table 1. Description of Youth Released from DJJ in FY 2011‐12 ................................................................... 9
Table 2. Rates of DJJ Return by Juvenile Offender Type, FY 2011‐12 Releases .......................................... 10
Table 3. Rates of DAI Return/Commitment by Juvenile Offender Type, FY 2011‐12 Releases .................. 11
Table 4. Rates of Return to Any State‐Level Incarceration by Juvenile Offender Type, FY 2011‐12 Releases
.................................................................................................................................................................... 12
Table 5. Arrest Rates by Juvenile Offender Type, FY 2011‐12 Releases ..................................................... 13
Table 6. Type of Arrest, FY 2011‐12 Releases ............................................................................................. 14
Table 7. Count of Arrests, FY 2011‐12 Releases ......................................................................................... 15
Table 8. Three‐Year Conviction Rate by Juvenile Offender Type, FY 2011‐12 Releases ............................. 16
Table 9. Type of Conviction, FY 2011‐12 Releases ...................................................................................... 17
Table 10. Count of Convictions, FY 2011‐12 Releases ................................................................................ 18
Table 11. Three‐Year Recidivism Rates for First Releases and Re‐Releases, FY 2011‐12 ........................... 20
Table 12. Three‐Year Quarterly and Cumulative Rate of Return for the 252 Youth Returning to any State‐
Level Incarceration During the Three‐Year Follow‐Up Period .................................................................... 21
Table 13. Three‐Year Recidivism Rates by Gender, FY 2011‐12 Releases .................................................. 22
Table 14. Three‐Year Recidivism Rates by Race/Ethnicity, FY 2011‐12 Releases ....................................... 22
Table 15. Three‐Year Recidivism Rates by Age at Admission, FY 2011‐12 Releases .................................. 23
Table 16. Three‐Year Recidivism Rates by Age at Release, FY 2011‐12 Releases ....................................... 23
Table 17. Three‐Year Recidivism Rates by Juvenile Offender Type, FY 2011‐12 ........................................ 25
Table 18. Three‐Year Recidivism Rates by Commitment Offense Category, FY 2011‐12 Releases ............ 26
Table 19. Three‐Year Return to State‐Level Incarceration Rate by Commitment Offense, FY 2011‐12
Releases ...................................................................................................................................................... 28
iv
2016 Juvenile Justice Outcome Evaluation Report
Figures
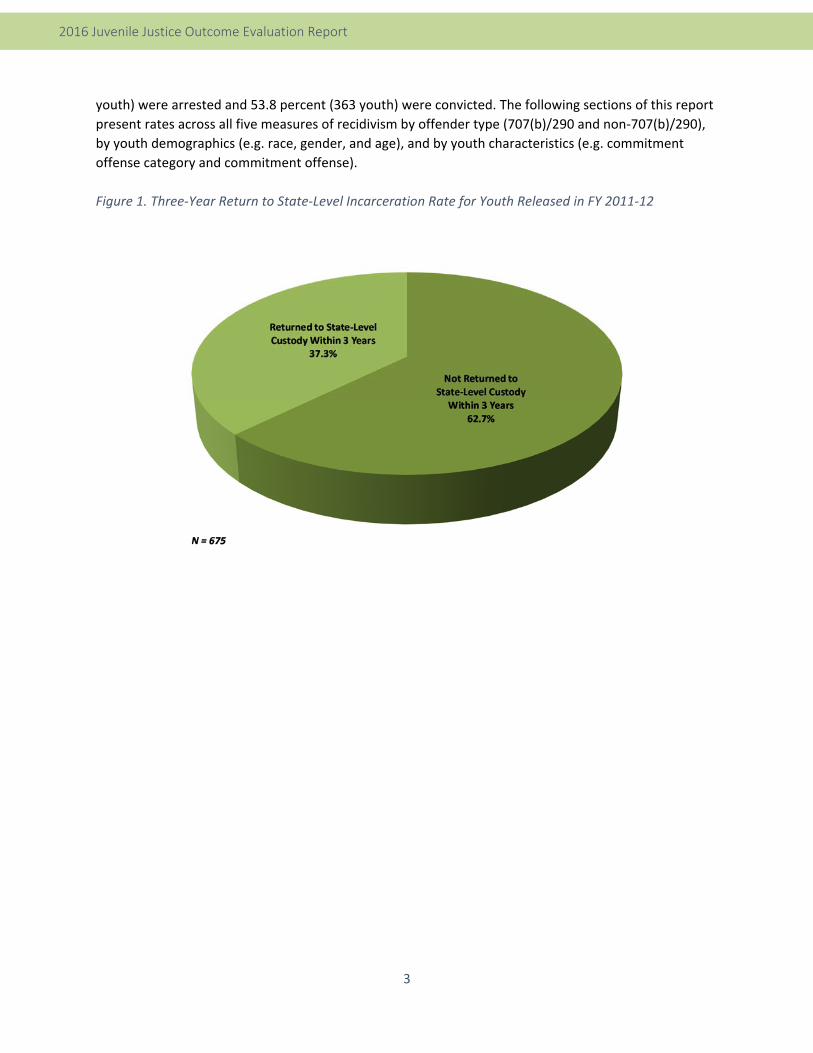
Figure 1. Three‐Year Return to State‐Level Incarceration Rate for Youth Released in FY 2011‐12 ............. 3
Figure 2. Rates of DJJ Return by Juvenile Offender Type, FY 2011‐12 Releases ......................................... 10
Figure 3. Rates of DAI Return/Commitment by Juvenile Offender Type, FY 2011‐12 Releases ................. 11
Figure 4. Rates of Return to Any State‐Level Incarceration by Juvenile Offender Type, FY 2011‐12
Releases ...................................................................................................................................................... 12
Figure 5. Arrest Rates by Juvenile Offender Type, FY 2011‐12 Releases .................................................... 13
Figure 6. Three‐Year Conviction Rate by Juvenile Offender Type, FY 2011‐12 Releases ........................... 16
Figure 7. Recidivism Rate by Release Status, FY 2011‐12 ........................................................................... 19
Figure 8. Three‐Year Quarterly and Cumulative Rate of Return for the 252 Youth Returning to any State‐
Level Incarceration During the Three‐Year Follow‐Up Period .................................................................... 21
Figure 9. Three‐Year Recidivism Rates by Juvenile Offender Type, FY 2011‐12 ......................................... 24
Figure 10. Three‐Year Recidivism Rates by Commitment Offense Category, FY 2011‐12 Releases ........... 26
Figure 11. Three‐Year Return to State‐Level Incarceration Rate by Commitment Offense, FY 2011‐12
Releases ...................................................................................................................................................... 27
v
2016 Juvenile Justice Outcome Evaluation Report
Executive Summary
As a division of the California Department of Corrections and Rehabilitation (CDCR), the Division of
Juvenile Justice (DJJ) provides education and treatment to California’s most serious and violent youthful
offenders and juveniles sex offenders with the most intense treatment needs. Today in California, most
juvenile offenders are committed to county‐level facilities in their home communities where they can be
closer to their families and community‐based treatment services that are vital to rehabilitation. As such,
DJJ’s population has diminished in size and has become more serious with respect to their offense
histories. Currently, DJJ’s population represents less than one percent of the estimated 86,823 youth
arrested in California each year.1
The CDCR 2016 Juvenile Justice Outcome Evaluation Report presents the rate of recidivism of youth
discharged from DJJ during Fiscal Year (FY) 2011‐12. This report employs multiple recidivism measures
including rates for a return to DJJ, a return to the Division of Adult Institutions (DAI), or a return to either
DJJ or DAI (i.e., any state‐level correctional institution) for a three‐year follow‐up period. Recidivism is
also measured by tracking arrests and convictions (in California only) of the release cohort for the three‐
year follow‐up period. In FY 2011‐12, a total of 675 youth were released from DJJ and tracked for three
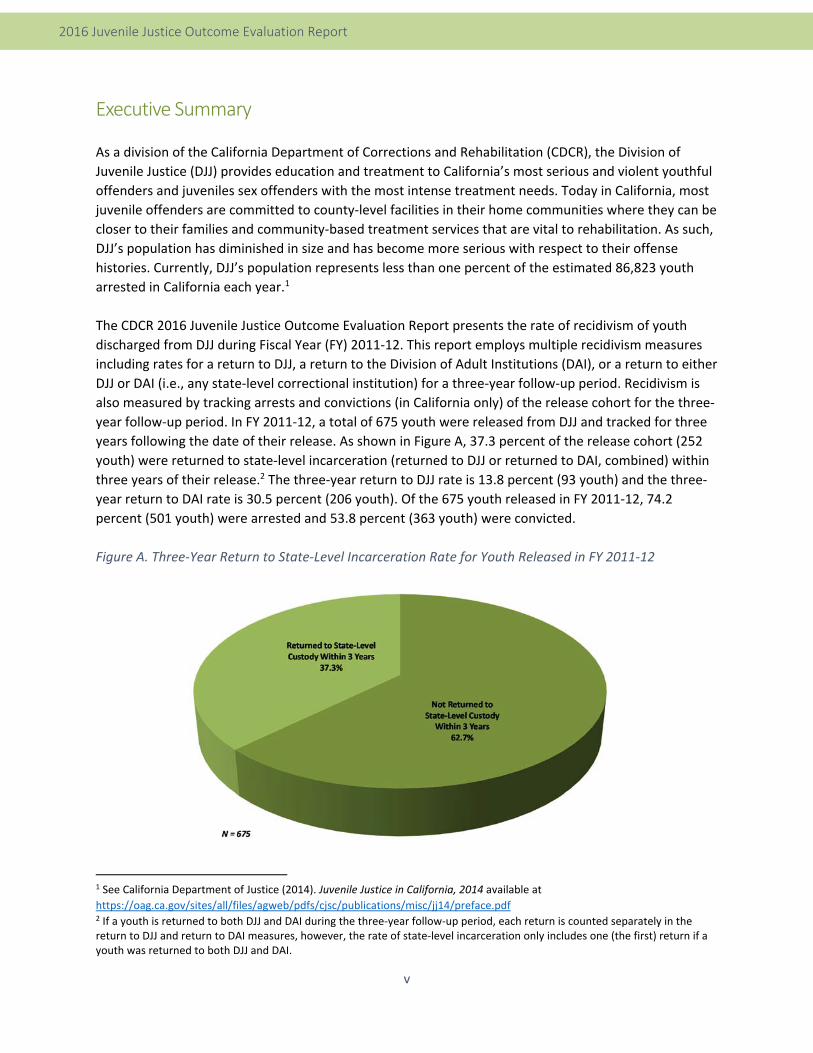
years following the date of their release. As shown in Figure A, 37.3 percent of the release cohort (252
youth) were returned to state‐level incarceration (returned to DJJ or returned to DAI, combined) within
three years of their release.2 The three‐year return to DJJ rate is 13.8 percent (93 youth) and the three‐
year return to DAI rate is 30.5 percent (206 youth). Of the 675 youth released in FY 2011‐12, 74.2
percent (501 youth) were arrested and 53.8 percent (363 youth) were convicted.
Figure A. Three‐Year Return to State‐Level Incarceration Rate for Youth Released in FY 2011‐12
1 See California Department of Justice (2014). Juvenile Justice in California, 2014 available at
https://oag.ca.gov/sites/all/files/agweb/pdfs/cjsc/publications/misc/jj14/preface.pdf 2 If a youth is returned to both DJJ and DAI during the three‐year follow‐up period, each return is counted separately in the return to DJJ and return to DAI measures, however, the rate of state‐level incarceration only includes one (the first) return if a youth was returned to both DJJ and DAI.
vi
2016 Juvenile Justice Outcome Evaluation Report
In 2007, Senate Bill (SB) 81 was passed and continued the fundamental shift of keeping lower‐level
juvenile offenders close to home so they could be near local treatment services and receive support
from their families and the community at large. Only youth whose most recent sustained offense was
listed under the Welfare and Institutions Code (W&IC) 707(b), violent offenses, or an offense listed in
Penal Code (PC) 290.008, sex offenses, (henceforth, “707(b)/290”) are eligible for commitment to DJJ. In
addition, this legislation required that remaining non‐707(b) offenders be returned to the county of
commitment upon release for community supervision, rather than DJJ parole. Due to the fundamental
shift in the types of youth eligible for commitment to DJJ with the passage of SB 81, this report provides
rates for the 619 released 707(b)/290 youth, as well as the 56 released non‐707(b)/290 youth. The rates
for the 619 released 707(b)/290 youth were higher across all five measures of recidivism than non‐
707(b)/290 youth.
In addition to the overall rates, rates for the five measures of recidivism by youth demographics (e.g.
race, gender, and age) and youth characteristics (e.g. commitment offense category, commitment
offense and juvenile offender type) are also provided in this report. As discussed in the following
sections, this report employs a different methodology than previous reports, therefore, the rates of
recidivism presented in this report may be used as a baseline rate for future analyses conducted by the
Department, however, direct comparisons between the rates presented in this report and previous
reports cannot be made.
In keeping with the CDCR’s goal of developing a comprehensive system of program evaluation, these
recidivism rates may be used to monitor DJJ’s population over time, investigate the relationship
between youth’s risk to recidivate, and to evaluate the effectiveness of DJJ programs, policies, and
procedures. This report employs a different methodology than previous analyses of DJJ youth. While
direct comparisons between past reports and the rates in this report should not be made, the recidivism
rates presented in the following sections of this report may serve as baseline rates for future analyses
conducted by the CDCR and in order to monitor changes in youth’s risk to recidivate over time.
In February 2016, the class‐action lawsuit known as Farrell v Kernan3 was terminated after DJJ fully
implemented sweeping reforms to the juvenile system. Among the many reforms was the
implementation of the Integrated Behavior Treatment Model (IBTM), a comprehensive approach to
assessing, understanding, and treating youth. The IBTM is intended to reduce institutional violence and
the risk of future criminal behavior by working with youth to prioritize and achieve goals for successful
community living. The DJJ adopted the IBTM as the foundation for developing and implementing the
education, mental health, and treatment model for committed youth. The IBTM provides collaborative
services and evidence‐based interventions and programs that develop youths’ skills for success. The
data presented in this report pre‐dates some of the important reforms that took place near the
conclusion of the lawsuit; therefore, more time is needed to fully understand the long‐term impacts of
DJJ programs on recidivism.
3 Margaret Farrell v. Scott Kernan (Case No. RG 03079344). Stipulation and Order Dismissing Consent Decree with Prejudice,
dated February 25, 2016.
vii
2016 Juvenile Justice Outcome Evaluation Report
Key Findings
Overall DJJ Youth Recidivism Rates
At the end of the three‐year follow‐up period:
13.8 percent (93 youth) of the 675 youth released from DJJ in FY 2011‐12 were returned to DJJ.
30.5 percent (206 youth) were returned or committed to DAI.
37.3 percent (252 youth) were returned to state‐level incarceration (i.e., returned to DJJ and/or DAI, combined).4
74.2 percent (501 youth) were arrested.
53.8 percent (363 youth) were convicted.
Over 64 percent of youth who returned to state‐level incarceration did so within 18 months of their release from DJJ.
Additional Findings
Youth who were re‐released (i.e., released from an institution after serving time for a supervision violation or a recommitment) from incarceration were more likely to recidivate by every measure when compared to youth who were released for the first time from a DJJ institution. The return to state‐level custody rate was 55.5 percent (161 youth) for re‐releases and 23.6 percent (91 youth) for first releases.
In general, males were more likely to recidivate than females, although the number of females released was very small (27 female youth). While 38.4 percent of males (249 youth) were returned to state‐level custody, 11.1 percent of females (3 female youth) were returned to state‐level custody.
Black youth were most likely to be incarcerated at any state‐level commitment (51.2 percent or 126 youth), followed by Hispanic youth (30.4 percent or 102 youth), and White youth (25.7 percent or 18 youth).
The proportion of non‐707(b)/290 youth has diminished significantly in the last 5 years to 56 youth in the current cohort. In general, 707(b)/290 youth were more likely to recidivate across all measures. While 5.4 percent of the non‐707(b)/290 youth (3 of the 56 releases) were returned to state‐level custody, 40.2 percent of the 707(b)/290 youth (249 of the 619 releases) were returned to state‐level custody.
4 To avoid double‐counting, we only included a youth’s first return if he or she was admitted to both DJJ and DAI during the three‐year follow‐up period.

1
2016 Juvenile Justice Outcome Evaluation Report
California Department of Corrections and Rehabilitation 2016 Juvenile Justice Outcome Evaluation Report
1 Introduction
California’s juvenile justice system is comprised of county and state‐level facilities, each operating
evidence‐based rehabilitative programs. Compared to other states, California’s state‐level juvenile
justice system serves an older youth population who commit more serious and violent offenses. During
FY 2011‐12, the Division of Juvenile Justice was responsible for the confinement and rehabilitation of
youth adjudicated or sentenced to state‐level custody. Youth released from DJJ prior to February 2011
were released to state‐level parole, while youth released after February 2011, like the cohort presented
in this report, were released to their county of commitment for community supervision.
In 2007, SB 81 was passed and continued the fundamental shift of keeping lower‐level juvenile
offenders close to home so they could be near local treatment services and receive support from their
families and the community at large. This legislation limited the type of youth eligible for commitment
to DJJ. Only youth whose most recent sustained offense was listed under the Welfare and Institutions
Code (W&IC) 707(b), violent offenses, or an offense listed in Penal Code (PC) 290.008, sex offenses,
(henceforth, “707(b)/290”) are eligible for commitment to DJJ. In addition, this legislation required that
remaining non‐707(b) offenders be returned to the county of commitment upon release for community
supervision, rather than DJJ parole. It is also important to note W&IC 707(b) commitments to DJJ prior
to 2012 had their jurisdictional age set at age 25. As of July 1, 2013, SB 1021 changed jurisdictional age
from age 25 W&IC 1769(b) to age 23 W&IC 1769(c) for W&IC 707(b) offenders.
This report employs a different methodology than previous reports, therefore, the rates of recidivism
presented in this report may be used as baseline rates for future analyses conducted by the
Department, however, direct comparisons between the rates presented in this report and previous
reports cannot be made. This analysis is provided for use by CDCR executives and managers, lawmakers,
other correctional stakeholders, and California citizens who have an interest in the dynamics of youthful
offenders’ behaviors and in reducing juvenile recidivism rates.
Definition of Recidivism
Understanding the rate of recidivism for the DJJ population is complicated because it occurs at the
intersection of juvenile and adult corrections. It is not simply the case that individuals under the age of
18 go to DJJ and individuals over 18 go to DAI. In reality, DJJ can and does house and provide treatment
services for offenders over the age of 18. Most youth who are released from DJJ are no longer
“juveniles” (i.e., younger than 18), however, that may not necessarily mean they would be committed to
an adult institution for a supervision violation. In contrast, a youth in DJJ can commit offenses while in
DJJ that could send them to DAI for a new term. When youth under the jurisdiction of DJJ are released
and reoffend, they could be handled exclusively at the county‐level, in which case arrest and conviction
information is useful. They could be returned to a DJJ institution, or they could be committed to state

2
2016 Juvenile Justice Outcome Evaluation Report
prison and be placed at a DAI institution. For these reasons, multiple measures are utilized to better
assess recidivism patterns.
Furthermore, there is no universally agreed‐upon definition of recidivism for juvenile offenders in
California. Recently the California Board of State and Community Corrections (BSCC) developed a
definition, in response to Assembly Bill 1050, for adults defined as “a new felony or misdemeanor
committed within three years of release from custody or committed within three years of placement on
supervision for a previous criminal conviction.” However, even the committee that drafted the definition
acknowledged different supplemental measures may be used. Thus, although there are numerous ways
to define recidivism, for this report DJJ defines recidivism as follows:
A return to DJJ custody, a return or commitment to DAI custody, an arrest, or a conviction within three
years of release from DJJ custody.
Recidivism Measures
This report includes multiple measures of recidivism or re‐offending because of the limitations and benefits of the data for each available measure. This analysis includes five measures of recidivism to offer the most complete picture of the likelihood of re‐offending after incarceration in DJJ. The recidivism measures and their components are: 1) Return or Recommitment to the Division of Juvenile Justice 2) Return or Commitment to the Division of Adult Institutions 3) Return to any state‐level institution (returned to DJJ or returned to DAI, combined) 4) Arrest
Type of Arrest (felony versus misdemeanor)
Number of Arrests 5) Conviction
Type of Conviction (felony versus misdemeanor)
Number of Convictions
Recidivism Rates
Figure 1 shows the three‐year, state‐level incarceration recidivism rate for youth released in FY 2011‐12.
In other words, it shows the percent of youth released from DJJ in FY 2011‐12 who were returned to DJJ
and/or DAI within the three years following release. Of the 675 youth who were released from DJJ in this
cohort, 62.7 percent, or 423 youth, were not returned to any state‐level incarceration within three
years. In contrast, 252 youth, or 37.3 percent were returned to either DJJ or DAI within the three‐year
follow‐up period. The three‐year return to DJJ rate is 13.8 percent (93 youth) and the three‐year return
to DAI rate is 30.5 percent (206 youth).5 Of the 675 youth released in FY 2011‐12, 74.2 percent (501
5 If a youth is returned to both DJJ and DAI during the three‐year follow‐up period, each return is counted separately in the return to DJJ and return to DAI measures, however, the rate of state‐level incarceration only includes one (the first) return if a youth was returned to both DJJ and DAI.
3
2016 Juvenile Justice Outcome Evaluation Report
youth) were arrested and 53.8 percent (363 youth) were convicted. The following sections of this report
present rates across all five measures of recidivism by offender type (707(b)/290 and non‐707(b)/290),
by youth demographics (e.g. race, gender, and age), and by youth characteristics (e.g. commitment
offense category and commitment offense).
Figure 1. Three‐Year Return to State‐Level Incarceration Rate for Youth Released in FY 2011‐12

4
2016 Juvenile Justice Outcome Evaluation Report
2 Evaluation Design
Objectives and Purpose of the Evaluation
The purpose of this evaluation is to report the recidivism rates for youth released from DJJ and to
examine how these rates vary by time (to return) and person (personal and juvenile offender
characteristics).
Definition of Recidivism
This report defines recidivism as:
A return to DJJ custody, a return or commitment to DAI custody, an arrest, or conviction within
three years of release from DJJ custody.
This definition differs from definitions in other reports. The 2010 Juvenile Justice Outcome Evaluation
Report indicates the intention was always to expand the DJJ recidivism definition to include convictions
as separate recidivism measures. Due to factors related to cohort selection and definitions of recidivism,
recidivism rates reported in this document may not match previous reports. This was necessary to
ensure the most accurate results.
For the purpose of this report, the recidivism rate is calculated using the ratio of the number of youth in
the release cohort who were returned to DJJ, and or returned/committed to DAI, arrested, or convicted
during the recidivism period (recidivists) to the total number of youth in the release cohort, multiplied
by 100.
Recidivism Rate = Number of Recidivists
X 100 Total Release Cohort
Methods
This report contains the recidivism rates from a three‐year follow‐up period for DJJ youth released from
a CDCR facility between July 1, 2011 and June 30, 2012 (FY 2011‐12). The release cohort includes youth
who were released for the first time on their current term as well as those who were re‐released after a
previous return to custody. Re‐released youth were those released prior to FY 2011‐12, who violated
and were returned to DJJ on the same term, and then were re‐released during FY 2011‐12. In some
instances, a youth may be serving concurrent sentences in DJJ and DAI. Concurrent jurisdiction cases
have two release dates, the release from DJJ (even if they are still incarcerated in DAI) and a release
from DAI date (even if they may still be incarcerated in DJJ). In these cases, the date that the youth was
shown to have been released from both sentences was used as the “release date” regardless of whether
5
2016 Juvenile Justice Outcome Evaluation Report
the last stay was in a DJJ facility or a DAI facility. Youth whose new release dates were no longer in FY
2011‐12 were moved into their correct cohort.
Historically, these outcome reports offer a variety of tables and figures that reflect multiple‐year trends.
The method for calculation of recidivism in this report is not the same as previous reports. The
introduction of the Strategic Offender Management System (SOMS) system has improved the quality of
data related to return to DAI facilities. The new calculation of release dates for concurrent jurisdiction
cases and updates to the California Law Enforcement Telecommunications System (CLETS) dataset for
state arrest and conviction data have all refined the calculation of recidivism from previous reports. As
such, the rates of recidivism should not be directly compared to previous reports. We have provided
longitudinal trends from the years in which recidivism rates were calculated, FY 2007‐08 to FY 2011‐12,
in the appendix of this document for context, however, direct comparisons between the rates provided
in Appendix B and the rates provided for the FY 2010‐11 cohort presented in this report should not be
made.
2.3.1 Sample Selection and Limitations
An individual was included in this sample if he/she was either discharged from DJJ custody or released to
supervision between July 1, 2011 and June 30, 2012 (see definition of “DJJ Population” in the Definition
of Terms section of this report for more specifics). As stated in the previous section, if a concurrent
jurisdiction case had an actual release date that was not in FY 2011‐12 the juvenile offender was moved
into the correct release cohort. In this report, each person can only appear as a release one time. The
same individual can be represented across different fiscal years (i.e., different yearly reports) for any
release and re‐release, but they will only be in each fiscal year cohort one time.
Typically, the CDCR does not calculate recidivism rates for offender releases (i.e. denominators) that are
under 30 records. Due to the small number of overall records (675 releases) contained in this report,
recidivism rates are presented for subgroups of juvenile offenders under 30. Because these subgroups
may be influenced by nuances associated with each case, caution should be exercised when interpreting
results associated with fewer records.
2.3.2 Data Sources and Analysis
Data from three systems was used and analyzed in this report. Once the cohort was selected, data
managed by DJJ through the Offender Based Information Tracking System (OBITS) was used to
determine which individuals in the cohort had been returned to a DJJ institution within three years after
their release date for either a new commitment or a supervision violation. This information is captured
in the dependent measure, “Return to DJJ.” OBITS data also provided juvenile offender and
incarceration characteristics. The CDCR also maintains SOMS and each cohort record was matched with
any record of a commitment to DAI within three years of the release date (i.e., “Return to DAI”). Finally,
the California Department of Justice (DOJ) provided data regarding the arrest and conviction history of
the sample using the CLETS using the DOJ identifier. Youth who had a subsequent arrest and/or

6
2016 Juvenile Justice Outcome Evaluation Report
conviction within three years after release from a CDCR institution are reflected in the “Arrest” and
“Conviction” sections of this report. The details of each arrest and conviction were also analyzed for this
report.
7
2016 Juvenile Justice Outcome Evaluation Report
3 Description of Release Cohort
The passage of California Senate Bill (SB) 81 and California Assembly Bill (AB) 191 in 2007 mandates that
only youth with a sex offense requiring registration as a sex offender (PC 290), youth with violent and/or
serious offenses [W&IC 707(b)], and youth committed to DJJ from adult court may be committed to DJJ.
As youth who do not meet these criteria are now retained in county facilities, the DJJ youth population
has diminished in size and has more serious offense histories. While youth who are not 707(b)/290 are
no longer committed to DJJ, a small subset (56 youth) of DJJ youth who had previously been
incarcerated before SB 81 and AB 191 had been released in this cohort. Previous reports on the DJJ
population present direct comparisons between 707(b)/290 and non‐707(b)/290 (e.g., 2010 Juvenile
Justice Outcome Evaluation Report). Due to the small size of this group, comparisons between these two
groups are available primarily in Appendix A.
In February 2016, the class‐action lawsuit known as Farrell v Kernan6 was terminated after DJJ fully
implemented sweeping reforms to the juvenile system. Among the many reforms was the
implementation of the IBTM, a comprehensive approach to assessing, understanding, and treating
youth. The data presented in this report pre‐dates some of the important reforms that took place near
the conclusion of the lawsuit; therefore, more time is needed to fully understand the long‐term impacts
of DJJ programs on recidivism.
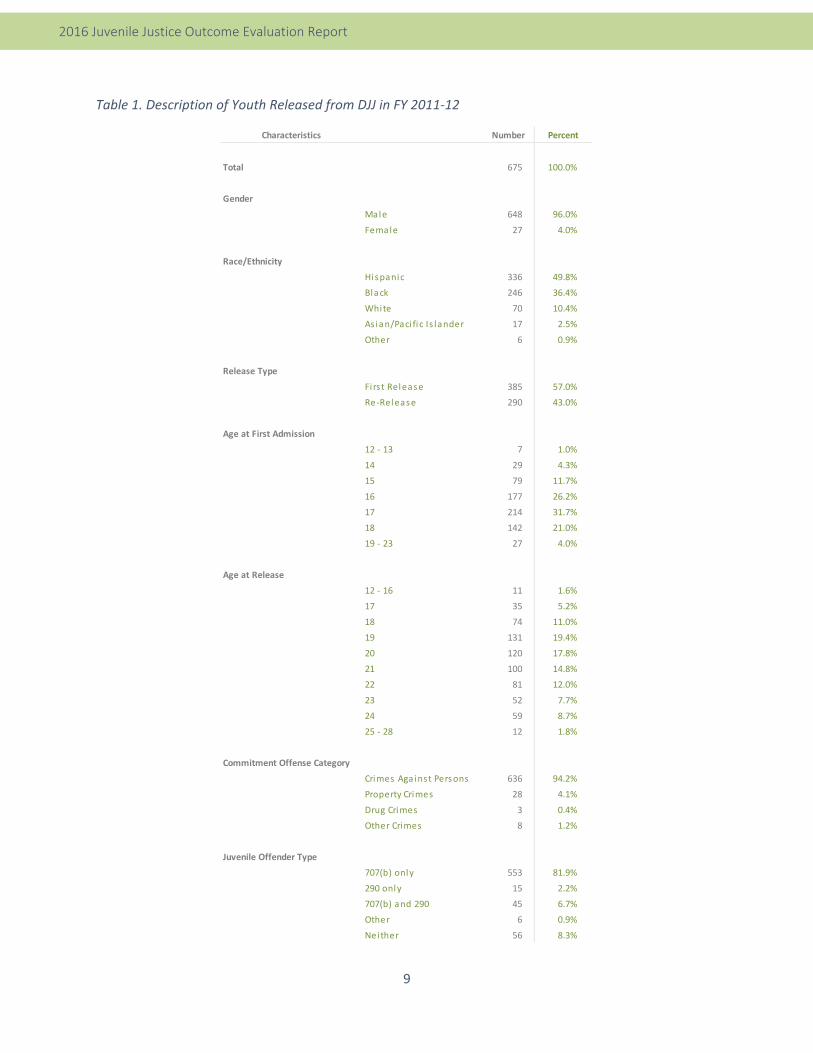
Table 1 provides a description of the cohort of youth who were released from a DJJ facility during FY
2011‐12 (675 youth in total).
Juvenile Demographics and Characteristics
The FY 2011‐12 DJJ release cohort was overwhelmingly male (96 percent or 648 youth). The largest
racial/ethnic group in the release cohort was Hispanic youth (49.8 percent or 336 youth), followed by
Black youth (36.4 percent or 246 youth), White youth (10.4 percent or 70 youth), and a small group of
Asian/Pacific Islander youth (2.5 percent or 17 youth) or those with any other racial/ethnic background
(0.9 percent or 6 youth). A majority of youth (57.0 percent or 385 youth) were being released from DJJ
for the first time, as compared to the remaining youth who were being re‐released from a previous
return.
Most youth in this cohort were 16 to 18 years old (78.9 percent or 533 youth) when they were first
admitted to DJJ. This cohort was between 12 and 28 years old when they were released from DJJ in FY
2011‐12. While rare, Welfare and Institutions Code 1800 allows the court to extend a youth’s
jurisdiction and confinement with DJJ up to two years at a time, provided the court finds that they meet
certain criteria. In addition, if a youth tried in juvenile court is committed to DJJ at a later age (over 18
for example), W&IC 1769 requires DJJ to set jurisdiction at 21, 23, or two years from date of court
action, whatever is longer. Any youth whose release date is beyond the standard jurisdictional age (21,
6 Margaret Farrell v. Scott Kernan (Case No. RG 03079344). Stipulation and Order Dismissing Consent Decree with Prejudice, dated February 25, 2016.
8
2016 Juvenile Justice Outcome Evaluation Report
23 or 25), was subject to either a W&IC 1800 extension or was committed to DJJ at a late age and
subject to W&IC. 1769. Over 93 percent of the youth (629 youth) were 18 years or older at the time of
their release.
As previously mentioned, legislation in 2007 ensured that only serious and violent juvenile offenders
were committed to DJJ. As such, it is not surprising that over 94 percent (94.2 percent or 636 youth) of
the youth in this release cohort were committed for crimes against persons. Only 4.1 percent (28 youth)
of the DJJ youth were committed for a property crime. Eleven of the FY 2011‐12 release cohort were
originally admitted for a drug or other type of crime.
Approximately 82 percent (553 youth) were 707(b) only cases (i.e., serious and/or violent crimes). Only
2.2 percent (15 youth) were 290 only cases, or registered sex offenders. And over 6 percent (45 youth)
were both 707(b) and 290. Six youth were classified as “other” which indicates that they were superior
court commitments to DJJ, whose crime would have been a 707(b) if the commitment were from a
juvenile court.7 Finally, only 8.3 percent or 56 youth included in this cohort were not a 707(b) or 290
cases. Comparisons between juvenile offender characteristics by 707(b)/290 and non‐707(b)/290
statuses are available in Appendix A.
7 Youth committed to DJJ by the superior court under W&IC 1731.5(a) who would have been designated as a 707(b) offender if the commitment had resulted from a juvenile court.
9
2016 Juvenile Justice Outcome Evaluation Report
Table 1. Description of Youth Released from DJJ in FY 2011‐12
Characteristics Number Percent
Total 675 100.0%
Gender
Male 648 96.0%
Female 27 4.0%
Race/Ethnicity
Hispanic 336 49.8%
Black 246 36.4%
White 70 10.4%
As ian/Paci fi c Is lander 17 2.5%
Other 6 0.9%
Release Type
Firs t Release 385 57.0%
Re‐Release 290 43.0%
Age at First Admission
12 ‐ 13 7 1.0%
14 29 4.3%
15 79 11.7%
16 177 26.2%
17 214 31.7%
18 142 21.0%
19 ‐ 23 27 4.0%
Age at Release
12 ‐ 16 11 1.6%
17 35 5.2%
18 74 11.0%
19 131 19.4%
20 120 17.8%
21 100 14.8%
22 81 12.0%
23 52 7.7%
24 59 8.7%
25 ‐ 28 12 1.8%
Commitment Offense Category
Crimes Against Persons 636 94.2%
Property Crimes 28 4.1%
Drug Crimes 3 0.4%
Other Crimes 8 1.2%
Juvenile Offender Type
707(b) only 553 81.9%
290 only 15 2.2%
707(b) and 290 45 6.7%
Other 6 0.9%
Neither 56 8.3%

10
2016 Juvenile Justice Outcome Evaluation Report
4 Overall DJJ Youth Recidivism Rates
DJJ Return
Figure 2. Rates of DJJ Return by Juvenile Offender Type, FY 2011‐12 Releases
Figure 2 and Table 2 show that 13.8 percent (93 youth) of those released from DJJ in FY 2011‐12 were
returned to DJJ within the three‐year follow‐up period. The rate of return to DJJ remained relatively
stable across the three years. Nearly all of the returns to DJJ occurred by the first year. There was no
change in the rate from year two to year three. None of the non‐707(b)/290 youth were returned to DJJ.
Table 2. Rates of DJJ Return by Juvenile Offender Type, FY 2011‐12 Releases
14.1% 15.0% 15.0%
0.0% 0.0% 0.0%
12.9% 13.8% 13.8%
0%
10%
20%
30%
40%
50%
60%
70%
80%
90%
100%
One‐Year Two‐Year Three‐Year
707(b)/290 Non‐707(b)/290 Total
DJJ ReturnNumber
Released
Number
Returned
Return
Rate
Number
Returned
Return
Rate
Number
Returned
Return
Rate
707(b)/290 619 87 14.1% 93 15.0% 93 15.0%
Non‐707(b)/290 56 0 0.0% 0 0.0% 0 0.0%
Total 675 87 12.9% 93 13.8% 93 13.8%
One‐Year Two‐Year Three‐Year

11
2016 Juvenile Justice Outcome Evaluation Report
DAI Return/Commitment
Figure 3. Rates of DAI Return/Commitment by Juvenile Offender Type, FY 2011‐12 Releases
Figure 3 and Table 3 present the rate of return to DAI (i.e., adult prison). In total, 30.5 percent (206
youth) of those released from DJJ in FY 2011‐12 were returned or committed to DAI within three years.
Unlike most recidivism measures, which are highest within the first year after release and then grow
slowly as the years progress, this measure actually increases steadily across the three years. In the first
year, 8.9 percent (60 youth) of the FY 2011‐12 cohort was returned to DAI. In year two, an additional
11.2 percent (74 youth, 136 total youth and 20.1 percent) were admitted to DAI. Finally, in the third
year, an additional 10.4 percent (70 youth) of the cohort was committed to DAI for a three‐year
recidivism rate of 30.5 percent of the cohort (206 youth). The youth who were returned or committed
for the first time to DAI were almost exclusively 707(b)/290 offenders.
Table 3. Rates of DAI Return/Commitment by Juvenile Offender Type, FY 2011‐12 Releases
9.7%
21.6%
32.8%
0.0%
3.6% 5.4%
8.9%
20.1%
30.5%
0%
10%
20%
30%
40%
50%
60%
70%
80%
90%
100%
One‐Year Two‐Year Three‐Year
707(b)/290 Non‐707(b)/290 Total
DAI ReturnNumber
Released
Number
Returned
Return
Rate
Number
Returned
Return
Rate
Number
Returned
Return
Rate
707(b)/290 619 60 9.7% 134 21.6% 203 32.8%
Non‐707(b)/290 56 0 0.0% 2 3.6% 3 5.4%
Total 675 60 8.9% 136 20.1% 206 30.5%
One‐Year Two‐Year Three‐Year
12
2016 Juvenile Justice Outcome Evaluation Report
Any State‐Level Incarceration (Return to DJJ or Return/Commitment to DAI)
Figure 4. Rates of Return to Any State‐Level Incarceration by Juvenile Offender Type, FY 2011‐12 Releases
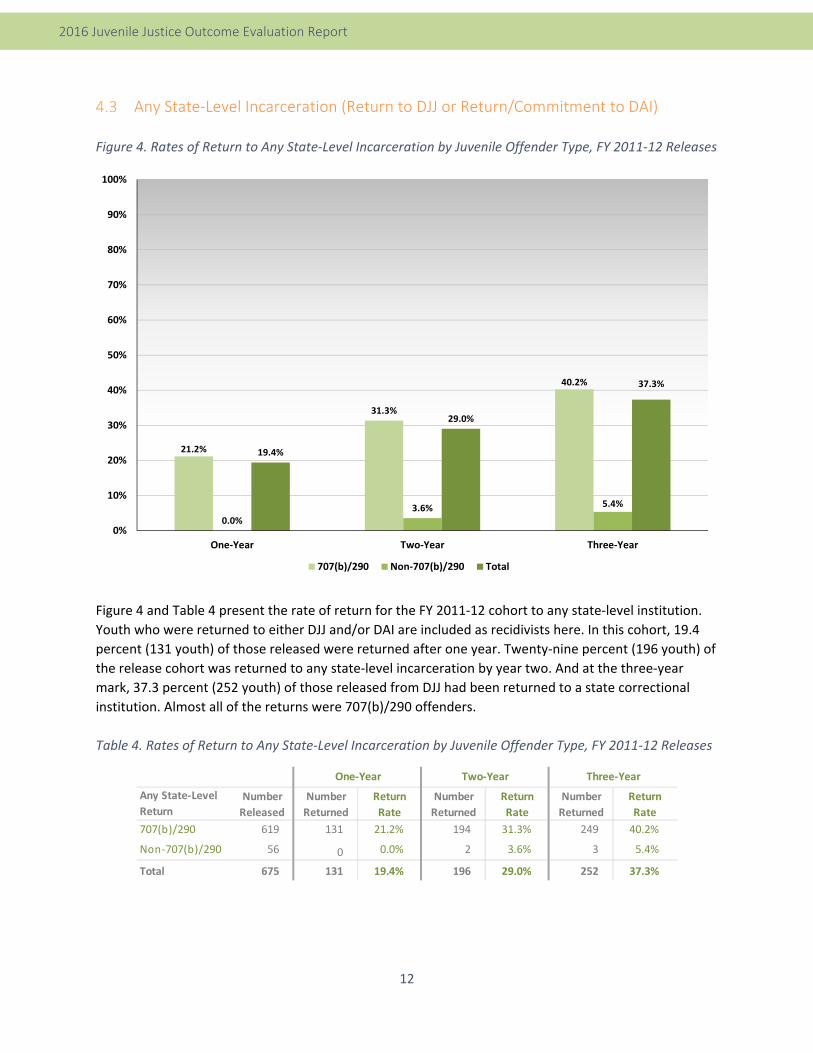
Figure 4 and Table 4 present the rate of return for the FY 2011‐12 cohort to any state‐level institution.
Youth who were returned to either DJJ and/or DAI are included as recidivists here. In this cohort, 19.4
percent (131 youth) of those released were returned after one year. Twenty‐nine percent (196 youth) of
the release cohort was returned to any state‐level incarceration by year two. And at the three‐year
mark, 37.3 percent (252 youth) of those released from DJJ had been returned to a state correctional
institution. Almost all of the returns were 707(b)/290 offenders.
Table 4. Rates of Return to Any State‐Level Incarceration by Juvenile Offender Type, FY 2011‐12 Releases
21.2%
31.3%
40.2%
0.0% 3.6% 5.4%
19.4%
29.0%
37.3%
0%
10%
20%
30%
40%
50%
60%
70%
80%
90%
100%
One‐Year Two‐Year Three‐Year
707(b)/290 Non‐707(b)/290 Total
Any State‐Level
ReturnNumber
Released
Number
Returned
Return
Rate
Number
Returned
Return
Rate
Number
Returned
Return
Rate
707(b)/290 619 131 21.2% 194 31.3% 249 40.2%
Non‐707(b)/290 56 0 0.0% 2 3.6% 3 5.4%
Total 675 131 19.4% 196 29.0% 252 37.3%
One‐Year Two‐Year Three‐Year

13
2016 Juvenile Justice Outcome Evaluation Report
Arrests
4.4.1 Arrest Rate
Figure 5. Arrest Rates by Juvenile Offender Type, FY 2011‐12 Releases
As shown in Figure 5 and Table 5, youth released from DJJ in FY 2011‐12 had a 74.2 percent (501 youth)
arrest rate by the end of three years. Most arrests (54.2 percent or 366 youth) occurred during the first
year. In general, the non‐707(b)/290 offenders were less likely to be arrested post‐release, however,
due to the small size of the group, any comparisons or generalizations about the group should be done
with caution.
Table 5. Arrest Rates by Juvenile Offender Type, FY 2011‐12 Releases
57.0%
70.8%
77.5%
23.2%
33.9%
37.5%
54.2%
67.7%
74.2%
0%
10%
20%
30%
40%
50%
60%
70%
80%
90%
100%
One‐Year Two‐Year Three‐Year
707(b)/290 Non‐707(b)/290 Total
ArrestNumber
Released
Number
Arrested
Arrest
Rate
Number
Arrested
Arrest
Rate
Number
Arrested
Arrest
Rate
707(b)/290 619 353 57.0% 438 70.8% 480 77.5%
Non‐707(b)/290 56 13 23.2% 19 33.9% 21 37.5%
Total 675 366 54.2% 457 67.7% 501 74.2%
One‐Year Two‐Year Three‐Year

14
2016 Juvenile Justice Outcome Evaluation Report
4.4.2 Type of Arrest
Table 6 reports the types of crimes for which youth released from DJJ in FY 2011‐12 were arrested
during the three‐year follow‐up period. This table reflects the most serious charge from the first arrest
within the three‐year period for the cohort. Of the 501 arrests, 86.4 percent (433 youth) of the most
serious arrests were for felonies, 12.2 percent (61 youth) were for misdemeanors, and 1.4 percent (7
youth) were for supervision violations. Of the felony arrests, most (57.3 percent) were for crimes against
persons, followed by “other” felony crimes at 12.6 percent (63 youth), felony property crimes at 10.2
percent (51 youth), and felony drug/alcohol crimes at 5.2 percent (26 youth). Over 4 percent (4.6
percent or 23 youth) were arrested for misdemeanor crimes against persons, 3.6 (18 youth) for
misdemeanor drug/alcohol crimes, 1.6 percent (8 youth) for “other” misdemeanor crimes and 1.4
percent (7 youth) for misdemeanor property crimes.
Table 6. Type of Arrest, FY 2011‐12 Releases
Number Percent
All Felonies 433 86.4%
Felony Crimes Against Persons 287 57.3%
Felony Property Crimes 51 10.2%
Felony Drug/Alcohol Crimes 26 5.2%
Felony Other Crimes 63 12.6%
Felony Unknown 6 1.2%
All Misdemeanors 61 12.2%
Misdemeanor Crimes Against Persons 23 4.6%
Misdemeanor Property Crimes 7 1.4%
Misdemeanor Drug/Alcohol Crimes 18 3.6%
Misdemeanor Other Crimes 8 1.6%
Misdemeanor Unknown 5 1.0%
All Supervision Violations 7 1.4%
Total 501 100.0%
Type of Arrest

15
2016 Juvenile Justice Outcome Evaluation Report
4.4.3 Count of Arrests
Table 7 reports the total count of arrest cycles for the FY 2011‐12 release cohort. In other words, this
table shows the number of times a juvenile offender was arrested after release from DJJ. Nearly 26
percent (174 youth) were not arrested at all after release from DJJ. Fifteen percent (101 youth) of the
cohort were arrested once. Over 12 percent (86 youth) were arrested two times after their release from
DJJ, and 11 percent (74 youth) were arrested three times. In total, 26.9 percent (181 youth) of the
release cohort was arrested 5 or more times.
Table 7. Count of Arrests, FY 2011‐12 Releases
Number of Arrests Number Percent
0 174 25.8%
1 101 15.0%
2 86 12.7%
3 74 11.0%
4 59 8.7%
5 46 6.8%
6 29 4.3%
7 26 3.9%
8 10 1.5%
9 18 2.7%
10 13 1.9%
11 10 1.5%
12+ 29 4.3%
Total 675 100.0%

16
2016 Juvenile Justice Outcome Evaluation Report
Convictions
4.5.1 Conviction Rate
Figure 6. Three‐Year Conviction Rate by Juvenile Offender Type, FY 2011‐12 Releases
Figure 6 and Table 8 report conviction rates for the FY 2011‐12 release cohort three years post‐release.
By the end of the follow‐up period, almost 54 percent (363 youth) of the cohort had been convicted of
another crime. Most of the youth who were re‐convicted were 707(b)/290 offenders.
Table 8. Three‐Year Conviction Rate by Juvenile Offender Type, FY 2011‐12 Releases
23.4%
43.9%
57.0%
5.4%
14.3%
17.9% 21.9%
41.5%
53.8%
0%
10%
20%
30%
40%
50%
60%
70%
80%
90%
100%
One‐Year Two‐Year Three‐Year
707(b)/290 Non‐707(b)/290 Total
ConvictionNumber
Released
Number
Convicted
Conviction
Rate
Number
Convicted
Conviction
Rate
Number
Convicted
Conviction
Rate
707(b)/290 619 145 23.4% 272 43.9% 353 57.0%
Non‐707(b)/290 56 3 5.4% 8 14.3% 10 17.9%
Total 675 148 21.9% 280 41.5% 363 53.8%
One‐Year Two‐Year Three‐Year
17
2016 Juvenile Justice Outcome Evaluation Report
4.5.2 Conviction Type
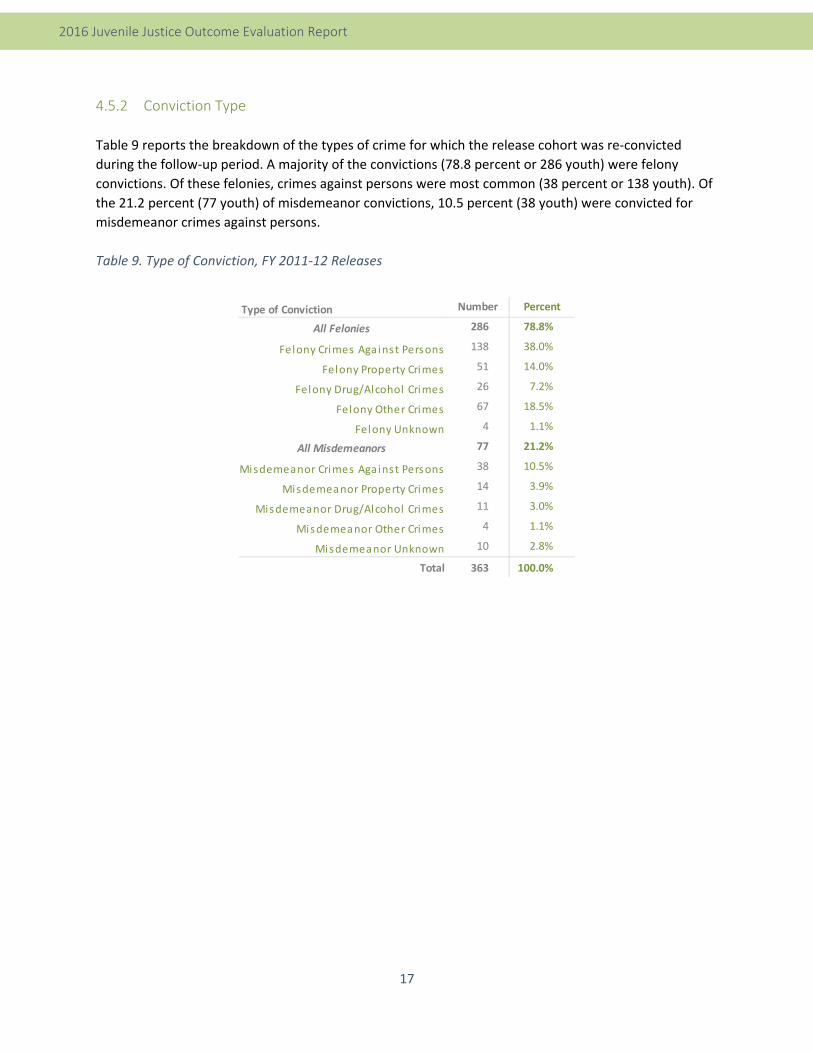
Table 9 reports the breakdown of the types of crime for which the release cohort was re‐convicted
during the follow‐up period. A majority of the convictions (78.8 percent or 286 youth) were felony
convictions. Of these felonies, crimes against persons were most common (38 percent or 138 youth). Of
the 21.2 percent (77 youth) of misdemeanor convictions, 10.5 percent (38 youth) were convicted for
misdemeanor crimes against persons.
Table 9. Type of Conviction, FY 2011‐12 Releases
Number Percent
All Felonies 286 78.8%
Felony Crimes Against Persons 138 38.0%
Felony Property Crimes 51 14.0%
Felony Drug/Alcohol Crimes 26 7.2%
Felony Other Crimes 67 18.5%
Felony Unknown 4 1.1%
All Misdemeanors 77 21.2%
Misdemeanor Crimes Against Persons 38 10.5%
Misdemeanor Property Crimes 14 3.9%
Misdemeanor Drug/Alcohol Crimes 11 3.0%
Misdemeanor Other Crimes 4 1.1%
Misdemeanor Unknown 10 2.8%
Total 363 100.0%
Type of Conviction

18
2016 Juvenile Justice Outcome Evaluation Report
4.5.3 Count of Convictions
Table 10 presents the number of conviction cycles for the FY 2011‐12 cohort. More than 46 percent (312
youth) of the cohort did not have a new conviction. Of those who did have a new conviction, most only
had 1 conviction (28.1 percent of the total cohort, 190 youth). In other words, 52.3 percent of DJJ
releases that were re‐convicted were only re‐convicted once.
Table 10. Count of Convictions, FY 2011‐12 Releases
Number of Convictions Number Percent
0 312 46.2%
1 190 28.1%
2 94 13.9%
3 44 6.5%
4 19 2.8%
5 9 1.3%
6+ 7 1.0%
Total 675 100.0%
19
2016 Juvenile Justice Outcome Evaluation Report
5 Rates by Type of Release
Figure 7. Recidivism Rate by Release Status, FY 2011‐12
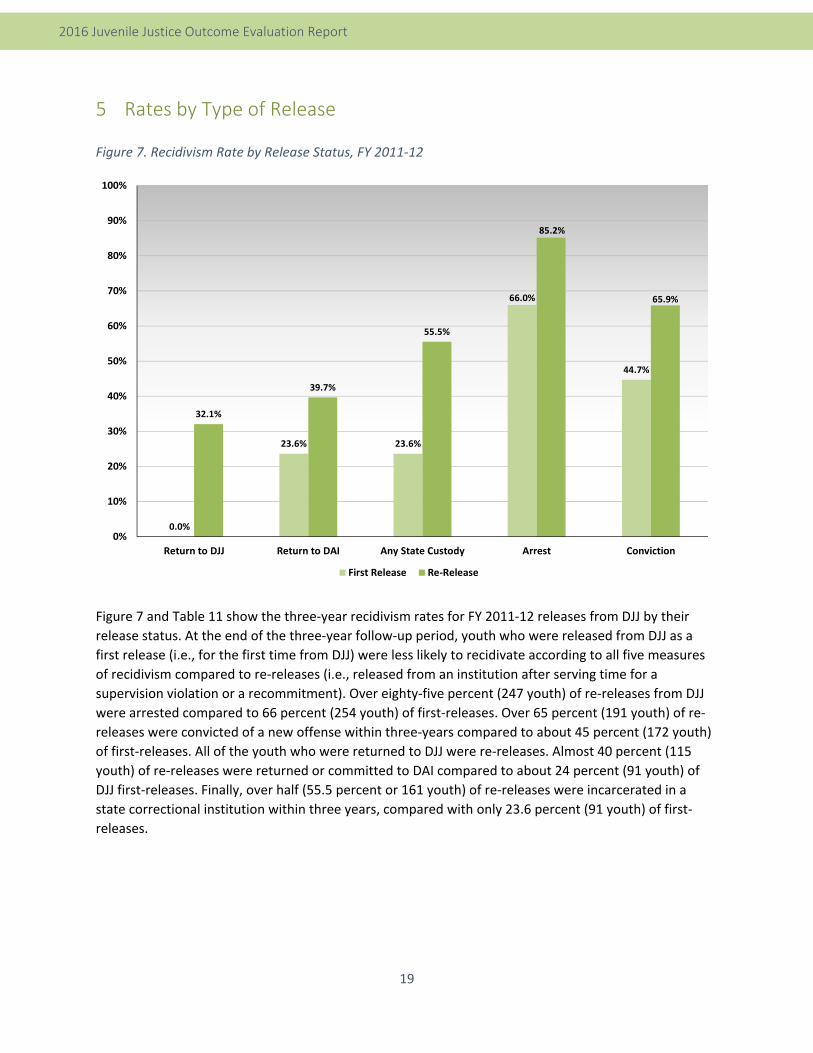
Figure 7 and Table 11 show the three‐year recidivism rates for FY 2011‐12 releases from DJJ by their
release status. At the end of the three‐year follow‐up period, youth who were released from DJJ as a
first release (i.e., for the first time from DJJ) were less likely to recidivate according to all five measures
of recidivism compared to re‐releases (i.e., released from an institution after serving time for a
supervision violation or a recommitment). Over eighty‐five percent (247 youth) of re‐releases from DJJ
were arrested compared to 66 percent (254 youth) of first‐releases. Over 65 percent (191 youth) of re‐
releases were convicted of a new offense within three‐years compared to about 45 percent (172 youth)
of first‐releases. All of the youth who were returned to DJJ were re‐releases. Almost 40 percent (115
youth) of re‐releases were returned or committed to DAI compared to about 24 percent (91 youth) of
DJJ first‐releases. Finally, over half (55.5 percent or 161 youth) of re‐releases were incarcerated in a
state correctional institution within three years, compared with only 23.6 percent (91 youth) of first‐
releases.
0.0%
23.6% 23.6%
66.0%
44.7%
32.1%
39.7%
55.5%
85.2%
65.9%
0%
10%
20%
30%
40%
50%
60%
70%
80%
90%
100%
Return to DJJ Return to DAI Any State Custody Arrest Conviction
First Release Re‐Release
20
2016 Juvenile Justice Outcome Evaluation Report
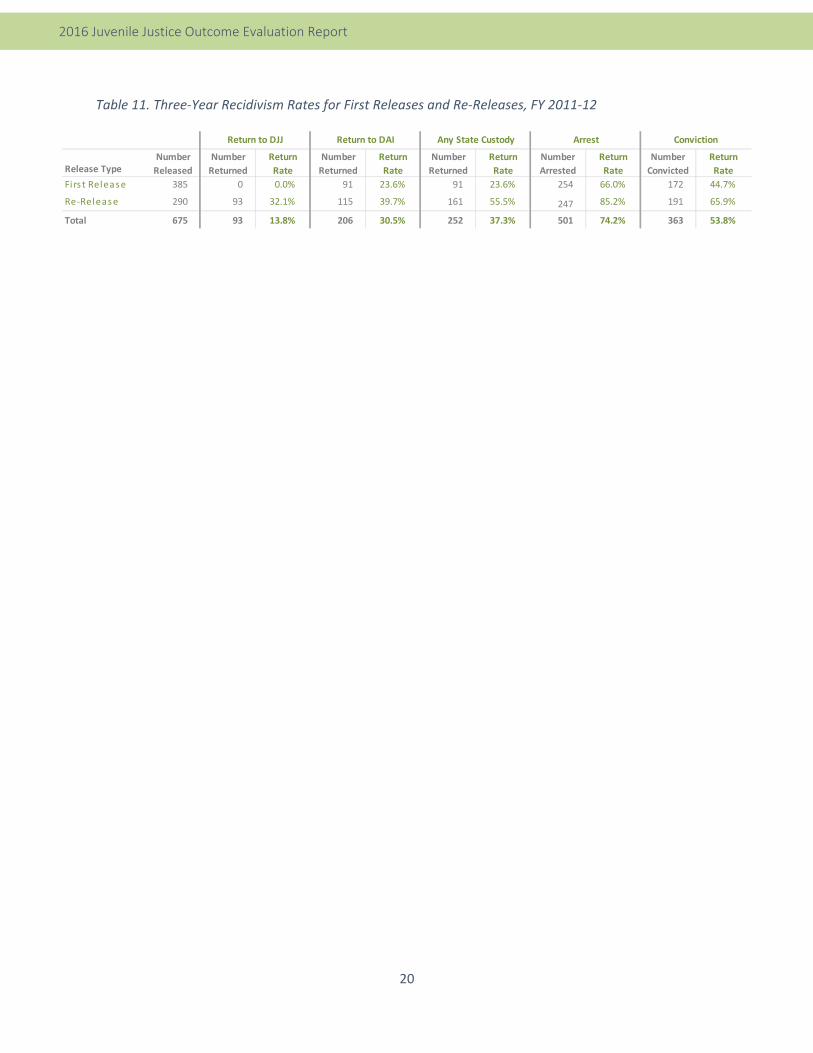
Table 11. Three‐Year Recidivism Rates for First Releases and Re‐Releases, FY 2011‐12
Release TypeNumber
Released
Number
Returned
Return
Rate
Number
Returned
Return
Rate
Number
Returned
Return
Rate
Number
Arrested
Return
Rate
Number
Convicted
Return
Rate
Firs t Release 385 0 0.0% 91 23.6% 91 23.6% 254 66.0% 172 44.7%
Re‐Release 290 93 32.1% 115 39.7% 161 55.5% 247 85.2% 191 65.9%
Total 675 93 13.8% 206 30.5% 252 37.3% 501 74.2% 363 53.8%
Return to DJJ Return to DAI Any State Custody Arrest Conviction

21
2016 Juvenile Justice Outcome Evaluation Report
6 Time to Return
Figure 8. Three‐Year Quarterly and Cumulative Rate of Return for the 252 Youth Returning to any State‐Level Incarceration During the Three‐Year Follow‐Up Period
Figure 8 and Table 12 present the percentage of recidivists by months after release. They also include
the cumulative percent of youth who recidivated over time. Of the 675 youth released from DJJ in FY
2011‐12 nearly 28 percent (70 youth) were returned to state‐level incarceration within the first six
months. By the one‐year mark, more than half (52 percent or 131 youth) of all the youth who would be
returned to a state institution had already been returned.
Table 12. Three‐Year Quarterly and Cumulative Rate of Return for the 252 Youth Returning to any State‐Level Incarceration During the Three‐Year Follow‐Up Period
1st 2nd 3rd 4th 5th 6th 7th 8th 9th 10th 11th 12th
Percentage Returning 11.5% 16.3% 14.7% 9.5% 3.6% 8.7% 6.7% 6.7% 7.9% 6.0% 5.2% 3.2%
Cumulative Percentage 11.5% 27.8% 42.5% 52.0% 55.6% 64.3% 71.0% 77.8% 85.7% 91.7% 96.8% 100.0%
11.5%16.3%
14.7%
9.5%
3.6%
8.7% 6.7% 6.7% 7.9%6.0% 5.2%
3.2%
27.8%
42.5%
52.0%
55.6%
64.3%
71.0%
77.8%
85.7%
91.7%
96.8%
0.0%
10.0%
20.0%
30.0%
40.0%
50.0%
60.0%
70.0%
80.0%
90.0%
100.0%
1st 2nd 3rd 4th 5th 6th 7th 8th 9th 10th 11th 12thQuarters After Release
Percentage Returning Cumulative Percentage
100.0%
N = 252
22
2016 Juvenile Justice Outcome Evaluation Report
7 Rates by Juvenile Demographics
Gender
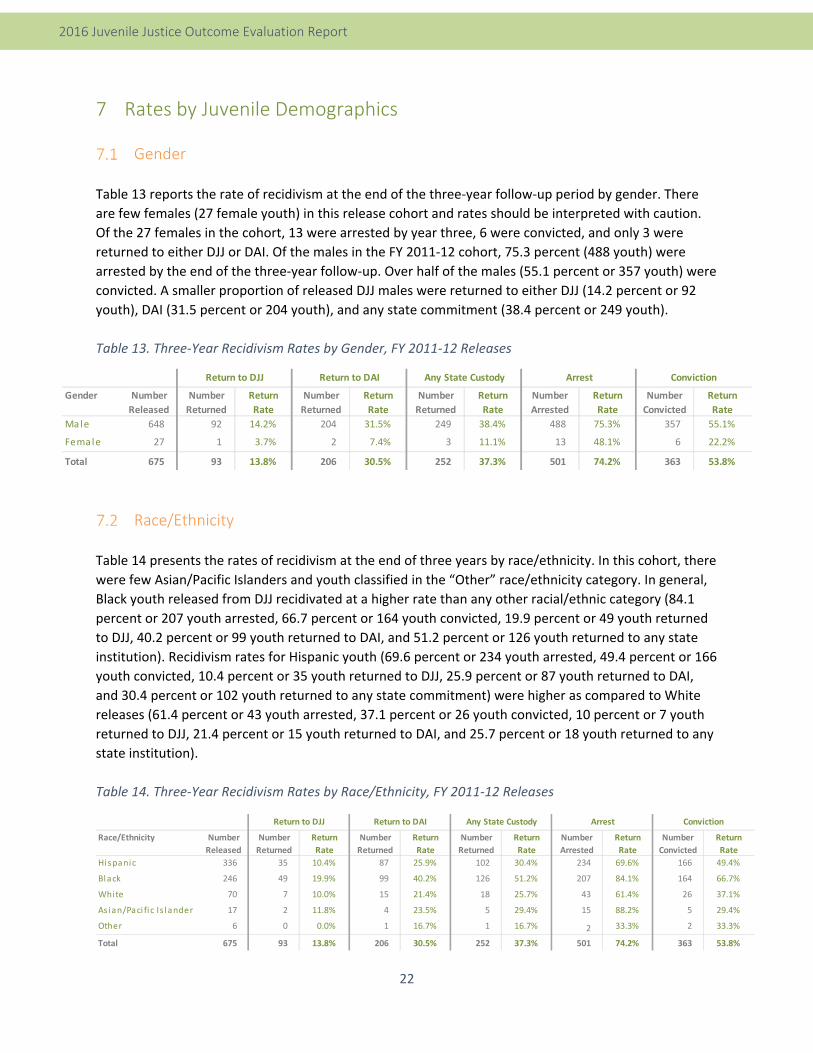
Table 13 reports the rate of recidivism at the end of the three‐year follow‐up period by gender. There
are few females (27 female youth) in this release cohort and rates should be interpreted with caution.
Of the 27 females in the cohort, 13 were arrested by year three, 6 were convicted, and only 3 were
returned to either DJJ or DAI. Of the males in the FY 2011‐12 cohort, 75.3 percent (488 youth) were
arrested by the end of the three‐year follow‐up. Over half of the males (55.1 percent or 357 youth) were
convicted. A smaller proportion of released DJJ males were returned to either DJJ (14.2 percent or 92
youth), DAI (31.5 percent or 204 youth), and any state commitment (38.4 percent or 249 youth).
Table 13. Three‐Year Recidivism Rates by Gender, FY 2011‐12 Releases
Race/Ethnicity
Table 14 presents the rates of recidivism at the end of three years by race/ethnicity. In this cohort, there
were few Asian/Pacific Islanders and youth classified in the “Other” race/ethnicity category. In general,
Black youth released from DJJ recidivated at a higher rate than any other racial/ethnic category (84.1
percent or 207 youth arrested, 66.7 percent or 164 youth convicted, 19.9 percent or 49 youth returned
to DJJ, 40.2 percent or 99 youth returned to DAI, and 51.2 percent or 126 youth returned to any state
institution). Recidivism rates for Hispanic youth (69.6 percent or 234 youth arrested, 49.4 percent or 166
youth convicted, 10.4 percent or 35 youth returned to DJJ, 25.9 percent or 87 youth returned to DAI,
and 30.4 percent or 102 youth returned to any state commitment) were higher as compared to White
releases (61.4 percent or 43 youth arrested, 37.1 percent or 26 youth convicted, 10 percent or 7 youth
returned to DJJ, 21.4 percent or 15 youth returned to DAI, and 25.7 percent or 18 youth returned to any
state institution).
Table 14. Three‐Year Recidivism Rates by Race/Ethnicity, FY 2011‐12 Releases
Race/Ethnicity Number
Released
Number
Returned
Return
Rate
Number
Returned
Return
Rate
Number
Returned
Return
Rate
Number
Arrested
Return
Rate
Number
Convicted
Return
Rate
Hispanic 336 35 10.4% 87 25.9% 102 30.4% 234 69.6% 166 49.4%
Black 246 49 19.9% 99 40.2% 126 51.2% 207 84.1% 164 66.7%
White 70 7 10.0% 15 21.4% 18 25.7% 43 61.4% 26 37.1%
Asian/Paci fi c Is lander 17 2 11.8% 4 23.5% 5 29.4% 15 88.2% 5 29.4%
Other 6 0 0.0% 1 16.7% 1 16.7% 2 33.3% 2 33.3%
Total 675 93 13.8% 206 30.5% 252 37.3% 501 74.2% 363 53.8%
Return to DJJ Return to DAI Any State Custody Arrest Conviction
Gender Number
Released
Number
Returned
Return
Rate
Number
Returned
Return
Rate
Number
Returned
Return
Rate
Number
Arrested
Return
Rate
Number
Convicted
Return
Rate
Male 648 92 14.2% 204 31.5% 249 38.4% 488 75.3% 357 55.1%
Female 27 1 3.7% 2 7.4% 3 11.1% 13 48.1% 6 22.2%
Total 675 93 13.8% 206 30.5% 252 37.3% 501 74.2% 363 53.8%
Return to DJJ Return to DAI Any State Custody Arrest Conviction

23
2016 Juvenile Justice Outcome Evaluation Report
Age at Admission
Table 15 reports the rates of recidivism at the end of three years by age at admission. Youths that were
admitted at older ages (19‐23 years old) have the lowest recidivism rate in every measured category.
Youth who were between 15 and 17 at the time of admission were generally the most likely to
recidivate.
Table 15. Three‐Year Recidivism Rates by Age at Admission, FY 2011‐12 Releases
Age at Release
Table 16 reports the three‐year recidivism rates by age at release. In general, the rate of recidivism is
relatively stable across ages of release. The most variation is observed at the youngest groups and the
eldest groups, and is most likely due to the fact that very few youth comprise those categories.
Table 16. Three‐Year Recidivism Rates by Age at Release, FY 2011‐12 Releases
Age at
Admission
Number
Released
Number
Returned
Return
Rate
Number
Returned
Return
Rate
Number
Returned
Return
Rate
Number
Arrested
Return
Rate
Number
Convicted
Return
Rate
12 ‐ 13 7 1 14.3% 2 28.6% 2 28.6% 4 57.1% 4 57.1%
14 29 4 13.8% 9 31.0% 11 37.9% 21 72.4% 17 58.6%
15 79 13 16.5% 25 31.6% 30 38.0% 62 78.5% 50 63.3%
16 177 27 15.3% 62 35.0% 75 42.4% 147 83.1% 104 58.8%
17 214 31 14.5% 69 32.2% 87 40.7% 157 73.4% 109 50.9%
18 142 16 11.3% 36 25.4% 43 30.3% 97 68.3% 69 48.6%
19 ‐ 23 27 1 3.7% 3 11.1% 4 14.8% 13 48.1% 10 37.0%
Total 675 93 13.8% 206 30.5% 252 37.3% 501 74.2% 363 53.8%
Return to DJJ Return to DAI Any State Custody Arrest Conviction
Age at
Release
Number
Released
Number
Returned
Return
Rate
Number
Returned
Return
Rate
Number
Returned
Return
Rate
Number
Arrested
Return
Rate
Number
Convicted
Return
Rate
12 ‐ 16 11 1 9.1% 1 9.1% 1 9.1% 5 45.5% 4 36.4%
17 35 2 5.7% 10 28.6% 12 34.3% 28 80.0% 19 54.3%
18 74 8 10.8% 24 32.4% 27 36.5% 59 79.7% 42 56.8%
19 131 12 9.2% 35 26.7% 40 30.5% 97 74.0% 68 51.9%
20 120 22 18.3% 35 29.2% 45 37.5% 83 69.2% 63 52.5%
21 100 15 15.0% 38 38.0% 47 47.0% 76 76.0% 54 54.0%
22 81 20 24.7% 24 29.6% 34 42.0% 63 77.8% 46 56.8%
23 52 7 13.5% 16 30.8% 19 36.5% 43 82.7% 31 59.6%
24 59 6 10.2% 17 28.8% 21 35.6% 41 69.5% 32 54.2%
25 ‐ 28 12 0 0.0% 6 50.0% 6 50.0% 6 50.0% 4 33.3%
Total 675 93 13.8% 206 30.5% 252 37.3% 501 74.2% 363 53.8%
Return to DJJ Return to DAI Any State Custody Arrest Conviction

24
2016 Juvenile Justice Outcome Evaluation Report
8 Rates by Juvenile Characteristics
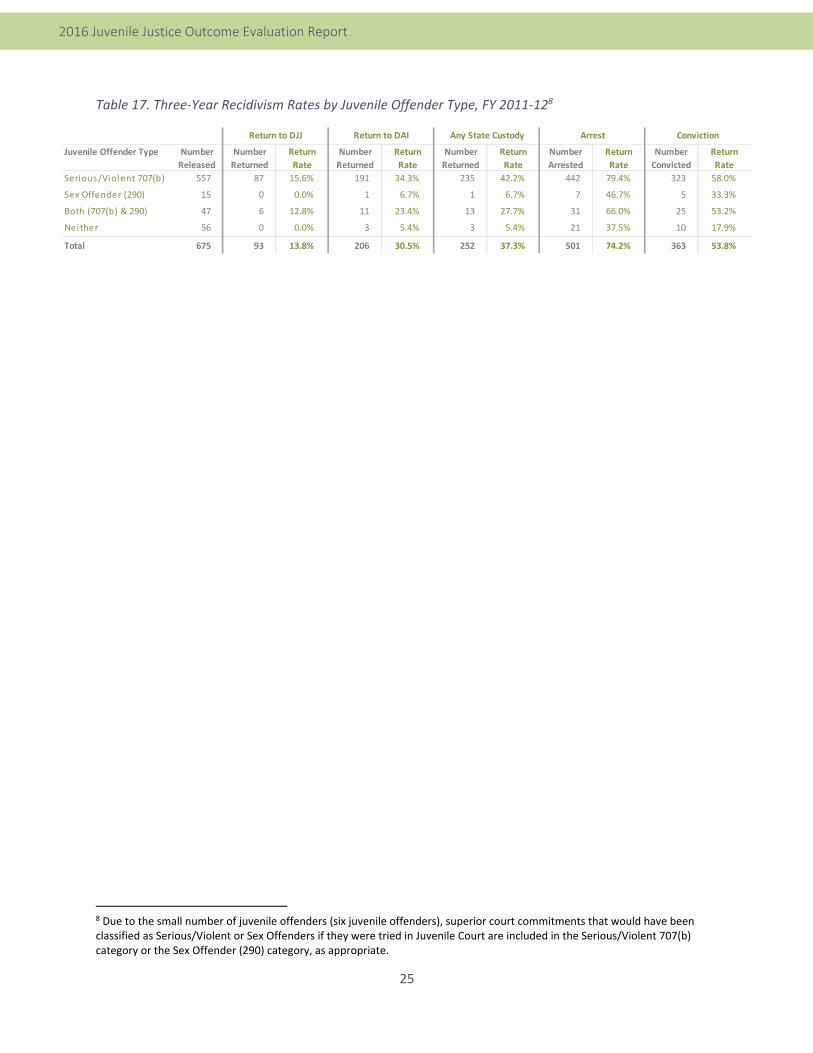
Juvenile Offender Type
Figure 9. Three‐Year Recidivism Rates by Juvenile Offender Type, FY 2011‐12
Figure 9 and Table 17 report the rate of recidivism by Juvenile Offender Type (i.e., Serious/Violent only,
Sex Offender only, Both, or Neither). A majority of the FY 2011‐12 cohort is Serious/Violent only, so any
comparisons should be made with caution. However, in general, Serious/Violent Only releases were the
most likely to recidivate in every category. The next highest rates were found for youth who were both
serious/violent and sex offenders (707(b) & 290).
15.6%
34.3%
42.2%
79.4%
58.0%
0.0%
6.7% 6.7%
46.7%
33.3%
12.8%
23.4%
27.7%
66.0%
53.2%
0.0%
5.4% 5.4%
37.5%
17.9%
0%
10%
20%
30%
40%
50%
60%
70%
80%
90%
100%
Return to DJJ Return to DAI Any State Custody Arrest Conviction
Serious/Violent 707(b) Sex Offender (290) Both (707(b) & 290) Neither
25
2016 Juvenile Justice Outcome Evaluation Report
Table 17. Three‐Year Recidivism Rates by Juvenile Offender Type, FY 2011‐128
8 Due to the small number of juvenile offenders (six juvenile offenders), superior court commitments that would have been classified as Serious/Violent or Sex Offenders if they were tried in Juvenile Court are included in the Serious/Violent 707(b) category or the Sex Offender (290) category, as appropriate.
Juvenile Offender Type Number
Released
Number
Returned
Return
Rate
Number
Returned
Return
Rate
Number
Returned
Return
Rate
Number
Arrested
Return
Rate
Number
Convicted
Return
Rate
Serious/Violent 707(b) 557 87 15.6% 191 34.3% 235 42.2% 442 79.4% 323 58.0%
Sex Offender (290) 15 0 0.0% 1 6.7% 1 6.7% 7 46.7% 5 33.3%
Both (707(b) & 290) 47 6 12.8% 11 23.4% 13 27.7% 31 66.0% 25 53.2%
Neither 56 0 0.0% 3 5.4% 3 5.4% 21 37.5% 10 17.9%
Total 675 93 13.8% 206 30.5% 252 37.3% 501 74.2% 363 53.8%
Return to DJJ Return to DAI Any State Custody Arrest Conviction

26
2016 Juvenile Justice Outcome Evaluation Report
Commitment Offense Category
Figure 10. Three‐Year Recidivism Rates by Commitment Offense Category, FY 2011‐12 Releases
Table 18 presents the rate of recidivism by commitment offense category. All commitment offenses are
classified as a crimes against persons, property crimes, drug crimes, or other crimes. Overwhelmingly,
the DJJ release cohort in FY 2011‐12 was committed for crimes against persons. The small number of
youth who committed any other type of offense makes it difficult to perform meaningful comparisons.
As a whole, despite the serious nature of crimes against persons, youth who committed them were not
the most likely to recidivate.
Table 18. Three‐Year Recidivism Rates by Commitment Offense Category, FY 2011‐12 Releases
13.2%
29.2%
36.2%
73.7%
53.0%
32.1%
46.4%
53.6%
82.1%
64.3%
0.0%
66.7% 66.7%
100.0% 100.0%
0.0%
62.5% 62.5%
75.0%
62.5%
0%
10%
20%
30%
40%
50%
60%
70%
80%
90%
100%
Return to DJJ Return to DAI Any State Custody Arrest Conviction
Crimes Against Persons Property Crimes Drug Crimes Other Crimes
Juvenile Offender Type Number
Released
Number
Returned
Return
Rate
Number
Returned
Return
Rate
Number
Returned
Return
Rate
Number
Arrested
Return
Rate
Number
Convicted
Return
Rate
Crimes Against Persons 636 84 13.2% 186 29.2% 230 36.2% 469 73.7% 337 53.0%
Property Crimes 28 9 32.1% 13 46.4% 15 53.6% 23 82.1% 18 64.3%
Drug Crimes 3 0 0.0% 2 66.7% 2 66.7% 3 100.0% 3 100.0%
Other Crimes 8 0 0.0% 5 62.5% 5 62.5% 6 75.0% 5 62.5%
Total 675 93 13.8% 206 30.5% 252 37.3% 501 74.2% 363 53.8%
Return to DJJ Return to DAI Any State Custody Arrest Conviction

27
2016 Juvenile Justice Outcome Evaluation Report
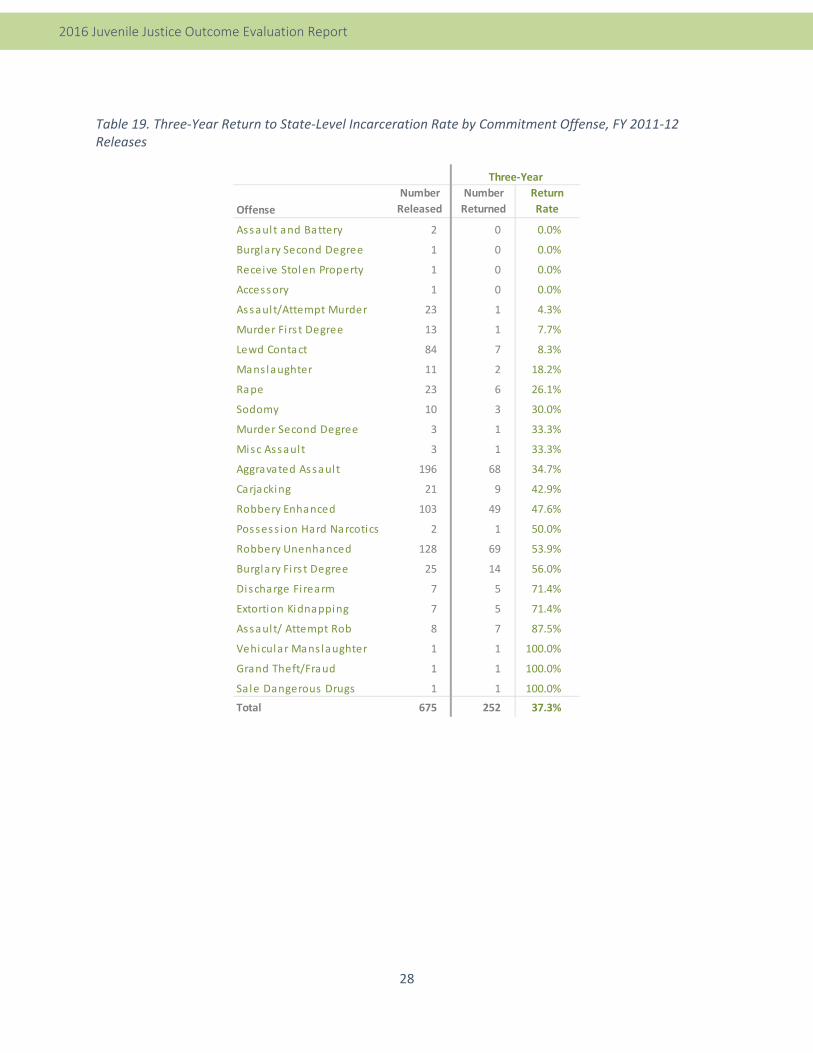
Commitment Offenses
Figure 11. Three‐Year Return to State‐Level Incarceration Rate by Commitment Offense, FY 2011‐12 Releases
Figure 11 and Table 19 show the three‐year return to any state‐level incarceration by commitment
offense. These rates represent recidivism by commitment offense. They do not reflect what type of
recidivism crime the offender committed to be returned to state‐custody. In many cases, only one
offender was committed for a given offense. Therefore, caution should be exercised when interpreting
the rates.
0.0%
0.0%
0.0%
0.0%
4.3%
7.7%
8.3%
18.2%
26.1%
30.0%
33.3%
33.3%
34.7%
42.9%
47.6%
50.0%
53.9%
56.0%
71.4%
71.4%
87.5%
100.0%
100.0%
100.0%
0% 20% 40% 60% 80% 100%
Assault and Battery
Burglary Second Degree
Receive Stolen Property
Accessory
Assault/Attempt Murder
Murder First Degree
Lewd Contact
Manslaughter
Rape
Sodomy
Murder Second Degree
Misc Assault
Aggravated Assault
Carjacking
Robbery Enhanced
Possession Hard Narcotics
Robbery Unenhanced
Burglary First Degree
Discharge Firearm
Extortion Kidnapping
Assault/ Attempt Rob
Vehicular Manslaughter
Grand Theft/Fraud
Sale Dangerous Drugs
28
2016 Juvenile Justice Outcome Evaluation Report
Table 19. Three‐Year Return to State‐Level Incarceration Rate by Commitment Offense, FY 2011‐12 Releases
Offense
Number
Released
Number
Returned
Return
Rate
Assault and Battery 2 0 0.0%
Burglary Second Degree 1 0 0.0%
Receive Stolen Property 1 0 0.0%
Accessory 1 0 0.0%
Assault/Attempt Murder 23 1 4.3%
Murder Firs t Degree 13 1 7.7%
Lewd Contact 84 7 8.3%
Manslaughter 11 2 18.2%
Rape 23 6 26.1%
Sodomy 10 3 30.0%
Murder Second Degree 3 1 33.3%
Misc Assault 3 1 33.3%
Aggravated Assault 196 68 34.7%
Carjacking 21 9 42.9%
Robbery Enhanced 103 49 47.6%
Possess ion Hard Narcotics 2 1 50.0%
Robbery Unenhanced 128 69 53.9%
Burglary Firs t Degree 25 14 56.0%
Discharge Firearm 7 5 71.4%
Extortion Kidnapping 7 5 71.4%
Assault/ Attempt Rob 8 7 87.5%
Vehicular Mans laughter 1 1 100.0%
Grand Theft/Fraud 1 1 100.0%
Sale Dangerous Drugs 1 1 100.0%
Total 675 252 37.3%
Three‐Year
29
2016 Juvenile Justice Outcome Evaluation Report
9 Conclusion
This report provides recidivism rates for the 675 youth who were released from DJJ in FY 2011‐12 and
tracked for a three‐year follow‐up period. Multiple measures of recidivism were used to better assess
patterns among youth and include: returns to DJJ, returns to DAI, returns to either DJJ or DAI (i.e., any
state‐level correctional institution), arrests, and reconvictions. Due to recent legislation, which changed
and limited the type of youth eligible for commitment to DJJ, the release cohort was examined in two
groups: 1) 619 youth comprising 707(b) cases (i.e. serious and/or violent crimes, 290 cases (registered
sex youth), both 707(b) and 290 cases, and superior court commitments to DJJ and; 2) 56 youth that
were not 707(b) or 290 cases.
For all five measures of recidivism, the 619 youth including 707(b) and 290 cases recidivated at higher
rates than the 56 non‐707(b)/290 cases, as expected. Overall, 13.8 percent of youth released from DJJ in
FY 2011‐12 were returned to DJJ within three years of their release and 30.5 percent were returned or
committed to DAI. In total, 37.3 percent of the youth returned to state‐level incarceration (i.e. DJJ
and/or DAI). Over 70 percent (74.2 percent) of the cohort was arrested and 53.8 percent of the cohort
was re‐convicted after three years of follow‐up.
In February 2016, the class‐action lawsuit known as Farrell v Kernan9 was terminated after DJJ fully
implemented sweeping reforms to the juvenile system. Among the many reforms was the
implementation of the IBTM a comprehensive approach to assessing, understanding, and treating
youth. The IBTM is intended to reduce institutional violence and the risk of future criminal behavior by
working with youth to prioritize and achieve goals for successful community living. The DJJ adopted the
IBTM as the foundation for developing and implementing the education, mental health, and treatment
model for committed youth. The IBTM provides collaborative services and evidence‐based interventions
and programs that develop youths’ skills for success. The data presented in this report pre‐dates some
of the important reforms that took place near the conclusion of the lawsuit; therefore, more time is
needed to fully understand the long‐term impacts of DJJ programs on recidivism.
California’s juvenile justice system is made up of county and state‐level facilities and evidence‐based
rehabilitative programs. In keeping with the CDCR’s goal of developing a comprehensive system of
program evaluation, these recidivism rates may be used to monitor DJJ youth population over time,
investigate the relationship between youth risk to recidivate and, and to evaluate the effectiveness of
DJJ programs, policies, and procedures.
9 Margaret Farrell v. Scott Kernan (Case No. RG 03079344). Stipulation and Order Dismissing Consent Decree with Prejudice, dated February 25, 2016.
30
2016 Juvenile Justice Outcome Evaluation Report
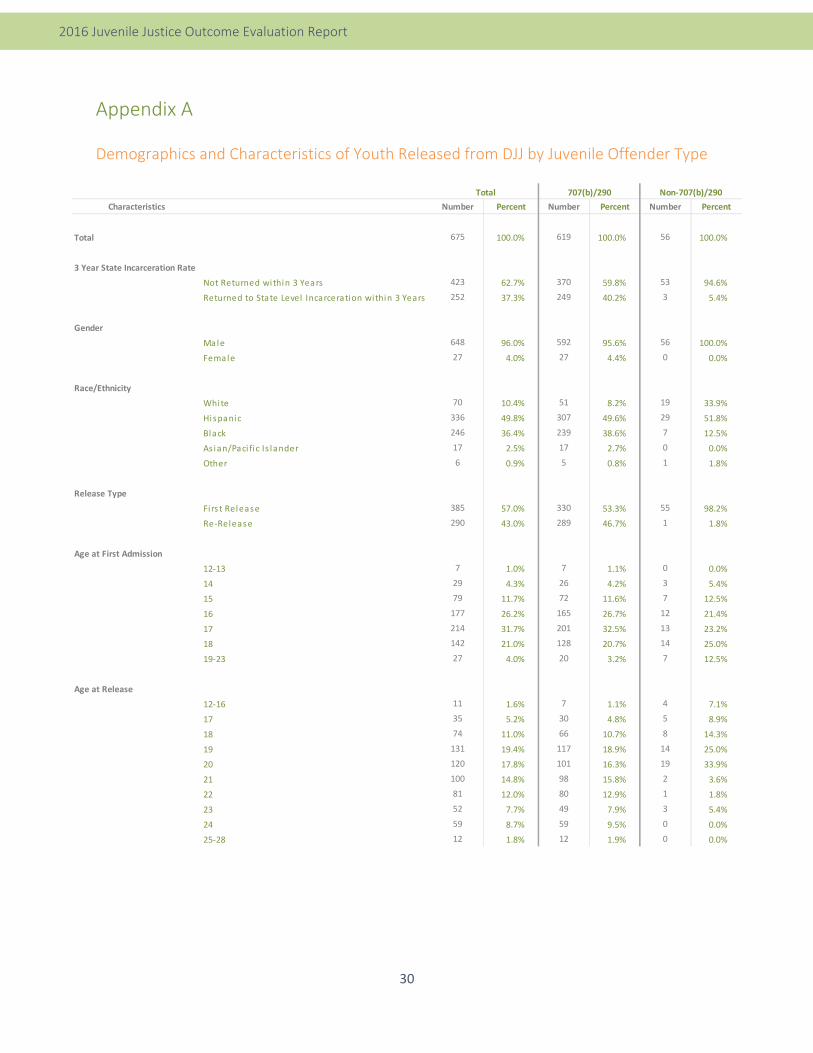
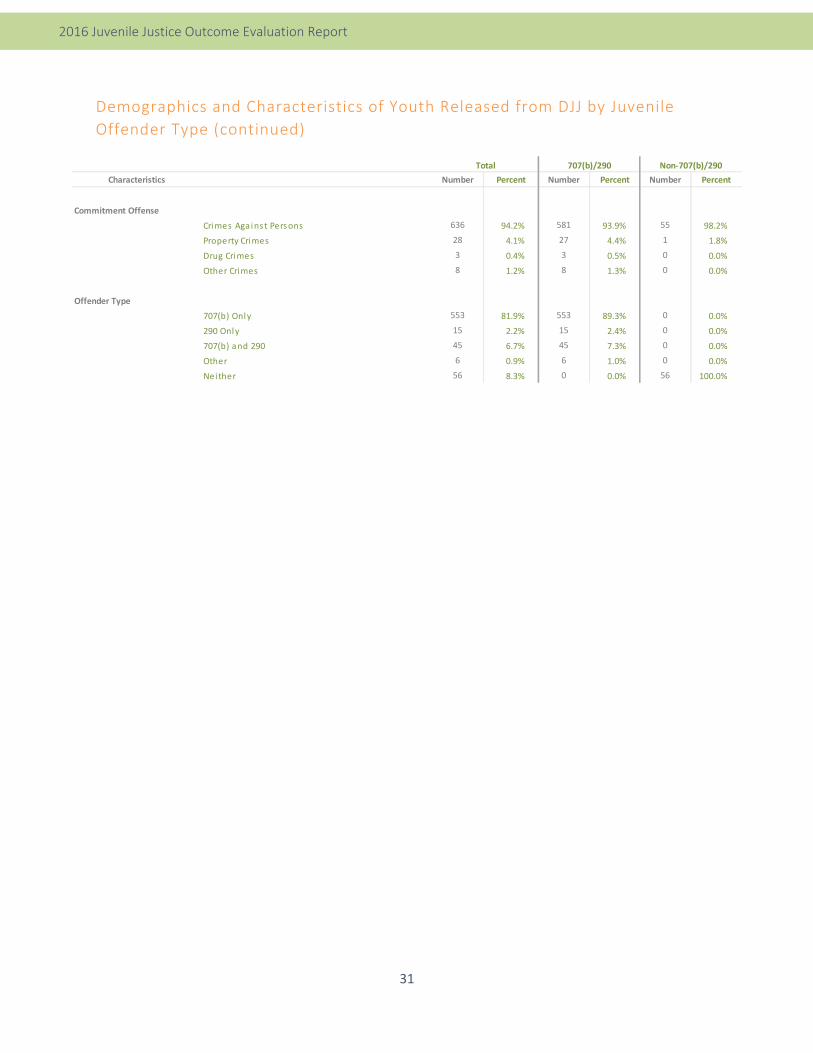
Appendix A
Demographics and Characteristics of Youth Released from DJJ by Juvenile Offender Type
Characteristics Number Percent Number Percent Number Percent
Total 675 100.0% 619 100.0% 56 100.0%
3 Year State Incarceration Rate
Not Returned within 3 Years 423 62.7% 370 59.8% 53 94.6%
Returned to State Level Incarceration within 3 Years 252 37.3% 249 40.2% 3 5.4%
Gender
Male 648 96.0% 592 95.6% 56 100.0%
Female 27 4.0% 27 4.4% 0 0.0%
Race/Ethnicity
White 70 10.4% 51 8.2% 19 33.9%
Hispanic 336 49.8% 307 49.6% 29 51.8%
Black 246 36.4% 239 38.6% 7 12.5%
Asian/Paci fic Is lander 17 2.5% 17 2.7% 0 0.0%
Other 6 0.9% 5 0.8% 1 1.8%
Release Type
Firs t Release 385 57.0% 330 53.3% 55 98.2%
Re‐Release 290 43.0% 289 46.7% 1 1.8%
Age at First Admission
12‐13 7 1.0% 7 1.1% 0 0.0%
14 29 4.3% 26 4.2% 3 5.4%
15 79 11.7% 72 11.6% 7 12.5%
16 177 26.2% 165 26.7% 12 21.4%
17 214 31.7% 201 32.5% 13 23.2%
18 142 21.0% 128 20.7% 14 25.0%
19‐23 27 4.0% 20 3.2% 7 12.5%
Age at Release
12‐16 11 1.6% 7 1.1% 4 7.1%
17 35 5.2% 30 4.8% 5 8.9%
18 74 11.0% 66 10.7% 8 14.3%
19 131 19.4% 117 18.9% 14 25.0%
20 120 17.8% 101 16.3% 19 33.9%
21 100 14.8% 98 15.8% 2 3.6%
22 81 12.0% 80 12.9% 1 1.8%
23 52 7.7% 49 7.9% 3 5.4%
24 59 8.7% 59 9.5% 0 0.0%
25‐28 12 1.8% 12 1.9% 0 0.0%
707(b)/290Total Non‐707(b)/290
31
2016 Juvenile Justice Outcome Evaluation Report
Demographics and Characteristics of Youth Released from DJJ by Juvenile
Offender Type (continued)
Characteristics Number Percent Number Percent Number Percent
Commitment Offense
Crimes Against Persons 636 94.2% 581 93.9% 55 98.2%
Property Crimes 28 4.1% 27 4.4% 1 1.8%
Drug Crimes 3 0.4% 3 0.5% 0 0.0%
Other Crimes 8 1.2% 8 1.3% 0 0.0%
Offender Type
707(b) Only 553 81.9% 553 89.3% 0 0.0%
290 Only 15 2.2% 15 2.4% 0 0.0%
707(b) and 290 45 6.7% 45 7.3% 0 0.0%
Other 6 0.9% 6 1.0% 0 0.0%
Neither 56 8.3% 0 0.0% 56 100.0%
Total 707(b)/290 Non‐707(b)/290

32
2016 Juvenile Justice Outcome Evaluation Report
Appendix B
Recidivism Rates for Youth Released in FY 2007‐08 through FY 2011‐12
The data provided in the following tables present rates for youth released from DJJ between FY 2007‐08
and FY 2011‐12. These rates have been provided for context, but due to changes in the methods used to
calculate the below rates, as well as the makeup of each cohort, direct comparisons should not be made
across fiscal years.
Return to DJJ
Number
Released
Number
Returned
Return
Rate
Number
Returned
Return
Rate
Number
Returned
Return
Rate
707(b)/290 916 179 19.5% 319 34.8% 358 39.1%
FY 2007‐08 Non‐707(b)/290 488 3 0.6% 3 0.6% 3 0.6%
Total 1,404 182 13.0% 322 22.9% 361 25.7%
707(b)/290 808 250 30.9% 324 40.1% 342 42.3%
FY 2008‐09 Non‐707(b)/290 228 0 0.0% 0 0.0% 0 0.0%
Total 1,036 250 24.1% 324 31.3% 342 33.0%
707(b)/290 890 321 36.1% 396 44.5% 418 47.0%
FY 2009‐10 Non‐707(b)/290 103 0 0.0% 0 0.0% 0 0.0%
Total 993 321 32.3% 396 39.9% 418 42.1%
707(b)/290 788 202 25.6% 277 35.2% 283 35.9%
FY 2010‐11 Non‐707(b)/290 26 1 3.8% 1 3.8% 1 3.8%
Total 814 203 24.9% 278 34.2% 284 34.9%
707(b)/290 619 87 14.1% 93 15.0% 93 15.0%
FY 2011‐12 Non‐707(b)/290 56 0 0.0% 0 0.0% 0 0.0%
Total 675 87 12.9% 93 13.8% 93 13.8%
One‐Year Two‐Year Three‐Year
Return to DAI
Number
Released
Number
Returned
Return
Rate
Number
Returned
Return
Rate
Number
Returned
Return
Rate
707(b)/290 916 77 8.4% 180 19.7% 272 29.7%
FY 2007‐08 Non‐707(b)/290 488 44 9.0% 134 27.5% 196 40.2%
Total 1,404 121 8.6% 314 22.4% 468 33.3%
707(b)/290 808 70 8.7% 162 20.0% 239 29.6%
FY 2008‐09 Non‐707(b)/290 228 37 16.2% 72 31.6% 91 39.9%
Total 1,036 107 10.3% 234 22.6% 330 31.9%
707(b)/290 890 99 11.1% 212 23.8% 282 31.7%
FY 2009‐10 Non‐707(b)/290 103 14 13.6% 33 32.0% 42 40.8%
Total 993 113 11.4% 245 24.7% 324 32.6%
707(b)/290 788 75 9.5% 163 20.7% 239 30.3%
FY 2010‐11 Non‐707(b)/290 26 2 7.7% 7 26.9% 7 26.9%
Total 814 77 9.5% 170 20.9% 246 30.2%
707(b)/290 619 60 9.7% 134 21.6% 203 32.8%
FY 2011‐12 Non‐707(b)/290 56 0 0.0% 2 3.6% 3 5.4%
Total 675 60 8.9% 136 20.1% 206 30.5%
One‐Year Two‐Year Three‐Year

33
2016 Juvenile Justice Outcome Evaluation Report
Recidivism Rates for Youth Released in FY 2007‐08 through FY 2011‐12
(continued)
Return to Any State‐
Level Commitment
Number
Released
Number
Returned
Return
Rate
Number
Returned
Return
Rate
Number
Returned
Return
Rate
707(b)/290 916 239 26.1% 437 47.7% 510 55.7%
FY 2007‐08 Non‐707(b)/290 488 47 9.6% 136 27.9% 198 40.6%
Total 1,404 286 20.4% 573 40.8% 708 50.4%
707(b)/290 808 290 35.9% 394 48.8% 439 54.3%
FY 2008‐09 Non‐707(b)/290 228 37 16.2% 72 31.6% 91 39.9%
Total 1,036 327 31.6% 466 45.0% 530 51.2%
707(b)/290 890 383 43.0% 499 56.1% 547 61.5%
FY 2009‐10 Non‐707(b)/290 103 14 13.6% 33 32.0% 42 40.8%
Total 993 397 40.0% 532 53.6% 589 59.3%
707(b)/290 788 254 32.2% 372 47.2% 414 52.5%
FY 2010‐11 Non‐707(b)/290 26 3 11.5% 8 30.8% 8 30.8%
Total 814 257 31.6% 380 46.7% 422 51.8%
707(b)/290 619 131 21.2% 194 31.3% 249 40.2%
FY 2011‐12 Non‐707(b)/290 56 0 0.0% 2 3.6% 3 5.4%
Total 675 131 19.4% 196 29.0% 252 37.3%
One‐Year Two‐Year Three‐Year
Arrest
Number
Released
Number
Arrested
Arrest
Rate
Number
Arrested
Arrest
Rate
Number
Arrested
Arrest
Rate
707(b)/290 916 542 59.2% 694 75.8% 734 80.1%
FY 2007‐08 Non‐707(b)/290 488 326 66.8% 397 81.4% 417 85.5%
Total 1,404 868 61.8% 1,091 77.7% 1,151 82.0%
707(b)/290 808 482 59.7% 574 71.0% 614 76.0%
FY 2008‐09 Non‐707(b)/290 228 159 69.7% 183 80.3% 198 86.8%
Total 1,036 641 61.9% 757 73.1% 812 78.4%
707(b)/290 890 536 60.2% 658 73.9% 709 79.7%
FY 2009‐10 Non‐707(b)/290 103 66 64.1% 76 73.8% 79 76.7%
Total 993 602 60.6% 734 73.9% 788 79.4%
707(b)/290 788 458 58.1% 584 74.1% 629 79.8%
FY 2010‐11 Non‐707(b)/290 26 15 57.7% 15 57.7% 16 61.5%
Total 814 473 58.1% 599 73.6% 645 79.2%
707(b)/290 619 353 57.0% 438 70.8% 480 77.5%
FY 2011‐12 Non‐707(b)/290 56 13 23.2% 19 33.9% 21 37.5%
Total 675 366 54.2% 457 67.7% 501 74.2%
One‐Year Two‐Year Three‐Year
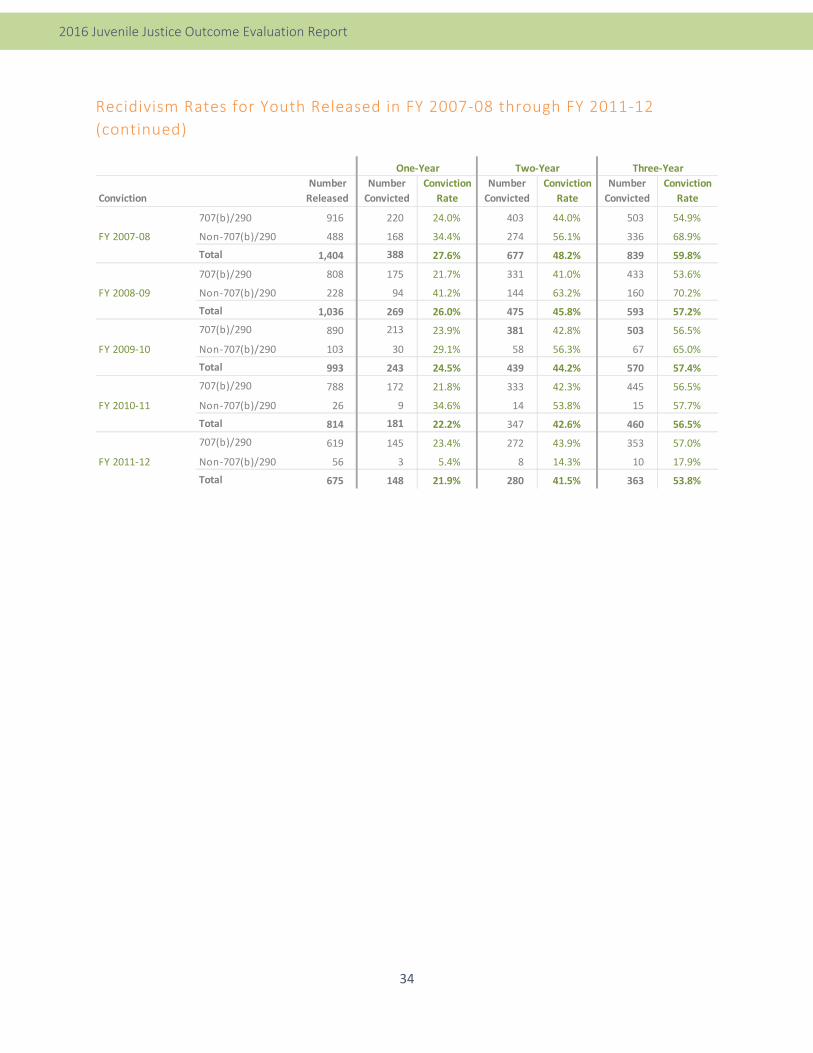
34
2016 Juvenile Justice Outcome Evaluation Report
Recidivism Rates for Youth Released in FY 2007‐08 through FY 2011‐12
(continued)
Conviction
Number
Released
Number
Convicted
Conviction
Rate
Number
Convicted
Conviction
Rate
Number
Convicted
Conviction
Rate
707(b)/290 916 220 24.0% 403 44.0% 503 54.9%
FY 2007‐08 Non‐707(b)/290 488 168 34.4% 274 56.1% 336 68.9%
Total 1,404 388 27.6% 677 48.2% 839 59.8%
707(b)/290 808 175 21.7% 331 41.0% 433 53.6%
FY 2008‐09 Non‐707(b)/290 228 94 41.2% 144 63.2% 160 70.2%
Total 1,036 269 26.0% 475 45.8% 593 57.2%
707(b)/290 890 213 23.9% 381 42.8% 503 56.5%
FY 2009‐10 Non‐707(b)/290 103 30 29.1% 58 56.3% 67 65.0%
Total 993 243 24.5% 439 44.2% 570 57.4%
707(b)/290 788 172 21.8% 333 42.3% 445 56.5%
FY 2010‐11 Non‐707(b)/290 26 9 34.6% 14 53.8% 15 57.7%
Total 814 181 22.2% 347 42.6% 460 56.5%
707(b)/290 619 145 23.4% 272 43.9% 353 57.0%
FY 2011‐12 Non‐707(b)/290 56 3 5.4% 8 14.3% 10 17.9%
Total 675 148 21.9% 280 41.5% 363 53.8%
One‐Year Two‐Year Three‐Year

35
2016 Juvenile Justice Outcome Evaluation Report
Appendix C
One‐Year, Two‐Year, and Three‐Year Recidivism Rates by Fiscal Year
One‐Year Recidivism Rates by Fiscal Year
13.0%
24.1%
32.3%
24.9%
12.9%
8.6%
10.3% 11.4%9.5%
8.9%
20.4%
31.6%
40.0%
31.6%
19.4%
61.8%
58.5%60.6%
58.1%
54.2%
27.6%
26.0% 24.5%
22.2%
21.9%
0%
10%
20%
30%
40%
50%
60%
70%
80%
90%
100%
2007‐2008 2008‐2009 2009‐2010 2010‐2011 2011‐2012
Return DJJ Return DAI Return Any State Arrest Conviction
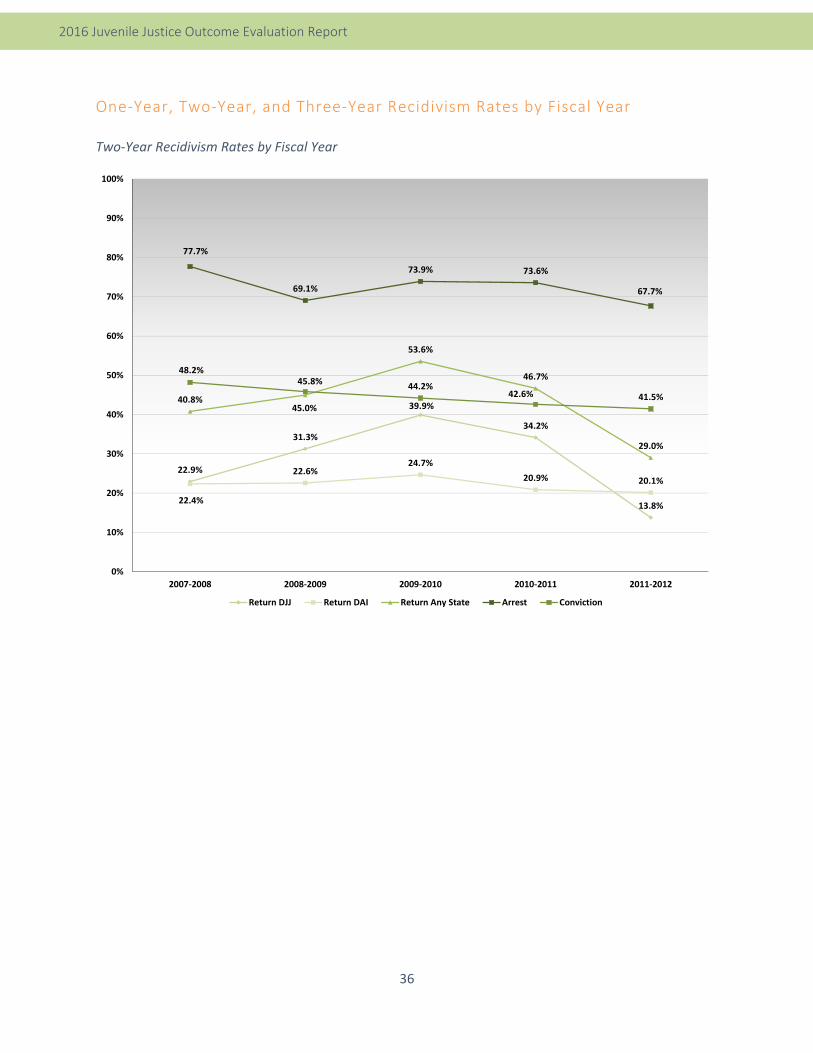
36
2016 Juvenile Justice Outcome Evaluation Report
One‐Year, Two‐Year, and Three‐Year Recidivism Rates by Fiscal Year
Two‐Year Recidivism Rates by Fiscal Year
22.9%
31.3%
39.9%
34.2%
13.8%22.4%
22.6%24.7%
20.9% 20.1%
40.8%45.0%
53.6%
46.7%
29.0%
77.7%
69.1%
73.9% 73.6%
67.7%
48.2%45.8%
44.2%42.6% 41.5%
0%
10%
20%
30%
40%
50%
60%
70%
80%
90%
100%
2007‐2008 2008‐2009 2009‐2010 2010‐2011 2011‐2012
Return DJJ Return DAI Return Any State Arrest Conviction

37
2016 Juvenile Justice Outcome Evaluation Report
One‐Year, Two‐Year, Three‐Year Recidivism Rates by Fiscal Year
Three‐Year Recidivism Rates by Fiscal Year
25.7%
33.0%
42.1%
34.9%
13.8%
33.3%
31.9%
32.6%
30.2%
30.5%
50.4% 51.2%
59.3%
51.8%
37.3%
82.0%
74.1%
79.4% 79.2%
74.2%
59.8% 57.2%
57.4%
56.5%53.8%
0%
10%
20%
30%
40%
50%
60%
70%
80%
90%
100%
2007‐2008 2008‐2009 2009‐2010 2010‐2011 2011‐2012
Return DJJ Return DAI Return Any State Arrest Conviction

38
2016 Juvenile Justice Outcome Evaluation Report
Appendix D
Definition of Terms
Arrest
Taking a person into custody, in a case and in the manner authorized by the law (California Penal Code
section 834)
Assembly Bill (AB) 191
AB 191 – A bill enacted on September 27, 2007 that provides more specific language for Senate Bill 81.
Conviction
A judgement, based either on the verdict of a jury or a judicial officer or on the guilty plea of the
defendant, that the defendant is guilty.
Department of Justice (DOJ) Identifier
DOJ assigns a Criminal Identification and Index number (CII Number) to anyone who is arrested or
fingerprinted. An initial record of arrest and prosecution (rap sheet) is then created and subsequent
arrests are added to it as DOJ received notification from the courts. A CII number may also be issued if a
youth not fingerprinted by DOJ has received a disposition notification from the court.
Division of Adult Institutions (DAI)
The DAI is part of the California Department of Corrections and Rehabilitation (CDCR) and is responsible
for the state‐level supervision and custody of adult, felony offenders.
Division of Juvenile Justice (DJJ)
The DJJ is a part of the CDCR and is responsible for state‐level supervision and custody of youthful
offenders.
DJJ Population
This DJJ release cohort is comprised of youth directly committed from the juvenile or adult/superior
court. Not included in this release cohort are the housing and contract cases‐ C cases (County Referrals),
D cases (adult court diagnostic), E cases (youth under age 18 committed to DAI but housed at DJJ for
education), G cases (emergency housing from the counties), J cases (overflow cases from Juvenile Hall),
M cases (youth under the age of 18 who under W&IC 1731.5(c) are committed to DAI but ordered by
adult court to be housed in DJJ), S cases (juvenile cases whose records are sealed), and Z cases (parole
caseload from other cases).
707(b)/290 Offenders
Youth committed to DJJ with an offense included in W&IC 707(b), or youth required to register as sex
offenders under Penal Code (PC) section 290. Youth committed to DJJ from adult court are considered a
707(b) case whether or not their commitment offense is included in W&IC 707(b).

39
2016 Juvenile Justice Outcome Evaluation Report
Non‐707(b)/290 Offenders
All other DJJ youth who were committed to the DJJ with commitment offenses not falling under W&IC
707(b) or PC section 290.
Juvenile Court Commitment
Youth committed to DJJ from the juvenile court. DJJ maintains jurisdiction until age 21 if any
commitment offense is not designated by the court to be a W&IC 707(b) offense. If the court deems one
of the commitment offenses as falling under the offenses listed in W&IC 707(b), the jurisdiction increase
to age 25.
Parole Violation
If a youth released onto parole commits a law violation or a technical violation (e.g., absence without
leave, positive drug test), s/he can be returned to DJJ or DAI custody by the Juvenile Parole Board. A law
violation can be a recommitment by the court for a new offense or a disposition by the Juvenile Parole
Board that there was probable cause of a law violation was committed.
Registered Sex Offender
Under PC section 290, if a committing court designates someone as a sex offender, s/he must register
with local law enforcement as such.
Senate Bill (SB) 81
SB 81 – A bill enacted on September 1, 2007 mandating that only youth with a sex offense requiring
their registration as a sex offender (PC 290), youth with violent and/or serious offense [W&IC 707(b)],
and youth committed to DJJ from adult court may be committed to DJJ. Since 2007, youth with new
court commitments who do not meet these criteria are retained in county facilities.
Superior Court Commitment
Youth committed to DJJ from adult court. DJJ maintains jurisdiction until age 25 from the adult court
under W&IC 1731.5(a). Not to be confused with “E” or “M” cases [W&IC 1731.5(c)], which are also adult
court commitments to DJJ but are not included in the release cohort analyzed in this report. “E” and “M”
case admissions are juveniles sentenced to an adult institution but housed in juvenile facilities.
Recommended