2014 Pipeline Report
Citizens Advisory Committee on Pipeline Safety
March 2015

Page 2 of 24
TABLE OF CONTENTS
Executive Summary ........................................................................................................................ 3
Section I: Regulatory Framework .................................................................................................. 5
Interstate Agent Agreements....................................................................................................... 6
Pipeline Safety: Stakeholder Roles ............................................................................................. 8
Section II: Washington Pipeline Overview.................................................................................. 10
The State’s Pipeline System...................................................................................................... 10
Commodity Capacity ................................................................................................................ 10
Replacing Bare Steel and Wrought Iron Pipe ........................................................................... 12
Pipeline Incidents ...................................................................................................................... 15
Section III: PHMSA Performance Metrics ................................................................................... 17
Section IV: Annual Review of Committee Work ......................................................................... 20
Section V: 2015 Annual Work-Plan ............................................................................................. 23
CCOPS Members .......................................................................................................................... 24

Page 3 of 24
Executive Summary The Citizens Advisory Committee on Pipeline Safety is charged with monitoring and providing
guidance to policymakers, pipeline operators and regulators on pipeline safety in Washington.
(RCW 81.88.140). With more than 41,000 miles of underground pipelines transporting natural
gas and hazardous liquid to all corners of the state, Washington has established a practice of
ensuring that this system is both efficient and safe to operate.
Introduction
The annual report of the Citizens Advisory Committee on Pipeline Safety (CCOPS) is
intended to inform decision makers, the industry, and the public of the work of the
committee related to the pipeline system in Washington state. In 2014, the committee met on
a regular basis with state regulators, industry representatives, and the people of the state to
discuss issues of concern and interest with the natural gas and hazardous liquid pipelines.
This is a high-level report on the state of the pipeline system in Washington; a summary of
the issues that the committee raised during 2014; and a work plan for 2015.
Overview There are more than 2.5 million miles of pipeline in the United States operated by about
3,000 companies. Stacked end to end, there is enough pipe to travel to the moon and back
more than five times. Nationally, these pipelines include:
182,000 miles of Hazardous Liquid and Carbon Dioxide pipelines;
325,000 miles of onshore and offshore Gas Transmission and Gathering Systems
pipelines;
2,145,000 miles of Natural Gas Distribution mains and services pipelines;
129 Liquid Natural Gas (LNG) Facilities connected to our gas transmission and
distribution systems; and
Propane Distribution System pipelines.1
Hazardous liquid pipelines carry crude oil and refined products developed from crude oil,
such as gas, diesel, home heating oil, jet fuels, and kerosene, along with liquefied gases and
highly volatile commodities, like propane, butane, and ethane. Natural gas pipelines transport
natural gas, which is composed of, in large part, methane. Taken together, natural gas and
petroleum account for 65 percent of the total energy used for heating, transportation,
electricity, etc. in the United States (petroleum 40 percent, natural gas 25 percent).2 To put
this in perspective, the remaining 35 percent of energy used is made up of coal at 22 percent,
nuclear at 8 percent and renewables at 4 percent.
1 http://primis.phmsa.dot.gov/comm/PipelineBasics.htm 2http://phmsa.dot.gov/portal/site/PHMSA/menuitem.6f23687cf7b00b0f22e4c6962d9c8789/?vgnextoid=a
62924cc45ea4110VgnVCM1000009ed07898RCRD&vgnextchannel=f7280665b91ac010VgnVCM10000
08049a8c0RCRD&vgnextfmt=print
Page 4 of 24
There are different types of pipeline which are used based on the need and function for the
pipeline. For example, pipelines that collect products for further refinement or to be
transported in a transmission line are called gathering lines. Transmission pipelines are used
to transport large quantities of hazardous liquids or natural gas over long distances at high
pressures. Distribution lines consist of main and service lines that move gas to industrial
customers and individual consumers including commercial property and residential homes.
Finally, pipelines are also divided into interstate pipelines, i.e., those crossing state
boundaries, and intrastate pipelines, or those that operate entirely within a state. When
operating correctly and safely, these primary components of the energy transportation system
are, in large part, unseen by the general public.
Page 5 of 24
Section I: Regulatory Framework
A number of federal agencies are responsible for and are involved in the regulation and
oversight of pipelines in the United States. The Natural Gas Pipeline Safety Act of 1968
(P.L. 90-481) and the Hazardous Liquid Pipeline Act of 1979 (P.L. 96-129) are two of the
key early acts establishing the federal role in pipeline safety. Under both statutes, the
transportation secretary is given primary authority to regulate key aspects of interstate
pipeline safety, including: design, construction, operation and maintenance, and spill
response planning.3
The Department of Transportation’s Pipeline and Hazardous Materials Safety Administration
(PHMSA) is the primary federal regulatory body responsible for the oversight of pipeline
safety in the United States. All pipelines are subject to PHMSA safety regulations. PHMSA,
acting through the Office of Pipeline Safety (OPS), regulates, monitors and enforces pipeline
safety. There are 1354 full time PHMSA pipeline inspectors employed to ensure that pipeline
operators comply with safety regulations.5
The Federal Energy Regulatory Commission (FERC) regulates the siting of interstate natural
gas pipelines6, storage of natural gas flowing through the pipelines, natural gas transportation
in interstate commerce, and LNG facility construction. It also oversees operations at U.S.
points of entry for natural gas imports and exports, and analyzes environmental impacts of
natural gas projects.
The National Transportation Safety Board (NTSB) is an independent federal agency that
investigates the probable cause of transportation accidents. The Pipeline Division of NTSB
investigates accidents that occur during the transport of natural gas or other hazardous liquids
through the pipeline system. NTSB investigates all pipeline accidents that result in a fatality,
substantial property damage, or significant environmental impact.7
The Environmental Protection Agency (EPA) and the U.S. Coast Guard act as incident
commanders and spill response agencies should an oil spill occur. The EPA has also been
advised, based on a July 2014 Office of Inspector General (OIG) report, to address methane
emissions from natural gas distribution pipelines.
The Transportation Security Administration (TSA) is assigned the duties and powers related
to general transportation security, such as intelligence management, threat assessment,
mitigation, security measure oversight and enforcement, including transportation by pipeline.
The TSA pipeline security plan requires the development of a national plan for critical
infrastructure and key resource protection. Pipeline security activities are led by the Pipeline
3 http://fas.org/sgp/crs/homesec/RL33347.pdf 4 http://phmsa.dot.gov/pipeline/inspections 5 June 2010 PHMSA FTE reported number 6 Energy Facility Site Evaluation Council regulates siting of intrastate pipelines in Washington state. 7 http://www.ntsb.gov/about/organization/RPHM/Pages/office_rph.aspx
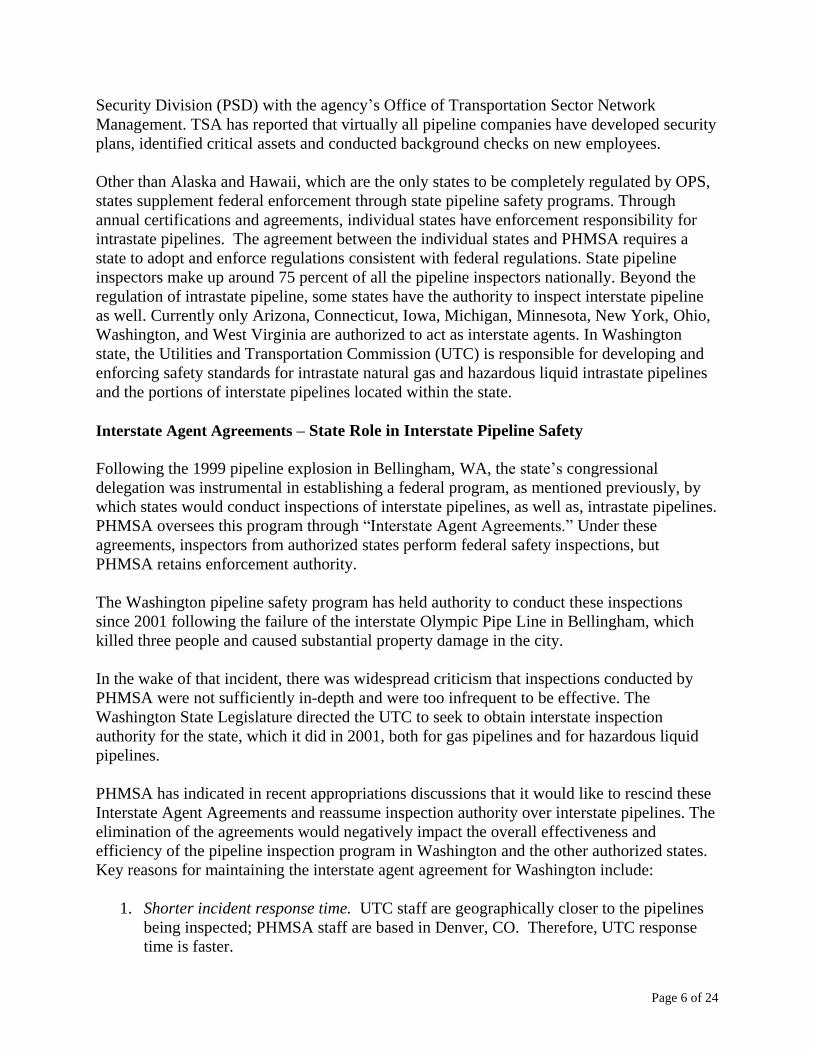
Page 6 of 24
Security Division (PSD) with the agency’s Office of Transportation Sector Network
Management. TSA has reported that virtually all pipeline companies have developed security
plans, identified critical assets and conducted background checks on new employees.
Other than Alaska and Hawaii, which are the only states to be completely regulated by OPS,
states supplement federal enforcement through state pipeline safety programs. Through
annual certifications and agreements, individual states have enforcement responsibility for
intrastate pipelines. The agreement between the individual states and PHMSA requires a
state to adopt and enforce regulations consistent with federal regulations. State pipeline
inspectors make up around 75 percent of all the pipeline inspectors nationally. Beyond the
regulation of intrastate pipeline, some states have the authority to inspect interstate pipeline
as well. Currently only Arizona, Connecticut, Iowa, Michigan, Minnesota, New York, Ohio,
Washington, and West Virginia are authorized to act as interstate agents. In Washington
state, the Utilities and Transportation Commission (UTC) is responsible for developing and
enforcing safety standards for intrastate natural gas and hazardous liquid intrastate pipelines
and the portions of interstate pipelines located within the state.
Interstate Agent Agreements – State Role in Interstate Pipeline Safety
Following the 1999 pipeline explosion in Bellingham, WA, the state’s congressional
delegation was instrumental in establishing a federal program, as mentioned previously, by
which states would conduct inspections of interstate pipelines, as well as, intrastate pipelines.
PHMSA oversees this program through “Interstate Agent Agreements.” Under these
agreements, inspectors from authorized states perform federal safety inspections, but
PHMSA retains enforcement authority.
The Washington pipeline safety program has held authority to conduct these inspections
since 2001 following the failure of the interstate Olympic Pipe Line in Bellingham, which
killed three people and caused substantial property damage in the city.
In the wake of that incident, there was widespread criticism that inspections conducted by
PHMSA were not sufficiently in-depth and were too infrequent to be effective. The
Washington State Legislature directed the UTC to seek to obtain interstate inspection
authority for the state, which it did in 2001, both for gas pipelines and for hazardous liquid
pipelines.
PHMSA has indicated in recent appropriations discussions that it would like to rescind these
Interstate Agent Agreements and reassume inspection authority over interstate pipelines. The
elimination of the agreements would negatively impact the overall effectiveness and
efficiency of the pipeline inspection program in Washington and the other authorized states.
Key reasons for maintaining the interstate agent agreement for Washington include:
1. Shorter incident response time. UTC staff are geographically closer to the pipelines
being inspected; PHMSA staff are based in Denver, CO. Therefore, UTC response
time is faster.

Page 7 of 24
2. Greater “local knowledge.” UTC staff, being closer to the pipelines being inspected,
have greater knowledge of the facilities and their operational history.
3. More thorough inspections. The greater proximity of state UTC staff, and little need
for travel time, leads to more thorough inspections.
4. Public trust. The UTC makes a significant amount of pipeline information available
to the public and works closely with local governments. For example, in a survey of
local government planning officials by the Pipeline Safety Trust, 25 percent said they
most trusted the UTC to provide them accurate information about pipeline risks.
PHMSA scored 4 percent – less than half the trust accorded pipeline operators which
rated 10 percent.8
5. Better oversight of pipeline construction projects. The UTC also monitors pipeline
construction projects. Until recently, PHMSA has not made this an area of focus.
6. Direct integration with other state and local agencies. UTC staff are directly involved
with other state agencies and local government operations with pipeline safety
concerns or responsibilities.
Terminating these agreements would also be counter to the initial intent, embodied in the
pipeline safety legislation co-sponsored by Senator Patty Murray, to allow qualified states to
conduct inspections of interstate pipelines, not just intrastate pipelines.
8
http://primis.phmsa.dot.gov/tag/PrjHome.rdm?prj=346&s=DC53A80466A14DEE810CF1EE63DF2FF0
&c=1&nocache=2627
Page 8 of 24
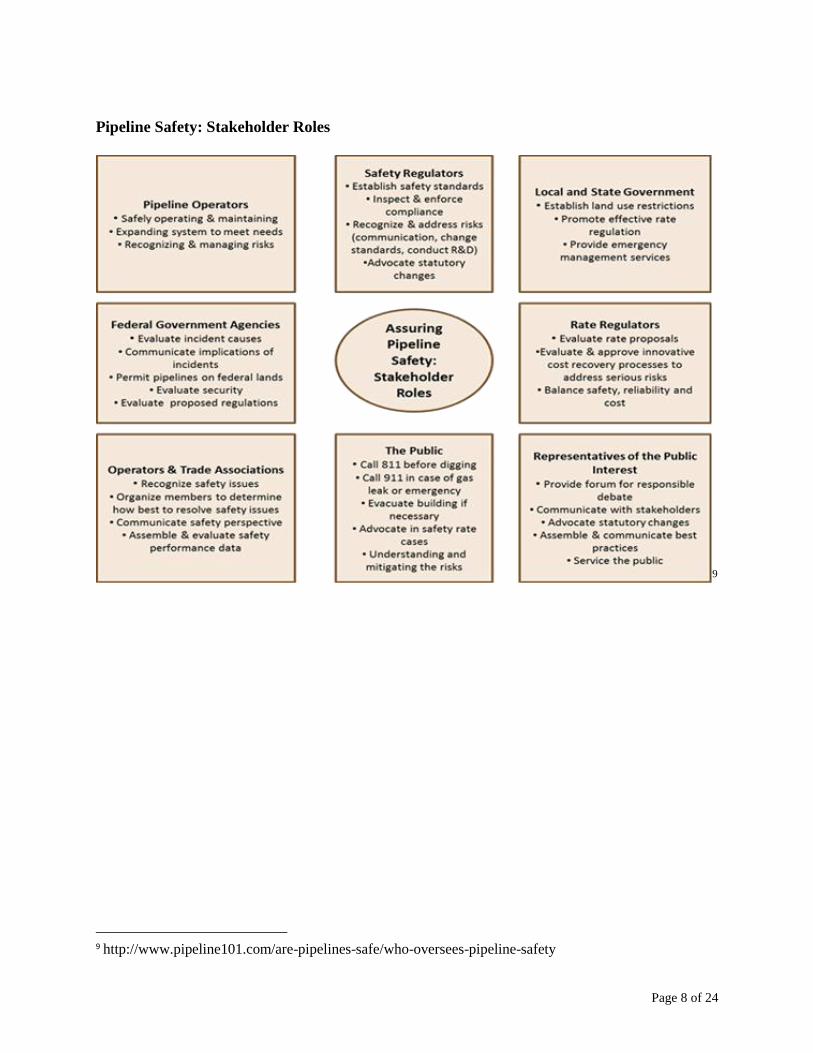
Pipeline Safety: Stakeholder Roles
9
9 http://www.pipeline101.com/are-pipelines-safe/who-oversees-pipeline-safety

Page 9 of 24
The federal regulations governing pipelines can be found in Title 49 CFR Part 190, 191, 192,
193, 194, 195, 198 and 199. A reference guide is as follows:
Table 1: Title 49 Code of Federal Regulation
PART 190 - PIPELINE SAFETY PROGRAMS10
PART 191—TRANSPORTATION OF NATURAL AND OTHER GAS BY PIPELINE;
ANNUAL REPORTS, INCIDENT REPORTS, AND SAFETY-RELATED CONDITION
REPORTS11
PART 192 - TRANSPORTATION OF NATURAL GAS12
PART 193—LIQUEFIED NATURAL GAS FACILITIES: FEDERAL SAFETY
STANDARDS13
PART 194—RESPONSE PLANS FOR ONSHORE OIL PIPELINES14
PART 195 - TRANSPORTATION OF HAZARDOUS LIQUIDS BY PIPELINES15
PART 198—REGULATIONS FOR GRANTS TO AID STATE PIPELINE SAFETY
PROGRAMS16
PART 199—DRUG AND ALCOHOL TESTING17
10http://www.ecfr.gov/cgi-bin/text-
idx?SID=967d61d8c1357a55e9f041067e3b62a4&node=pt49.3.190&rgn=div5 11 http://www.ecfr.gov/cgi-bin/text-
idx?SID=967d61d8c1357a55e9f041067e3b62a4&node=pt49.3.191&rgn=div5 12 http://www.ecfr.gov/cgi-bin/text-
idx?SID=967d61d8c1357a55e9f041067e3b62a4&node=pt49.3.192&rgn=div5 13 http://www.ecfr.gov/cgi-bin/text-idx?SID=f297f09b3c8041c1b9fa7cbe8adf19fc&node=pt49.3.193&rgn=div5 14 http://www.ecfr.gov/cgi-bin/text-
idx?SID=967d61d8c1357a55e9f041067e3b62a4&node=pt49.3.194&rgn=div5 15 http://www.ecfr.gov/cgi-bin/text-
idx?SID=967d61d8c1357a55e9f041067e3b62a4&node=pt49.3.195&rgn=div5 16 http://www.ecfr.gov/cgi-bin/text-
idx?SID=967d61d8c1357a55e9f041067e3b62a4&node=pt49.3.198&rgn=div5 17 http://www.ecfr.gov/cgi-bin/text-
idx?SID=967d61d8c1357a55e9f041067e3b62a4&node=pt49.3.199&rgn=div5

Page 10 of 24
Section II: Washington Pipeline Overview
The State’s Pipeline System
There are 30 pipeline companies in Washington with more than 41,000 miles of main and
service line pipe for natural gas and hazardous liquid. There are approximately 2,725 miles
of total transmission line in the state, with the commodities breakdown found in Table 2. 18
Table 2: Transmission Mileage by Commodity
Commodity Pipeline Miles %
Highly Volatile Liquid (HVL) 5 0.10%
CRUDE OIL 69 2.50%
REFINED AND/OR PETROLEUM PRODUCT (NON-
HVL) 726 26.60%
HYDROGEN GAS 3 0.10%
LANDFILL GAS 0 0.00%
NATURAL GAS 1921 70.40%
OTHER GAS 1 0.00%
Totals 2725 100%
Commodity Capacity
According to the PHMSA annual hazardous liquid inventory, Washington received
approximately 50 million barrels of crude oil through pipelines in 2013.19 The crude oil is
refined, in large part, at the five refineries located in the state, (BP West Coast Products,
Shell Oil Products, Phillips 66 Co., Tesoro West Coast and U.S. Oil & Refining).
Approximately 49 percent of the refined product (gasoline) is sent by pipeline.
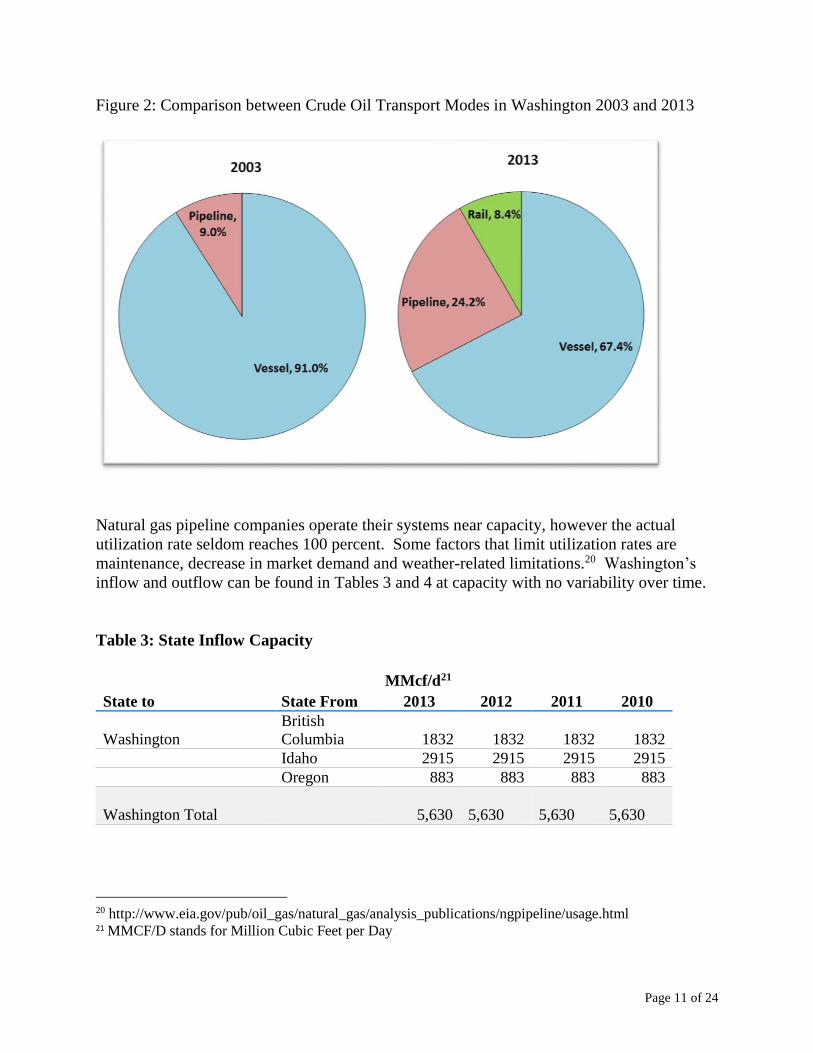
Overall, Washington has seen a significant shift in the mode of transportation of crude oil
from marine and pipeline to include rail, with significant increases in transportation by both
pipeline and rail, and a reduction in marine transportation, as shown in Figure 2. While there
has been a shift in the mode of transportation, the amount of crude oil being transported has
not significantly changed. The figure represents crude oil transport and not refined oil.
18 http://primis.phmsa.dot.gov/comm/reports/safety/wa_detail1.html, 8/06/14, 19 PHMSA 2013 Annual Hazardous Liquids Inventory
Page 11 of 24
Figure 2: Comparison between Crude Oil Transport Modes in Washington 2003 and 2013
Natural gas pipeline companies operate their systems near capacity, however the actual
utilization rate seldom reaches 100 percent. Some factors that limit utilization rates are
maintenance, decrease in market demand and weather-related limitations.20 Washington’s
inflow and outflow can be found in Tables 3 and 4 at capacity with no variability over time.
Table 3: State Inflow Capacity
MMcf/d21
State to State From 2013 2012 2011 2010
Washington
British
Columbia 1832 1832 1832 1832
Idaho 2915 2915 2915 2915
Oregon 883 883 883 883
Washington Total 5,630
5,630
5,630
5,630
20 http://www.eia.gov/pub/oil_gas/natural_gas/analysis_publications/ngpipeline/usage.html 21 MMCF/D stands for Million Cubic Feet per Day

Page 12 of 24
Table 4: State Outflow Capacity22
MMcf/d
State From State to 2013 2012 2011 2010
Washington
British
Columbia
51
51
51
51
Idaho
59
59
59
59
Oregon
4,315
4,315
4,315
4,315
Washington Total
4,425
4,425
4,425
4,425
Replacing Bare Steel and Wrought Iron Pipe
On March 23, 2012, PHMSA issued an advisory bulletin in the Federal Register urging
owners and operators of natural gas cast iron distribution pipelines to conduct a
comprehensive review of their cast or wrought iron pipeline, bare steel pipe, and aging
infrastructure focusing on repair and replacement of high risk pipelines. Also included in the
bulletin is a request for state agencies to consider enhancements to cast and wrought iron
replacement plans.
Cast and wrought iron pipelines are among the oldest energy pipelines in the United States.
The age and degrading nature of iron alloys increase the overall risks associated with this
type of pipeline. Similarly, uncoated steel pipelines (bare steel), tend to become a higher risk
due to the lack of protective coating. The industry has moved to producing and using plastic
or coated steel for natural gas distribution lines in the U.S. with plastic and coated steel
representing approximately 97% of the pipe produced at the end of 2012. Replacement of
cast iron and bare steel pipeline reduces the risk of leaks, cuts methane emissions and
increases system safety.23
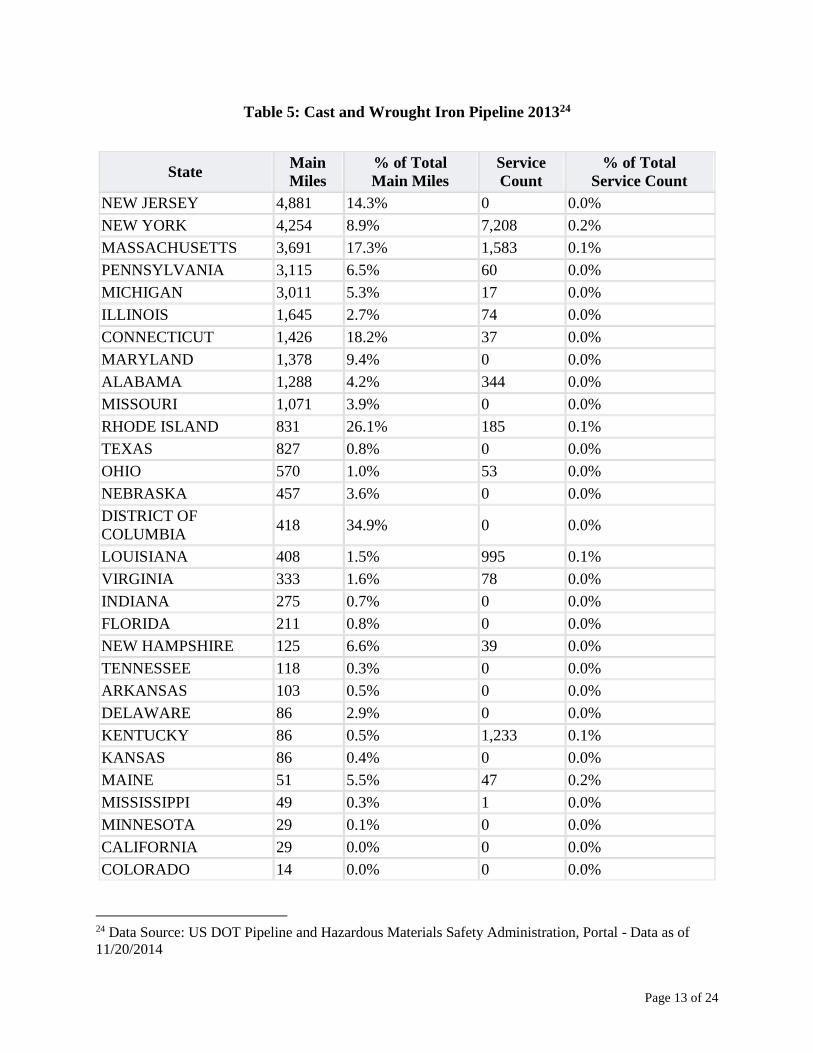
Washington effectively replaced all cast and wrought iron pipeline in 2014. Table 5
illustrates the progress of the state at the close of 2013, showing just thee miles remaining to
be replaced.
22 http://www.eia.gov/naturalgas/data.cfm 23 http://www.northeastgas.org/accelerated_infrastructure.php
Page 13 of 24
Table 5: Cast and Wrought Iron Pipeline 201324
State Main
Miles
% of Total
Main Miles
Service
Count
% of Total
Service Count
NEW JERSEY 4,881 14.3% 0 0.0%
NEW YORK 4,254 8.9% 7,208 0.2%
MASSACHUSETTS 3,691 17.3% 1,583 0.1%
PENNSYLVANIA 3,115 6.5% 60 0.0%
MICHIGAN 3,011 5.3% 17 0.0%
ILLINOIS 1,645 2.7% 74 0.0%
CONNECTICUT 1,426 18.2% 37 0.0%
MARYLAND 1,378 9.4% 0 0.0%
ALABAMA 1,288 4.2% 344 0.0%
MISSOURI 1,071 3.9% 0 0.0%
RHODE ISLAND 831 26.1% 185 0.1%
TEXAS 827 0.8% 0 0.0%
OHIO 570 1.0% 53 0.0%
NEBRASKA 457 3.6% 0 0.0%
DISTRICT OF
COLUMBIA 418 34.9% 0 0.0%
LOUISIANA 408 1.5% 995 0.1%
VIRGINIA 333 1.6% 78 0.0%
INDIANA 275 0.7% 0 0.0%
FLORIDA 211 0.8% 0 0.0%
NEW HAMPSHIRE 125 6.6% 39 0.0%
TENNESSEE 118 0.3% 0 0.0%
ARKANSAS 103 0.5% 0 0.0%
DELAWARE 86 2.9% 0 0.0%
KENTUCKY 86 0.5% 1,233 0.1%
KANSAS 86 0.4% 0 0.0%
MAINE 51 5.5% 47 0.2%
MISSISSIPPI 49 0.3% 1 0.0%
MINNESOTA 29 0.1% 0 0.0%
CALIFORNIA 29 0.0% 0 0.0%
COLORADO 14 0.0% 0 0.0%
24 Data Source: US DOT Pipeline and Hazardous Materials Safety Administration, Portal - Data as of
11/20/2014

Page 14 of 24
WEST VIRGINIA 14 0.1% 30 0.0%
SOUTH DAKOTA 9 0.2% 0 0.0%
IOWA 7 0.0% 7 0.0%
GEORGIA 5 0.0% 0 0.0%
WASHINGTON 3 0.0% 0 0.0%
Similarly, Washington will have the last remaining bare steel gas distribution pipeline
replaced in the first part of 2015. Table 6 illustrates the progress of the state at the close of
2013.
Table 6: Bare Steel Pipeline 2013
State Main Miles
Bare Steel
% of Total
Main Miles
Service
Count
% of Total
Service Count
OHIO 8,641.57 15.1% 151,370 4.3%
PENNSYLVANIA 7,648.74 16.1% 326,151 11.5%
NEW YORK 6,515.83 13.6% 317,447 10.0%
TEXAS 5,932.16 5.8% 158,199 3.2%
KANSAS 3,433.28 15.4% 117,677 12.4%
CALIFORNIA 3,430.94 3.3% 17,807 0.2%
WEST VIRGINIA 2,911.75 27.2% 82,337 19.4%
OKLAHOMA 1,783.73 6.9% 54,805 4.2%
MASSACHUSETTS 1,697.82 7.9% 188,612 14.7%
NEW JERSEY 1,556.20 4.6% 269,636 11.6%
MICHIGAN 1,354.26 2.4% 49,493 1.5%
ARKANSAS 1,341.43 6.6% 22,805 3.4%
MISSOURI 1,190.22 4.4% 13,578 0.9%
FLORIDA 1,135.48 4.2% 43,033 4.9%
LOUISIANA 984.18 3.7% 27,717 2.5%
NEBRASKA 958.47 7.6% 5,130 0.9%
KENTUCKY 831.38 4.6% 25,666 3.0%
INDIANA 741.81 1.8% 3,079 0.2%
ALABAMA 591.20 1.9% 154,068 14.3%
VIRGINIA 574.80 2.7% 15,000 1.2%
ARIZONA 548.72 2.3% 11,487 0.9%
MISSISSIPPI 529.17 3.2% 2,179 0.4%
MINNESOTA 438.53 1.4% 5,482 0.4%

Page 15 of 24
RHODE ISLAND 319.84 10.1% 41,821 21.7%
MARYLAND 308.48 2.1% 91,270 9.0%
ILLINOIS 303.87 0.5% 26,597 0.7%
COLORADO 229.96 0.7% 19,101 1.2%
CONNECTICUT 173.72 2.2% 55,468 12.9%
IOWA 172.49 1.0% 8,318 0.9%
HAWAII 109.10 17.9% 7,272 20.9%
NEW MEXICO 98.44 0.7% 10,477 1.7%
TENNESSEE 81.27 0.2% 3,066 0.2%
GEORGIA 81.20 0.2% 11,708 0.6%
WYOMING 43.08 0.8% 3,078 1.7%
SOUTH DAKOTA 32.30 0.7% 2,157 1.1%
NEW HAMPSHIRE 29.88 1.6% 6,704 7.5%
DISTRICT OF
COLUMBIA 27.72 2.3% 6,908 5.6%
WASHINGTON 23.30 0.1% 2,094 0.2%
DELAWARE 22.59 0.8% 957 0.6%
MONTANA 10.03 0.1% 599 0.2%
OREGON 10.01 0.1% 69 0.0%
SOUTH CAROLINA 10.00 0.0% 410 0.1%
ALASKA 7.99 0.3% 0 0.0%
NORTH DAKOTA 7.81 0.2% 68 0.0%
UTAH 6.56 0.0% 8 0.0%
MAINE 1.67 0.2% 185 0.7%
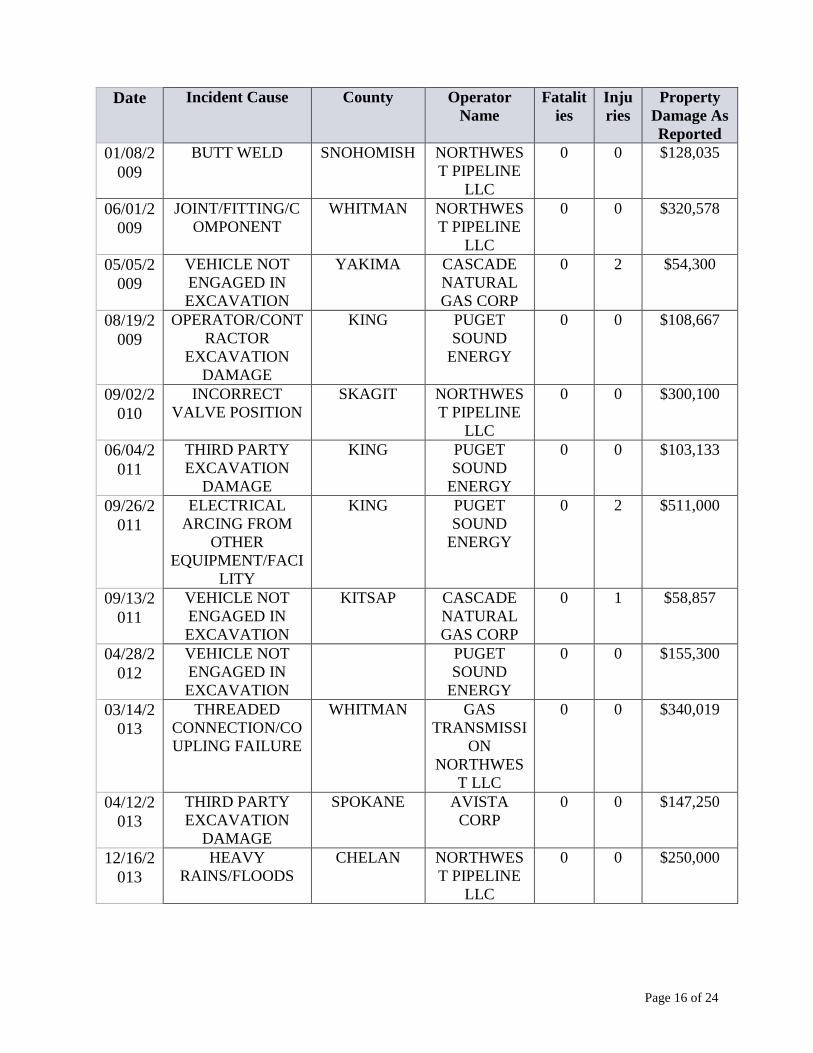
Pipeline Incidents
During the previous five years, there have been 12 significant pipeline incidents in
Washington, all on natural gas pipelines. Table 7 provides basic information about all these
incidents.
Page 16 of 24
Date Incident Cause County Operator
Name
Fatalit
ies
Inju
ries
Property
Damage As
Reported
01/08/2
009
BUTT WELD SNOHOMISH NORTHWES
T PIPELINE
LLC
0 0 $128,035
06/01/2
009
JOINT/FITTING/C
OMPONENT
WHITMAN NORTHWES
T PIPELINE
LLC
0 0 $320,578
05/05/2
009
VEHICLE NOT
ENGAGED IN
EXCAVATION
YAKIMA CASCADE
NATURAL
GAS CORP
0 2 $54,300
08/19/2
009
OPERATOR/CONT
RACTOR
EXCAVATION
DAMAGE
KING PUGET
SOUND
ENERGY
0 0 $108,667
09/02/2
010
INCORRECT
VALVE POSITION
SKAGIT NORTHWES
T PIPELINE
LLC
0 0 $300,100
06/04/2
011
THIRD PARTY
EXCAVATION
DAMAGE
KING PUGET
SOUND
ENERGY
0 0 $103,133
09/26/2
011
ELECTRICAL
ARCING FROM
OTHER
EQUIPMENT/FACI
LITY
KING PUGET
SOUND
ENERGY
0 2 $511,000
09/13/2
011
VEHICLE NOT
ENGAGED IN
EXCAVATION
KITSAP CASCADE
NATURAL
GAS CORP
0 1 $58,857
04/28/2
012
VEHICLE NOT
ENGAGED IN
EXCAVATION
PUGET
SOUND
ENERGY
0 0 $155,300
03/14/2
013
THREADED
CONNECTION/CO
UPLING FAILURE
WHITMAN GAS
TRANSMISSI
ON
NORTHWES
T LLC
0 0 $340,019
04/12/2
013
THIRD PARTY
EXCAVATION
DAMAGE
SPOKANE AVISTA
CORP
0 0 $147,250
12/16/2
013
HEAVY
RAINS/FLOODS
CHELAN NORTHWES
T PIPELINE
LLC
0 0 $250,000

Page 17 of 24
Section III: PHMSA Performance Metrics
PHMSA annually conducts an evaluation process of the individual state regulatory programs.
PHMSA and the National Association of Pipeline Safety Representatives developed a
performance metric to better inform the evaluation. One metric that is used, which is
associated with the discussion on the replacement of leaking pipelines, is a leak management
system. Under this system, leak management is measured by the total number of leaks
repaired per mile, the total number of hazardous leaks repaired per mile, and the total leaks
scheduled for repair per mile for gas distribution systems in the state. The results for
Washington can be found in Figure 3.
Figure 3: Washington Leak Management25
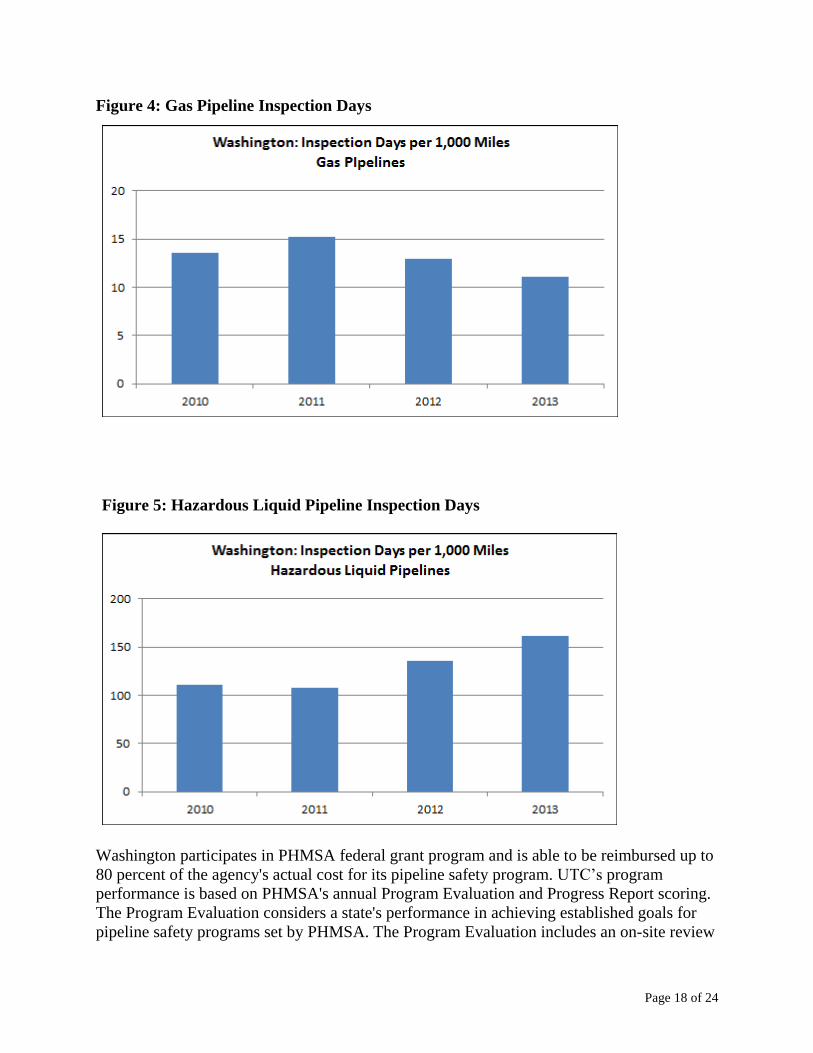
Inspection activity is another metric used by PHMSA in its evaluation of the state programs.
Inspection time is critical in ensuring the safe operation of the state’s pipelines. Figures 4
and 5 illustrate the current inspection system in the state of Washington.
25 http://primis.phmsa.dot.gov/previewamur/stateprogrammetrics/stateprogrammetrics_wa.htm
Page 18 of 24
Figure 4: Gas Pipeline Inspection Days
Figure 5: Hazardous Liquid Pipeline Inspection Days
Washington participates in PHMSA federal grant program and is able to be reimbursed up to
80 percent of the agency's actual cost for its pipeline safety program. UTC’s program
performance is based on PHMSA's annual Program Evaluation and Progress Report scoring.
The Program Evaluation considers a state's performance in achieving established goals for
pipeline safety programs set by PHMSA. The Program Evaluation includes an on-site review
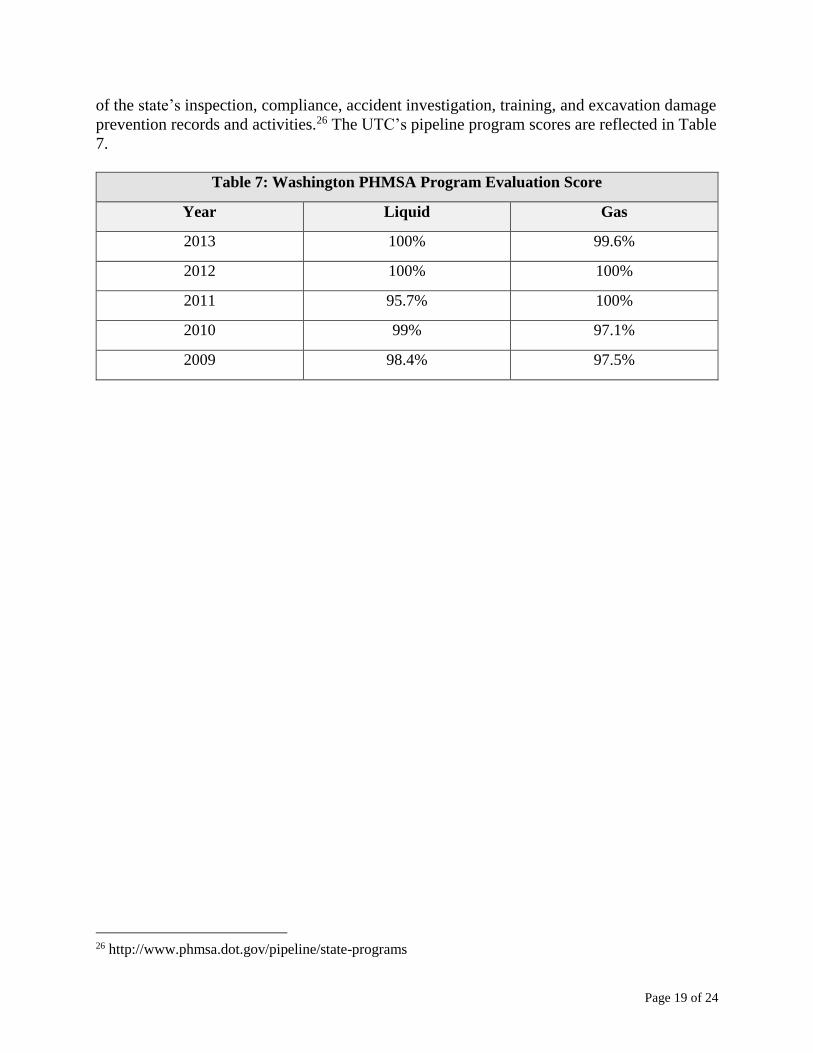
Page 19 of 24
of the state’s inspection, compliance, accident investigation, training, and excavation damage
prevention records and activities.26 The UTC’s pipeline program scores are reflected in Table
7.
Table 7: Washington PHMSA Program Evaluation Score
Year Liquid Gas
2013 100% 99.6%
2012 100% 100%
2011 95.7% 100%
2010 99% 97.1%
2009 98.4% 97.5%
26 http://www.phmsa.dot.gov/pipeline/state-programs
Page 20 of 24
Section IV: Annual Review of Committee Work
The Citizen Committee met four times in 2014 with full meeting details, presentations,
materials and background information available at www.utc.wa.gov/ccops. There were a
number of presentations and discussions surrounding various pipeline and public safety
issues. The following are topics discussed and presented to the committee by pipeline safety
staff and others:
Damage Prevention Program Monitoring o Dirt Analysis Quarterly Dig Report – Developed for education outreach.
Available on Pipeline Safety program website.
o Newsletter – Emailed quarterly to Dig Law interested parties list.
o Letters to Homeowners and Excavators –UTC sends letters to offenders that
damage the gas lines. Information is obtained from Virtual DIRT. Repeat
offenders have been identified and are investigated by engineering staff.
o Dig Law Safety Committee - The committee reviews all complaints received
and provide recommendations to the UTC for enforcement. The committee is
currently working on several issues, including “Positive response to the dig
tickets” and hoping to conclude with recommendations.
o Dig Law Education Training – Training was conducted at the Dept. of Labor
and Industries (LNI) on June 27, 2014.
o Survey – Advertising agency hired a contractor to conduct a survey of 400
homeowners before and after the advertising campaign. The result of the
survey indicates significant improvement of homeowner’s knowledge.
o 2015 Expenditure – State Pipeline Safety Program will spend $600,000 from
penalty assessment money on future media campaign. An additional $75,000
may be added to the advertisement. Additional emphasis will be placed on
advertising in Hispanic communities.
Regulatory Actions
o Sent a letter to the U.S. Secretary of Transportation recommending release of
long pending PHMSA rules.
Emergency Response as it relates to Local Emergency Management and
Geographic Response Plans
o Discussed the role of the Local Emergency Planning Committees as they relate
to Local Emergency Management offices that conduct hazard identification,
vulnerability analysis, and risk assessment activities for their jurisdictions.
o The federal and state statutes requires these committees to develop and
maintain response plans.
o Geographic Response Plans (GRP) guide local responders during the first 24
to 48 hours of a major oil spill until additional resources supplied by Unified
Command can arrive.
Page 21 of 24
o Department of Ecology will work with the Committee to receive input and
comment regarding GRP’s and potential geographic areas where GRP work
may be needed.
Reviewed Marine and Rail Oil Transportation Study Preliminary Findings
o UTC staff presented the preliminary findings of the marine and oil
transportation study.
o Department of Ecology is the lead on the study. UTC, the WA Military Dept.
Emergency Management and the Federal Railroad Administration (have
assisted Ecology with the study.
o In June 2014, Governor Inslee issued Directive 14-06 that required Ecology to
draft a preliminary report with findings and recommendations by October 1,
2014, to assess the oil transportation safety in Washington.
o An interim report to the Governor and Legislature was completed by
December 1, 2014.
o The final report is due by March 1, 2015.
Alcohol, Tobacco and Firearms (ATF) Involvement During UTC Investigations
o Committee was presented with a report from UTC staff regarding possible
interference from an ATF agent during a UTC investigation.
o Issue was raised at the National Association of Pipeline Safety Regulators
(NAPSR) meetings.
o There have been similar reports in other states involving ATF agents.
o NAPSR has reached out to ATF regarding the potential conflict.
o UTC reports an improved working relationship with ATF.
Emergency Management’s Role in Pipeline Incident o King and Pierce County Offices of Emergency Management provided an
overview of their emergency roles in informing the public and local
government pertaining to emergency planning and incident response.
Pipeline Association of Washington Update Presentation o The association presented its Emergency Responder Training sessions.
Trans Mountain Worst Case Scenario Spill Drill – May 1, Observation o Committee Member Dave Taylor provided a presentation from his
observations on the Trans Mountain Spill Drill held on May 1, 2014, in
Bellingham.
o Following the presentation, committee had a lengthy discussion regarding
involvement of the local agencies, roles and responsibilities.
o It was suggested that the committee should review the spill response plan such
as leak detection systems, etc.

Page 22 of 24
Washington – Ground Zero for Fossil Fuel Transportation o Rick Kuprewicz with Accufacts, Inc. provided a presentation on the Ground
Zero for Fossil Fuel Transportation.
o Presentation was based on investigation of recent hydrocarbon transportation
accidents and also information that is readily available to the public.
Emergency Response
o Department of Ecology gave regular briefings regarding spill response
activities.

Page 23 of 24
Section V: 2015 Annual Work-Plan
Members voted and approved the following topics to be included in the 2015 work plan.
Geographic Response Plan (GRP) – Interacting with Dept. of Ecology.
Fugitive Gas as it relates to the conditions of pipelines.
Cyber Security issues.
Effectiveness of Damage Prevention programs.
Updates on Earthquake warning system from University of Washington.
Evaluate the value of supply disruption public education efforts.
Update on land use planning around pipelines.
UTC updates.
Dept. of Ecology updates.
Evaluate the Federal Rulemaking Procedures.

Page 24 of 24
CCOPS Members
In 2014, the committee lost and gained members as terms expired and new members were
appointed.
Members serving during 2014:
Voting members:
Bob Beaumier, Chair, Spokane Public
Tim Sweeney, Olympia Public
David Taylor, Ridgefield Cities Representative
Carl Weimer, Bellingham Washington State Association of Counties
Arthur Coulombe, Walla Walla Public
Ron Schmitt, Tacoma Public
Terrill Briere, Renton Public
Christian Amend, Pasco Public
Robert Oenning, Tacoma Public
Ron Bowen, Shelton Public
Non-voting members:
Jody Morehouse, Spokane Avista Utilities
Nick Peelo, Tacoma McChord Pipeline
Randy Craig Tarter, Bellingham Williams Northwest Pipeline
Edward Cimaroli, Maple Valley BP Pipelines
Citizens Advisory Committee on Pipeline Safety
Washington Utilities and Transportation Commission
Attention: Pipeline Safety Program
PO Box 47250, Olympia, WA 98504-7250
Email: [email protected]
Website: www.utc.wa.gov/ccops
Recommended