2013 Interim Results Corporate Presentation
IPPC 26 Aug 2013

2
Disclaimer
This presentation has been prepared by Comba Telecom Systems Holdings Limited (the “Company”) for reference only. The information contained in this presentation has not been independently verified. The Company does not make any representation, warranty or undertaking, whether express or implied, to and no reliance should be placed on, the fairness, accuracy, suitability, completeness or correctness of the information or opinions contained herein. Any summary does not purport to be complete and accurate. None of the Company or its affiliates or their respective directors, employees or representatives will be liable for any loss howsoever arising from any use of this presentation or its contents or otherwise arising in connection with this presentation. This presentation contains statements that constitute forward-looking statements. These statements include descriptions regarding the intent, belief or current expectations of the Company or its officers with respect to the Company and the relevant industry. Such forward-looking statements are not guarantees of future performance and involve risks and uncertainties, and actual results may differ from those in the forward-looking statements in material respect as a result of various factors and assumptions (in particular for the national policies). The Company has no obligation does not undertake to revise forward-looking statements to reflect future events or circumstances. This presentation does not constitute an offer to sell or issue or the solicitation of an offer to buy or acquire securities of the Company in any jurisdiction or an inducement to enter into investment activity, not may it or any part of if form the basis of or be relied upon in connection with any contract or commitment whatsoever.

3
Agenda
Financial Highlights
Financial Review
Customer Review
Business Review
Open Forum
Financial Highlights
Financial Results
Financial Position
Key Financial Indicators
4 4
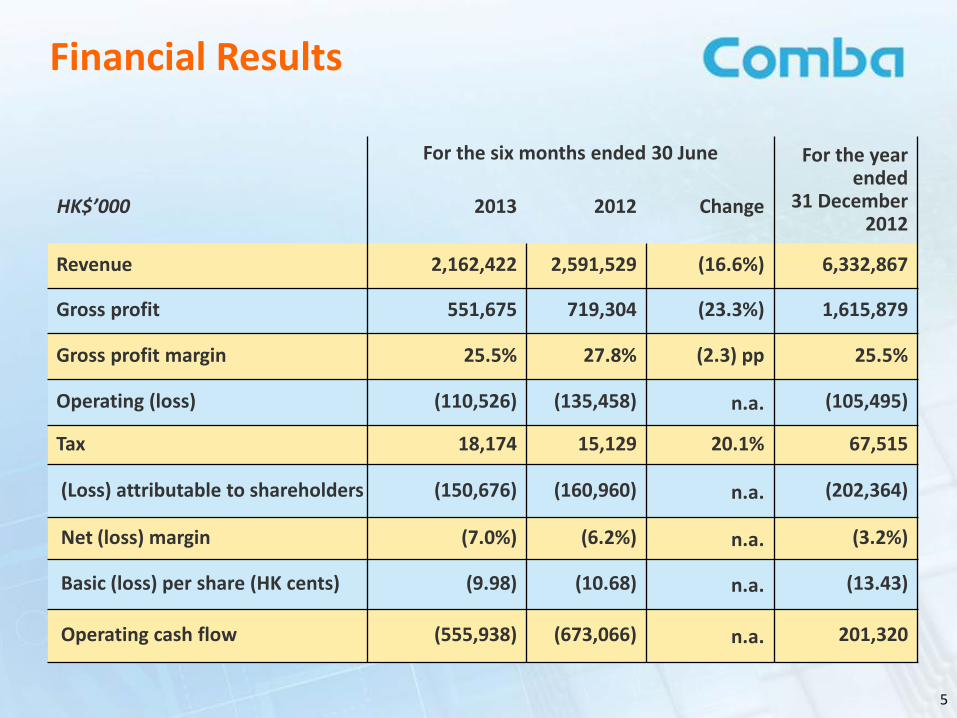
For the six months ended 30 June For the year ended
31 December 2012
HK$’000 2013 2012 Change
Revenue 2,162,422 2,591,529 (16.6%) 6,332,867
Gross profit 551,675 719,304 (23.3%) 1,615,879
Gross profit margin 25.5% 27.8% (2.3) pp 25.5%
Operating (loss) (110,526) (135,458) n.a. (105,495)
Tax 18,174 15,129 20.1% 67,515
(Loss) attributable to shareholders (150,676) (160,960) n.a. (202,364)
Net (loss) margin (7.0%) (6.2%) n.a. (3.2%)
Basic (loss) per share (HK cents) (9.98) (10.68) n.a. (13.43)
Operating cash flow (555,938) (673,066) n.a. 201,320
5
Financial Results
Financial Position
6
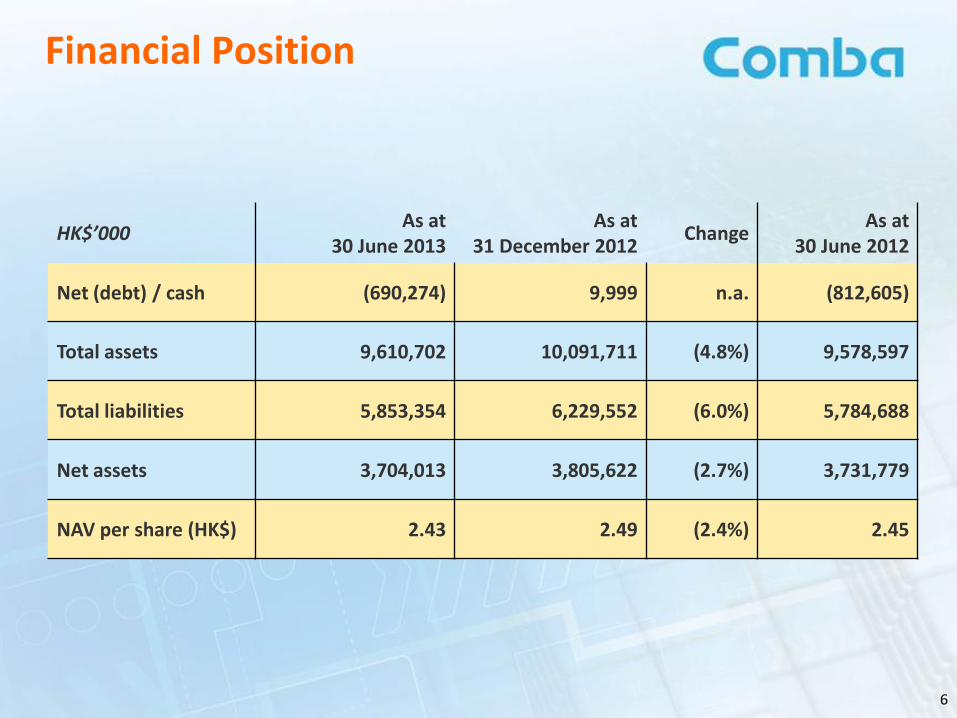
HK$’000 As at
30 June 2013 As at
31 December 2012 Change
As at 30 June 2012
Net (debt) / cash (690,274) 9,999 n.a. (812,605)
Total assets 9,610,702 10,091,711 (4.8%) 9,578,597
Total liabilities 5,853,354 6,229,552 (6.0%) 5,784,688
Net assets 3,704,013 3,805,622 (2.7%) 3,731,779
NAV per share (HK$) 2.43 2.49 (2.4%) 2.45

Key Financial Indicators
For the six months ended 30 June For the year
ended
2013 2012 Change 31 December 2012
Inventory turnover days 257 239 +18 days 180
A/R turnover days 388 315 +73 days 259
A/P turnover days 364 288 +76 days 242
Gross gearing ratio 16.5% 15.9% 0.6 pp 15.4%
7

Financial Review
Revenue Breakdown by Customers
Revenue Breakdown by Businesses
Cost Structure
8 8
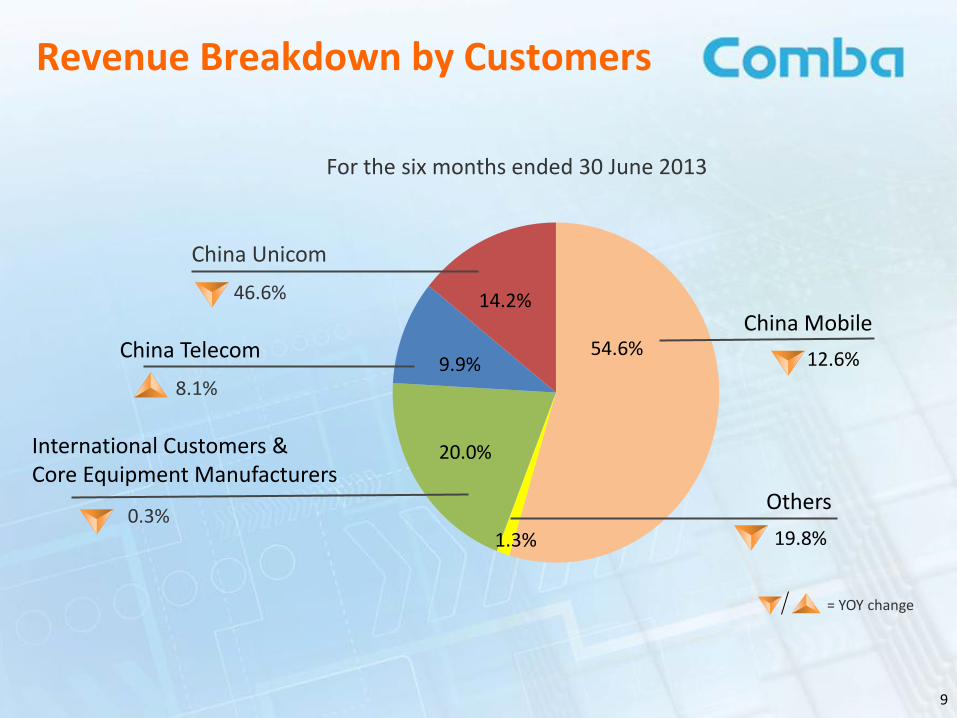
Revenue Breakdown by Customers
54.6% China Mobile
12.6%
China Unicom
46.6% 14.2%
1.3%
Others
19.8%
20.0% International Customers & Core Equipment Manufacturers
0.3%
For the six months ended 30 June 2013
China Telecom
8.1% 9.9%
= YOY change
9

Revenue Breakdown by Businesses
25.8%
Wireless Enhancement
20.4%
8.4% Wireless Access & Transmission
48.9%
32.9 %
32.9%
Services
6.8%
For the six months ended 30 June 2013
18.2%
Antennas & Subsystems
= YOY change
10

0.6% 0.8%
0.6% 1.2%
16.4% 16.4%
9.6%11.0%
7.7% 4.0%
0%
5%
10%
15%
20%
25%
30%
35%
1H2012 1H2013
11
Cost Structure
As % of Total Revenue
Administrative expenses
Decrease in revenue Stringent cost control
Selling and distribution expenses
Capitalization of R&D expenses of HK$92 million Stringent cost control
R&D costs
= YOY change
56.9%
4.9%
16.5%
Finance costs
Taxation charge 20.1%
58.1%
Stringent cost control
Higher borrowing costs and more bank borrowings
For the six months ended 30 June
34.9% 33.4%
A deferred tax debit

12
Global Customers
China Business
International Customers & Core Equipment Manufacturers
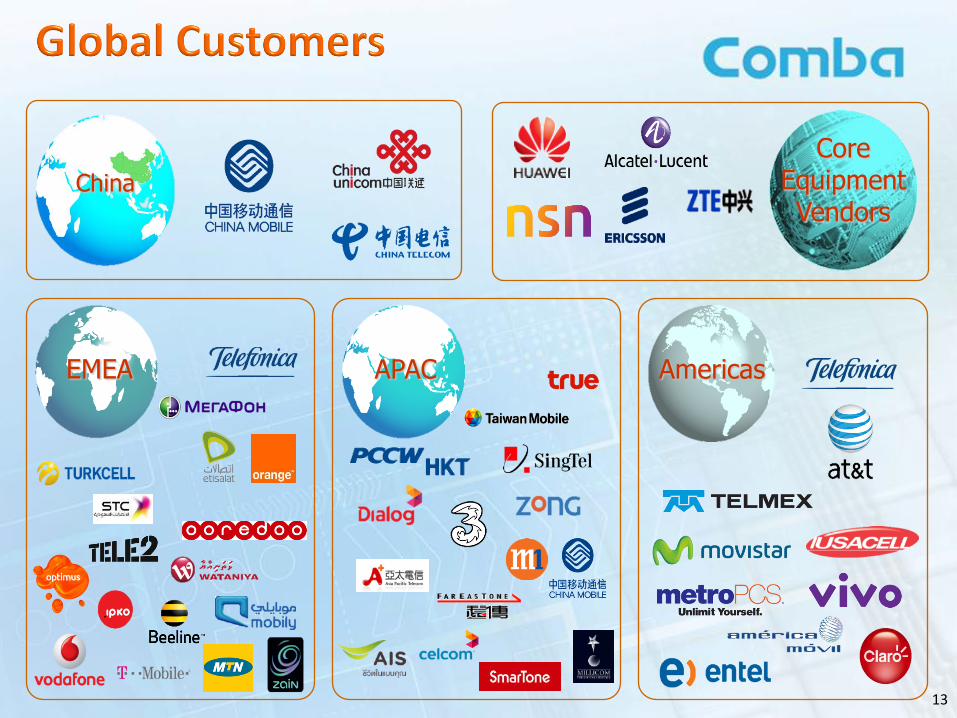
China
EMEA APAC Americas
Core Equipment Vendors
13
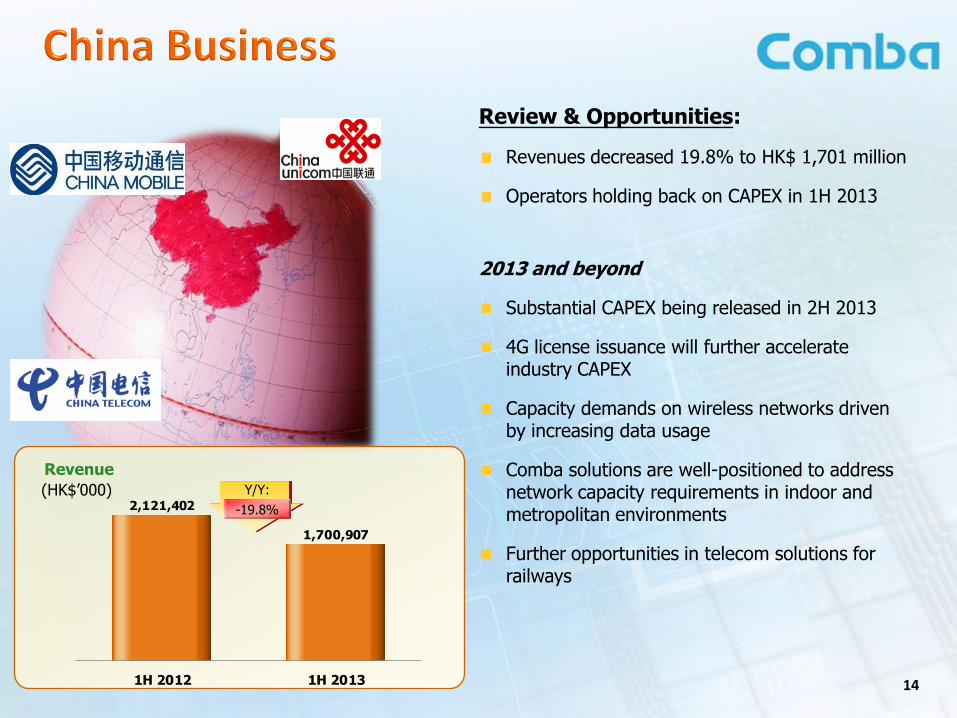
2,121,402
1,700,907
1H 2012 1H 2013
Review & Opportunities:
Revenues decreased 19.8% to HK$ 1,701 million
Operators holding back on CAPEX in 1H 2013
2013 and beyond
Substantial CAPEX being released in 2H 2013
4G license issuance will further accelerate industry CAPEX
Capacity demands on wireless networks driven by increasing data usage
Comba solutions are well-positioned to address network capacity requirements in indoor and metropolitan environments
Further opportunities in telecom solutions for railways
(HK$’000)
Revenue
14
Y/Y:
-19.8%
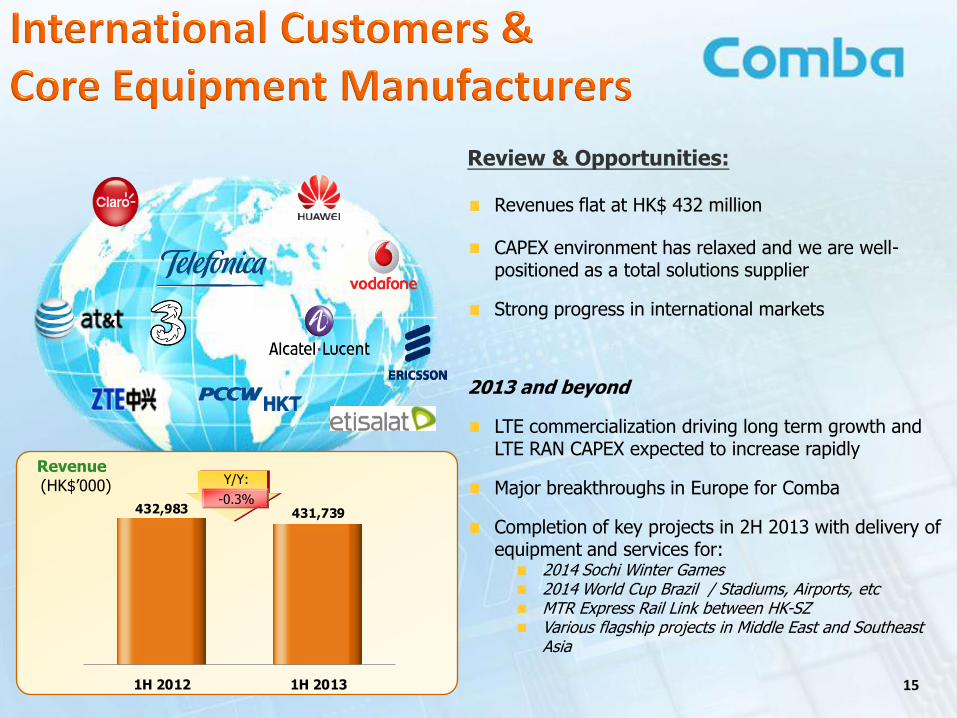
Review & Opportunities:
Revenues flat at HK$ 432 million
CAPEX environment has relaxed and we are well-positioned as a total solutions supplier
Strong progress in international markets
2013 and beyond
LTE commercialization driving long term growth and LTE RAN CAPEX expected to increase rapidly
Major breakthroughs in Europe for Comba
Completion of key projects in 2H 2013 with delivery of equipment and services for:
2014 Sochi Winter Games 2014 World Cup Brazil / Stadiums, Airports, etc MTR Express Rail Link between HK-SZ Various flagship projects in Middle East and Southeast Asia
15
(HK$’000) Revenue
432,983 431,739
1H 2012 1H 2013
Y/Y:
-0.3%

16
Wireless Access & Transmission
Wireless Enhancement
Antenna & Subsystems
Services
Summary

17
Review & Opportunities:
Revenues decreased 48.9% to HK$ 182 million
WIRELESS ACCESS (WLAN Solutions + IB-WAS Solutions)
Directly addresses capacity solutions demand
IB-WAS solution trials in China:
Various trials are now progressing into larger scale commercial deployments
2013 and beyond
Exploding wireless data usage globally expected to drive offload solution demands.
Integration of small cell and wi-fi solutions for indoor and outdoor systems
Accelerate introduction of wireless access solutions to the international market
Revenue
(HK$’000)
Small Cell Solutions (IB-WAS)
WLAN Solutions
355,640
181,897
1H 2012 1H 2013
Y/Y:
-48.9%

18
WIRELESS TRANSMISSION (Digital Microwave Systems & Satellite Solutions)
Expanded digital microwave solution sales to international markets around the world
Complete backhaul solutions including IP and small cell backhaul
Expanded customer base in various industry verticals
Integration of satellite solutions to create complete wireless transmission portfolio
2013 and beyond
High-speed and high-capacity network requirements to drive backhaul solution demands
4G license issuance in China will fuel further growth
Digital Microwave Systems
Satellite Solutions
High Capacity
Wireless
Backhaul
Enterprise Subscribers
Residential Subscribers
Wi-Fi &
Enterprise Small
Cell
Wi-Fi & Home
Small Cell

Review & Opportunities:
Revenues decreased 20.4% to HK$ 557 million
China operators control on CAPEX directly impacted spending on wireless enhancement
2013 and beyond
Substantial CAPEX being released in 2H 2013 in China
Wireless enhancement solution opportunities for China’s railways
Huge capacity demands in networks and high density areas driving wireless enhancement solutions
Enhanced multi-band, multi-operator DAS portfolio
Perfectly addresses opportunities in large-scale venue with extreme capacity demands.
2014 World Cup, 2014 Sochi Winter Games, MTR, etc.
19
Passive DAS (Small Venue)
Active DAS (Med/Large Venue)
Repeaters
Remote Radio Units
Y/Y:
+26.9%
(HK$’000) Revenue
Y/Y:
-20.4% 699,227
556,900
1H 2012 1H 2013

Antennas
Tower Mounted Solutions
RF Front Ends
20
Review & Opportunities:
Revenues decreased 18.2% to HK$ 712 million
China operators CAPEX slowdown adversely affected revenues but was mitigated by international demand
1H 2013 launch of multi-system, multi-band antennas portfolio helps address new 3G/4G opportunities
2013 and beyond
China 4G license issuance will drive antennas & subsystem demand
New and existing 3G and 4G network buildouts around the world continues
Co-siting solutions to ease operator site acquisition issues
LTE antennas and passives being deployed in 4G network trials and rollouts around the world
Revenue
(HK$’000)
869,990
711,931
1H 2012 1H 2013
Y/Y:
-18.2%
21
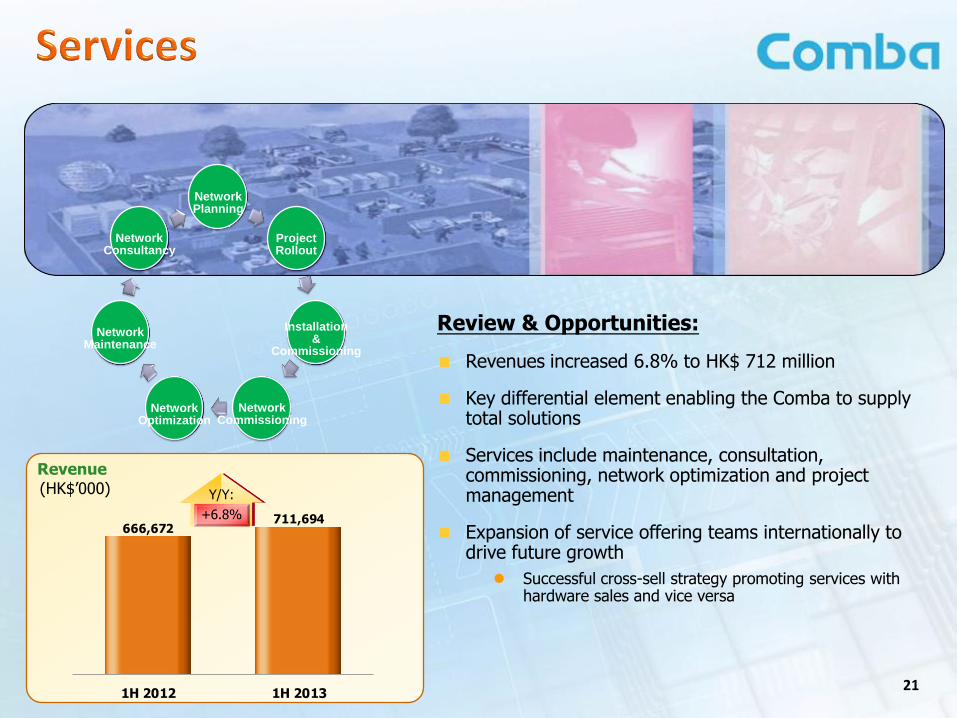
Network Maintenance
Network Consultancy
Network Planning
Project Rollout
Installation &
Commissioning
Network Commissioning
Network Optimization
Y/Y:
+6.8%
Review & Opportunities:
Revenues increased 6.8% to HK$ 712 million
Key differential element enabling the Comba to supply total solutions
Services include maintenance, consultation, commissioning, network optimization and project management
Expansion of service offering teams internationally to drive future growth
Successful cross-sell strategy promoting services with hardware sales and vice versa
Revenue (HK$’000)
666,672711,694
1H 2012 1H 2013

Substantial CAPEX in China is being released in 2H 2013
4G licensing will further accelerate spending
4G LTE is the next stage of industry growth internationally
Global CAPEX on LTE expected to be the fastest growing segment
Key international projects will be completed in 2H 2013
Continuous development of Comba products and solutions to maintain position in meeting demands for data capacity solutions
22

Open Forum &
Appendix
23
Recommended