Report prepared by Mekong River Commision Environment Programme
MRC Technical Paper No.40May 2013
ISSN: 1683-1489
2011 Annual Water Quality Data Assessment Report

Report prepared by Mekong River Commision Environment Programme
MRC Technical Paper No.40May 2013
ISSN: 1683-1489
2011 Annual Water Quality Data Assessment Report

Published in Vientiane, Lao PDR in May 2013 by the Mekong River Commission
Suggested citation:
Kongmeng LY, Henrik LARSEN (2012). 2011 Annual Water Quality Data Assessment Report,
MRC Technical Paper No. 40. Mekong River Commission, Vientiane, 59 pp.
The opinions and interpretation expressed within are those of the authors
and do not necessarily reflect the views of the Mekong River Commission.
Editor: Robert Brown
Photographers: © Mekong River Commission
© Mekong River Commission
Office of the Secretariat in Phnom Penh (OSP)
576 National Road, #2, Chak Angre Krom, P.O. Box 623, Phnom Penh, Cambodia
Tel. (855-23) 425 353. Fax (855-23) 425 363
Email: [email protected]
Office of the Secretariat in Vientiane (OSV)
Office of the Chief Executive Officer
184 Fa Ngoum Road,
P.O. Box 6101, Vientiane, Lao PDR
Tel (856-21) 263 263. Fax (856-21) 263 264
Website: www.mrcmekong.org

iii2011 Annual Water Quality Data Assessment Report
LIST OF FIguRES IV
LIST OF TABLES V
ACRONYMS VII
EXECuTIVE SuMMARY IX
1. INTRODuCTION 11.1 Background 21.2 Water Quality Monitoring Network 21.3 Objectives of the Report 3
2. WATER QuALITY MONITORINg METHODOLOgY 52.1 Field Sampling Plan 62.2 Laboratories Analysis 92.3 Data Assessment and Reporting 102.4 Quality Assurance and Quality Control 13
3. RESuLTS AND DISCuSSIONS 153.1 Analysis of Water Quality Trends 183.2 Water Quality Indices 273.3 Ecological Health Monitoring 30
4. CONCLuSIONS AND RECOMMENDATIONS 354.1 Conclusions 364.2 Recommendations 37
REFERENCES 39
APPENDIX A. THE MRC WATER QuALITY guIDELINES FOR THE PROTECTION OF HuMAN HEALTH 41
APPENDIX B. THE MRC WATER QuALITY guIDELINES FOR THE PROTECTION OF AQuATIC LIFE 43
Table Of Contents

iv 2011 Annual Water Quality Data Assessment Report
Figure 2.1. An illustration of water quality monitoring stations of the MRC WQMN in the Lower Mekong Basin _________________________________ 8
Figure 3.1. Variation in pH levels along the Mekong River (1-17) and Bassac River (18-22) as observed in 2011 ___________________________ 18
Figure 3.2. Annual variation of pH levels in the Mekong River from 1985 to 2011 ________ 19Figure 3.3. Variation in Electrical Conductivity levels along the Mekong River (1-17)
and Bassac River (18-22) as observed in 2011 ___________________________ 19Figure 3.4. Variation in TSS concentrations along the Mekong River (1-17)
and Bassac River (18-22) as observed in 2011 ___________________________ 20Figure 3.5. Temporal variation in TSS in the Mekong River from 1985 to 2011 ___________ 20Figure 3.6. Spatial variation in nitrate-nitrite concentrations in the
Mekong River (1-17) and Bassac River (18-22) in 2011 _____________________ 21Figure 3.7. Temporal variation in nitrate-nitrite concentration in the
Mekong River from 1985 to 2011 ______________________________________ 21Figure 3.8. Spatial variation in ammonium concentrations in the Mekong River (1-17)
and Bassac River (18-22) in 2011 _____________________________________ 22Figure 3.9. Temporal variation in ammonium concentration in the
Mekong River from 1985 to 2011 ______________________________________ 22Figure 3.10. Spatial variation in total phosphorus concentrations in the
Mekong River (1-17) and Bassac River (18-22) in 2011 _____________________ 23Figure 3.11. Temporal variation in total phosphorus concentration in the
Mekong River from 1985 to 2011 ______________________________________ 23Figure 3.12. Variation in dissolved oxygen (mg/L) at 22 stations along the
Mekong (1-17) and Bassac (18-22) Rivers in 2011 ________________________ 24Figure 3.13. Temporal variation in dissolved oxygen concentration in the
Mekong River from 1985 to 2011 ______________________________________ 25Figure 3.14. Variation in COD (mg/L) at 22 stations along the Mekong (1-17)
and Bassac (18-22) Rivers in 2011 _____________________________________ 26Figure 3.15. Temporal variation in COD concentrations in the Mekong River
from 1985 to 2011 _________________________________________________ 26Figure 3.16. Locations of the EHM in relation to the location of the WQMN ______________ 31
List of Figures

v2011 Annual Water Quality Data Assessment Report
Table 2-1. A summary of 2011 water quality monitoring stations ______________________ 6Table 2-2. Water quality monitoring stations in the Mekong and
Bassac Rivers numbered in sequential from upstream to downstream and as monitored in 2011_________________________________ 7
Table 2-3. Water quality parameters and their corresponding analytical methods ________ 10Table 2-4. Weight for each parameter used for calculating indices
for human impact on water quality and for the protection of aquatic life ______ 11Table 2-5. Rating systems for the MRC Water Quality Indices _________________________ 12Table 3-1. A comparison of water quality data of the Mekong River
between 1985-2010 and 2011 _________________________________________ 17Table 3-2. A comparison of water quality data of the Bassac River
between 1985-2010 and 2011 _________________________________________ 17Table 3-3. Levels of human impacts on water quality of the Mekong River (1-17)
and Bassac River (18-22) from 2007-2011 ________________________________ 28Table 3-4. Water quality class of the Mekong River (1-17) and Bassac River (18-22)
for the protection of aquatic life 2007-2011 ______________________________ 29Table 3-5. Water quality class of the Mekong River (1-17) and Bassac River (18-22)
for agricultural use for 2007-2011 ______________________________________ 30Table 3-6. Results of the Ecological Health Monitoring 2005-2008 and 2011 _____________ 32
List of Tables

vii2011 Annual Water Quality Data Assessment Report
Acronyms
COD Chemical Oxygen Demand
DO Dissolved Oxygen
EC Electrical Conductivity
EHM Ecological Health Monitoring
EP Environment Programme
ISO International Organization for Standardization
MRC Mekong River Commission
MRCS Mekong River Commission Secretariat
NMCs National Mekong Committees
PWQ Procedures for Water Quality
QA/QC Quality Assurance/Quality Control
TSS Total Suspended Solids
WQCA MRC Water Quality Criteria for the Protection of Aquatic Life
WQCH MRC Water Quality Criteria for the Protection of Human Health
WQI Water Quality Index
WQIag Water Quality Index for Agricultural use
WQIal Water Quality Index for the Protection of Aquatic Life
WQIhi Water Quality Index for Human Impacts
WQMN Water Quality Monitoring Network

EXECUTIVE SUMMARy
ix2011 Annual Water Quality Data Assessment Report

x 2011 Annual Water Quality Data Assessment Report
Since its inception 1985, the Water Quality
Monitoring Network (WQMN) has provided
a continuous record of water quality in
the Mekong River and its tributaries. The
routine water quality monitoring under the
WQMN has become one of the key environ-
mental monitoring activities implemented
under the MRC Environment Programme,
supporting the implementation of the
Procedures for Water Quality. The actual
monitoring of water quality is being imple-
mented by the designated laboratories of
the Member Countries.
In 2011, the Mekong River Commission,
with the assistance of the Member Coun-
tries, conducted a routine monitoring of
water quality of the Mekong River and its
tributaries at 48 stations, of which 17 were
located in the Mekong River while 5 were
located in the Bassac River. In all, 18 water
quality parameters were monitored on a
monthly or bi-monthly basis at each station
while additional 6 parameters were mon-
itoring monthly or bi-monthly during the
wet season at each station.
The results of the monitoring showed that
water quality of the Mekong River is still
of good quality with only a few numbers
of dissolved oxygen and chemical oxygen
demand samples exceeding the MRC Water
Quality guidelines for the Protection of
Human Health and Aquatic Life. The results
also showed that pH and dissolved oxy-
gen levels decreased as the Mekong River
flowed from upstream to downstream
while nutrients, total suspended solids and
chemical oxygen demand levels exhibited
opposite trends as the river flowed from
upstream to downstream.
Compared to previous years, nutrient
levels increased slightly in 2011 with total
phosphorus and ammonium levels show-
ing increasing trends from 1985 to 2011
while nitrate-nitrite levels remain relatively
constant. While dissolved oxygen levels
remained relatively constant from 1985
to 2011, chemical oxygen demand levels
increased slightly during the same time
frame. Total suspended solids level showed
a noticeable decrease between 1985 and
2011, from an average value of about 300
mg/L to about 80 mg/L.
With the maximum recorded electrical con-
ductivity of 35 mS/m, no restriction on the
use of the Mekong and Bassac Rivers water
for agricultural purposes was recorded in
2011.
The analysis of the 2011 water quality data
using the MRC Water Quality Index for
“Human Impacts” reveals that the degree of
human impact (pressure exerted by human
activities) on water quality of the Mekong
and Bassac Rivers ranged from “not impact-
ed” to “severely impacted”, with six stations
being classified as “severely impacted”
EXECUTIVE SUMMARy

EXECuTIVE SuMMARY
xi2011 Annual Water Quality Data Assessment Report
by human activities. Despite six stations
being classified as “severely impacted” by
human activities, all monitoring stations in
the Mekong and Bassac Rivers were rated
as “good” or “excellent” for the protection
of aquatic life. The results of the ecological
health monitoring also confirmed that the
biodiversity and ecological capability of the
Mekong and Bassac Rivers to support fish
and other aquatic functions was still mostly
excellent with many ecological health mon-
itoring stations being classified as either
“excellent” or “good”.
Overall, it can be concluded that the Me-
kong and Bassac Rivers are still fairly unpol-
luted. The water quality in the Delta tends
to be more impacted by human activities
than in other sections of the Lower Mekong
Basin, partly because of more intensive
agriculture and higher population densities
and cumulative effects of pollutants flowing
from upstream to downstream.

1. InTRODUCTIOn
12011 Annual Water Quality Data Assessment Report

2 2011 Annual Water Quality Data Assessment Report
1.1 BACKgROuND
The Mekong River, originating in the Tibetan
Plateau, is the longest river in Southeast
Asia and the 12th longest river in the world
at 4,880 km. It is also the 8th largest river in
the world in terms of mean annual discharge
(flow) at the mouth, which is about 14,500
m3/s (MRC, 2011). From the Tibetan Plateau,
the river flows in a south-easterly direction,
running through China, Myanmar, Lao PDR,
Thailand, Cambodia and Viet Nam before
discharging into the South China Sea.
At its confluence with the South China Sea,
the Mekong River has a total catchment
area of about 795,000 km2 (MRC, 2011). The
Mekong River is functionally subdivided
into seven broad physiographic regions
described by topography, drainage patterns
and the geomorphology of river channels.
The upper three regions (Tibetan Plateau,
Three Rivers, and Lancang Basin) make up
the upper Mekong Basin while the lower
4 regions (Northern Highlands, Khorat
Plateau, Tonle Sap Basin and the Delta)
make up the Lower Mekong Basin (MRC,
2010). With a total catchment area of about
571,000 km2, the Lower Mekong Basin
covers a large part of Northeast Thailand,
almost the entire countries of Lao PDR and
Cambodia, and the Southern tip of Viet
Nam (MRC, 2010).
According to the Mekong River Commission
State of the Basin Report (2010), the Lower
Mekong River is home to about 60 million
people of which about 75% live in rural
areas and depend on the Mekong River for
livelihoods and food security. The Mekong
River is also biodiversity rich with over 850
fish species identified. As such, water quali-
ty monitoring is an integral part for detect-
ing changes in the Mekong riverine environ-
ment and for maintaining good/acceptable
water quality to promote the sustainable
development of the Mekong River Basin.
1.2 WATER QuALITY MONITORINg NETWORK
To assist the Member Countries detect
changes in the environment and take
preventive and remedial action if water
quality deteriorated, the Interim Mekong
Committee (forerunner to the Mekong River
Commission) established a Water Quality
Monitoring Network (WQMN) in 1985 with
the initial involvement of the Lao PDR, Thai-
land and Viet Nam. Cambodia later joined
the WQMN in 1993. Since its inception, the
network has provided a continuous record
of water quality in the Mekong River and
its tributaries by measuring a number of
different water quality parameters. In 2011,
a total of 48 stations were monitored by the
WQNM. Of the 48 stations, 17 were located
on the Mekong River and 5 were located on
the Bassac River. The other 26 stations were
located in the tributaries of the Mekong Riv-
er. As of 2005, all 48 stations were classified
as “primary stations,” designed to detect
1. InTRODUCTIOn

INTRODuCTION
32011 Annual Water Quality Data Assessment Report
changes and capture pressures and threats
to the Mekong water quality. While only 48
stations were monitored in 2011, at its peak
(2009), up to 87 stations were monitored
by the WQMN (55 primary stations and 32
secondary stations). A reduction in the
number of monitoring stations was made
after an analysis found that water quality of
the Mekong River is still good and could be
reasonably represented by the 48 stations.
WQMN is one of the MRC core function
activities that require to be decentralised
to the Member Countries. At regional level,
the overall management of the WQMN is
under the MRC Environment Programme
(EP). Since the inception of the WQMN, the
EP has provided both technical and finan-
cial supports to the WQMN. The WQMN is
co-financed by the MRCS (25%) and the
Member Countries (75%). At national level,
each Member Country has designated a
water quality laboratory to undertake the
monitoring, sampling, and analysis of the
Mekong water quality. The contact details
of the designated laboratories can be found
in Appendix A. The designated laboratories
are responsible for undertaking a routine
monitoring and measurement of water
quality parameters. They are also respon-
sible for analysing, assessing and reporting
water quality data on an annual basis. Their
specific duties include:
• Conduct a routine (monthly or bi-month-
ly) water quality monitoring of the Me-
kong River and its tributaries as defined
in their Terms of Reference;
• Manage water quality data in accordance
with the agreed format and submit the
data for the MRCS for validation and stor-
age in the MRC data portal; and
• Produce annual water quality data
assessment report, outlining the results
of water quality monitoring, analysis and
assessment.
1.3 OBjECTIVES OF THE REPORT
This report is a compilation of the des-
ignated WQMN laboratories’ 2011 water
quality data and Annual Water Quality Data
Assessment Reports. It has been prepared
to provide the consolidated results of the
water quality monitoring activities, focus-
ing on the implementation of the Proce-
dures for Water Quality and compliance
with their associated technical guidelines.
However, in addition to the compliance
with the technical guidelines the report also
addresses indicators for impacts from hu-
man activities. As such, the main objectives
of this report are to:
• Provide the status of the 2011 water qual-
ity of the Mekong River, assessing and
summarising water quality monitoring
data monitored by the WQMN laborato-
ries in 2011;
• Identify any changes observed in the Me-
kong River water quality compared to the
results of the water quality monitoring of
past years;
• With the MRC Water Quality Indices, as-
sess human impacts on the Mekong River
water quality and assess the adequacy of
the water quality for aquatic life protec-
tion and agricultural uses; and

4 2011 Annual Water Quality Data Assessment Report
• Provide recommendations for future
monitoring and continuous improvement
of the water quality monitoring activities.
In addition to this report, periodical report
cards are issued with condensed overview
information on the environmental condi-
tions of the Mekong River. Report cards cov-
er the compliance with the technical guide-
lines of the Procedures for Water Quality
(human health and ecological health) as
well as impacts from human activities.

2. WATER QUALITy MOnITORIng METhODOLOgy
52011 Annual Water Quality Data Assessment Report

6 2011 Annual Water Quality Data Assessment Report
Table 2-1. A summary of 2011 water quality monitoring stations
Countries no. of Stations no. on the Mekong River no. on the Bassac River no. on tributaries Monitoring Frequency
Lao PDR 11 5 0 6 Bi-monthly
Thailand 8 3 0 5 Bi-monthly
Cambodia 19 6 3 10 Bi-monthly
Viet Nam 10 3 2 5 Monthly
Total 48 19 5 26 Bi-monthly or Monthly
2.1 FIELD SAMPLINg PLAN
2.1.1 Sampling Locations and FrequencyForty-eight stations were monitored by the
WQMN in 2011. A breakdown of the num-
ber of stations in each Member Country is
presented in Table 2-1. As can be seen in the
table, of the 48 stations monitored in 2011,
11 stations are located in the Lao PDR, 8
are located in Thailand, 19 are located in
Cambodia and 10 are located Viet Nam.
Figure 2-1 illustrates their locations in the
Lower Mekong Basin (17 on the Mekong
River, 5 on the Bassac River and 26 on the
Mekong tributaries). The detailed list of
each station, code name and coordinates
can be found in Table 2-2.
In 2011, the monitoring frequencies varied
between Member Countries. In the Lao
PDR, Thailand and Cambodia, the moni-
toring of water quality was carried out on
a bi-monthly basis while the monitoring
in Viet Nam was carried out in a monthly
basis. The variation in frequency of the
water quality monitoring was first intro-
duced in 2009 and has been implemented
by the Member Countries ever since. Prior
to 2009, the monitoring of water quality of
the Mekong River and its tributaries was
carried out uniformly on a monthly basis.
However, prior to the start of the 2009
monitoring year, a review was conducted
to assess the trend of the Mekong River
water quality, and subsequently, the meth-
odology employed by the MRC WQMN to
conduct water quality of the Mekong River.
During the review, temporal variations of
all water quality parameters were assessed
and the results indicated that water qual-
ity of the Mekong River and its tributaries
stayed relatively unchanged from 1985 to
2008. Consequently, a joint decision was
made by the Mekong River Commission
Secretariat and the Member Countries to
reduce the monitoring frequency in the
Lao PDR, Thailand and Cambodia where
the Mekong River and its tributaries are
characterised as free flowing and well
2. WATER QUALITy MOnITORIng METhODOLOgy

MATERIALS AND METHODS
72011 Annual Water Quality Data Assessment Report
mixed. The reduction of the monitoring
frequency also helped reduce cost for
operating the MRC WQMN in each Member
Countries.
For consistency, the Member Countries also
agreed to carry out the sampling and mon-
itoring of water quality between the 13th
and 18th of the monitoring month.
Table 2-2 lists the 22 mainstream stations
monitored in 2011. The table lists the
Table 2-2. Water quality monitoring stations in the Mekong and Bassac Rivers numbered in sequential from upstream to downstream and as monitored in 2011
Station No. Name of station Station ID River Country Latitude Longitude
1 Houa Khong H010500 Mekong River Lao PDR 21.5471 101.1598
2 Chaing Sean H010501 Mekong River Thailand 20.2731 100.0917
3 Luang Prabang H011200 Mekong River Lao PDR 19.9000 102.0000
4 Vientiane H011901 Mekong River Lao PDR 17.9281 102.6200
5 Nakhon Phanom H013101 Mekong River Thailand 17.3983 104.8033
6 Savannakhet H013401 Mekong River Lao PDR 16.5583 104.7522
7 Khong Chaim H013801 Mekong River Thailand 15.3183 105.5000
8 Pakse H013900 Mekong River Lao PDR 15.1206 105.7837
9 Stung Trieng H014501 Mekong River Cambodia 13.5450 106.0164
10 Kratie H014901 Mekong River Cambodia 12.4777 106.0150
11 Kampong Cham H019802 Mekong River Cambodia 11.9942 105.4667
12 Chrouy Changvar H019801 Mekong River Cambodia 11.5861 104.9407
13 Neak Loung H019806 Mekong River Cambodia 11.2580 105.2793
14 Krom Samnor H019807 Mekong River Cambodia 11.0679 105.2086
15 Tan Chau H019803 Mekong River Viet Nam 10.9036 105.5206
16 My Thuan H019804 Mekong River Viet Nam 10.8044 105.2425
17 My Tho H019805 Mekong River Viet Nam 10.6039 104.9436
18 Takhmao H033401 Bassac River Cambodia 11.4785 104.9530
19 Khos Khel H033402 Bassac River Cambodia 11.2676 105.0292
20 Koh Thom H033403 Bassac River Cambodia 11.1054 105.0678
21 Chau Doc H039801 Bassac River Viet Nam 10.8253 105.3367
22 Can Tho H039803 Bassac River Viet Nam 10.7064 105.1272
mainstream stations in geographical order,
from upstream to downstream, to assist in
the analysis of water quality trend along the
Mekong River mainstream.
2.1.2 Sampling TechniquesIn an effort to standardise the sampling
techniques, the Environment Programme
has continued to work with the designated
laboratories of the Member Countries to
identify appropriate sampling techniques
for collecting water samples. Through

8 2011 Annual Water Quality Data Assessment Report
Figure 2.1. An illustration of water quality monitoring stations of the MRC WQMN in the Lower Mekong Basin

MATERIALS AND METHODS
92011 Annual Water Quality Data Assessment Report
consultations, it was agreed that the water
sampling, sample preservation, sample
transportation and storage would be
carried out in accordance with methods
outlined in the 20th edition of the Stand-
ard Methods for the Examination of Water
and Wastewater (Clesceri et al., 1998) or in
accordance with national standards com-
plying with the requirements of method
validation of ISO/IEC 17025-2005.
Specifically, the designated laboratories are
required to:
• Collect water samples using simple
surface grab technique at the middle of
the stream where free flowing water is
observable;
• Collect water sample at about 30 to 50
cm under the surface of the stream;
• If in-situ measurement is not possible,
immediately preserve samples collected
with proper preservative agents (i.e. sul-
phuric acid for nutrients measurement)
and store in a cooler to prevent further
breakdown of chemicals and biological
contents.
• Analyse all water samples within the
recommended holding time.
All designated laboratories of the MRC
WQMN are required to adhere to the MRC
QA/QC procedures which was developed in
accordance with ISO/IEC 17025-2005 and
personnel safety procedures when collect-
ing water samples and measuring water
quality parameters.
2.2 LABORATORIES ANALYSIS
2.2.1 Water Quality Parameters and Analytical MethodsSince its inception in 1985, the Water Qual-
ity Monitoring Network has provided data
on water quality in the Mekong River and its
selected tributaries by measuring a number
of different water quality parameters. At its
peak, the network (Table 2-2) provided a
measurement of 23 water quality parame-
ters. However, in 2011, 18 water quality pa-
rameters were measured by the MRC WQMN
(Table 2-3). Of the 18 parameters measured
in 2011, 12 are routine water quality pa-
rameters that are required to be measured
for each sample month. The other 6, major
anions and major cations, are required to
be analysed for each sample taken between
April and October (the wet season).
Table 2-3, in addition to providing a list of
parameters measured by the MRC WQMN,
also provides a list of recommended ana-
lytical methods used for measuring water
quality parameters. These methods are
consistent with methods outlined in the
20th edition of the Standard Methods for
the Examination of Water and Wastewater
(Clesceri et al., 1998) or nationally accepted
methods, as previously agreed between the
laboratories and the Mekong River Commis-
sion Secretariat.

10 2011 Annual Water Quality Data Assessment Report
2.3 DATA ASSESSMENT AND REPORTINg
2.3.1 Water Quality Objectives and guidelinesRecognising the rapid development within
the Lower Mekong Basin and also the
importance of Mekong riverine environ-
ment on economic and social well-being,
the governments of the Lao PDR, Thai-
land, Cambodia and Viet Nam signed an
Agreement on the Cooperation for the
Sustainable Development of the Mekong
River Basin in 1995 (also known as the 1995
Mekong Agreement). The Procedures for
Water Quality, approved in 2011, define
water quality objectives of the 1995 Mekong
Agreement – “to maintain acceptable/good
water quality.”
To assist the Member Countries fulfil their
obligations and implement the Procedures
for Water Quality, Technical guidelines for
Implementation of Procedures for Water
Quality were developed, comprising water
quality guidelines for the protection of
human health and aquatic life (Appendix
A and Appendix B). These guidelines were
developed specifically for the Mekong
region and based on the national guide-
lines of the Member Countries. While they
have not been officially approved by the
MRC joint Committee, the guidelines have
been finalised by the Technical Body on
Water Quality, a regional working group
established to develop the guidelines, and
have been used by the Member Countries to
assess the Mekong River water quality.
2.3.2 Data assessmentThe maximum, average and minimum
values of each water quality parameter
were analysed for each monitoring station
for 2011. These values were compared to
the MRC Water Quality guidelines for the
Table 2-3. Water quality parameters and their corresponding analytical methods
Analytical parameter Recommended Analytical Methods
Temperature 2550-Temp/SM
pH 4500-H+/SM
Conductivity (Salinity) 2510-Ec/SM
Alkalinity/ Acidity 2320-A/SM
Dissolved Oxygen (DO) 4500-O/SM
Chemical Oxygen Demand (COD) Permanganate Oxidation
Total phosphorous (T-P) 4500-P/SM
Total Nitrogen (T-N) 4500-N/SM
Ammonium (NH4-N) 4500-NH4/SM
Total Nitrite and Nitrate (NO2-3-N) 4500-NO2-3/SM
Faecal Coliform 9221-Faecal Coliform group/SM
Total Suspended Solid 2540-D-TSS-SM
Calcium (Ca)* 3500-Ca-B/SM
Magnesium (Mg)* 3500-Mg-B/SM
Sodium (Na)* 3500-Na-B/SM
Potassium (K)* 3500-K-B/SM
Sulphate (SO4)* 4500- SO4 –E/SM
Chloride (Cl)* 4500-Cl/SM
* Only measured during the wet season in Lao PDR, Thailand and Cambodia on a bi-monthly basis and Viet Nam on a monthly basis.

MATERIALS AND METHODS
112011 Annual Water Quality Data Assessment Report
Protection of Human Health and for the
Protection of Aquatic Life to identify any
exceedances that need special attention.
Additionally, variations of key water quality
parameters were assessed spatially and
temporally. Variations along the main-
stream were assessed for data obtained
in 2011. Trend analysis of water quality
from 1985 to 2011 was also carried out for
selected water quality parameters. Box-
and-whisker plots were used to character-
ise water quality data spatial and temporal
analysis. Box-and-whisker plot is a useful
statistical tool which can be used to explore
a dataset and show key statistics associ-
ated with that dataset. In particular, when
using box-and-whisker plot the following
key statistical information can be drawn
(Nord, 1995):
• Median value of the dataset;
• upper quartile and lower quartile or the
median of all data above and below the
median, respectively; and
• upper and lower extremes or the maxi-
mum and minimum values of the dataset
(excluding outliers), respectively.
Another way to assess the water quality of
the Mekong River is through the use of the
MRC Water Quality Indices which combine
Equation 2.1
WQI = ×10M
∑ ріі=1
Where,
“Pi” is the points score of sample day i. If each of the parameters listed in Table 2-4 meeting its respective target value in Table 2-6, it respec-tive weighting are scored; otherwise the score is zero.
“n” is the number of samples from the station in the year.
“M” is the maximum possible score for the measured parameters in the year.
Table 2-4. Weight for each parameter used for calculating indices for human impact on water quality and for the protection of aquatic life
Parameters Target Values1 Weighting Factors2
Human Impact on Water Quality
DO (mg/L) ≥ 6 1
NH4 – N (mg/L) < 0.05 1
COD (mg/L) < 5 1
T-P (mg/L) <0.08 1
Protection of Aquatic Life
pH 6 – 9 2
EC (mS/m) < 70 2
NH3 (mg/L) < 0.2 2
DO (mg/L) > 5 2
NO2-3 – N (mg/L) < 0.7 1
T-P (mg/L) < 0.13 1
1 Water Quality Guidelines found in Chapters 1 and 2 of the Technical Guidelines for the Implementation of the Proce-dures for Water Quality (TGWQ) are used for this 2011 Annual Water Quality Data Assessment Report, where available. It should be noted, however, that while Chapters 1 and 2 of the TGWQ are finalised by the Technical Body for Water quality, it has not been officially endorsed by the MRC Joint Committee. The missing target values were supplemented with previous established values for the MRC Water Quality Indices. The use of water quality guidelines of the Technical Guidelines for the Implementation of the Procedures for Water Quality may caused the results of the assessment found in this report to be differ from assessment found in other MRC’s reports and publications. 2 Point score (p) for meeting water quality target values.
12 2011 Annual Water Quality Data Assessment Report
the results for several parameters into one
overall value describing the water quali-
ty. The indices were developed based on
reviews of scientific literature and statistical
characteristics of available water quality
data obtained through the MRC WQMN.
They can be used to express overall water
quality of the Mekong River and its tributar-
ies at specific location and time based on
several water quality parameters. They can
also be used to turn complex water quality
data into information that can be under-
stood by the public.
To assist the Member Countries interpret
the results of the MRC WQMN data, three
water quality indices were developed and
adopted in july 2006 (Wilanders, 2007).
These include:
• Water quality index for the protection of
aquatic life (WQIal)
• Water quality index for human impact on
water quality (WQIhi)
• Water quality index for agricultural use
(WQIag) which is divided into 3 catego-
ries: (i) general irrigation, (ii) irrigation of
paddy rice, (iii) livestock and poultry.
While one formula (Equation 2.1) is used to
determine the value for each water quality
indicator, the type and number of water
quality parameters used are varied depend-
ing on the objective of the assessment (i.e.
assessing the suitability of water quality
for the protection of aquatic life, etc.). The
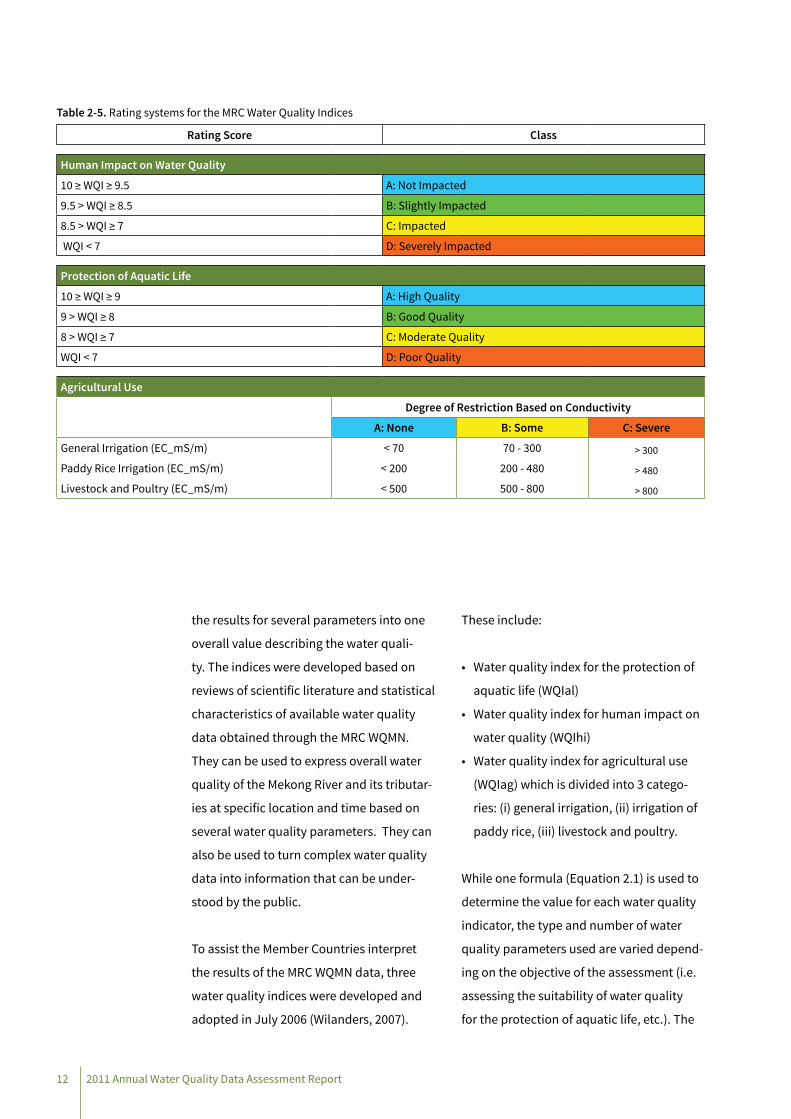
Table 2-5. Rating systems for the MRC Water Quality Indices
Rating Score Class
human Impact on Water Quality
10 ≥ WQI ≥ 9.5 A: Not Impacted
9.5 > WQI ≥ 8.5 B: Slightly Impacted
8.5 > WQI ≥ 7 C: Impacted
WQI < 7 D: Severely Impacted
Protection of Aquatic Life
10 ≥ WQI ≥ 9 A: High Quality
9 > WQI ≥ 8 B: good Quality
8 > WQI ≥ 7 C: Moderate Quality
WQI < 7 D: Poor Quality
Agricultural Use
Degree of Restriction Based on Conductivity
A: none B: Some C: Severe
general Irrigation (EC_mS/m) < 70 70 - 300 > 300
Paddy Rice Irrigation (EC_mS/m) < 200 200 - 480 > 480
Livestock and Poultry (EC_mS/m) < 500 500 - 800 > 800

MATERIALS AND METHODS
132011 Annual Water Quality Data Assessment Report
numbers and types of water quality param-
eters used for each index are outlined in
Table 2-5, together with their target values
and weighting for meeting the target val-
ues. The table also provides a classification
of the water quality based on the calcula-
tion of the rating score.
2.4 QuALITY ASSuRANCE AND QuALITY CONTROL
Recognising the needs to improve the
quality, precision and accuracy of the water
quality data, all designated laboratories of
the MRC WQMN were requested to partic-
ipate in the implementation of a quality
assurance and quality control (QA/QC) test
for water sampling, preservation, transpor-
tation and analysis in 2004. The goal of the
implementation of the QA/QC procedures
is to ensure that the designated laborato-
ries carry out their routine water quality
monitoring activities in accordance with
international standard ISO/IEC 17025-2005.
To date, of the four designated laboratories
of the MRC WQMN, the designated labo-
ratory in Viet Nam has received ISO/IEC
17025-2005 certification. The certification
was gained in 2007 and given by the Bureau
of Accreditation, Directorate for Standards
and Quality of Viet Nam.
Other designated laboratories, while not
being ISO/IEC 17025-2005 certified, have
rigorously implemented the MRC WQMN
QA/QC in Sampling and Laboratory Work or
national QA/QC procedures that meet the
requirements of the ISO/IEC 17025-2005.
The MRC QA/QC procedure calls for the
designated laboratories to:
• Be well prepared for each sampling
event, having a sampling plan with clear
sampling objectives and ensuring sam-
pling teams are equipped with appropri-
ate sampling and safety equipments and
preservative chemical reagents;
• Apply quality control during sampling
which consist of taking duplicate samples
and field blanks for certain parameters;
• Analyse all water samples within recom-
mended holding times;
• Conduct routine maintenance and cali-
bration of all measurement equipments;
• Conduct data analysis using control chart
and reliability score testing using ion
balance test;
• Archive raw data and any important piec-
es of information relating to the results
the analysis in order to make it possible
to trace all data and reconfirm the results
of the analysis.

3. RESULTS AnD DISCUSSIOnS
152011 Annual Water Quality Data Assessment Report

16 2011 Annual Water Quality Data Assessment Report
Tables 3-1 and 3-2 provide comparison of
the maximum, mean and minimum values
of key water quality parameters of the 22
stations located in the Mekong and Bas-
sac Rivers between 2011 and 1985-2010.
These data are also assessed against the
proposed MRC water quality criteria for the
protection of human health and for the pro-
tection of aquatic life. As can be seen in the
table, exceedances are only observed when
comparing the 2011 water quality data with
the MRC water quality criteria for human
health. No single water quality value was
observed to exceed the MRC water quality
criteria for the protection of aquatic life.
Of the key water quality parameters
measured in 2011 (Tables 3-1 and 3-2), only
three parameters had some or all measured
values not complying with the MRC water
quality criteria for the protection of human
health. These included:
• Electrical Conductivity (EC) with all
values less than the suggested lower limit
of the water quality for the protection of
human health of 70 mS/m. It should be
noted, however, that the Mekong River
mainstream is generally a low-salinity riv-
er with the average electrical conductivity
rarely exceeding 20 mS/m. High electrical
conductivity can be observed in the Delta
during high tide due to the intrusion of
sea water. In 2011, all samplings in the
Delta, for both the Mekong River and the
Bassac River, were carried out during low
tide which explains the low levels of elec-
trical conductivity recorded in 2011.
• Dissolved oxygen (DO) concentrations at
some stations were observed to be lower
than the suggested MRC water quality cri-
teria for the protection of human health.
The value of 5.5 mg/L was recorded as
the minimum value for both the Mekong
River and the Bassac River. This value is
slightly below the water quality crite-
ria for the protection of human health.
This value, however, is higher than the
suggested criteria for the protection of
aquatic life.
• Chemical oxygen demand (COD) concen-
tration for some stations in the Mekong
River and the Bassac River slightly
exceeded the water quality criteria for
the protection of human health (5 mg/L).
The maximum value observed along the
Mekong River in 2011 was 6.1 mg/L while
the maximum value observed along the
Bassac River was 6.4 mg/L. However, the
average COD values were estimated to be
about 2.2 mg/L and 3.3 mg/L, respectively
for the Mekong River and the Bassac River.
Compared to historical data (1985-2010),
the average pH, TSS, EC, and DO values de-
creased slightly in 2011. On the other hand,
the average nutrient values (NH4, NO3-2,
TOT-P) increased slightly in 2011 compared
to the 1985-2010 data. Water quality trend
for each water quality parameter will be
discussed in more detailed in the following
sections.
3. RESULTS AnD DISCUSSIOnS

RESuLTS & DISCuSSIONS
172011 Annual Water Quality Data Assessment Report
Table 3-1. A comparison of water quality data of the Mekong River between 1985-2010 and 2011
Parameters Unit
Water Quality guidelines 1985-2010 Water Quality Data3 2011 Water Quality Data
Protection of human health
(WQCh)
Protection of Aquatic Life
(WQCA) Max Mean Min St Dev Max Mean Min St Dev
Temperature Natural Natural 38.0 26.8 13.0 3.1 31.5 27.2 18.0 2.5
pH - 6 – 9 6 – 9 9.7 7.6 3.8 0.5 8.2 7.2 6.5 0.4
TSS mg/L - - 5716 173 0.1 296.8 323 82 4 74.2
EC mS/m 70 – 150 - 841 21 1 31.4 35 18 9 6.0
NO3-2 mg/L 5 5 1.42 0.24 0.01 0.16 1.19 0.26 0.01 0.19
NH4N mg/L - - 2.99 0.05 0.01 0.12 1.11 0.06 0.00 0.11
TOT-N mg/L - - 4.89 0.61 0.01 0.40 2.38 0.49 0.04 0.33
TOT-P mg/L - - 2.11 0.09 0.01 0.11 0.43 0.12 0.01 0.11
DO mg/L ≥ 6 > 5 13.9 7.3 1.0 1.1 9.0 7.1 5.5 0.7
CODMN mg/L 5 - 16.4 2.2 0.0 1.7 6.1 2.2 0.4 1.3
Table 3-2. A comparison of water quality data of the Bassac River between 1985-2010 and 2011
Parameters unit
Water Quality guidelines 1985-2010 Water Quality Data3 2011 Water Quality Data
Protection of Human Health
(WQCH)
Protection of Aquatic Life
(WQCA) Max Mean Min St Dev Max Mean Min St Dev
Temperature Natural Natural 34.0 29.1 23.8 1.8 33.5 28.2 24.5 1.9
pH - 6 – 9 6 – 9 9.4 7.2 6.1 0.4 7.5 7.0 6.5 0.2
TSS mg/L - - 636 71 0 82 276 84 10 63
EC mS/m 70 – 150 - 64 13 1 5 22 13 8 4
NO3-2 mg/L 5 5 1.99 0.24 0.00 0.19 1.20 0.33 0.03 0.27
NH4N mg/L - - 3.04 0.05 0.00 0.12 0.62 0.08 0.00 0.11
TOT-N mg/L - - 4.03 0.74 0.03 0.43 1.56 0.67 0.17 0.35
TOT-P mg/L - - 1.78 0.12 0.00 0.12 0.45 0.16 0.04 0.10
DO mg/L ≥ 6 > 5 12.3 6.4 1.9 1.1 9.9 6.5 5.5 0.9
CODMN mg/L 5 - 13.1 3.2 0.0 1.8 6.4 3.3 1.1 1.4
3 Water quality data from 1985-2010 included those collected during high tide.

18 2011 Annual Water Quality Data Assessment Report
3.1 ANALYSIS OF WATER QuALITY TRENDS
3.1.1 pHpH is one of the key water quality param-
eters monitored by the MRC Water Quality
Monitoring Network. This is because pH
can affect the dynamic of the water body,
influencing the physiology of aquatic
organisms. For example, at low pH, some
toxic compounds and elements from
sediments may be released into the water
where they can be taken up by aquatic an-
imals or plants and ultimately by humans
through direct contact and/or human
consumption of aquatic animals or plants.
Additionally, changes in pH can also in-
fluence the availability of trace elements,
iron and nutrients such as phosphate and
ammonia in water.
Recognising the importance of pH on the
Mekong Riverine environment, the Member
Countries have agreed to establish water
quality criteria for pH levels in the Mekong
River and its tributaries to protect human
health and aquatic life, with an overall goal
of achieving the MRC water quality objec-
tive – to maintain acceptable/good water
quality to promote the sustainable develop-
ment of the Mekong River Basin.
Compared to the water quality criteria
(Table 3-1), the results of the 2011 moni-
toring revealed that the pH values along
Mekong River were within the water qual-
ity criteria for pH (pH values of 6 to 9 for
both the protection of human health and
the protection of aquatic life). In 2011, the
highest pH level was observed at Vientiane
monitoring station (pH of 8.2) while the
lowest pH level was observed at Stung
Trieng monitoring station (pH of 6.5). Both,
however, are well within the water quality
criteria for pH.
The spatial trend for pH in the Mekong River
and in the Bassac River is shown in Figure
3-1. As can be seen in the figure, pH values
tend to be higher in upstream stations
Figure 3.1. Variation in pH levels along the Mekong River (1-17) and Bassac River (18-22) as observed in 2011

RESuLTS & DISCuSSIONS
192011 Annual Water Quality Data Assessment Report
with all mainstream stations monitored in
Lao PDR (Stations 1, 3, 4, 6 and 8) having
pH levels higher than the neutral level (pH
of 7). On the other hand, the lowest pH
levels were observed at the stations in the
Mekong Delta.
3.1.2 Electrical Conductivity (EC)Electrical conductivity is another useful
water quality indicator monitored by the
MRC WQMN. It provides a valuable baseline
that has been used to identify any emerging
effects of development on water quality of
the Mekong River.
Based on the results of the monitoring, the
Mekong River can be characterised as a riv-
er with relatively low conductivity with val-
ues ranged from 8 mS/m to 35 mS/m (Table
3-1). Compared to the MRC water quality
criteria for the protection of human health,
the electrical conductivity values observed
in 2011 fell outside the recommended range
of 70 to 150 mS/m. This, however, should
not be seen as non-compliance since his-
torically the electrical conductivity values
of the Mekong River are generally low with
the average EC value of 19 mS/m from 1985
to 2010.
Figure 3.2. Annual variation of pH levels in the Mekong River from 1985 to 2011
Figure 3.3. Variation in Electrical Conductivity levels along the Mekong River (1-17) and Bassac River (18-22) as observed in 2011

20 2011 Annual Water Quality Data Assessment Report
The spatial trend of electrical conductivity
along the Mekong River, as shown in Figure
3-3, reveals that electrical conductivity
values were highest in upstream stations
and lowest in downstream stations. It
should be noted however that water quality
samplings in the Mekong Delta were taken
during the low tide to minimise sea water
intrusion. During high tide, the stations
in the Mekong Delta would have elevated
electrical conductivity values due to sea
water intrusion.
3.1.3 Total Suspended SolidsIn the Mekong River, Total Suspended
Solids (TSS) are influenced by both natural
and anthropogenic activities in the Basin,
including urban runoff, industrial effluents,
and natural and/or human induced (i.e. ag-
riculture, forestry or construction) soil ero-
sion (MRC, 2008). The method used by the
MRC WQMN to sample TSS does not reflect
the sediment concentration in the whole
water column4, but currently provides an
indication of long term trend in sediment
content in the Mekong River.
Figure 3.4. Variation in TSS concentrations along the Mekong River (1-17) and Bassac River (18-22) as observed in 2011
Figure 3.5. Temporal variation in TSS in the Mekong River from 1985 to 2011
4 Analytical methods used by the designated laboratories may vary. However, all methods must meet international standard ISO/IEC 17025-2005.
RESuLTS & DISCuSSIONS
212011 Annual Water Quality Data Assessment Report
In 2011, the TSS concentrations observed
along the Mekong and Bassac Rivers were
highly variable, ranging from 4 mg/L to 323
mg/L. The average TSS concentration was
observed to be about 82 mg/L (Table 3-1).
The lowest TSS concentration was observed
during the dry season at Luang Prabang
Station in the Lao PDR while the highest
TSS concentration was observed during the
wet season at Tan Chau Station in Viet Nam.
Figure 3-4 shows the variation in TSS along
the Mekong and Bassac Rivers in 2011. The
spatial analysis of the 2011 data reveals
that TSS concentrations increased slightly
as the Mekong River flows from upstream
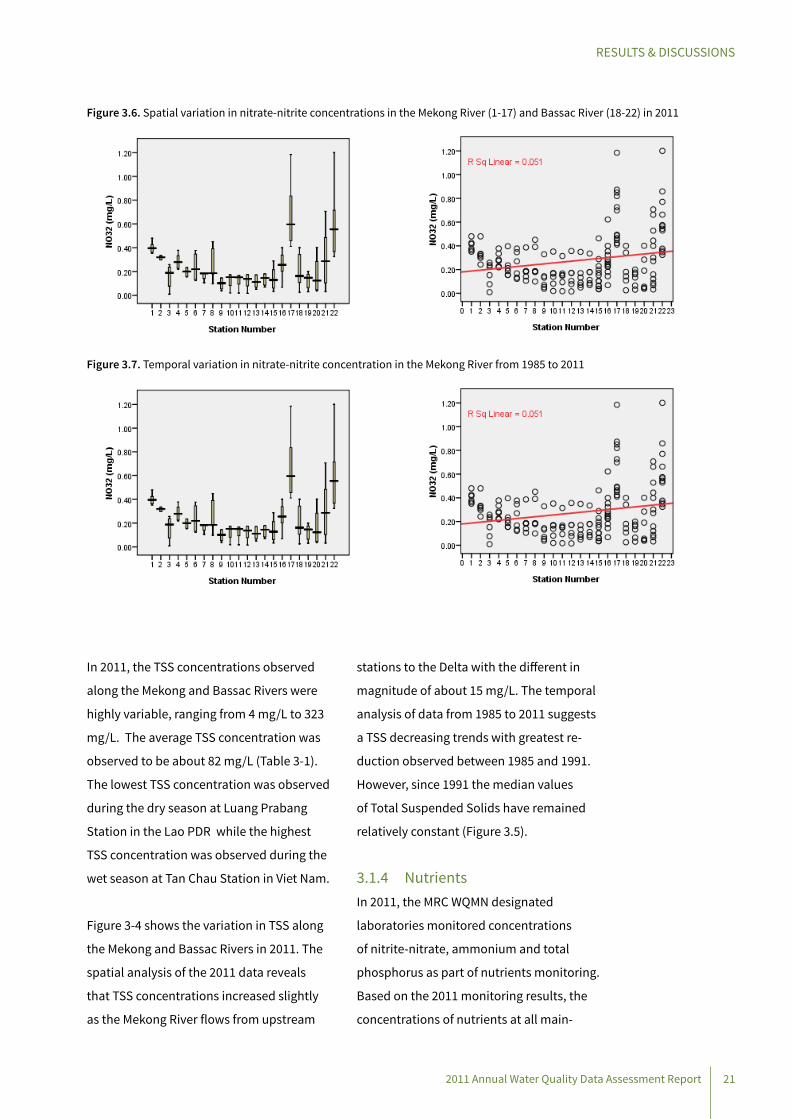
Figure 3.6. Spatial variation in nitrate-nitrite concentrations in the Mekong River (1-17) and Bassac River (18-22) in 2011
Figure 3.7. Temporal variation in nitrate-nitrite concentration in the Mekong River from 1985 to 2011
stations to the Delta with the different in
magnitude of about 15 mg/L. The temporal
analysis of data from 1985 to 2011 suggests
a TSS decreasing trends with greatest re-
duction observed between 1985 and 1991.
However, since 1991 the median values
of Total Suspended Solids have remained
relatively constant (Figure 3.5).
3.1.4 NutrientsIn 2011, the MRC WQMN designated
laboratories monitored concentrations
of nitrite-nitrate, ammonium and total
phosphorus as part of nutrients monitoring.
Based on the 2011 monitoring results, the
concentrations of nutrients at all main-
22 2011 Annual Water Quality Data Assessment Report
stream stations in the Mekong River and
Bassac River remained well below the MRC
water quality criteria for the protection of
human health and for the protection of
aquatic life (Table 3-1).
The spatial variations of nitrate-nitrite
concentrations are shown in Figure 3-6
which show slightly elevated nitrate-nitrite
concentrations at My Tho (17) and Can Tho
(22) monitoring stations. Both are located
in the Mekong Delta. However, the meas-
ured values are well below the MRC water
quality criteria for the protection of human
health and aquatic life (5 mg/L). In 2011,
nitrate-nitrite concentrations exhibited
a u-shape trend as the river flows from
upstream to downstream with the high-
est concentrations observed in the Delta,
indicating potential increase nitrate-nitrite
contaminated effluents, possibly due to
intensive agricultural activities and urbani-
sation (MRC, 2010).
Temporal analysis of nitrate-nitrite concentra-
tion from 1985 to 2011 reveals that nitrate-ni-
trite concentrations in the Mekong River did
not change significantly (Figure 3-7).
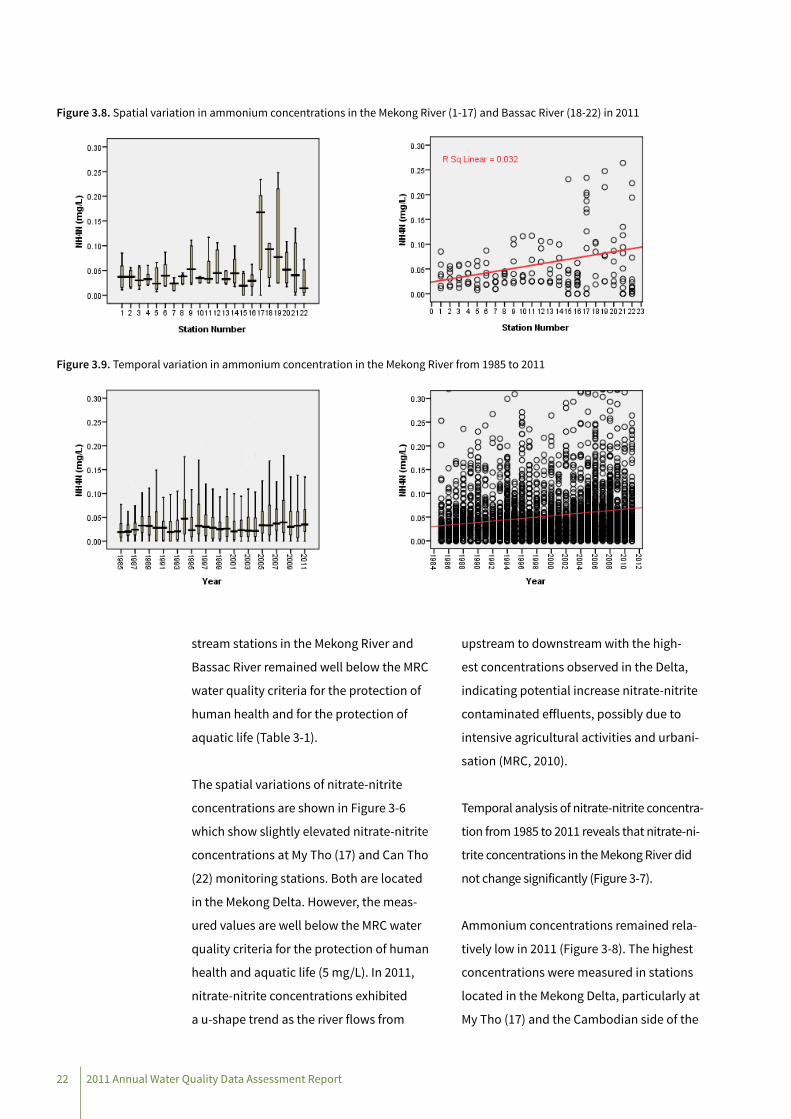
Ammonium concentrations remained rela-
tively low in 2011 (Figure 3-8). The highest
concentrations were measured in stations
located in the Mekong Delta, particularly at
My Tho (17) and the Cambodian side of the
Figure 3.8. Spatial variation in ammonium concentrations in the Mekong River (1-17) and Bassac River (18-22) in 2011
Figure 3.9. Temporal variation in ammonium concentration in the Mekong River from 1985 to 2011

RESuLTS & DISCuSSIONS
232011 Annual Water Quality Data Assessment Report
Bassac River (Khos Khel - 19). Ammonium
concentrations at these stations also varied
greatly month to month. For example, at
Khos Khel , the minimum concentration for
ammonium was measured to be 0.025 mg/L
while the maximum concentration was
reported to be 0.248 mg/L.
Temporal analysis of data from 1985 to
2011 for the Mekong River reveals that
ammonium concentration increased
slightly (Figure 3-9), a potential reflection of
increased human activities in the Mekong
Basin and increased in untreated agricultur-
al waste and human effluent.
Total phosphorus trends follow those of
nitrate-nitrite and ammonium, increasing
as the Mekong River flows downstream
(Figure 3-10). In 2011, the lowest concen-
trations of total phosphorus were gener-
ally found in upstream stations where the
concentrations were less than 0.2 mg/L.
Total phosphorus concentrations of some
downstream stations were slightly elevat-
ed, including Kampong Cham, Tan Chau,
My Thauan and My Tho in the Mekong River
and Can Tho in the Bassac River, where it
reached as high as 0.448 mg/L. A result of
increase human activities (agricultural run-
off and municipal wastewater discharge)
Figure 3.10. Spatial variation in total phosphorus concentrations in the Mekong River (1-17) and Bassac River (18-22) in 2011
Figure 3.11. Temporal variation in total phosphorus concentration in the Mekong River from 1985 to 2011
24 2011 Annual Water Quality Data Assessment Report
as the Mekong River traverses downstream
was likely the reason for the downstream
increasing trend.
Between 1985 and 2011, total phosphorus
concentrations in the Mekong River in-
creased slightly (Figure 3-11). The tempo-
ral trend is similar to the trend observed
for ammonium and likely a reflection of
increase nutrient contaminated agricultural
runoff and urban effluents.
3.1.5 Dissolved Oxygen and Chemical Oxygen DemandDissolved oxygen (DO) is one of the key
water quality parameters monitoring rou-
tinely by the MRC Water Quality Monitoring
Network. To maintain acceptable/good
water quality, having adequate concentra-
tion of dissolved oxygen is necessary. This is
because oxygen is required for all life forms
including those that live in a river ecosys-
tem. Recognising that dissolved oxygen
is an integral component for determining
water quality of the Mekong River, the MRC
member countries have jointly established
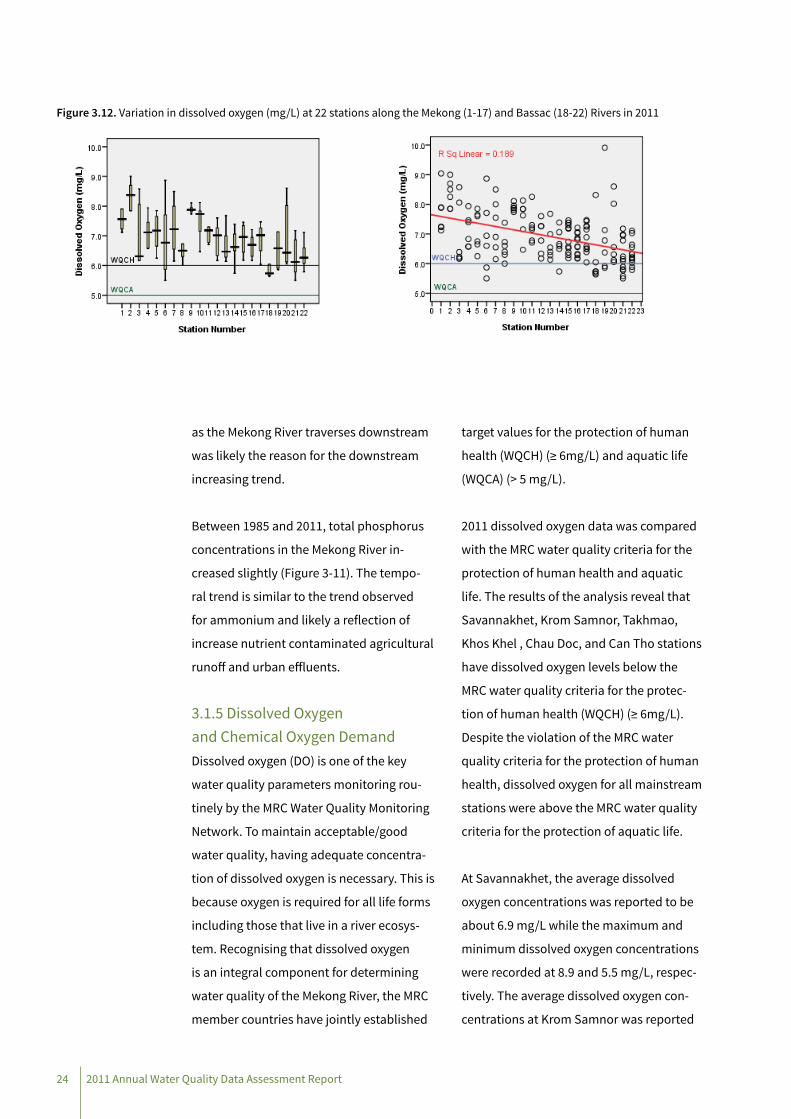
target values for the protection of human
health (WQCH) (≥ 6mg/L) and aquatic life
(WQCA) (> 5 mg/L).
2011 dissolved oxygen data was compared
with the MRC water quality criteria for the
protection of human health and aquatic
life. The results of the analysis reveal that
Savannakhet, Krom Samnor, Takhmao,
Khos Khel , Chau Doc, and Can Tho stations
have dissolved oxygen levels below the
MRC water quality criteria for the protec-
tion of human health (WQCH) (≥ 6mg/L).
Despite the violation of the MRC water
quality criteria for the protection of human
health, dissolved oxygen for all mainstream
stations were above the MRC water quality
criteria for the protection of aquatic life.
At Savannakhet, the average dissolved
oxygen concentrations was reported to be
about 6.9 mg/L while the maximum and
minimum dissolved oxygen concentrations
were recorded at 8.9 and 5.5 mg/L, respec-
tively. The average dissolved oxygen con-
centrations at Krom Samnor was reported
Figure 3.12. Variation in dissolved oxygen (mg/L) at 22 stations along the Mekong (1-17) and Bassac (18-22) Rivers in 2011

RESuLTS & DISCuSSIONS
252011 Annual Water Quality Data Assessment Report
to be about 6.7 mg/L while the maximum
and minimum dissolved oxygen concentra-
tions measured at the station in 2011 were
recorded at 7.4 mg/L and 5.7 mg/L, respec-
tively.
At Takhmao, about 83% of dissolved oxygen
values measured were reported to be lower
than the MRC water quality criteria for
human health with the maximum, average
and minimum values of 8.3 mg/L, 6.2 mg/L,
and 5.6 mg/L, respectively. The minimum
measured dissolved oxygen concentration
at Khos Khel was 5.9 mg/L which was
slightly below the MRC water quality criteria
for the protection of human health (6 mg/L)
while average and maximum concentra-
tions were reported to be 7.0 mg/L and 9.9
mg/L, respectively.
At Chau Doc and Can Tho, the average
dissolved oxygen concentrations were re-
ported to be about 6.2 and 6.4, respectively,
while the minimum measured values at the
two stations were 5.5 and 5.8 mg/L, respec-
tively. The maximum measured dissolved
Figure 3.13. Temporal variation in dissolved oxygen concentration in the Mekong River from 1985 to 2011
oxygen values at Chau Doc and Can Tho
were 7.2 and 7.1 mg/L, respectively.
The analysis of spatial variation of dissolved
oxygen along the mainstream reveals that
on average dissolved oxygen concentration
decreased as the Mekong River flows down-
stream (Figure 3-12). upstream stations
were generally observed to have higher
dissolved oxygen concentrations which are
likely reflection of fast-flowing water and
relatively low organic contents (as seen in
Figure 3-14). Among the mainstream sta-
tions, Savannakhet Station was observed
to have widest DO range with minimum and
maximum DO concentrations of 5.5 mg/L
and 8.9, respectively.
A temporal analysis of dissolved oxygen in
the Mekong River from 1985 to 2011 reveals
that dissolved oxygen concentrations in
the mainstream did not change signifi-
cantly during the time period. Figure 3.13
also shows that there was no significant
difference in the median value of dissolved
oxygen between 1985 and 2011.

26 2011 Annual Water Quality Data Assessment Report
Dissolved oxygen levels in water are influ-
enced by many factors. Among them are
organic matters accompanying industrial
and municipal waste water effluents. The
direct discharge of these contaminated
effluents into natural water bodies can cause
depletion of dissolved oxygen leading to the
mortality of aquatic organisms. The amount
of oxygen needed to oxidize the organic and
inorganic material is called Chemical Oxygen
Demand (COD). under the MRC Water Quali-
ty Monitoring Network, COD is monitored in
parallel with dissolved oxygen.
Figure 3-14 shows spatial variations in COD
along the Mekong and Bassac Rivers in
2011. The spatial variations observed for
COD were directly opposite of the trends
observed for dissolved oxygen. COD con-
centration increased as the Mekong River
flowed downstream to the Mekong Delta,
whereas dissolved oxygen levels decreased
as the river flowed downstream to the Del-
ta. The variations in COD are also consistent
with the trends observed for total phos-
phorous, nitrate-nitrite and ammonium
(Figures, 3-5, 3-7 and 3-9, respectively).
Compared to the MRC Water Quality Cri-
teria for the Protection of Human Health
(WQCH), the analysis of 2011 COD data
reveals that Nakhon Phanom (5), Tan Chau
Figure 3.14. Variation in COD (mg/L) at 22 stations along the Mekong (1-17) and Bassac (18-22) Rivers in 2011
Figure 3.15. Temporal variation in COD concentrations in the Mekong River from 1985 to 2011

RESuLTS & DISCuSSIONS
272011 Annual Water Quality Data Assessment Report
(15), My Tho (17), Chau Doc (21) and Can
Tho (22) have chemical oxygen demand
levels that exceeded the WQCH of 5 mg/L.
No COD threshold value has been set for
the MRC Water Quality Criteria for the Pro-
tection of Aquatic Life (WQCA).
Figure 3-15 reveals that COD concentra-
tions in the Mekong River have increased
slightly since it was first monitored in
1985. The trend was also consistent with
trends observed for total phosphorous
and ammonium (Figures 3-9 and 3-11,
respectively) and was likely a reflection of
increased organic and inorganic pollutants
in surface runoff.
3.2 WATER QuALITY INDICES
In an attempt to provide a better un-
derstanding of the results of the water
quality monitoring activities and assist in
the management of water quality of the
Mekong River, the MRC Environment Pro-
gramme, in 2006, adopted Water Quality
Indices of Mekong River using a combi-
nation of different water quality criteria
to describe the overall condition of water
quality. Three water quality indices were
adopted as follows:
• Human impact
• Protection of aquatic life
• Agricultural use
The analysis of water quality indices in this
Annual Water Quality Data Assessment Re-
port is based on data measured from 2007
to 2011.
3.2.1 Human Impact Index on Water QualityThe MRC Water Quality Index for “Human
Impacts” was developed with the intention
of quantifying pressure exerted by human
activities on water quality of the Mekong
River (MRC, 2010b). As such, the results
obtained from the Water Quality Index for
“Human Impacts” do not provide an indi-
cation of how polluted the Mekong River
water quality is; rather it provides evidence
of human pressure on water quality (Ong-
ley, n.d.).
The analysis of the 2011 water quality data
using the MRC Water Quality Index for “Hu-
man Impacts” reveals that the degree of hu-
man impact or pressure exerted by human
activities on water quality of the Mekong
and Bassac Rivers stations ranged from
“not impacted” to “severely impacted”. In
2011, 6 stations were classified as “severely
impacted” by human activities, of which 5
are located in the Delta, in both the Mekong
(My Tho) and Bassac Rivers (Takhmao,
Khos Khel , Chau Doc, and Can Tho). The
main culprit was the exceedance in total
phosphorus levels, with 4 of the 5 stations
reported exceedance in total phosphorus
levels in 80% or more of the total sampling
occasions.
The other station classified as “severely
impacted” is located in Nakhon Phanom
where elevated total phosphorus levels
were observed for 4 out of the 6 months
monitored. Additionally, elevated COD
levels were also observed during the wet
season in Nakhon Phanom.

28 2011 Annual Water Quality Data Assessment Report
Other than Savannakhet, Nakhon Phanom
and Chaing Sean monitoring stations, all
stations on the Mekong River upstream of
Pakse are either “slightly” or “not” impact-
ed by human activities.
Compared to water quality data between
2007 and 2010, the degree of human impact
on water quality of the Mekong and the
Bassac Rivers improved slightly in 2011, with
8 stations showing a lesser degree of impact
compared to the previous years. Nakhon
Phanom, Savannakhet and Chrouy Changvar
monitoring stations are the only stations
that reported higher degree of human im-
pact when compared to the previous years
which was mainly caused by elevated total
phosphorus levels. Chrouy Changvar station
also reported exceedance in ammonium
levels in 50% of the total sampling occasion
(6 sampling occasions in 2011).
Overall, the degree of human impact on
water quality of the Mekong River tend to
be more severe in the Delta, with the degree
of human impact ranging from “slightly
impacted” to “severely impacted” which
may be attributable to higher population
densities and intensive agricultural activi-
ties. given the fact that the stations located
in the Delta are downstream stations
receiving flow from upstream, the stations
are likely to be accumulatively affected
by human activities at both the Delta and
upper and middle part of the Lower Mekong
Basin. The water quality data from 2007 to
2011 indicate that elevated total phospho-
rus levels were the main culprit and while
phosphorus can enter aquatic environment
from the natural weathering of minerals, it
can also enter the aquatic environment as
runoff from man-made sources, including
sewage effluent, agricultural runoff and in-
dustrial discharge (MRC, 2010b). In addition
to the elevated total phosphorus levels, the
water quality data also show somewhat re-
Table 3-3. Levels of human impacts on water quality of the Mekong River (1-17) and Bassac River (18-22) from 2007-2011
Station No Station Names River Country
Class5
2007 2008 2009 2010 2011
1 Houa Khong Mekong Lao PDR C B B C B2 Chaing Sean Mekong Thailand B C C C C3 Luang Prabang Mekong Lao PDR B C B C B4 Vientiane Mekong Lao PDR C C B C A5 Nakhon Phanom Mekong Thailand D D C C D6 Savannakhet Mekong Lao PDR C C C B C7 Khong Chaim Mekong Thailand C C B C B8 Pakse Mekong Lao PDR B B B C A9 Stung Trieng Mekong Cambodia C C C C C
10 Kratie Mekong Cambodia C C C C C11 Kampong Cham Mekong Cambodia C C C C C12 Chrouy Changvar Mekong Cambodia C C C B C13 Neak Loung Mekong Cambodia C C C C C14 Krom Samnor Mekong Cambodia C D C C C15 Tan Chau Mekong Viet Nam C D D D C16 My Thuan Mekong Viet Nam C D D D C17 My Tho Mekong Viet Nam D D D D D18 Takhmao Bassac Cambodia D D D D D19 Khos Khel Bassac Cambodia D D D D D20 Khos Thom Bassac Cambodia D D D D C21 Chau Doc Bassac Viet Nam D D D D D22 Can Tho Bassac Viet Nam C D D D D
A: Not impacted; B: Slightly impacted; C: Impacted; D: Severely impacted
5 The results for 2007 and 2008 are different from those reported in Volume 2 of the Mekong River Report Card on Water Quality (MRC, 2010b) due to the use of different target values for the assessment.

RESuLTS & DISCuSSIONS
292011 Annual Water Quality Data Assessment Report
duced dissolved oxygen levels and slightly
elevated chemical oxygen demand levels in
the Delta. Elevated COD level can be attrib-
uted to excessive inputs of organic matter
from the drainage basin, such as those that
may occur downstream of a sewage outfall
(MRC, 2010b).
3.2.2 Water Quality Index for the Protection of Aquatic LifeDespite 17 stations being rated as either
“impacted” or “severely impacted” by
human activities in 2011, all but 2 stations
are rated as “excellent” for the protection
of aquatic life, with the exception being My
Tho and Can Tho. My Tho and Can Tho are
the last monitoring stations on the Mekong
River and the Bassac River, respective-
ly. These two stations were the only two
stations rated as “good” for the protection
of aquatic life. The slight impairment at My
Tho and Can Tho stations can be attribut-
able to both the elevated total phosphorus
concentrations (human impact) and salinity
intrusion, causing elevated electrical con-
ductivity levels (natural occurrence).
Between 2007 and 2011, water quality of
the Mekong and the Bassac Rivers remain
relatively unchanged and suitable for all
aquatic life with only a minor degree of
threat or impairment observed in the Delta.
Water quality in the upper reach upstream
of Kampong Cham is rated as “excellent”
for the protection of aquatic life. Compared
to 2010, water quality for the protection of
aquatic life improved from “good” to “excel-
lent” at two stations (My Thuan and Chau
Doc), where dissolved oxygen levels were
observed to be greatly improved compared
to the levels observed in 2010.
3.2.3 Water Quality Index for Agricultural useThe level of impairment of water quality
for agricultural use was assessed using the
MRC Water Quality Indices for Agricultural
use. While three indices were adopted by
the MRC to assess the level of impairment
of water quality for general irrigation,
paddy rice irrigation and livestock and
poultry, all indices for agricultural use can
be assessed against threshold values for
electrical conductivity (Table 2-7).
Table 3-4. Water quality class of the Mekong River (1-17) and Bassac River (18-22) for the protection of aquatic life 2007-2011
Station No Station Names Rivers Countries
Class
2007 2008 2009 2010 2011
1 Houa Khong Mekong Lao PDR A A A A A2 Chaing Sean Mekong Thailand A A A A A3 Luang Prabang Mekong Lao PDR A A A A A4 Vientiane Mekong Lao PDR A A A A A5 Nakhon Phanom Mekong Thailand A A A A A6 Savannakhet Mekong Lao PDR A A A A A7 Khong Chaim Mekong Thailand A A A A A8 Pakse Mekong Lao PDR A A A A A9 Stung Trieng Mekong Cambodia A A A A A
10 Kratie Mekong Cambodia A A A A A11 Kampong Cham Mekong Cambodia A A A A A12 Chrouy Changvar Mekong Cambodia A A A A A13 Neak Loung Mekong Cambodia A A A A A14 Krom Samnor Mekong Cambodia A A A A A15 Tan Chau Mekong Viet Nam A A A A A16 My Thuan Mekong Viet Nam A A B B A17 My Tho Mekong Viet Nam B B B B B18 Takhmao Bassac Cambodia A A A A A19 Khos Khel Bassac Cambodia A A A A A20 Khos Thom Bassac Cambodia A A A A A21 Chau Doc Bassac Viet Nam A A B B A22 Can Tho Bassac Viet Nam A A B B B
A: Excellent quality; B: Good quality; C: Moderate quality; D: Poor quality

30 2011 Annual Water Quality Data Assessment Report
A spatial trend analysis carried out for
electrical conductivity along the Mekong
and Bassac Rivers (Section 3.1.2 and Figure
3-3) reveals that all electrical conductivity
values obtained from the water quality
monitoring in 2011 were well within the
threshold of Water Quality Index for general
Irrigation use of 70 mS/m, with the maxi-
mum value being measured at Houa Khong
Station at 35 mS/m.
With no recorded violation of threshold
values for Water Quality Indices for gen-
eral Irrigation, Paddy Rice Irrigation, and
Livestock and Poultry, it can be concluded
that there is no restriction for all types of
agricultural use of the Mekong and Bassac
River water. The level of impairment of the
Mekong and Bassac Rivers water quality on
agricultural use are summarised in Table
3-5.
3.3 ECOLOgICAL HEALTH MONITORINg
Another method used by the MRC to
monitor the health of the Mekong River
is Ecological Health Monitoring (EHM).
The objective of the EHM is to determine
whether changes in water quality have any
effect on fish and other aquatic life in the
Mekong River and its tributaries. The EHM is
conducted by a group of national experts of
the Member Countries, including biologists
and ecologists. The EHM Programme was
commenced by the MRC in 2004 and dis-
continued in 2008 due to a lack of funding.
The Programme was resumed in 2011 at
41 stations (8 stations each in the Lao PDR,
Thailand, and Viet Nam, and 17 stations in
Cambodia). Of the 41 stations monitored
in 2011, 22 stations are located at the same
sites or close to the water quality moni-
toring stations of the MRC Water Quality
Monitoring Network, of which 11 are locat-
ed in either the Mekong or Bassac Rivers.
The locations of the EHM in relation to the
locations of the Water Quality Monitoring
Network are illustrated in Figure 3-16.
As part of the EHM, 4 biological groups,
namely benthic diatoms, zooplankton, litto-
ral macro-invertebrates and benthic mac-
ro-invertebrates were monitored. For each
Table 3-5. Water quality class of the Mekong River (1-17) and Bassac River (18-22) for agricultural use for 2007-2011
Station No Station Name River Country
Class2007 2008 2009 2010 2011
1 Houa Khong Mekong Lao PDR A A A A A2 Chaing Sean Mekong Thailand A A A A A3 Luang Prabang Mekong Lao PDR A A A A A4 Vientiane Mekong Lao PDR A A A A A5 Nakhon Phanom Mekong Thailand A A A A A6 Savannakhet Mekong Lao PDR A A A A A7 Khong Chaim Mekong Thailand A A A A A8 Pakse Mekong Lao PDR A A A A A9 Stung Trieng Mekong Cambodia A A A A A
10 Kratie Mekong Cambodia A A A A A11 Kampong Cham Mekong Cambodia A A A A A12 Chrouy Changvar Mekong Cambodia A A A A A13 Neak Loung Mekong Cambodia A A A A A14 Krom Samnor Mekong Cambodia A A A A A15 Tan Chau Mekong Viet Nam A A A A A16 My Thuan Mekong Viet Nam A A A A A17 My Tho Mekong Viet Nam A A A A A18 Takhmao Bassac Cambodia A A A A A19 Khos Khel Bassac Cambodia A A A A A20 Khos Thom Bassac Cambodia A A A A A21 Chau Doc Bassac Viet Nam A A A A A22 Can Tho Bassac Viet Nam A A A A A
A: No restriction; B: Some restriction; C: Severe restriction

RESuLTS & DISCuSSIONS
312011 Annual Water Quality Data Assessment Report
Figure 3.16. Locations of the EHM in relation to the location of the WQMN

32 2011 Annual Water Quality Data Assessment Report
biological group, 3 biological metrics namely
abundance, average richness and the Aver-
age Tolerance Score per Taxon (ATSPT) were
measured. Thus, a total of 12 biological indi-
cators were used to evaluate each site. The
quality of each site was classified into one of
the four following groups (MRC, 2008):
• Class A (Excellent): 10 - 12 of the 12 indi-
cators meet the guidelines. The biodiver-
sity and ecological capacity to support
fish and other freshwater functions are
similar to those at the reference sites de-
fined in the 2004 – 2007 survey. These ref-
erence sites provide a ‘baseline’ against
which other sites can be measured.
• Class B (good): 7 - 9 of the 12 indicators
meet the guidelines. The biodiversity and
ecological capacity are slightly less than
that at the reference sites. Human activi-
ties may have caused some disturbance.
• Class C (Moderate): 4 - 6 of the 12 indicators
meet the guidelines. The biodiversity and
ecological capacity are markedly less than
that at the reference sites. Disturbance
resulting from human activities is present.
• Class D (Poor): 0 - 3 of the 12 indicators
meet the guidelines. The biodiversity and
ecological capacity are significantly less
than that at the reference sites. Various
disturbances from human activities are
likely to be present.
Table 3-6. Results of the Ecological Health Monitoring 2005-2008 and 2011
Station Name Country River 2005 2006 2007 2008 2011
Chiang Sean Thailand Mekong B B
Luang Prabang Lao PDR Mekong B C C
Vientiane Lao PDR Mekong A B A
Nakhon Phanom Thailand Mekong C B
Kong Chiam Thailand Mekong A B
Kratie/Kampi Pool Cambodia Mekong A A A
Neak Loung Cambodia Mekong B
Tan Chau/Thuong Thoi Viet Nam Mekong C B
My Thuan Viet Nam Mekong C C
Khos Khel Cambodia Bassac B C B
Can Tho Viet Nam Bassac C B B
Chau Doc/Da Phuoc Viet Nam Bassac C B
Chiang Rai Thailand Mae Kok A A B
Ban Chai Buri Thailand Song Kham C A C
Se Bang Fai Bridge Lao PDR Se Bang Fai B B C
Na Kae Thailand Nam Kam C B B
Se Bang Hieng Bridge Lao PDR Se Bang Hieng A C B
Se Done Bridge/Ban Hae Lao PDR Se Done B B B
ubon Thailand Mun A A
Phum Phi (Phi Village) Cambodia Se San A A A B A
Prek Kdam Cambodia Tonle Sap B
Phnom Penh Port Cambodia Tonle Sap B
RESuLTS & DISCuSSIONS
332011 Annual Water Quality Data Assessment Report
Table 3-6 provides results of the ecological
health monitoring in the Mekong and Bas-
sac Rivers at stations where water quality
monitoring were also carried out. In addi-
tion to providing the 2011 ecological health
monitoring results, the table also provides
results of the monitoring between 2005 and
2008 for trends comparison. Key observa-
tions of the ecological health monitoring
results at these stations are as follows:
• Of the 22 sites listed in Table 3.4, all but four
are rated as either “good” or “excellent”,
meaning that the biodiversity and ecolog-
ical capacity of these sites to support fish
and other freshwater functions are still rela-
tively unaffected by human impacts. Of the
four stations rated as “moderate” two are
located in the Mekong mainstream (Luang
Prabang and My Thuan).
• Despite many water quality monitoring
stations in the Mekong and Bassac Rivers
being rated as either “impacted” or
“severely impacted” by human activ-
ities in 2011 (Table 3-2), the results of
the ecological health monitoring reveal
that water quality is still either “good” or
“excellent” for support of fish and other
freshwater functions, with the exception
of the two stations (Luang Prabang and
My Thuan) where it was rated as “moder-
ate” for support of fish and other fresh-
water functions. It should be noted that
results of the 2011 water quality moni-
toring reveal that water quality at Luang
Prabang station was “slightly impacted”
by human activities while water quality at
My Thuan station was “severely impact-
ed” by human activities which likely alter
the habitat of aquatic fauna.

4. COnCLUSIOnS AnD RECOMMEnDATIOnS
352011 Annual Water Quality Data Assessment Report

36 2011 Annual Water Quality Data Assessment Report
The levels of human impact on water quality
of the Mekong and Bassac Rivers improved
slightly in 2011 compared to the levels
calculated for 2010, with 8 stations showing
a lesser degree of impact from human ac-
tivities or pressure. Only 3 stations reported
higher degrees of impact when compared
to the 2010 water quality monitoring results
while the rest of the stations remained rel-
atively unchanged. In general, the majority
of stations rated as “impacted” or “severely
impacted” by human activities are located
in the Delta (for both the Mekong and Bassac
Rivers) where higher population densities
and intensive agricultural activities were
observed. The stations in the Delta were also
likely to be cumulatively impacted by human
activities in the upper and middle parts of
the Lower Mekong Basin.
Despite many stations being rated as either
“impacted” or “severely impacted” by
human activities in 2011, the assessment of
the Water Quality Index for the Protection
of Aquatic Life revealed that all stations
were rated as either “excellent” or “good”
for the protection of aquatic life. In fact, 20
of the 22 stations located in Mekong and
Bassac Rivers were rated as “excellent” for
the protection of aquatic life while the only
two downstream most stations (My Tho
and Can Tho) were rated as “good” for the
protection for water quality.
The biodiversity and ecological capability
of the Mekong and Bassac Rivers to sup-
4.1 CONCLuSIONS
Based on the results of the 2011 water
quality monitoring, it can be concluded that
the water quality of the Mekong and Bassac
Rivers is still of good quality with only a few
numbers of dissolved oxygen and chemical
oxygen demand samples exceeding the MRC
Water Quality guidelines for the Protection
of Human Health and Aquatic Life. The
majority of exceeding values of dissolved
oxygen and chemical oxygen demand were
recorded in the Delta. Additionally, electrical
conductivity levels were recorded to be well
below the lowest allowable limit of the MRC
Water Quality guidelines for the Protection
of Human Health and Aquatic Life. However,
it should be noted that the Mekong River is
generally characterised as a low saline river
with the average electrical conductivity rare-
ly exceeding 20 mS/m.
Compared to previous years, nutrient levels
increased slightly in 2011 with total phos-
phorus and ammonium levels showing
increasing trends from 1985 to 2011 while
the nitrate-nitrite levels remain relatively
constant. While the dissolved oxygen levels
remained relatively constant from 1985
to 2011, chemical oxygen demand levels
increased slightly during the same time
frame. Total suspended solids level showed
a noticeable decrease between 1985 and
2011, from an average value of 389 mg/L to
82 mg/L and the median value of 244 mg/L
to 55 mg/L.
4. COnCLUSIOnS AnD RECOMMEnDATIOnS

4. CONCLuSIONS AND RECOMMENDATIONS
372011 Annual Water Quality Data Assessment Report
port fish and other aquatic functions was
also reported to be mostly excellent with
many ecological health monitoring stations
being classified as either “excellent” or
“good”. Of the mainstream stations located
at the same locations as the water quality
monitoring stations, only two were report-
ed to be “moderate” for support of fish and
aquatic functions. These 2 stations were
rated by the Water Quality Index for Human
Impacts as “slightly impacted” and “im-
pacted” by human activities.
4.2 RECOMMENDATIONS
The maintenance of good or acceptable
water quality to promote the sustainable
development of the Mekong River is of para-
mount concern basin wide. So much so that
the MRC Member Countries has adopted
the Procedures for Water Quality with an
objective of establishing a cooperation
framework for the maintenance of accept-
able/good water quality of the Mekong Riv-
er to promote the sustainable development
of the Mekong River Basin. With a view to
achieving the objective of the Procedures
for Water Quality, Member Countries have
agreed to:
• Make every effort to maintain acceptable/
good water quality on the mainstream;
• Strengthen the existing and, if necessary,
establish new joint programs for monitor-
ing and assessing the water quality of the
Mekong River;
• jointly develop the Technical guidelines
for the Implementation of the Procedures
for Water Quality (TgWQ); and
• Conduct research to refine the Technical
guidelines for an effective implementa-
tion of the Procedures for Water Quality.
Member Countries’ effort to maintain
acceptable/good water quality of the
Mekong River has led to the development
of Technical guidelines for the Implemen-
tation of the Procedures for Water Quality,
where a number of additional water quality
indicators have been proposed for monitor-
ing in the near future. These indicators have
been added taking into account emerging
threats on water quality, including popu-
lation growth, intensive agricultural and
aquaculture, navigation, hydropower and
industrialisation, which can often increased
input of chemicals and ultimately affect the
aquatic ecosystem and human health.
In this regard, to improve future monitor-
ing of water quality under the MRC Water
Quality Monitoring Network, the following
aspects need to be considered:
• Provide timely data to assure the curren-
cy and validity of data for the protection
of aquatic life and human health;
• Allow for the determination of the re-
lationship between water quality con-
ditions and land use within the Lower
Mekong Basin;
• Expand coverage of the WQMN to include
additional key tributaries of the Mekong
River ensuring the establishment of water
quality baseline conditions at these
tributaries;
• Include water quality indicators listed in
the draft Chapters 1 and 2 of the TgWQ

38 2011 Annual Water Quality Data Assessment Report
which include heavy metals and persis-
tent and non-persistent organic sub-
stances in addition to the already monitor
conventional water quality parameters;
and
• Improve water quality risk assessment
and methods for communicating results
of the water quality monitoring, including
reviewing the adequacy and currency of
the MRC Water Quality Indices.

392011 Annual Water Quality Data Assessment Report
ReferencesClesceri et al. (1998) The Standard Methods for the Examination of Water and Wastewater. 20th Edition.
MRC (2008) The Mekong River Report Card on Aquatic Ecological Health (2004-2007). Mekong River Commission. Vientiane, Lao PDR.
MRC (2010a) State of the Basin Report 2010. Mekong River Commission, Vientiane, Lao PDR
MRC (2010b) The Mekong River Report Card on Water Quality. Volume 2: june 2010. Mekong River Commission, Vientiane, Lao PDR.
MRC (2011) Planning Atlas of the Lower Mekong River Basin. Mekong River Commission, Vientiane, Lao PDR.
nord, J. (1995) Box-and-whisker plot. http://ellerbruch.nmu.edu/cs255/jnord/boxplot.html.
Ongley, E. [n.d.] Water Quality Guidelines and Index: Recommendations for Mekong Water Quality Assessment. A Discussion Paper for the Environment Programme. Version 8. Mekong River Commission, Vientiane, Lao PDR.

412011 Annual Water Quality Data Assessment Report
APPEnDIX A. The MRC Water Quality guidelines for the Protection of human health
Parameters Symbol unit Value
Total Arsenic Total As mg/l 0.01
Cadmium Cd mg/l 0.0051
Chromium Hexavalent Cr mg/l 0.05
Cyanide CN mg/l 0.01
Lead Pb mg/l 0.05
Total Mercury Total Hg mg/l 0.002
Oil and grease Should not occur in such a way that:• It can be observed as an oil film, sheen or discolouration;• One can smell its odour; or• It can be seen as oily deposits on the river bank and/or at the river bottom.
Phenol C6H5OH mg/l 0.005
Total Organochlorine Pesticide mg/l 0.05
Faecal Coliforms MPN/100ml 10002
Ammonia as N NH3 as N mg/l 0.53
Biological oxygen demand BOD5 mg/l 4
Chemical oxygen demand CODMn mg/l 5
Conductivity EC mS/m 70-150
Dissolved Oxygen DO mg/l ≥ 64
Total Nitrite and Nitrate as N (NO2 + NO3 ) as N mg/l 5
pH pH 6-9
Temperature T oC Natural
Total Coliform MPN/100ml 5000
Note:(1) When the water hardness is less than 100 mg/l as CaCO3(2), (3) and,(4)An interim target value. The TBWQ with support from the Mekong River Commission Secretariat will continue to study this issue in order to reconsider the interim target value.

432011 Annual Water Quality Data Assessment Report
APPEnDIX B. The MRC Water Quality guidelines for the Protection of Aquatic Life
Parameters Symbol Unit Value
Arsenic Total As mg/l 0.01Cadmium Cd mg/l 0.0051
Chromium Hexavelent Cr (VI) mg/l 0.052
Copper Cu Mg/l 0.1Cyanide CN mg/l 0.005Lead Pb mg/l 0.053
Total Mercury Total Hg mg/l 0.0014
Oil and grease5 Should not occur in such a way that:• It can be observed as an oil film, sheen or discolouration;• One can smell its odour; or• It can be seen as oily deposits on the river bank and/or at the river bottom.
Phenol C6H5OH mg/l 0.005Total Organochlorine Pesticide mg/l 0.05Ammonia NH3 as N mg/l 0.2Biological oxygen demand BOD5 mg/l 36
Dissolved Oxygen DO mg/l > 5pH pH 6 – 9 Temperature oC NaturalNitrite7 NO 2 as N Nitrate NO 3 as N mg/l 5Phosphate8 PO4 as P
Note: (1) When the water hardness is less than 100 mg/l as CaCO3(2), (3),(4),(5) and (6)An interim target value. The TBWQ with support from the Mekong River Commission Secretariat will continue to study this issue in order to reconsider the interim target value.(7) An interim target value. The TBWQ with support from the MRC Secretariat will continue to study this issue in order to reconsider the interim target value. Thailand proposes 0.5 mg/l; Viet Nam proposes 0.1 mg/l.(8) Target values will be proposed in the future when the national standard target values for Lao PDR and Thailand are available.

Office of the Secretariat in Phnom Phenh (OSP)567 National Road, #2, Chak Angre Krom,P.O.Box 623, Phnom Penh, CambodiaTel : (855-23) 425 353Fax : (855-23) 425 363
Office of the Secretariat in Vientiane (OSV)Office of the Chief Execuive Officer184 Fa Ngoum RoadP.O. Box 6101, Vientiane, Lao PDRTel : (856-21) 263 263Fax : (856-21) 263 264
Mekong River CommissionCambodia Lao PDR Thailand Viet Nam
Recommended