2008 SWAP – Harrisville Fire District WHPA for Wells Replacement #1, 2 and 3 1 of 29
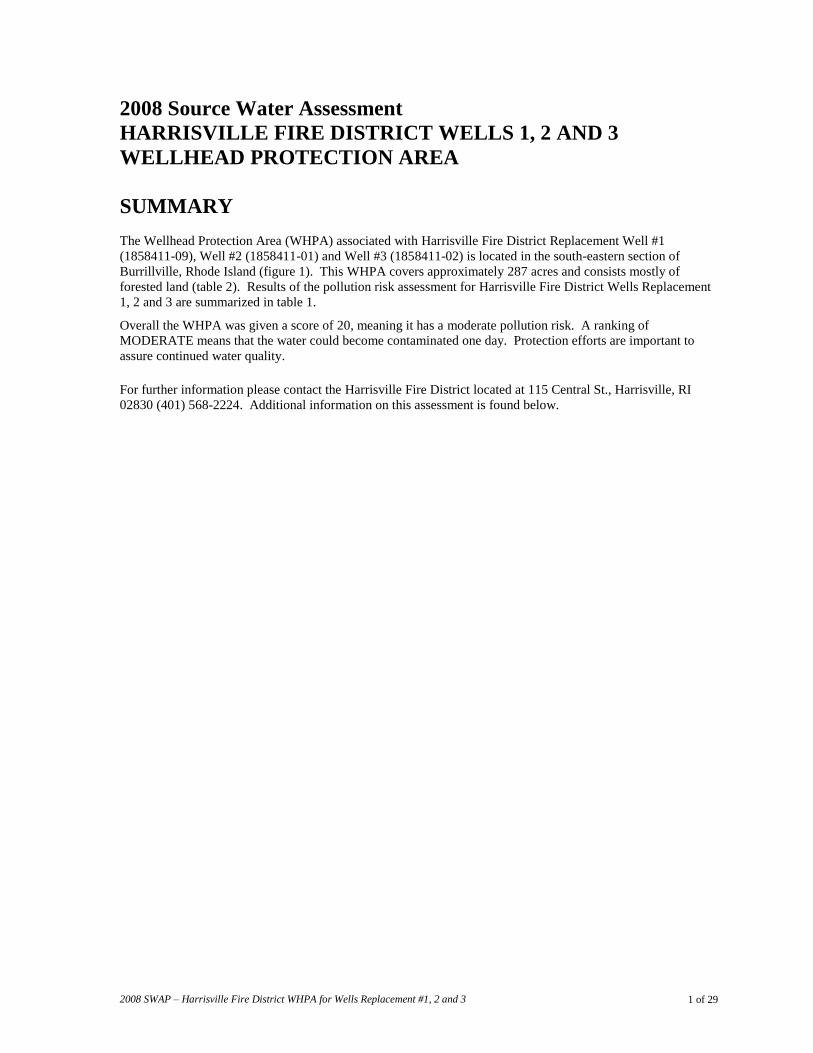
2008 Source Water Assessment
HARRISVILLE FIRE DISTRICT WELLS 1, 2 AND 3
WELLHEAD PROTECTION AREA
SUMMARY
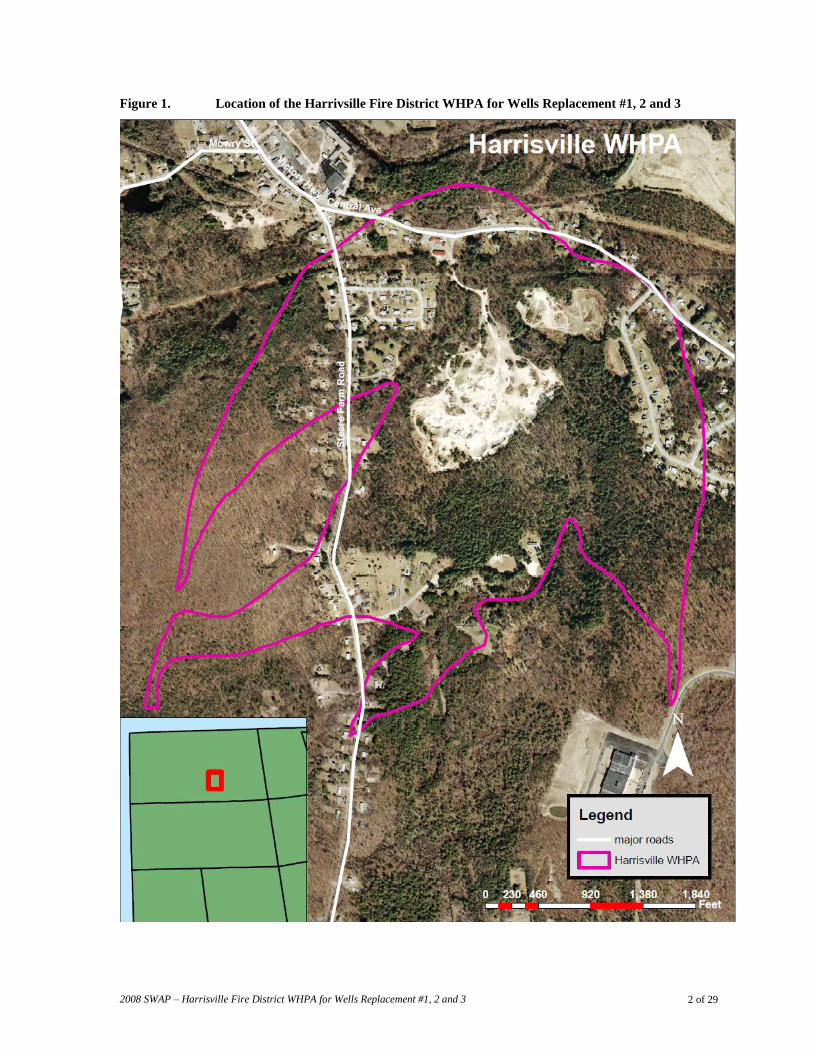
The Wellhead Protection Area (WHPA) associated with Harrisville Fire District Replacement Well #1
(1858411-09), Well #2 (1858411-01) and Well #3 (1858411-02) is located in the south-eastern section of
Burrillville, Rhode Island (figure 1). This WHPA covers approximately 287 acres and consists mostly of
forested land (table 2). Results of the pollution risk assessment for Harrisville Fire District Wells Replacement
1, 2 and 3 are summarized in table 1.
Overall the WHPA was given a score of 20, meaning it has a moderate pollution risk. A ranking of
MODERATE means that the water could become contaminated one day. Protection efforts are important to
assure continued water quality.
For further information please contact the Harrisville Fire District located at 115 Central St., Harrisville, RI
02830 (401) 568-2224. Additional information on this assessment is found below.
2008 SWAP – Harrisville Fire District WHPA for Wells Replacement #1, 2 and 3 2 of 29
Figure 1. Location of the Harrivsille Fire District WHPA for Wells Replacement #1, 2 and 3
2008 SWAP – Harrisville Fire District WHPA for Wells Replacement #1, 2 and 3 3 of 29
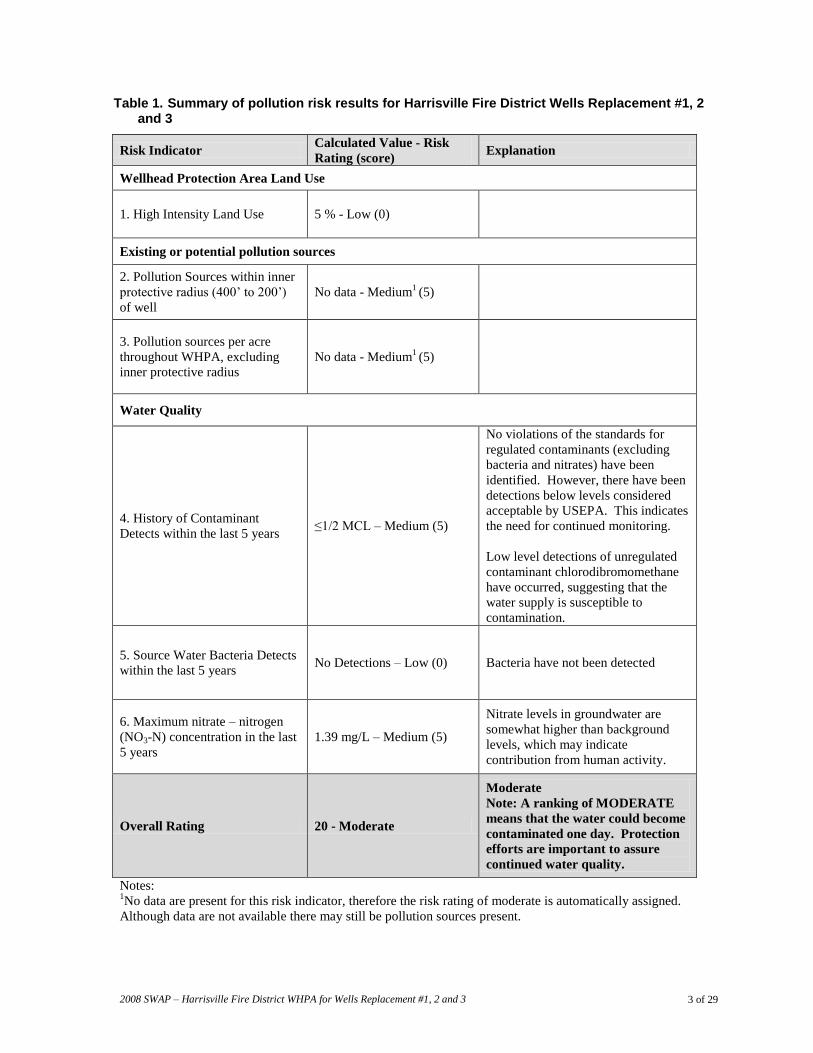
Table 1. Summary of pollution risk results for Harrisville Fire District Wells Replacement #1, 2 and 3
Risk Indicator Calculated Value - Risk
Rating (score) Explanation
Wellhead Protection Area Land Use
1. High Intensity Land Use 5 % - Low (0)
Existing or potential pollution sources
2. Pollution Sources within inner
protective radius (400’ to 200’)
of well
No data - Medium1 (5)
3. Pollution sources per acre
throughout WHPA, excluding
inner protective radius
No data - Medium1 (5)
Water Quality
4. History of Contaminant
Detects within the last 5 years ≤1/2 MCL – Medium (5)
No violations of the standards for
regulated contaminants (excluding
bacteria and nitrates) have been
identified. However, there have been
detections below levels considered
acceptable by USEPA. This indicates
the need for continued monitoring.
Low level detections of unregulated
contaminant chlorodibromomethane
have occurred, suggesting that the
water supply is susceptible to
contamination.
5. Source Water Bacteria Detects
within the last 5 years No Detections – Low (0) Bacteria have not been detected
6. Maximum nitrate – nitrogen
(NO3-N) concentration in the last
5 years
1.39 mg/L – Medium (5)
Nitrate levels in groundwater are
somewhat higher than background
levels, which may indicate
contribution from human activity.
Overall Rating 20 - Moderate
Moderate
Note: A ranking of MODERATE
means that the water could become
contaminated one day. Protection
efforts are important to assure
continued water quality.
Notes: 1No data are present for this risk indicator, therefore the risk rating of moderate is automatically assigned.
Although data are not available there may still be pollution sources present.
2008 SWAP – Harrisville Fire District WHPA for Wells Replacement #1, 2 and 3 4 of 29
UNDERSTANDING THE ASSESSMENT
WHY WAS THE ASSESSMENT DONE?
The Safe Drinking Water Act (SDWA) Amendments of 1996 required states to develop and implement source
water assessment programs (SWAPs) to analyze existing and potential threats to the quality of the public
drinking water throughout the state. Using these programs, most states have completed source water
assessments for every public water system -- from major metropolitan areas to the smallest towns. Even
schools, restaurants, and other public facilities that have wells or surface water supplies have been assessed. A
source water assessment is a study and report, unique to a water system that provides basic information about
the water used to provide drinking water. States are working with local communities and public water systems
to identify protection measures to address potential threats to sources of drinking water.
In Rhode Island, RI HEALTH's Office of Drinking Water Quality administers the Source Water Assessment
Program.
WHAT AREA WAS EVALUATED FOR THIS ASSESSMENT?
The source water protection area, the area evaluated for this assessment, is the critical area surrounding a public
water supply well or an intake on a surface source. For a public water supply well this is the wellhead
protection area (WHPA). The WHPA is the estimated area from which groundwater and surface water will
flow from under severe pumping conditions. This can also be stated as the maximum estimated area that water
withdrawn from the well will ever be drawn from. For most bedrock wells, this area is a volume dependent
circle For wells in sand and gravel this area is generally not a circle, but an irregular shape determined by
sedimentary deposits and pumping rate. The source protection area for surface water sources is generally the
watershed of the surface waterbody.
WILL THE POTENTIAL CONTAMINATION SOURCES IDENTIFIED IN THE SANTIARY
SURVEY CONTAMINATE MY SOURCE?
Potential contamination sources identified in sanitary surveys are facilities that typically use, produce, handle or
store contaminants of concern, which, if improperly managed, could find their way to a source of public
drinking water. It is important to understand that a release may never occur from a potential contamination
source, provided it is using good management practices. Many potential contamination sources are regulated at
the federal level, the state level, or both, to reduce the risk of a release. There are a number of methods that
waster systems can use to work cooperatively with potential contamination sources. These often involve
educational visits and inspections of stored materials.
HOW SHOULD THIS ASSESSMENT BE USED?
This assessment should be used to plan for improved protection of public drinking water sources. Additional
information may also be useful such as identification of the 100-year flood plain, tax map information, soils
information or high-density development areas. This assessment is a good starting place for planning protection
programs. Communities should act now to protect valuable water supply resources; once contamination
occurs clean-up is costly and sometimes technically infeasible. Additionally, unprotected watersheds and
wellheads can lead to deterioration of water quality that may eventually lead to higher treatment costs.
2008 SWAP – Harrisville Fire District WHPA for Wells Replacement #1, 2 and 3 5 of 29
EXPLANATION & DETERMINATION OF POLLUTION RISK
FACTORS Overview
This Source Water Assessment was completed using the ―Guide to Updating Source Water Assessments and
Protection Plans, Version 3 – 2010‖. All risk indicator ratings were obtained from the ―Guide‖. A summary of
methods as well as calculated risks is presented here.
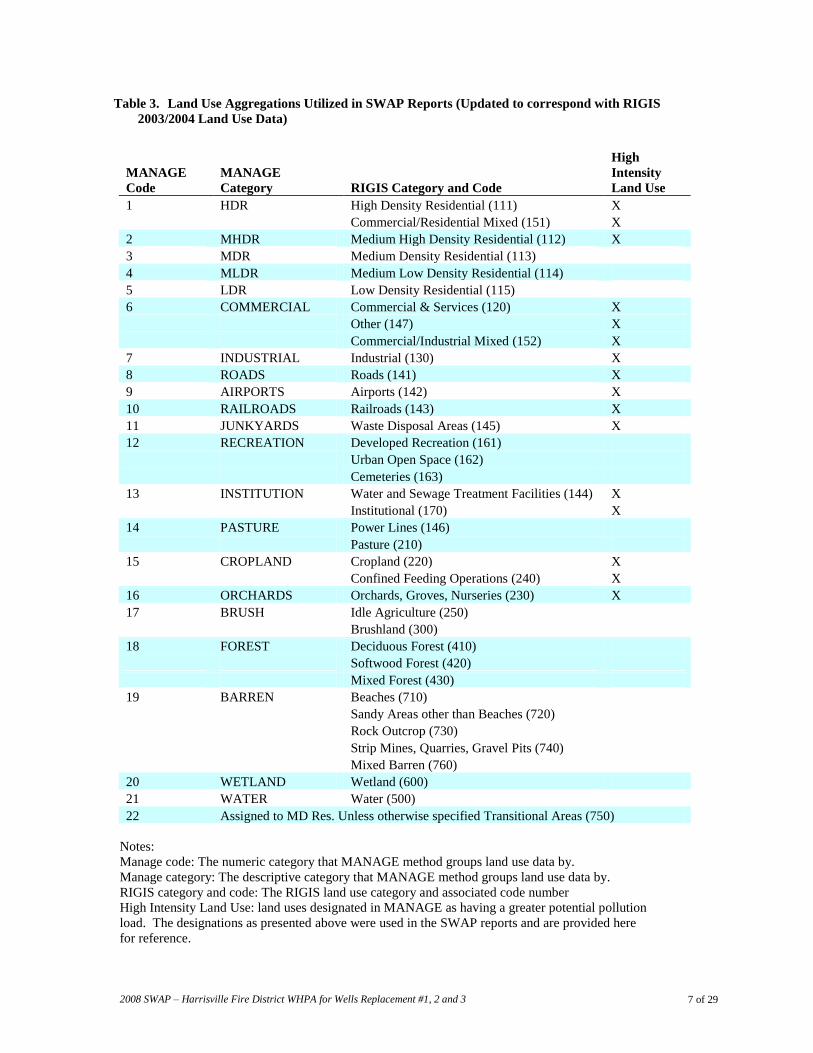
Risk Factor 1. High Intensity Land Use High intensity land use was determined using Rhode Island GIS (RIGIS) land use data (2003/2004 data). Land
uses within the WHPA were calculated using ArcView 9.3 (ESRI) and then aggregated based on land use
categories defined in the MANAGE model. The MANAGE model assigns RIGIS land use types into a reduced
number of categories, 11 of which are identified as High Intensity Land Use (table 3). The MANAGE model is
a GIS based tool that informs decisions about environmental risks associated with land use. Technical
documentation for MANAGE model can be viewed at : http://www.uri.edu/ce/wq/NEMO/Tools/mapping.htm.
The percentage of high intensity land use in the WHPA under study is then compared to the rating scale for risk
indicator 1, High intensity land use. A summary of all land uses found within the WHPA for Harrisville
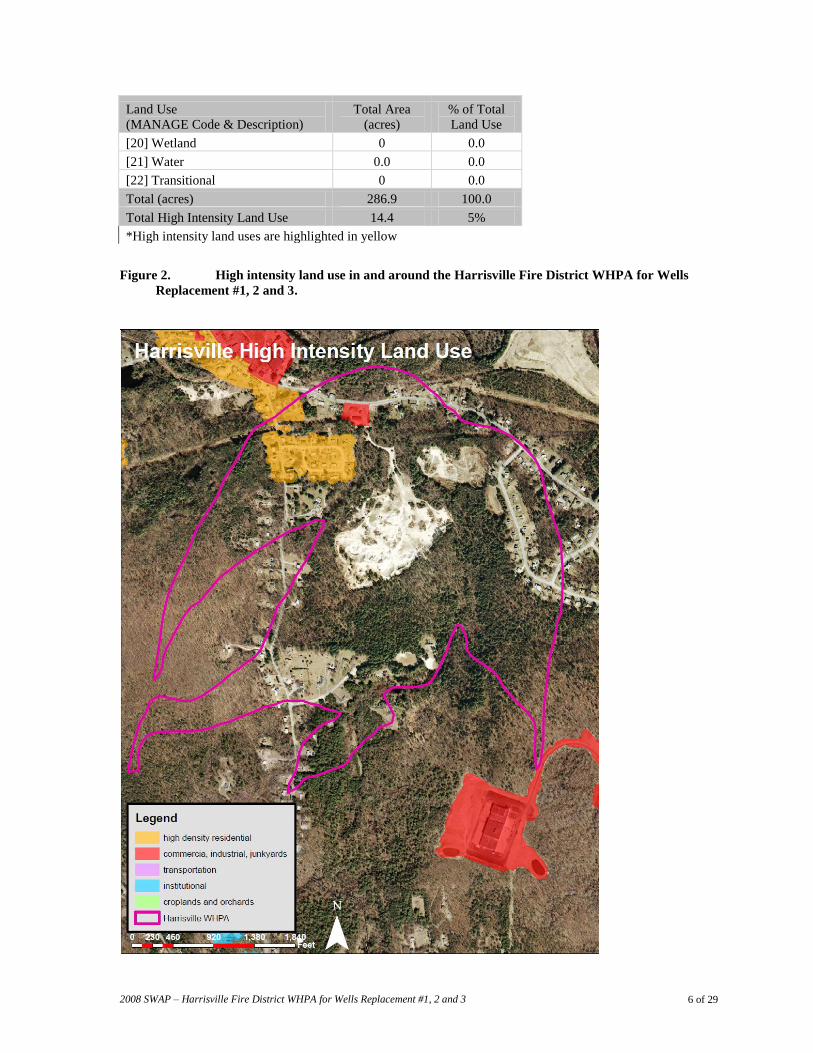
Fire District Wells Replacement #1, 2 and 3 reveals that 5% of the WHPA is considered to be developed
as high intensity land use, corresponding with a risk rating of low.
Table 2. Harrisville Fire District Wells Replacement #1, 2 and 3 WHPA Land Use
Land Use
(MANAGE Code & Description)
Total Area
(acres)
% of Total
Land Use
[1] HD Res.(>8 /ac) 0 0.0
[2] MHD Res.(4-7.9/ac) 12.9 4.5
[3] MD Res.(1-3.9/ac) 43.5 15.2
[4] MLD Res.(0.5-0.9/ac) 4.6 1.6
[5] LD Res.(<0.5/ac) 0 0.0
[6] Commercial 1.5 0.5
[7] Industrial 0.0 0.0
[8] Roads 0 0.0
[9] Airports 0 0.0
[10] Railroads 0 0.0
[11] Junkyards 0 0.0
[12] Recreation 0 0.0
[13] Institution 0 0.0
[14] Pasture 0 0.0
[15] Cropland 0 0.0
[16] Orchards 0 0.0
[17] Brush 1.5 0.5
[18] Forest 196.2 68.4
[19] Barren 26.7 9.3
Risk Indicator Rating (Score)
Low (0) Medium (5) High (10) Extreme (25)
1. High intensity land use <10% 10-24% 25-50% >40%
2008 SWAP – Harrisville Fire District WHPA for Wells Replacement #1, 2 and 3 6 of 29
Land Use
(MANAGE Code & Description)
Total Area
(acres)
% of Total
Land Use
[20] Wetland 0 0.0
[21] Water 0.0 0.0
[22] Transitional 0 0.0
Total (acres) 286.9 100.0
Total High Intensity Land Use 14.4 5%
*High intensity land uses are highlighted in yellow
Figure 2. High intensity land use in and around the Harrisville Fire District WHPA for Wells
Replacement #1, 2 and 3.
2008 SWAP – Harrisville Fire District WHPA for Wells Replacement #1, 2 and 3 7 of 29
Table 3. Land Use Aggregations Utilized in SWAP Reports (Updated to correspond with RIGIS
2003/2004 Land Use Data)
MANAGE
Code
MANAGE
Category RIGIS Category and Code
High
Intensity
Land Use
1 HDR High Density Residential (111) X
Commercial/Residential Mixed (151) X
2 MHDR Medium High Density Residential (112) X
3 MDR Medium Density Residential (113)
4 MLDR Medium Low Density Residential (114)
5 LDR Low Density Residential (115)
6 COMMERCIAL Commercial & Services (120) X
Other (147) X
Commercial/Industrial Mixed (152) X
7 INDUSTRIAL Industrial (130) X
8 ROADS Roads (141) X
9 AIRPORTS Airports (142) X
10 RAILROADS Railroads (143) X
11 JUNKYARDS Waste Disposal Areas (145) X
12 RECREATION Developed Recreation (161)
Urban Open Space (162)
Cemeteries (163)
13 INSTITUTION Water and Sewage Treatment Facilities (144) X
Institutional (170) X
14 PASTURE Power Lines (146)
Pasture (210)
15 CROPLAND Cropland (220) X
Confined Feeding Operations (240) X
16 ORCHARDS Orchards, Groves, Nurseries (230) X
17 BRUSH Idle Agriculture (250)
Brushland (300)
18 FOREST Deciduous Forest (410)
Softwood Forest (420)
Mixed Forest (430)
19 BARREN Beaches (710)
Sandy Areas other than Beaches (720)
Rock Outcrop (730)
Strip Mines, Quarries, Gravel Pits (740)
Mixed Barren (760)
20 WETLAND Wetland (600)
21 WATER Water (500)
22 Assigned to MD Res. Unless otherwise specified Transitional Areas (750)
Notes:
Manage code: The numeric category that MANAGE method groups land use data by.
Manage category: The descriptive category that MANAGE method groups land use data by.
RIGIS category and code: The RIGIS land use category and associated code number
High Intensity Land Use: land uses designated in MANAGE as having a greater potential pollution
load. The designations as presented above were used in the SWAP reports and are provided here
for reference.
2008 SWAP – Harrisville Fire District WHPA for Wells Replacement #1, 2 and 3 8 of 29
Risk Factor 2 & 3: Pollution Sources Within Inner Protective Radius and Per Acre Throughout the
WHPA Information on the presence or absence of pollution sources within the inner protective radius of the well can
usually be obtained through the Rhode Island Department of Health (RIDOH) Sanitary Surveys and Waivers.
The most recent RIDOH Waiver for the Harrisville Fire District was completed in 2007. This Waiver provides
little information on the WHPA containing Replacement Well #1, Well #2 and Well #3, especially since the
WHPA delineation changed after this Waiver was completed. The Waiver does not provide an analysis of
pollution sources within the inner protective radius nor a per acre count of potential sources throughout the
WHPA. Therefore, Risk Factor 2 – Pollution Sources Within Inner Protective Radius and Risk Factor 3 –
Pollution Sources Per Acre Throughout the WHPA—were both set at Medium. The Waiver is included as an
attachment.
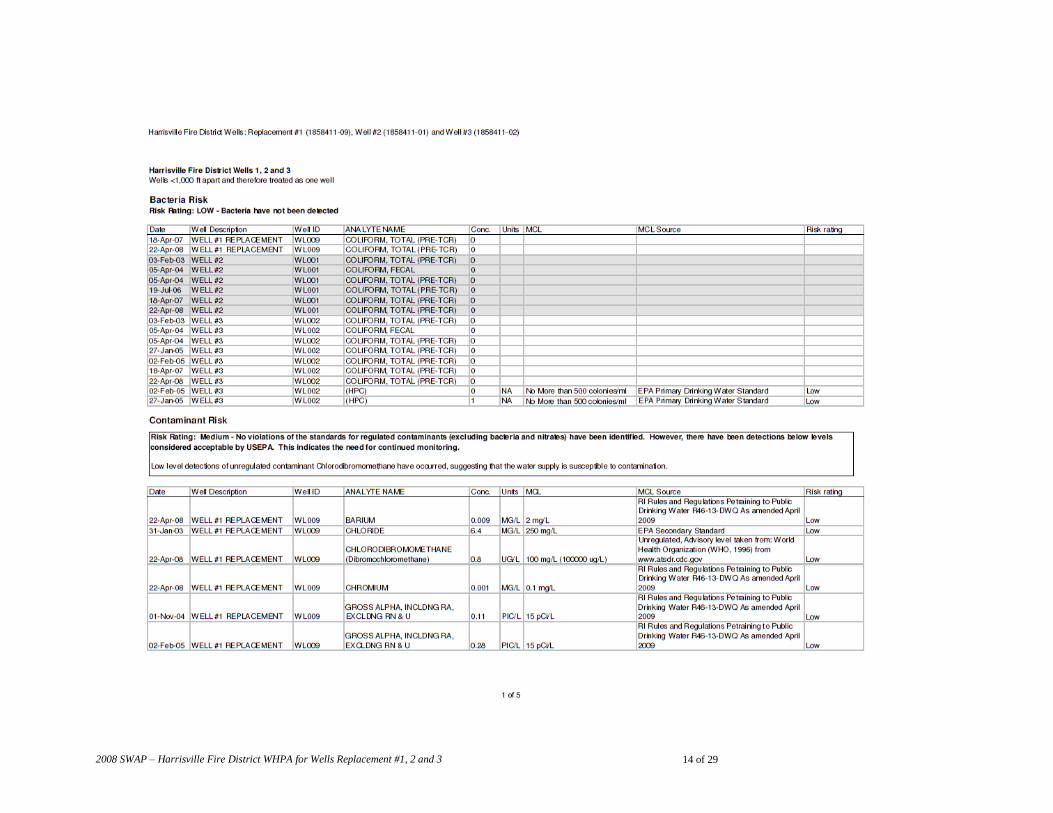
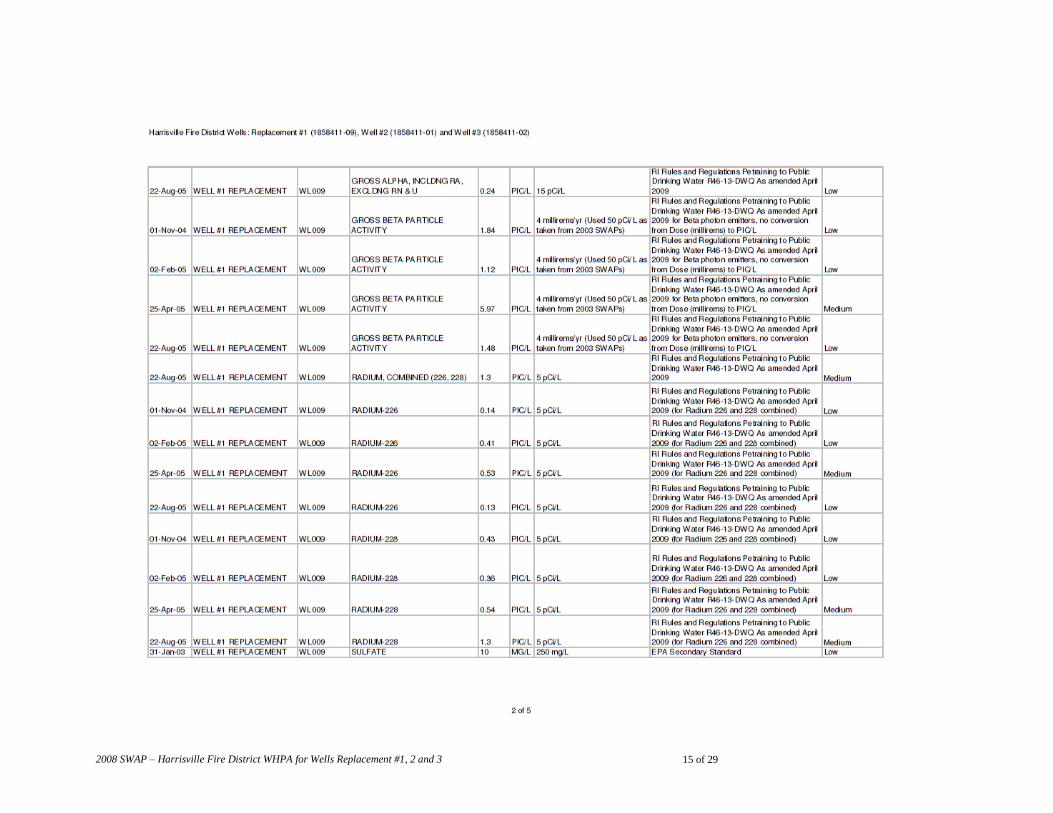
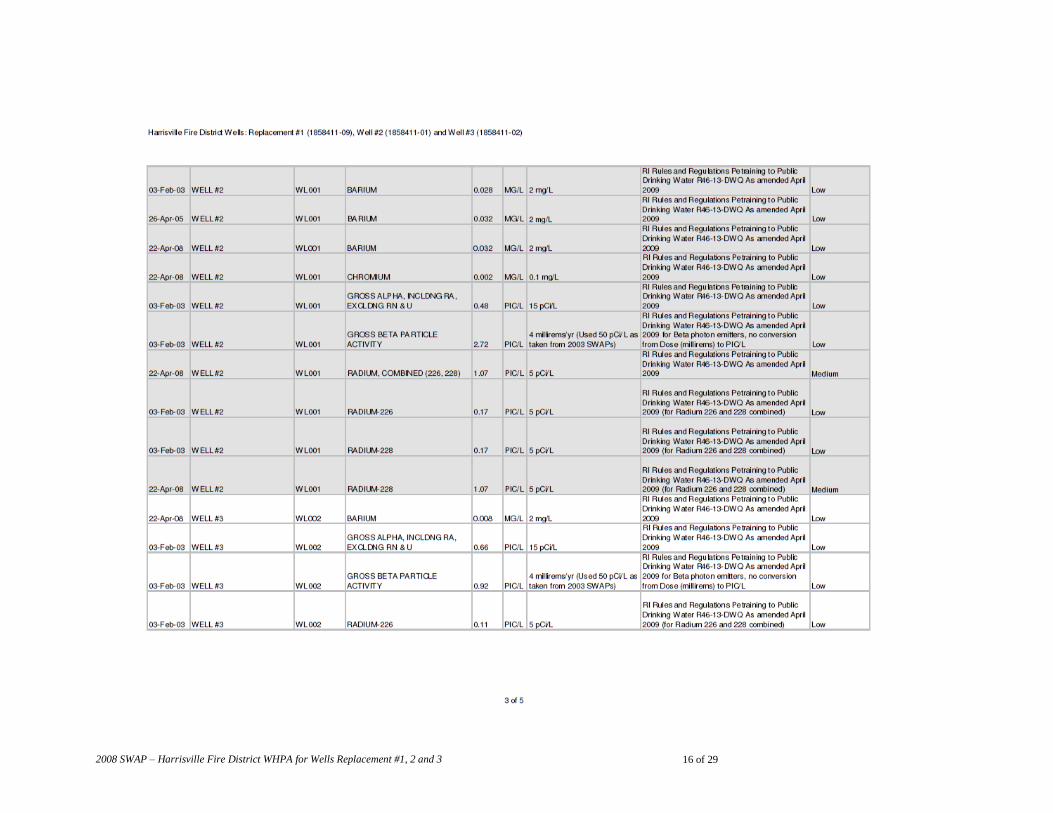
Risk Factor 4, 5 & 6: History of Contaminant, Bacteria and Nitrate-Nitrogen Detections
Laboratory results for samples collected from Replacement Well #1, Well #2 and Well #3 were obtained from
Rhode Island Department of Health (RIDOH) and used to determine risk factors 4, 5 and 6. As all three Wells
are less than 1,000 ft apart, they were assessed as one for the purposes of this analysis and only one risk rating
score is provided for risk factors 4, 5 and 6.
Risk Factor 4 – History of contaminant detections within the last 5 years was determined by reviewing all
contaminant detections in the laboratory records (excluding bacteria, nitrogen, sodium, calcium and
magnesium). A risk rating for each contaminant above the detection limit was then assigned based on the
Maximum Contaminant Level (MCL). The MCL is based on either Rhode Island or EPA drinking water
standards and advisory levels. The highest risk rating observed was used to set the total risk rating for the
WHPA. Risk factor 4 for Harrisville Fire District Replacement Well #1, Well #2 and Well #3 was set at
medium; No violations of the standards for regulated contaminants (excluding bacteria and nitrates) have been
identified. However, there have been detections below levels considered acceptable by USEPA. This indicates
the need for continued monitoring.
Although the risk rating is set at medium for the WHPA, low level detections of unregulated contaminant
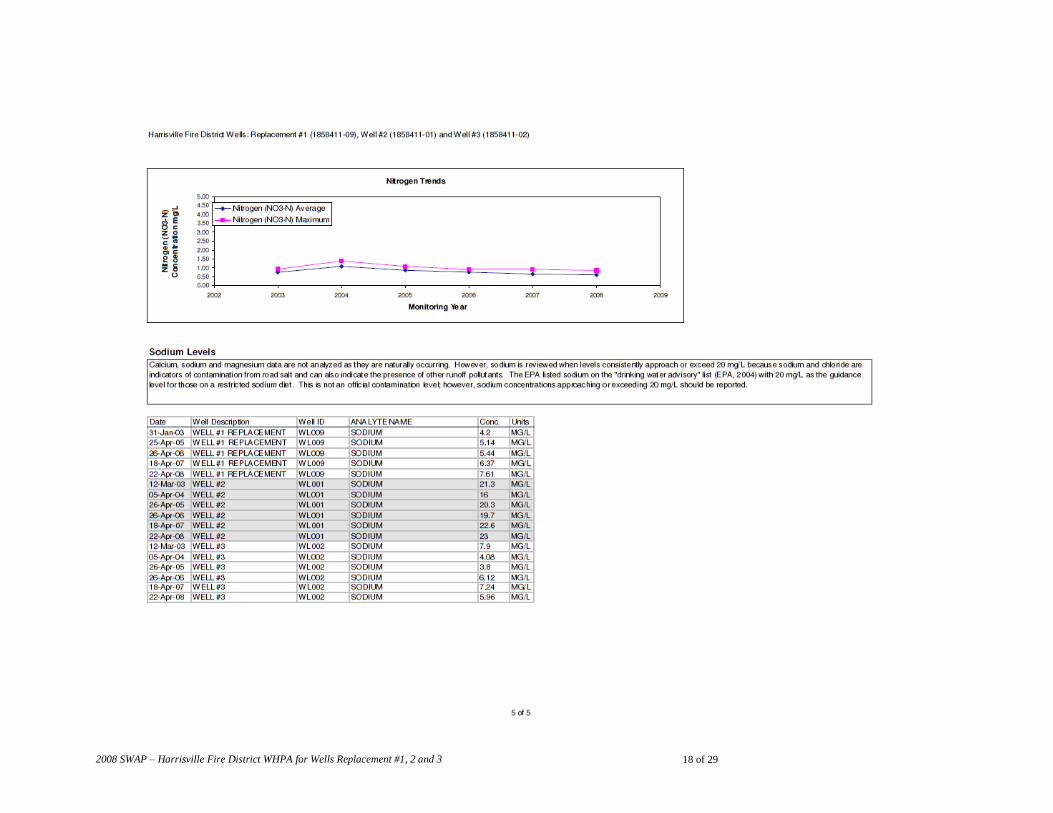
chlorodibromomethane have occurred, suggesting that the water supply is susceptible to contamination.
Additionally, sodium levels have exceeded 20 mg/L in Well #2 where the sodium levels ranged from 16 – 23
mg/L during the monitoring period. Sodium levels in Replacement Well #1 and Well #2 did not approach 20
mg/L. Calcium, sodium and magnesium data are not analyzed as contaminants (risk factor 4) as they are
naturally occurring. However, sodium is reviewed when levels consistently approach or exceed 20 mg/L
because sodium and chloride are indicators of contamination from road salt and can also indicate the presence
of other runoff pollutants. The EPA listed sodium on the ―drinking water advisory‖ list with 20 mg/L as the
guidance level for those on a restricted sodium diet (EPA 822-R-09-011, 2009 Edition of the Drinking Water
Standards and Health Advisories, October 2009). This is not an official contamination level; however, sodium
concentrations approaching or exceeding 20 mg/L should be reported.
Risk Factor 5 – Source Water Bacteria Detections within the last 5 years was determined by viewing all
available bacteria data for each well. The number of bacteria sample detections was used to determine the risk
Risk Indicator Rating (Score)
Low (0) Medium (5) High (10) Extreme (25)
2. Pollution sources within inner
protective radius (400 ft of 200 ft
of well)
0 1 (set by
default) 2-3 >3
3. Pollution sources per acre
throughout WHPA, excluding
inner protective radius (multiply by
10)
<0.1 0.1 - 0.5 (set
by default) 0.5 - 1 >1
2008 SWAP – Harrisville Fire District WHPA for Wells Replacement #1, 2 and 3 9 of 29
rating. Risk factor 5 for Harrisville Fire District Replacement Well #1, Well #2 and Well #3 was set at Low –
Bacteria have not been detected.
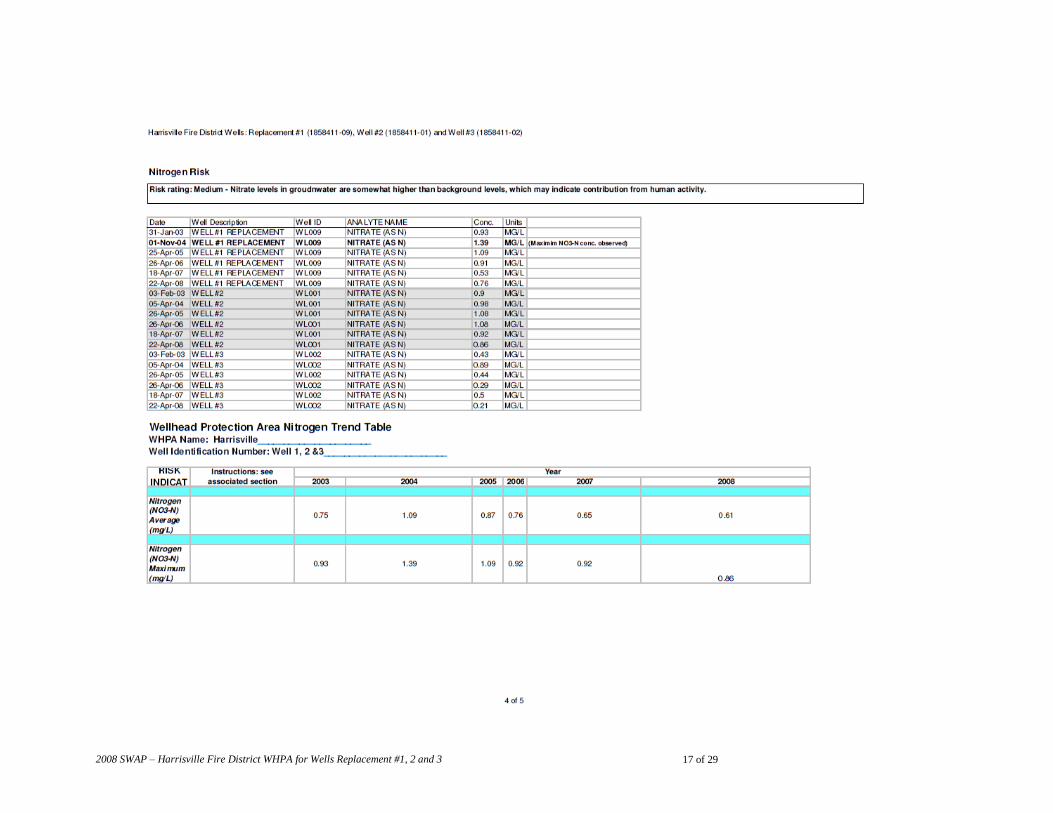
Risk Factor 6 – Maximum nitrate-nitrogen (NO3-N) concentration in the last 5 years was determined by
viewing all detections of nitrate-nitrogen in the laboratory record for all the wells in the WHPA. The maximum
observed nitrate-nitrogen value was 1.39 mg/L NO3-N. This nitrate-nitrogen value corresponds with a risk
rating of medium – nitrate levels in groundwater are somewhat higher than background levels, which may
indicate contribution from human activity.
The yearly maximum and average nitrogen values for the WHPA were plotted and the data reviewed for trends.
There does not appear to be an observable upward or downward trend in nitrate-nitrogen values in the WHPA.
*It is assumed for the purposes of the SWAP that if fecal coliform samples are found to be in violation that the
cause of the contamination was identified and corrected. Therefore, no bacterial samples are ranked in the
extreme category.
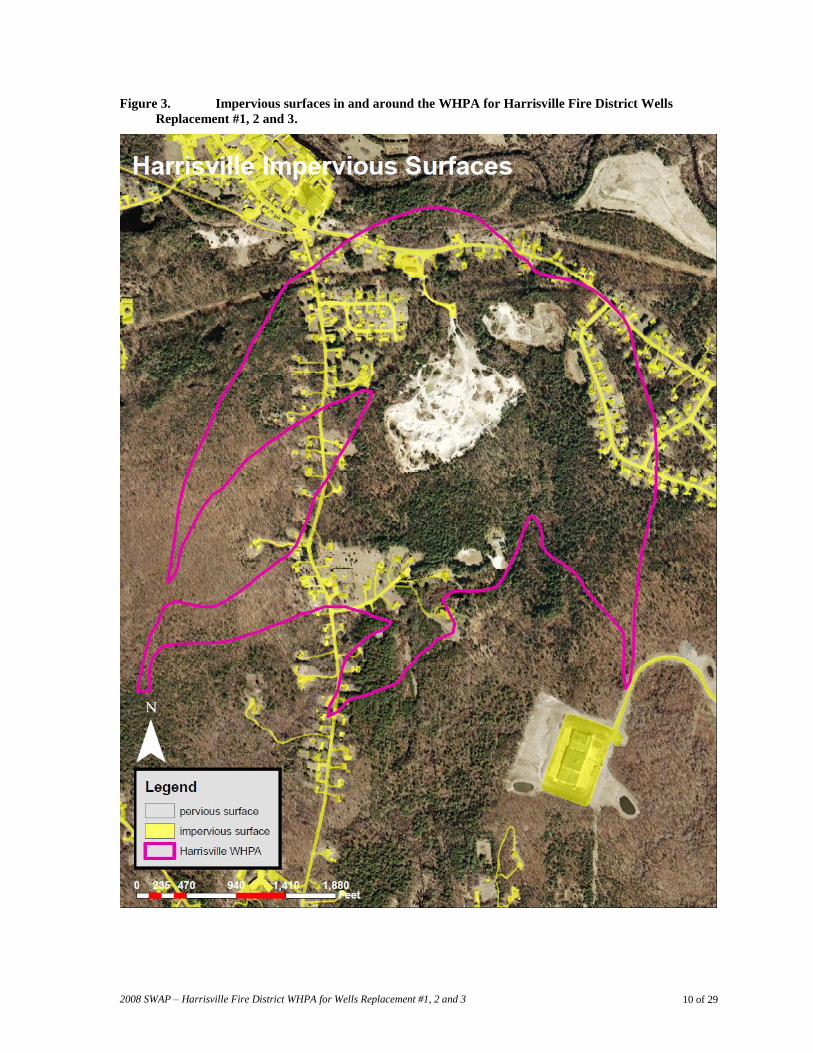
Additional Optional Assessment Steps: Impervious Surface Analysis
Although an impervious cover analysis is not included as a risk assessment indicator it is an important
consideration when performing a pollution risk assessment. A high amount of impervious surface generally is
associated with higher amounts of stormwater runoff. Stormwater runoff can transport harmful contaminants
into surface water bodies as it flows over impervious surfaces such as roads, parking lots and commercial
facilities. Impervious surfaces also impede precipitation from reaching groundwaters, reducing recharge. The
risk rating scale for percentage of impervious surface is as follows:
Impervious surface coverage for the WHPA protecting Harrisville Fire District Replacement Well #1, Well #2
and Well #3 was calculated in ArcView 9.3 (ESRI) using the Rhode Island Impervious Surface Coverage
available from RIGIS (Rhode Island Geographic Information System). The percentage of impervious surface
found in WHPA protecting Harrisville Fire District Replacement Well #1, Well #2 and Well #3 is 8%,
corresponding to a risk rating of low.
Risk Indicator Rating (Score)
Low (0) Medium (5) High (10) Extreme (25)
4. History of contaminant
detections within the last 5 years
Trace
(Maximum
value is less
than 10% of
MCL)
Less than ½
MCL
Greater than ½
MCL
Greater than
MCL
(violation)
5. Source water bacteria detections
within the last 5 years
Less than 5%
of samples
have detected
total coliform
Greater than
5% of samples
have detected
total coliform
One or more
Fecal coliform
samples exhibit
a detection
One or more
Fecal coliform
samples is
above water
quality
standards*
6. Maximum nitrate-nitrogen
(NO3-N) concentration in the last 5
years
< 0.5 mg/L
NO3-N 0.5-2 mg/L
NO3-N
2-5 mg/L
NO3-N
>5 mg/L
NO3-N
Risk Indicator Rating
Low Medium High Extreme
Percentage of impervious surface
in WHPA <10% 10-14% 15-25% >25%
2008 SWAP – Harrisville Fire District WHPA for Wells Replacement #1, 2 and 3 10 of 29
Figure 3. Impervious surfaces in and around the WHPA for Harrisville Fire District Wells
Replacement #1, 2 and 3.
2008 SWAP – Harrisville Fire District WHPA for Wells Replacement #1, 2 and 3 11 of 29
REFERENCES
Rhode Island Geographic Information Systems (RIGIS), Geospatial Data, Available at
http://www.edc.uri.edu/RIGIS/.
Rhode Island Department of Health, 2007, Sanitary Survey Report for the Westerly Water Department.
Obtained from Rhode Island Department of Health.
Rhode Island Department of Health and URI NEMO Program, 2010, Guide to Updating Source Water
Assessments and Protection Plans.
Rhode Island and Providence Plantations, Rules and Regulations Pertaining to public Drinking Water, as
Amended April 2009, R46-13-DWQ
USEPA National Primary Drinking Water Regulations (Factsheet), EPA 816-F-09-004, May 2009
2009 Edition of the Drinking Water Standards and Health Advisories, October 2009, EPA 822-R-09-011
2008 SWAP – Harrisville Fire District WHPA for Wells Replacement #1, 2 and 3 12 of 29
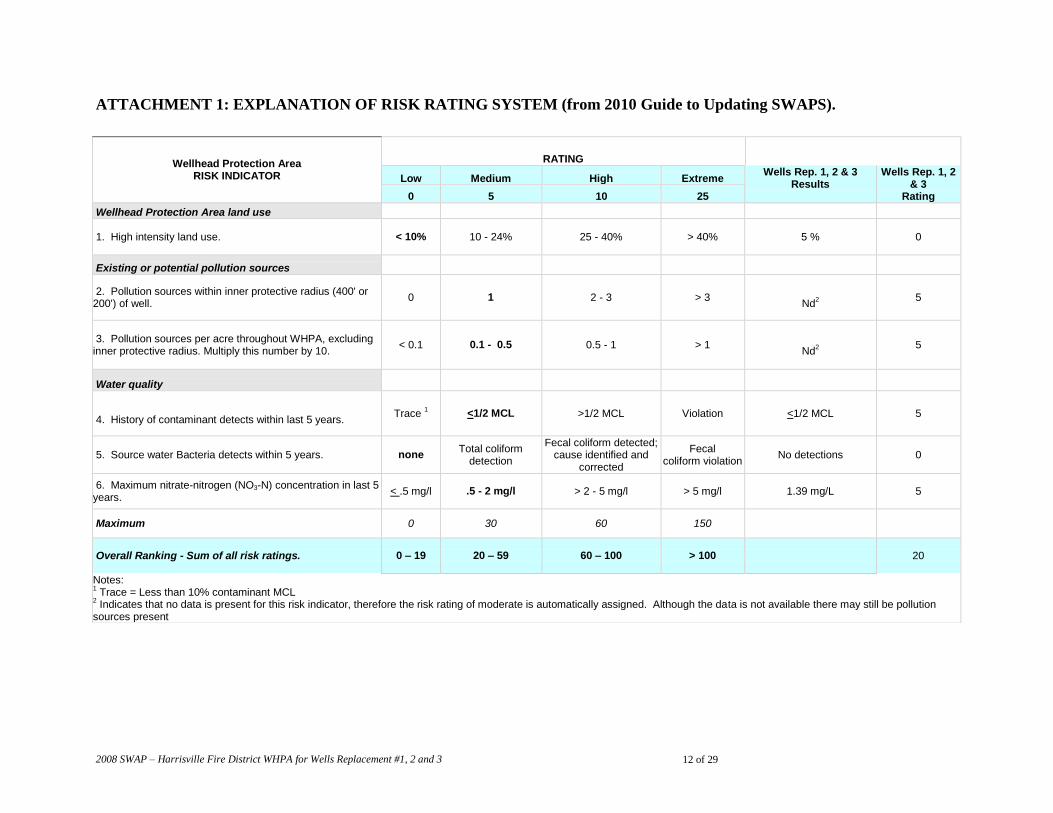
ATTACHMENT 1: EXPLANATION OF RISK RATING SYSTEM (from 2010 Guide to Updating SWAPS).
Wellhead Protection Area RISK INDICATOR
RATING
Low Medium High Extreme Wells Rep. 1, 2 & 3
Results Wells Rep. 1, 2
& 3 Rating 0 5 10 25
Wellhead Protection Area land use
1. High intensity land use. < 10% 10 - 24% 25 - 40% > 40% 5 % 0
Existing or potential pollution sources
2. Pollution sources within inner protective radius (400' or 200') of well.
0 1 2 - 3
> 3
Nd
2
5
3. Pollution sources per acre throughout WHPA, excluding inner protective radius. Multiply this number by 10.
< 0.1 0.1 - 0.5 0.5 - 1 > 1
Nd2
5
Water quality
4. History of contaminant detects within last 5 years.
Trace 1 <1/2 MCL >1/2 MCL Violation <1/2 MCL
5
5. Source water Bacteria detects within 5 years. none Total coliform
detection
Fecal coliform detected; cause identified and
corrected
Fecal coliform violation
No detections 0
6. Maximum nitrate-nitrogen (NO3-N) concentration in last 5 years.
< .5 mg/l .5 - 2 mg/l > 2 - 5 mg/l > 5 mg/l 1.39 mg/L
5
Maximum 0 30 60 150
Overall Ranking - Sum of all risk ratings. 0 – 19 20 – 59 60 – 100 > 100 20
Notes: 1 Trace = Less than 10% contaminant MCL
2 Indicates that no data is present for this risk indicator, therefore the risk rating of moderate is automatically assigned. Although the data is not available there may still be pollution
sources present
2008 SWAP – Harrisville Fire District WHPA for Wells Replacement #1, 2 and 3 13 of 29
ATTACHMENT 2: DEPARTMENT OF HEALTH RECORDS FOR
CONTAMINANTS, BACTERIA, AND NITRATES
2008 SWAP – Harrisville Fire District WHPA for Wells Replacement #1, 2 and 3 14 of 29
2008 SWAP – Harrisville Fire District WHPA for Wells Replacement #1, 2 and 3 15 of 29
2008 SWAP – Harrisville Fire District WHPA for Wells Replacement #1, 2 and 3 16 of 29
2008 SWAP – Harrisville Fire District WHPA for Wells Replacement #1, 2 and 3 17 of 29
2008 SWAP – Harrisville Fire District WHPA for Wells Replacement #1, 2 and 3 18 of 29
2008 SWAP – Harrisville Fire District WHPA for Wells Replacement #1, 2 and 3 19 of 29
ATTACHMENT 3: RIDOH WAIVER
2008 SWAP – Harrisville Fire District WHPA for Wells Replacement #1, 2 and 3 20 of 29
2008 SWAP – Harrisville Fire District WHPA for Wells Replacement #1, 2 and 3 21 of 29
2008 SWAP – Harrisville Fire District WHPA for Wells Replacement #1, 2 and 3 22 of 29
2008 SWAP – Harrisville Fire District WHPA for Wells Replacement #1, 2 and 3 23 of 29
2008 SWAP – Harrisville Fire District WHPA for Wells Replacement #1, 2 and 3 24 of 29
2008 SWAP – Harrisville Fire District WHPA for Wells Replacement #1, 2 and 3 25 of 29
2008 SWAP – Harrisville Fire District WHPA for Wells Replacement #1, 2 and 3 26 of 29
2008 SWAP – Harrisville Fire District WHPA for Wells Replacement #1, 2 and 3 27 of 29
2008 SWAP – Harrisville Fire District WHPA for Wells Replacement #1, 2 and 3 28 of 29
2008 SWAP – Harrisville Fire District WHPA for Wells Replacement #1, 2 and 3 29 of 29
Recommended