www.distell.co.za
annual report
2007
Distell A
nn
ual R
epo
rt 2007

Distell Annual Report 2007Distell Annual Report 2007
Dates of importance to shareholders
Annual general meeting October 2007
Financial reports Interim report February 2008
Preliminary announcement of annual results August 2008
Annual financial statements September 2008
Ordinary dividends Interim dividends
– declaration February 2008
– payable March 2008
Final dividends
– declaration August 2008
– payable September 2008
Administration
Distell Group Limited Incorporated in the Republic of South Africa
(Registration number: 1988/005808/06)
ISIN: ZAE000028668
JSE share code: DST
Company secretary CJ Cronjé
Registered office Aan-de-Wagen Road, Stellenbosch 7600
PO Box 184, Stellenbosch 7599
Telephone: 021 809 7000
Facsimile: 021 886 4611
E-mail: [email protected]
Transfer secretaries Computershare Investor Services 2004 (Proprietary) Limited
70 Marshall Street, Johannesburg 2001
PO Box 61051, Marshalltown 2107
Telephone: 011 370 7700
Facsimile: 011 688 5221
Auditors PricewaterhouseCoopers Inc.
Stellenbosch
Listing JSE Limited
Sector: Consumer Goods – Food and Beverage – Beverages
Sponsor Rand Merchant Bank (A division of FirstRand Bank Limited)
Websitewww.distell.co.za
COMPRESS ) 3460
CONTENTS
Features
Our Group 3
Annual highlights 4
How we’ve measured up 5
Our brands at a glance 8
Our global presence 10
Board matters 12
Seven-year fi nancial review 15
Analysis of shareholders 18
Cash value added statement 19
Reviews
Chairman’s statement 20
Managing director’s report 24
Corporate
Corporate governance 32
Sustainability report 37
Financials
Consolidated annual fi nancial statements 52
Notice to shareholders, voting form,
dates of importance and administration 102
DISTELLANNUAL REPORT
2007

1Distell Annual Report 2007
we craftgreat brands

2 Distell Annual Report 2007
Our culture
Who we areAfrica’s leading producer and marketer of fi ne wines,
spirits, ciders and ready-to-drinks (RTDs).
Our visionA great company rooted in South Africa crafting
leading liquor brands for people to enjoy at every
occasion the world over.
We turn into assets.
At Distell, we create brands quite literally from the ground up.
Each brand starts as a tiny seed – or a germ of an idea – and is then crafted and nurtured to its fi nal
perfection through years of care and dedication. We harvest the raw materials from the earth, blend it
with our own passion and shape it into brands that have become icons of companionship, relaxation
and celebration . . . Th at’s why we’re Brandcrafters.
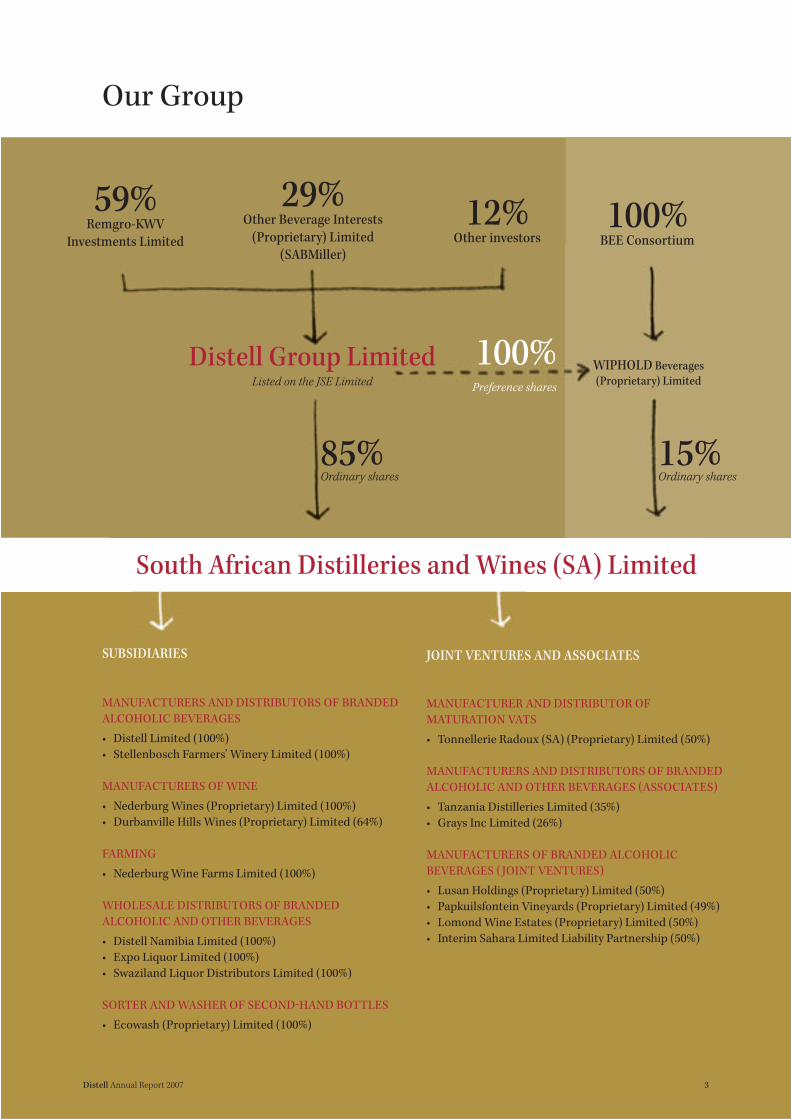
59% Remgro-KWV
Investments Limited
Distell Group Limited Listed on the JSE Limited
Our Group
29%Other Beverage Interests
(Proprietary) Limited
(SABMiller)
12%Other investors
85%Ordinary shares
South African Distilleries and Wines (SA) Limited
100%Preference shares
MANUFACTURERS AND DISTRIBUTORS OF BRANDED
ALCOHOLIC BEVERAGES
• Distell Limited (100%)
• Stellenbosch Farmers’ Winery Limited (100%)
MANUFACTURERS OF WINE
• Nederburg Wines (Proprietary) Limited (100%)
• Durbanville Hills Wines (Proprietary) Limited (64%)
FARMING
• Nederburg Wine Farms Limited (100%)
WHOLESALE DISTRIBUTORS OF BRANDED
ALCOHOLIC AND OTHER BEVERAGES
• Distell Namibia Limited (100%)
• Expo Liquor Limited (100%)
• Swaziland Liquor Distributors Limited (100%)
SORTER AND WASHER OF SECOND-HAND BOTTLES
• Ecowash (Proprietary) Limited (100%)
MANUFACTURER AND DISTRIBUTOR OF
MATURATION VATS
• Tonnellerie Radoux (SA) (Proprietary) Limited (50%)
MANUFACTURERS AND DISTRIBUTORS OF BRANDED
ALCOHOLIC AND OTHER BEVERAGES (ASSOCIATES)
• Tanzania Distilleries Limited (35%)
• Grays Inc Limited (26%)
MANUFACTURERS OF BRANDED ALCOHOLIC
BEVERAGES ( JOINT VENTURES)
• Lusan Holdings (Proprietary) Limited (50%)
• Papkuilsfontein Vineyards (Proprietary) Limited (49%)
• Lomond Wine Estates (Proprietary) Limited (50%)
• Interim Sahara Limited Liability Partnership (50%)
JOINT VENTURES AND ASSOCIATESSUBSIDIARIES
100%BEE Consortium
WIPHOLD Beverages
(Proprietary) Limited
15%Ordinary shares
3Distell Annual Report 2007

4 Distell Annual Report 2007
Annual highlights
Financial results (R’000) % change 2007 2006
Revenue 18,4 7 954 602 6 717 210
Trading income 25,3 1 114 733 889 395
Headline earnings 45,4 779 294 535 970
Adjusted headline earnings 29,2 779 294 603 211
Total assets 9,5 5 997 095 5 475 078
Share performance (cents) % change 2007 2006
Headline earnings 44,2 391,5 271,5
Adjusted headline earnings 28,1 391,5 305,6
Dividends 28,1 196,0 153,0
Net asset value 18,4 1 972,7 1 666,6
Cash fl ow from operating activities 19,8 407,8 340,5
Closing share price 38,8 5 415,0 3 900,0
Financial statistics 2007 2006
Return on equity (excluding BEE* share-based payment) 19,8 16,2
Seven-year compound growth per annum (%) 2007 2006
Total return to shareholders 34,3 29,8
Distell share price index 29,8 25,2
* BEE: black economic empowerment
Headline earnings per share
Salient features
Total revenue
Dividend per share
Total sales volumes
Trading income
Headline earnings per share, excluding non-recurring BEE expense in the previous year,

5Distell Annual Report 2007
How we’ve measured up
Objectives
Strategic priorities
• Growing Amarula’s position globally
• Building on our position as a profi table
and leading South African wine exporter
• Consolidating our position as a
domestic market leader
• Expanding our global footprint through
exploring new markets, and increasing our
focus on our operations in Africa
• Continuing on our path as a
responsible corporate citizen
• Creating shareholder value
• Accelerating transformation
A sense of ownership
Each and every one of us will be
aware of our contribution.
Performance-driven culture
We will challenge each other to ensure
continuous improvement by creating
more, better and faster.
What we stand for (our values)
Respect for the individual
We will respect each other’s diversity
and contribute to the communities
in which we live. We will promote the
responsible use of alcohol.
Entrepreneurial spirit
We will give each other the freedom
to explore and create.
Customer service orientation
We will delight our customers and
consumers everywhere.
6 Distell Annual Report 2007
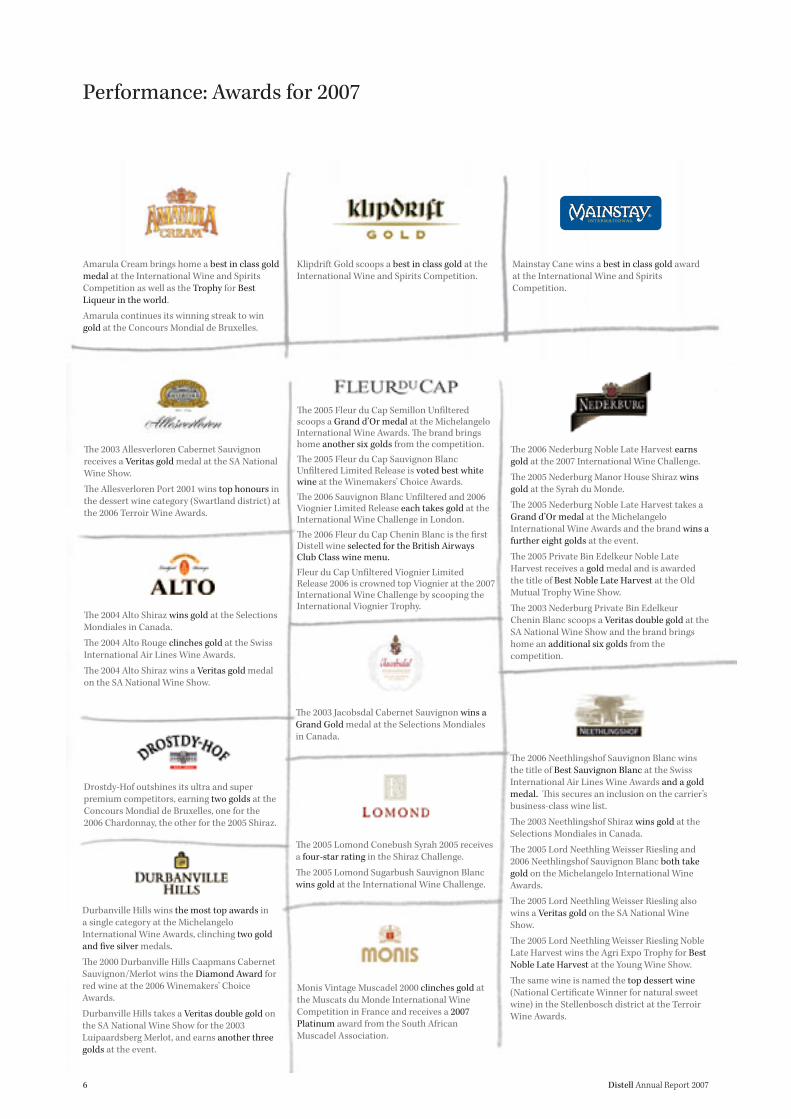
Performance: Awards for 2007
Th e 2003 Jacobsdal Cabernet Sauvignon wins a Grand Gold medal at the Selections Mondiales in Canada.
Th e 2005 Lomond Conebush Syrah 2005 receives a four-star rating in the Shiraz Challenge.
Th e 2005 Lomond Sugarbush Sauvignon Blanc wins gold at the International Wine Challenge.
Monis Vintage Muscadel 2000 clinches gold at the Muscats du Monde International Wine Competition in France and receives a 2007 Platinum award from the South African Muscadel Association.
Th e 2006 Nederburg Noble Late Harvest earns gold at the 2007 International Wine Challenge.
Th e 2005 Nederburg Manor House Shiraz wins gold at the Syrah du Monde.
Th e 2005 Nederburg Noble Late Harvest takes a Grand d’Or medal at the Michelangelo International Wine Awards and the brand wins a further eight golds at the event.
Th e 2005 Private Bin Edelkeur Noble Late Harvest receives a gold medal and is awarded the title of Best Noble Late Harvest at the Old Mutual Trophy Wine Show.
Th e 2003 Nederburg Private Bin Edelkeur Chenin Blanc scoops a Veritas double gold at the SA National Wine Show and the brand brings home an additional six golds from the competition.
Th e 2006 Neethlingshof Sauvignon Blanc wins the title of Best Sauvignon Blanc at the Swiss International Air Lines Wine Awards and a gold medal. Th is secures an inclusion on the carrier’s business-class wine list.
Th e 2003 Neethlingshof Shiraz wins gold at the Selections Mondiales in Canada.
Th e 2005 Lord Neethling Weisser Riesling and 2006 Neethlingshof Sauvignon Blanc both take gold on the Michelangelo International Wine Awards.
Th e 2005 Lord Neethling Weisser Riesling also wins a Veritas gold on the SA National Wine Show.
Th e 2005 Lord Neethling Weisser Riesling Noble Late Harvest wins the Agri Expo Trophy for Best Noble Late Harvest at the Young Wine Show.
Th e same wine is named the top dessert wine (National Certifi cate Winner for natural sweet wine) in the Stellenbosch district at the Terroir Wine Awards.
Th e 2003 Allesverloren Cabernet Sauvignon receives a Veritas gold medal at the SA National Wine Show.
Th e Allesverloren Port 2001 wins top honours in the dessert wine category (Swartland district) at the 2006 Terroir Wine Awards.
Th e 2004 Alto Shiraz wins gold at the Selections Mondiales in Canada.
Th e 2004 Alto Rouge clinches gold at the Swiss International Air Lines Wine Awards.
Th e 2004 Alto Shiraz wins a Veritas gold medal on the SA National Wine Show.
Th e 2005 Fleur du Cap Semillon Unfi ltered scoops a Grand d’Or medal at the Michelangelo International Wine Awards. Th e brand brings home another six golds from the competition.
Th e 2005 Fleur du Cap Sauvignon Blanc Unfi ltered Limited Release is voted best white wine at the Winemakers’ Choice Awards.
Th e 2006 Sauvignon Blanc Unfi ltered and 2006 Viognier Limited Release each takes gold at the International Wine Challenge in London.
Th e 2006 Fleur du Cap Chenin Blanc is the fi rst Distell wine selected for the British Airways Club Class wine menu.
Fleur du Cap Unfi ltered Viognier Limited Release 2006 is crowned top Viognier at the 2007 International Wine Challenge by scooping the International Viognier Trophy.
Drostdy-Hof outshines its ultra and super premium competitors, earning two golds at the Concours Mondial de Bruxelles, one for the 2006 Chardonnay, the other for the 2005 Shiraz.
Durbanville Hills wins the most top awards in a single category at the Michelangelo International Wine Awards, clinching two gold and fi ve silver medals.
Th e 2000 Durbanville Hills Caapmans Cabernet Sauvignon/Merlot wins the Diamond Award for red wine at the 2006 Winemakers’ Choice Awards.
Durbanville Hills takes a Veritas double gold on the SA National Wine Show for the 2003 Luipaardsberg Merlot, and earns another three golds at the event.
Amarula Cream brings home a best in class gold medal at the International Wine and Spirits Competition as well as the Trophy for Best Liqueur in the world.
Amarula continues its winning streak to win gold at the Concours Mondial de Bruxelles.
Klipdrift Gold scoops a best in class gold at the International Wine and Spirits Competition.
Mainstay Cane wins a best in class gold award at the International Wine and Spirits Competition.

7Distell Annual Report 2007
Plaisir de Merle stands out at the Swiss International Air Lines Wine Awards, where the 2006 Chardonnay is judged both the top white wine on the show, and the best Chardonnay. Th ey also clinch an overall gold medal for the vintage. Th e wine is chosen by the carrier to serve to fi rst-class passengers.
Th e Pongracz Magnum and Desiderius 2001 both win Veritas gold at the SA National Wine Show.
Desiderius 2001 is crowned top South African sparkling wine at the WINE Magazine Amorim Cork Cap Classique Challenge.
Th e 2001 Stellenzicht Syrah wins a gold medal at the inaugural Syrah du Monde and outclasses all the other South African producers as the only local contestant amongst the competition’s ten best wines.
Th e 2001 Syrah also earns gold at the Selections Mondiales in Canada.
Stellenzicht’s 2002 Syrah and 2005 Golden Triangle Pinotage both bring home gold from the Swiss International Air Lines Wine Awards.
Th e 2003 Golden Triangle Shiraz is selected for SAA’s fi rst and business-class wine lists on board intercontinental fl ights.
Stellenzicht wins a Veritas gold at the SA National Wine Show with the Golden Triangle Cabernet Sauvignon 2001.
Th e 2005 Pinotage Golden Triangle is included on the Absa Top 10 Pinotage list.
Th e 2004 Tukulu Pinotage is selected for the Absa Top Ten Pinotage line-up, a fourth such inclusion for Tukulu.
Th e 2005 Tukulu Chenin Blanc is named top white wine (Swartland district) at the 2006 Terroir Awards.
Th e Uitkyk Reserve Sauvignon Blanc 2005 is named the top Sauvignon Blanc in the Stellenbosch district and top white wine (Simonsberg-Stellenbosch ward) at the Terroir Wine Awards.
Oude Meester earns two golds at the Concours Mondial de Bruxelles, one for the 12 Year Old Reserve and the other for the Peppermint Liqueur.
Th e Ginger Liqueur wins a best in class gold medal at the International Wine and Spirits Competition.
Oude Meester Reserve also clinches a gold at the International Spirits Challenge.
Th e Th ree Ships 10 Year Old Single Malt Whisky achieves a best in class gold award at the International Wine and Spirits Competition.
Th ree Ships 5 Year Old Whisky wins gold at the Concours Mondial de Bruxelles.
Van Ryn’s 10 Year Old wins a best in class gold medal at the International Wine and Spirits Competition.
Van Ryn’s Collection Reserve 12 Year Old and 10 Year Old vintages scoop gold at the Concours Mondial de Bruxelles.
Van Ryn’s 10 Year Old continues to win best in class gold at the International Spirits Challenge.
• ISO 9001:2000 certifi cation at all our distilleries,
wineries, secondary production sites, distribution
centres and brand homes in the Republic of South
Africa. Distell Namibia Windhoek and Walvis Bay
are also included in the ISO 9001:2000
certifi cation. Distell’s ISO 9001:2000 certifi cation,
which is valid until November 2008, includes the
corporate functions quality management and
research, group purchasing, logistics, technical
services, export logistics and group human
resource management.
• Hazard Analysis and Critical Control Points
(HACCP) certifi cation at the majority of our
wineries and secondary production sites.
Accreditation and certifi cation as at 30 June 2007
Worcester Distillery is the fi rst distillery to be
listed for HACCP.
• ISO 17025 accreditation of Distell’s central
laboratory at Adam Tas cellar.
• International Food Standards higher-level
certifi cation at Adam Tas.
• British Retail Consortium (BRC) food safety
certifi cation of Adam Tas, Bergkelder, J.C. Le Roux
and Nederburg wineries, Durbanville Hills, Paarl
and Green Park. During this fi nancial year BRC
certifi cation was given to Plaisir de Merle, while all
the sites previously certifi ed retained their status.
• ISO 14001:2004 certifi cation of Durbanville Hills
and Nederburg. Plaisir de Merle and Bergkelder
have been assessed and recommended for listing.
• Integrated Production of Wine certifi cation of all
Distell and Lusan farms and the winemaking
cellars.
• Wine and Agricultural Ethical Trade Association
certifi cation of Worcester/Robertson, Goudini,
Wellington and Van Ryn Distilleries.
• Organic certifi cation for certain vineyards at
Papkuilsfontein and Plaisir de Merle. Nederburg
cellar has been certifi ed to produce organic wines.
Mellow-Wood 5 Year old wins a gold medal at the International Spirits Challenge.

8 Distell Annual Report 2007
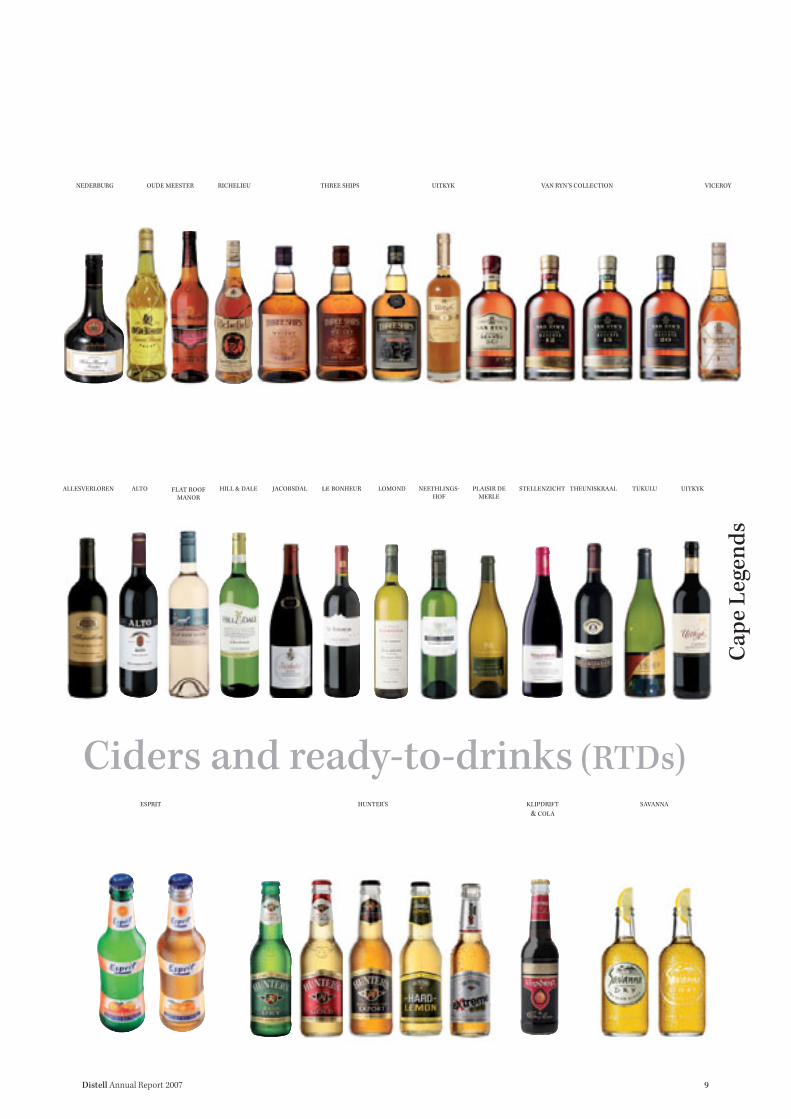
Our brands at a glance
Spirits
Wines
Do
mes
tic
Inte
rna
tio
na
l
AMARULA COUNT PUSHKIN
COLLISON’SWHITE GOLD
MAINSTAYCOMMANDO MELLOW-WOODKLIPDRIFTFLIGHT OF THEFISH EAGLE
AUTUMN HARVEST
CELLAR CASK
CHATEAU LIBERTAS
GRAÇA GRÜNBERGER J.C. LE ROUX SEDGWICK’S OLD
BROWN SHERRY
PAARL PERLÉ PONGRÁCZ TASSENBERG ZONNEBLOEM
DROSTDY-HOF DURBANVILLE HILLS
FLEUR DU CAP NEDERBURG OBIKWA TWO OCEANS
9Distell Annual Report 2007
Ciders and ready-to-drinks (RTDs)C
ap
e L
egen
ds
HILL & DALE le BONHEUR LOMOND TUKULUNEETHLINGS-HOF
PLAISIR DE MERLE
STELLENZICHT UITKYKALTOALLESVERLOREN THEUNISKRAALJACOBSDALFLAT ROOF MANOR
ESPRIT SAVANNAHUNTER’S KLIPDRIFT
& COLA
OUDE MEESTER RICHELIEU VAN RYN’S COLLECTION VICEROYTHREE SHIPSNEDERBURG UITKYK

Our global presence
Year-on-year growth
Trend Amarula Wine
Volume +31% +17%
Value +67% +30%
% of total exports 4% 3%Asia Pacifi c
Trend Amarula Wine
Volume +20% +1%
Value +54% +27%
% of total exports 25% 40%Europe
Trend Amarula Wine
Volume +34% +14%
Value +45% +21%
% of total exports 28% 46%
Trend Amarula Wine
Volume +12% +12%
Value +29% +29%
% of total exports 20% 9%North America
Africa (including BLNS*)
Trend Amarula Wine
Volume +52% +23%
Value +69% +27%
% of total exports 20% 1%Latin America
Trend
Volume Value
% of total export volumes
Total exports
* BLNS: Botswana, Lesotho, Namibia and Swaziland
10 Distell Annual Report 2007
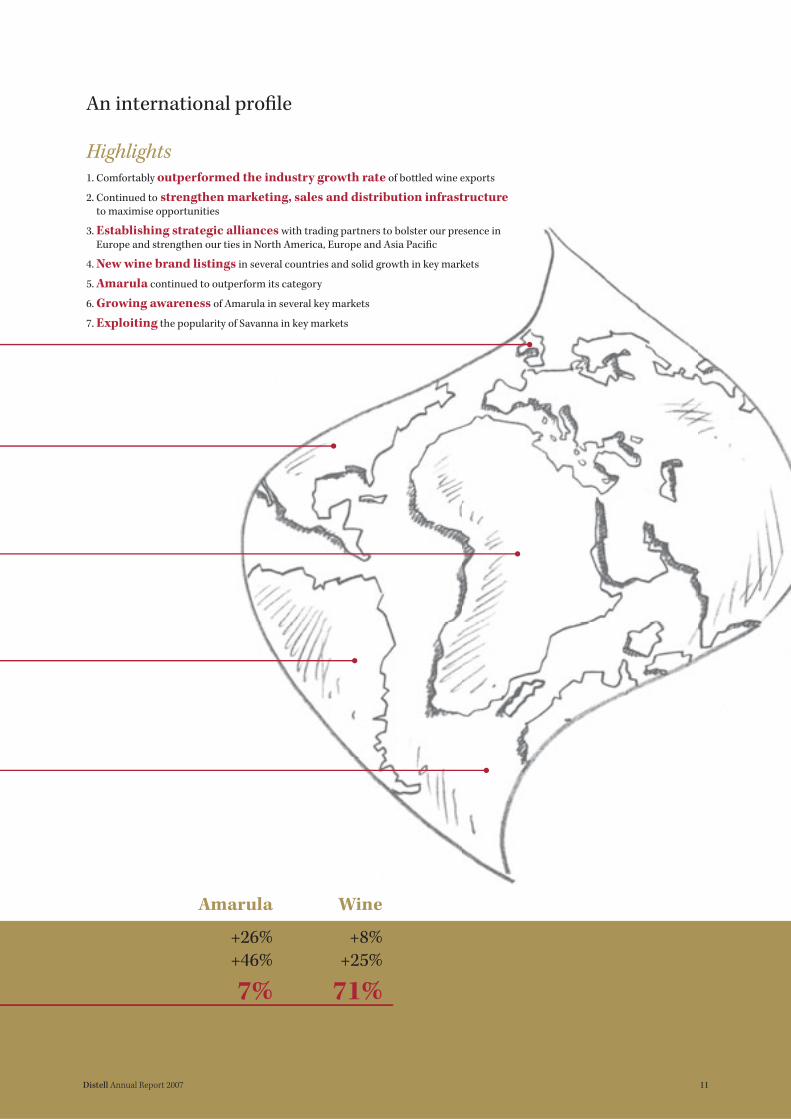
Highlights1. Comfortably outperformed the industry growth rate of bottled wine exports
2. Continued to strengthen marketing, sales and distribution infrastructure to maximise opportunities
3. Establishing strategic alliances with trading partners to bolster our presence in Europe and strengthen our ties in North America, Europe and Asia Pacifi c
4. New wine brand listings in several countries and solid growth in key markets
5. Amarula continued to outperform its category
6. Growing awareness of Amarula in several key markets
7. Exploiting the popularity of Savanna in key markets
An international profi le
Amarula Wine
+26% +8%+46% +25%
7% 71%
11Distell Annual Report 2007

12 Distell Annual Report 2007
Board matters
Board of directors
Duimpie Bayly*
Director of Duimpie Bayly & Associates,
technical consultant and adviser to the
wine industry. Attended 6 of 6 board
meetings.
Peter Bester*
Director of Agrinet, Dorbyl and South
African Property Opportunities Plc,
amongst others. He was formerly executive
chairperson of Cadbury Schweppes (SA)
until retiring in 2001. Attended 6 of 6
board meetings and 3 of 3 remuneration
committee meetings.
Piet Beyers
Director of Remgro and Unilever Bestfoods
Robertsons (Holdings) LLC. Attended 6
of 6 board meetings.
Merwe Botha#
Financial director
Attended 6 of 6 board meetings.
Johan Carinus*
Wine farmer and director of Het Jan
Marais Fund and Zeder Investments.
Attended 6 of 6 board meetings.
Smartie Genade#
Business director: Wines
Attended 6 of 6 board meetings.
Jakes Gerwel*
Chancellor of Rhodes University, non-
executive director of Naspers and Old
Mutual, non-executive chairperson of
Brimstone Investment Corporation,
Africon Engineering International, Life
Healthcare, Media 24 and South African
Airways. He chairs the boards of trustees
of the Nelson Mandela Foundation, the
Mandela Rhodes Foundation and the
Human Sciences Research Council,
amongst others and is vice chairperson of
the Peace Parks Foundation. Attended 2
of 6 board meetings.
Dr Edwin de la H Hertzog
Chairperson of Medi-Clinic Corporation,
non-executive deputy chairperson of
Remgro, non-executive director of Total
(SA) and Trans Hex Group as well as
Chair of Council, Stellenbosch University.
Attended 6 of 6 board meetings.
Robert Lumb*
Independent non-executive director of
New Clicks Holdings, Metje & Ziegler and
HomeChoice Holdings. He was formerly
managing partner, Western Cape, of Ernst
& Young. Attended 3 of 4 board meetings
and 2 of 2 audit committee meetings since
joining the board on 19 October 2006.
Joe Madungandaba*
Chief executive offi cer of Community
Investment Holdings. Executive director
of Jasco Electronic Holdings and
non-executive director of Air Liquide
Healthcare. Attended 3 of 6 board
meetings.
Louisa Mojela*
A founder and group chief executive offi cer
of Women Investment Portfolio Holdings
(WIPHOLD). Serves on the boards of Sun
International, ABB SA, South African
Airways and the Financial Services
Board, amongst others. Attended 5 of 6
board meetings and 3 of 3 remuneration
committee meetings.
Gugu Mthethwa*
Investment executive at WIPHOLD and
non-executive board member of ABB SA,
MCG Industries and Landis+Gyr. Attended
6 of 6 board meetings and 4 of 4 audit
committee meetings.
David Nurek*
Regional chairperson of Investec Western
Cape, chairperson of New Clicks Holdings
and Lewis Group, deputy chairperson
of Foschini and, amongst others, also a
director of Pick ’n Pay, Aspen Pharmacare,
Sun International and Trencor. Attended
6 of 6 board meetings, 4 of 4 audit
committee meetings and 3 of 3
remuneration committee meetings.
Jan Scannell#
Managing director
Attended 6 of 6 board meetings.
Peter Swartz*
Proprietor of Swartz Properties and
Southern Pumps and also a director
of Absa Group, Absa Bank and Sun
International. Attended 6 of 6 board
meetings and 3 of 3 remuneration
committee meetings.
Th ys Visser
Chief executive offi cer of Remgro and also
a director of Rainbow Chicken, Nampak,
British American Tobacco Plc, Medi-
Clinic Corporation, Unilever Bestfoods
Robertsons (Holdings) LLC. Attended 5
of 6 board meetings, 3 of 4 audit
committee meetings and 2 of 3
remuneration committee meetings.
* Independent
# Executive

13Distell Annual Report 2007
Jan Scannell (56)
Managing director
BCom, LLB
Jan joined Distillers Corporation in 1979.
He was appointed a director in 1988, and
managing director in 1994. In December
2000, he was appointed managing director
of Distell. Jan’s role is to ensure the
company delivers on its key objectives. He
is also responsible for building a high-
performance culture within the company.
Merwe Botha (54)
Financial director
BCom Hons (Taxation), BCompt Hons,
CA(SA)
Merwe joined Distillers Corporation
in 1980. He was appointed fi nancial
director in 1997 and to his present
position at Distell in December 2000. He
is responsible for fi nancial planning and
control, information technology, statutory
reporting and internal auditing.
Stoff el Cronjé (53)
Company secretary and corporate
development director
MA
Stoff el joined Distillers Corporation in
1980. He was appointed group company
secretary and human resources director
in 1990 and to his present position at
Distell in December 2000. He performs all
statutory company secretarial functions
and is also responsible for the company’s
human resources, legal, corporate aff airs
and corporate strategy planning divisions.
Don Gallow (49)
International director
Don joined Distillers Corporation in 1986.
He was appointed Distell’s international
director in 2005 and is responsible for
growing our international revenue by
providing superior service to existing
customers and obtaining new listings.
Smartie Genade (56)
Business director: Wines
BCom (Hons), MBA
Smartie joined Stellenbosch Farmers’
Winery in1972, was appointed director
of the company in 1988 and managing
director in 2000. He was appointed
operations director at Distell in December
2000, assuming his present position in
2004. He is responsible for the profi tability
and sustainability of Distell’s wine
interests.
Hennie Heÿl (61)
Primary production director
MSc Agric
Hennie joined Distillers Corporation in
1974, was appointed technical director
in 1988 and production director in 1997.
He took up his present position at Distell
in December 2000. He is responsible for
our farms; grape, wine, brandy and other
raw material procurement; distillation,
winemaking and blending.
Gert Loubser (59)
Quality management and research director
MSc, PhD
Gert joined Stellenbosch Farmers’ Winery
in 1974, was appointed research and
development director in 1994 and to his
present position at Distell in December
2000. His role is to ensure total quality
management is implemented throughout
the Group and that ongoing research leads
to new products and processes.
Nantha Moodley (48)
Business director: Ciders and RTDs
BA, NDip
Nantha joined Stellenbosch Farmers’
Winery in 1989 and has over 15 years’
experience in sales, training and
distribution. He was appointed to his
current position in November 2004 and
is responsible for the profi tability and
sustainability of Distell’s business in the
cider and ready-to-drink (RTD) categories.
Malcolm Searle (47)
Marketing director
BCom (Hons)
Malcolm joined Distell as marketing
director in January 2004 with almost
20 years’ experience in fast-moving
consumer goods, working as a marketing
executive in several countries worldwide.
He is responsible for building strong brand
portfolios based on market strategies that
leverage consumer insights and drive
innovation.
Caroline Snyman (32)
Business director: Spirits
BEng (Chemical), MSc, PhD, CWM
Caroline joined Distell in January 2000
as technical manager: spirits and was
appointed to her current position in
November 2004. She is responsible for the
profi tability and sustainability of Distell’s
spirits interests.
Tim Tarr (49)
Sales director
Tim joined Distillers Corporation in 1979
and was appointed national sales director
in 1995. He took up his present position
at Distell in December 2000. His role is to
ensure we retain and improve our market
leadership in South Africa, Botswana,
Lesotho, Namibia and Swaziland and he
oversees all our sales forces operating in
these areas.
Valerio Toros (43)
Operations director
BEng (Mech), MBA
Valerio joined Distillers Corporation in
1991 as project engineer. After overseeing
the SFW/Distillers merger, he was made
group manager of business process
improvement (BPI), and then appointed
BPI director at the end of 2003. He took
up his present position in November
2004 and oversees the operations of the
Group, including packaging, distribution,
technical services, procurement and
supply chain management.
Executive management

14 Distell Annual Report 2007
Klipdrift, South Africa’s best-selling
brandy is synonymous with generosity and
hospitality. No matter where you are, open a bottle
of Klipdrift and make yourself at home.

15Distell Annual Report 2007
Seven-year fi nancial reviewfor the years ended 30 June
Balance sheets (R’000)AssetsNon-current assets
Property, plant and equipment 1 330 516 1 256 900 1 223 036 1 225 351 1 197 900 1 139 182 1 022 442
Biological assets 114 675 104 380 107 170 98 939 94 585 – –
Financial assets and
investments in associates 96 092 418 490 307 711 558 839 313 707 565 208 654 551
Intangible assets 34 060 11 211 14 501 – – – –
Retirement benefit assets 187 052 48 795 – – – – –
Deferred income tax assets 28 762 36 770 44 118 36 431 19 402 16 789 8 745
Total non-current assets 1 791 157 1 876 546 1 696 536 1 919 560 1 625 594 1 721 179 1 685 738
Current assets
Inventories 2 703 336 2 499 217 2 246 268 2 207 296 2 074 364 1 651 076 1 600 341
Trade and other receivables 809 024 617 097 552 542 513 414 529 192 581 978 477 079
Financial assets 361 152 254 640 309 249 – 324 106 195 452 –
Current income tax assets – – 51 636 33 230 31 864 29 741 25 403
Cash and cash equivalents 332 426 227 578 196 989 159 390 139 304 185 221 178 227
Total current assets 4 205 938 3 598 532 3 356 684 2 913 330 3 098 830 2 643 468 2 281 050
Total assets 6,7 5 997 095 5 475 078 5 053 220 4 832 890 4 724 424 4 364 647 3 966 788
Equity and liabilitiesTotal shareholders’ equity 3 940 680 3 316 048 2 894 248 2 572 091 2 363 184 2 127 516 2 039 812
Non-current liabilities
Interest-bearing borrowings 2 629 330 646 329 014 754 601 424 130 598 791 791 347
Retirement benefit obligations 12 842 12 191 21 391 16 905 15 297 15 297 15 592
Deferred income tax liabilities 164 033 120 647 110 646 101 127 105 128 80 959 47 275
Total non-current liabilities 179 504 463 484 461 051 872 633 544 555 695 047 854 214
Current liabilities
Trade payables and provisions 1 489 940 1 196 201 1 023 333 1 003 788 791 961 673 844 562 324
Interest-bearing borrowings 329 264 432 502 674 588 384 378 1 024 724 868 240 510 438
Current income tax liabilities 57 707 66 843 – – – – –
Total current liabilities 1 876 911 1 695 546 1 697 921 1 388 166 1 816 685 1 542 084 1 072 762
Total equity and liabilities 5 997 095 5 475 078 5 053 220 4 832 890 4 724 424 4 364 647 3 966 788
Note: The figures for 2001 to 2004 have not been adjusted, except for reclassifications, for the adoption of IFRS.
Seven-year
compound 2007 2006 2005 2004 2003 2002 2001
growth % p.a. IFRS IFRS IFRS SA GAAP SA GAAP SA GAAP SA GAAP

16 Distell Annual Report 2007
Seven-year fi nancial reviewfor the years ended 30 June
Income statements (R’000)Revenue 8,5 7 954 602 6 717 210 5 964 003 5 563 969 5 032 563 4 777 536 4 471 202
Operating expenses (6 839 869) (5 827 815) (5 241 696) (4 994 128) (4 579 560) (4 296 757) (4 129 073)
Trading income 15,9 1 114 733 889 395 722 307 569 841 453 003 480 779 342 129
Dividend income 1 284 1 497 1 210 949 922 1 776 618
Net financing costs 7 969 (27 363) (53 071) (95 702) (119 056) (89 440) (76 974)
Share of profit of associates 14 255 9 856 9 316 10 674 12 723 13 387 5 731
Profit before exceptional
items and taxation 19,7 1 138 241 873 385 679 762 485 762 347 592 406 502 271 504
Exceptional items 73 876 (67 241) – – 51 462 (73 175) (145 602)
Profit before taxation 1 212 117 806 144 679 762 485 762 399 054 333 327 125 902
Taxation (367 243) (271 756) (187 265) (124 790) (86 277) (96 575) (10 862)
Minority interest 2 979 – (844) (390) (315) (266) (283)
Net profit attributable to
equity holders 17,9 847 853 534 388 491 653 360 582 312 462 236 486 114 757
Cash fl ow statements (R’000)Cash generated from
operating activities 15,5 1 188 101 900 123 795 348 761 195 408 778 496 710 609 703
Dividend income 1 284 1 497 1 210 949 922 1 776 618
Net financing costs (23 179) (75 987) (101 685) (161 381) (214 228) (133 736) (152 181)
Taxation paid (365 380) (153 388) (219 980) (143 915) (91 015) (71 292) (50 600)
Dividends paid (342 729) (266 788) (209 948) (158 420) (146 685) (148 641) (104 670)
Cash retained from normal
operating activities 458 097 405 457 264 945 298 428 (42 228) 144 817 302 870
Exceptional items 11 006 – – 46 500 4 962 (73 175) (145 602)
Cash retained by operating
activities 469 103 405 457 264 945 344 928 (37 266) 71 642 157 268
Cash inflow from investment
activities 50 800 (164 364) (92 486) (19 265) 9 841 (229 628) (148 941)
Ordinary shares issued 11 542 18 406 8 406 5 708 – – –
Treasury shares sold 1 893 5 348 (7 981) (1 480) – – –
Minority interest 2 692 (1 417) – 70 (315) (266) (270)
Decrease in interest-bearing
borrowings (325 472) (101 638) (85 364) (984) 41 240 12 764 8 987
Cash outflow from
financing activities (309 345) (79 301) (84 939) 3 314 40 925 12 498 8 717
Increase in net cash and
cash equivalents 210 558 161 792 87 520 328 977 13 500 (145 488) 17 044
Seven-year
compound 2007 2006 2005 2004 2003 2002 2001
growth % p.a. IFRS IFRS IFRS SA GAAP SA GAAP SA GAAP SA GAAP

17Distell Annual Report 2007
Performance per share (cents)Earnings
attributable earnings basis 17,6 425,9 270,7 250,6 184,3 159,8 120,9 58,7
adjusted headline basis 18,9 391,5 305,6 250,6 183,3 130,1 110,4 106,1
cash equivalent basis 15,7 475,7 377,5 300,4 219,1 162,6 143,5 103,6
Dividends 17,9 197,0 153,0 123,0 97,0 75,0 70,0 53,0
Cash flow 20,2 407,8 340,5 242,1 257,3 55,9 112,6 133,9
Net asset value 10,2 1 972,7 1 666,6 1 466,6 1 309,9 1 208,3 1 087,8 1 043,0
Liquidity and solvencyFinancial gearing ratio 0,00 0,16 0,28 0,38 0,55 0,60 0,55
Total liabilities on total equity Avg 0,8 0,52 0,65 0,75 0,88 1,00 1,05 0,94
Interest-free liabilities on total assets 0,26 0,23 0,21 0,21 0,17 0,16 0,15
Dividend cover (times) 2,0 2,0 2,0 1,9 1,7 1,6 2,0
Current ratio 2,24 2,12 1,98 2,10 1,71 1,71 2,13
Acid test ratio 0,80 0,65 0,65 0,51 0,56 0,64 0,63
Returns (%)Trading income on turnover 14,0 13,2 12,1 10,2 9,0 10,1 7,7
Pretax return on equity Avg 19,5 30,8 24,3 23,5 18,9 16,9 15,7 6,2
Effective tax rate 30,3 33,7 27,5 25,7 21,6 29,0 8,6
Return on equity Avg 14,3 19,8 18,2 17,0 13,9 10,8 10,2 10,2
Attributable earnings on total assets 14,1 9,8 9,7 7,5 6,6 5,4 2,9
Attributable earnings on turnover 10,7 8,0 8,2 6,5 6,2 4,9 2,6
Dividend yield 4,2 4,5 5,8 6,8 5,8 6,9 6,7
ProductivityCash value added (R million) 12,9 3 743,1 3 090,8 2 601,1 2 314,7 1 794,6 1 704,6 1 727,4
Net asset turn (times) 2,0 2,0 2,1 2,2 2,2 2,3 2,3
Net assets per employee (R’000) 15,7 926,3 800,8 693,7 614,7 544,3 468,6 401,7
Revenue per employee (R’000) 13,6 1 869,9 1 622,1 1 429,5 1 329,8 1 159,0 1 052,3 880,5
Number of employees 4 254 4 141 4 172 4 184 4 342 4 540 5 078
Seven-year
compound 2007 2006 2005 2004 2003 2002 2001
growth % p.a. IFRS IFRS IFRS SA GAAP SA GAAP SA GAAP SA GAAP

18 Distell Annual Report 2007
Analysis of shareholdersat 30 June
Distribution of shareholders
Public shareholders 3 456 99,37 21 838 590 10,93
Non-public shareholders
Major beneficial shareholders 2 0,06 176 022 000 88,12
Directors, including those of subsidiaries, and their associates 19 0,54 1 746 840 0,87
The Distell Group Share Trust 1 0,03 152 074 0,08
3 478 100,00 199 759 504 100,00
Number of shares in issue 2007 2006
Total number of shares in issue 199 759 504 198 968 930
Shares purchased by The Distell Group Share Trust
and accounted for as treasury shares (152 074) (434 636)
199 607 430 198 534 294
Weighted number of shares 199 078 536 197 413 974
Major beneficial shareholders Number of % of
shares total
The following shareholders have a holding of greater than 5% of the issued shares of the company:
Remgro-KWV Investments Limited 117 348 000 58,74
Other Beverage Interests (Proprietary) Limited (SABMiller) 58 674 000 29,37
JSE Limited
2007 2006 2005 2004 2003 2002 2001
Price per share (cents)
highest during the year 5 500 4 000 2 600 1 725 1 500 1 500 1 000
lowest during the year 3 605 2 475 1 500 1 100 1 105 735 675
closing at year-end 5 415 3 900 2 600 1 500 1 201 1 350 730
weighted average 4 738 3 377 2 121 1 418 1 287 1 008 788
Price earnings ratio 13,8 14,4 10,4 8,1 7,5 11,2 12,4
JSE actuaries’ price index
at year-end (2000: 100 cents)
Distell Group Limited 622 448 299 172 138 155 84
Closing price/net asset value per share 2,7 2,3 1,8 1,1 1,0 1,2 0,7
Weighted average number of
shares in issue (’000) 199 079 197 414 196 194 195 626 195 580 195 580 195 580
Number of shares traded (’000) 6 575 4 692 5 099 3 533 2 784 6 263 3 647
Shares traded/shares in issue (%) 3,3 2,4 2,6 1,8 1,4 3,2 1,9
Value of shares traded (R’000) 311 556 158 440 108 145 50 114 35 833 63 124 28 722
Number of transactions 1 259 1 274 1 214 1 069 981 1 386 1 220
Number of shareholders 3 478 3 445 3 381 3 283 3 389 1 738 2 268
Market capitalisation (R million) 10 817 7 760 5 131 2 945 2 349 2 640 1 428
Net asset value/market capitalisation 0,36 0,43 0,56 0,87 1,01 0,81 1,43
Number of % Number of % of issued
Ordinary shares holders of holders shares shares

19Distell Annual Report 2007
Cash value added statementfor the years ended 30 June
GR OU P 2007 2006
R’000 R’000
Cash generated
Cash derived from sales 7 762 675 6 652 655
Net financing costs paid (23 179) (75 987)
Income from investments 1 284 1 497
Cash value generated 7 740 780 6 578 165
Cash payments to suppliers of materials and services (3 997 691) (3 487 335)
Cash value added/wealth created 3 743 089 3 090 830
Cash utilised to:
Pay excise duty to the State 1 757 671 1 510 664
Pay tax on income to the State 365 380 153 388
Remunerate employees for their services 808 206 754 533
Provide shareholders with a return on the use of their risk capital 342 729 266 788
Cash disbursed among stakeholders 3 273 986 2 685 373
Net cash retained from operating activities 469 103 405 457
Reconciliation with cash generated
Cash value added (above) 3 743 089 3 090 830
Less: Remuneration to employees for their services (808 206) (754 533)
Net financing costs paid 23 179 75 987
Payment of excise duty to the State (1 757 671) (1 510 664)
Cash generated from operating activities 1 200 391 901 620
State taxes
Excise duty 1 757 671 1 510 664
Tax on income 365 380 153 388
Value added tax 372 022 304 790
Employees’ tax deducted from remuneration 99 084 90 501
Regional Services Council levies and property taxes 17 009 22 753
Channelled through the Group 2 611 166 2 082 096
2007
State 65%Employees 25%
Other 10%
Employees 28%State 62%
2006Other 10%

20 Distell Annual Report 2007
Trading environmentDuring the year under review the
economy remained buoyant, given
positive consumer spending, an
encouraging momentum in fi xed
investments and stronger than expected
export growth. Th e anticipated slowdown
in consumer spending did not materialise
despite several interest rate hikes.
Investor confi dence, in particular,
was boosted by Government’s stated
commitment, as it prepares for the 2010
FIFA World Cup, to tackle crime with
integrated strategies that address root
causes, as well as ineffi ciencies in the
policing and justice systems.
Th e country’s economic upswing,
however, has been led largely by
consumer spending, much of it on credit.
A voracious consumer appetite not only
adds to infl ationary pressures and the
risk of still further interest rate increases
but has also pushed household debt to
record highs. Such high levels of spending
will likely temper to some degree, as the
impact of the National Credit Act comes
into eff ect, petrol prices continue to rise
and further interest rate hikes are
anticipated.
Nevertheless, the positive impact of
greater domestic affl uence is marked.
South Africa’s black diamonds, as the
upwardly mobile black middle class are
now being named, pumped an extra
R60 billion into the economy in the last
year, according to the University of Cape
Town Unilever Institute of Research.
Estimated to have an annual spending
power of R180 billion, they represent a
relatively small percentage of black
consumers, but have a signifi cantly larger
proportion of black buying power.
Although the study has been criticised for
using too liberal a defi nition of the term
middle class, to include relatively low-
wage earners as well as students, there
can be no denying that greater access to
education, as well as to job opportunities
and career advancement, has contributed
to the growth in spending, creating a
climate in which strong brands can
fl ourish.
While extensive fi xed investment
spending across many sectors has
accelerated job creation, the high rates of
unemployment continue, impacting on
both economic and social stability. It is
also cause for concern that potential
development, which could further curb
joblessness, is being impeded by a
collapse in infrastructure. Water and
electricity supply, roads and other
utilities are buckling under the strain of
increased demand. Government and local
authorities need to step in and provide
the necessary resources and skills, not
only to sustain much-needed growth, but
to improve South Africa’s global
competitiveness.
We note the slip in our ratings with the
World Economic Forum. South Africa
now ranks 46th of 125 countries in terms
of global competitiveness, compared with
40th place of 117 countries in 2005.
Overstretched infrastructure, along with
the costs to business of crime and
violence, a shortage of skills and
infl exible labour policies, has contributed
to the lower rating.
Th ese drawbacks notwithstanding, we
see great opportunities for South African
companies keen to operate on a broad
geographic front. South Africans are
recognised for their entrepreneurship
and good business practices. All over the
world, there are organisations willing to
partner local operations and Distell is no
exception. We recently entered into
distribution agreements with major
players on European wine markets. We
have also established a joint venture with
Burn Stewart Distillers, a Scotch whisky
producer and brand owner with a
portfolio of leading whisky brands.
Relationships such as these allow us to
exploit opportunities and extend our
global reach, and we shall continue to
investigate options for international
relationships and investment, in the
process building on what has already
been exciting export growth.
Ciders, made from the juice derived from
apples, are now the fastest growing
alcoholic beverage worldwide. Distell, as
one of the world’s largest producers of
ciders, is well-placed to capitalise on this
trend, domestically, on the African
continent, and further afi eld, as you will
read in the managing director’s report,
which follows.
In recent months, there have been reports
about a crisis in our wine industry. Th at
there is a global oversupply, now in its
fourth year, is not in dispute. Nor is it
disputed that some farmers are under
fi nancial pressure as a result. However, it
is our view that the wine industry
remains viable, with a potentially
encouraging long-term future. Research
undertaken by the international Wine &
Spirits Record, on behalf of Vinexpo,
points to ongoing growth in international
wine consumption and there is reason to
expect that South African producers will
continue to participate in this growth,
provided their off erings are consistent
with market demand.
Nevertheless, we believe the industry
would be in a far healthier state and
generating far more jobs if there were
access to Government funding for market
research, development and promotional
activity, as is provided in countries such
as Australia and New Zealand, for
example.
“ . . . we see great opportunities for South African
companies keen to operate on a broad geographic front”
Chairman’s statement

21Distell Annual Report 2007
A large portion of the global market is
concentrated in the premium sector and
that is where much future growth has
been identifi ed. However, if South Africa
is to compete eff ectively in this sector, we
shall have to plan and produce our wines
cost effi ciently and support our brands
with long-term investment and
strategies. Winegrowers should also seek
to align themselves with viable brands.
To maximise success, however, calls for a
collective eff ort to market Brand South
Africa, our single biggest asset, so our
individual brands can follow in its
slipstream.
Distell’s policy is to protect its brands
and, tempting as it may be in the short
term, not to chase volume at the expense
of profi tability. We employ over
4 200 people. Th ere are also some
44 000 hectares under cultivation for
Distell wine brands, representing many
suppliers, their workers and their
families. Protecting our brands is also a
way of protecting them. By building
sustainable brands, we are assuring them
of a continuous uptake of production,
even in times of oversupply.
LegislationTh e progress of provincial liquor
legislation has been slow but now appears
to be gaining at least some momentum.
We believe that once legislation is in
place nationwide, it will be far easier to
promote the responsible consumption of
alcohol, as well as monitor and address
transgressions. While ad hoc
interventions can contain on-trade abuse
to a limited extent, a formalised
infrastructure will make for far greater
effi ciencies in this regard. Most
important, however, is to recognise that
unless legislation in all provinces refl ects
the needs of the communities and
consumers it intends to serve, it will be
unrealistic to expect widespread
compliance.
We also call on Government to address
the continued illicit trading and
smuggling of alcoholic beverages that
pose a threat not only to our industry but
also to the domestic excise regime. Th e
National Treasury has also voiced its
concerns and is in consultation with the
industry as well as the South African
Revenue Service. We look forward to the
outcome of these discussions in curbing
illegal liquor production and distribution.
Superbly matured since 1845, Viceroy’s success has increased
throughout Africa with it becoming one of the best-selling
premium brandies in Kenya.

22 Distell Annual Report 2007
Chairman’s statement (continued)
Th e release earlier this year of the
Department of Trade and Industry’s Code
of Good Practice meant the drafting of
the Liquor Manufacturers’ and
Distributors’ Industry Charter could be
brought closer to completion and we look
forward to its conclusion. We also await
the response of the Minister of
Agriculture to the Wine Industry
Transformation Charter submitted at the
end of July.
TransformationTh e establishment of the South African
Wine Industry Council has been an
extremely important development in
underpinning transformation. It has been
structured to allow for greater
representativity and improved
collaboration between the major players
in the industry. Its success will require
unity of purpose amongst all players, who
will have to overlook sectoral interests for
the greater good of the industry. Without
a cohesive industry, we cannot expect
progress to continue unimpeded, nor can
we expect to make the much-needed
advance in developing our domestic wine
market.
Excise duties on wines and spiritsAn understanding has been reached with
the National Treasury regarding the basis
on which average retail prices should be
calculated. We hope this will lead to a fair
and consistent excise dispensation for all
alcoholic beverages.
Drinking responsiblyDistell fully supports existing legislation
in respect of under-age consumption, as
well as of driving under the infl uence of
alcohol. Abuse of alcohol across the
spectrum and under-age drinking are, in
our view, best addressed through closely
targeted and holistic measures adopted
by the industry as a whole. To this end, we
have taken an active role in the Industry
Association for the Responsible Use of
Alcohol (ARA) of which we are a leading
corporate member, with Distell’s head of
regulatory aff airs, Michael Mokhoro,
currently serving as chairman. Our belief
is that working as a unifi ed force in co-
operation with Government in developing
educational, early identifi cation and
interventionist measures that target the
vulnerable and marginalised, provides
the strongest, most eff ective and cost-
effi cient basis for combating excessive,
harmful and inappropriate consumption.
Th e Liquor Manufacturers’ and
Distributors’ Industry Charter, in its
current form, accepts that membership of
ARA is ample demonstration of
commitment to combat abuse and should
further strengthen the very positive
contribution made by the organisation.
We also express our thanks to former
ARA director, Chan Makan, for the
laudable and very successful initiatives
he has developed and implemented, and
we welcome his successor, Adrian Botha,
who formerly served on ARA’s
management committee. His extensive
background and experience make him
ideally suited to the task.
ProspectsWe expect the present tempo of consumer
spending to moderate to some degree.
Even a slight downward adjustment in
disposable income should see well-
marketed brands as the best positioned
to build loyalty and attract newcomers.
Our task will be to further strengthen our
market visibility and our existing
relationships with retail and on-
consumption channels, as well as with
consumers locally and globally, ensuring
ever better quality and service.
AcknowledgementsWe have set and to a large extent met
demanding standards across every facet
of the business, all the while maintaining
stringent fi nancial disciplines. Our aim is
to delight our customers and consumers
wherever we trade and to maintain the
highest quality in every one of the
functions we perform. We strive to be a
worthy employer and a responsible
corporate citizen, mindful of the impact
we make at an economic, social and
environmental level.
We have not only weathered a diffi cult
wine market locally and abroad but we
have also played a key role in advancing
the domestic popularity of brandy, still
South Africa’s favourite spirit. We have
established a global platform for
Amarula, internationally the most widely
known South African consumer product.
We have introduced many product
innovations and we have set the
benchmark for the local cider industry.
We have been acknowledged on local and
international showcases for our products
across the portfolio and we have
extended our international footprint,
despite the ferocity of the competition.
We have also managed to participate
actively in technical forums worldwide in
pursuit of ever better quality systems and
products.
None of these activities or successes
would have been possible without the
shared goals, dedication and support at
every level of the business from
co-directors, management, staff and
suppliers. I thank each one of you
personally and look forward to your
continued commitment.
We also thank Daan Prins, who has
resigned from the board, for his
contributions and insights over the
years, and we welcome Robert Lumb.
DM Nurek
Chairman
Stellenbosch
22 August 2007

23Distell Annual Report 2007
Savanna, one of the country’s most popular dry cider
brands, embraces the attitude of a new South Africa with
its off -the-wall dry humour. Th is trendy brand’s popularity
is now spreading to international shores where, amongst
others, it is sold at leading supermarket
chains in the United Kingdom.

24 Distell Annual Report 2007
Th e domestic marketSouth Africa’s economic climate has
generally been favourable, with gross
domestic product (GDP) growing at 5%.
Business and consumer confi dence
remained high during the period under
review, fuelled by accelerated economic
growth in the fi nal quarter of 2006 and
ever-increasing employment levels.
Rising infl ation and interest rates did
little to curb cash or credit spending
amongst consumers.
Th e alcoholic beverage sector continued
to benefi t from ongoing premiumisation
for the third consecutive year. Th is trend
of trading up to distinctively packaged
alcoholic beverages that denote a sense of
luxury has in large part been driven by
the black diamond phenomenon,
described in the chairman’s statement.
Newly affl uent black middle class
consumers have grown dramatically in
number and spending power.
Growth in the alcoholic beverage sector
was driven mostly by premium priced
beer, whisky and ready-to-drink (RTD)
beverages.
In the case of our own portfolio, a further
increase in market investment and a
continuation of our relentless pursuit of
quality at intrinsic and packaging levels,
supported by compelling advertising
campaigns, resulted in greater consumer
support across all product categories.
Performance highlights in our spirits
segment included the sustained growth
of Klipdrift and Richelieu brandies.
Exclusive brands such as the Van Ryn’s
Collection Reserve range of potstill
brandies, Klipdrift Gold and Oude
Meester 12 Year Old also benefi ted from
ongoing premiumisation.
Amarula Cream had another excellent
year, further entrenching its position as
the category leader. On the wine front,
Durbanville Hills and Two Oceans
experienced sound growth, the latter
benefi ting from the greater exposure
brought by television advertising. Other
good performances came from Drostdy-
Hof (especially the Extra Light and
Natural Sweet variants), J.C. Le Roux
sparkling wines, and Sedgwick’s Old
Brown Sherry. Within the RTD category,
our cider brands performed exceptionally
well. Hunter’s posted strong growth
across its entire brand range, while
Savanna was once again the star
performer of the entire Distell brand
portfolio.
Continued focus on and investment in
brand building, market activation, trade
channel management, as well as
customer and consumer relationship
management strategies, have allowed us
to capitalise on favourable economic
conditions and remain fi rmly on our
growth path.
We also explored new investment
opportunities to enhance our spirit
portfolio during the year under review as
mentioned in the chairman’s statement.
In April, we entered into a joint venture
as equal partners with Burn Stewart
Distillers, a Scotch whisky producer and
brand owner with a portfolio of leading
whisky brands. Burn Stewart is owned by
CL WorldBrands, the global drinks group
of Trinidad-based CL Financial with
distribution networks in Europe, the USA
and the Far East. Th e joint venture owns
and markets three of Burn Stewart’s
leading brands in sub-Saharan Africa.
In addition to Scottish Leader (which
Distell has represented in South Africa
Managing director’s report
We have improved shareholder value through considerable growth in earnings and by extracting even better performance from our assets.
“Th is has been another successful year for Distell”
Headline earnings, excluding the non-recurring black economic empowerment (BEE) expense incurred the previous year, grew 29,2%, achieving compound annual growth of 19,2% over a seven-year period.
Over the same period, net operating assets (i.e. fi xed assets, inventory and accounts receivable, less accounts payable) refl ected compound annual growth of 3,3%.
Returns on shareholders’ funds continued to improve, from 18,2% last year to 19,8%.
Our sound fi nancial performance has been the result of strong and profi table volume growth, and a very satisfactory performance by operating units across the business.
Management uses a range of fi nancial and non-fi nancial key performance indicators to monitor progress against our strategic priorities and business plans. Divisions across the business succeeded in meeting, if not improving, most of these performance measurements.

25Distell Annual Report 2007
Nederburg, the country’s most awarded name in wine, continues
to fi nd favour in markets abroad. A South African
brand leader in Germany, Nederburg is delighting
wine lovers in the UK, across Europe, the USA, Asia Pacifi c and
closer to home, on the African continent.

26 Distell Annual Report 2007
Managing director’s report (continued)
since 1999), they are the Bunnahabhain
Islay Single Malt, and Black Bottle Scotch
Whisky, a blend of seven Islay malts.
International marketTh e expansion of our international
business forms an integral part of
Distell’s strategic focus. To this end, we
are concentrating on:
• Building a core portfolio of brands in
key markets.
• Still further advancing Amarula’s
global position, strengthening
support where we currently trade and
establishing a presence in new
markets. Amarula is the company’s
biggest spirit brand and also South
Africa’s most widely distributed
alcoholic beverage internationally.
• Building on our position as a
profi table and leading South African
wine exporter. We succeeded in
exporting 43% of our premium wine
production, with drive brands,
Nederburg, Fleur du Cap, Two
Oceans, Durbanville Hills and
Drostdy-Hof, all showing signifi cant
growth in key markets.
• Exploiting the popularity of Savanna
in key markets.
• Giving greater attention to our
African operations.
International sales volumes have shown
compound annual growth of 10,3% over
a fi ve-year period. Currently,
international business contributes
18% of total revenue. Th is year export
volumes grew 9,8%, a refl ection of a
favourable sales mix.
African markets Th e International Monetary Fund, in its
April 2007 World Economic Outlook,
painted a fairly optimistic picture of
Africa. Th e continent’s economic growth
is being fuelled mainly by strong global
growth, increased capital infl ows,
a buoyant commodities sector, improved
economic stability in many countries and
the positive impact of debt relief.
Since 2000, real GDP growth in sub-
Saharan Africa has averaged around
4,5% per annum. We began focusing
assiduously on the subcontinent in 2003
and have been expanding our presence in
the region ever since, with our eff orts
continuing to bear fruit. Th is year, sales
volumes for Africa (excluding Botswana,
Lesotho, Namibia and Swaziland) grew
31,5%, well ahead of target.
Wine sales volumes grew 24,5% and
spirits 47,8%. We are particularly
encouraged by the acceptance and
growth of brandy outside South Africa.
Although off a low base, sales volumes of
ciders and RTDs grew 62,5%.
Angola, Kenya and Zambia delivered
excellent results, with sales volume growth
driven particularly by Amarula, Viceroy,
J.C. Le Roux, Nederburg and Savanna.
In line with strong growth trends, we
have substantially strengthened our
marketing structures and sales
representation in key markets in the
region. We are confi dent that our
increased investment, both in terms of
infrastructure and brand support, will
allow us to eff ectively exploit market
potential.
At the same time, we remain committed
to our philosophy of partnering with local
players to expand our footprint across the
continent, while building capacity in
developing markets. Th e Group adds
signifi cant value by providing technical
and manufacturing skills in countries
such as Zimbabwe, Kenya, Tanzania and
Mauritius.
We hold a 35% share in Tanzania
Distilleries Limited that continues to
deliver excellent results. With sales
volumes far exceeding targets, capacity
has recently been expanded. In a major
boost to the local industry, the operation
is now also bottling Tanzanian wines.
Zimbabwean company African Distillers
Limited, in which we have an eff ective
31% share, has demonstrated remarkable
resilience under extremely challenging
conditions. Present circumstances have,
however, necessitated the adoption of a
survival as opposed to a growth strategy.
Nevertheless, the performance of this
investment has no material bearing on
Distell’s overall performance.
During the review period we fi nalised a
transaction giving us a 26% interest in
the Mauritian company, Grays Inc
Limited, and initial results have proved
encouraging.
Our production and distribution
agreement with Kenya Wine Agencies
Limited once again resulted in
substantial volume growth for key
brands, especially brandies.
BLNS countries (Botswana, Lesotho, Namibia, Swaziland)Th e countries immediately beyond our
borders have long been important
markets for us and over the years we have
continued to strengthen marketing, sales
and distribution infrastructure to
maximise opportunities. Growth across
all product segments has been in line
with projections.
Other markets (outside the African continent)Th is year export volumes grew 7,2%, a
refl ection of a favourable sales mix.
Amarula Cream
Th e past few years have seen
unprecedented global growth in the
popularity of cream liqueurs,
precipitating a signifi cant proliferation in
product off ering in all markets. However,
most players have not managed to make
any real impact and the market is
currently consolidating.

27Distell Annual Report 2007
Amarula continued to perform well with
strong growth achieved in all key
markets, in particular Canada, Germany,
Brazil and neighbouring countries, as
well as the UK. With a 25,6% growth in
export volumes, the brand continues to
outperform the category on the
international front.
Global development remains a priority.
Continuous research underpins our
investment strategy in the brand, which
focuses on both established and newer
markets. Th e travel retail channel has and
will continue to play a valuable role in
promoting Amarula’s visibility.
Wines
To underpin our international trading
activities, we have been actively engaged
in establishing strategic alliances with
trading partners, concluding several
important agency agreements that will
not only bolster our presence in Europe,
but also strengthen our ties in North
America, Europe and Asia Pacifi c.
Distell entered into a supply and agency
agreement with Altia Corporation, an
international multi-beverage company
that operates in the Nordic states, where
it is the market leader, as well as in the
emergent Baltic markets. Th is deal is
helping to forge an already strong
presence in Finland, Norway and Sweden,
while giving us exposure to new
opportunities in the Baltic states.
We also entered into an agreement with
Baarsma Wine Group Holding (BWGH) to
carry some of our drive wine brands in
the Netherlands, giving us a balanced
exposure across a range of channels and
price points. BWGH is a leading player in
the Dutch retail and on-consumption
channels and also markets directly to an
extensive base of consumers. Key brands
being represented include Fleur du Cap,
Durbanville Hills, J.C. Le Roux, Pongracz,
Two Oceans and Drostdy-Hof.
To secure a stronger presence in UK
retail, we have expanded our agreement
with distributor Waverly TBS, which has
recently taken on Two Oceans, in
addition to other focus wine brands –
Nederburg, Drostdy-Hof, Fleur du Cap
and Plaisir de Merle.
AV Imports continues to make inroads
for Two Oceans in the USA, focusing on
some of the major grocers’ chains.
Listings have been achieved with Hyvee,
across over 200 stores in the mid-west;
Publix in the south; 500 Food Lion stores
in the south; and mid-Atlantic and
Pennsylvania Liquor Commission.
Distell’s competitive edge is, we believe,
the result of ongoing brand investment,
a relentless focus on quality, fl exibility of
service off erings, solid agency structures
and a balanced product portfolio.
Drive brands have shown compound
annual growth in volume of 16,8 % over
a fi ve-year period, increasing the
contribution of international markets to
total group brand income from wine.
During the review period, these key
brands showed a 12,6% volume growth in
an international market characterised by
oversupply and contracting market share
for many players. However, overall wine
volume growth was signifi cantly lower,
increasing just 3,3%, given the decline in
sales of second-tier brands.
We have seen solid growth in key markets
such as Scandinavia, Canada (where Two
Oceans is one of the top ten wine brands)
and the USA. Although our performance
in the UK and the Netherlands did not
meet our expectations, we were able to
increase our share of the South African
category in these markets.
Our continued focus on emerging
markets is also starting to show
encouraging results and a number of
breakthroughs have been made in
Central Eastern Europe and Asia Pacifi c.
Although off a small base, we are heartened
by brand developments, most notably in
Russia, China, Vietnam and South Korea.
Our intention remains to establish and
maintain profi table brands. We have
increased our earnings from wine
exports this year, while substantially
increasing advertising support for our
brands.
OperationsStrategies and initiatives designed to
achieve and entrench a sustainable
competitive cost advantage remain a top
priority in our goal to participate
successfully in competitive global
markets. Year-on-year improvement in
operational performance is refl ected in
a continuous reduction in unit cost and
a constant improvement in net operating
margin. Excellence in operational
performance demands that we:
• place customers and consumers at
the centre of our thinking,
• deliver superior products, and
• provide excellent service at
competitive prices.
It is, however, imperative that we
constantly raise the performance of our
operating units to maintain our lead and
competitive edge. Business process
improvement is therefore integral to the
way we work.
Th is year we have made further advances
in enhancing effi ciencies. Progress
against cost leadership goals has been in
line with targets, with most key
performance indicators showing an
improvement on the previous year. Sales
volumes increased 14,4% while expenses,
excluding sales and marketing
expenditure, rose 15,7%, resulting in a
mere 1,2% increase in cost per litre, well
below the producer price index (PPI) of
10,4%. Th e benefi ts fl owing from
28 Distell Annual Report 2007
Managing director’s report (continued)
improved effi ciencies allow us to reinvest
in strategic areas of the business,
particularly marketing expenditure on
drive brands and by extending sales
representation and marketing
capabilities in key markets.
Th e principle of managing by project has
contributed to an overall improvement in
effi ciencies. Consequently we have
formalised this approach by establishing
a central Enterprise Project Offi ce. We
successfully implemented the Six Sigma
methodology, training project managers
and placing them in business units. Th is
has further boosted a sense of ownership
amongst staff and impacted positively on
both team and individual performance.
Th is year our secondary production
division, responsible for bottling and
blending, extended the implementation
of the “overall equipment effi ciency”
process monitoring systems to all
production sites. Th e system is designed
to signifi cantly reduce unplanned
downtime and changeover time on
production lines, resulting in enhanced
throughput and a substantial
improvement in resource utilisation.
To capitalise on the trend towards
premiumisation, while still maintaining
a competitive advantage, we continue to
invest diligently in measures to improve
product intrinsics, as well as extrinsics
such as packaging. Advances in this
regard include:
• Establishing labelling capability to
produce complex product
confi gurations
• A programme to expand automatic
packers to prevent damage caused by
manual processes
• Investment in equipment to produce
new packaging concepts
We also have to ensure that our service
off erings are aligned with customer
needs in a changing environment. Our
‘Route to Market’ project, aimed at
identifying customer needs, market
opportunities and gaps in our service
model, is close to completion and
recommendations, based on research
fi ndings, are in the process of being
implemented. SAP functionality is
currently being implemented in Distell
TradeXpress outlets that service specifi c
customer channels in the South African
market. Not only will this enable us to
raise our service levels to customers, but
also to reduce inventory and optimise
inter-depot transport.
Th e quality of our employees impacts
directly on our operational performance.
We therefore promote values such as:
• A sense of ownership where
employees at every level are aware of
their contributions, and are
empowered and accountable
• A performance-driven culture, where
we challenge ourselves to ensure
continuous improvement, by creating
more, better and faster
• A customer-service orientation, to
delight our customers and consumers
everywhere
• Entrepreneurship, by allowing
employees the freedom to explore and
create
• Respect for the individual where we
respect each other’s diversity and
contribute to the communities in
which we operate. We also promote
the responsible use of alcohol.
Th e Group continues to maintain mission
directed work teams in all operation
environments. We believe this approach
provides a valuable foundation for
ongoing improvement. It encourages and
builds a culture that is performance-
driven and oriented towards customer
service. It also promotes team work, a
sense of ownership and stimulates
innovation. Given the excellent results
from initiatives already under way, we
recently expanded the parameters by
introducing additional modules that
focus on areas such as ‘asset care’ and
‘process control’.
We have embarked on a programme to
align our people competencies with
future business requirements. In this way
we are able to engage in more meaningful
and targeted training programmes.
Th e phenomenal growth of the RTD market
in which Distell is a signifi cant player, has
resulted in greater investment to meet
demand, of ciders in particular. We are
increasing cider capacity at our production
plant in Paarl, as well as at our bottling
facility in Green Park. Th ese expansions
are expected to be commissioned early in
the 2008 fi nancial year.
A national shortage of carbon dioxide
(CO2 )
prompted us to explore the
viability of CO2 recovery. We have since
entered into an agreement with Air
Liquide for the installation of a full-scale
CO2 recovery plant in Paarl which will
give us continued supply of CO2 needed in
the production of many of our products.
Procurement practices remain a top
priority. Close collaboration with our
suppliers plays a major role in enabling us
to further expand our business, both in
the local and international markets,
benefi ting all industry participants. It is
therefore crucial to ensure continuous
product availability, quality standards
and cost reduction through improved
effi ciencies throughout the value chain.
Th is is particularly important given the
challenging trading conditions faced by
the industry and the need to provide
a stable operating environment over
the long term for the mutual benefi t of
all participants in the supply chain.
During the year signifi cant progress was
made in establishing a global supply
network. Th is gives us access to better
product, service and pricing options and

29Distell Annual Report 2007
Amarula Cream is enjoyed in over 90 countries worldwide and
continues to outperform the category on the
international front. Amarula, the spirit of Africa, achieved strong
growth in all key markets, in particular Brazil, Canada,
Germany, neighbouring countries as well as the UK.

30 Distell Annual Report 2007
also helps to counter local supplier
production capacity constraints,
particularly in the case of packaging
materials.
We have also initiated a low-tech, labour-
intensive scheme in the Northern Cape
and Free State, to ensure Distell of a cost-
eff ective source of distilling wine. Using
virgin land that does not require the
grafting of vines onto rootstock (thus
reducing input costs), applying low-cost
trellising, as well as fl ood irrigation, the
intention is to establish high-density
vineyard planting on some 700 hectares.
Expected to optimally yield an average of
45 tons per hectare, crops will be
processed at existing wine cellars with
underutilised capacity. Further details
regarding this project appear on page 44
in the sustainability report.
A section of our production plant in
Wadeville was destroyed by fi re late in
2006. We are pleased to report that
eff ective business resumption procedures
meant production remained virtually
uninterrupted as alternative sites
stepped in to provide the necessary
support. Repairs are on schedule and
we expect the plant to be fully
operational by October 2007.
Financial reviewRevenueRevenue grew 18,4% to R8,0 billion on
a sales volume increase of 14,4%.
Locally, sales volumes increased 15,6%,
with growth accelerating signifi cantly
during the second six months. Our
brands in the cider and RTD category
continued their exceptional performance
and, with a 37,2% volume growth,
performed way ahead of the category.
Spirit volumes, including brandy, rose
2,4% (2006: 3,2%) in an extremely
competitive market. While brown spirit
brands and liqueurs showed 4,0% volume
growth, the white spirit market remained
under pressure. Continued focus on
brand building saw our wine segment
refl ect profi table volume growth of 4,5%
(2006: 1,9%) notwithstanding the ever-
increasing number of players in a highly
price-competitive market.
International sales volumes, excluding
Africa, increased 7,2%. International
revenue, benefi ting from a favourable
exchange rate and sales mix, increased
32,0%. Spirit volumes grew 23,2%, thanks
to solid performances in all key markets.
Although natural wine sales volumes
rose 3,3%, drive brands performed
impressively, growing 12,6%.
Revenue derived from African countries
grew 20,0% on a volume growth of 11,8%.
African countries outside the BLNS
region delivered revenue growth of
31,5%, although off a relatively small base.
Trading incomeTh e increase of 25,3% in trading income
was the result of strong revenue growth,
benefi ts derived from improved
throughput and further advances made
to enhance effi ciencies across the
business.
Th e Group’s ability to constantly raise the
performance of our operating units has
become a key strength, enabling us to
signifi cantly step up brand investment,
sales support and representation, as well
as marketing activities, while at the same
time improving net operating margin,
a key performance indicator.
Improved throughput and effi ciencies in
production, distribution and other
service centres meant we could contain
increases in operating costs per sales unit
to a mere 1,2%, well below the offi cial PPI
of 10,4%.
We continued to meet our objective of
ongoing margin enhancement, by further
improving net operating margin from
13,2% to 14,0%.
Net other gainsDuring November 2006, a section of our
production plant in Wadeville was
destroyed by fi re. Th e portion of the
insurance claim which relates to the
replacement of assets has been settled
between the Group and the insurers.
Th e diff erence between the insurance
proceeds in respect of fi xed assets and
book value at the time of the incident is
refl ected separately in the income
statement and is included in net other
gains.
Net fi nance income and cash fl owCash generated from operating activities
rose to R1,2 billion from last year’s
R900,1 million, an increase of 33,2%.
Cash retained from operating activities
amounted to R469,1 million (2006:
R405,5 million).
Fixed investment spend to maintain and
expand operations amounted to
R224,5 million (2006: R164,4 million).
Th e increase in capital expenditure, to
expand the production capacity of our
cider manufacturing plants, was
necessitated by a signifi cant increase in
demand.
Th e Group generated net cash fl ow of
R244,6 million before fi nancing activities,
with an equivalent increase in cash and
cash equivalents and, as a result,
net fi nancing income amounted to
R8,0 million compared to net fi nancing
cost of R27,4 million the previous year.
TaxationTh e eff ective tax rate decreased from
33,7% to 30,3%, mainly as a result of the
BEE share-based payment incurred the
previous year, which was not tax-
deductible.
Managing director’s report (continued)

31Distell Annual Report 2007
EarningsHeadline earnings increased 45,4% to
R779,3 million.
Adjusted headline earnings – headline
earnings excluding the non-recurring
BEE share-based payment incurred
the previous year – rose 29,2% to
R779,3 million. Th is growth is
attributable largely to a 25,3% rise in
trading income, a substantial reduction
in fi nancing costs and a lower eff ective
tax rate.
DividendTh e directors have resolved to declare
dividend number 38 of 109 cents per share,
making a total dividend of 196 cents per
share for the year ended 30 June 2007
(2006: 153 cents). Th e total dividend
represents a dividend cover of 2,0 times
by adjusted headline earnings, and is
28,1% higher than the previous year.
Investment and fundingTotal assets increased by R522,0 million
to R6,0 billion, an increase of 9,5% on the
previous year. Th is compares favourably
with the 25,3% rise in trading income,
demonstrating the Group’s ability to
extract better performance from our
assets.
Total capital expenditure amounted to
R224,5 million, of which R123,2 million
was spent on the replacement of assets.
A further R101,3 million was directed
to the extension and refurbishment
of the Wadeville plant, increasing
production capability at our cider and
RTD facilities and augmenting both
production and maturation capacity
for our spirits.
Investment in net working capital rose
5,3% to R2,0 billion. Inventory increased
8,2% to R2,7 billion. Bulk spirit stock in
maturation increased substantially, in
accordance with the Group’s longer-term
view of consumer demand for our spirits
brands. Although bottled stock and
packaging material at year-end refl ected
an increase of 12,7% on the previous year,
average annual bottled stock duration
improved from 41 days last year to
35 days and was maintained at 40 days
for packaging material.
Th e Group remains in an extremely
strong fi nancial position as shown by
the positive cash and cash equivalent
balance, net of interest-bearing debt,
of R361,7 million at year-end (2006:
R55,4 million).
Increased cash generated refl ects growth
in profi tability, effi cient utilisation of
fi xed assets and continuous improvement
in working capital management.
Future funding fl exibility is ensured by
the existence of a R3,9 billion borrowing
facility.
Shareholder valueTh e value that a company generates for its
shareholders is best measured by total
shareholder return (TSR), a combination
of share price appreciation and dividends
over the medium to long term. Since the
merger between Distillers Corporation
Limited and Stellenbosch Farmers’
Winery Group Limited in 2000, to form
Distell Group Limited, the Group has
delivered a TSR of 34,3% per annum over
a seven-year period, compared to the
seven-year compound annual growth rate
of 19,8% in the JSE Top 40 index.
ProspectsBusiness conditions in South Africa
remain favourable, with consumption
expenditure growth an important driver
of overall economic performance.
Employment creation, further real
growth in disposable income and high
levels of consumer confi dence are
expected to continue. Although the
tightening in credit availability and
higher interest rates may have an adverse
impact on consumer spending in the
short term, the board is expecting growth
in consumer spending to continue, albeit
at a slower pace, still benefi ting alcoholic
beverage sales.
Th e global economic outlook remains
positive, but there are concerns about the
short-term impact of higher energy
prices, and higher interest rates.
We expect the trading environment to
remain competitive, with increased
marketing investment by most industry
players. Th e wine industry in particular
continues to pose challenges globally.
Nevertheless, we believe our business is
appropriately structured, with a portfolio
of compelling brands and an effi cient cost
base that will allow us to compete
eff ectively, and to capture opportunities
in key markets. We shall underpin our
eff orts by upping our investment in drive
brands and support structures and
expect to continue to deliver growth in
earnings.
AcknowledgementI express my sincere appreciation to every
member of Distell for their committed
individual contribution and teamwork in
crafting our fi ne brands.
JJ Scannell
Managing director
Stellenbosch
22 August 2007

32 Distell Annual Report 2007
Corporate governance, critically
important to Distell’s success as a
business and in protecting the interests
of its shareholders, is managed and
monitored by the company’s board of
directors and several of its
subcommittees. Th e directors are
unreserved ly committed to the principles
of good governance and to this end
accept full accountability to all their
stakeholders in applying the necessary
disciplines in maintaining the highest
standards of professionalism, integrity,
independence, fairness and social
responsibility.
Transparency in the management
process gives shareholders and other
interest groups the assurance that the
Group is managed according to ethical
norms and international best practice
within the boundaries of prudently
determined risk parameters.
Th e board is of the opinion that the Group
complies more than adequately with all
the signifi cant principles incorporated in
the Code of Corporate Practices and
Conduct, as set out in the second King
Report (King II) and the JSE Limited
Listings Requirements.
Board of directorsTh e board evaluates and reviews the
strategic direction of the Group, agrees
on key performance indicators and
identifi es key risk areas and responses.
Executive management is then charged
with the detailed planning and
implementation of these strategies in
accordance with appropriate risk
parameters.
Th e board holds management
accountable for its activities, which are
monitored and controlled through
regular reports and discussions. In this
way the board is able to:
• Retain full and eff ective control over the
Group, and monitor management’s
implementation of planning strategies
• Review the performance of executive
management against business plans,
budgets and industry standards
• Consider signifi cant fi nancial matters,
including investment decisions
• Identify, consider, monitor and, if
appropriate, approve fi nancial and non-
fi nancial matters relevant to the
business of the Group
• Ensure a comprehensive system of
policies, procedures and controls is in
place and adhered to
• Ensure sound governance, including
compliance with relevant laws and
regulations, audit and accounting
principles and the Group’s internal
governing documents and codes of
conduct
• Defi ne levels of materiality, hold certain
powers and delegate other matters with
the necessary written authority and
terms of reference to management or
board committees
• Be aware of and commit to the
underlying principles of good corporate
governance, monitor and maintain
compliance.
Th e board is chaired by independent,
non-executive director DM Nurek and
comprises 13 non-executive directors
(of whom ten are independent) and three
executive directors, including the
managing director. Th e roles of the
chairperson and managing director are
separated, with responsibilities divided
between them. Th e chairperson has no
executive functions.
Non-executive directors, appointed for
their knowledge and experience of a wide
range of businesses and business sectors,
augment the skills and experience of the
executive directors and management and
contribute independent viewpoints to
matters under consideration. All
directors have the appropriate expertise
to fulfi l their duties and enjoy signifi cant
infl uence at meetings. Th is ensures a
balance of authority and precludes any
one director from exercising unfettered
powers of decision-making.
Generally, directors have no fi xed term
of appointment but retire by rotation.
At each annual general meeting of the
company, a third of the directors (those
longest in offi ce since their last election)
retire and, if available, are considered for
reappointment.
Procedures for appointments to the
board are formal and transparent and a
matter for the full board’s consideration.
Th e board is always mindful of the need
to maintain an infusion of fresh thinking
and a relevant mix of skills and
experience.
Th e eff ectiveness of the board
composition and the performance of all
its directors, including the chairperson,
are assessed annually.
Non-executive directors receive neither
share options nor material benefi ts from
Distell, other than their directors’ fees.
All board members are required to
disclose the extent of their shareholdings
in Distell, other directorships and any
potential confl ict of interest. It is
incumbent on directors to act in the best
interests of the company at all times.
Where a potential confl ict of interest does
exist, they are expected to recuse
themselves from relevant discussions and
decisions.
Directors and other nominated
employees are required to advise the
chairperson and obtain his clearance
before dealing in Distell shares. Th e
chairperson withholds clearance during
any closed period or where there exists
unpublished, price-sensitive information
in relation to the company shares.
Th e board convenes at least every two
months to review a formal schedule of
matters for which its members are fully
briefed in advance. Eff ective
chairmanship and a formal agenda
ensure all issues requiring attention are
raised and addressed. Th is enables
directors to discharge their
Corporate governance
“Managing the Group according to ethical norms . . .”

33Distell Annual Report 2007
responsibilities in determining whether
prescribed functions have been carried
out according to set standards within the
boundaries of prudent, predetermined
risk levels and in line with international
best practice.
Th e company has purchased adequate
“Directors and Offi cers” insurance cover
to meet any material claims against
directors and offi cers.
In addition, all directors have unlimited
access to the advice of the company
secretary, who acts as an adviser to the
board and its subcommittees on issues,
including compliance with Group rules
and procedures, statutory regulations
and with King II. Independent
professional advice is available to
directors in appropriate circumstances at
the company’s expense.
Board subcommitteesSpecifi c responsibilities are delegated to
board committees, with defi ned terms of
reference from approved charters. All
chairs of committees report orally on the
proceedings of their committees at the
subsequent board meeting and minutes
of committee meetings are provided to
the board.
Th e principal board committees are as
follows:
Th e audit and risk committeeTh e audit and risk committee regularly
evaluates the Group’s exposure and
responses to signifi cant business,
strategic, statutory and fi nancial risks. It
also reviews:
• the eff ectiveness of risk management
processes; and
• the appropriateness and adequacy of the
systems of internal fi nancial and
operational controls.
In addition, the committee reviews and
evaluates accounting policies and
fi nancial information issued to the
public, to ensure appropriate standards
of governance and reporting are
maintained.
Th e audit and risk committee is
responsible for recommending the
appointment of the external auditors,
determines their fees and assesses the
performance of internal as well as
external auditors. Th e committee also
ensures eff ective communication
between directors, management and
internal and external auditors. Th e risk
management workgroup assists the audit
and risk committee with its risk
management function.
Drostdy-Hof, more than any other South African wine,
embodies the essence of the Cape both in style and taste. It is
the biggest South African wine brand by
volume in Sweden and continues to show
signifi cant growth in other key markets.
34 Distell Annual Report 2007
Corporate governance (continued)
Th e committee is chaired by an
independent, non-executive director
since the chairperson of the board may
not serve as chairperson of the audit and
risk committee. Th e present incumbent is
Robert Lumb.
Th e committee meets at least four times a
year. Th e internal and external auditors,
the managing director, the fi nancial
director and the company secretary are
in attendance at each meeting and other
members of the management team attend
as required. However, when issues are
raised with the external auditors in
which executive attendees have a vested
interest, the latter are required to recuse
themselves.
Audit and risk committee members, as
well as the internal and external auditors,
have unlimited access to whatever
information they require in discharging
their responsibilities. Moreover, the
internal and external auditors have
unlimited access to the chairperson.
Th e internal audit department reports
directly to the audit and risk committee
and is also responsible to the group
fi nancial director on day-to-day matters.
Th e managing director is copied on all
signifi cant reports which are then
discussed with him.
Th e remuneration committeeTh e remuneration committee is
responsible for the assessment and
approval of a broad remuneration strategy
for the Group. It also determines the
remuneration of non-executive directors,
as well as the short and long-term
incentive pay structures for executive
management and senior management.
Remuneration strategies are aimed at
rewarding employees at market-related
levels and in accordance with their
contribution to the Group’s operating and
fi nancial performance, covering basic pay
as well as short and long-term incentives.
To promote identifi cation with
shareholders’ interests, share incentives
are considered a critical element of
executive incentive pay.
Th e remuneration committee is also
responsible for the identifi cation,
assessment and nomination of potential
new directors. New directors are
provided with suitable induction material
designed to familiarise them with all
aspects of the business. Th e remuneration
committee consists of fi ve non-executive
directors, and is chaired by DM Nurek.
In compliance with its charter, the
committee met three times during
the year.
Accountability and auditInternal auditTh e mandate of the Group’s internal audit
function operates in terms of the audit and
risk committee’s approved charter to
provide management with an independent,
objective consulting and assurance service
that reviews matters relating to control,
risk management, corporate governance
and operational effi ciency.
Th e primary mandate of the Group’s
internal auditors is to examine and
evaluate the eff ectiveness of operational
activities, the attendant business risks
and the eff ectiveness of the system of
internal operational and fi nancial control
to manage such risks and to bring
material defi ciencies, instances of non-
compliance and development needs to
the attention of management, the
external auditors and the audit and risk
committee for resolution.
In particular, the internal audit function
assesses the relevance, reliability and
integrity of management and fi nancial
information, the effi cient and economic
use of resources, the safeguarding of
assets, compliance with relevant policies,
procedures, laws and regulations and the
prevention of waste and fraud.
Th e Group’s exposure and responses to
signifi cant business, strategic, statutory
and fi nancial risks and reviews are
regularly evaluated.
Th e function of the Group’s internal audit
is also to provide a risk management
facilitation role, ensuring the process of
risk management is always accorded the
highest priority, but without assuming
responsibility for risk management itself,
which remains the responsibility of
relevant line management.
Th e internal auditors also conduct
independent investigations into fraud or
other irregularities.
Th e internal audit department functions
under the direction of and reports to the
audit and risk committee, but is
responsible to the group fi nancial
director for day-to-day matters. It has
unrestricted access to the chairperson of
the audit and risk committee. Th e
internal audit plan is presented in
advance of audit and risk committee
meetings and is based on an assessment
of potential risk areas. All Distell
business operations and support
functions are subject to internal audit.
Th e audit and risk committee approves
the yearly audit schedule. Internal audits
are conducted in accordance with the
standards of the Institute of Internal
Auditors.
Teams of appropriately qualifi ed and
experienced employees perform internal
audits. From time to time, in the case of
special assignments, independent
external practitioners are engaged and
accorded equivalent access to
information.
Every audit assignment is followed by a
detailed report to executive management,
including recommendations on aspects

35Distell Annual Report 2007
requiring improvement. Material
fi ndings are reported to the audit and
risk committee.
External auditTh e external auditors express an
independent opinion on the annual
fi nancial statements. Th e external audit
function provides reasonable, but not
absolute, assurance on the accuracy and
reliability of fi nancial disclosures. Th e
external auditors’ plan is reviewed by the
audit and risk committee to ensure
signifi cant areas of concern are covered,
without encroaching on the external
auditors’ independence and right
to audit.
Th ere is close co-operation between
internal and external auditors with the
aim of ensuring appropriate combined
audit coverage and minimisation of
duplicated eff ort.
Internal controlSystems of internal control are designed
to manage, rather than eliminate, the risk
of failure to achieve business objectives
and can provide reasonable, but not
absolute, assurance against
misstatement or loss.
While the board of directors is
responsible for the internal control
systems and for reviewing their
eff ectiveness, responsibility for their
actual implementation and maintenance
rests with executive management.
Th e systems of internal control are based
on established organisational structures,
together with written policies and
procedures, and provide for suitably
qualifi ed employees, segregation of
duties, clearly defi ned lines of authority
and accountability. Th ey also include
standard cost and budgeting controls,
and comprehensive management
reporting.
Th e Group’s treasury department is
responsible for controlling and reducing
exposure to interest rate, liquidity and
currency transaction risks. Treasury
functions and decisions are guided by
written policies and procedures as well as
by clearly defi ned levels of authority and
risk assumption. While non-leveraged
derivatives are purchased periodically to
hedge specifi c interest rate or currency
exposures, the Group treasury does not
undertake speculative fi nancial
transactions.
Th e eff ectiveness of and adherence to
internal control systems are monitored
continually through reviews and reports
by senior management, through a process
of control self-assessment, as well as
through the internal and external audit
processes. Th e process of control self-
assessment by management itself,
supplements the existing structures to
evaluate the systems of internal control,
and is designed to assess, maintain and
improve controls on an ongoing basis. All
divisions report on their assessments on
a monthly basis.
During the year under review, none of
these reviews indicated the occurrence of
any signifi cant lapse in the functioning
of internal controls.
Th e directors are satisfi ed that control
systems and procedures are suitably
implemented, maintained and monitored
on an ongoing basis by qualifi ed
personnel, with an appropriate
segregation of authority, duties and
reporting lines.
Risk managementTh e board is responsible for the total
process of risk management. Th e audit
and risk committee has specifi c
responsibility for the system of risk
management, and reviews the risk
reports of the Group twice a year,
reporting to the board on key risks facing
the Group and its associated risk
mitigation responses.
A central risk manager, reporting to the
audit and risk committee, is responsible
for setting policies and procedures on
risk management and risk fi nancing.
Th e workgroup supervises the activities
of decentralised risk management and
loss control departments. Th e
management of operational risk, a line
function, is conducted in compliance
with set policies and standards.
Performance is measured on a regular
basis through independent risk audits
carried out by a central risk management
function, assisted by independent
consultants.
Th e Group has adopted a continuous,
systematic and integrated enterprise-
wide risk management process that
focuses on identifying, assessing,
managing and monitoring all known
forms of risks across the Group.
Management, assisted by external
consultants, continues to further develop
and enhance its comprehensive risk
management framework and related
controls. Th is includes the training and
communication, continuous control self-
assessment by line management and
comprehensive reporting.
Major risks are the subject of ongoing
attention of the board of directors and
are given particular consideration in the
Group’s annual business plans, which
they approve.
Th e most signifi cant risks currently
faced by the Group include those
pertaining to regulations, brands, failure
to achieve international objectives,
the supply chain, physical environment,
skills and people, technology as well as
currency and interest rates. Th ese risks
and risk responses are included in
the Group’s integrated risk management
programme.

36 Distell Annual Report 2007
Two Oceans is sold on every continent and takes its name from
the two great oceans that converge at the Cape – the warm
Indian and the bracingly cold Atlantic. Not only has Two Oceans
become one of Canada’s top ten wine brands,
it also holds the position as the top-selling South African wine in
that country.

37Distell Annual Report 2007
Sustainability report
Environmental sustainabilityEnvironmentWe see environmental management as
an important area of our corporate
performance. To this end we have
established an environmental working
group that identifi es, plans, implements,
reports on and reviews a range of
initiatives intended to reduce our impact
on the environment and promote best
practice in terms of sustainable
production, packaging and distribution.
While we clearly comply with all
environmental legislation, we have made
our engagement with the natural
environment a centralised corporate
focus and have established and
embedded measuring and monitoring
systems in respect of the company’s use
of water and energy, as well as our
generation of effl uent, of solid waste and
air emissions. With these systems now in
place, backed by investment in
appropriate technology, extensive
training programmes in environmental
awareness across the company, amongst
our suppliers and with local
communities, we are in the process of
setting stringent reduction targets.
At primary production level in particular,
but also at secondary production level,
environmental monitoring forms part of
the mission directed work teams
(MDWTs).
We have also focused during the year
under review in developing environmental
management systems for all our
operations in line with ISO 14001
principles, and are pleased to report that
four of our wineries – Durbanville Hills,
Plaisir de Merle, Nederburg and Bergkelder
– are now ISO 14001:2004 certifi ed.
Our key environmental priorities during
the year under review were:
Water useOur water is derived from two sources.
Almost 80% is municipally supplied, with
the balance from boreholes, dams or
rivers. With our improved capacity to
measure water usage at our primary and
secondary production sites, as well as our
offi ce buildings, gardens and public
facilities, coupled with greater staff
awareness of the need to use water
sparingly, we are better placed to reduce
our water consumption.
At all our bottle-washing facilities, for
example, we measure water usage strictly
in terms of the number of bottles washed.
We also recycle fi nal bottle rinse water
for gardening purposes. In addition, we
have installed shut-off nozzles wherever
appropriate and now make use of high-
pressure cleaning equipment at our
operational sites, replacing open-plant
cleaning and tank-rinsing procedures to
curtail both water usage and effl uent.
Effl uent generationImplementing cleaner production
practices at all primary and secondary
operations is helping to reduce the
effl uent we generate. We also work on an
ongoing basis with the University of
Stellenbosch and other research bodies to
improve the quality of our effl uent.
Our approach to the disposal of waste
water is tailored to the conditions
prevailing at each site. A little less than
82% of effl uent is sent to municipal
facilities, with the balance treated in-
house and dispersed, complying with
environmental regulations.
We have now installed cross-fl ow
fi ltration units at our three largest
primary cellars and, in one case, a
centrifuge unit as well. Th ese moves have
not only cut waste water to a signifi cant
degree but have also reduced its organic
loading downstream.
We continue to explore the development
of treatment systems with other parties,
working with other producers as well as
local authorities. We are collaborating
with other producers in the Worcester
area, for example, to implement a system
to treat our collective effl uent. Our
Wellington distillery is also working with
a range of interest groups to fi nd a
sustainable solution to treat the waste
water from grain whisky distillation
through the upfl ow anaerobic sludge bed
bioreactor.
Energy managementGovernment’s overtaxed infrastructure
and the resultant energy shortfalls have
made the need to minimise energy
consumption more pressing than ever.
We are working towards reducing
consumption and are creating a specialist
group to advise on how to further
minimise energy usage.
Air emissionsCarbon dioxide (CO
2), produced during
fermentation, energy generation and
transportation, is our biggest contributor
to air emissions. We have entered into an
agreement with Air Liquide for the
installation of a full-scale CO2 recovery
plant in Paarl. Expected to be operational
by the end of 2007, the recovery facility
will not only give us ready access to CO2
needed in many of our products, but will
signifi cantly reduce our carbon footprint.
In other smaller initiatives, CO2
emissions from boilers are being reduced
on an ongoing basis, given our
application of best-practice boiler-water
treatment and our controls to ensure
optimal coal-to-steam generation.
“We strive to be a worthy employer and a responsible corporate citizen, mindful of the impact we make at
an economic, social and environmental level”David Nurek, Chairman

38 Distell Annual Report 2007
Solid wasteIn our eff orts to reduce the impact on the
environment of the solid waste we
generate, we promote by-product
recovery and recycling as widely as
possible. Our purchasing contracts also
specify the use of safe, recyclable and
environmentally friendly materials.
We have initiatives in place to ensure
pomace is composted, tartrate residues
are collected for tartrate recovery and
yeast lees and skins are processed for
alcohol recovery. Filtration waste is
collected by a certifi ed waste contractor
to ensure safe and environmentally
friendly disposal.
Distell is a shareholder and board
member of the Glass Recycling Company.
A not-for-profi t venture involving glass
manufacturers and bottlers, it has been
endorsed by the Department of
Environmental Aff airs and Tourism. Its
mandate is to improve recycling levels
and reduce waste glass through public
awareness, capacity-building initiatives
and the provision of infrastructure, such
as glass banks, where people can take
waste glass for recycling. Th e initiative
aims to help at least 80 recycling
entrepreneurs to establish themselves,
ultimately leading to new jobs for several
thousand people a year. To date, about
100 entrepreneurs operating nationally,
have created 5 000 informal jobs for glass
collectors.
Other solid waste generated on our
production sites, such as paper and
plastic waste, is sold to companies for
recycling.
Integrated production of wine (IPW)Distell is fully compliant with IPW, which
promotes sustainable wine production
and is rated one of the most progressive
systems of its type worldwide.
Organic winegrowingTh e organically cultivated vineyards on
Distell farms Plaisir de Merle and
Papkuilsfontein, have been accredited by
Swiss-based Société Générale de
Surveillance (SGS), the international
body that monitors organically grown
agricultural foodstuff s. Varietals
cultivated on these blocks include
Sauvignon Blanc, Chardonnay,
Sangiovese and Pinotage. Our Nederburg
cellar has also been accredited by SGS for
the production of organic wines.
Biodiversity and Wine Initiative (BWI)Th e BWI is a pioneering partnership
between the local wine industry and the
conservation sector aimed at minimising
any further loss to the highly threatened
Cape Floral Kingdom (CFK), the smallest
on the planet but home to as many as
9 600 plant species, more than found
across the entire Northern Hemisphere.
Some 90% of local wine production
occurs within the CFK, which is also a
World Heritage site and a conservation
hotspot.
To become a member of the BWI,
producers have to incorporate biodiversity
best practices in their farming operations,
enhancing the suitability of vineyards as
habitat for biodiversity through eco-
sensitive measures, and reducing the
negative impact of farming practices on
the surrounding natural habitat. Distell
farms that are now BWI members include
Plaisir de Merle, Papkuilsfontein and
Lomond.
Amarula Elephant Research ProgrammeWith elephants becoming increasingly
restricted to small, fenced reserves, they
pose unique problems to game reserve
managers, given their large size, social
nature and their vast consumption of
vegetation. Th e Amarula Elephant
Research Programme is a long-term
research initiative that brings together
expertise from a range of disciplines
within the University of KwaZulu-Natal,
as well as from other academic
institutions both in South Africa and
internationally. Using a team of full-time
and part-time researchers, as well as PhD
and MSc students, the programme, for
Sustainability report (continued)

39Distell Annual Report 2007
which Amarula is providing R3 million
over a fi ve-year period, involves
Government conservation agencies and
private game reserves, as well as
ecologists, in generating elephant
management plans based on data
collected. Th e programme is directed by
Professor Rob Slotow and is intended to
contribute strategically to elephant
conservation. Recent projects have
included a study into the behaviour of
female elephants in the Kruger National
Park and their impact on their physical
environment. Th e research explores how
elephants move through their range and
seeks to identify what prompts their
migration to certain locations. Making
use of a satellite tracking system similar
to those used in cars, researchers are able
to record very precise location data.
Findings will provide key information in
the management of elephant populations
at the Park that will also be applied in
other reserves.
Th e Amarula Elephant Research
Programme has also been engaged in an
initiative to protect the rare sand forest
in Maputaland, under threat from
elephants. Once disturbed, sand forest
habitat is slow to regenerate and becomes
susceptible to alien invasion, making it
vulnerable to fi re. Th e programme has
used a series of interventions that include
reducing the elephant population by
relocating some of the animals to other
reserves and the use of immuno-
contraception, as well as the erection of
two-strand electric fencing 1,3 metres
above the ground. Th e fences prevent the
entry of elephants but allow the freedom
of movement of other animals. Th e
successful outcome of the project has
prompted other reserves to follow similar
interventions to protect sand forests
elsewhere.
Flight of the Fish Eagle sponsors Breede River Fish Eagle ProjectBrandy brand, Flight of the Fish Eagle, is
sponsoring a three-year study being
undertaken jointly by conservation body
Birds of Prey Working Group of the
Endangered Wildlife Trust and the
University of Cape Town. Its long-term
goal is to develop a systematic chemical
pollution profi le for the entire Breede
River from source to mouth, and to
determine how effi ciently the African fi sh
eagle (Haliaeetus vocifer) and other
selected raptor species refl ect that profi le.
Zones of particular concern, in terms of
both pesticide concentrations and overall
water quality, will be identifi ed along the
length of the river. Th e results should
facilitate the development of a more eco-
friendly and sustainable approach to
agriculture and water management
within the river’s catchment area. It is
also envisaged that it will reduce
pollution beyond the Breede River and
the Western Cape as the fi ndings are
intended to inform national decision-
makers of the relative impact of chemical
pollution on South African water systems
and agricultural landscapes.
World Wide Fund for Nature (WWF-SA) and Peace Parks Foundation (PPF)Distell’s relationship with WWF-SA
continues into its 40th year. Involvement
includes the protection of habitats,
conservation of species and natural
resources.
Distell also supports the Southern
African Wildlife College, a joint initiative
of WWF-SA and the PPF. A training point
for game rangers throughout the
Southern African Development

40 Distell Annual Report 2007
Sustainability report (continued)
Community (SADC) region is located in
the Kruger National Park. Th e company
sponsors the prizes for the top certifi cate
and diploma course students every year,
many of whom go onto middle and senior
management conservation positions in
leading game parks on the African
continent.
Kenya Wildlife Society (KWS)Th e company, via Amarula, provides
support to this initiative of the Kenyan
government to promote and
communicate the importance of
conservation, highlighting its activities
in brand-related news and
advertisements. Co-branded clothing,
featuring KWS and Amarula, is also sold
to raise funds for conservation work.
Social sustainabilityPublic healthResponsible drinking
Distell recognises the social benefi ts of
moderate and responsible consumption
of alcoholic beverages. Th ere is also
increasing evidence to support the
benefi cial eff ect on health that carefully
regulated consumption can have,
positively impacting on coronary health,
cognitive function, as well as other areas.
At the same time, it cannot be denied that
excessive or irresponsible consumption of
alcohol may result in negative personal,
social or health consequences.
As we believe our employees are our most
important ambassadors, we have made
the culture of moderation an essential
focus of the Distell culture and ensure it
is maintained at company events. We also
run awareness campaigns as an integral
feature of staff communication so our
people are well supported to follow
responsible drinking patterns in their
own environments. A recent example was
the hard-hitting, multilingual play, Love
Child, that raises awareness of foetal
alcohol spectrum disorder (FASD). It was
initially staged on Distell farms before
being taken to outside communities as
part of the company’s broader social
initiatives.
Our role in promoting awareness of
FASD has been furthered through
our sponsorship of training programmes
for public health workers. Th ese
programmes are designed to train
workers in identifying and managing
FASD patients.
We acknowledge that meaningful
targeting of abuse is the collective
responsibility of the alcoholic beverage
industry, national and provincial
government, local authorities and
police services.
It is for this reason that the company
co-operates very closely with the Industry
Association for Responsible Alcohol Use
(ARA) to promote and execute a
constructive approach to alcohol use and
abuse. Moreover, Michael Mokhoro,
Distell’s head of regulatory aff airs, has
been appointed chairman of the
organisation and will be devoting a
signifi cant portion of his time to ARA
activities and issues. Th e ARA represents
the industry in liaison with Government,
the Advertising Standards Authority and
law enforcement agencies and researches
and funds a variety of initiatives into
targeting and supporting those at risk.
Projects include life-skills education for
urban and rural children, youth and adult
communities; the identifi cation of
alcohol-related health risks; intervention
among vulnerable groups through
counselling and rehabilitation; running
pedestrian-focused campaigns; targeting
urban youth through the Rock Challenge,
a three-year initiative, now in its second
year, that uses rock music as a vehicle to
raise awareness of responsible lifestyle
habits; providing training to licensees to
develop and entrench a culture of
moderation among patrons and to
eliminate under-age drinking. Currently,
the organisation is addressing ways to
ensure compliance with specifi c
provincial legislation, beginning with the
Eastern Cape.
Th e ARA has also recently established a
complaints line accessible to the public to
augment eff orts to monitor non-
compliance.
A major area of ARA’s involvement is
research into and creating awareness of
the dangers of alcohol-related illnesses,
and to this end it was instrumental in
establishing the Foundation for Alcohol-
Related Research (FARR) in 1996. Th e
FARR, whose administration is funded by
ARA, is based at the medical schools of
both the University of Cape Town and the
University of the Witwatersrand and is

41Distell Annual Report 2007
chaired by Human Genetics professor
Denis Viljoen, who is also a specialist
paediatrician and ranked as a world
authority on FASD.
Th e FARR, now funding its fourth
research fellow, has played a signifi cant
role in studying the incidence of FASD
amongst communities throughout the
country and in exploring the relationship
between the disease and patterns of
alcohol consumption among pregnant
women.
Based on the fi ndings of the research,
which has been ongoing since the mid-
1990s, the FARR spearheaded the
establishment of the country’s fi rst FASD
support centre and safe house, in De Aar,
Northern Cape, in 2004. Th e Joan
Wertheim Centre is the joint project of
the FARR and the Northern Cape
government. In addition to providing
help to those caring for children with
FASD and their families, the centre also
raises awareness amongst communities
of the dangers of drinking among
pregnant women and provides a place of
refuge for women and their children.
A second such facility followed in
Upington, while a third is being
established in Ashton, scheduled for
completion this year. Intended to serve
the rural communities of the Boland-
Overberg communities, it is being created
in association with the Western Cape
provincial authorities. Th e possibility
of another facility in Ceres is also
being explored.
In addition, ARA also engages with
community leaders to promote the
development of stable social
environments with adequate recourse
to sporting and recreational facilities.
Recent focus has also been given to the
issue of digital marketing and parameters
for the industry to follow in the interests
of responsible communication.
Distell’s advertising principles
No conclusive evidence has been found to
prove that advertising promotes specifi c
drinking patterns. It is our view that
advertising encourages choice. It
therefore forms the platform for many of
our marketing initiatives in which we
compete for the attention of responsible
consumers, of legal drinking age.
However, we believe in responsible
advertising as demonstrated in our
advertising principles listed below. In
addition, management assumes
responsibility for compliance with these
principles. Compliance with these
principles is also a prerequisite when
awarding business to our communication
suppliers, including advertising and
public relations agencies, events
management, market research and media
buying companies and consultancies.
Th ese principles apply to all advertising,
packaging, merchandising and
promotional material produced on behalf
of the company.
1. All communication developed to
promote the consumption of our
products will be legal, decent, honest
and truthful and conform to accepted
principles of fair competition and
good business practice. It will comply
with all regulatory requirements and
always be ethical and will be
prepared with a due sense of social
responsibility. It will be mindful to
sensitivities relating to culture,
gender, race and religion and will not
impugn human dignity or integrity.
It will be free of suggestion or
encouragement of excessive or
inappropriate consumption.
Furthermore, no religion or religious
themes will be employed in such
communications.
2. Advertisements will not show or
encourage irresponsible drinking.
Th is applies, for example, to the
quantity of drink being consumed in
any advertisement. Advertisements
will also not induce people to prefer a
drink because of its higher alcohol
content or potentially intoxicating
eff ects. In addition, abstinence or
moderate consumption may not be
presented in a negative light.
3. Advertisements will be directed
towards brand selling with a view to
establishing brand loyalty but will
not set out to encourage a general
increase in the consumption of
alcohol or to change brands or the
type of alcoholic beverage consumed.
4. Liquor advertising will not be
directed at anyone under the age of
18 years. No-one associated with the
act of drinking in an advertisement

42 Distell Annual Report 2007
Sustainability report (continued)
will be younger than 25. No-one
under the age of 18 will be depicted in
advertisements except where it would
be usual for them to appear, such as
in family scenes or in background
crowds. Th ey will not be shown
drinking alcoholic beverages, nor
may it be implied that they are.
5. Advertisements will not be placed in
any medium aimed specifi cally at
children. Nor will they be directed at
those under age or be created to have
special appeal to children. Th ey will
not employ characters or icons with
special appeal to children. Moreover,
advertisements will not be
transmitted in the commercial
breaks immediately before, during or
immediately after children’s
programmes on television or radio.
6. No TV advertisement will be
broadcast during programmes with a
verifi able 30% or more viewership of
people under the age of 18 (known as
the 70/30 rule). Even in the case
where liquor sponsorship of televised
sporting events takes place, no
fl ighting of advertisements will be
permitted if at least 30% of viewers
are under the age of 18. No fl ighting of
any advertisement will take place on
weekdays between 14:00 and 17:00 or
on week-ends before 12:00.
7. Th e same 70/30 rule will apply in the
case of radio programmes but for
audiences below the age of 20 years.
However, an 80/20 rule will apply in
the case of audiences aged between
16 and 20 years. No liquor
advertisements will be broadcast
before 08:00 and between 14:00 and
17:00 on weekdays and before 12:00
on week-ends.
8. Th e 70/30 rule will apply in the case
of advertisements shown in cinemas,
with compliance achieved through
contractual arrangements with
cinema owners.
9. No liquor billboards will be placed
within 200 metres of schools,
community centres or places of
worship and no building wraps or
billboards larger than Super 96 size
will be placed within 500 metres of
schools, community centres or places
of worship.
10. Advertisements will not imply that
alcoholic beverage consumption is
essential to business and social
success or acceptance, or that refusal
is a sign of weakness. Nor will they be
based on a dare or imply any failing in
those who do not accept the challenge
of a particular alcoholic beverage.
11. Advertisements will not be suggestive
of sexual indulgence or
permissiveness or claim or suggest
that alcoholic beverages can
contribute directly to sexual success
or seduction. Nor will such
advertisements portray nudity or
near nudity. Th ey will also not be
derogatory to either gender.
12. Advertisements will not claim that
alcohol has curative qualities, nor
off er it expressly as a stimulant,
sedative or tranquilliser.
Advertisements may refer to the
refreshing attributes of an alcoholic
beverage, but will not imply that
performance can be improved
through the consumption of such
a drink.
13. Advertisements will not suggest
consumption of liquor under
circumstances which are generally
regarded as inadvisable, improper or
illegal, such as preceding or during
any activity requiring sobriety, skill
or precision. Examples of such
activities are driving, work or sport
requiring intense physical eff ort.
14. Advertisements will not depict
pregnant women.
15. Alcoholic drinks will not be
advertised in a context of aggressive
or antisocial behaviour. Nor will they
suggest any association with illicit
drugs or drug culture.
16. All advertisements in print, television
and cinema media will carry the
message “Not for sale to persons
under the age of 18”. Th e minimum
specifi cations set for displaying this
message are designed to ensure its
clear visibility. Furthermore, there
must be no variation in the wording
of the message line.
Th e following rules also apply in the case
of all promotional events undertaken in
the name of Distell:
1. Events and competitions directed at
people below the age of 18 will not be
linked to any of the company’s
alcoholic brand or sponsorship
initiatives. Th ose under the age of
18 will not be eligible to participate
in events and competitions aimed at
promoting our alcoholic beverages
and products.
2. All product launches or promotions
will exclude activities which
encourage excessive or irresponsible
consumption. Consumers who attend
such promotions will be encouraged
to assume personal responsibility for
their decision to drink or not drink
and for the quantity they consume.
3. Appropriate snacks or meals will
be available when promotions or
tastings are held.
4. On-campus promotions will be
arranged in a manner that meets
with the approval of the authorities of
the university or other tertiary
institution involved, and care will be
taken to avoid serving alcoholic
beverages to under-age consumers.
5. No promotions will be permitted that
encourage increased consumption
within a limited time period.
6. In accordance with the law, Distell
will not deliver or sell to unlicensed
outlets.
Th e following rules apply to the
packaging of Distell products:
1. Products will be packaged
attractively, making use of the
highest practical quality materials

43Distell Annual Report 2007
and may also be designed to improve
the convenience of storage, transport
and service.
2. Th e alcoholic strength of a product
will not be used as the principal
subject of any label. However, details
of alcoholic strength will be provided,
in accordance with legislation.
3. Packaging will not be designed
expressly to appeal to people under
the age of 18.
4. Labels will not convey any sexual
innuendo.
5. Packaging will not be designed to
encourage the impression that
alcohol is a bulk commodity. Nor will
degrading or colloquial terms such as
“dop”, “grog” or “booze” be used.
Distell sells exclusively to licensed traders
and works closely with its customers to
promote responsible consumption, by
encouraging them to undergo training
devised by ARA and by ensuring the
following:
1. Minors are not supplied with
alcoholic beverages. Furthermore, we
shall not supply to traders convicted
of selling alcoholic beverages to
minors or of employing staff under
the age of 16. Nor shall we supply to
traders convicted of supplying
alcoholic beverages as an inducement
to employment or in lieu of
remuneration.
2. Alcohol is not supplied to anyone who
is intoxicated. Rapid and/or excessive
consumption of alcohol is
discouraged and promotions with
this objective are disallowed.
3. Traders do not allow for activities on
their premises to result in undue
off ence, annoyance, disturbance,
noise or inconvenience to people who
reside, work or worship in the vicinity.
Skills transferFocusing on our home community, Distell
supports the Stellemploy Project that
provides training for mainly unemployed
young men in the Boland region, teaching
skills in bricklaying, painting, welding,
plumbing, electrical services and
gardening. Distell has made a building
available for training purposes. We also
provide fi nancial support to AgriTrain,
a Section 21 company that works in
conjunction with the Department of
Agriculture in the Western Cape,
Elsenburg College of Agriculture and the
University of Stellenbosch, to give
disadvantaged matriculants access to
tertiary training in viticulture and other
agricultural courses.
Last year Plaisir de Merle embarked on a
pilot trout-farming project, involving
some of the farm’s 64 workers, with
Distell providing infrastructure that
includes the use of the dams and water
supply, as well as all legal input. Th is
venture is connected to a larger initiative
led by the Hands-on Fish Farmers Co-
operative that provides a smoking service
and also markets all the fi sh, fresh and
smoked, to retailers and restaurants, on
behalf of its members. Th e co-operative is
being run in association with
Stellenbosch University’s Department of
Agriculture and Forestry Sciences, with
funding supplied by the national
Department of Science and Technology.
Th e project harvested six tons of fi sh,
resulting in a profi t for the 18 workers on
the farm who are involved. It is hoped to
extend the operations with additional
workers keen to join and thus share in the
benefi ts, broadening their skills, enabling
them to augment their income while also
exposing them to business management
training. Th e growth of the project,
however, will depend on access to
fi ngerlings.
Black economic empowerment (BEE)Distell has implemented a BEE
measurement system that conforms to
the Department of Trade and Industry’s
Codes of Good Practice, released in
November 2005.
Externally audited, the system has
accorded us an interim score rating of
fair broad-based (BB) contributor and we
are placed at level 6, enabling our
customers to claim 60% of their
expenditure on Distell for the purposes of
their preferential procurement ratings.
Th ese ratings will remain valid until
February 2008, by when we hope to have
been re-evaluated in accordance with
Government’s updated 2007 Codes of
Good Practice.
Enterprise, skills development and skills transferPapkuilsfontein Vineyards
Papkuilsfontein Vineyards is jointly
owned by Distell, a consortium of
Gauteng entrepreneurs and a community
trust, and supplies grapes to Nederburg.
It also produces its own range, the award-
winning Tukulu label. When the farm was
purchased in 1998, the plan was to
develop 330 hectares to vineyards with
much of the rest of the farm being
earmarked for conservation. After
extensive soil testing, it turned out that
a total of 375 hectares could be planted,
now cultivated in full. Of these,
approximately 20 hectares are farmed
organically and have been accredited by
the SGS. To date, all vineyards on the
farm have been farmed without
irrigation, thanks to suitable climatic
conditions, soils with good water
retention, and the planting of cover crops
between vine rows. Papkuilsfontein is a
member of the BWI.
Durbanville Hills
Durbanville Hills is one of Distell’s
leading wine brands. Th e venture
includes a winegrowing and winemaking
skills transfer initiative for farm workers
and a share ownership component.
A workers’ trust has been allocated
50 000 shares (5% of the total), while a
portion of wine sales revenue is also
devoted to the workers’ trust.

44 Distell Annual Report 2007
Sustainability report (continued)
Trustees include employee
representatives appointed by the workers
on the nine member farms of the
Durbanville Hills venture who decide on
the distribution of shares, as well as how
dividends can be spent in a way that
benefi ts the workers and their families.
To avoid confl ict of interest, trustees may
not take up shares.
Apart from the wine operation which has
a capacity to process 8 000 tons of grapes
a year, Durbanville Hills has also
established a small olive-growing project.
Some fi ve hectares of olive groves have
been planted and are farmed under
contract with the revenue going to the
workers’ trust.
A dedicated co-ordinator has been
appointed to oversee the provision of life-
skill, literacy and health education
programmes for the approximately
170 workers and their families. Th e
programmes include recreational and
sporting initiatives.
Durbanville Hills is also a sponsor of the
Durbanville Schools Foundation,
providing infrastructure to
disadvantaged schools in the area, as well
as assisting with tuition and hostel
accommodation fees.
Empowerment of poor rural
communities in the Northern Cape
and Free State
Distell has initiated and structured an
empowerment initiative with several
wine industry players to provide skills
training and income to marginalised
rural communities in the Northern Cape
and Free State, bringing them into the
wine industry and opening up
opportunities for land ownership.
Parties involved with Distell include wine
research body Winetech, VinPro, the
South African Wine Industry Trust
(SAWIT), as well as Griekwaland Wes
Korporatief Limited, Oranjerivier
Wynkelders and SENWES Limited,
together with the provincial governments
of the Free State and Northern Cape.
All these localised farming initiatives
have been co-ordinated under the aegis of
a Section 21 company established as the
Northern Cape/Free State Vineyard
Development Company. Distell is
represented as one of its members, along
with Winetech, SAWIT, VinPro and the
three co-operatives.
Th e low-tech, labour-intensive scheme
has been conceived to ensure Distell a
cost-eff ective source of distilling wine.
Using virgin land that does not require
the grafting of vines onto rootstock and
thus reducing input costs, applying low-
cost trellising, as well as fl ood irrigation,
the intention is to establish high-density
vineyard plantings on some 700 hectares.
Expected to ultimately yield an average of
45 tons per hectare, crops will be
processed at existing wine cellars with
underutilised capacity. All players
involved are optimistic about achieving
this goal, given that as early as the second
year some growers have already been able
to produce as much as 18 tons per
hectare, although yields range from 13
to 18 tons per hectare.
Distell is guaranteeing the uptake of
crops, once in production, to meet its
needs. We are also involved in providing
management and technical
infrastructure, as well as training to
emergent farmers involved in the project,
with Ernst le Roux as chairman. Th e
project is also involved in the national
Department of Agriculture’s mentorship
programme.
Th e fi rst phase involved experimentation
with various winegrowing techniques
and varietals by a team of viticulturalists
at the Agricultural Research Council’s

45Distell Annual Report 2007
research station in Upington, as well as
by individual commercial farmers, keen
to participate. Th e second phase, now
under way, involves the establishment of
small-scale vineyards in Upington,
Douglas and Hartswater, ranging in size
from 0,5 to 2,5 hectares.
Land is being made available through a
variety of measures, including land
restitution, loans granted by farmers,
land given or leased by farmers and the
leasing of Government and municipal
property. A two-year 50-hectare
commercial planting programme,
originally scheduled to begin last year,
will begin later this year at Jacobsdal.
Depending on the quality of the grapes, it
is possible that some of the fruit could be
distilled into potstill brandy to meet the
demands of this fast-growing segment of
the burgeoning brandy market. It is also
possible that the project could be further
extended to include plantings for grape
concentrate and thus off er an additional
source of revenue.
Lutouw, Olifants River
Distell is a major supporter of Lutouw
Estates, the high-quality wine-farming
venture at Lutzville situated along the
Olifants River, some 6 km from the sea
and where a dam has been built to irrigate
arable land. Th e company currently
purchases premium grapes for its Fleur
du Cap Unfi ltered range as well as for
other top-end brands. Workers on the
farm hold a 40% share in the venture in
which viticultural services are provided
on a contractual basis by self-employed
workers fi rst trained in agricultural and
business skills for the purpose.
Th e venture was established in 2000 by
two leading Lutzville wine farmers,
Truter Lutz and Jan Louw, with the
SAWIT warehousing shares on behalf of
workers. Lutz and Louw have also
assisted the farm workers to establish
specialised business units contracted to
carry out work on the farm.
After initially planting 60 hectares of
vineyards, Lutouw Estates cultivated a
further 37 hectares to white varietals,
with Distell providing surety to fi nance
the new plantings.
Uylenkraal, Gansbaai
Distell has acquired a 75-hectare farm
adjacent to Lomond Wine Estates in
Gansbaai, which has been bought
expressly for the purpose of establishing
a BEE venture involving workers on the
farm, as well as those from the
neighbouring Lomond. Th e company’s
soil scientists and viticulturalists have
assessed the property to determine the
ideal varietals for cultivation. Last year
11 hectares were planted to Sauvignon
Blanc and Cabernet Sauvignon. A further
3,5 hectares will be planted this year and
will include Pinot Noir. It is expected that
30 hectares will be cultivated eventually.
Preferential procurementDistell spent R4,0 billion on the purchase
of service and materials from its suppliers
during the year under review. To date, the
majority of suppliers, who represent 70%
of total supplier spend, have been
assessed in terms of their ability to meet
BEE criteria. We have evolved long-term
partnerships with a substantial portion
of our strategic suppliers, particularly
those of raw materials and packaging
with whom there is extensive joint
investment in research, development and
application, and, in the same spirit, we
are working closely with them to enhance
their BEE status, assisting them to follow
company-established policy guidelines
46 Distell Annual Report 2007
Sustainability report (continued)
and procedures. Moreover, all potential
new vendors are required to comply with
Distell’s BEE requirements before
relationships can be formalised.
Distell is also actively engaged in
assisting small-scale suppliers with
infrastructural support and training,
where necessary, to ensure they meet
company-specifi ed quality standards.
Currently, small suppliers supported by
Distell include those operating in the
fi elds of long-distance transport, bottles
and merchandising materials.
Mirma
Th e marula fruit used to make Amarula
Cream is harvested from January to March
in a 500-km radius around Phalaborwa, as
far south as Acornhoek and
Th ulamahashe in Mpumalanga. While the
fruit is harvested annually during this
three-month period, the remaining nine
months of the year off er little economic
activity to sustain the people in these
marginalised rural communities. It is
estimated that some 60 000 people are
dependent on the income produced from
the marula harvest. It was against this
background that in 1998, Distillers
Corporation, together with tribal indunas
representing the communities in these
areas, established the Section 21 Mirma
Product Development Company. In
addition to managing the collection of
marula fruit harvests from the relevant
communities and transporting them to
Distell’s factory in Phalaborwa, the
development company also conceives and
initiates other revenue-producing projects
within these communities and develops
the infrastructure to enhance general
quality of life.
Distell and the development company
have jointly fi nanced a crèche in
Hnlangasi in Khenyi, as well as a clinic
and community hall in Phalaborwa for
the Edinburgh community, most recently
funding equipment for the clinic and
providing running water for the crèche.
At present, negotiations are under way
with the local authorities to obtain
permission to build another clinic in
Dumphries, serving settlements as far as
Th ulamahashe.
Distell has also trained community
members in brick-making and wire-fence
construction.
Owner driver scheme
Our owner driver scheme, established in
1999, made it possible for drivers,
originally employed by the company, to
establish their own enterprises and
undertake deliveries on our behalf to
retailers and on-consumption outlets.
Th ey have been trained in business
management and administration,
guaranteed an income by being
contracted to undertake deliveries and
given access to funding to acquire their
vehicles. In addition, a technical mentor
provides training in vehicle upkeep and
arranges breakdown repairs at
reasonable cost, and, where required,
trains driving crew.
We continue to provide ongoing business,
management and technical support to
the owner drivers through a structured
liaison programme. Moreover, every six
months all the vehicles in the scheme are
subjected to a full technical audit by
Distell-appointed technical personnel to
ensure the highest safety standards are
maintained.
Th e national scheme involves 105 drivers,
employing 369 assistants, to service all
17 of Distell’s distribution centres in
South Africa, but is set to expand, given
the growth in sales nationwide. At
present, 98% of deliveries from these
17 distribution centres are handled by the
owner drivers, with the company paying
R64 million for their services during the
year under review. In addition to their
steady monthly income derived from
their participation in the project,
owner drivers are free to undertake
deliveries on behalf of other clients,
provided there is no confl ict of interest.
Engaging with the wider communityTh e company’s Staff Volunteer
Programme helps employees to make a
meaningful contribution to the
communities within which they live and
work. A Crises Welfare Programme,
designed to respond rapidly to
communities ravaged by natural
disasters and fi res also forms part of the
company’s corporate social investment
strategy.
In addition, the Distell Foundation,
chaired by board member Gugu
Mthethwa, has been established to
allocate funds to needy organisations.
Sponsorships are to be directed to,
amongst others, job creation initiatives,
the reintegration of street children into
society and hospital equipment for the
treatment of FASD.
Distell also contributes to the Charity
Wines Trust by donating Nederburg
wines. Th ese are sold in cases of six
bottles each at R250 per case, with
proceeds used to fund a range of
initiatives that impact positively on the
quality of life of wine-farm workers and
their families. Some of the benefi ciaries of
the charity trust are the Pebbles Project,
the Anna Bram Foundation and the
Association for the Sensory Disabled.
Funds are used to purchase sporting and
learning equipment, clothing and
infrastructure.
Distell also supports a number of health-
related initiatives via the Nederburg
Charity Trust, whose benefi ciaries are the
Hospice Palliative Care Association of
South Africa, Organ Donor Foundation
and an HIV/Aids support non-
governmental organisation called

47Distell Annual Report 2007
Mothers2Mothers. At last year’s
Nederburg Auction over R322 000 was
raised and shared equally amongst the
three organisations. Amongst those items
auctioned were 50 cases of 2005
Nederburg Amateur White, a wine
created for this purpose by the
winemaking team and donated by
Nederburg.
Arts and cultureFor more than four decades, Distell has
been actively supporting the arts in South
Africa, based on the belief that music,
dance and drama help to cross cultural
divides, promote better understanding
amongst South African communities,
advance and empower talent, enhance
quality of life and create jobs.
During the year under review, the
company helped to support dance, poetry
performances, music and drama.
Highlights included sponsorship of:
• Th e Fleur du Cap Th eatre Awards,
amongst the most important of its
kind in South African theatre,
opportunity to perform on stage with
a professional orchestra. Th is event,
now in its 36th year, serves as an
important launching pad for young
musicians.
• Th e Jazzart Dance Th eatre Young
Adult Training and Job Creation
Programme gives trainees the
opportunity over a three-year period
to participate in professional theatre
productions, to make television
appearances and acquire practical
experience. Th ey are trained in
African music, African dance, ballet
and various other styles of dance, as
well as in basic lighting design,
theatre craft, choreography,
improvisation, voice and physical
theatre.
• Magnet Th eatre’s Educational
Outreach Projects, which include the
Community Groups Intervention, the
Directors’ Workshops and the
Clanwilliam Arts Project, contribute
signifi cantly to capacity building and
skills transfer.
• Th e Voorkamerfest in Darling off ers
audiences and performers the unique
experience of theatre in the
presented for the 40th year. Th ese
annual awards for distinguished
acting, directing and technical talent,
were initiated in 1967. Funds made
through ticket sales to the annual
gala presentation dinner are donated
to a development project in the
performing arts.
• Th e Oude Libertas Summer Season
presented at the renowned Oude
Libertas Amphitheatre in
Stellenbosch, featuring an array of
local and international artists, both
established and upcoming.
• Th e Kayamandi Art Project, a
Stellenbosch community arts
development initiative presented in
collaboration with the Greater
Stellenbosch Trust and the
Woordfees. Young township artists
develop skills in entrepreneurship,
dancing, singing and drama through
regular workshops and mentoring.
• Th e Classical & Jazz Music Festival
presented by Artscape and the Cape
Philharmonic Orchestra, where
exceptionally talented young
instrumental soloists and singers
from the Western Cape are given the

48 Distell Annual Report 2007
voorkamers (living rooms) of Darling’s
residents. Th ere are six routes, with
each presenting three voorkamer
stops. Performances take place in
homes that range from small
township dwellings to grand
Victorian homesteads. Local taxis are
used as transport to the venues.
• Th e Ikhwezi Community Festival is
an outreach drama project presented
by the Baxter Th eatre. Young talent
from Cape Town and the rural areas
of the Western and Eastern Cape is
given six-month workshops in the
fi eld and four-week pre-production
rehearsals to prepare them for a
three-week run at the Baxter Th eatre.
• Emerging artists appearing in a range
of arts festivals, including the
Woordfees, Klein Karoo Nasionale
Kunstefees, Aardklop, Grahamstown,
Cape Town, Suidooster, Hilton, Whale,
Volksblad, Kalfi e and Cederberg
Festival.
• New indigenous productions by South
African playwrights.
Heritage CollectionDistell is the custodian of a collection of
unique, priceless and important heritage
assets, including the homesteads of
Nederburg and Plaisir de Merle, and,
together with Lusan Holdings, maintains
several other well-known national
monuments, like the Uitkyk,
Le Bonheur and Neethlingshof manor
houses. Th ese buildings, some dating
back to the late 17th century, together
with Distell’s collection of antique Cape
furniture from the 18th and 19th
centuries, are among the most signifi cant
to refl ect the Cape’s wine-related history
and culture.
Distell also has an extensive collection of
historical wine and brandy-related
artifacts, displayed at our wine and
brandy cellars. Th ese items are of great
interest and educational value to local
and overseas visitors.
Only authentic traditional museum
techniques are used to conserve and
restore the antiques in the care of Distell,
with all such activities overseen by
a curator appointed for this purpose.
A central register of all the antiques,
implements and wine presses is
maintained at Distell’s archives, where
books, photographs, video material,
documents and information relating to
the company’s history, its people and
products are also maintained, as well as
research material on the wine and brandy
industries.
During the year under review, the
interiors of Nederburg’s Manor House
were refurbished in keeping with the
period furniture and artefacts, to
coincide with the upgrade of the winery’s
wine-tasting and sales areas. Th e wine-
tasting facility at the Drostdy in Tulbagh
was also upgraded in harmony with the
heritage environment.
Sustainability report (continued)

49Distell Annual Report 2007
Our peopleOur human resources department is
achieving its goal of becoming a truly
strategic partner to the business.
Highlights during the year included:
• Bringing all human resources
procedures and policies in line with
ISO requirements.
• Ongoing focus on competency
profi ling, identifying skills gaps and
aligning recruitment with needed
skills, as well as on competency
training. Our competency model
ensures fair selection processes and
focused training interventions, and it
serves as a basis for career guidance.
Continuous learning is encouraged to
augment skills.
• Integrating performance
management assessments with
competency profi ling to maximise
the potential of our people, giving
them the appropriate skills where
needed.
• Ongoing focus on developing leaders
through leadership development and
training.
• Th e initiation of an apprenticeship
programme that is to be expanded in
the coming year.
Mission directed work teams (MDWTs)Our MDWTs provide a key
communication tool to the business and
are used at every level, from top
management to operations. Focused on
promoting a culture of quality and cost-
effi ciency, they are also designed to boost
morale and commitment. We now have
235 such teams across the business and
their establishment has served to
enhance employee performance,
encourage a sense of ownership and
accountability in terms of responsibility,
increase co-operation and foster a
climate of mutual respect. In addition,
confl ict handling has been greatly
facilitated.
Training and career development programmesWe recognise that key to maintaining a
competitive advantage is the
development of functional expertise and
leadership talent across all facets of our
business. We have exceeded our overall
training targets for the year and are
comfortably ahead in the areas of career
development and sales training, as well
as leadership and management training
and operational training.
A. Our sales and marketing training
focused on the upliftment of Distell-
specifi c marketing competencies,
generic sales training and
merchandising training. Our
customer care consultants also
received training during this period.
B. Our initiatives around leadership
development focused on supervisory
skills on various levels, as well as
Distell’s leadership development
programmes (DLDP) in conjunction
with Gibs. Due to the roll-out of the
competency profi ling process, more
leadership development training has
been rolled out than planned for, to
address immediate needs.
797
730 91
5
416
2 03
3
1 88
7
4 89
4
3 50
2
A B C D
People trained
Year to date = 8 639
Annual target = 6 535

50 Distell Annual Report 2007
C. We continued with the
implementation of organisational
development and completed more
drug, HIV/Aids and alcohol aware-
ness programmes than planned for.
D. Our operational training focuses on
statutory training, health and safety
training, MDWT training and
standard operating practice training.
Learnership and skills programmesDuring the period under review
180 people completed their learnerships.
Th ese were in fi rst-line manufacturing,
freight handling, packaging and other
skills.
InternshipsDistell is a frontrunner in
accommodating interns from tertiary
institutions. During the year, we hosted
21 interns who gained valuable
experience that they could apply to
workplace practices. Th ey represented
the fi elds of food technology, sales,
marketing, quality assurance and human
resources. Based on the success of the
initiative, we plan to expand its scope
during the current year, to include more
students across a greater spectrum of
disciplines.
Adult basic education trainingA total of 110 people were assisted to
become functionally literate during the
year under review.
Employee assistanceTh e company provides non-stigmatised,
confi dential support to staff for HIV/Aids,
as well as for drug and alcohol addiction,
domestic violence and stress-related
conditions. Our HIV/Aids Know Your
Status addresses prevention, as well as
managing the disease as a chronic
condition rather than an exceptional
disease. We also run drug awareness
training and domestic life-skills
programmes, and encourage early
interventions to promote staff wellness.
Industrial relationsDistell fully supports the right to freedom
of association and collective bargaining.
Recognition, organisational rights and
conditions of employment are regulated
by collective agreements and labour
legislation. Collective relationships have
been formalised with the following three
unions:
• National Union of Food, Beverages,
Wine, Spirits & Allied Workers
• Food & Allied Workers’ Union
• Africa Wood & Allied Workers’ Union
During the year under review, we were
not aff ected by any industrial action.
Moreover, all wage negotiations were
concluded timeously at company level.
Corrective action practicesTh e Corrective Action Code, aligned to
Distell’s core values, provides the
framework for line management and staff
to operate in a principled and ethical
environment. Th e code is communicated
on an ongoing basis amongst Distell
teams and in such a way that the
implications of deviation are readily
understood. Moreover, procedures for
handling deviations from the code are
also made explicit.
Th e code focuses on cultivating:
• A sense of ownership by passionately
promoting Distell, its business
reputation and products
• An entrepreneurial spirit by
continually striving to stay ahead,
learning on an ongoing basis,
confronting problems constructively
and encouraging innovation
• A performance-driven ethos by being
accountable and striving to
continually raise standards
• A climate of mutual respect and
dignity, expressing care and
sensitivity to colleagues, suppliers
and all those encountered in the
course of duty
• Health and safety in the workplace by
upholding safety procedures and
exercising responsibility
• A climate of service by proactively
anticipating and meeting the needs of
colleagues, customers and
consumers.
Health and safetyDistell has an eff ective risk control
programme to address the risks arising
from criminal activity, fi re and
occupational safety. All Distell sites
undergo detailed compliance audits,
conducted twice a year. Reports and their
fi ndings also infl uence employee
management performance scores.
Managers are required to meet minimum
service levels, failing which, corrective
action is taken.
An overall average of 92% for health and
safety was achieved across all sites.
While external criminal activity
continues to require signifi cant
investment to mitigate risk, the number
of motor vehicle accidents during the
year refl ected a 3% decline and a 9% drop
in gross loss year-on-year.
Of the 255 occupational injuries reported
to the Compensation Commissioner,
25 required reporting to the Department
of Labour.
Employment equity (EE)In vigorously pursuing the sustainability
of our business, we treat the development
of intellectual capital as a priority,
through several initiatives including
leadership development, internships,
learnership and skills programmes. All
are focused primarily on previously
disadvantaged staff .
To date, the percentage of previously
disadvantaged individuals (PDI)
appointed to management level has
increased from 25% in 2002/03 to 36% in
2006/07. Female members of staff now
comprise 33% of management, up from
Sustainability report (continued)

51Distell Annual Report 2007
MALE FEMALE African Coloured Indian White African Coloured Indian White Total
Top management 1 17 4 22
Senior management 1 1 1 72 1 9 85
Professionally qualifi ed and experienced specialists and middle management 17 14 4 223 1 6 1 75 341
Skilled technical and academically qualifi ed workers, junior management, supervisors, foremen and superintendents 178 149 26 409 30 79 10 306 1 187
Semi-skilled and discretionary decision-making 494 512 14 52 60 147 14 198 1 491
Unskilled and defi ned decision-making 449 346 6 13 101 213 1 128
Total permanent 1 139 1 022 52 786 192 446 25 592 4 254
Non-permanent employees 35 23 1 35 36 18 40 188
Grand total 1 174 1 045 53 821 228 464 25 632 4 442
OCCUPATIONAL LEVELS – 2006/07
28% at the start of our EE project. Of the
246 promotions in the past fi scal year,
82% involved previously disadvantaged
individuals.
Over the past fi ve years, PDI promotions
at all levels have averaged 83%.
Our fi ve-year EE plan developed in 2002
expires in September 2007, necessitating
a new fi ve-year EE plan, currently being
drafted.
Percentage of staff appointed amongst previously disadvantaged individuals
Appointments %
Supervisory, sales and administrative staff
82,5%
Management level 80,0%
Promotions (all levels) 82,0%
Occupational levelsConcerted eff orts are being made by the
company to increase representativity in
all occupational categories and across all
levels through the Distell Leadership
Development Programme (DLDP),
focused recruitment, learnerships, skills
development, internships and focused
training. Competency modelling is under
way at all sites and is assisting us in
closing existing gaps and improving
employee performance.
Focus will be placed on the bargaining
unit levels in the near future to ensure
this process is rolled out throughout the
organisation during the 2007/08 year.
Overall race split 2007
Overall gender split 2007
Male 70%
Female 30%
African, Coloured, Indian 67%
White 33%

Contents
53 Currency of financial statements
53 Report of the independent auditor
54 Directors’ responsibilities for financial reporting
54 Certificate by the company secretary
55 Report of the board of directors
56 Balance sheets
57 Income statements
58 Statements of recognised income and expense
59 Cash flow statements
60 – 98 Notes to the annual financial statements
99 Annexure 1: Interest in subsidiaries
100 Annexure 2: Interest in unlisted associates
101 Annexure 3: Interest in joint ventures
Consolidated annual financial statementsfor the year ended 30 June 2007
Distell Annual Report 200752

Currency of financial statements
53Distell Annual Report 2007
Report of the independent auditorTo the members of Distell Group Limited
We have audited the annual financial statements and group annual financial statements of Distell Group Limited, which comprise the directors’ report,
the balance sheet and the consolidated balance sheet as at 30 June 2007, the income statement and the consolidated income statement, the statement of
recognised income and expense and the consolidated statement of recognised income and expense, the cash flow statement and the consolidated cash
flow statement for the year then ended, and a summary of significant accounting policies and other explanatory notes, as set out on pages 55 to 101.
Directors’ responsibility for the financial statements
The company’s directors are responsible for the preparation and fair presentation of these financial statements in accordance with International Financial
Reporting Standards and in the manner required by the Companies Act of South Africa. This responsibility includes: designing, implementing and main-
taining internal control relevant to the preparation and fair presentation of financial statements that are free from material misstatement, whether due to
fraud or error; selecting and applying appropriate accounting policies; and making accounting estimates that are reasonable in the circumstances.
Auditor’s responsibility
Our responsibility is to express an opinion on these financial statements based on our audit. We conducted our audit in accordance with International
Standards on Auditing. Those standards require that we comply with ethical requirements and plan and perform the audit to obtain reasonable assurance
whether the financial statements are free from material misstatement.
An audit involves performing procedures to obtain audit evidence about the amounts and disclosures in the financial statements. The procedures
selected depend on the auditor’s judgement, including the assessment of the risks of material misstatement of the financial statements, whether due to
fraud or error. In making those risk assessments, the auditor considers internal control relevant to the entity’s preparation and fair presentation of the
financial statements in order to design audit procedures that are appropriate in the circumstances, but not for the purpose of expressing an opinion on the
effectiveness of the entity’s internal control. An audit also includes evaluating the appropriateness of accounting policies used and the reasonableness of
accounting estimates made by management, as well as evaluating the overall presentation of the financial statements.
We believe that the audit evidence we have obtained is sufficient and appropriate to provide a basis for our audit opinion.
Opinion
In our opinion, the financial statements present fairly, in all material respects, the financial position of the company and of the Group as of
30 June 2007, and their financial performance and their cash flows for the year then ended in accordance with International Financial Reporting
Standards and in the manner required by the Companies Act of South Africa.
PRICEWATERHOUSECOOPERS INC.
Director: A Wentzel
Registered Auditor
Stellenbosch
22 August 2007
The annual financial statements are expressed in South African rand (R).
The rand cost of a unit of the following major currencies at 30 June was:
2007 2006
US dollar 7,09 7,11
British pound 14,20 13,05
Euro 9,53 9,05
Canadian dollar 6,70 6,41
Botswana pula 1,14 1,18
Australian dollar 6,02 5,28

54 Distell Annual Report 2007
Directors’ responsibilities for financial reporting
The Companies Act (Act 61 of 1973), as amended (the Act), requires the
directors to prepare financial statements for each financial year which
fairly present the state of affairs of the company and the Group and the
profits or losses for the period. In preparing these financial statements,
they must:
• select suitable accounting policies and apply them consistently;
• make judgements and estimates that are reasonable and prudent;
• state whether set accounting standards have been followed, subject
to any material departures disclosed and explained in the financial
statements; and
• prepare the financial statements on the going concern basis unless it is
inappropriate to presume the Group will continue in business.
The directors are responsible for keeping proper accounting records, which
disclose with reasonable accuracy at any time the financial position of the
company, to ensure the financial statements comply with the Act. They
have general responsibility for taking such steps as are reasonably
accessible to them to safeguard the assets of the Group and to prevent and
detect fraud and other irregularities.
These annual financial statements are prepared in accordance with
International Financial Reporting Standards and incorporate full and
responsible disclosure in line with the accounting policies of the Group,
supported by reasonable and prudent judgements and estimates.
The board of directors approves any change in accounting policy, with
their effects fully explained in the annual financial statements.
The directors have reviewed the Group’s budget and cash flow projections
for the period to 30 June 2008. Based on these projections, and considering
the Group’s current financial position and the financing facilities available
to it, they are satisfied it has adequate resources to continue its operations
in the foreseeable future. The annual financial statements were prepared
on a going concern basis.
No event, material to the understanding of this report, has occurred
between the financial year-end and the date of this report.
A copy of the financial statements of the Group is available on the
company’s website. The directors are responsible for the maintenance and
integrity of statutory and audited information on the company’s website.
The annual financial statements as set out on pages 55 to 101 have been
approved by the board of directors and are signed on their behalf:
DM Nurek JJ Scannell
Chairman Managing Director
Stellenbosch
22 August 2007
Certificate by the company secretary
In my capacity as company secretary, I hereby confirm, in terms of the Companies Act, that for the year ended 30 June 2007, the Group has lodged with the
Registrar of Companies all such returns as are required of a public company in terms of this Act and that all such returns are true, correct and up to date.
CJ Cronjé
Company secretary
Stellenbosch
22 August 2007

Report of the board of directorsfor the year ended 30 June 2007
The board has pleasure in reporting on the activities and financial results
for the year under review:
Nature of activities
The company is an investment holding company with interests in liquor-
related companies.
The Group is South Africa’s leading producer and marketer of wines,
spirits and flavoured alcoholic beverages.
Group financial review
Results
Year ended 30 June: 2007 2006
R’000 R’000
Revenue 7 954 602 6 717 210
Trading income 1 114 733 889 395
BEE share-based payment – (67 241)
Attributable earnings 847 853 534 388
– Per share (cents) 425,9 270,7
Headline earnings 779 294 535 970
– Per share (cents) 391,5 271,5
Adjusted headline earnings 779 294 603 211
– Per share (cents) 391,5 305,6
Total assets 5 997 095 5 475 078
Total liabilities (2 056 415) (2 159 030)
The annual financial statements on pages 55 to 101 set out fully the
financial position, results of operations and cash flows of the Group for the
financial year ended 30 June 2007.
Dividends
Total dividends for the year (R’000)* 392 470 303 934
– Per share (cents) 196,0 153,0
* The final dividend of 109 cents (2006: 85 cents) per share was declared after year-end
and was therefore not provided for in the annual financial statements. Refer to note 29
to the annual financial statements for payment details.
Accounting policies and comparative figures
The Group changed its accounting policy on 1 July 2006 by adopting the
option in the amended statement of International Financial Reporting
Standards dealing with Employee Benefits (IAS 19), to recognise all actuarial
gains and losses in retirement benefit obligations outside profit and loss in
the period in which they occur in the statement of recognised income and
expense, and by early adopting IFRIC Interpretation 11 dealing with Group
and Treasury Share Transactions which addresses the issue of share-based
payment arrangements that involve two or more entities within the same
group.
Details of these changes are contained in note 37 to the annual financial
statements.
55Distell Annual Report 2007
Subsidiary companies and investments
The Group acquired interests in the following associates and joint ventures
during the current financial year:
– Grays Inc Limited (Mauritius) (26%)
– Lomond Wine Estates (Proprietary) Limited (50%)
– Interim Sahara LLP (United Kingdom) (50%)
Particulars of subsidiary companies, associated companies and joint
venture companies are disclosed in Annexures 1, 2 and 3 respectively.
Directors
The names of the directors, their attendance of meetings and their
membership of board committees appear on page 12.
Daan Prins resigned as director during the course of the year and we thank
him for his valuable contributions. Robert Lumb was appointed to the
board of directors with effect from 19 October 2006.
Directors’ interests and emoluments
Particulars of the emoluments of directors and their interests in the issued
share capital of the company and in contracts are disclosed in notes 39 to
41 to the annual financial statements.
Events subsequent to balance sheet date
The directors are not aware of any matter or circumstance arising since
the end of the financial year that would significantly affect the operations
of the Group or the results of its operations.
Holding company
The holding company of the Group is Remgro-KWV Investments Limited.
The Group structure appears on page 3.
Secretary
The name and address of the company secretary appears on the inside
back cover.
Approval
The annual financial statements set out on pages 55 to 101 have been
approved by the board.
Signed on behalf of the board of directors:
DM Nurek JJ Scannell
Chairman Managing director
Stellenbosch
22 August 2007

Balance sheetsat 30 June
ASSETS
Non-current assets
Property, plant and equipment 3 1 330 516 1 256 900 – –
Biological assets 4 114 675 104 380 – –
Financial assets 5 72 822 403 107 – –
Investments in subsidiaries 6 – – 1 680 041 1 661 622
Investments in associates 6 23 270 15 383 – –
Intangible assets 7 34 060 11 211 – –
Retirement benefit assets 15 187 052 48 795 – –
Deferred income tax assets 16 28 762 36 770 – –
Total non-current assets 1 791 157 1 876 546 1 680 041 1 661 622
Current assets
Inventories 8 2 703 336 2 499 217 – –
Trade and other receivables 9 809 024 617 097 – –
Financial assets 5 361 152 254 640 – –
Cash and cash equivalents 332 426 227 578 – –
Total current assets 4 205 938 3 598 532 – –
Total assets 5 997 095 5 475 078 1 680 041 1 661 622
EQUITY AND LIABILITIES
Capital and reserves
Share capital 11 601 800 588 365 604 020 592 478
Non-distributable and other reserves 12 295 959 189 599 96 430 89 553
Retained earnings 13 3 040 443 2 535 319 979 591 979 591
Attributable to equity holders of the company 3 938 202 3 313 283 1 680 041 1 661 622
Minority interest 2 478 2 765 – –
Total equity 3 940 680 3 316 048 1 680 041 1 661 622
Non-current liabilities
Interest-bearing borrowings 14 2 629 330 646 – –
Retirement benefit obligations 15 12 842 12 191 – –
Deferred income tax liabilities 16 164 033 120 647 – –
Total non-current liabilities 179 504 463 484 – –
Current liabilities
Trade and other payables 17 1 386 401 1 093 191 – –
Interest-bearing borrowings 14 329 264 432 502 – –
Provisions 18 103 539 103 010 – –
Current income tax liabilities 57 707 66 843 – –
Total current liabilities 1 876 911 1 695 546 – –
Total equity and liabilities 5 997 095 5 475 078 1 680 041 1 661 622
Net asset value per share (cents) 1 972,7 1 666,6
GR OU P C OM PAN Y 2007 2006 2007 2006
Notes R’000 R’000 R’000 R’000
56 Distell Annual Report 2007

Income statementsfor the years ended 30 June
Sales volumes (litres ’000) 391 889 342 633 – –
Revenue 19 7 954 602 6 717 210 342 914 120 996
Operating expenses 20 (6 839 869) (5 827 815) – 750 325
Trading income 1 114 733 889 395 342 914 871 321
BEE share-based payment 21 – (67 241) – –
Net other gains 22 73 876 – – –
Operating profit 1 188 609 822 154 342 914 871 321
Dividend income 23 1 284 1 497 – –
Finance income 24 87 172 93 483 – –
Finance costs 25 (79 203) (120 846) – –
Share of profit of associates 26 14 255 9 856 – –
Profit before taxation 1 212 117 806 144 342 914 871 321
Taxation 27 (367 243) (271 756) – (18 255)
Profit for the year 844 874 534 388 342 914 853 066
Attributable to:
Equity holders of the company 847 853 534 388 342 914 853 066
Minority interest (2 979) – – –
844 874 534 388 342 914 853 066
Earnings per ordinary share (cents) 28
– basic 425,9 270,7
– diluted 396,8 269,3
Dividends per ordinary share (cents) 29
– interim 87,0 68,0
– final 109,0 85,0
196,0 153,0
GR OU P C OM PAN Y 2007 2006 2007 2006
Notes R’000 R’000 R’000 R’000
57Distell Annual Report 2007

Statements of recognised income and expensefor the years ended 30 June
58 Distell Annual Report 2007
Group
Fair value adjustments (net of tax):
– cash flow hedges 12 – (649)
– available-for-sale investments 12 3 093 2 577
Cash fl ow hedge realised to income 12 256 3 082
Currency translation differences 12 (7 893) 5 720
Actuarial gains and losses 12 98 689 42 876
Net income recognised directly in equity 94 145 53 606
Profit for the year 844 874 534 388
Total recognised income for the year 939 019 587 994
Attributable to:
Equity holders of the company 941 998 587 994
Minority interest (2 979) –
939 019 587 994
Company
Profit for the year 342 914 853 066
Total recognised income for the year 342 914 853 066
2007 2006
Notes R’000 R’000

Cash flow statementsfor the years ended 30 June
Cash flows from operating activities
Trading income 1 114 733 889 395 342 914 120 996
Non-cash flow items 30.1 117 539 185 540 – –
Working capital changes 30.2 (44 171) (174 812) – 146 036
Net other gains 11 006 – – –
Cash generated from operating activities 1 199 107 900 123 342 914 267 032
Dividend income 1 284 1 497 – –
Interest received 41 664 44 859 – –
Interest paid (64 843) (120 846) – –
Taxation paid 30.3 (365 380) (153 388) – –
Dividends paid 30.4 (342 729) (266 788) (342 914) (267 032)
Cash retained from operating activities 469 103 405 457 – –
Cash flows from investment activities
Investment to maintain operations 30.5 (123 212) (106 317) – –
Investment to expand operations 30.6 (89 960) (58 047) – –
Preference shares redeemed 275 277 – – –
Investment in associates (11 305) – – –
Cash inflow from investment activities 50 800 (164 364) – –
Cash flows from financing activities
Ordinary shares issued 11 542 18 406 11 542 18 406
Treasury shares sold 1 893 5 348 – –
Minority interest 2 692 (1 417) – –
Decrease in interest-bearing borrowings (325 472) (101 638) – –
Increase in intercompany borrowings – – (11 542) (18 406)
Cash outflow from financing activities (309 345) (79 301) – –
Increase in net cash and cash equivalents
Balance at the beginning of the year (121 795) 47 610 – –
Exchange gains on cash and cash equivalents (73) (7 613) – –
Balance at the end of the year 332 426 121 795 – –
Increase in net cash and cash equivalents 30.7 210 558 161 792 – –
Cash flow per share (cents) from operating activities 407,8 340,5
GR OU P C OM PAN Y 2007 2006 2007 2006
Notes R’000 R’000 R’000 R’000
59Distell Annual Report 2007

Notes to the annual financial statementsfor the years ended 30 June
1. SIGNIFICANT ACCOUNTING POLICIES
1.1 Basis of preparation
The annual financial statements are prepared in accordance with
and comply with International Financial Reporting Standards (IFRS)
and the South African Companies Act (Act No 61 of 1973), as
amended. The financial statements are prepared on the historical
cost convention, as modified by the revaluation of certain financial
instruments and biological assets to fair value.
These financial statements incorporate accounting policies that
have been consistently applied to both years presented, with the
exception of the implementation of the following accounting
standards which did not have a material effect:
• IFRS 1 (AC 138) (Amendment) – First-time Adoption of
International Financial Reporting Standards and IFRS 6 (AC 143)
(Amendment) – Exploration for and Evaluation of Mineral
Resources (effective from 1 January 2006) *
• IFRS 6 (AC 143) – Exploration for and Evaluation of Mineral
Resources (effective from 1 January 2006) *
• IFRIC 8 (AC 141) Scope of IFRS 2 (AC 139) and AC 503: Accounting
for Black Economic Empowerment (BEE) transactions, that was
early adopted in 2006.
• IAS 19 (AC 116) (Amendment) – Employee Benefits – Actuarial
gains and losses, Group Plans and Disclosures (effective from
1 January 2006)
• IAS 21 (AC 112) (Amendment) – The Effect of Changes in Foreign
Exchange Rates – Net Investment in a Foreign Operation (effective
from 1 January 2006)
• IAS 39 (AC 133) (Amendment) and IFRS 4 (AC 141) (Amendment)
– Insurance Contracts (effective from 1 January 2006)
• IAS 39 (AC 133) (Amendment) – Cash Flow Hedge Accounting of
Forecast Intragroup Transactions (effective from 1 January 2006)
• IAS 39 (AC 133) (Amendment) – Financial Instruments – The Fair
Value Option (effective from 1 January 2006)
• IFRIC Interpretation 4 (AC 437) – Determining whether an
Arrangement Contains a Lease (effective from 1 January 2006)
• IFRIC Interpretation 5 (AC 438) – Rights to Interests arising from
Decommissioning, Restoration and Environmental Rehabilitation
Funds (effective from 1 January 2006) *
• IFRIC Interpretation 6 (AC 439) – Liabilities arising from
Participating in a Specific Market – Waste Electrical and Electronic
Equipment (effective from 1 December 2005) *
• IFRIC Interpretation 7 (AC 440) – Applying the Restatement
Approach under IAS 29 (AC 124) – Financial Reporting in
Hyperinflationary Economies (effective from 1 March 2006)
• IFRIC Interpretation 9 (AC 442) – Reassessment of Embedded
Derivatives (effective 1 June 2006)
• IFRIC Interpretation 11 (AC 444) – IFRS 2 – Group and Treasury
Share Transactions (effective 1 March 2007), that was early
adopted.
* The relevance of these standards, interpretations and amendments to
published standards has been assessed with respect to the Group’s operations
and it was concluded that they are not relevant to the Group.
60 Distell Annual Report 2007
The preparation of the financial statements in accordance with
IFRS requires the use of certain critical accounting estimates.
It requires management to exercise its judgement in the process
of applying the Group’s accounting policies. The areas involving
a higher degree of judgement or complexity, or areas where
assumptions and estimates are significant to the financial
statements are mainly biological assets, impairment of receivables,
retirement benefits, deferred income taxes, impairment of
intangibles, useful life and impairment of property, plant and
equipment, inventory provisions, share options and income taxes.
The key estimates and assumptions relating to these areas are
disclosed in the relevant notes to the annual financial statements.
Standards, interpretations and amendments to published
standards that are not yet effective
Certain new standards, amendments and interpretations to
existing standards have been published that are mandatory for the
Group’s accounting periods beginning on or after 1 November 2006
or later periods but which the Group has not early adopted and
which would not have a material effect on the financial results,
financial position or cash flows, if implemented:
• IAS 1 (AC 101) (Amendment) – Presentation of Financial
Statements – Capital Disclosures (effective from 1 January 2007)
• IFRS 7 (AC 144) – Financial Instruments: Disclosures, and
a complementary Amendment to IAS 1 (AC 101), Presentation
of Financial Statements – Capital Disclosures (effective from
1 January 2007)
• IFRS 8 (AC 145) – Operating segments (effective from
1 January 2009)
• IAS 23 (AC 114) (Revised) – Borrowing Costs (effective from
1 January 2009)
• IFRIC Interpretation 10 (AC 443) – Interim Financial Reporting
and Impairment (effective 1 November 2006)
• IFRIC Interpretation 12 (AC 445) – Service Concession
Arrangements (effective 1 January 2008) *
• IFRIC Interpretation 13 (AC 446) – Customer Loyalty Programmes
(effective 1 January 2008) *
* The relevance of these standards, interpretations and amendments to
published standards has been assessed with respect to the Group’s operations
and it was concluded that they are not relevant to the Group.
1.2 Basis of consolidation
Subsidiaries
Subsidiaries are entities (including special purpose entities) which
are, directly or indirectly, controlled by the Group. Control is
established where the Group has power to govern the financial and
operating policies of an entity so as to obtain benefits from its
activities. Subsidiaries are fully consolidated from the date on
which effective control is transferred to the Group. They are
deconsolidated from the date that control ceases.
The purchase method of accounting is used to account for the
acquisition of subsidiaries by the Group. The cost of an acquisition
is measured as the fair value of the assets given, equity instruments

issued and liabilities incurred or assumed at the date of exchange,
plus costs directly attributable to the acquisition. Identifiable assets
acquired and liabilities and contingent liabilities assumed in a
business combination are measured initially at their fair values at
the acquisition date, irrespective of the extent of any minority
interest. The excess of the cost of acquisition over the fair value of
the Group’s share of the identifiable net assets acquired is recorded
as goodwill. If the cost of acquisition is less than the fair value of the
net assets of the subsidiary acquired, the difference is recognised
directly in the income statement.
All intercompany transactions, balances and unrealised gains and
losses on transactions between Group companies are eliminated.
Where necessary, accounting policies for subsidiaries have been
changed to ensure consistency with the policies adopted by the
Group. Separate disclosure is made of minority interests.
A listing of the Group’s principal subsidiaries is set out in
annexure 1 to the annual financial statements.
Associates
These are undertakings over which the Group has between 20%
and 50% of the voting rights, and over which the Group exercises
significant influence, but which it does not control. Investments in
associated undertakings are accounted for by using the equity
method of accounting and are initially recognised at cost. The
Group’s investment in associates includes goodwill identified on
acquisition, net of any subsequent accumulated impairment loss.
The Group’s share of its associates’ post-acquisition profits or losses
is recognised in the income statement, and its share of post-
acquisition movements in reserves is recognised in reserves. The
cumulative post-acquisition movements are adjusted against the
carrying amount of the investment. When the Group’s share of
losses in an associate equals or exceeds its interest in the associate,
including any other unsecured receivables, the Group does not
recognise further losses, unless it has incurred obligations or made
payments on behalf of the associate.
Unrealised gains on transactions between the Group and its
associates are eliminated to the extent of the Group’s interest in
the associates. Unrealised losses are also eliminated unless the
transaction provides evidence of an impairment of the asset
transferred. Accounting policies of associates have been changed
where necessary to ensure consistency with the policies adopted by
the Group.
A listing of the Group’s principal associated undertakings is set out
in annexure 2 to the annual financial statements.
Joint ventures
Joint ventures are those entities over which the Group exercises
joint control in terms of a contractual agreement. The Group’s
interests in jointly controlled entities are accounted for by
proportionate consolidation. The Group combines its share of the
joint ventures’ individual income and expenses, assets and liabilities
61Distell Annual Report 2007
and cash flows on a line-by-line basis with similar items in the
Group’s financial statements. The Group recognises the portion of
gains or losses on the sale of assets by the Group to the joint venture
that is attributable to the other venturers. The Group does not
recognise its share of profits or losses from the joint venture that
result from the Group’s purchase of assets from the joint venture
until it resells the assets to an independent party. However, a loss
on the transaction is recognised immediately if the loss provides
evidence of a reduction in the net realisable value of current assets,
or an impairment loss.
A listing of the Group’s principal joint ventures is set out in
annexure 3 to the annual financial statements.
1.3 Foreign currency translation
Functional and presentation currency
Items included in the financial statements of each of the Group’s
entities are measured using the currency of the primary economic
environment in which it operates (the functional currency). The
consolidated financial statements are prepared in South African
rands which is the company’s functional and presentation currency.
Foreign subsidiaries and joint ventures
The results and the financial position of all Group subsidiaries and
joint ventures that have a functional currency that is different from
the presentation currency of the Group are translated into the
presentation currency as follows:
• Assets and liabilities for each balance sheet presented are
translated at the closing rate at the date of that balance sheet.
• Income and expenses for each income statement presented are
translated at the average exchange rates for the period presented.
• All resulting exchange rate translation differences are recognised
as a separate component of equity in the foreign currency
translation reserve (FCTR).
When the foreign subsidiary’s or joint venture’s functional currency
is the currency of a hyperinflationary economy the financial
statements of this subsidiary or joint venture are restated for the
changes in the general purchasing power of the functional currency
and, as a result, are stated in terms of the measuring unit current at
the balance sheet date. All the line items in these inflation adjusted
financial statements are translated to the Group’s presentation
currency at the closing rate. The comparative amounts are those
that were included in the Group’s results in the previous year.
The resulting exchange rate differences are recognised in the
income statement.
On consolidation, exchange rate differences arising from the
translation of the net investment in foreign subsidiaries and joint
ventures are also taken to the FCTR. When a foreign operation is
sold all related exchange rate differences in the FCTR are recognised
in the income statement as part of the profit or loss on the sale of
the operation. The Group’s net investment in a subsidiary or joint
venture is equal to the equity investment plus all monetary items
that are receivable from or payable to the subsidiary or joint venture,
for which settlement is neither planned nor likely to occur in the
foreseeable future.

Notes to the annual financial statementsfor the years ended 30 June
Goodwill and fair value adjustments arising on the acquisition of a
foreign subsidiary or joint venture are treated as assets and liabilities
of the foreign subsidiary or joint venture and are translated at the
closing rate.
Transactions and balances
Foreign currency transactions are translated into the functional
currency using the exchange rates prevailing at the date of the
transactions. Foreign exchange gains and losses resulting from the
settlement of such transactions and from the translation at year-end
exchange rates of monetary assets and liabilities denominated in
foreign currencies are recognised in the income statement, except
when deferred in equity as qualifying cash flow hedges and qualifying
net investment hedges.
1.4 Segment reporting
A business segment is a group of assets and operations engaged in
providing products or services that are subject to risks and returns
that are different from those of other business segments.
A geographical segment is engaged in providing products or
services within a particular economic environment that are subject
to risks and returns that are different from those of segments
operating in other economic environments.
Segment revenue is all revenue directly attributable to the segment,
excluding investment income and including joint venture revenue.
Segment result is segment revenue less segment expenses. Segment
expenses are all directly attributable expenses resulting from the
operating activities of a segment as well as any relevant portion of
an expense that can be allocated to the segment on a reasonable
basis. This allocation is done on a line-by-line basis considering
the driver for each type of expense, e.g. sales of merchandise or
employee costs. Segment result comprises trading profit plus
exchange rate differences less investment income.
1.5 Property, plant and equipment
Property, plant and equipment are tangible assets held by the
Group for use in manufacturing and distribution of its products
and are expected to be used during more than one period. All
property, plant and equipment are stated at their historical costs
less subsequent depreciation and accumulated impairment. The
historical cost includes all expenditure that is directly attributable
to the acquisition of the property, plant and equipment and is
depreciated on a straight line basis, from the date that assets are
available for use, at rates appropriate to the various classes of assets
involved, taking into account the estimated useful life and residual
values of the individual items. Land is not depreciated, as it is
deemed to have an unlimited useful life. Improvements to leasehold
properties are shown at cost and written off over the remaining
period of the lease.
Management determines the estimated useful lives and the related
depreciation charges at acquisition but will revise the depreciation
charge where useful lives are subsequently found to be different
from the previous estimate.
62 Distell Annual Report 2007
Useful lives:
Buildings 60 years
Stainless steel tanks 25 years
Other machinery and barrels 3 – 25 years
Equipment and vehicles 4 – 10 years
Capitalised finance lease vehicles 4 years
Property, plant and equipment’s residual values and useful lives are
reviewed at each balance sheet date. If appropriate, adjustments
are made and accounted for prospectively as a change in estimate.
Subsequent costs are included in the asset’s carrying amount or
recognised as a separate asset, as appropriate, to the extent that it
is probable that future economic benefits associated with the item
will flow to the Group and the cost of the item can be measured
reliably. All other repairs and maintenance are charged to the
income statement during the financial period in which they are
incurred.
Gains and losses on disposal or scrapping of property, plant and
equipment, being the difference between the net proceeds on
disposals or scrappings and the carrying amount are recognised in
the income statement.
1.6 Biological assets
Biological assets consist of grape vines which are valued at fair
value by discounting its net cash flows over the remaining lives
thereof at an appropriate discount rate.
Gains and losses arising from changes in fair value are accounted
for in income in the period in which they arise.
The determination of fair value of biological assets requires
significant management judgement and, amongst others, the
following factors are considered: the discount rate, productive life
of grape vines, rental value of farm land and expected sales prices.
Immature grape vines are shown at cost.
1.7 Intangible assets
Goodwill
Goodwill represents the excess of the cost of an acquisition over the
fair value of the Group’s share of the net identifiable assets of the
acquired subsidiaries, joint ventures and associates at the date of
acquisition. Goodwill on acquisition of subsidiaries and joint
ventures is included in ‘intangible assets’. Goodwill on acquisition
of associates is included in ‘investment in associates’. Goodwill
denominated in a foreign currency is translated at closing rates.
Separately recognised goodwill is tested annually for impairment
and carried at cost less accumulated impairment losses. Impairment
losses on goodwill are not reversed. Goodwill is allocated to cash-
generating units for the purpose of impairment testing. The
allocation is made to those cash-generating units or groups of cash-
generating units that are expected to benefit from the business
combination in which the goodwill arose. Impairment losses on
goodwill are not reversed. The gain or loss on disposal of an entity
includes the carrying amount of goodwill relating to the entity
disposed.

Trademarks
Trademarks are shown at historical cost. Trademarks that have a
finite useful life are carried at cost less accumulated amortisation.
Amortisation is calculated using the straight-line method to
allocate the cost of trademarks over their estimated useful lives.
Trademarks that are deemed to have an indefinite useful life are
carried at cost less accumulated impairment losses.
Research and development expenditure
Research and development expenditure relating to internally
generated brands and trademarks are recognised as an expense in
the income statement as incurred.
Computer software
Acquired computer software (which are not integral parts of
computer hardware) and software licences and the direct costs
associated with the development and installation thereof are
capitalised.
Costs associated with developing or maintaining software are
recognised as an expense when incurred. Costs that are directly
associated with the production of identifiable and unique software
controlled by the Group, and that will probably generate future
economic benefits beyond one year, are recognised as intangible
assets. Direct costs include the software development employee
costs and an appropriate portion of relevant overheads.
Computer software is depreciated on the straight-line method
over their estimated useful lives (three to five years) when available
for use.
1.8 Impairment of non-financial assets
Assets that have an indefinite life are not subject to amortisation
and are tested for impairment at each balance sheet date. Assets
that are subject to amortisation are reviewed for impairment
whenever events or changes in circumstances indicate that the full
carrying amount may not be recoverable. The determination of
whether an asset is permanently impaired requires significant
management judgement and, amongst others, the following factors
will be considered: duration and extent to which the fair value of the
assets is less than its cost; industry, geographical and sector
performance; changes in regional economies and operational and
financing cash flows.
Where the carrying value of an asset exceeds its estimated
recoverable amount, the carrying value is impaired and the asset is
written down to its recoverable amount. The recoverable amount
is calculated as the higher of the asset’s fair value less cost to sell
and the value in use. These calculations are prepared based on
management’s assumptions and estimates such as forecasted cash
flows; management budgets and industry, regional and geographical
operational and financial outlooks. For the purpose of impairment
testing the assets are allocated to cash-generating units (CGUs).
CGUs are the lowest levels for which separately identifiable cash
flows can be determined. The related impairment expense is
charged to the income statement to the extent that it is not a reversal
of a previous revaluation included in non-distributable reserves.
63Distell Annual Report 2007
Non-financial assets, other than goodwill, that suffered impairment
are reviewed for possible reversal of the impairment at each
reporting date.
1.9 Financial assets
The Group classifies its financial assets in the following categories:
• Held-to-maturity investments
• Available-for-sale investments
• Financial assets at fair value through profit and loss
• Loans and receivables
The classification is dependent on the purpose for which the financial
asset was acquired. Management determines the classification of its
financial assets at the time of the purchase and re-evaluates such
designations at each balance sheet date.
Held-to-maturity investments
Held-to-maturity investments are non-derivative financial assets
with fixed or determinable payments and fixed maturities that the
Group’s management has the positive intention and ability to hold
to maturity. If the Group were to sell other than an insignificant
amount of held-to-maturity investments, the whole category would
be tainted and reclassified as available for sale. Held-to-maturity
investments are included in non-current assets, except for those
with maturities less than 12 months from the balance sheet date,
which are classified as current assets.
Available-for-sale investments
Available-for-sale investments are non-derivatives that are either
designated in this category or not classified in any of the other
categories. They are included in non-current assets unless
management intends to dispose of the investment within
12 months of the balance sheet date.
Financial assets at fair value through profit and loss
This category has two subcategories: financial assets held for
trading, and those designated at fair value through profit or loss at
inception. A financial asset is classified in this category if acquired
principally for the purpose of selling in the short term or if so
designated by management. Derivatives are also categorised as
held for trading unless they are designated as hedges. Assets in this
category are classified as current assets if they are either held for
trading or are expected to be realised within 12 months of the
balance sheet date.
Loans and receivables
Loans and receivables are non-derivative financial assets with fixed
or determinable payments that are not quoted in an active market.
They are included in current assets, except for maturities greater
than 12 months after the balance sheet date. These are classified as
non-current assets.
Regular purchases and sales of investments are recognised on trade
date – the date on which the Group commits to purchase or sell the
asset. Investments are initially recognised at fair value plus
transaction costs for all financial assets not carried at fair value
through profit or loss. Financial assets carried at fair value through

Notes to the annual financial statementsfor the years ended 30 June
profit or loss are initially recognised at fair value and transaction
costs are expensed in the income statement. Financial assets are
derecognised when the rights to receive cash flows from the
investments have expired or have been transferred and the Group
has transferred substantially all risks and rewards of ownership.
Available-for-sale financial assets and financial assets at fair value
through profit or loss are subsequently carried at fair value. Loans
and receivables and held-to-maturity financial assets are carried at
amortised cost using the effective interest rate method.
Gains or losses arising from changes in the fair value of the ‘financial
assets at fair value through profit or loss’ category, including interest
and dividend income, are presented in the income statement within
‘operating expenses’ in the period in which they arise. Changes in
the fair value of monetary securities denominated in a foreign
currency and classified as available-for-sale are analysed between
translation differences resulting from changes in amortised cost of
the security and other changes in the carrying amount of the
security. The translation differences are recognised in profit or
loss, and other changes in carrying amount are recognised in
equity. Changes in the fair value of monetary securities classified
as available-for-sale and non-monetary securities classified as
available-for-sale are recognised in equity. When securities
classified as available-for-sale are sold or impaired, the accumulated
fair value adjustments recognised in equity are included in the
income statement as ‘gains and losses from investment securities’.
Interest on available-for-sale securities calculated using the
effective interest rate method is recognised in the income statement.
Dividends on available-for-sale equity instruments are recognised
in the income statement when the Group’s right to receive payments
is established.
The fair values of quoted investments are based on current bid
prices. If the market for a financial asset is not active (and for
unlisted securities), the Group establishes fair value by using cash
flow models.
The investment of Distell Group Limited in the ordinary shares of
its subsidiary, South African Distilleries and Wines (SA) Limited is
carried at cost less impairment losses in the company financial
statements.
1.10 Financial instruments
Financial instruments on the balance sheet consist of financial
assets, trade and other receivables, cash and cash equivalents,
interest-bearing borrowings and trade and other payables. The
particular recognition methods adopted are disclosed in the
individual policy statements associated with each item.
Derivatives
The Group is party to financial instruments that reduce exposure
to fluctuations in foreign currency exchange and interest rates.
These instruments mainly comprise forward foreign exchange
contracts and interest rate swap agreements. The purpose of these
instruments is to reduce risk.
64 Distell Annual Report 2007
Derivatives are initially recognised at fair value on the date a
derivative contract is entered into and are subsequently remeasured
at their fair value. The method of recognising the resulting gain or
loss depends on whether the derivative is designated as a hedging
instrument, and if so, the nature of the item being hedged. The
Group designates certain derivatives as either: (1) hedges of the fair
value of recognised assets or liabilities or a firm commitment ( fair
value hedge); or (2) hedges of a particular risk associated with a
recognised asset or liability or a highly probable forecast transaction
(cash flow hedge); or (3) hedges of a net investment in a foreign
operation (net investment hedge).
The Group documents at the inception of the transaction the
relationship between hedging instruments and hedged items, as
well as its risk management objectives and strategy for undertaking
various hedge transactions. The Group also documents its
assessment, both at hedge inception and on an ongoing basis, of
whether the derivatives that are used in hedging transactions are
highly effective in offsetting changes in fair values or cash flows of
hedged items.
The fair values of various derivative instruments used for hedging
purposes and the movements on the hedging reserve in
shareholders’ equity are disclosed in the relevant notes to the
financial statements. The full fair value of a hedging derivative is
classified as a non-current asset or liability if the remaining hedge
item is more than 12 months, and as a current asset or liability, if
the remaining maturity of the hedged item is less than 12 months.
Trading derivatives are classified as a current asset or liability.
Fair value hedge
Changes in the fair value of derivatives that are designated and
qualify as fair value hedges are recorded in the income statement,
together with any changes in the fair value of the hedged asset or
liability that are attributable to the hedged risk. The gain or loss
relating to the effective portion of interest rate swaps hedging fixed
rate borrowings is recognised in the income statement within
‘finance costs’. The gain or loss relating to the ineffective portion is
recognised in the income statement within ‘operating expenses’.
Changes in the fair value of the hedged fixed rate borrowings
attributable to interest rate risk are recognised in the income
statement within ‘finance costs’.
If the hedge no longer meets the criteria for hedge accounting, the
adjustment to the carrying amount of a hedge item for which
the effective interest rate method is used is amortised to profit or loss
over the period to maturity.
Cash flow hedge
The effective portion of changes in the fair value of derivatives that
are designated and qualify as cash flow hedges are recognised in
equity. The gain or loss relating to the ineffective portion is
recognised immediately in the income statement within ‘finance
costs’.

Amounts accumulated in equity are recycled in the income
statement in the periods when the hedged item affects profit or loss
( for instance when the forecast sale that is hedged takes place). The
gain or loss relating to the effective portion of interest rate swaps
hedging variable rate borrowings is recognised in the income
statement within ‘finance costs’. The gain or loss relating to the
effective portion of forward foreign exchange contracts hedging
export sales is recognised in the income statement within ‘revenue’.
However, when the forecast transaction that is hedged results in
the recognition of a non-financial asset ( for example, inventory) or
a non-financial liability, the gains and losses previously deferred in
equity are transferred from equity and included in the initial
measurement of the cost of the asset or liability.
When a hedging instrument expires or is sold, or when a hedge no
longer meets the criteria for hedge accounting, any cumulative gain
or loss existing in equity at that time remains in equity and is
recognised when the forecast transaction is ultimately recognised
in the income statement. When a forecast transaction is no longer
expected to occur, the cumulative gain or loss that was reported in
equity is immediately transferred to the income statement. If the
hedge no longer meets the criteria for hedge accounting,
the adjustment to the carrying amount of a hedged item for
which the effective interest rate method is used is amortised to
profit or loss over the period to maturity.
Derivatives that do not qualify for hedge accounting
Certain derivative instruments do not qualify for hedge accounting.
Changes in the fair value of any derivative instruments that do not
qualify for hedge accounting are recognised immediately in the
income statement within ‘finance costs’.
Offsetting
Where a current legally enforceable right of set-off exists for
recognised financial assets and financial liabilities, and where
there is an intention to settle the liability and realise the asset
simultaneously, or to settle on a net basis, all related financial
effects are offset.
Disclosure about financial instruments to which the Group is
a party is provided in note 10 to the annual financial statements.
1.11 Deferred income tax
Deferred income tax is provided at currently enacted or substantially
enacted tax rates using the liability method. Provision is made for
all temporary differences arising between the taxation bases of
assets and liabilities and their balance sheet carrying values.
No deferred income tax is accounted for if it arises from initial
recognition of an asset or liability in a transaction other than
a business combination that at the time of the transaction affects
neither accounting nor taxable profit or loss.
Deferred income tax assets are recognised to the extent that it is
probable that future taxable profit will be available against which
the temporary differences can be utilised. Management applies
judgement to determine whether sufficient future taxable profit
65Distell Annual Report 2007
will be available after considering, amongst others, factors such as:
profit histories; forecasted cash flows and budgets.
Secondary taxation on companies (STC) is provided in respect of
dividend payments, net of dividends received or receivable and is
recognised as a taxation charge for the year in which the dividend
is paid.
Deferred income tax is provided on unutilised STC credits which
will be utilised in the foreseeable future.
Non-resident shareholders’ taxation is provided in respect of foreign
dividends receivable only when the dividend is recognised.
Deferred income tax is provided on temporary differences arising
on investments in subsidiaries, associates and joint ventures,
except where the timing of the reversal of the temporary difference
can be controlled by the Group and it is probable that it will not
reverse in the foreseeable future.
1.12 Leases
The Group leases certain property, plant and equipment. Capitalised
leased assets are assets leased in terms of finance lease agreements
where the Group has substantially all the risks and rewards of
ownership. Finance leases are capitalised at the lease’s commence-
ment at the lower of the fair value of the leased item or the present
value of the minimum lease payments. Depreciation is provided
on the straight-line method over the shorter of the lease term and
their estimated useful lives. Finance charges are written off over
the term of the lease in accordance with the effective interest
rate method.
Leases of assets in terms of which all the risks and benefits of
ownership are effectively retained by the lessor are classified as
operating leases. Payments made under operating leases are
charged to the income statement on a straight-line basis over the
lease term.
1.13 Inventories
Inventories are stated at the lower of cost and net realisable value.
Cost is determined by the first-in first-out (FIFO) method. The
cost of finished goods and work in progress comprises raw
materials, direct labour, other direct costs and related production
overheads (based on normal operating capacity), but excludes
borrowing cost.
Net realisable value is the estimated selling price in the ordinary
course of business, less the applicable costs of completion and
selling expenses.
1.14 Trade and other receivables
Trade and other receivables originated by the Group are initially
recognised at fair value and subsequently measured at amortised
cost using the effective interest rate method, less provision for
impairment. Fair value is the estimated future cash flows discounted
at the effective interest rate.

Notes to the annual financial statementsfor the years ended 30 June
A provision for impairment of trade receivables is established when
there is objective evidence that the Group will not be able to collect
all amounts due according to the original terms of the receivables.
Significant financial difficulties of the debtor, probability that the
debtor will enter bankruptcy or financial reorganisation, and
default or delinquency in payments are considered indicators that
the trade receivable is impaired. The amount of the provision is the
difference between the carrying amount and the recoverable
amount, being the present value of the expected cash flows,
discounted at the market rate of interest for similar borrowers.
1.15 Cash and cash equivalents
Cash and cash equivalents and bank overdrafts are carried at cost
and, if denominated in foreign currencies, are translated at closing
rate. Cash comprise cash on hand, deposits held at call with banks
and other short-term highly liquid investments with original
maturities of three months or less. Bank overdrafts are included in
current interest-bearing borrowings.
1.16 Share capital
Ordinary shares are classified as equity. Incremental costs directly
attributable to the issue of new shares are shown in equity as
a deduction from proceeds, net of tax.
Where entities controlled by the Group purchase the company’s
shares, the consideration paid, including attributable transaction
costs net of income taxes, is deducted from total shareholders’
equity as treasury shares until they are sold. Where such shares are
subsequently sold, any consideration received is included in
shareholders’ equity. Dividends received on treasury shares are
eliminated on consolidation.
1.17 Trade and other payables
Trade and other payables are recognised initially at fair value and
subsequently measured at amortised cost using the effective
interest rate method.
Financial guarantee contracts are recognised initially at fair value
and subsequently at the initially recognised fair value, less
appropriate cumulative amortisation recognised on a straight-line
basis over the estimated duration of the contract.
1.18 Borrowings
Borrowings are recognised initially at fair value, net of transaction
costs incurred. Borrowings are subsequently stated at amortised
cost. Any difference between the proceeds (net of transaction costs)
and the redemption value is recognised in the income statement
over the period of the borrowings using the effective interest rate
method. Borrowings are classified as current liabilities unless the
Group has the unconditional right to defer settlement of the liability
for at least 12 months after the balance sheet date.
All borrowing costs are expensed when incurred.
66 Distell Annual Report 2007
1.19 Provisions
Provisions are recognised when the Group has a present legal or
constructive obligation, as a result of past events, and it is probable
that an outflow of resources embodying economic benefits will be
required to settle the obligation, and a reliable estimate of the
amount of the obligation can be made. Provisions are measured at
the present value of the expenditures expected to be required to
settle the obligation using a pretax rate that reflects current market
assessments of the time value of money and the risks specific to the
obligation. The increase in the provision due to passage of time is
recognised as interest expense.
1.20 Employee benefits
Retirement funds
The Group provides pension, retirement or provident fund benefits
to all employees.
The schemes are generally funded through payments to insurance
companies or trustee-administered funds, determined by periodic
actuarial calculations. The Group has both defined-contribution
and defined-benefit plans.
A defined-contribution plan is a plan under which the Group pays
fixed contributions into a separate entity. The Group has no legal or
constructive obligations to pay further contributions if the fund
does not hold sufficient assets to pay all employees the benefits
relating to employee service in the current and prior periods.
The Group’s contributions to defined-contribution plans in respect
of services rendered in a particular period are recognised as an
expense in that period. Additional contributions are recognised as
an expense in the period during which the associated services are
rendered by employees.
A defined-benefit plan is a plan that is not a defined-contribution
plan. This plan defines an amount of pension benefit an employee
will receive on retirement, dependent on one or more factors such
as age, years of service and compensation.
The liability recognised in the balance sheet in respect of defined-
benefit pension plans is the present value of the defined-benefit
obligation at the balance sheet date less the fair value of plan assets.
The defined-benefit obligation is calculated every third year by
independent actuaries using the projected unit credit method. The
present value of the defined-benefit obligation is determined by
discounting the estimated future cash outflows using interest rates
of high-quality corporate bonds that are denominated in the
currency in which the benefits will be paid and that have terms to
maturity approximating to the terms of the related pension liability.
Current service costs are recognised immediately in income.

Actuarial gains and losses arising from experience adjustments
and changes in actuarial assumptions are recognised outside profit
or loss in the period in which they occur and are presented in the
statement of recognised income and expense. Refer to note 37 to
the financial statements for the effect of this change in accounting
policy.
Past-service costs are recognised immediately in income, unless
the changes to the pension plan are conditional on the employees
remaining in service for a specified period of time (the vesting
period). In this case, the past-service costs are amortised on a
straight-line basis over the vesting period.
Post-retirement medical benefits
The Group provides for actuarially determined future medical
benefits of employees who retire based on the employee’s
remaining years in service up to retirement age and completing a
minimum service period. The expected costs of these benefits are
accrued over the period of employment based on past services.
This post-retirement medical benefit obligation is measured as
the present value of the estimated future cash outflows based on
a number of assumptions. These assumptions include, amongst
others, health care cost inflation, discount rates, salary inflation
and promotions and experience increases, expected retirement
age and continuation at retirement. Valuations of this obligation
are carried out every third year by independent qualified
actuaries, in respect of past service liabilities and actuarial
gains or losses are recognised outside profit or loss in the period
in which they occur and are presented in the statement of
recognised income and expense. Refer to note 37 to the financial
statements for the effect of this change in accounting policy.
Share-based compensation
The Group operates an equity-settled share incentive scheme
through The Distell Group Share Trust.
Scheme shares are granted to executive directors and manage-
ment. Shares are granted at the market price of the shares on the
date of the offer and are exercisable at that price. Offers are
exercisable within one year from the date of offer and are payable
within seven years in three equal instalments of which the first
instalment is only payable after three years
The fair value is determined at grant date with reference to the
fair value of the shares granted, excluding the impact of any non-
market vesting conditions. Non-market vesting conditions are
included in assumptions about the number of shares that are
expected to become exercisable. At each balance sheet date, the
entity revises its estimates of the number of shares that are
expected to become exercisable. It recognises the impact of the
revision of original estimates, if any, in the income statement, and
a corresponding adjustment to equity over the remaining vesting
period. The proceeds received net of any directly attributable
transaction costs are credited to share capital (nominal value)
and share premium when the shares are exercised.
67Distell Annual Report 2007
Long-service awards
Long-service awards are provided to employees who achieve certain
predetermined milestones of service within the Group. The Group’s
obligation is valued by independent qualified professionals at year-
end and the corresponding liability is raised. Costs incurred are set off
against the liability. Movements in the liability, including notional
interest, resulting from the valuation are charged against the income
statement upon valuation.
Bonus plans
The Group recognises a liability and an expense for bonuses and
profit-sharing, based on a formula that takes into consideration the
profit attributable to the company’s shareholders after certain
adjustments. The Group recognises a provision where contractually
obliged or where there is a past practice that has created a
constructive obligation.
1.21 Revenue recognition
Revenue comprises the fair value of the consideration received or
receivable for the sale of goods and services in the ordinary course
of the Group’s activities, including excise duty, but net of value
added tax (VAT), general sales taxes (GST), rebates and discounts,
and after eliminating sales within the Group.
Excise is not directly related to sales, unlike value added tax. It is
not recognised as a separate item on invoices, increases in excise
are not always directly passed on to customers and the Group
cannot reclaim the excise where customers do not pay for products
received. The Group considers excise as a cost to the Group and
reflect it as cost of goods sold and consequently any excise that is
recovered in the sales price is included in revenue.
Revenue is recognised as follows:
• Cash sales of goods: Sales are recognised upon delivery of
products and customer acceptance and collectability of the
related receivable is reasonably assured.
• Sales of services: Sales of services are recognised in the
accounting period in which the services are rendered, by
reference to completion of the specific transaction assessed on
the basis of the actual service provided as a proportion of the
total services to be provided.
• Interest income: Interest income is recognised on a time-
proportion basis using the effective interest rate method. When a
receivable is impaired, the Group reduces the carrying amount to
its recoverable amount, being the estimated future cash flow
discounted at the original effective interest rate of the instrument,
and continues unwinding the discount as interest income. Interest
income on impaired loans is recognised using the original effective
interest rate.
• Dividend income: Dividend income is recognised when the
shareholder has an irrevocable right to receive payment.
1.22 BEE transactions
BEE transactions where the Group receives or acquires goods or
services as consideration for the issue of equity instruments of the
Group are treated as share-based payment transactions.

Notes to the annual financial statementsfor the years ended 30 June
BEE transactions where employees are involved are measured and
accounted for on the same basis as share-based compensation as
in note 1.20.
Transactions, in which share-based payments are made to parties
other than employees, are measured by reference to the fair value of
equity instruments granted if no specific goods or services are
received. Vesting of the equity instrument granted occurs
immediately and an expense and a related increase in equity are
recognised on the date that the instrument is granted. No further
measurement or adjustments are required as it is presumed that
the BEE credentials are received upfront.
1.23 Earnings per share
Earnings, headline earnings and adjusted headline earnings per
share are calculated by dividing the net profit attributable to
shareholders, headline earnings and adjusted headline earnings,
respectively, by the weighted average number of ordinary shares in
issue during the year, excluding the ordinary shares held by the
Group as treasury shares. Adjusted headline earnings are calculated
by excluding the non-recurring BEE expenses from headline
earnings.
For the diluted earnings per share, the weighted average number of
ordinary shares in issue is adjusted to assume conversion of all
ordinary shares with dilutive potential. Share scheme options,
issued in terms of the share option scheme, have dilutive potential.
For the share scheme options a calculation is done to determine
the number of shares that could have been acquired, at the closing
market price, based on the monetary value of subscription rights
attached to outstanding share scheme options in order to determine
the “bonus” element; the “bonus” shares are added to the ordinary
shares in issue. No adjustment is made to net profit, as the share
scheme options have no income statement effect.
1.24 Dividend distribution
Dividend distribution to the company’s shareholders is recognised
as a liability in the Group’s financial statements in the period in
which the dividends are approved.
68 Distell Annual Report 2007
1.25 Comparative figures
Where necessary, comparative figures have been adjusted to
conform with changes in presentations made in the current year
with disclosure of the reclassification detailed in the relevant
notes.
1.26 Non-current assets held-for-sale
Non-current assets held for sale are classified as assets held for sale
and are stated at the lower of the carrying amount and fair value,
less costs to sell if their carrying amount is recovered principally
through a sale transaction rather than through continued use.
These assets are measured at the lower of its carrying amount and
the fair value less costs to sell.
1.27 Related parties
Individuals or entities are related parties if one party has the ability,
directly or indirectly, to control or jointly control the other party or
exercise significant influence over the other party in making
financial and/or operating decisions. Key management personnel
are defined as all directors of Distell Limited, the main operating
company of the Group.
1.28 Income statement line items
The following additional line items, headings and subtotals are
presented on the face of the income statement, as management
believes it to be relevant to the understanding of the Group’s
financial performance:
• Trading income being the Group’s operating results excluding
non-recurring BEE share-based payments and net other gains.
• BEE share-based payment being the fair value of instruments
granted in terms of the non-recurring portion of the BEE
transaction (see note 1.22).

2. DEFINITIONS AND RATIOS
2.1 Acid test ratio
Current assets, excluding inventories, divided by total current
liabilities.
2.2 Cash flow per ordinary share
Cash flow from operating activities before dividends paid, divided
by the number of ordinary shares in issue. This basis identifies the
cash stream actually achieved in the period under review.
2.3 Cash and cash equivalents
For the purposes of the cash flow statement, cash and cash
equivalents comprise cash on hand, deposits held at call with
banks, and investments in money market instruments, net of bank
overdrafts. In the balance sheet, bank overdrafts are included in
interest-bearing borrowings under current liabilities.
2.4 Current ratio
Current assets divided by total current liabilities.
2.5 Dividend cover
Adjusted headline earnings per ordinary share divided by dividends
per ordinary share.
2.6 Dividend yield
Dividends per ordinary share divided by the weighted average price
per share during the year.
2.7 Earnings per ordinary share
Basic earnings basis
Earnings attributable to equity holders divided by the weighted
average number of ordinary shares in issue.
Headline basis
Earnings attributable to equity holders, after taking into account
the adjustments explained in note 28.1, divided by the weighted
average number of ordinary shares in issue.
Cash equivalent basis
Earnings attributable to equity holders, after taking into account
the adjustments explained in note 28.1, divided by the weighted
average number of ordinary shares in issue. This basis recognises
the potential of the earnings stream to generate cash.
69Distell Annual Report 2007
2.8 Earnings yield
Headline earnings per ordinary share divided by the closing share
price at year-end on the JSE Limited ( JSE).
2.9 Effective tax rate
The tax charge for the year divided by the profit before taxation.
2.10 Financial gearing ratio
The ratio of interest-bearing borrowings, net of cash and cash
equivalents, to total equity.
2.11 Interest-free borrowings to total assets
Interest-free borrowings, excluding post-retirement medical
liability, divided by total assets (both excluding deferred income
tax).
2.12 Net asset turn
Revenue divided by net assets at year-end.
2.13 Net asset value per ordinary share
Total equity divided by the number of ordinary shares in issue.
2.14 Pretax return on equity
Profit before taxation as a percentage of closing equity.
2.15 Price earnings ratio
The closing share price at year-end on the JSE, divided by headline
earnings per ordinary share for that year.
2.16 Return on equity
Adjusted headline earnings divided by closing equity.
2.17 Total return to shareholders
This represents the internal rate of return over a seven-year period.
It is computed by recognising the market price of a Distell ordinary
share seven years ago as a cash outflow, recognising the annual
cash dividend streams per share and the closing share price at the
end of the current year as inflows and then determining the
discount rate inherent to these cash flow streams. The equivalent of
the market price of a Distell ordinary share seven years ago is
computed by dividing the total market capitalisation of both
Distillers and SFW at that date by the number of ordinary shares in
issue at 30 June 2007 (199,0 million shares).

Notes to the annual financial statementsfor the years ended 30 June
3. PROPERTY, PLANT AND EQUIPMENT
Machinery,
tanks and Equipment
Properties barrels and vehicles Total
R’000 R’000 R’000 R’000
2006
Opening balance 552 436 636 559 34 041 1 223 036
Additions 47 298 108 606 15 744 171 648
Disposals (716) (6 608) (1 594) (8 918)
Transfers (876) (255) 1 131 –
Depreciation (2 336) (117 086) (9 444) (128 866)
595 806 621 216 39 878 1 256 900
At cost 618 792 1 399 274 105 279 2 123 345
Accumulated depreciation (22 986) (778 058) (65 401) (866 445)
Net carrying value 595 806 621 216 39 878 1 256 900
2007
Opening balance 595 806 621 216 39 878 1 256 900
Additions 62 473 126 834 20 788 210 095
Disposals (9 062) (278) (502) (9 842)
Transfers (2 887) 2 818 69 –
Depreciation (2 712) (113 261) (10 664) (126 637)
643 618 637 329 49 569 1 330 516
At cost 667 775 1 486 054 118 329 2 272 158
Accumulated depreciation (24 157) (848 725) (68 760) (941 642)
Net carrying value 643 618 637 329 49 569 1 330 516
Included in equipment and vehicles are capitalised finance lease vehicles with a book value of R3,2 million (2006: R2,3 million) (see note 14).
Details of properties are available for inspection at the registered office of the company.
4. BIOLOGICAL ASSETS
The Group owns bearer biological assets in the form of grape vines. The grapes produced from these vines are mainly used in the production of
wines and spirits of the Group’s own brands and products. The vines are cultivated on land either owned or leased by the Group.
The total area under grape vines on 30 June 2007 amounted to approximately 1 483 ha (2006: 1 331 ha), of which approximately 1 139 ha
(2006: 976 ha) can be classified as mature vines. The total output of grapes harvested during the current year amounted to 10 186 tons
(2006: 9 740 tons).
The fair value of the grapes harvested during the current financial year amounted to R37,2 million (2006: R35,0 million). The fair value was calculated
with reference to arm’s length prices paid in an active market less estimated point-of-sale costs.
The fair value of mature grape vines was calculated by discounting the net cash flows thereof over its remaining lives at a discount rate of 18%
(2006: 18%). The net cash flows were calculated with reference to grape varieties, expected yields based on the past three years’ experience,
estimated future sales prices and estimated future production costs. The average productive life of grape vines are estimated at 23 years
(2006: 23 years).
70 Distell Annual Report 2007

4. BIOLOGICAL ASSETS (continued)
Carrying amount
Opening balance 104 380 107 170
Acquisitions 12 424 5 791
Net change in fair value (2 129) (8 581)
– Decrease due to harvest (37 248) (34 970)
– Gain due to price, yield, maturity and cost changes 35 119 26 389
Balance at the end of the year 114 675 104 380
An amount of R8,5 million (2006: R5,8 million) for vineyard development expenses is included in the
total of capital commitments in note 32.
The fair value of grape vines cultivated on land, of which the lease expires in 2018, amounts to
R4,1 million (2006: R6,1 million).
Short-term insurance cover, as part of an overall risk management strategy, is utilised to protect the
Group against the replacement cost, and subsequent loss of income, of establishing new vineyards in the
event of them being damaged by natural perils, such as fire and lightning.
5. FINANCIAL ASSETS
Other loans and receivables
– Preference shares with a dividend rate of between 7,3% and 9,1%, redeemable in May 2007
and March 2008 361 152 590 921
– Loans to producers and other unrelated parties at market-related interest rates and secured
by bonds over properties where applicable 19 360 27 859
Available-for-sale investments 53 462 38 967
433 974 657 747
Less: Short-term portion of preference shares (361 152) (254 640)
72 822 403 107
Directors’ valuation of financial assets 434 259 657 747
All the investments are unlisted and details thereof are available at the registered office of the company.
6. INVESTMENTS IN SUBSIDIARIES AND ASSOCIATES
Company
Investments in subsidiaries (annexure 1) 1 680 041 1 661 622
Group
Investments in associates (annexure 2)
Opening balance 15 383 16 299
Additions 6 949 –
Share of profit 14 255 9 856
Dividends received (13 317) (8 671)
Disposal of interest in associate – (2 101)
Balance at the end of the year 23 270 15 383
Made up as follows:
Cost and share of profits 14 194 8 805
Goodwill 9 076 6 578
23 270 15 383
2007 2006
R’000 R’000
71Distell Annual Report 2007

Notes to the annual financial statementsfor the years ended 30 June
2007 2006
R’000 R’000
72 Distell Annual Report 2007
6. INVESTMENTS IN SUBSIDIARIES AND ASSOCIATES (continued)
Summary of goodwill
Opening balance 6 578 6 578
Additions 2 498 –
Balance at the end of the year 9 076 6 578
Directors’ valuation of investments in associates 162 046 30 534
Impairment test of indefinite life goodwill
Goodwill acquired through the investments in Tanzania Distilleries Limited and Grays Inc Limited
has been allocated to those cash-generating units. The recoverable amount of the cash-generating
units has been based on a value-in-use calculation. To calculate this, cash flow projections are
based on financial budgets approved by management covering a five-year period. The discount
rate applied to the cash flow projections is between 10% and 16%. These calculations indicate that
there was no impairment in the carrying value of the goodwill.
Key assumptions used for value-in-use calculation
Sales growth rates (7% – 11%), gross margins (26% – 55%) and cost increases (5% – 12%) were
based on historical performance and management’s expectations of the market development. The
discount rates used are pretax and reflect specific risks relating to the relevant business.
7. INTANGIBLE ASSETS
Capitalised
software Trademarks Total
R’000 R’000 R’000
2006
Opening balance 14 501 – 14 501
Additions 985 – 985
Amortisation (4 275) – (4 275)
Balance at the end of the year 11 211 – 11 211
Cost 43 466 – 43 466
Accumulated amortisation (32 255) – (32 255)
Net carrying value 11 211 – 11 211
2007
Opening balance 11 211 – 11 211
Additions 19 598 14 303 33 901
Amortisation (11 052) – (11 052)
Balance at the end of the year 19 757 14 303 34 060
Cost 63 064 14 303 77 367
Accumulated amortisation (43 307) – (43 307)
Net carrying value 19 757 14 303 34 060
The Group acquired certain whisky brands during the course of the financial year. Management regards these as having an indefinite useful life
as there are no foreseeable limit on the time the trademarks are expected to provide future cash flows.
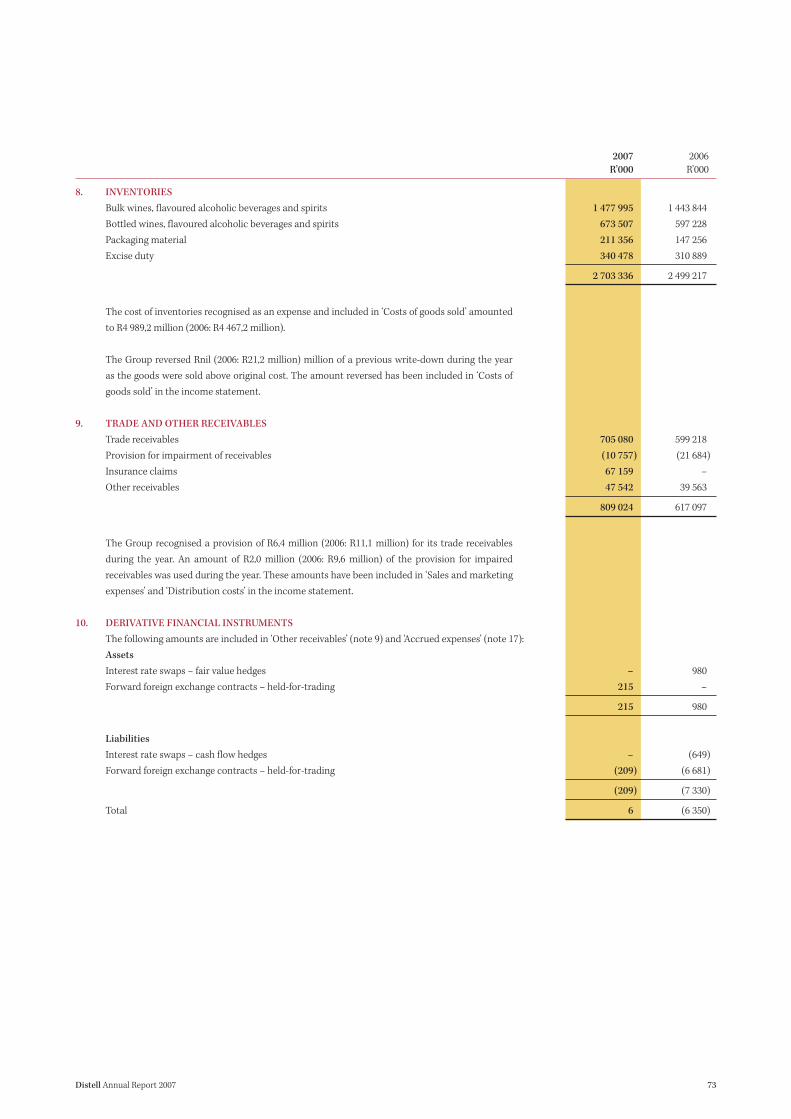
8. INVENTORIES
Bulk wines, flavoured alcoholic beverages and spirits 1 477 995 1 443 844
Bottled wines, flavoured alcoholic beverages and spirits 673 507 597 228
Packaging material 211 356 147 256
Excise duty 340 478 310 889
2 703 336 2 499 217
The cost of inventories recognised as an expense and included in ‘Costs of goods sold’ amounted
to R4 989,2 million (2006: R4 467,2 million).
The Group reversed Rnil (2006: R21,2 million) million of a previous write-down during the year
as the goods were sold above original cost. The amount reversed has been included in ‘Costs of
goods sold’ in the income statement.
9. TRADE AND OTHER RECEIVABLES
Trade receivables 705 080 599 218
Provision for impairment of receivables (10 757) (21 684)
Insurance claims 67 159 –
Other receivables 47 542 39 563
809 024 617 097
The Group recognised a provision of R6,4 million (2006: R11,1 million) for its trade receivables
during the year. An amount of R2,0 million (2006: R9,6 million) of the provision for impaired
receivables was used during the year. These amounts have been included in ‘Sales and marketing
expenses’ and ‘Distribution costs’ in the income statement.
10. DERIVATIVE FINANCIAL INSTRUMENTS
The following amounts are included in ‘Other receivables’ (note 9) and ‘Accrued expenses’ (note 17):
Assets
Interest rate swaps – fair value hedges – 980
Forward foreign exchange contracts – held-for-trading 215 –
215 980
Liabilities
Interest rate swaps – cash flow hedges – (649)
Forward foreign exchange contracts – held-for-trading (209) (6 681)
(209) (7 330)
Total 6 (6 350)
2007 2006
R’000 R’000
73Distell Annual Report 2007

Notes to the annual financial statementsfor the years ended 30 June
10. DERIVATIVE FINANCIAL INSTRUMENTS (continued)
Interest rate swaps
In order to hedge specific exposures in the interest rate repricing profile of existing borrowings, the Group uses interest rate derivatives to
generate the desired interest profile. The value of borrowings hedged by interest rate derivatives, and the rates applicable to these contracts at
30 June 2007 and 30 June 2006, were as follows:
Borrowings Fair value
hedged Interest Interest gain/(loss)
R’000 payable receivable R’000
2007
Interest rate swaps (0 – 1 years) – – – –
Interest rate swaps (0 – 1 years) – – – –
2006
Interest rate swaps (0 – 1 years) 80 946 3M Jibar +1,2% 9,7% fixed 980
Interest rate swaps (0 – 1 years) 80 946 10,1% fixed 3M Jibar +1,2% (649)
The interest rate swap agreements reset every six months on 17 March and 17 September, with the final reset on 17 May 2007.
Forward foreign exchange contracts
Material forward foreign exchange contracts as at 30 June 2007 and 30 June 2006 are summarised as follows:
Forward foreign exchange contracts – anticipated transactions
These forward foreign exchange contracts do not relate to specific items on the balance sheet, but were entered into to cover export proceeds not
yet receivable or import commitments not yet payable. The forward foreign exchange contracts will be utilised for the purposes of trade within the
first three months of the following year.
Foreign
currency Rand Fair value
amount amount gain/(loss)
Foreign currency ’000 R’000 R’000
2007
Forward foreign exchange sales
Canadian dollar 1 300 8 649 (17)
Euro 2 400 23 045 215
31 694 198
Forward foreign exchange purchases
Euro 6 700 64 421 (192)
96 115 6
2006
Forward foreign exchange sales
US dollar 2 850 18 301 (1 480)
Canadian dollar 1 000 5 836 (605)
Euro 5 000 41 106 (4 596)
65 243 (6 681)
The net uncovered trade proceeds at 30 June 2007 amounted to R222,3 million (2006: R125,1 million) and net uncovered trade purchases at
30 June 2007 amounted to R21,0 million (2006: R29,1 million).
74 Distell Annual Report 2007

11. SHARE CAPITAL
Number Number
’000 ’000
Shares authorised
Ordinary shares of 1 cent each 250 000 250 000
Shares issued
Opening balance 198 969 197 347
Issue of shares – share scheme 791 1 622
Ordinary shares of 1 cent each issued and fully paid 199 760 198 969
Treasury shares
Opening balance 435 1 134
Issue of shares – share scheme 791 1 622
Shares paid and delivered – share scheme (1 074) (2 321)
Shares held by The Distell Group Share Trust 152 435
Ordinary Share Treasury
shares premium shares Total
R’000 R’000 R’000 R’000
2006
Opening balance 1 974 572 098 (9 461) 564 611
Issue of shares – share scheme 16 18 390 (18 406) –
Shares paid and delivered – share scheme – – 23 754 23 754
Balance at the end of the year 1 990 590 488 (4 113) 588 365
2007
Opening balance 1 990 590 488 (4 113) 588 365
Issue of shares – share scheme 8 11 534 (11 542) –
Shares paid and delivered – share scheme – – 13 435 13 435
Balance at the end of the year 1 998 602 022 (2 220) 601 800
Ten percent of the unissued share capital is under the control of the board of directors until the next annual general meeting.
Share scheme
The trustees of The Distell Group Share Trust (the scheme) offered to participants unissued ordinary shares which were reserved for the scheme.
The total number of unissued shares reserved for the scheme is 10 488 996 (2006: 11 279 570). The details of the offer are as follows:
The offer is open for acceptance for one year from the date of the offer. The scheme is a deferred purchase scheme and payment is made in three
equal annual instalments of which the first instalment is only payable after three years.
Participants have no right to delivery, voting or dividends on shares before payment has been made. Participants may choose to pay on a later date
with the resultant deferment of rights. Payment must, however, be made within seven years.
2007 2006
75Distell Annual Report 2007

Notes to the annual financial statementsfor the years ended 30 June
11. SHARE CAPITAL (continued)
Number of Number of
shares shares paid
Offer price Number of accepted as and delivered
per share shares at 30 June as at 30 June
Date Participants (Rand) offered 2007 2007
19 March 2001 Executive directors 7,35 1 127 780 1 127 780 1 127 780
19 March 2001 Other participants 7,35 1 202 127 1 202 127 1 202 126
15 October 2002 Other participants 13,21 47 779 47 779 47 779
13 December 2002 Executive directors 14,60 953 320 953 320 635 548
13 December 2002 Other participants 14,60 1 639 069 1 639 069 1 014 197
3 June 2004 Other participants 15,05 219 570 219 570 –
25 October 2005 Executive directors 31,00 62 743 62 743 –
25 October 2005 Other participants 31,00 1 079 191 1 079 191 –
7 November 2006 Executive directors 40,00 227 233 227 233 –
7 November 2006 Other participants 40,00 335 074 335 074 –
6 893 886 6 893 886 4 027 430
2007 2006
Average Average
offer price offer price
per share Number of per share Number of
(Rand) shares (Rand) shares
The current status of the scheme is as follows:
Ordinary shares due to participants
Previous financial years 19,88 3 489 402 12,01 4 782 071
Offered and accepted in current financial year 40,00 562 307 31,00 1 254 051
Shares paid for and delivered 12,52 (1 073 136) 10,23 (2 321 233)
Resignations and other 31,00 (112 117) 14,01 (225 487)
Outstanding at the end of the year 26,15 2 866 456 19,88 3 489 402
Scheme shares outstanding at the end of the year have the following
expiry dates and exercise prices:
2007 2006
Exercise
price
per share Number of Number of
(Rand) shares shares
Shares issued, not paid for and not delivered (Share Trust) 14,60 152 074 434 636
April 2006 7,35 1 1
December 2006 14,60 – 790 573
June 2007 15,05 73 190 73 190
December 2007 14,60 790 571 790 571
June 2008 15,05 73 190 73 190
October 2008 31,00 380 644 418 017
June 2009 15,05 73 190 73 190
October 2009 31,00 380 644 418 017
November 2009 40,00 187 437 –
October 2010 31,00 380 645 418 017
November 2010 40,00 187 437 –
November 2011 40,00 187 433 –
2 866 456 3 489 402
76 Distell Annual Report 2007
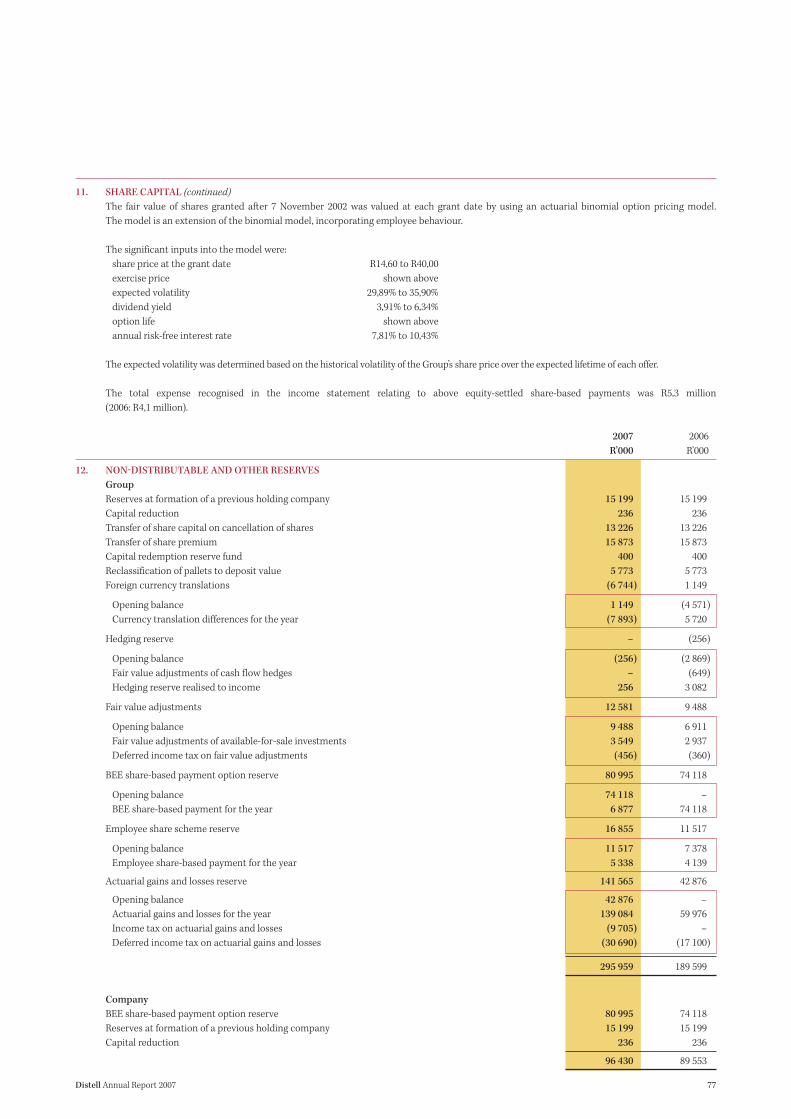
11. SHARE CAPITAL (continued)
The fair value of shares granted after 7 November 2002 was valued at each grant date by using an actuarial binomial option pricing model.
The model is an extension of the binomial model, incorporating employee behaviour.
The significant inputs into the model were:
share price at the grant date R14,60 to R40,00
exercise price shown above
expected volatility 29,89% to 35,90%
dividend yield 3,91% to 6,34%
option life shown above
annual risk-free interest rate 7,81% to 10,43%
The expected volatility was determined based on the historical volatility of the Group’s share price over the expected lifetime of each offer.
The total expense recognised in the income statement relating to above equity-settled share-based payments was R5,3 million
(2006: R4,1 million).
2007 2006
R’000 R’000
12. NON-DISTRIBUTABLE AND OTHER RESERVES
Group
Reserves at formation of a previous holding company 15 199 15 199
Capital reduction 236 236
Transfer of share capital on cancellation of shares 13 226 13 226
Transfer of share premium 15 873 15 873
Capital redemption reserve fund 400 400
Reclassification of pallets to deposit value 5 773 5 773
Foreign currency translations (6 744) 1 149
Opening balance 1 149 (4 571)
Currency translation differences for the year (7 893) 5 720
Hedging reserve – (256)
Opening balance (256) (2 869)
Fair value adjustments of cash flow hedges – (649)
Hedging reserve realised to income 256 3 082
Fair value adjustments 12 581 9 488
Opening balance 9 488 6 911
Fair value adjustments of available-for-sale investments 3 549 2 937
Deferred income tax on fair value adjustments (456) (360)
BEE share-based payment option reserve 80 995 74 118
Opening balance 74 118 –
BEE share-based payment for the year 6 877 74 118
Employee share scheme reserve 16 855 11 517
Opening balance 11 517 7 378
Employee share-based payment for the year 5 338 4 139
Actuarial gains and losses reserve 141 565 42 876
Opening balance 42 876 –
Actuarial gains and losses for the year 139 084 59 976
Income tax on actuarial gains and losses (9 705) –
Deferred income tax on actuarial gains and losses (30 690) (17 100)
295 959 189 599
Company
BEE share-based payment option reserve 80 995 74 118
Reserves at formation of a previous holding company 15 199 15 199
Capital reduction 236 236
96 430 89 553
77Distell Annual Report 2007

Notes to the annual financial statementsfor the years ended 30 June
13. RETAINED EARNINGS
Company 979 591 979 591
Consolidated subsidiaries 2 024 322 1 524 719
Joint ventures 33 561 28 978
Associated companies 2 969 2 031
3 040 443 2 535 319
Opening balance 2 535 319 2 267 719
Profit for the year 847 853 534 388
Dividends paid (342 729) (266 788)
Balance at the end of the year 3 040 443 2 535 319
Any future dividends declared from the distributable reserves of the company or its subsidiaries,
which are not wholly owned subsidiaries of the company and are incorporated in South Africa,
may be subject to secondary taxation on companies (STC) at a rate of 12,5% of the dividends
declared.
Dividends received by group companies during their various dividend cycles can be carried
forward as unutilised STC credits. These STC credits can then be utilised to reduce any STC
payable on future dividends declared by Group companies.
Changes in legislation relating to STC are currently being contemplated by the revenue authorities.
The Group had unutilised STC credits of R25,6 million at 30 June 2007 (2006: R26,4 million).
14. INTEREST-BEARING BORROWINGS
Non-current
Unsecured loan, bearing interest at a fixed rate of 8,8% per annum, payable six-monthly in arrears,
with a final redemption on 3 March 2008 328 484 328 484
Unsecured loan, bearing interest at a fixed rate of 10,7% per annum, payable six-monthly in arrears,
with a final redemption on 17 May 2007 – 326 819
Secured loans on capitalised finance lease vehicles (see note 3), bearing interest at a variable
rate of 1,8% below prime per annum, payable monthly in arrears in instalments of R91 068
(2006: R57 130) for 48 months 3 409 2 062
331 893 657 365
Less: Portion of loans repayable within one year, included in current liabilities (329 264) (326 719)
2 629 330 646
Current
Unsecured call accounts and bank overdrafts – 105 783
Short-term portion of non-current borrowings 329 264 326 719
329 264 432 502
Total interest-bearing borrowings 331 893 763 148
The interest rate repricing profile at 30 June 2007 and 30 June 2006 is summarised as follows:
% of 2007 2006 % of
Interest-bearing borrowings total R’000 R’000 total
Fixed rate (unsecured loans) 99,0 328 484 655 303 85,8
Floating rate (secured loans) 1,0 3 409 2 062 0,3
Floating call rate (2006: 7,4%) – – 105 783 13,9
Total interest-bearing borrowings 100,0 331 893 763 148 100,0
The maturity profile of the interest-bearing borrowings is indicated in note 34.5.
2007 2006
R’000 R’000
78 Distell Annual Report 2007

14. INTEREST-BEARING BORROWINGS (continued)
The Group’s unutilised banking facilities and reserve borrowing capacity are as follows:
Unutilised banking facilities
Total floating rate banking facilities expiring within one year 1 620 000 1 682 000
Less: Current interest-bearing borrowings – (105 783)
Unutilised banking facilities 1 620 000 1 576 217
Banking facilities are renewed annually and are subject to review at various dates during the
next year.
Unutilised borrowing capacity
In terms of the company’s articles of association, the aggregate amount of the Group’s year-end
interest-bearing borrowings is limited to 100% of total equity of the Group.
Maximum permissible year-end interest-bearing borrowings 3 940 680 3 316 048
Total interest-bearing borrowings (331 893) (763 148)
Unutilised borrowing capacity 3 608 787 2 552 900
Cash and cash equivalents 332 426 227 578
Unutilised borrowing capacity and cash and cash equivalents 3 941 213 2 780 478
No assets of the Group, other than vehicles under finance lease agreements, were encumbered as
at 30 June 2007.
15. RETIREMENT BENEFITS
Balance sheet assets for:
Pension benefits (45 851) (9 972)
Post-retirement medical liability (141 201) (38 823)
(187 052) (48 795)
Balance sheet obligations for:
Post-retirement medical liability 12 842 12 191
12 842 12 191
Net retirement benefit asset (174 210) (36 604)
Income statement charge for:
Pension benefits (5 744) (9 972)
Post-retirement medical liability 12 723 11 953
6 979 1 981
15.1 Pension benefits
Defined-benefit pension funds
The Group operates two defined-benefit pension funds and three defined-contribution provident funds. All permanent employees have access
to these funds. These schemes are regulated by the Pension Funds Act, 1956, as amended, and are managed by trustees and administered by
independent administrators. Fund assets are held independently of the Group’s finances.
The defined-benefit pension funds are actuarially valued every three years and reviewed every year using the projected unit credit method. The
latest full actuarial valuation was performed on 1 March 2005 and indicated that the plans are in a sound financial position.
2007 2006
R’000 R’000
79Distell Annual Report 2007
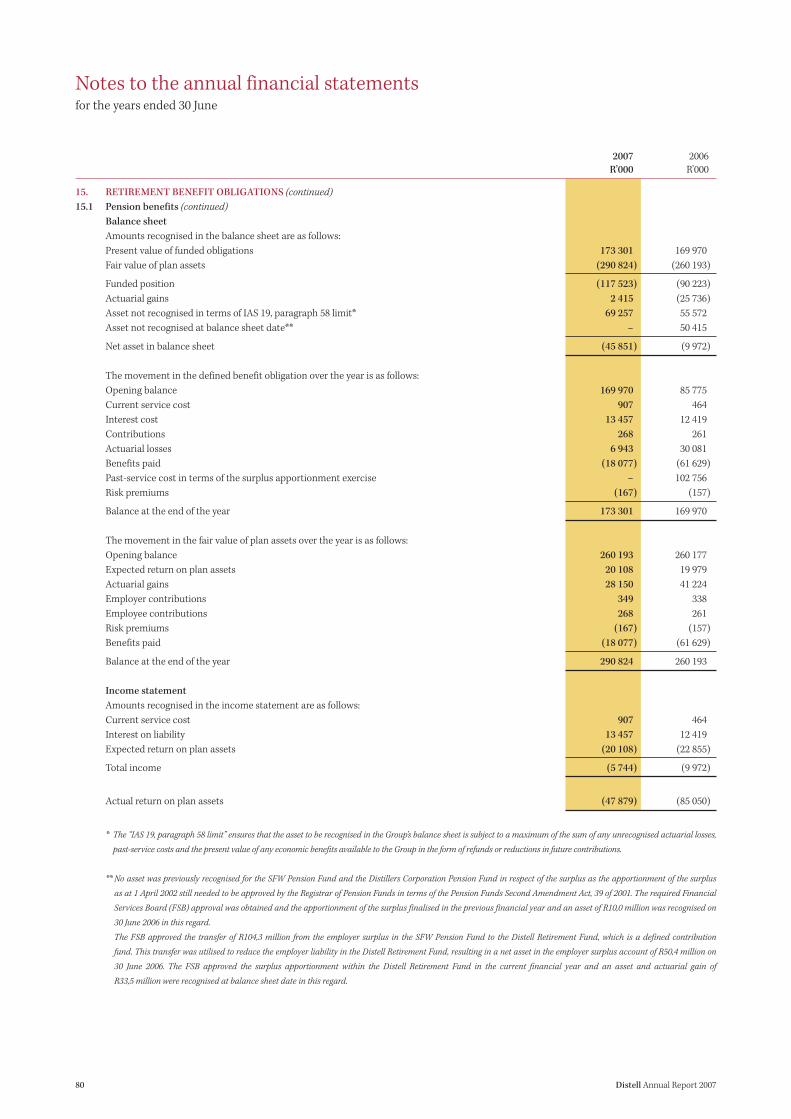
Notes to the annual financial statementsfor the years ended 30 June
15. RETIREMENT BENEFIT OBLIGATIONS (continued)
15.1 Pension benefits (continued)
Balance sheet
Amounts recognised in the balance sheet are as follows:
Present value of funded obligations 173 301 169 970
Fair value of plan assets (290 824) (260 193)
Funded position (117 523) (90 223)
Actuarial gains 2 415 (25 736)
Asset not recognised in terms of IAS 19, paragraph 58 limit* 69 257 55 572
Asset not recognised at balance sheet date** – 50 415
Net asset in balance sheet (45 851) (9 972)
The movement in the defined benefit obligation over the year is as follows:
Opening balance 169 970 85 775
Current service cost 907 464
Interest cost 13 457 12 419
Contributions 268 261
Actuarial losses 6 943 30 081
Benefits paid (18 077) (61 629)
Past-service cost in terms of the surplus apportionment exercise – 102 756
Risk premiums (167) (157)
Balance at the end of the year 173 301 169 970
The movement in the fair value of plan assets over the year is as follows:
Opening balance 260 193 260 177
Expected return on plan assets 20 108 19 979
Actuarial gains 28 150 41 224
Employer contributions 349 338
Employee contributions 268 261
Risk premiums (167) (157)
Benefits paid (18 077) (61 629)
Balance at the end of the year 290 824 260 193
Income statement
Amounts recognised in the income statement are as follows:
Current service cost 907 464
Interest on liability 13 457 12 419
Expected return on plan assets (20 108) (22 855)
Total income (5 744) (9 972)
Actual return on plan assets (47 879) (85 050)
* The “IAS 19, paragraph 58 limit” ensures that the asset to be recognised in the Group’s balance sheet is subject to a maximum of the sum of any unrecognised actuarial losses,
past-service costs and the present value of any economic benefits available to the Group in the form of refunds or reductions in future contributions.
** No asset was previously recognised for the SFW Pension Fund and the Distillers Corporation Pension Fund in respect of the surplus as the apportionment of the surplus
as at 1 April 2002 still needed to be approved by the Registrar of Pension Funds in terms of the Pension Funds Second Amendment Act, 39 of 2001. The required Financial
Services Board (FSB) approval was obtained and the apportionment of the surplus finalised in the previous financial year and an asset of R10,0 million was recognised on
30 June 2006 in this regard.
The FSB approved the transfer of R104,3 million from the employer surplus in the SFW Pension Fund to the Distell Retirement Fund, which is a defined contribution
fund. This transfer was utilised to reduce the employer liability in the Distell Retirement Fund, resulting in a net asset in the employer surplus account of R50,4 million on
30 June 2006. The FSB approved the surplus apportionment within the Distell Retirement Fund in the current financial year and an asset and actuarial gain of
R33,5 million were recognised at balance sheet date in this regard.
2007 2006
R’000 R’000
80 Distell Annual Report 2007

15. RETIREMENT BENEFIT OBLIGATIONS (continued)
15.1 Pension benefits (continued)
Principal actuarial assumptions on balance sheet date
Discount rate 7,8% 8,0%
Expected rate of return on plan assets 8,3% 7,5%
Future salary increases 5,8% 6,0%
Future pension increases 4,8% 5,0%
Inflation rate 4,8% 5,0%
2007 2006
R’000 R’000
15.2 Post-retirement medical liability
Balance sheet
Amounts recognised in the balance sheet are as follows:
Present value of funded obligation 441 128 395 764
Fair value of plan assets (569 487) (422 396)
Net asset in balance sheet (128 359) (26 632)
The movement in the defined benefit obligation over the year is as follows:
Opening balance 395 764 312 008
Current service cost 19 228 12 991
Interest cost 31 074 26 108
Actuarial losses 4 764 54 372
Benefits paid (9 702) (9 715)
Balance at the end of the year 441 128 395 764
The movement in the fair value of plan assets over the year is as follows:
Opening balance 422 396 290 617
Expected return on plan assets 37 579 27 146
Actuarial gains 107 969 114 348
Employer contributions 11 245 –
Benefits paid (9 702) (9 715)
Balance at the end of the year 569 487 422 396
Income statement
Amounts recognised in the income statement are as follows:
Current service cost 19 228 12 991
Interest on liability 31 074 26 108
Expected return on plan assets (37 579) (27 146)
Total expense 12 723 11 953
The post-retirement medical liability is actuarially valued every year, using the projected unit credit
method. Plan assets are valued at current market value.
Principal actuarial assumptions on balance sheet date
Discount rate 7,8% 8,0%
Expected rate of return on assets 8,8% 9,0%
Future salary increases 5,8% 6,0%
Annual increases in health cost 6,8% 7,0%
Expected membership continuation at retirement 95,0% 95,0%
Expected retirement age 60 60
2007 2006
81Distell Annual Report 2007

Notes to the annual financial statementsfor the years ended 30 June
Decrease Increase
82 Distell Annual Report 2007
15. RETIREMENT BENEFIT OBLIGATIONS (continued)
15.2 Post-retirement medical liability (continued)
The effect of a 1% movement in the assumed health cost trend rate is as follows:
Effect on the aggregate of the current service cost and interest cost 11 699 16 010
Effect on the defined-benefit obligation 78 674 104 501
2007 2006
R’000 R’000
Actuarial gains recognised in the SoRIE 139 084 59 976
Cumulative actuarial gains recognised in the SoRIE 199 060 59 976
16. DEFERRED INCOME TAX
Deferred income tax assets and deferred income tax liabilities are offset when there is a legally
enforceable right of offset and when the deferred income tax relates to the same fiscal authority.
The amounts disclosed on the balance sheet are as follows:
Companies in the Group with net deferred income tax assets
Deferred tax asset to be recovered after more than 12 months (18 459) (29 452)
Deferred tax asset to be recovered within 12 months (10 303) (7 318)
(28 762) (36 770)
Companies in the Group with net deferred income tax liabilities
Deferred tax liability to be recovered after more than 12 months 142 999 92 252
Deferred tax liability to be recovered within 12 months 21 034 28 395
164 033 120 647
Net deferred income tax 135 271 83 877
The gross movement on the deferred income tax account is as follows:
Opening balance 83 877 66 528
Income statement charge
Provision for the year 20 248 (111)
Charged to equity (note 12) 31 146 17 460
Balance at the end of the year 135 271 83 877
The movement in deferred income tax assets and liabilities during the year, without taking
offsetting into account, is as follows:
Allowances Actuarial
on fixed Biological gains and
assets assets losses Total
Deferred income tax liabilities R’000 R’000 R’000 R’000
2006
Opening balance 129 430 20 691 – 150 121
Charged to the income statement 2 849 (2 206) – 643
Charged to equity – – 17 100 17 100
Balance at the end of the year 132 279 18 485 17 100 167 864
2007
Opening balance 132 279 18 485 17 100 167 864
Charged to the income statement 8 883 3 543 – 12 426
Charged to equity – – 30 690 30 690
Balance at the end of the year 141 162 22 028 47 790 210 980

83Distell Annual Report 2007
16. DEFERRED INCOME TAX (continued)
Leave and
Impairment of Assessed Unutilised bonus
receivables losses STC credits accruals Other Total
Deferred income tax assets R’000 R’000 R’000 R’000 R’000 R’000
2006
Opening balance (6 731) (25 340) (18 255) (17 526) (15 741) (83 593)
Charged to the income statement 443 (701) 14 949 (22 366) 6 921 (754)
Charged to equity – – – – 360 360
Balance at the end of the year (6 288) (26 041) (3 306) (39 892) (8 460) (83 987)
2007
Opening balance (6 288) (26 041) (3 306) (39 892) (8 460) (83 987)
Charged to the income statement 3 168 5 509 104 (1 829) 870 7 822
Charged to equity – – – – 456 456
Balance at the end of the year (3 120) (20 532) (3 202) (41 721) (7 134) (75 709)
2007 2006
R’000 R’000
17. TRADE AND OTHER PAYABLES
Trade payables 858 029 616 249
Accrued expenses 58 077 42 756
Accrued leave pay 40 328 34 550
Excise duty 417 731 376 921
Value added tax 12 236 22 715
1 386 401 1 093 191
18. PROVISIONS
Bonuses
Opening balance 103 010 60 433
Charged to the income statement
Additional provisions 105 567 106 714
Unused amounts – reversed (11 725) (548)
Utilised during the year (93 313) (63 589)
Balance at the end of the year 103 539 103 010
Performance and other bonuses 101 778 101 208
Long-service bonuses 1 761 1 802
103 539 103 010
The majority of employees in service of the Group participate in a performance-based incentive scheme and a provision is made for the estimated
liability in terms of set performance criteria. These bonuses are paid in October of every year.
The Group pays long-service bonuses to employees after 10, 25 and 35 years of service respectively. An actuarial calculation is done to determine
the Group’s liability under this practice using the projected unit credit method. The calculation is based on a discount rate of 8% and an attrition
rate of 7%.

Notes to the annual financial statementsfor the years ended 30 June
84 Distell Annual Report 2007
19. REVENUE
Group
Sales 6 231 244 5 247 586
Excise duty 1 723 358 1 469 624
7 954 602 6 717 210
Company
Dividends received
Ordinary shares: South African Distilleries and Wines (SA) Limited 291 477 102 846
Preference shares: WIPHOLD Beverages (Proprietary) Limited 51 437 18 150
342 914 120 996
20. OPERATING EXPENSES
20.1 Costs classified by function
Costs of goods sold 5 178 362 4 407 290
Sales and marketing expenses 910 472 703 873
Distribution costs 488 273 430 627
Administration and other costs 262 762 286 025
6 839 869 5 827 815
20.2 Costs classified by nature
Group
Administrative and managerial fees 6 597 6 286
Advertising costs and promotions 643 765 466 792
Amortisation of intangible assets 11 052 4 275
Auditor’s remuneration (note 20.3) 4 975 4 509
BEE share-based payment relating to employees 6 877 6 877
Depreciation (note 3) 126 637 128 866
Employee benefit expense (note 20.4) 808 206 754 533
Impairment of trade and other receivables 4 050 7 079
Net fair value adjustment of biological assets (note 4) 2 129 8 581
Net foreign exchange losses 1 540 (17 584)
Operating lease expenses (notes 20.5 and 32) 70 295 60 278
Loss on disposal of property, plant and equipment – 255
Raw materials and consumables used 4 751 861 4 108 606
Research and development expenditure: trademarks and brands 6 495 6 359
Transportation costs 147 054 112 465
Other expenses 248 336 169 638
6 839 869 5 827 815
Company
Profit on disposal of interest in subsidiary: Sale of 15% in South African Distilleries and
Wines to WIP Beverages (see note 38) – (750 325)
– (750 325)
2007 2006
R’000 R’000

20. OPERATING EXPENSES (continued)
20.3 Auditor’s remuneration
Audit fees 3 411 3 021
Audit fees in respect of previous year 170 132
Fees for other services
Taxation 1 197 993
Other 140 289
Expenses 57 74
4 975 4 509
20.4 Employee benefit expense
Salaries and wages 720 881 682 441
Scheme shares granted to directors and employees 5 337 4 139
Pension costs – defined-contribution plans 44 824 39 695
Medical aid contributions 30 185 26 277
Post-retirement medical benefits 12 723 11 953
Pension benefits (5 744) (9 972)
808 206 754 533
20.5 Operating lease expenses
Properties 25 586 22 680
Vehicles 23 855 20 216
Equipment 11 713 8 745
Machinery 9 141 8 637
70 295 60 278
21. BEE SHARE-BASED PAYMENT
Employee portion – recurring 6 877 6 877
Non-employee portion – non-recurring – 67 241
6 877 74 118
Taxation – –
6 877 74 118
See note 38 for details about the BEE transaction.
22. NET OTHER GAINS
Net insurance proceeds received for fire damage to production site 63 587 –
Profit on disposal of property, plant and equipment 10 289 –
73 876 –
Taxation (5 317) –
68 559 –
23. DIVIDEND INCOME
Dividend income is derived from unlisted investments 1 284 1 497
1 284 1 497
24. FINANCE INCOME
Interest received
Cash and cash equivalents 38 212 38 146
Other 3 452 6 713
Dividends received on preference shares 45 508 48 624
87 172 93 483
2007 2006
R’000 R’000
85Distell Annual Report 2007

Notes to the annual financial statementsfor the years ended 30 June
25. FINANCE COSTS
Interest paid
Borrowings (77 029) (118 289)
Other (2 220) (2 597)
Fair value gains on financial instruments
Interest rate swaps: cash flow hedges transferred from equity (256) (3 082)
Interest rate swaps: fair value hedges 302 3 122
(79 203) (120 846)
26. SHARE OF PROFIT OF ASSOCIATES
Share of profit before taxation 20 789 14 408
Share of taxation (6 534) (4 552)
14 255 9 856
Dividends received (13 317) (8 671)
Share of profit for the year 938 1 185
27. TAXATION
27.1 Normal company taxation
Group
Current taxation
current year 347 528 264 233
previous year (533) 7 634
Deferred taxation 20 248 (111)
367 243 271 756
Composition
Normal South African taxation 300 220 236 056
Foreign taxation 30 087 23 414
Secondary taxation on companies (STC) 36 936 12 286
367 243 271 756
Company
Deferred taxation
current year – 18 255
27.2 Reconciliation of rate of taxation (%)
Standard rate for companies 29,0 29,0
Differences arising from normal activities:
non-taxable income (3,1) (2,3)
non-deductible expenses 1,2 3,5
taxation losses utilised – (0,1)
foreign tax rate differential and withholding taxes 0,2 0,2
27,3 30,3
Secondary taxation on companies 3,0 1,5
Unutilised STC credits – 1,9
Effective rate 30,3 33,7
27.3 Taxation losses
Calculated taxation losses and capital improvements available for offset against future taxable income 77 924 97 558
Applied to reduce deferred income tax (70 801) (89 796)
7 123 7 762
2007 2006
R’000 R’000
86 Distell Annual Report 2007

28. EARNINGS PER ORDINARY SHARE
28.1 Basic, headline and cash equivalent earnings per share
The calculation of earnings per ordinary share is based on earnings as detailed below and on the
weighted average number of ordinary shares in issue.
Weighted average number of ordinary shares in issue (’000) 199 079 197 414
Earnings reconciliation
Profit attributable to equity holders 874 853 534 388
Adjusted for (net of taxation):
net other capital gains (68 559) (181)
loss on disposal of interest in associate – 1 763
Headline earnings 779 294 535 970
Adjusted for (net of taxation):
non-recurring BEE share-based payment (note 21) – 67 241
Adjusted headline earnings 779 294 603 211
Basic earnings per share (cents) 425,9 270,7
Headline earnings per share (cents) 391,5 271,5
Adjusted headline earnings per share (cents) 391,5 305,6
Cash equivalent earnings
Profit attributable to equity holders 847 853 534 388
Adjusted for:
deferred income tax (note 27.1) 20 248 (111)
dividend from preference shares (note 24) (45 508) (48 624)
BEE share-based payment (note 21) 6 877 74 118
non-cash flow items (note 30.1) 117 539 185 540
Total cash equivalent earnings 947 009 745 311
Cash equivalent earnings per share (cents) 475,7 377,5
28.2 Diluted earnings per share
Diluted earnings per share is calculated by adjusting the weighted average number of ordinary shares outstanding to assume conversion of all
dilutive potential ordinary shares. The company has two categories of dilutive potential ordinary shares: shares offered, but not paid and delivered,
to participants in the share scheme (note 11) and the call option granted to the consortium participating in the BEE transaction (note 38).
For the share scheme, a calculation is done to determine the number of shares that could have been acquired at fair value (determined as the
average annual market share price of the company’s shares) based on the monetary value of the subscription rights attached to outstanding
scheme shares. The number of shares calculated as above is compared with the number of shares that would have been issued assuming the
exercise of the share scheme options.
For the BEE transaction, a calculation is done to determine the additional number of shares that could have been issued at fair value (determined
as the average market share price of the company’s shares) based on the value of WIPHOLD Beverages (Proprietary) Limited at year-end.
2007 2006
R’000 R’000
87Distell Annual Report 2007
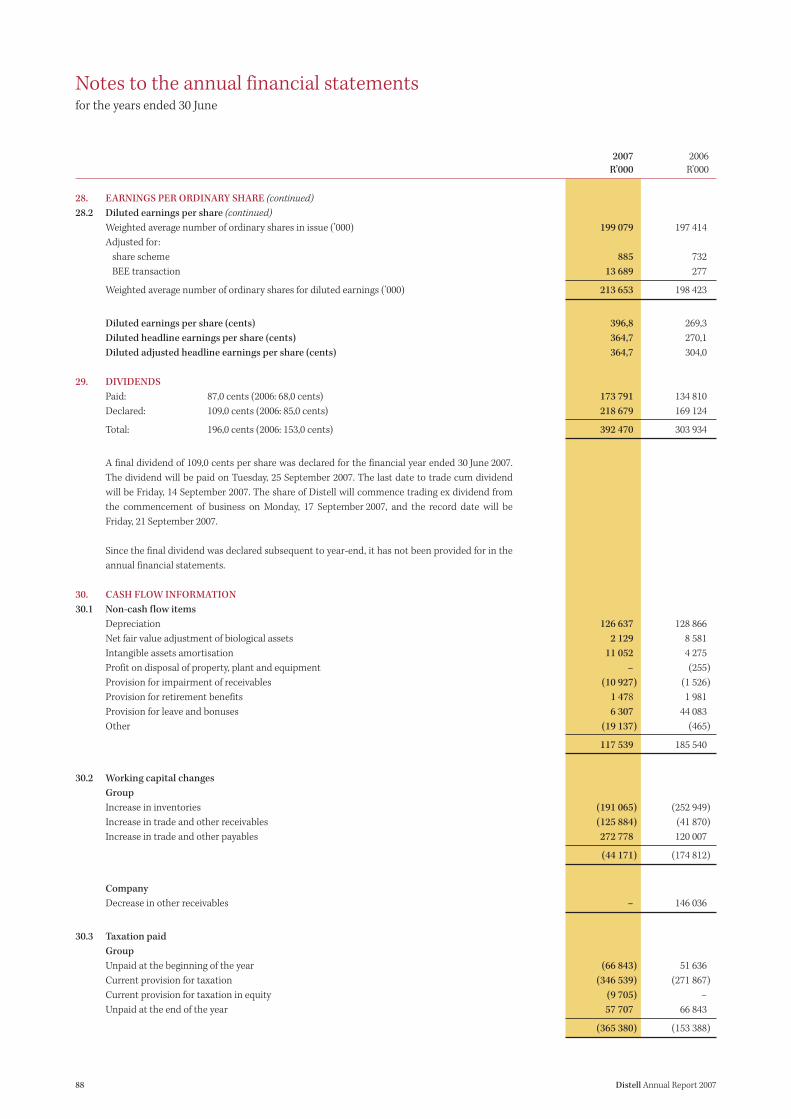
Notes to the annual financial statementsfor the years ended 30 June
28. EARNINGS PER ORDINARY SHARE (continued)
28.2 Diluted earnings per share (continued)
Weighted average number of ordinary shares in issue (’000) 199 079 197 414
Adjusted for:
share scheme 885 732
BEE transaction 13 689 277
Weighted average number of ordinary shares for diluted earnings (’000) 213 653 198 423
Diluted earnings per share (cents) 396,8 269,3
Diluted headline earnings per share (cents) 364,7 270,1
Diluted adjusted headline earnings per share (cents) 364,7 304,0
29. DIVIDENDS
Paid: 87,0 cents (2006: 68,0 cents) 173 791 134 810
Declared: 109,0 cents (2006: 85,0 cents) 218 679 169 124
Total: 196,0 cents (2006: 153,0 cents) 392 470 303 934
A final dividend of 109,0 cents per share was declared for the financial year ended 30 June 2007.
The dividend will be paid on Tuesday, 25 September 2007. The last date to trade cum dividend
will be Friday, 14 September 2007. The share of Distell will commence trading ex dividend from
the commencement of business on Monday, 17 September 2007, and the record date will be
Friday, 21 September 2007.
Since the final dividend was declared subsequent to year-end, it has not been provided for in the
annual financial statements.
30. CASH FLOW INFORMATION
30.1 Non-cash flow items
Depreciation 126 637 128 866
Net fair value adjustment of biological assets 2 129 8 581
Intangible assets amortisation 11 052 4 275
Profit on disposal of property, plant and equipment – (255)
Provision for impairment of receivables (10 927) (1 526)
Provision for retirement benefits 1 478 1 981
Provision for leave and bonuses 6 307 44 083
Other (19 137) (465)
117 539 185 540
30.2 Working capital changes
Group
Increase in inventories (191 065) (252 949)
Increase in trade and other receivables (125 884) (41 870)
Increase in trade and other payables 272 778 120 007
(44 171) (174 812)
Company
Decrease in other receivables – 146 036
30.3 Taxation paid
Group
Unpaid at the beginning of the year (66 843) 51 636
Current provision for taxation (346 539) (271 867)
Current provision for taxation in equity (9 705) –
Unpaid at the end of the year 57 707 66 843
(365 380) (153 388)
2007 2006
R’000 R’000
88 Distell Annual Report 2007
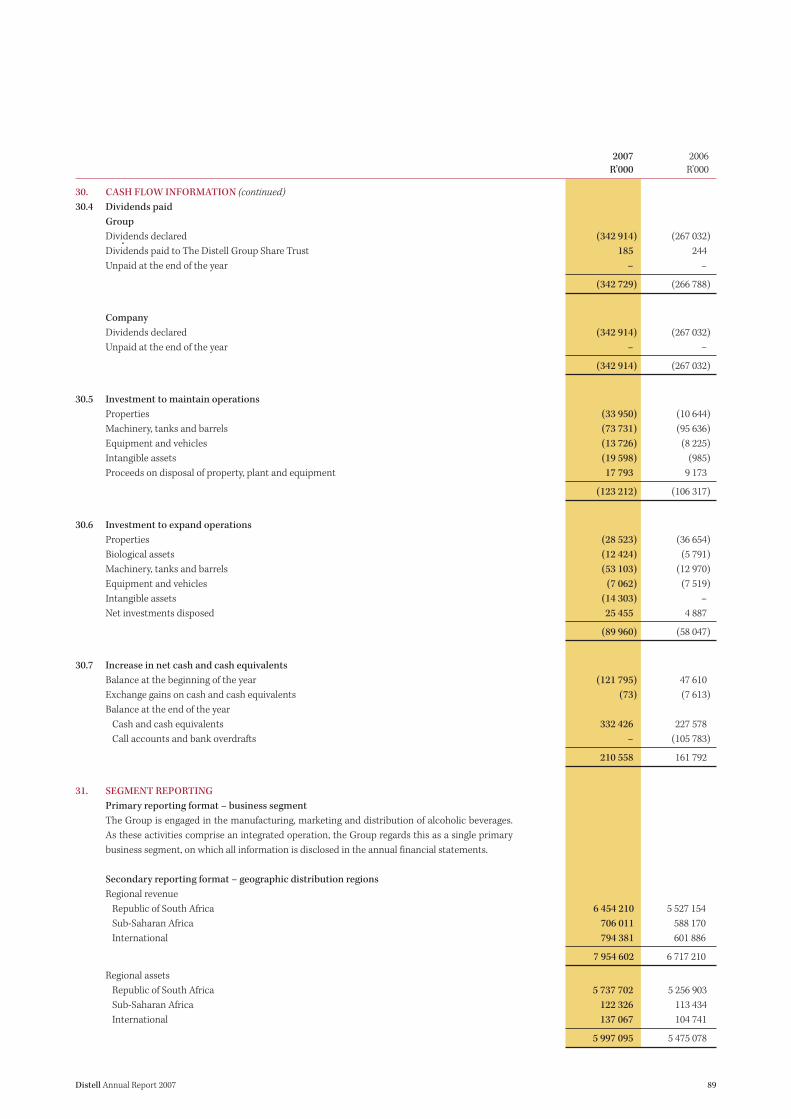
89Distell Annual Report 2007
30. CASH FLOW INFORMATION (continued)
30.4 Dividends paid
Group
Dividends declared (342 914) (267 032)
Dividends paid to The Distell Group Share Trust 185 244
Unpaid at the end of the year – –
(342 729) (266 788)
Company
Dividends declared (342 914) (267 032)
Unpaid at the end of the year – –
(342 914) (267 032)
30.5 Investment to maintain operations
Properties (33 950) (10 644)
Machinery, tanks and barrels (73 731) (95 636)
Equipment and vehicles (13 726) (8 225)
Intangible assets (19 598) (985)
Proceeds on disposal of property, plant and equipment 17 793 9 173
(123 212) (106 317)
30.6 Investment to expand operations
Properties (28 523) (36 654)
Biological assets (12 424) (5 791)
Machinery, tanks and barrels (53 103) (12 970)
Equipment and vehicles (7 062) (7 519)
Intangible assets (14 303) –
Net investments disposed 25 455 4 887
(89 960) (58 047)
30.7 Increase in net cash and cash equivalents
Balance at the beginning of the year (121 795) 47 610
Exchange gains on cash and cash equivalents (73) (7 613)
Balance at the end of the year
Cash and cash equivalents 332 426 227 578
Call accounts and bank overdrafts – (105 783)
210 558 161 792
31. SEGMENT REPORTING
Primary reporting format – business segment
The Group is engaged in the manufacturing, marketing and distribution of alcoholic beverages.
As these activities comprise an integrated operation, the Group regards this as a single primary
business segment, on which all information is disclosed in the annual financial statements.
Secondary reporting format – geographic distribution regions
Regional revenue
Republic of South Africa 6 454 210 5 527 154
Sub-Saharan Africa 706 011 588 170
International 794 381 601 886
7 954 602 6 717 210
Regional assets
Republic of South Africa 5 737 702 5 256 903
Sub-Saharan Africa 122 326 113 434
International 137 067 104 741
5 997 095 5 475 078
2007 2006
R’000 R’000

Notes to the annual financial statementsfor the years ended 30 June
2007 2006
R’000 R’000
90 Distell Annual Report 2007
31. SEGMENT REPORTING (continued)
Secondary reporting format – geographic distribution regions (continued)
Capital expenditure on property, plant and equipment
Republic of South Africa 208 174 158 596
Sub-Saharan Africa 1 718 6 820
International 203 6 232
210 095 171 648
Regional revenue excludes sales between Group companies.
Regional assets include operating assets and investments in associates, but exclude intercompany balances.
32. COMMITMENTS
Capital commitments
Capital expenditure contracted, not yet incurred 155 772 61 387
Capital expenditure authorised by the directors, not yet contracted 371 260 202 143
527 032 263 530
Composition of capital commitments
Subsidiaries 515 524 259 346
Joint ventures 11 508 4 184
527 032 263 530
These commitments will be incurred in the coming year and will be financed by own and borrowed
funds, comfortably contained within established gearing constraints.
Operating lease commitments
The Group leases various warehouses, machinery, equipment and vehicles under non-cancellable
operating lease agreements. The leases have varying terms, renewal rights and escalation clauses. The
majority of escalation clauses are linked to the CPIX inflation rate.
The future minimum lease payments under non-cancellable operating leases are as follows:
Not later than 1 year 45 566 39 827
Later than 1 year and not later than 5 years 108 221 78 764
153 787 118 591
Finance lease commitments
The Group entered into finance lease agreements with financial institutions for the lease of vehicles for a period of between 48 and 60 months.
In terms of the lease agreements, instalments are payable at the end of each month. Ownership of the vehicles is transferred to employees of the
Group at the end of the lease agreements. The agreements have no contingent rents.
Later than
Not 1 year and
later than not later than
1 year 5 years Total Total
R’000 R’000 R’000 R’000
Minimum lease payments 1 102 3 077 4 179 2 453
Finance costs (322) (448) (770) (391)
Present value of minimum lease payments 780 2 629 3 409 2 062

91Distell Annual Report 2007
33. CONTINGENCIES
In prior years the Group received compensation for relinquishing its distribution rights to certain whisky trademarks. The South African Revenue
Service has issued revised assessments to the value of R29,5 million in terms of which the proceeds of R67 million have been subjected to
income tax and value added tax. The Group has lodged an appeal against these assessments and the matter will be heard in the Special Income
Tax Court.
34. FINANCIAL RISK MANAGEMENT
34.1 Treasury risk management
The Group adopts a prudent, but flexible approach towards the use of derivative instruments aimed at reducing or eliminating foreign currency
and interest rate risks, using the most cost-effective means available. Senior executives and advisers meet on a regular basis to analyse currency
and interest rate exposures and re-evaluate treasury management strategies against revised economic forecasts. Group policies are reviewed
annually by the board of directors.
34.2 Foreign currency risk management
The Group has transactional currency exposures, which principally arise from sales and purchases, in currencies other than SA rand. In order to
manage this risk, the Group may enter into transactions in terms of approved policies and limits which make use of financial instruments that
include forward foreign exchange contracts.
The Group does not speculate or engage in the trading of financial instruments.
The functional currencies of the following subsidiaries are as follows:
Afdis Holdings (Private) Limited (Zimbabwe) (50%) Zimbabwe dollar
Distell Namibia Limited (Namibia) Namibian dollar
Distillers Corporation (Botswana) (Proprietary) Limited (Botswana) Botswana pula
Grays Inc Limited (Mauritius) (26%) Mauritian rupee
Namibia Wines & Spirits Limited (Namibia) Namibian dollar
Swaziland Liquor Distributors Limited (Swaziland) Emalangeni
Tanzania Distilleries Limited (Tanzania) (35%) Tanzanian shilling
34.3 Interest rate risk management
Interest rate risk arises from the repricing of forward cover and floating rate debt as well as incremental funding/new borrowings and the rollover
of maturing debt/refinancing of existing borrowings. The interest rate characteristics of new borrowings and the refinancing of existing borrowings
are revised on an ongoing basis.
34.4 Credit risk management
Potential concentrations of credit risk principally exist for trade receivables, cash and cash equivalents, derivatives and investments. The Group
only deposits cash with banks with high credit ratings. Trade receivables comprise a large, widespread customer base and the Group performs
ongoing credit evaluations of the financial condition of these customers. The granting of credit is controlled by application and the assumptions
applied therein are reviewed and updated on an ongoing basis.
The Group is exposed to credit-related losses in the event of non-performance by counterparties to hedging instruments. The counterparties to
these contracts are major financial institutions. The Group continually monitors its positions and the credit ratings of its counterparties and limits
the extent to which it enters into contracts with any one party.
The Group is exposed to credit-related losses in the event of non-performance by counterparties to financial guarantee contracts relating to
vineyard development loans to certain farmers of R47,4 million and staff housing loans of R2,9 million (2006: R3,0 million). The guarantees relating
to vineyard development loans are secured by mortgage bonds over farming property with a market value in excess of the loan obligations. The
Group continually monitors its positions and limits its exposure with any one party.
At 30 June 2007, the Group did not consider there to be a significant concentration of credit risk which had not been adequately provided for.

Notes to the annual financial statementsfor the years ended 30 June
92 Distell Annual Report 2007
34. FINANCIAL RISK MANAGEMENT (continued)
34.5 Liquidity risk management
The Group manages liquidity risk through the compilation and monitoring of cash flow forecasts, as well as ensuring that adequate borrowing
facilities are maintained.
The maturity profile of the Group’s financial instruments are summarised as follows (derivative instruments reflect their contract amounts):
0 – 12 1 – 2 3 – 5 Beyond 5 2007 2006
months years years years Total Total
R’000 R’000 R’000 R’000 R’000 R’000
Financial assets
Derivative instruments 215 – – – 215 980
Trade and other receivables 808 809 – – – 808 809 616 117
Cash and cash equivalents 332 426 – – – 332 426 227 578
Other financial assets 361 152 – – 72 822 433 974 657 747
Financial liabilities
Derivative instruments 209 – – – 209 7 330
Trade and other payables 1 489 731 – – – 1 489 731 1 188 871
Interest-bearing borrowings 329 264 780 1 849 – 331 893 763 148
Current income tax liabilities 57 707 – – – 57 707 66 843
34.6 Fair value of financial instruments
The estimated net fair values, at 30 June 2007, have been determined using available market information and appropriate valuation methodologies,
as detailed below, but are not necessarily indicative of the amounts that the Group could realise in the normal course of business.
The following methods and assumptions were used by the Group in establishing fair values:
Cash and cash equivalents, trade and other receivables and loans: The carrying amounts reported in the balance sheet approximate
fair values.
Interest-bearing borrowings and trade and other payables: The carrying amounts reported in the balance sheet approximate fair values.
Forward foreign exchange contracts: Forward foreign exchange contracts are entered into to cover import orders and export proceeds, and
fair values are determined using foreign exchange bid or offer rates at year-end.
35. HYPERINFLATIONARY ECONOMIES
The Group’s joint venture in Zimbabwe operated in a hyperinflationary environment and the conversion factors and indices that were used to
restate the relevant financial statements are detailed below. The conversion factors are derived from the Zimbabwean consumer price index
issued by the Zimbabwean Central Statistics office.
2007 2006
Indices 4 032 634 158 708
Conversion factor 1,00 25,41
Parallel rate used for conversion of results 26 000 60 000
R’000 R’000
Loss on net monetary position, included in net foreign exchange gains (note 20.2) 11 816 1 816

93Distell Annual Report 2007
36. BUSINESS COMBINATIONS
With effect from 1 January 2006, the Group acquired 26% of the share capital of Grays Inc Limited, a liquor producer and distributor in Mauritius.
The acquired business contributed net income of R1,1 million for the 18 months to 30 June 2007.
With effect from 1 July 2006, Lomond Wine Estates (Proprietary) Limited, in which the Group holds a 50% interest, acquired a vineyard farming
operation from Lomond Properties (Proprietary) Limited. The acquired business contributed a net loss of R1,0 million for the 12 months to
30 June 2007.
Lomond
Wine Estates
Grays Inc (Proprietary)
Limited Limited
R’000 R’000
Details of the net assets acquired and goodwill are as follows:
Purchase consideration – cash paid 6 949 7 700
Fair value of net assets acquired (4 451) (7 700)
Goodwill (note 6) 2 498 –
The goodwill is attributable to the profitability of the acquired business and the synergies
expected to arise after the Group’s acquisition.
The fair value assets and liabilities arising from the acquisitions are as follows:
Property, plant and equipment 4 241 899
Biological assets – 16 106
Intangible assets 1 036 –
Deferred income tax assets 285 –
Inventories 32 446 –
Trade and other receivables 43 220 38
Cash and cash equivalents 2 236 1
Borrowings (32 773) (173)
Shareholder’s loan (16 753) –
Retirement benefit obligations (2 290) –
Trade and other payables (14 531) (1 471)
Net assets 17 117 15 400
Group’s interest in net assets acquired 4 451 7 700
Purchase consideration settled in cash 6 949 7 700
Shareholder’s loan for working capital requirements 4 356 –
Cash outflow on acquisition 11 305 7 700

Notes to the annual financial statementsfor the years ended 30 June
37. CHANGES IN ACCOUNTING POLICIES AND COMPARATIVE FIGURES
37.1 Actuarial gains and losses in retirement benefit obligations
The Group changed its accounting policy on 1 July 2006 by adopting the option in the amended statement of International Financial Reporting
Standards dealing with Employee Benefits (IAS 19), to recognise all actuarial gains and losses in retirement benefit obligations outside profit and
loss in the period in which they occur.
Previously, actuarial gains and losses arising from experience adjustments and changes in actuarial assumptions in excess of the greater of 10%
of the value of plan assets or 10% of the defined benefit obligation were charged or credited to income over the employees’ expected average
remaining working lives. All actuarial gains and losses are now recognised outside profit or loss in the period they occur and are presented in the
statement of recognised income and expense (SoRIE). This change in policy requires the Group to present the SoRIE as a primary statement in
place of the statement of changes in equity.
This change in accounting policy has been accounted for retrospectively and the comparative financial statements for 30 June 2006 have been
restated. The effect of the change on 30 June 2006 is as follows:
Previously Currently
reported reported Difference
R’000 R’000 R’000
Group
Income statement
Profit before taxation 806 144 806 144 –
Taxation (271 756) (271 756) –
Balance sheet
Retirement benefit assets 9 972 48 795 38 823
Deferred income tax assets 35 061 36 770 1 709
Retirement benefit liabilities (33 344) (12 191) 21 153
Deferred income tax liabilities (101 838) (120 647) (18 809)
Non-distributable and other reserves (146 723) (189 599) (42 876)
37.2 Group and treasury share transactions
The Group changed its accounting policy on 1 July 2006 by early adopting IFRIC Interpretation 11 dealing with Group and Treasury Share
Transactions. The interpretation addresses the issue of share-based payment arrangements that involve two or more entities within the same group
and also provides guidance on how share-based payment arrangements should be accounted for in the financial statements of the subsidiary that
receives services from its employees or goods or services from suppliers other than employees.
The employee portion of the BEE share-based payment (note 21) was allocated to subsidiaries based on the number of units that qualifying
employees receive in terms of The Distell Employee Share Ownership Trust and the non-employee portion was allocated to subsidiaries based on
the relative benefits expected to be received by them.
The implementation of this interpretation had no effect on the consolidated financial statements of the Group.
This change in accounting policy has been accounted for retrospectively and the comparative individual financial statements of Distell Group
Limited for 30 June 2006 have been restated. The effect of the change on 30 June 2006 is as follows:
Previously Currently
reported reported Difference
R’000 R’000 R’000
Company
Income statement
Profit before taxation 797 203 871 321 74 118
Taxation (18 255) (18 255) –
Balance sheet
Retirement benefit assets 1 587 504 1 661 622 74 118
94 Distell Annual Report 2007

95Distell Annual Report 2007
38. BEE TRANSACTION
In October 2005 the Group entered into a broad-based black economic empowerment (BEE) transaction with a consortium that includes
investment group WIPHOLD Distilleries and Wines Investments (Proprietary) Limited, all Distell’s employees and a corporate social investment
trust.
The consortium acquired an effective 15% investment in South African Distilleries and Wines (SA) Limited (SADW), the company in which all of
Distell’s operations are held, for an amount of R869,4 million through WIPHOLD Beverages (Proprietary) Limited (WIP Beverages).
WIP Beverages settled the purchase price by issuing variable rate (consumer price inflation index, for metropolitan areas, excluding interest rates
(CPIX) plus 7%) cumulative redeemable preference shares to Distell Group Limited (Distell Group).
After an initial eight-year term, which can be extended by two years, WIP Beverages has a call option whereby it can exchange its shares in SADW
for shares in Distell Group.
The preference shares do not have voting rights, except in respect of certain resolutions like those affecting the rights of the preference shares,
the disposal of any part of the undertaking or any asset of the company, the encumbrance of any part of the business or variation of ordinary
shareholders’ rights. As a consequence, Distell Group has power to govern certain activities of the company and WIP Beverages is therefore
regarded as a subsidiary of Distell Group.
The cost of this transaction to Distell’s shareholders, calculated by using a option pricing model, equates to R122,3 million or R4,13 per share.
In terms of IFRS 2 Share-based payments the non-employee portion of the BEE transaction is expensed immediately and the employee portion
is spread over a vesting period of eight years. Also see accounting policy note 1.22.
39. DIRECTORS’ EMOLUMENTS
2007 2006
Non- Non-
Executive executive Total Executive executive Total
R’000 R’000 R’000 R’000 R’000 R’000
Salaries and fees 3 621 1 654 5 275 3 253 1 238 4 491
Incentive bonuses 1 718 – 1 718 1 284 – 1 284
Retirement fund contributions 752 – 752 684 – 684
Medical aid contributions 48 – 48 86 – 86
Vehicle benefits 610 – 610 580 – 580
Scheme shares (8) 1 076 – 1 076 795 – 795
Paid by subsidiaries 7 825 1 654 9 479 6 682 1 238 7 920
Retirement
Incentive fund Medical aid Vehicle Scheme 2007 2006
Salaries bonuses contributions contributions benefits shares Total Total
R’000 R’000 R’000 R’000 R’000 R’000 R’000 R’000
Executive
JJ Scannell 1 787 990 371 16 222 727 4 113 3 465
SJ Genade 906 361 188 16 195 220 1 886 1 695
MJ Botha 928 367 193 16 193 129 1 826 1 522
Subtotal 3 621 1 718 752 48 610 1 076 7 825 6 682

Notes to the annual financial statementsfor the years ended 30 June
96 Distell Annual Report 2007
39. DIRECTORS’ EMOLUMENTS (continued)
Retirement
Incentive fund Medical aid Vehicle Scheme 2007 2006
Fees bonuses contributions contributions benefits shares Total Total
R’000 R’000 R’000 R’000 R’000 R’000 R’000 R’000
Non-executive
FC Bayly 90 – – – – – 90 80
PM Bester (1) 112 – – – – – 112 80
PE Beyers 90 – – – – – 90 80
JG Carinus 90 – – – – – 90 80
GJ Gerwel 90 – – – – – 90 80
E de la H Hertzog 90 – – – – – 90 80
R Lumb (2) 127 – – – – – 127
MJ Madungandaba 90 – – – – – 90 80
LM Mojela (3) 112 – – – – – 112 60
GP Mthethwa (4) 130 – – – – – 130 60
DM Nurek (5) 312 – – – – – 312 214
D Prins 57 – – – – – 57 120
PEI Swartz (6) 112 – – – – – 112 100
MH Visser (7) 152 – – – – – 152 124
Subtotal 1 654 – – – – – 1 654 1 238
Total 5 275 1 718 752 48 610 1 076 9 479 7 920
1. Mr PM Bester is a member of the remuneration committee.
2. Mr R Lumb was appointed with effect from 19 October 2006 and is chairman of the audit committee.
3. Ms LM Mojela is a member of the remuneration committee.
4. Ms GP Mthethwa is a member of the audit committee.
5. Mr DM Nurek is chairman of the board, a member of the audit committee and chairman of the remuneration committee.
6. Mr PEI Swartz is a member of the remuneration committee.
7. Mr MH Visser is a member of the audit committee and the remuneration committee.
8. Scheme shares refer to the value of shares accepted after 7 November 2002 which are accounted for in terms of IFRS 2.
.
40. INTEREST OF DIRECTORS IN SHARE CAPITAL AND CONTRACTS
On 30 June 2007 and on 30 June 2006, as well as on the date of this report, the directors of the company held in total less than 1% of the company’s
issued share capital.
Interests of the directors in the number of shares issued
Direct Indirect
Non- Non- 2007 2006
Ordinary shares Beneficial beneficial Beneficial beneficial Total Total
FC Bayly – – 1 949 – 1 949 1 949
MJ Botha 379 791 – – – 379 791 223 984
SJ Genade 336 837 2 992 – – 339 829 222 745
E de la H Hertzog 25 200 – – 21 000 46 200 46 200
R Lumb – – 3 000 – 3 000
DM Nurek – – 15 000 – 15 000 15 000
JJ Scannell 934 171 900 – 1 100 936 171 756 669
PEI Swartz – – 10 000 – 10 000 10 000
1 675 999 3 892 29 949 22 100 1 731 940 1 276 547
The other directors of the company have no interest in the issued capital of the company. There has been no change in these interests since the
financial year-end.
The directors of the company have each certified that they did not have any interest in any contract of significance to the company or any of its
subsidiaries which would have given rise to a related conflict of interest during the year.

97Distell Annual Report 2007
41. DISTELL SHARE SCHEME
In the financial year ended 30 June 2007 an additional 227 233 shares (2006: 62 743) were offered to directors.
Current status
Ordinary shares
Number of Number of Share price Balance
Shares Shares shares paid shares paid on date of of shares
accepted accepted Offer and delivered and delivered payment and Increase in accepted
prior to in the year to price prior to in the year to delivery value* as at
Participant 30 June 2006 30 June 2007 (Rand) 30 June 2006 30 June 2007 (Rand) R’000 30 June 2007
Executive
JJ Scannell 589 823 7,35 589 823 –
JJ Scannell 537 605 14,60 179 202 179 202 52,00 6 702 179 201
JJ Scannell 59 494 31,00 59 494
JJ Scannell 129 515 40,00 129 515
SJ Genade 275 995 7,35 183 996 91 999 41,00 3 096 –
SJ Genade 210 254 14,60 70 085 70 085 52,00 2 621 70 084
SJ Genade 48 506 40,00 48 506
MJ Botha 261 962 7,35 174 642 87 320 41,00 2 938 –
MJ Botha 205 461 14,60 68 487 68 487 52,00 2 561 68 487
MJ Botha 3 249 31,00 3 249
MJ Botha 49 212 40,00 49 212
Total 2 143 843 227 233 1 266 235 497 093 17 918 607 748
* Refers to the increase in value of the scheme shares of the indicated participants from the offer date to the date of payment and delivery during the current financial year.
The scheme is a deferred purchase scheme (see note 11).

Notes to the annual financial statementsfor the years ended 30 June
42. RELATED-PARTY TRANSACTIONS
Distell Group Limited is controlled by Remgro-KWV Investments Limited which owns 59% of the
company’s shares.
Related-party relationships exist between the Group, associates, joint ventures and the shareholders of the
company.
The following transactions were carried out with related parties:
Purchases of goods and services
KWV Group Limited (inventory used in production) 85 067 132 814
M&I Group Services Limited (management services) 6 081 5 698
M&I Group Services Limited (interest on loans) 1 412 6 097
92 560 144 609
Year-end balances arising from purchases of goods and services
KWV Group Limited (including VAT) 4 914 5 739
M&I Group Services Limited (including VAT) 1 401 1 067
M&I Group Services Limited (call accounts) – 75 000
6 315 81 806
The Group has access to loan funds from M&I Group Services Limited. A limited amount can be borrowed
at a market-related rate and is repayable on demand. The amount is included in current interest-bearing
liabilities.
Key management compensation
Directors of Distell Limited, the main operating company in the Group 19 486 16 911
Information regarding directors’ remuneration appears in note 39.
98 Distell Annual Report 2007
2007 2006
R’000 R’000

Annexure 1interest in subsidiaries
The total profits/(losses) after taxation of consolidated subsidiaries for the year are as follows:
Profits 848 604 527 940
Losses (19 588) (4 673)
Net consolidated profit after taxation 829 016 523 267
The company’s direct interests in its subsidiaries are as follows:
South African Distilleries and Wines (SA) Limited (85%) – Unlisted 810 630 792 211
Long-term loan – interest-free and repayable on demand 729 634 718 092
Share-based payment contribution (note 37.2) 80 995 74 118
Shares 1 1
WIPHOLD Beverages (Proprietary) Limited
Variable rate cumulative redeemable preference shares (note 38) 869 411 869 411
Investments in subsidiaries 1 680 041 1 661 622
The company’s indirect interest in subsidiaries through South African Distilleries and Wines (SA) Limited
is as follows:
ISSUED SHARE CAPITAL
Manufacturers and distributors Interest % R
Distell Limited 100 1 000
Distell Namibia Limited (Namibia) 100 4 000
Distillers Corporation International Limited (Mauritius) 100 12
Distillers Corporation (Botswana) (Proprietary) Limited (Botswana) 100 3
House of J.C. Le Roux Limited 100 100
Devon Road Property Limited 100 100
Durbanville Hills Wines (Proprietary) Limited 64 861 700
Ecowash (Proprietary) Limited 100 100
Expo Liquor Limited 100 4 066 625
Nederburg Wines (Proprietary) Limited 100 218 870
Nederburg Wine Farms Limited 100 200
Namibia Wines & Spirits Limited (Namibia) 100 100 000
SFW Holdings Limited 100 200
SFW Financing Company Limited 100 70 000
Stellenbosch Farmers’ Winery Limited 100 7
Swaziland Liquor Distributors Limited (Swaziland) 100 390 401
Other
Henry C. Collison & Sons Limited (United Kingdom) 100 82 792
Notes:
1. Information is only disclosed in respect of those subsidiaries of which the financial position or results are significant.
2. All subsidiaries are incorporated in South Africa, unless otherwise stated.
3. Cumulative arrear dividends relating to the preference shares in WIPHOLD Beverages on 30 June 2007 amounted
to R115,0 million (2006: R51,2 million). The preference shares have a dividend rate of CPIX plus 7%.
99Distell Annual Report 2007
2007 2006
R’000 R’000

Annexure 2interest in unlisted associates
2007 2006
R’000 R’000
The Group’s interest in associates is as follows:
Tanzania Distilleries Limited (Tanzania) (35%) 14 959 15 146
Cost price 27 427 27 427
Goodwill written off (14 075) (14 075)
Equity-accounted retained earnings 1 607 1 794
Grays Inc Limited (Mauritius) (26%) 8 025 –
Cost price 6 949 –
Equity-accounted retained earnings 1 076 –
Papkuilsfontein Vineyards (Proprietary) Limited (49%) 286 237
Cost price – –
Equity-accounted retained earnings 286 237
Investments in associates 23 270 15 383
Share in net assets of associates 14 194 8 805
Goodwill 9 076 6 578
23 270 15 383
The aggregate balance sheets of associates are summarised as follows:
Property, plant and equipment 28 795 22 251
Financial and intangible assets 10 134 –
Current assets 111 512 28 910
Total assets 150 441 51 161
Interest-free liabilities 67 476 27 840
Interest-bearing liabilities 29 348 13 729
Total liabilities 96 824 41 569
Equity 53 617 9 592
Minority interest (39 423) (787)
Group’s share in equity 14 194 8 805
Loans to associates 4 722 –
Group’s share in net assets of associates 18 916 8 805
Tanzania Distilleries Limited (35%) 8 381 8 568
Grays Inc Limited (26%) 5 527 –
Papkuilsfontein Vineyards (Proprietary) Limited (49%) 286 237
14 194 8 805
The Group’s interest in the revenue and profit of the associates is as follows:
Revenue 121 003 52 402
Profit for the year 14 255 9 856
Notes:
1. All associates are incorporated in South Africa, unless otherwise stated.
2. The interest in Grays Inc Limited was acquired on 1 January 2006.
3. The statutory year-ends of Tanzania Distilleries Limited and Grays Inc Limited are different to those of the rest of the Group. The unaudited results of these companies to
30 June 2006 and 30 June 2007, subsequent to their respective year-ends, have been included based on information prepared by management where applicable.
100 Distell Annual Report 2007

Annexure 3interest in joint ventures
The Group’s interest in the joint ventures is as follows:
Total equity
Afdis Holdings (Private) Limited (Zimbabwe) (50%) 1 128 8 452
Tonnellerie Radoux (SA) (Proprietary) Limited (50%) 7 980 7 315
Mirma Products (Proprietary) Limited (45%) 1 470 904
Lusan Holdings (Proprietary) Limited (50%) 27 855 15 652
Lomond Wines Estates (Proprietary) Limited (50%) (966) –
Interim Sahara LLP (United Kingdom) (50%) 14 309 –
Proportional interest in joint ventures 51 776 32 323
The Group’s interest in the assets and liabilities of the joint ventures is as follows:
Property, plant and equipment 161 864 162 956
Intangible assets 14 303 –
Current assets 67 954 56 010
Total assets 244 121 218 966
Non-current liabilities 187 266 180 153
Current liabilities 5 079 6 490
Total liabilities 192 345 186 643
Net assets 51 776 32 323
Net interest consolidated 51 776 32 323
The Group’s interest in the income and expenditure of the joint ventures is as follows:
Revenue 47 194 52 600
Profit before taxation 18 572 4 037
Profit for the year 12 913 5 820
The Group’s interest in the cash flow statements of the joint ventures is as follows:
Cash retained from operating activities 2 569 10 141
Cash inflow from investment activities 1 593 (5 217)
Net cash flow 4 162 4 924
Notes:
All joint ventures are incorporated in South Africa, unless otherwise stated.
2007 2006
R’000 R’000
101Distell Annual Report 2007

Notice to shareholders
Notice is hereby given that the next annual general meeting of the company
will be held at 12:00 on Wednesday, 17 October 2007, at the Visitors’ Centre
of Van Ryn’s Brandy Distillery, Van Ryn Road, off Baden Powell Drive
(R310), Vlottenburg, Western Cape, to pass the following resolutions with
or without modification:
1. APPROVAL OF ANNUAL FINANCIAL STATEMENTS
Ordinary resolution number 1
Resolved that the audited annual financial statements for the year
ended 30 June 2007, be accepted and approved.
2. APPROVAL OF DIRECTORS’ REMUNERATION
Ordinary resolution number 2
Resolved that the remuneration of the non-executive directors for
the financial year ended 30 June 2007, be approved.
3. ELECTION OF DIRECTOR
Ordinary resolution number 3
Resolved that Mr PE Beyers, who retires in accordance with the
company’s articles of association and who has offered himself for
re-election, be hereby re-elected as a director of the company.
4. ELECTION OF DIRECTOR
Ordinary resolution number 4
Resolved that Dr E de la H Hertzog, who retires in accordance with
the company’s articles of association and who has offered himself
for re-election, be hereby re-elected as a director of the company.
5. ELECTION OF DIRECTOR
Ordinary resolution number 5
Resolved that Mr RL Lumb, who retires in accordance with the
company’s articles of association and who has offered himself for
re-election, be hereby re-elected as a director of the company.
6. ELECTION OF DIRECTOR
Ordinary resolution number 6
Resolved that Mr MJ Madungandaba, who retires in accordance
with the company’s articles of association and who has offered
himself for re-election, be hereby re-elected as a director of the
company.
7. ELECTION OF DIRECTOR
Ordinary resolution number 7
Resolved that Mr MH Visser, who retires in accordance with the
company’s articles of association and who has offered himself for
re-election, be hereby re-elected as a director of the company.
Biographical details of all the directors standing for re-election can
be found on page 12.
8. AUTHORITY TO PLACE UNISUED SHARES UNDER THE
CONTROL OF THE DIRECTORS
Ordinary resolution number 8
Resolved that 10% (ten per centum) of the authorised but unissued
shares in the company be hereby placed under the control of the
directors as a general authority in terms of section 221(2) of the
Companies Act (Act 61 of 1973), as amended (the Act), who are
hereby authorised to allot and issue shares in the company upon
such terms and conditions as the directors in their sole discretion
deem fit, subject to the provisions of the Act, the company’s articles
of association and the Listings Requirements of the JSE Limited
( JSE), when applicable.
And to transact any other business that may be transacted at an annual
general meeting.
VOTING AND PROXIES
Members who have not dematerialised their shares or who have
dematerialised their shares with “own name” registration are entitled to
attend and vote at the meeting and are entitled to appoint a proxy or proxies
to attend, speak and vote in their stead. The person so appointed need not
be a member of the company. Proxy forms must be forwarded to reach
the company’s transfer secretaries, Computershare Investor Services 2004
(Proprietary) Limited, Ground Floor, 70 Marshall Street, Johannesburg, or
posted to the transfer secretaries at PO Box 61051, Marshalltown 2107, by
12:00 (South African time) on Monday, 15 October 2007.
Proxy forms must only be completed by members who have not
dematerialised their shares or who have dematerialised their shares with
“own name” registration.
On show of hands, every member of the company present in person or
represented by proxy shall have one vote only. On poll, every member of
the company shall have one vote for every share held in the company by
such member.
Members who have dematerialised their shares, other than those members
who have dematerialised their shares with “own name” registration, must
contact their CSDP or broker in the manner and time stipulated in their
agreement:
• to furnish them with their voting instructions; and
• in the event that they wish to attend the meeting, to obtain the necessary
authority to do so with a letter of representation in terms of the custody
agreement. Such letter of representation must be lodged with the
company’s transfer secretaries, Computershare Investor Services 2004
(Proprietary) Limited, Ground Floor, 70 Marshall Street, Johannesburg, or
posted to the transfer secretaries at PO Box 61051, Marshalltown 2107, by
12:00 (South African time) on Monday, 15 October 2007.
By order of the board of directors.
CJ Cronjé
Company secretary
Stellenbosch
22 August 2007
102 Distell Annual Report 2007

Form of proxyTHIS FORM OF PROXY IS ONLY FOR USE BY:
1. REGISTERED MEMBERS WHO HAVE NOT YET DEMATERIALISED THEIR DISTELL GROUP LIMITED ORDINARY SHARES; AND
2. REGISTERED MEMBERS WHO HAVE ALREADY DEMATERIALISED THEIR DISTELL GROUP LIMITED ORDINARY SHARES AND ARE REGIS-
TERED IN THEIR OWN NAMES IN THE COMPANY’S SUBREGISTER.*
* See explanatory note 3 overleaf.
For completion by the aforesaid registered members who hold ordinary shares of the company (“member”) and who are unable to attend the 2007 annual
general meeting of the company to be held at 12:00 on Wednesday, 17 October 2007, at the Visitors’ Centre of Van Ryn’s Brandy Distillery, Van Ryn Road,
off Baden Powell Drive (R310), Vlottenburg, Western Cape (“the annual general meeting”).
I/We ___________________________________________________________________________________________________________________
of (address) ______________________________________________________________________________________________________________
being the holder/s of ____________________________________________________________ ordinary shares in the company, hereby appoint (see
instruction 1 overleaf)
1. ________________________________________________________________________________________________________or failing him/her,
2. ________________________________________________________________________________________________________or failing him/her,
3. the chairperson of the annual general meeting, as my/our proxy to attend, speak and vote for me/us and on my/our behalf or to abstain from voting at
the annual general meeting of the company and at any adjournment thereof, as follows (see note 2 and instruction 2 overleaf):
Insert an “X” or the number of votes
exercisable (one vote per ordinary share)
In favour of Against Abstain
Ordinary resolution 1: Approval of annual financial statements
Ordinary resolution 2: Approval of directors’ remuneration
Ordinary resolution 3: Election of director – Mr PE Beyers
Ordinary resolution 4: Election of director – Dr E de la H Hertzog
Ordinary resolution 5: Election of director – Mr RL Lumb
Ordinary resolution 6: Election of director – Mr MJ Madungandaba
Ordinary resolution 7: Election of director – Mr MH Visser
Ordinary resolution 8: Authority to place unissued shares under the
control of the directors
Signed at ___________________________________________________ on __________________________________________________ 2007
Signature/s ______________________________________________________________________________________________________________
Assisted by me ___________________________________________________________________________________________________________
(where applicable)
Please read the notes and instructions overleaf.
Distell Group Limited
(Incorporated in the Republic of South Africa)
(Registration number 1988/005808/06)
( JSE share code: DST ISIN: ZAE000028668)
(“the company”)
Distell Annual Report 2007

Form of proxy
Notes:
1. A member entitled to attend and vote at the annual general meeting is entitled to appoint one or more proxies to attend, speak and vote in his/her
stead. A proxy need not be a registered member of the company.
2. Every member present in person or by proxy and entitled to vote at the annual general meeting of the company shall, on a show of hands, have one
vote only, irrespective of the number of shares such member holds. In the event of a poll, every member shall be entitled to that proportion of the
total votes in the company which the aggregate amount of the nominal value of the shares held by such member bears to the aggregate amount of the
nominal value of all the shares issued by the company.
3. Members registered in their own names are members who elected not to participate in the Issuer-Sponsored Nominee Programme and who
appointed Computershare as their Central Securities Depository Participant (CSDP) with the express instruction that their uncertificated shares are
to be registered in the electronic subregister of members in their own names.
Instructions on signing and lodging the form of proxy:
1. A member may insert the name of a proxy or the names of two alternative proxies of the member’s choice in the space/s provided overleaf, with or
without deleting “the chairperson of the annual general meeting”, but any such deletion must be initialled by the member. Should this space be left
blank, the proxy will be exercised by the chairperson of the annual general meeting. The person whose name appears first on the form of proxy and
who is present at the annual general meeting will be entitled to act as proxy to the exclusion of those whose names follow.
2. A member’s voting instructions to the proxy must be indicated by the insertion of an “X”, or the number of votes exercisable by that member, in the
appropriate spaces provided overleaf. Failure to do so will be deemed to authorise the proxy to vote or to abstain from voting at the annual general
meeting, as he/she thinks fit in respect of all the member’s exercisable votes. A member or his/her proxy is not obliged to use all the votes exercisable
by him/her or by his/her proxy, but the total number of votes cast, or those in respect of which abstention is recorded, may not exceed the total
number of votes exercisable by the member or by his/her proxy.
3. A minor must be assisted by his/her parent or guardian unless the relevant documents establishing his/her legal capacity are produced or have been
registered by the transfer secretaries.
4. To be valid, the completed forms of proxy must be lodged with the transfer secretaries of the company, Computershare Investor Services 2004
(Proprietary) Limited at Ground Floor, 70 Marshall Street, Johannesburg, South Africa, or posted to the transfer secretaries at PO Box 61051,
Marshalltown 2107, South Africa, to be received by them not later than Monday, 15 October 2007, at 12:00 (South African time).
5. Documentary evidence establishing the authority of a person signing this form of proxy in a representative capacity must be attached to this form of
proxy unless previously recorded by the transfer secretaries or waived by the chairperson of the annual general meeting.
6. The completion and lodging of this form of proxy will not preclude the relevant member from attending the annual general meeting and speaking and
voting in person thereat to the exclusion of any proxy appointed in terms hereof, should such member wish to do so.
7. The completion of any blank spaces overleaf need not be initialled. Any alterations or corrections to this form of proxy must be initialled by the
signatory/ies.
8. The chairperson of the annual general meeting may accept any form of proxy which is completed other than in accordance with these instructions
provided that he is satisfied as to the manner in which a member wishes to vote.
Distell Annual Report 2007
Distell Annual Report 2007Distell Annual Report 2007
Dates of importance to shareholders
Annual general meeting October 2007
Financial reports Interim report February 2008
Preliminary announcement of annual results August 2008
Annual financial statements September 2008
Ordinary dividends Interim dividends
– declaration February 2008
– payable March 2008
Final dividends
– declaration August 2008
– payable September 2008
Administration
Distell Group Limited Incorporated in the Republic of South Africa
(Registration number: 1988/005808/06)
ISIN: ZAE000028668
JSE share code: DST
Company secretary CJ Cronjé
Registered office Aan-de-Wagen Road, Stellenbosch 7600
PO Box 184, Stellenbosch 7599
Telephone: 021 809 7000
Facsimile: 021 886 4611
E-mail: [email protected]
Transfer secretaries Computershare Investor Services 2004 (Proprietary) Limited
70 Marshall Street, Johannesburg 2001
PO Box 61051, Marshalltown 2107
Telephone: 011 370 7700
Facsimile: 011 688 5221
Auditors PricewaterhouseCoopers Inc.
Stellenbosch
Listing JSE Limited
Sector: Consumer Goods – Food and Beverage – Beverages
Sponsor Rand Merchant Bank (A division of FirstRand Bank Limited)
Websitewww.distell.co.za
COMPRESS ) 3460
CONTENTS
Features
Our Group 3
Annual highlights 4
How we’ve measured up 5
Our brands at a glance 8
Our global presence 10
Board matters 12
Seven-year fi nancial review 15
Analysis of shareholders 18
Cash value added statement 19
Reviews
Chairman’s statement 20
Managing director’s report 24
Corporate
Corporate governance 32
Sustainability report 37
Financials
Consolidated annual fi nancial statements 52
Notice to shareholders, voting form,
dates of importance and administration 102
DISTELLANNUAL REPORT
2007

www.distell.co.za
annual report
2007
Distell A
nn
ual R
epo
rt 2007
Recommended