Utility Consumer Complaints 2006 Annual Report

2 Table of Contents
Page
1. Title Page
2. Table of Contents
3. Table of Contents
4. Complaint Percentages by Company
5. Type and Number of Complaints by District 2006
6. Year 2006 Consumer Complaints by Utility
7. 2006 Complaints by PSC District
8. Calls to PSC Toll-free complaints number and level of monthly utility consumer com-plaints 2004 -2005 -2006
9. Number of Calls (comparing 2005 and 2006)
10. Number of Complaints (comparing 2005 and 2006)
11. PSC Complaints from 2002 – 2006 by service type
12. Year 2006 PSC Consumer Complaints by Complaint Category Incumbent Local Exchange Carriers 13. Qwest Corporation 2006 Complaints 14. CenturyTel of Montana 2006 Complaints 15. Other Incumbent Local Exchange Carriers (ILECs) 2006 Complaints Competitive Local Exchange Carriers 16. McLeodUSA 2006 Complaints 17. Bresnan 2006 Complaints 18. Other Competitive Local Exchange Carriers (CLECs) 2006 Complaints Interexchange Carriers 19. AT&T 2006 Complaints 20. Qwest Long Distance Corporation 2006 Complaints 21. MCI 2006 Complaints 22. Sprint 2006 Complaints 23. Buzz Telecom 2006 Complaints 24. Other Interexchange Carriers (IXCs) 2006 Complaints ——————————————————————————————— 25. Operator Services Providers & Inmate Calling Providers 2006 Complaints 26. Non-Telco, Telco-Billed 2006 Complaints 27. NorthWestern Energy 2006 Complaints 28. Montana-Dakota Utilities 2006 Complaints 29. Energy West 2006 Complaints 30. Water Utilities 2006 Complaints

3 Table of Contents (Cont.)
Page
31. PSC Complaints from 1994—2006 by service type
32. Analysis of Annual Data
33. Analysis of Annual Data
34. Analysis of Annual Data
35. Telecommunications Complaints from 1994—2006
36. Incoming 800 Calls 1997—2006
37. Energy Complaints 1994—2006

4
Complaint Percentages by Company
Qwest – 17.87% .06% (percentage of complaints compared to total MT access lines)
CenturyTel - 6.71%
Other ILECs - .59%
McLeodUSA - .69%
Bresnan—.30%
Other CLECs - 1.28%
Water Utilities - .69%
MDU - 16.88% .21% (percentage of complaints compared to total MT customers)
Energy West - 1.09% .04% (percentage of complaints compared to total MT customers)
NorthWestern - 33.17% .09% (percentage of complaints compared to total MT customers)
ICP - .10%
AT&T - 3.36%
Qwest LD - .49%
MCI—2.67%
Sprint—.49%
Buzz Telecom—5.53%
Other IXCs - 4.74%%
OSP - 1.38%
Globalyp.net—.69%
Other Non-Telco - 1.28%
—————————————-
Total - 100%
Complaints by Service Type Percentage of Total
Energy—518 51.14%
Telecommunications—488 48.17
Water/Sewer—7 .69
—————————————— ——————
Total—1,013 100.00%
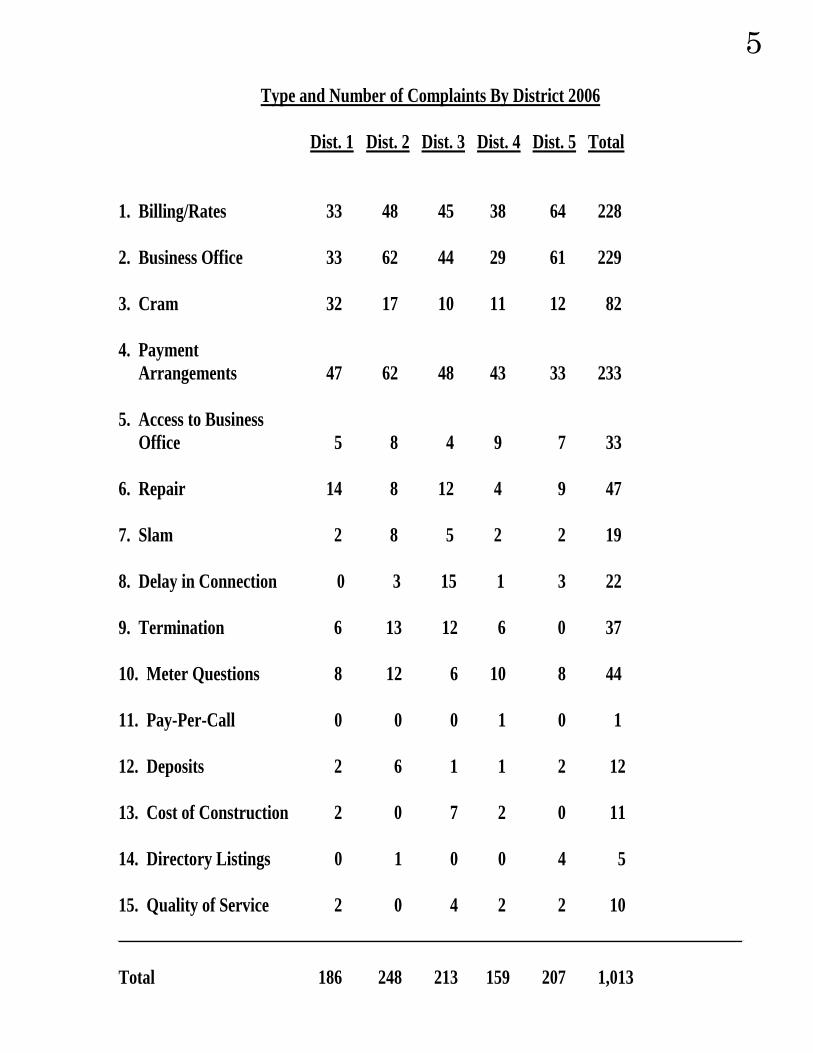
5
Type and Number of Complaints By District 2006 Dist. 1 Dist. 2 Dist. 3 Dist. 4 Dist. 5 Total
1. Billing/Rates 33 48 45 38 64 228 2. Business Office 33 62 44 29 61 229 3. Cram 32 17 10 11 12 82 4. Payment Arrangements 47 62 48 43 33 233 5. Access to Business Office 5 8 4 9 7 33 6. Repair 14 8 12 4 9 47 7. Slam 2 8 5 2 2 19 8. Delay in Connection 0 3 15 1 3 22 9. Termination 6 13 12 6 0 37 10. Meter Questions 8 12 6 10 8 44 11. Pay-Per-Call 0 0 0 1 0 1 12. Deposits 2 6 1 1 2 12 13. Cost of Construction 2 0 7 2 0 11 14. Directory Listings 0 1 0 0 4 5 15. Quality of Service 2 0 4 2 2 10 Total 186 248 213 159 207 1,013

6
AT&T, 34
CenturyTel, 68
Other ILECs, 6
Globalyp.net, 7
Other Non-Telco, 13
OSP, 14
ICP, 1
Qwest LD, 5
Qwest, 181
Bresnan, 3
McLeod, 7
Energy West, 11 MCI, 27
Sprint, 5
Buzz Telecom, 56
Other IXCs, 48
Other CLECs, 13
Water/Sewer, 7
MDU, 171
NWE, 336
ICP - Inmate Calling ProvidersOSP - Operator Service Providers
Year 2006 Consumer Complaints By Utility - Total # Informal Complaints - 1,013
7
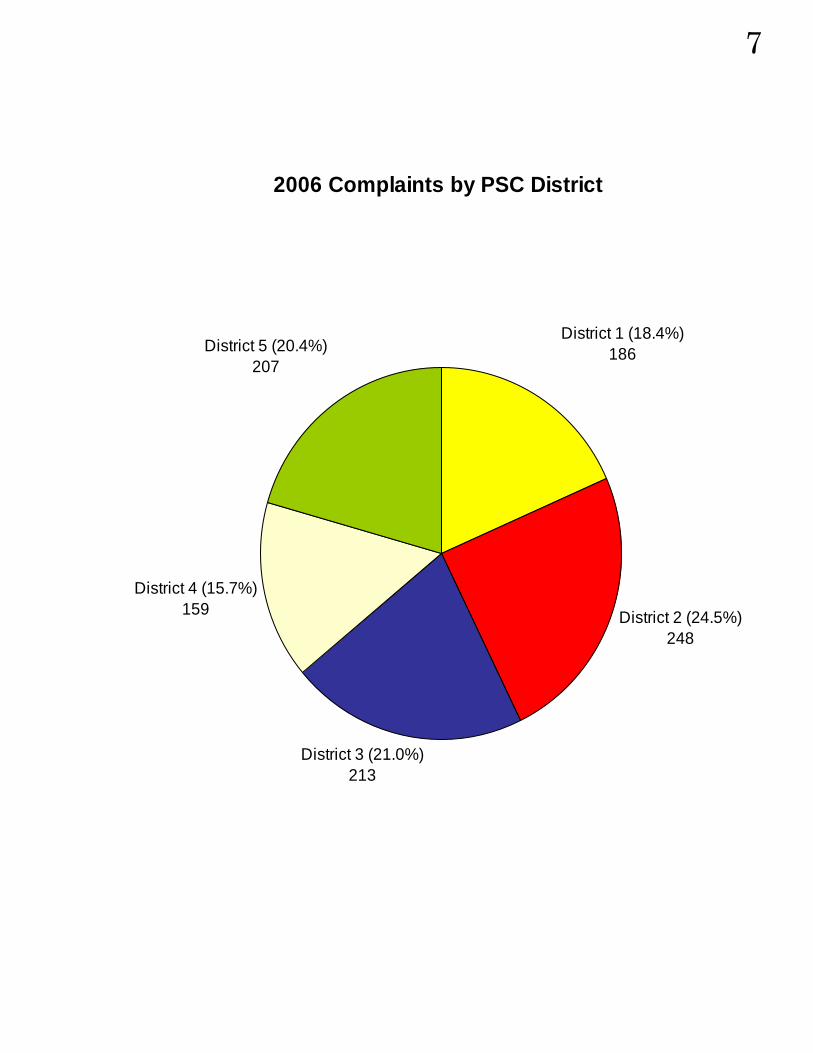
2006 Complaints by PSC District
District 4 (15.7%)159
District 3 (21.0%)213
District 2 (24.5%)248
District 1 (18.4%)186District 5 (20.4%)
207

8
Calls to PSC toll-free complaints number and level of
monthly utility consumer complaints2004-2005-2006
0
200
400
600
800
1,000
1,200
1,400
1,600
1,800
Jan.
-04
Mar
ch
May
July
Sept
embe
rN
ovem
ber
Jan.
- '0
5M
arch
May
July
Sept
embe
rN
ovem
ber
Jan.
- '0
6M
arch
May
July
Sept
embe
rN
ovem
ber
Num
ber o
f cal
ls
0
20
40
60
80
100
120
140
160
180
200
Num
ber o
f com
plai
nts*
*A consumer call or letter is not logged as a complaint unless PSC staff must contact the utility in order to resolve it.
Calls Complaints

9
Number of Calls (comparing 2005 and 2006)
2005 2006 %of Change
January 1,116 1,097 (1.70%) February 1,021 1,008 (1.27%) March 1,045 915 (12.44%) April 1,174 911 (22.40%) May 896 847 (5.47%) June 909 851 (6.38%) July 925 714 (22.81%) August 866 716 (17.32%) September 757 638 (15.72%) October 897 945 5.35% November 752 653 (13.16%) December 952 575 (39.60%) -------- ------- Total 11,310 9,870 (12.73%)

10
Number of Complaints (comparing 2005 and 2006)
2005 2006 %age of Change
January 134 104 (22.4%) February 107 93 (13.1%)March 118 106 (10.2%) April 132 103 (22.0%) May 105 96 (8.6%) June 110 91 (17.3%) July 86 65 (24.4%) August 93 91 (2.2%) September 90 93 3.3% October 107 96 (10.3%) November 73 35 (52.1%) December 72 40 (44.4%) ------ ----- Total 1,227 1,013 (17.4%)
11
0
500
1000
1500
2000
2500
3000
2002 2003 2004 2005 2006
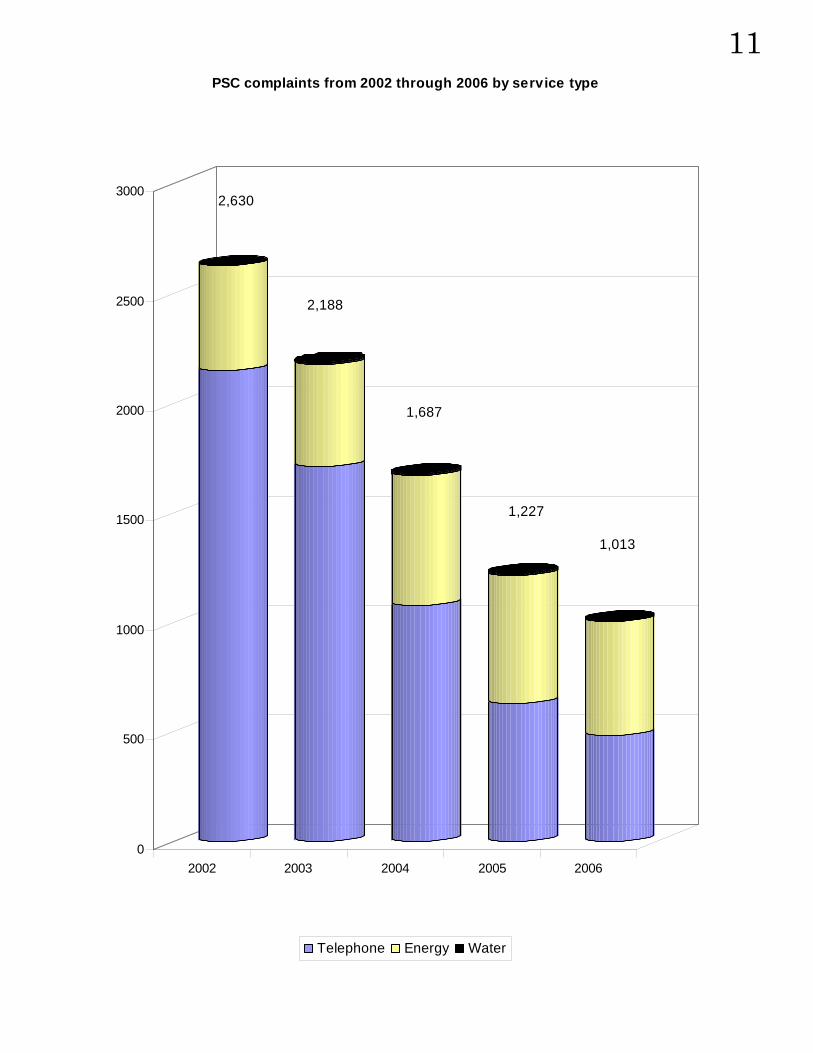
PSC complaints from 2002 through 2006 by service type
Telephone Energy Water
1,687
2,188
2,630
1,227
1,013
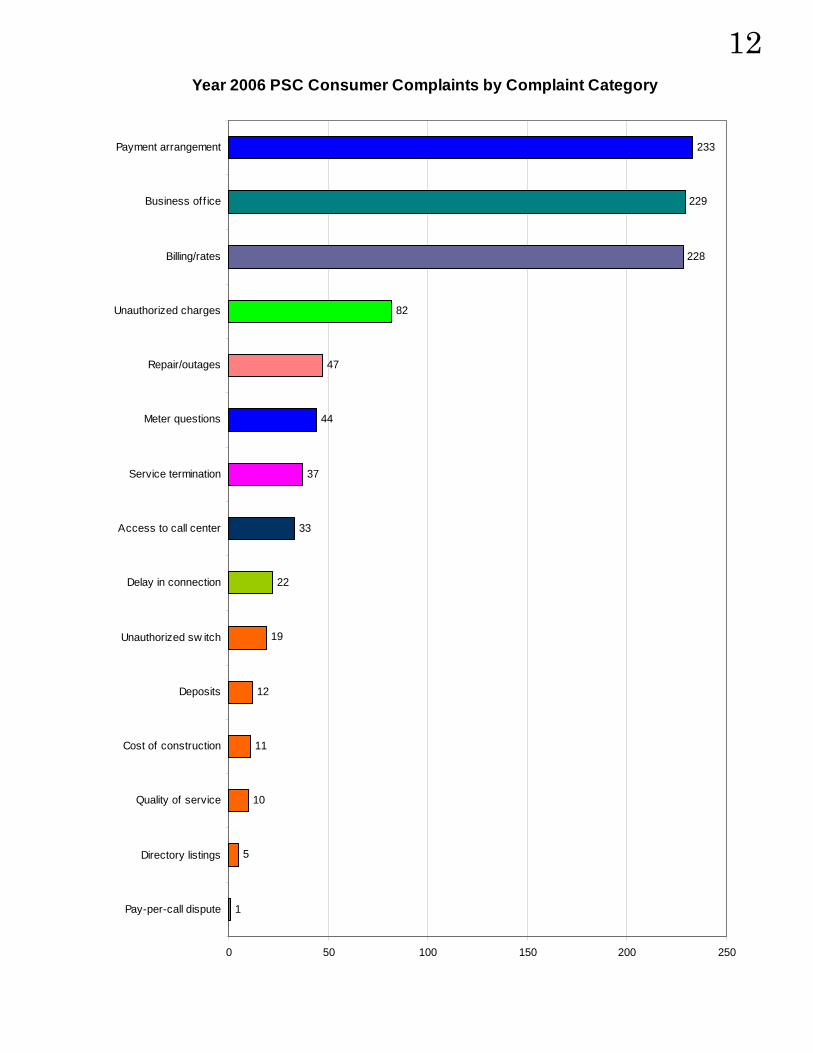
12 Year 2006 PSC Consumer Complaints by Complaint Category
1
5
10
11
12
19
22
33
37
44
47
82
228
229
233
0 50 100 150 200 250
Pay-per-call dispute
Directory listings
Quality of service
Cost of construction
Deposits
Unauthorized sw itch
Delay in connection
Access to call center
Service termination
Meter questions
Repair/outages
Unauthorized charges
Billing/rates
Business off ice
Payment arrangement

13
Qwest Corporation 2006 Complaints
181 Total
1
1
1
1
2
2
2
4
8
9
23
57
70
0 10 20 30 40 50 60 70 80
Unauthorized sw itch
Deposits
Unauthorized charges
Cost of construction
Service termination
Payment arrangement
Directory listings
Quality of service
Access to call center
Delay in connection
Repair/outages
Billing/rates
Business off ice
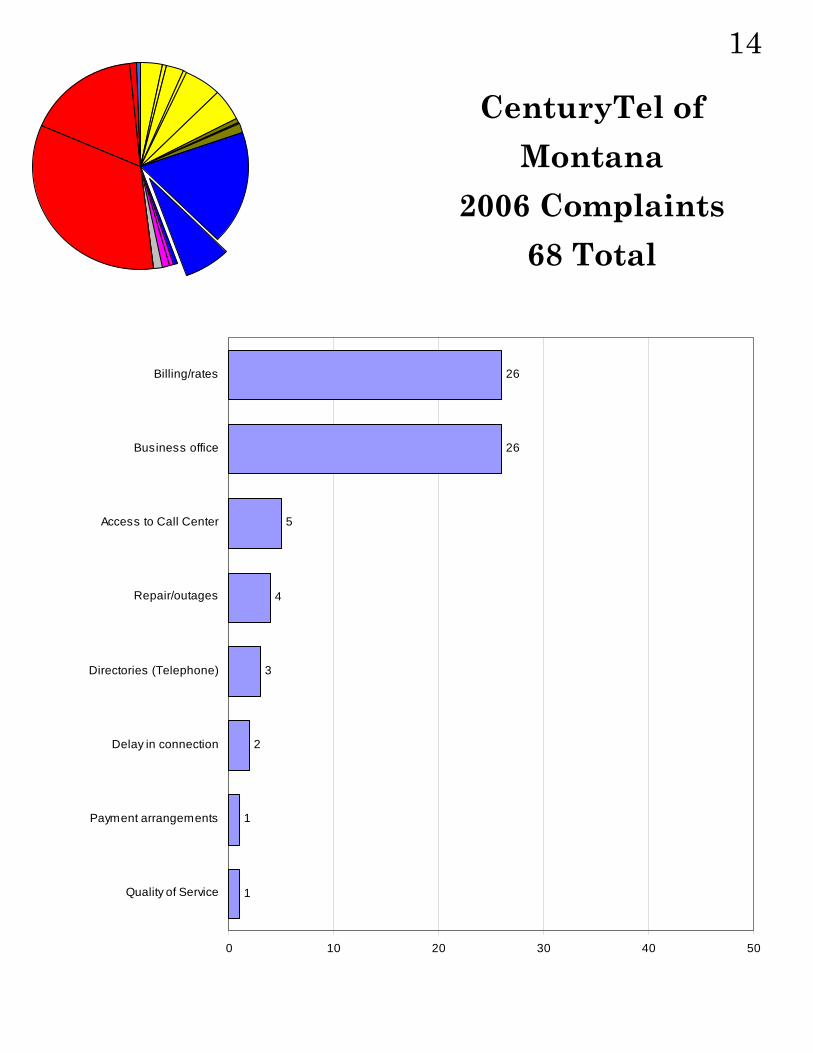
14
CenturyTel of Montana
2006 Complaints 68 Total
1
1
2
3
4
5
26
26
0 10 20 30 40 50
Quality of Service
Payment arrangements
Delay in connection
Directories (Telephone)
Repair/outages
Access to Call Center
Business office
Billing/rates

15 Other Incumbent
Local Exchange Carriers
(ILECs) 2006 Complaints
6 Total
1
1
1
3
0 25 50 75 100
Ronan
Frontier Communications
Triangle Tel. Coop.
Project Tel
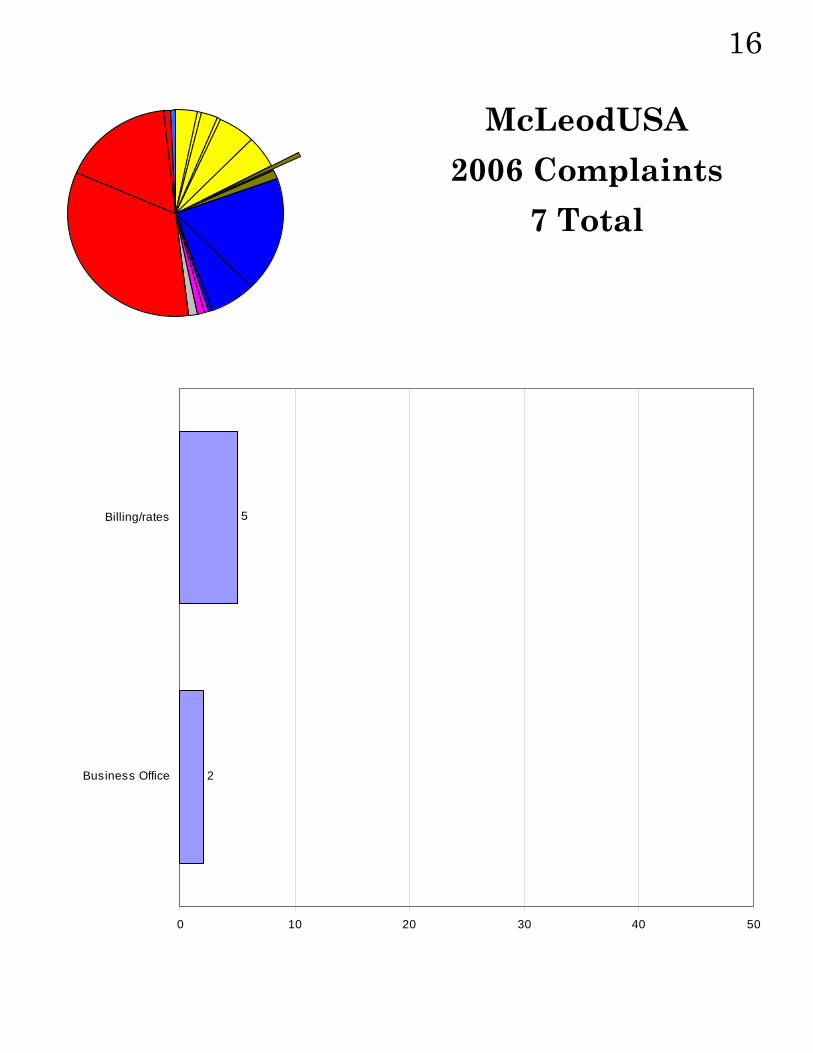
16
McLeodUSA 2006 Complaints
7 Total
2
5
0 10 20 30 40 50
Business Office
Billing/rates
17
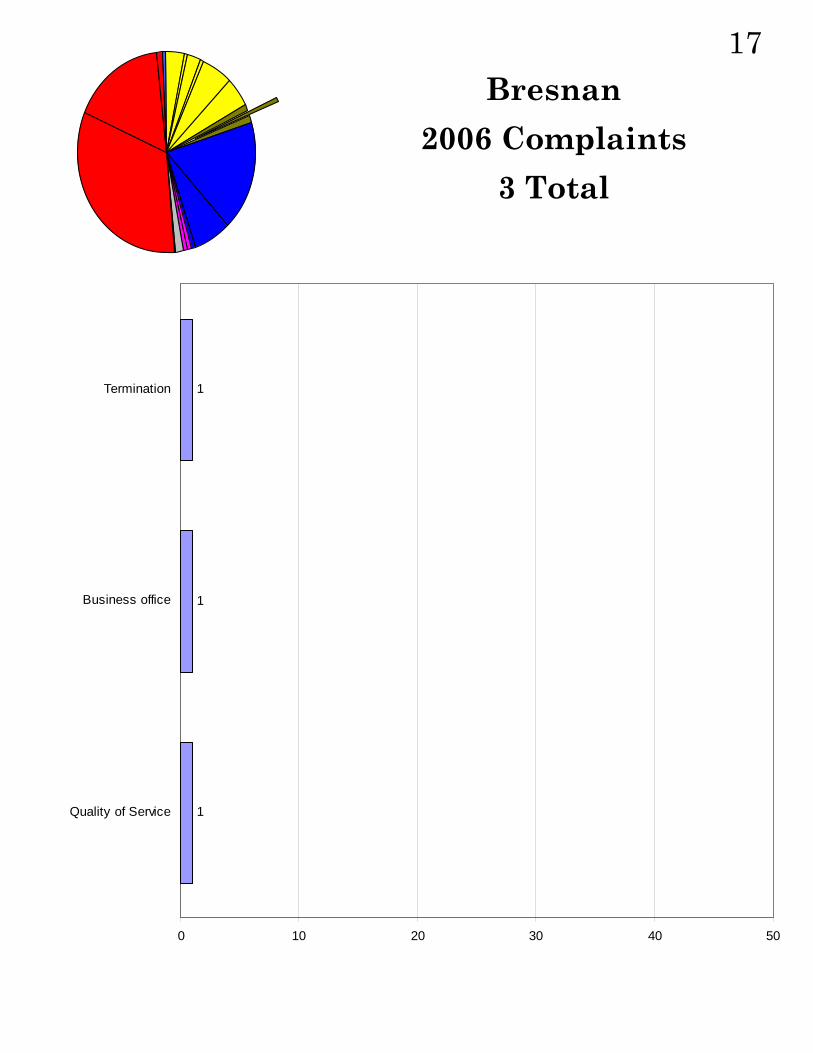
1
1
1
0 10 20 30 40 50
Quality of Service
Business office
Termination
Bresnan 2006 Complaints
3 Total

18 Other Competitive
Local Exchange Carriers (CLECs) 2006 Complaints
13 Total
1
1
1
1
1
2
2
2
2
0 10 20 30 40 50
VarTec
Blackfoot
Grizzly Telephone
Level 3 Communications
Tele-Info
OneEighty Comm
AT&T
MCI WorldCom
New Access

19
AT&T 2006 Complaints
38 Total
1
3
4
12
18
0 25 50 75 100 125
Unauthorized charges
Unauthorized switch
Business office
Access to call center
Billing/rates
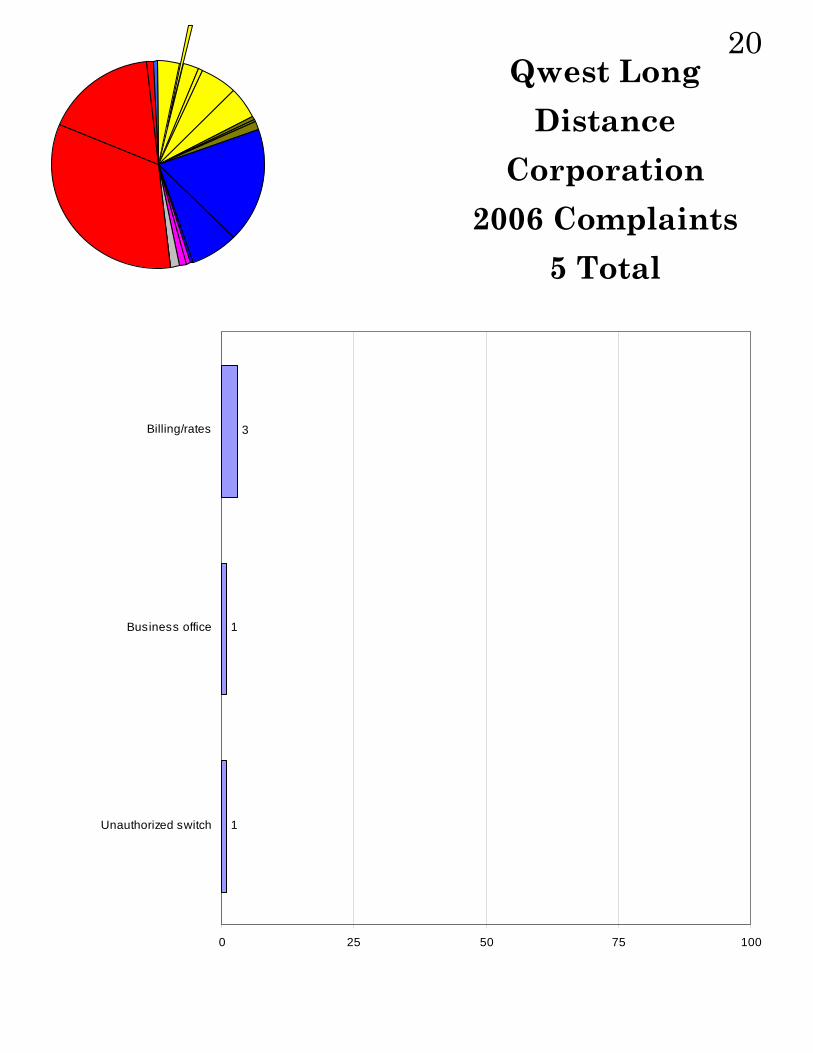
20 Qwest Long
Distance Corporation
2006 Complaints 5 Total
1
1
3
0 25 50 75 100
Unauthorized switch
Business office
Billing/rates
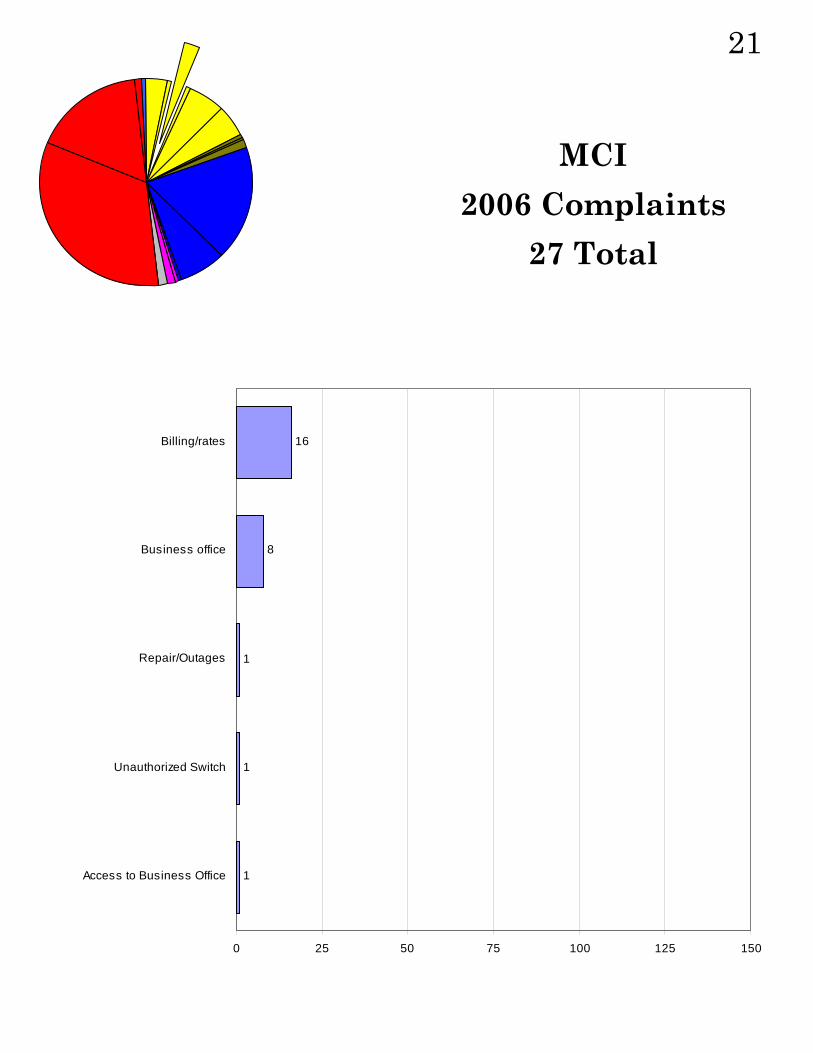
21
MCI 2006 Complaints
27 Total
1
1
1
8
16
0 25 50 75 100 125 150
Access to Business Office
Unauthorized Switch
Repair/Outages
Business office
Billing/rates
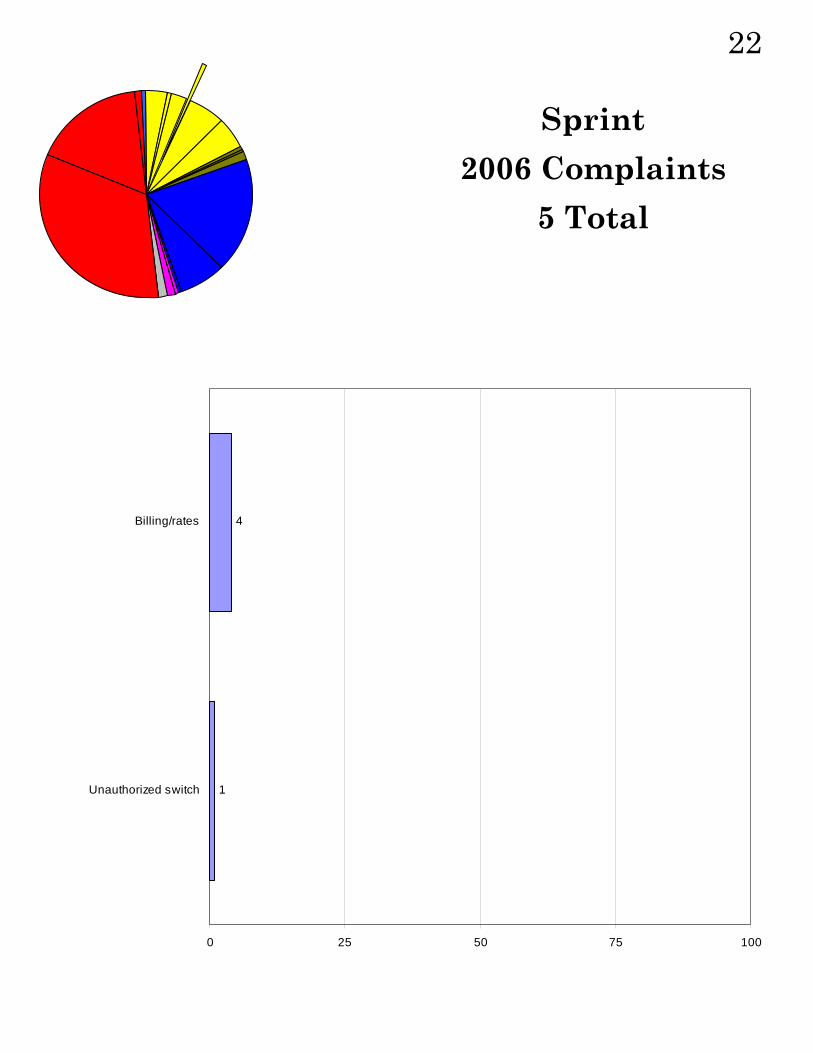
22
Sprint 2006 Complaints
5 Total
1
4
0 25 50 75 100
Unauthorized switch
Billing/rates

23
Buzz Telecom 2006 Complaints
56 Total
1
1
54
0 25 50 75 100
Unauthorized switch
Business office
Unauthorized charges

24 Other Interexchange
Carriers (IXCs) 2006 Complaints
48 Total
1
1
1
1
1
1
1
1
1
1
1
1
1
1
1
1
1
1
2
2
2
2
2
3
3
3
3
4
4
0 10 20 30 40 50
Affinity Netw ork
Blackfoot Communications
Business Netw ork Long Distance
CenturyTel Long Distance
Custom Teleconnect
eChurch Netw ork
Legent Communications Corp.
Main Street Telephone Company
Netw ork Service Billling
North American Telephone Netw ork
Opticom
Phone Tec PCS
Primus Telecommunications
Tel West Communications
United American Technology
VarTec Telecom
Verizon Long Distance
America Net, LLC
Clear Choice Communications
Communications Netw ork Billing
Horizon Telecom
L.D. Services & L.D. America
Telseven
Excel Telecommunications
Pow er Net Global Communications
Silv Communications
U.S. Telecom Long Distance
IDT America Corp.
UCN

25
Operator Services Providers & Inmate Calling Providers 2006 Complaints
14 Total
1
3
10
0 10 20 30 40 50
Business Office
Unauthorized charges
Billing/rates

26
Non-Telco, Telco-Billed
2006 Complaints 20 Total
1
1
1
1
1
1
1
1
1
2
2
7
0 10 20 30 40 50
Agora Solution, Inc.
CallWave
Enhanced Voice Mail
Information Services
Members Edge
Microsoft
To Talkinezz
Ultra Website
Unitedtel.com
Personal Voice
Roctel Corp.
Globalyp.net

27
NorthWestern Energy 2006 Complaints
336 Total
4
4
8
9
9
15
19
32
35
49
152
0 50 100 150 200
Quality of Service
Access to call center
Cost of construction
Delay in connection
Deposits
Repair/outages
Service termination
Meters
Billing/rates
Business office
Payment arrangement

28
Montana-Dakota Utilities
2006 Complaints 171 Total
2
3
4
11
15
21
43
72
0 25 50 75 100
Deposits
Access to Call Center
Repair/Outages
Meters
Service termination
Billing/rates
Business office
Payment arrangement

29
Energy West 2006 Complaints
11 total
1
1
4
5
0 25 50 75 100
Billing/Rates
Cost of Construction
Business Office
Payment Arrangement
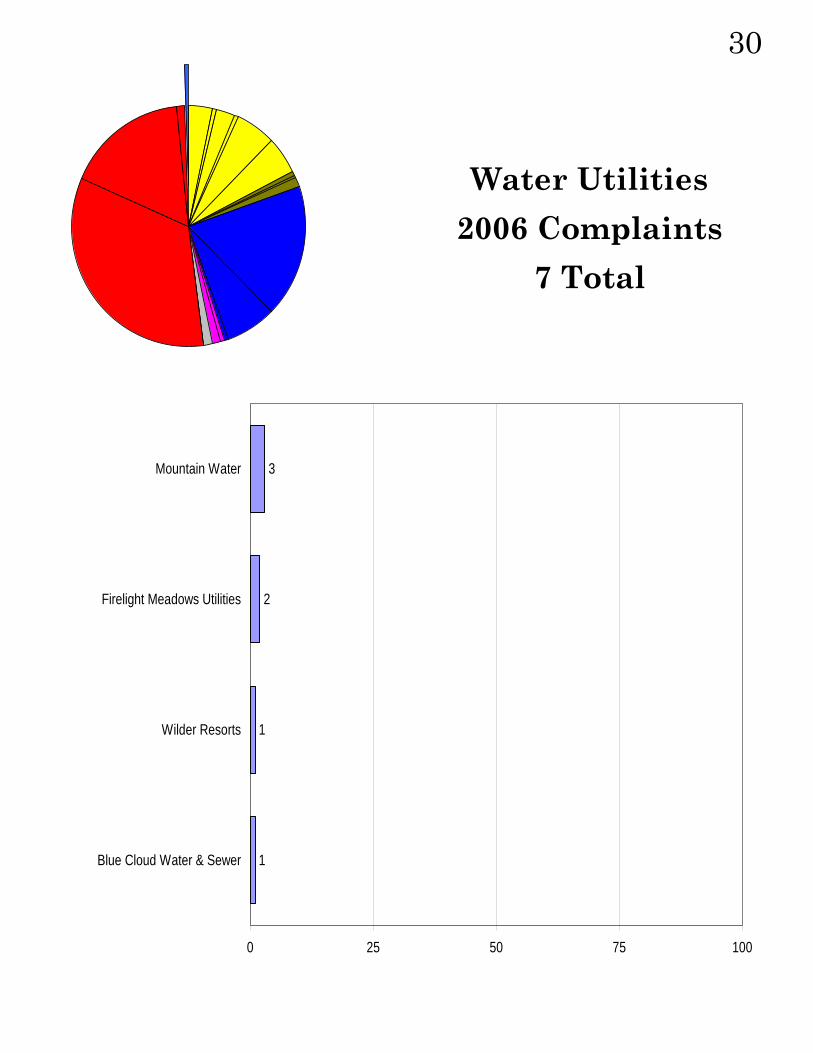
30
Water Utilities 2006 Complaints
7 Total
1
1
2
3
0 25 50 75 100
Blue Cloud Water & Sewer
Wilder Resorts
Firelight Meadows Utilities
Mountain Water

31
0
500
1000
1500
2000
2500
3000
3500
1994 1995 1996 1997 1998 1999 2000 2001 2002 2003 2004 2005 2006
PSC complaints from 1994 through 2006 by service type
Telephone Energy Water
1,687
2,188
2,630
1,227
1,013
2,5572,498
3,039
2,860
2,029
1,472
1,160
831
32 Analysis of Annual Data
As illustrated on pages 11 and 31, the 2006 complaint statistics have shown a continued drop in complaint numbers which started back in 2003. This drop is attrib-uted to telecommunications and not energy, since en-ergy complaints have not changed accordingly. I’ve in-cluded on page 35 a chart reflecting just the telecommu-nications complaint levels from 1994-2006. From 2002 through 2006 the telecommunications complaints have dropped over 77%. The Billing/Rates complaint cate-gory, over the last few years, the number one complaint category, has experienced a 68% drop from 2002 through 2006. The majority of this category (5 yr. average of 75%) is attributed to telecommunications—specifically, the long distance and local exchange carrier categories. There have been some changes over time that have con-tributed to this decline. They are: 1. Competition from cell phone and VoIP companies. 2. Prepaid calling cards. 3. Unlimited long distance plans vs. charges by the min-
ute. 4. A decline in residential long distance advertising. In
some cases, the long distance companies are marketing to the commercial arena only.

33 As is indicated on page 35, the telecommunications complaint chart resembles a bell curve. The main tele-communications categories that reflected the most com-plaints in 1998 and 1999, in frequency order, were busi-ness office, billing/rates, unauthorized switching of phone service (slamming) and unauthorized placement of charges on the customer’s LEC bill (cramming). The slamming and cramming complaints in Montana peaked in 1998 with significant numbers in 1999 as well. The slamming and cramming complaints after 1999 to pre-sent drastically reduced in number with only one nota-ble exception. It was in 2002 when we had 519 cramming complaints, the highest ever, almost half of which re-lated to Directory Service complaints. These involved small charges for directory assistance not authorized. In 2006 the bulk of telecommunications complaints were in the payment arrangement, billing/rates, and business of-fice categories. The 800 line for consumer complaints was installed at the PSC in June 1996. The number of calls on our 800 complaint line increased from 1997 to 2001, and, since then, the calls have decreased to present, as illustrated on page 36. Pages 8 and 9 reflect the more recent num-ber of call comparisons in monthly detail. Obviously, similar reasons would be attributed to the call volume drop as is attributed to the complaint number reduc-tions; however, there are incoming calls to the complaint staff other than the ones on the 800 line. We receive calls on our local complaint line, calls to our personal

34 telephone numbers, and calls coming into the Commis-sion’s main telephone line and transferred to staff. These type of calls into the Commission are not reflected in the 800 line totals. There are many more calls to staff that do not result in the filing of a complaint. Those would be in the area of explaining utility bills, answering many utility related questions, and explaining what and to what extent we regulate. The energy complaints over the years peaked in 2001 with 821 complaints filed. From that point on the energy complaints have hovered around 500-600 per year. The chart of page 37 illustrates the rise and eventual stabil-ity of the energy complaint numbers.

35
0
500
1000
1500
2000
2500
3000
1994 1995 1996 1997 1998 1999 2000 2001 2002 2003 2004 2005 2006
Telecommunications Complaints from 1994 through 2006
Telephone
1,078
1,716
2,152
630
488
1,728
1,875
2,519
2,389
1,642
1,102
876
566

36
0
2,000
4,000
6,000
8,000
10,000
12,000
14,000
16,000
18,000
20,000
1997 1998 1999 2000 2001 2002 2003 2004 2005 2006
800 Incoming Calls 1997 - 2006
Year
11,090
16,269
17,977
16,375
19,263
18,32618,004
13,608
11,310
9.870

37
0
100
200
300
400
500
600
700
800
900
1994 1995 1996 1997 1998 1999 2000 2001 2002 2003 2004 2005 2006
Energy Complaints from 1994 through 2006
Energy
596
465475
589
518
821
621
517
455
374
340
261
227
Recommended