Surviving and Thriving in Changing Times
40Years
and Beyond
A N N U A L R E P O R T 2 0 0 4
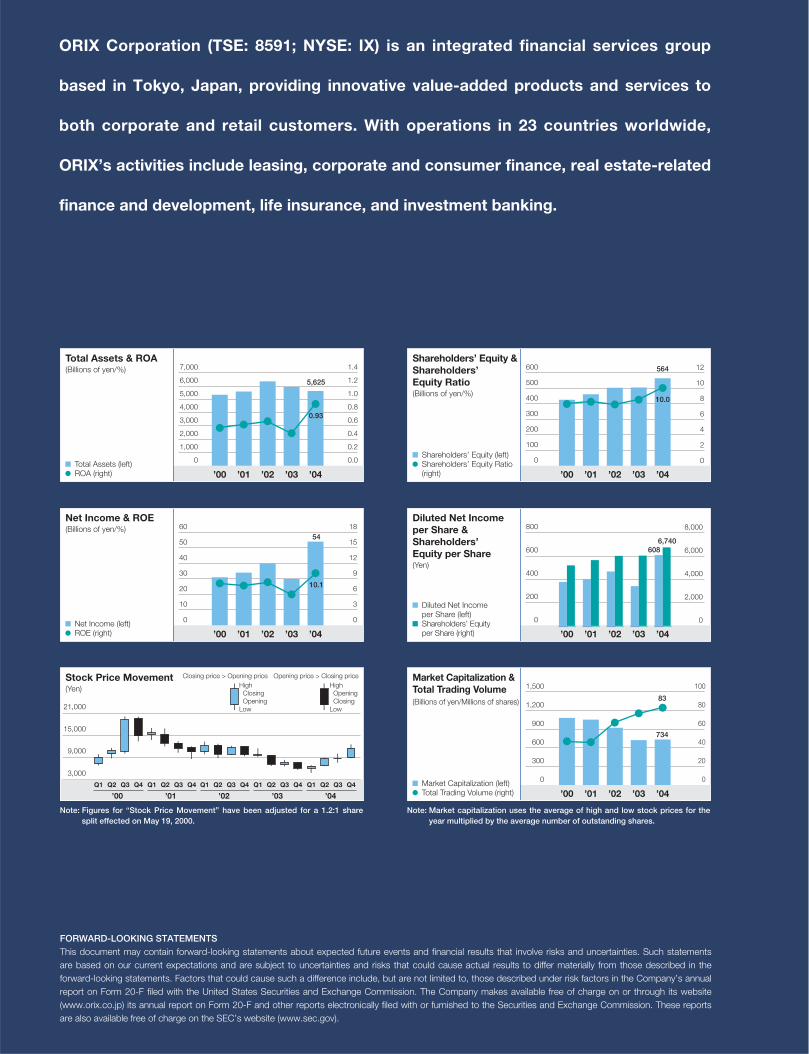
ORIX Corporation (TSE: 8591; NYSE: IX) is an integrated financial services group
based in Tokyo, Japan, providing innovative value-added products and services to
both corporate and retail customers. With operations in 23 countries worldwide,
ORIX’s activities include leasing, corporate and consumer finance, real estate-related
finance and development, life insurance, and investment banking.
’00 ’01 ’02 ’03 ’04Total Assets (left)ROA (right)
(Billions of yen/%)Total Assets & ROA
0
1,000
2,000
3,000
4,000
5,000
6,000
7,000
’00 ’01 ’02 ’03 ’04Net Income (left)ROE (right)
(Billions of yen/%)Net Income & ROE
’00 ’01 ’02 ’03 ’04
Shareholders’ Equity (left)Shareholders’ Equity Ratio (right)
(Billions of yen/%)
Shareholders’ Equity & Shareholders’ Equity Ratio
’00 ’01 ’02 ’03 ’04Shareholders’ Equity per Share (right)
Diluted Net Income per Share (left)
(Yen)
Diluted Net Income per Share & Shareholders’ Equity per Share
0.0
0.2
0.4
0.6
0.8
1.0
1.2
1.4
’00 ’01 ’02 ’03 ’04
(Yen)Stock Price Movement
’00 ’01 ’02 ’03 ’04
0
300
600
900
1,200
1,500
0
20
40
60
80
100
(Billions of yen/Millions of shares)
Market Capitalization & Total Trading Volume
Market Capitalization (left)Total Trading Volume (right)
3,000
9,000
15,000
21,000
Q1 Q2 Q3 Q4 Q1 Q2 Q3 Q4 Q1 Q2 Q3 Q4 Q1 Q2 Q3 Q4 Q1 Q2 Q3 Q4
High Closing OpeningLow
Closing price > Opening priceHigh Opening ClosingLow
Opening price > Closing price
0
10
20
30
40
50
60
0
3
6
9
12
15
18
0
100
200
300
400
500
600
0
200
400
600
800
0
2,000
4,000
6,000
8,000
0
2
4
6
8
10
12
0.93
5,625
54 6,740608
734
83
564
10.0
10.1
Note: Figures for “Stock Price Movement” have been adjusted for a 1.2:1 sharesplit effected on May 19, 2000.
Note: Market capitalization uses the average of high and low stock prices for theyear multiplied by the average number of outstanding shares.
FORWARD-LOOKING STATEMENTSThis document may contain forward-looking statements about expected future events and financial results that involve risks and uncertainties. Such statementsare based on our current expectations and are subject to uncertainties and risks that could cause actual results to differ materially from those described in theforward-looking statements. Factors that could cause such a difference include, but are not limited to, those described under risk factors in the Company’s annualreport on Form 20-F filed with the United States Securities and Exchange Commission. The Company makes available free of charge on or through its website(www.orix.co.jp) its annual report on Form 20-F and other reports electronically filed with or furnished to the Securities and Exchange Commission. These reportsare also available free of charge on the SEC’s website (www.sec.gov).
O R I X C o r p o r a t i o n
2
8
16
20
59
117
122
ORIX Story
To Our Shareholders—A Message from the CEO
Guide to ORIX’s Financial Statements
Management’s Discussion andAnalysis of Operations
Financial Section
Directory (by Segment) & Group Network
Website Guide & Corporate Information
C O N T E N T S
ORIX Corporation celebrated its 40th anniversary on
April 17, 2004. Since our start in 1964 as a pioneer
in the Japanese leasing market, we have evolved
dynamically as a leading integrated financial services
group that remains on the forefront of innovation
and change. We have faced many challenges along
the way, but our history during the last 40 years has
been one of surviving and thriving in changing times.
While taking a look at the milestones over the last
four decades, this year’s annual report describes
our performance for the year ended March 31, 2004,
and our strategies for the current year and beyond.
In his message from the CEO to shareholders,
Yoshihiko Miyauchi outlines our achievements and
the key points to further success in the future. The
“ORIX Story” looks back on the last 40 years and
highlights why we have evolved as we have. This
section is not just an overview of ORIX’s history and
its dynamic evolution over the years, it also reviews
our corporate culture, with its deep historical roots,
and the unique strengths we have evolved. The fea-
ture section then provides details of our strategy for
the year ending March 31, 2005.
While we believe that the results of our efforts
have been impressive, we realize that our diversifi-
cation has made ORIX a complex company for
many outsiders to understand. We have therefore
included a “Guide to ORIX’s Financial Statements”
to help you understand the numbers behind the bot-
tom line. We have also expanded the “Management’s
Discussion and Analysis of Operations” (MD&A) to
include more analysis and information on different
parts of our business. Finally, the “Directory (by
Segment) & Group Network” and “Website Guide &
Corporate Information” provide information on how to
find out more about ORIX.
We hope this year’s annual report helps you
understand how we are trying to survive and thrive
as we take on our next challenges.
40 Years and Beyond
Surviving and
Thriving in Changing Times
40 Years and Beyond
Surviving and
Thriving in Changing Times
O R I X C o r p o r a t i o n
2
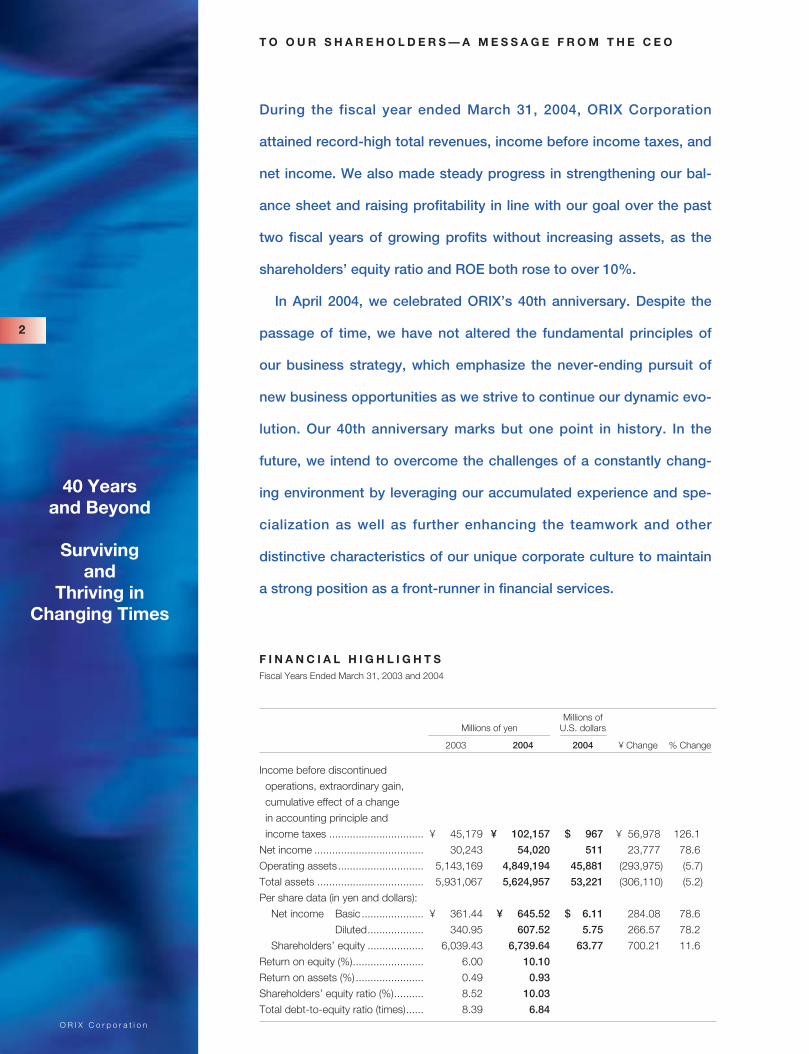
During the fiscal year ended March 31, 2004, ORIX Corporation
attained record-high total revenues, income before income taxes, and
net income. We also made steady progress in strengthening our bal-
ance sheet and raising profitability in line with our goal over the past
two fiscal years of growing profits without increasing assets, as the
shareholders’ equity ratio and ROE both rose to over 10%.
In April 2004, we celebrated ORIX’s 40th anniversary. Despite the
passage of time, we have not altered the fundamental principles of
our business strategy, which emphasize the never-ending pursuit of
new business opportunities as we strive to continue our dynamic evo-
lution. Our 40th anniversary marks but one point in history. In the
future, we intend to overcome the challenges of a constantly chang-
ing environment by leveraging our accumulated experience and spe-
cialization as well as further enhancing the teamwork and other
distinctive characteristics of our unique corporate culture to maintain
a strong position as a front-runner in financial services.
F I N A N C I A L H I G H L I G H T SFiscal Years Ended March 31, 2003 and 2004
Millions of Millions of yen U.S. dollars
2003 2004 2004 ¥ Change % Change
Income before discontinued
operations, extraordinary gain,
cumulative effect of a change
in accounting principle and
income taxes ................................ ¥ 45,179 ¥ 102,157 $ 967 ¥ 56,978 126.1
Net income ..................................... 30,243 54,020 511 23,777 78.6
Operating assets............................. 5,143,169 4,849,194 45,881 (293,975) (5.7)
Total assets .................................... 5,931,067 5,624,957 53,221 (306,110) (5.2)
Per share data (in yen and dollars):
Net income Basic ..................... ¥ 361.44 ¥ 645.52 $ 6.11 284.08 78.6
Diluted................... 340.95 607.52 5.75 266.57 78.2
Shareholders’ equity ................... 6,039.43 6,739.64 63.77 700.21 11.6
Return on equity (%)........................ 6.00 10.10
Return on assets (%)....................... 0.49 0.93
Shareholders’ equity ratio (%).......... 8.52 10.03
Total debt-to-equity ratio (times)...... 8.39 6.84
T O O U R S H A R E H O L D E R S — A M E S S A G E F R O M T H E C E O
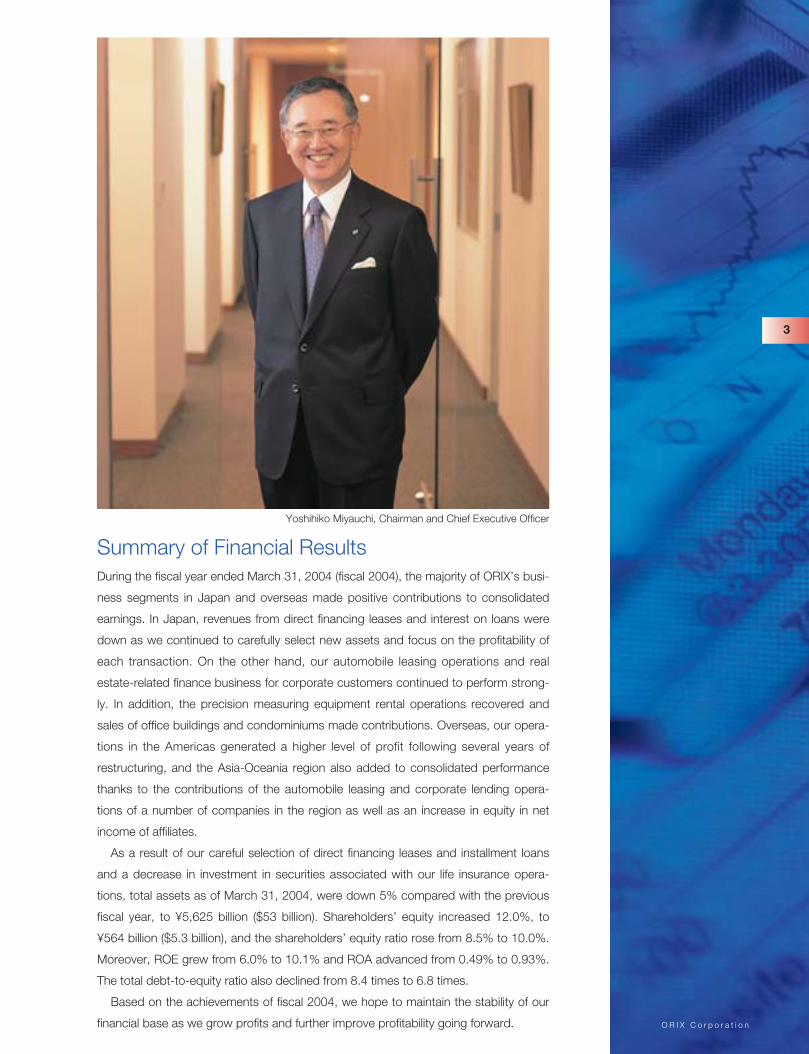
Yoshihiko Miyauchi, Chairman and Chief Executive Officer
O R I X C o r p o r a t i o n
3
Summary of Financial ResultsDuring the fiscal year ended March 31, 2004 (fiscal 2004), the majority of ORIX’s busi-
ness segments in Japan and overseas made positive contributions to consolidated
earnings. In Japan, revenues from direct financing leases and interest on loans were
down as we continued to carefully select new assets and focus on the profitability of
each transaction. On the other hand, our automobile leasing operations and real
estate-related finance business for corporate customers continued to perform strong-
ly. In addition, the precision measuring equipment rental operations recovered and
sales of office buildings and condominiums made contributions. Overseas, our opera-
tions in the Americas generated a higher level of profit following several years of
restructuring, and the Asia-Oceania region also added to consolidated performance
thanks to the contributions of the automobile leasing and corporate lending opera-
tions of a number of companies in the region as well as an increase in equity in net
income of affiliates.
As a result of our careful selection of direct financing leases and installment loans
and a decrease in investment in securities associated with our life insurance opera-
tions, total assets as of March 31, 2004, were down 5% compared with the previous
fiscal year, to ¥5,625 billion ($53 billion). Shareholders’ equity increased 12.0%, to
¥564 billion ($5.3 billion), and the shareholders’ equity ratio rose from 8.5% to 10.0%.
Moreover, ROE grew from 6.0% to 10.1% and ROA advanced from 0.49% to 0.93%.
The total debt-to-equity ratio also declined from 8.4 times to 6.8 times.
Based on the achievements of fiscal 2004, we hope to maintain the stability of our
financial base as we grow profits and further improve profitability going forward.
O R I X C o r p o r a t i o n
4
Future Management Policy
Responding to Japan’s Economic Recovery in Fiscal 2005Following a protracted period of stagnation, Japan’s economy is increasingly showing signs of having
bottomed out and appears to have finally entered a period of recovery. Moreover, while I still do not
expect rapid progress in structural reforms at this point, it does appear that the Japanese economy is
slowly but steadily gaining the characteristics of a true market economy.
In view of this, we have been reevaluating our strategic positioning and are considering how to shift
our focus from a strategy of growth by taking advantage of opportunities presented by the harsh eco-
nomic environment following the end of the bubble economy in Japan to an emphasis on growth amid
a period of recovery in Japan’s economy. With this transition in mind, we have begun preparing our-
selves for a potential full-scale upturn in the Japanese economy. If this recent upturn actually shows
some staying power, we will need to revise our cautious business outlook and make efforts to acceler-
ate our growth. Through this transition, I would like to take ORIX into the next period of expansion and
aim to achieve a considerable surge in earnings.
To achieve these goals, I believe that ORIX needs to implement a two-pronged strategy: 1) expand
the franchise value of our existing successful businesses and 2) create new franchise value by adding
businesses to our core of operations.
Expanding Franchise ValueAt times like the current period of transition toward economic recovery, mega banks and other com-
panies in Japan’s financial sector are likely to gradually regain their vitality and compete more directly
with us. For example, I believe they will probably try to develop strategies aimed at providing financial
services to ORIX’s core customer base of mainly small and medium-sized companies.
At present, however, I am proud to say that I believe ORIX is the only company in Japan with an
established business model in the field of financial services targeting small and medium-sized
companies. Over many years, we have built up an extensive customer network centering on approxi-
mately 500,000 small and medium-sized companies throughout Japan. Moreover, we have often
begun our relationships with individual customers based on lease transactions, then used cross-selling
to provide insurance, investment products, and other financial products and services. Nowadays, we
have advanced to the point where we can offer our customers diverse solutions, such as those related
to helping companies restructure their businesses and strengthen their financial positions. We have
already built a solid foundation in providing solutions to small and medium-sized companies and these
operations generate a substantial amount of our consolidated earnings.
To ensure that we can maintain a position that is consistently a step or more ahead of our competi-
tors, we are forming a variety of cross-divisional business teams with high levels of specialized skills.
The mission of these teams is to fully integrate the wealth of knowledge that exists throughout ORIX,
so that these teams can propose solutions that are tailored to meet the various needs of our cus-
tomers throughout our nationwide sales network. By better meeting our customer needs, we can fur-
ther strengthen our relationships of trust, which we believe will allow us to proactively expand this
most important franchise value.
O R I X C o r p o r a t i o n
5
Furthermore, in the process of developing this business model based on providing innovative
solutions, we have developed some unique specialized operations that we are also attempting
to expand.
In automobile leasing, for example, ORIX offers direct financing leases along with a full range of
maintenance and administrative services. As a result, we are able to enjoy relatively higher returns
because we provide considerably more valuable services than simple direct financing leases and this
has become a very profitable business. Moreover, we are enjoying economies of scale stemming from
the large-volume procurement of vehicles as well as tires, lubricants, and other maintenance items.
We are striving to leverage these merits to further upgrade our value-added services for leased vehi-
cles and greatly increase the number of vehicles that we administer.
In addition to the automobile leasing operations, ORIX is proactively working to expand operating
leases for precision measuring instruments and other financial businesses that incorporate a high
degree of specialization and value-added services. In the future, we also expect to further boost the
share of our profitability that stems from such services as building maintenance, which we are strategi-
cally expanding at this time. In this way, we are attempting to expand the services that we can
provide, even when the services are not strictly within the scope of financial services, in an
effort to boost growth and improve profitability.
Creating New Franchise ValueThe second main part of our strategy relates to the new business opportunities and customer needs
that have emerged as a result of macroeconomic changes and progress in implementing structural
reforms in Japan. We have developed various businesses in recent years and we want to create
new franchise value as we continue to add these to our core operations.
The benefits of this strategy are currently emerging in such financial fields as real estate-related
finance, which has grown strongly in Japan, as well as such investment banking operations as M&A
advisory, private equity, and corporate rehabilitation services.
In the field of real estate-related finance, we have successfully developed various new businesses
including non-recourse loans, securitization products, and a real estate investment trust (REIT) in the
past few years. We also have expanded business associated with non-performing loans as financial
institutions make efforts to move forward in dealing with their problem assets.
Drawing on our accumulated financial know-how and growing experience in such areas as real
estate development, management, and maintenance, ORIX is proactively expanding its operations
as a leader in real estate-related finance. In recent years, we have realized considerable profits in
the real estate-related finance market, and this market is projected to greatly expand in view of the
emergence of new needs. I believe that we are well prepared and poised to take advantage of oppor-
tunities in the real estate-related finance market. We plan to further expand and build our operations in
this market into an additional core business capable of generating attractive returns.
Our small and medium-sized corporate customers present us with various requests that are no
longer limited to needs associated with financial products and services, but include a growing number
of requests related to such issues as business restructuring and succession, balance-sheet strength-
ening, and stock listings. In December 1999, ORIX established a department specializing in investment
O R I X C o r p o r a t i o n
6
banking services. This department has worked in close cooperation with sales and marketing units
throughout Japan to provide solutions for these kinds of new needs.
We are also emphasizing the expansion of our corporate rehabilitation business, including equity
investments in and management support for companies in bankruptcy or undergoing restructuring. In
the corporate rehabilitation business, we are seeking to boost the value of companies in which we
invest to realize capital gains over the medium term upon their sale. Currently, we are striving to both
increase the value of our existing investments to prepare for profitable exits in the future, while main-
taining strict evaluation standards when making additional investments. The market for corporate reha-
bilitation and other types of investment banking solutions is projected to keep growing due to the
continued bipolarization of the performance of Japanese companies between winners and losers.
We expect demand both for proactive measures to help companies become winners and
for the rehabilitation of failed companies. Our goal is to further strengthen our position in this
market and thereby establish investment banking as another core business to create new fran-
chise value.
Overcoming the Challenges in Overseas OperationsPerformance in ORIX’s business segments in the Americas and the Asia and Oceania regions
has generally improved, and we intend to take the steps required to ensure that our overseas opera-
tions once again increase their contribution to overall earnings. In particular, our operations in the
Americas have been weak in recent years, but we feel that the segment is moving towards recovery as
we have finally completed the restructuring of our leasing subsidiary there. As a result of the improve-
ment in our overseas operations, we are now in a position to make serious consideration of opportuni-
ties for expansion.
ORIX’s 40th Anniversary
Surviving and Thriving Tomorrow and BeyondOn April 17, 2004, we celebrated our 40th anniversary. I would like to express my great appreciation
for the support and cooperation of the shareholders, customers, business partners, local communi-
ties, and other associates that have enabled ORIX to achieve so much in just four decades.
During its first 40 years, ORIX has proven itself to be a company able to respond quickly and flexibly to
changing times by adjusting its business model as necessary. While maintaining a primary focus on finan-
cial services, we have steadily grown by launching an impressive array of new products and services.
Soon after its establishment, the management of ORIX adopted a policy of seeking to develop inde-
pendently—without excessive dependence on the trading companies and banks that founded the
company—by vigorously seeking out new challenges. This has enabled us to develop an independ-
ent and dynamic corporate culture that has fostered a high degree of flexibility to adapt to
change as well as aggressively take on new business challenges. Thanks to this dynamic culture,
ORIX has developed various specialized capabilities based on its leasing-related know-how and
extended its sales and marketing network throughout Japan. We have promoted cooperation among
our sales and marketing and specialized departments with an emphasis on teamwork and knowledge
sharing. This has enabled the creation of various innovative financial products and services as well as
O R I X C o r p o r a t i o n
7
the provision of sophisticated solutions. Beginning in the early 1970s, ORIX began extending its
network overseas through the establishment and acquisition of companies. As a result of this strategy,
ORIX now has a network of bases for providing financial products and services in 22 countries and
regions outside of Japan in the Americas, Europe, Asia, and Oceania. As our operations have become
more diverse, we have upgraded our systems for monitoring and managing an increasingly complex
array of risks as well as a rigorous corporate governance system designed to ensure that operations
are consistently managed in line with shareholders’ interests.
As a result of these initiatives, ORIX has been able to overcome the challenges presented by such
developments as the two international oil crises and the collapse of Japan’s bubble economy. While
profitability was naturally impacted by those events, our profit-oriented business expansion strategies
and emphasis on thorough risk management policies enabled us to quickly restore the upward momen-
tum of our performance, while we accumulated more expertise in the process. We have thus been able
to increase our profits in almost every one of the 40 years of our operations. This long-standing
tradition of sustained increase in corporate value is a precious heritage, and our long-term goal is to
ensure that this tradition is perpetuated. Boosting corporate performance every year without fail is a
daunting proposition, but I believe that ORIX is more than capable of striving for such a goal.
We can assume that our operating environment will continue to change relentlessly. The post-
bubble stagnation has made it impossible for the Japanese financial sector to keep abreast of global
trends, but I expect that Japan will ultimately achieve economic recovery, at which point the country
will be able to proceed with structural reforms that will result in rapid changes. These changes are likely
to produce many business opportunities. In anticipation of this, we will strive to further reinforce our
solid foundation and strengths so that we can create more franchise value by continuing to provide
new types of solutions in our existing and new businesses. I am confident that the franchise value
that we have established over the last 40 years and continue to create today will help ORIX
maintain its strong position as a front-runner in financial services as we strive to survive and
thrive tomorrow and beyond.
I sincerely thank the shareholders, customers, business partners, and other associates who have
supported and cooperated with us during fiscal 2004. I look forward to your continued support and
advice in the future.
June 28, 2004
Yoshihiko Miyauchi
Director, Representative Executive Officer,
Chairman and Chief Executive Officer
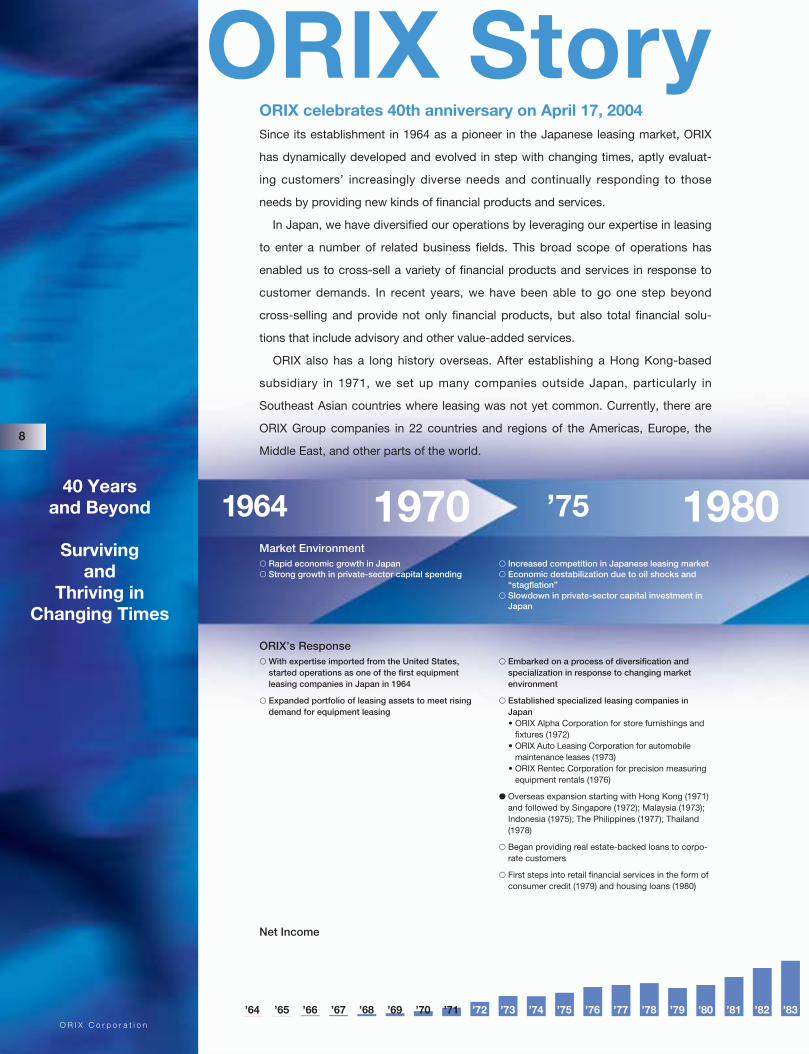
’67’65’64 ’66 ’68 ’69 ’70 ’71 ’72 ’73 ’74 ’75 ’76 ’77 ’78 ’79 ’80 ’81 ’82 ’83
� Rapid economic growth in Japan � Strong growth in private-sector capital spending
� Increased competition in Japanese leasing market� Economic destabilization due to oil shocks and
“stagflation”� Slowdown in private-sector capital investment in
Japan
ORIX celebrates 40th anniversary on April 17, 2004Since its establishment in 1964 as a pioneer in the Japanese leasing market, ORIX
has dynamically developed and evolved in step with changing times, aptly evaluat-
ing customers’ increasingly diverse needs and continually responding to those
needs by providing new kinds of financial products and services.
In Japan, we have diversified our operations by leveraging our expertise in leasing
to enter a number of related business fields. This broad scope of operations has
enabled us to cross-sell a variety of financial products and services in response to
customer demands. In recent years, we have been able to go one step beyond
cross-selling and provide not only financial products, but also total financial solu-
tions that include advisory and other value-added services.
ORIX also has a long history overseas. After establishing a Hong Kong-based
subsidiary in 1971, we set up many companies outside Japan, particularly in
Southeast Asian countries where leasing was not yet common. Currently, there are
ORIX Group companies in 22 countries and regions of the Americas, Europe, the
Middle East, and other parts of the world.
Market Environment
ORIX’s Response� With expertise imported from the United States,
started operations as one of the first equipmentleasing companies in Japan in 1964
� Expanded portfolio of leasing assets to meet risingdemand for equipment leasing
� Embarked on a process of diversification andspecialization in response to changing marketenvironment
� Established specialized leasing companies inJapan • ORIX Alpha Corporation for store furnishings and
fixtures (1972)• ORIX Auto Leasing Corporation for automobile
maintenance leases (1973)• ORIX Rentec Corporation for precision measuring
equipment rentals (1976)
� Overseas expansion starting with Hong Kong (1971)and followed by Singapore (1972); Malaysia (1973);Indonesia (1975); The Philippines (1977); Thailand(1978)
� Began providing real estate-backed loans to corpo-rate customers
� First steps into retail financial services in the form ofconsumer credit (1979) and housing loans (1980)
Net Income
40 Years and Beyond
Surviving and
Thriving in Changing Times
1964 ’751970 1980
8
O R I X C o r p o r a t i o n
ORIX Story
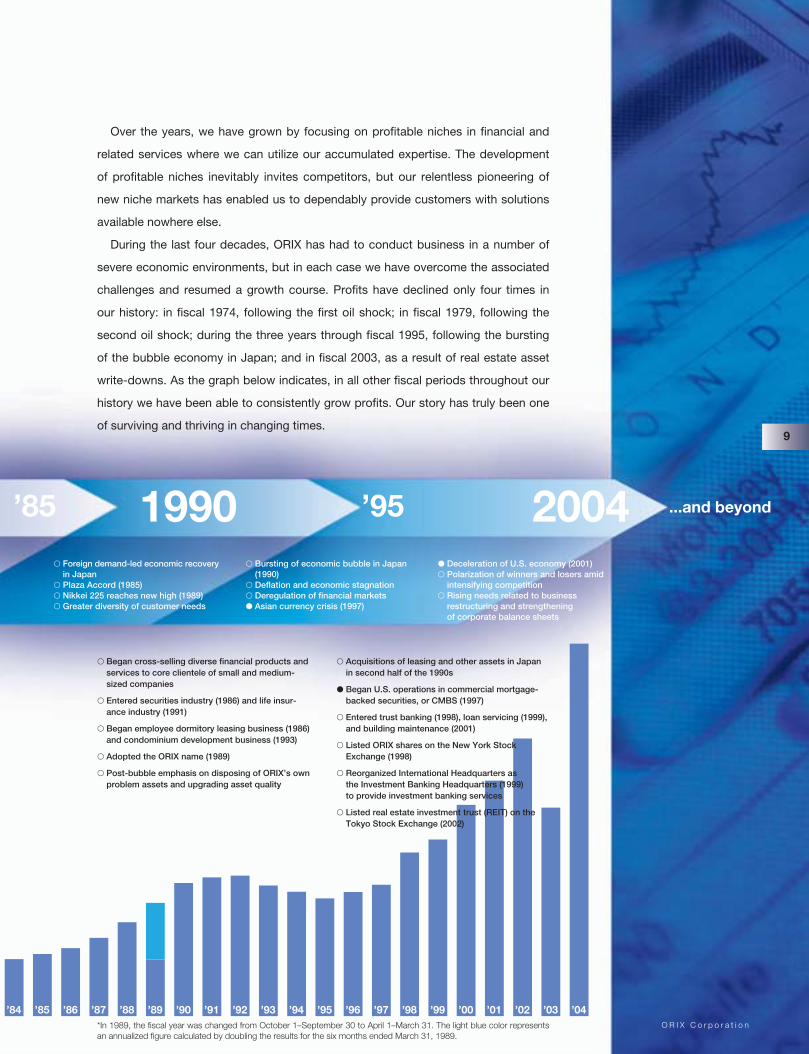
’84 ’85 ’86 ’87 ’88 ’89 ’90 ’91 ’92 ’93 ’94 ’95 ’96 ’97 ’98 ’99 ’00 ’01 ’02 ’03 ’04
� Foreign demand-led economic recoveryin Japan
� Plaza Accord (1985)� Nikkei 225 reaches new high (1989) � Greater diversity of customer needs
� Bursting of economic bubble in Japan(1990)
� Deflation and economic stagnation� Deregulation of financial markets� Asian currency crisis (1997)
� Deceleration of U.S. economy (2001)� Polarization of winners and losers amid
intensifying competition� Rising needs related to business
restructuring and strengthening of corporate balance sheets
Over the years, we have grown by focusing on profitable niches in financial and
related services where we can utilize our accumulated expertise. The development
of profitable niches inevitably invites competitors, but our relentless pioneering of
new niche markets has enabled us to dependably provide customers with solutions
available nowhere else.
During the last four decades, ORIX has had to conduct business in a number of
severe economic environments, but in each case we have overcome the associated
challenges and resumed a growth course. Profits have declined only four times in
our history: in fiscal 1974, following the first oil shock; in fiscal 1979, following the
second oil shock; during the three years through fiscal 1995, following the bursting
of the bubble economy in Japan; and in fiscal 2003, as a result of real estate asset
write-downs. As the graph below indicates, in all other fiscal periods throughout our
history we have been able to consistently grow profits. Our story has truly been one
of surviving and thriving in changing times.
� Began cross-selling diverse financial products andservices to core clientele of small and medium-sized companies
� Entered securities industry (1986) and life insur-ance industry (1991)
� Began employee dormitory leasing business (1986)and condominium development business (1993)
� Adopted the ORIX name (1989)
� Post-bubble emphasis on disposing of ORIX’s ownproblem assets and upgrading asset quality
� Acquisitions of leasing and other assets in Japanin second half of the 1990s
� Began U.S. operations in commercial mortgage-backed securities, or CMBS (1997)
� Entered trust banking (1998), loan servicing (1999),and building maintenance (2001)
� Listed ORIX shares on the New York StockExchange (1998)
� Reorganized International Headquarters as the Investment Banking Headquarters (1999) to provide investment banking services
� Listed real estate investment trust (REIT) on theTokyo Stock Exchange (2002)
*In 1989, the fiscal year was changed from October 1–September 30 to April 1–March 31. The light blue color representsan annualized figure calculated by doubling the results for the six months ended March 31, 1989.
9
’85 1990 ’95 2004 ...and beyond
O R I X C o r p o r a t i o n
O R I X C o r p o r a t i o n
10
CULTURE
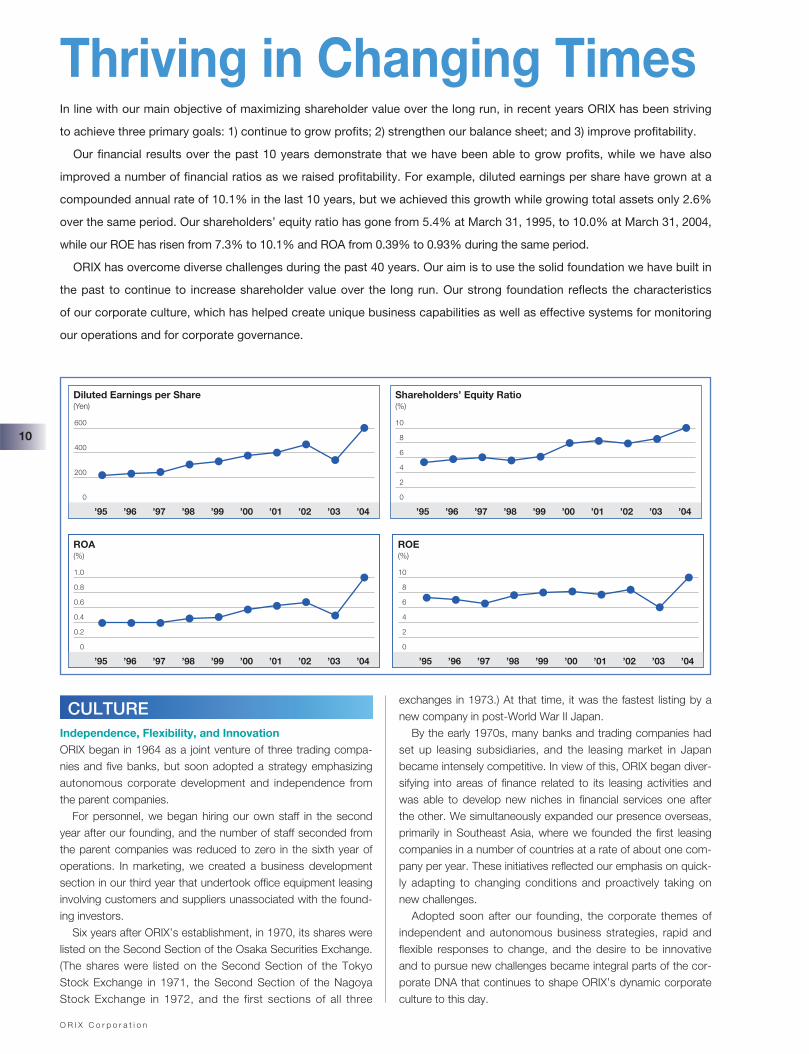
Thriving in Changing Times
(Yen)Diluted Earnings per Share
0
200
400
600
’04’03’02’01’00’99’98’97’96’95
(%)Shareholders’ Equity Ratio
’04’03’02’01’00’99’98’97’96’95
0
2
4
6
8
10
(%)ROA
’04’03’02’01’00’99’98’97’96’95
0
0.2
0.4
0.6
0.8
1.0
(%)ROE
’04’03’02’01’00’99’98’97’96’95
0
2
4
6
8
10
In line with our main objective of maximizing shareholder value over the long run, in recent years ORIX has been striving
to achieve three primary goals: 1) continue to grow profits; 2) strengthen our balance sheet; and 3) improve profitability.
Our financial results over the past 10 years demonstrate that we have been able to grow profits, while we have also
improved a number of financial ratios as we raised profitability. For example, diluted earnings per share have grown at a
compounded annual rate of 10.1% in the last 10 years, but we achieved this growth while growing total assets only 2.6%
over the same period. Our shareholders’ equity ratio has gone from 5.4% at March 31, 1995, to 10.0% at March 31, 2004,
while our ROE has risen from 7.3% to 10.1% and ROA from 0.39% to 0.93% during the same period.
ORIX has overcome diverse challenges during the past 40 years. Our aim is to use the solid foundation we have built in
the past to continue to increase shareholder value over the long run. Our strong foundation reflects the characteristics
of our corporate culture, which has helped create unique business capabilities as well as effective systems for monitoring
our operations and for corporate governance.
Independence, Flexibility, and InnovationORIX began in 1964 as a joint venture of three trading compa-nies and five banks, but soon adopted a strategy emphasizingautonomous corporate development and independence fromthe parent companies.
For personnel, we began hiring our own staff in the secondyear after our founding, and the number of staff seconded fromthe parent companies was reduced to zero in the sixth year ofoperations. In marketing, we created a business developmentsection in our third year that undertook office equipment leasinginvolving customers and suppliers unassociated with the found-ing investors.
Six years after ORIX’s establishment, in 1970, its shares werelisted on the Second Section of the Osaka Securities Exchange.(The shares were listed on the Second Section of the TokyoStock Exchange in 1971, the Second Section of the NagoyaStock Exchange in 1972, and the first sections of all three
exchanges in 1973.) At that time, it was the fastest listing by anew company in post-World War II Japan.
By the early 1970s, many banks and trading companies hadset up leasing subsidiaries, and the leasing market in Japanbecame intensely competitive. In view of this, ORIX began diver-sifying into areas of finance related to its leasing activities andwas able to develop new niches in financial services one afterthe other. We simultaneously expanded our presence overseas,primarily in Southeast Asia, where we founded the first leasingcompanies in a number of countries at a rate of about one com-pany per year. These initiatives reflected our emphasis on quick-ly adapting to changing conditions and proactively taking onnew challenges.
Adopted soon after our founding, the corporate themes ofindependent and autonomous business strategies, rapid andflexible responses to change, and the desire to be innovativeand to pursue new challenges became integral parts of the cor-porate DNA that continues to shape ORIX’s dynamic corporateculture to this day.
O R I X C o r p o r a t i o n
11
CORE STRENGTHS
Venture Capital & Principal
Investments
Non-Collateralized
Loans
Non-Recourse Loans
Collateralized Loans
Direct Financing Leases
Roots in Leasing
Automobile Maintenance Leases
Precision Measuring Equipment Rentals
Real Estate Leasing
Real Estate Development &
Management
Emphasis on Evaluation and Financing
Emphasis on Physical Assets
“””
The market for financial services today constantly
demands new products and innovations that cut
across the existing categories of financial activi-
ties...Only those players who are contributing new
value-added products and services are able to create
new markets and expand their operations.
Yoshihiko Miyauchi, “To Our Shareholders,” Annual Report1988
“Industries now face mounting problems...It is
inevitable that we will be asked to involve ourselves in
the search to solutions to these problems. We are
prepared and willing to meet these challenges.
Tsuneo Inui, “Letter from the President,” Annual Report 1970(This quote is taken from the first annual report published by thethen Orient Leasing Co., Ltd., and 1970 was the year we wentpublic with our listing on the Osaka Securities Exchange).
Expertise in EvaluationEstablished as a leasing company, ORIX has for 40 years pro-vided direct financing leases, which we view as a form of unse-cured financing because we do not base our credit evaluationon the assumption that we can repossess and sell the leasedassets. In addition, the small and medium-sized companies thatare our principal customers usually do not have third-party cred-it ratings, so sophisticated expertise is required to evaluate themproperly. To gain an accurate understanding of a customer’sbasic ability to make payments throughout the term of a con-tract, we employ interviews by marketing staff, the analysis offinancial statements, market research, and other measures tocarefully evaluate each customer’s cash flows, profitability, man-agement, and business prospects to determine the customer’screditworthiness. Having developed capabilities for determiningcorporate customers’ real creditworthiness over many years, wecan now make use of this expertise in our leasing and financingbusiness as well as when acquiring corporate assets, arrangingM&A transactions, and making selected equity investments aspart of our corporate rehabilitation business.
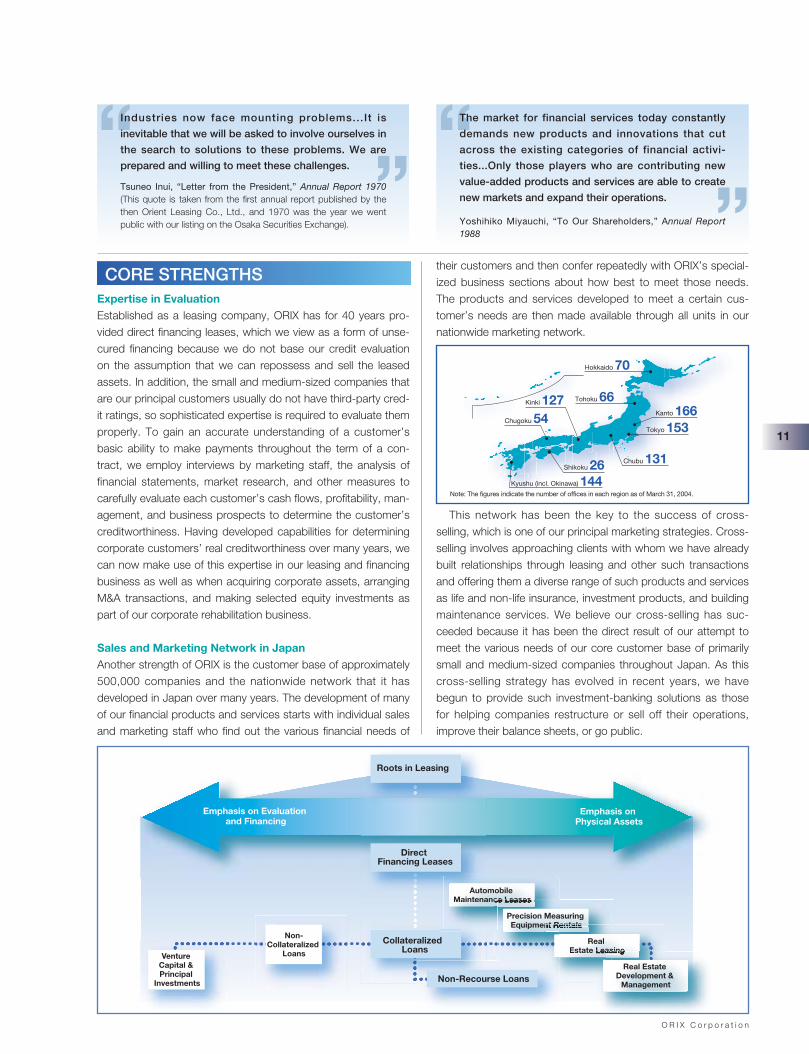
Sales and Marketing Network in JapanAnother strength of ORIX is the customer base of approximately500,000 companies and the nationwide network that it hasdeveloped in Japan over many years. The development of manyof our financial products and services starts with individual salesand marketing staff who find out the various financial needs of
their customers and then confer repeatedly with ORIX’s special-ized business sections about how best to meet those needs.The products and services developed to meet a certain cus-tomer’s needs are then made available through all units in ournationwide marketing network.
Note: The figures indicate the number of offices in each region as of March 31, 2004.
Chugoku 54Kinki 127
Kyushu (incl. Okinawa) 144Shikoku 26 Chubu 131
Kanto 166Tokyo 153
Hokkaido 70
Tohoku 66
This network has been the key to the success of cross-selling, which is one of our principal marketing strategies. Cross-selling involves approaching clients with whom we have alreadybuilt relationships through leasing and other such transactionsand offering them a diverse range of such products and servicesas life and non-life insurance, investment products, and buildingmaintenance services. We believe our cross-selling has suc-ceeded because it has been the direct result of our attempt tomeet the various needs of our core customer base of primarilysmall and medium-sized companies throughout Japan. As thiscross-selling strategy has evolved in recent years, we havebegun to provide such investment-banking solutions as thosefor helping companies restructure or sell off their operations,improve their balance sheets, or go public.
O R I X C o r p o r a t i o n
12 MONITORING
Knowledge Sharing and TeamworkTo enable the provision of value-added products and servicesthat meet the diverse needs of customers throughout Japan,ORIX has created a number of specialized teams that havesophisticated know-how. The most distinctive aspect of ourmarketing operations is the way the information and expertiseaccumulated in specialized fields by each individual employee isshared among many different organizational units, so that wecan synergistically combine our broad-ranging knowledgeresources when making business proposals to our customers.By encouraging marketing offices throughout Japan to make fulluse of specialized sections, we have considerably upgraded ouroverall capabilities.
For example, in recent years there have been a number ofbusiness opportunities involving the establishment of corporaterehabilitation funds with financial institutions that are trying toclean up their bad debt problems. Our Investment BankingHeadquarters, Real Estate Finance Headquarters, and such
Group companies as ORIX Asset Management & Loan ServicesCorporation have jointly established project teams of outstand-ing specialists. These teams have worked on corporate rehabili-tation projects in all regions of Japan and have already compileda strong record of success in such projects. This kind of team-work that facilitates synergistic combinations of expertise is oneof ORIX’s biggest strengths. We are trying to further strengthenthis knowledge sharing and create numerous specialized teamsthat can win against any competition.
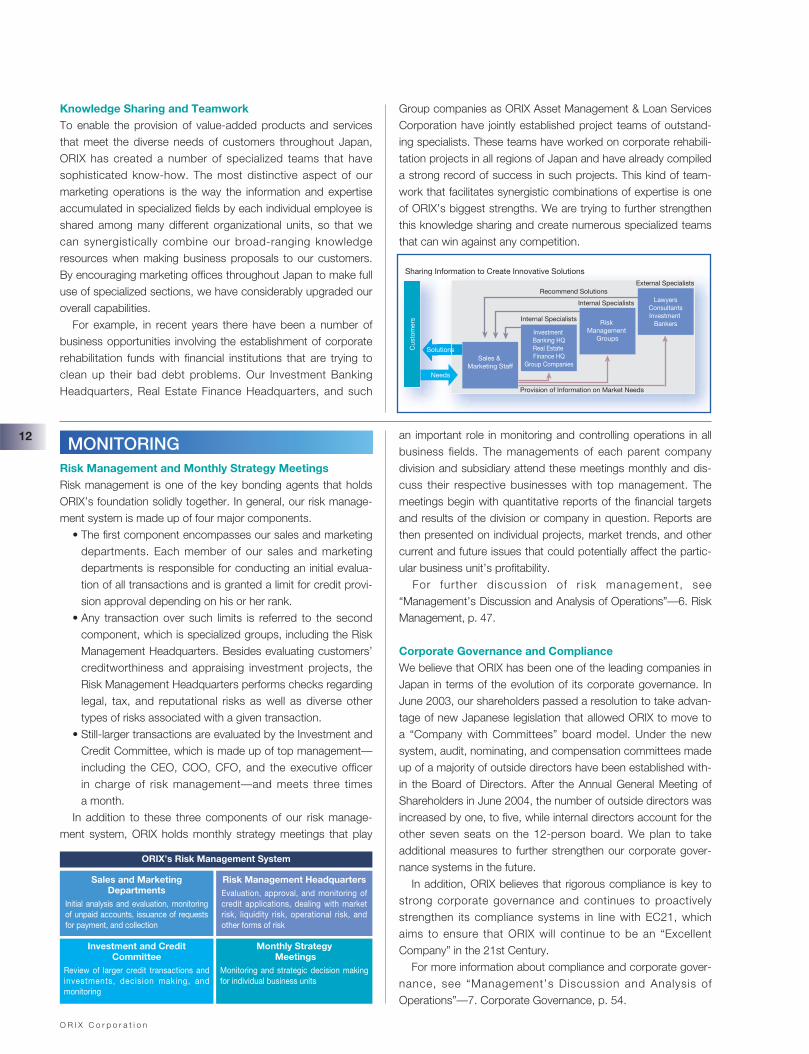
Risk Management and Monthly Strategy MeetingsRisk management is one of the key bonding agents that holdsORIX’s foundation solidly together. In general, our risk manage-ment system is made up of four major components.
• The first component encompasses our sales and marketingdepartments. Each member of our sales and marketingdepartments is responsible for conducting an initial evalua-tion of all transactions and is granted a limit for credit provi-sion approval depending on his or her rank.
• Any transaction over such limits is referred to the secondcomponent, which is specialized groups, including the RiskManagement Headquarters. Besides evaluating customers’creditworthiness and appraising investment projects, theRisk Management Headquarters performs checks regardinglegal, tax, and reputational risks as well as diverse othertypes of risks associated with a given transaction.
• Still-larger transactions are evaluated by the Investment andCredit Committee, which is made up of top management—including the CEO, COO, CFO, and the executive officerin charge of risk management—and meets three timesa month.
In addition to these three components of our risk manage-ment system, ORIX holds monthly strategy meetings that play
an important role in monitoring and controlling operations in allbusiness fields. The managements of each parent companydivision and subsidiary attend these meetings monthly and dis-cuss their respective businesses with top management. Themeetings begin with quantitative reports of the financial targetsand results of the division or company in question. Reports arethen presented on individual projects, market trends, and othercurrent and future issues that could potentially affect the partic-ular business unit’s profitability.
For further discussion of r isk management, see“Management’s Discussion and Analysis of Operations”—6. RiskManagement, p. 47.
Corporate Governance and ComplianceWe believe that ORIX has been one of the leading companies inJapan in terms of the evolution of its corporate governance. InJune 2003, our shareholders passed a resolution to take advan-tage of new Japanese legislation that allowed ORIX to move toa “Company with Committees” board model. Under the newsystem, audit, nominating, and compensation committees madeup of a majority of outside directors have been established with-in the Board of Directors. After the Annual General Meeting ofShareholders in June 2004, the number of outside directors wasincreased by one, to five, while internal directors account for theother seven seats on the 12-person board. We plan to takeadditional measures to further strengthen our corporate gover-nance systems in the future.
In addition, ORIX believes that rigorous compliance is key tostrong corporate governance and continues to proactivelystrengthen its compliance systems in line with EC21, whichaims to ensure that ORIX will continue to be an “ExcellentCompany” in the 21st Century.
For more information about compliance and corporate gover-nance, see “Management’s Discussion and Analysis ofOperations”—7. Corporate Governance, p. 54.
ORIX’s Risk Management System
Sales and MarketingDepartments
Initial analysis and evaluation, monitoringof unpaid accounts, issuance of requestsfor payment, and collection
Investment and CreditCommittee
Review of larger credit transactions andinvestments, decision making, andmonitoring
Risk Management HeadquartersEvaluation, approval, and monitoring ofcredit applications, dealing with marketrisk, liquidity risk, operational risk, andother forms of risk
Monthly StrategyMeetings
Monitoring and strategic decision makingfor individual business units
Sales & Marketing Staff
Risk Management
GroupsInvestment Banking HQReal Estate Finance HQ
Group Companies
Solutions
Needs
Sharing Information to Create Innovative Solutions
Provision of Information on Market Needs
Internal Specialists
Internal Specialists
External SpecialistsRecommend Solutions
LawyersConsultantsInvestment
Bankers
Cus
tom
ers
O R I X C o r p o r a t i o n
13
’00 ’01 ’02 ’03 ’04
(Billions of yen)
Cumulative Total of Nonperforming Loans Purchased
0
1,000
2,000
3,000
4,000
Face Value
3,300
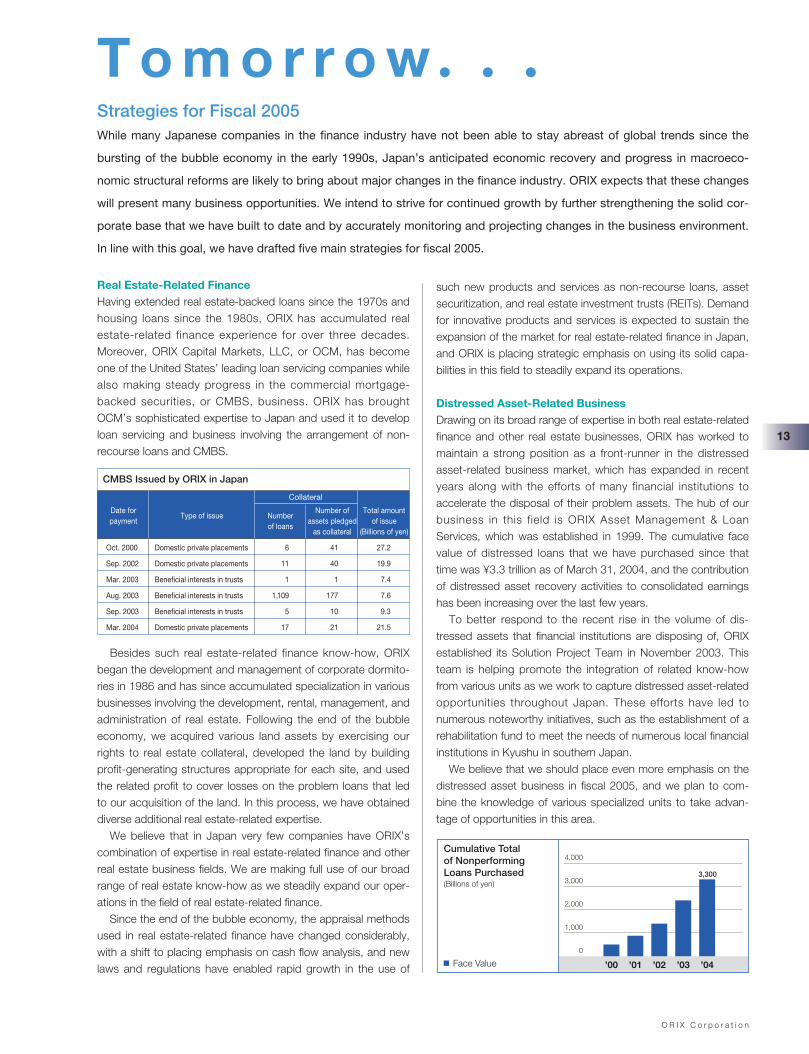
Real Estate-Related FinanceHaving extended real estate-backed loans since the 1970s andhousing loans since the 1980s, ORIX has accumulated realestate-related finance experience for over three decades.Moreover, ORIX Capital Markets, LLC, or OCM, has becomeone of the United States’ leading loan servicing companies whilealso making steady progress in the commercial mortgage-backed securities, or CMBS, business. ORIX has broughtOCM’s sophisticated expertise to Japan and used it to developloan servicing and business involving the arrangement of non-recourse loans and CMBS.
such new products and services as non-recourse loans, assetsecuritization, and real estate investment trusts (REITs). Demandfor innovative products and services is expected to sustain theexpansion of the market for real estate-related finance in Japan,and ORIX is placing strategic emphasis on using its solid capa-bilities in this field to steadily expand its operations.
Distressed Asset-Related BusinessDrawing on its broad range of expertise in both real estate-relatedfinance and other real estate businesses, ORIX has worked tomaintain a strong position as a front-runner in the distressedasset-related business market, which has expanded in recentyears along with the efforts of many financial institutions toaccelerate the disposal of their problem assets. The hub of ourbusiness in this field is ORIX Asset Management & LoanServices, which was established in 1999. The cumulative facevalue of distressed loans that we have purchased since thattime was ¥3.3 trillion as of March 31, 2004, and the contributionof distressed asset recovery activities to consolidated earningshas been increasing over the last few years.
To better respond to the recent rise in the volume of dis-tressed assets that financial institutions are disposing of, ORIXestablished its Solution Project Team in November 2003. Thisteam is helping promote the integration of related know-howfrom various units as we work to capture distressed asset-relatedopportunities throughout Japan. These efforts have led tonumerous noteworthy initiatives, such as the establishment of arehabilitation fund to meet the needs of numerous local financialinstitutions in Kyushu in southern Japan.
We believe that we should place even more emphasis on thedistressed asset business in fiscal 2005, and we plan to com-bine the knowledge of various specialized units to take advan-tage of opportunities in this area.
T o m o r r o w � � �Strategies for Fiscal 2005While many Japanese companies in the finance industry have not been able to stay abreast of global trends since the
bursting of the bubble economy in the early 1990s, Japan’s anticipated economic recovery and progress in macroeco-
nomic structural reforms are likely to bring about major changes in the finance industry. ORIX expects that these changes
will present many business opportunities. We intend to strive for continued growth by further strengthening the solid cor-
porate base that we have built to date and by accurately monitoring and projecting changes in the business environment.
In line with this goal, we have drafted five main strategies for fiscal 2005.
CMBS Issued by ORIX in Japan
Collateral
Date for Type of issue
Number of Total amount payment
Number assets pledged of issue
of loansas collateral (Billions of yen)
Oct. 2000 Domestic private placements 6 41 27.2
Sep. 2002 Domestic private placements 11 40 19.9
Mar. 2003 Beneficial interests in trusts 1 1 7.4
Aug. 2003 Beneficial interests in trusts 1,109 177 7.6
Sep. 2003 Beneficial interests in trusts 5 10 9.3
Mar. 2004 Domestic private placements 17 21 21.5
Besides such real estate-related finance know-how, ORIXbegan the development and management of corporate dormito-ries in 1986 and has since accumulated specialization in variousbusinesses involving the development, rental, management, andadministration of real estate. Following the end of the bubbleeconomy, we acquired various land assets by exercising ourrights to real estate collateral, developed the land by buildingprofit-generating structures appropriate for each site, and usedthe related profit to cover losses on the problem loans that ledto our acquisition of the land. In this process, we have obtaineddiverse additional real estate-related expertise.
We believe that in Japan very few companies have ORIX’scombination of expertise in real estate-related finance and otherreal estate business fields. We are making full use of our broadrange of real estate know-how as we steadily expand our oper-ations in the field of real estate-related finance.
Since the end of the bubble economy, the appraisal methodsused in real estate-related finance have changed considerably,with a shift to placing emphasis on cash flow analysis, and newlaws and regulations have enabled rapid growth in the use of
O R I X C o r p o r a t i o n
14
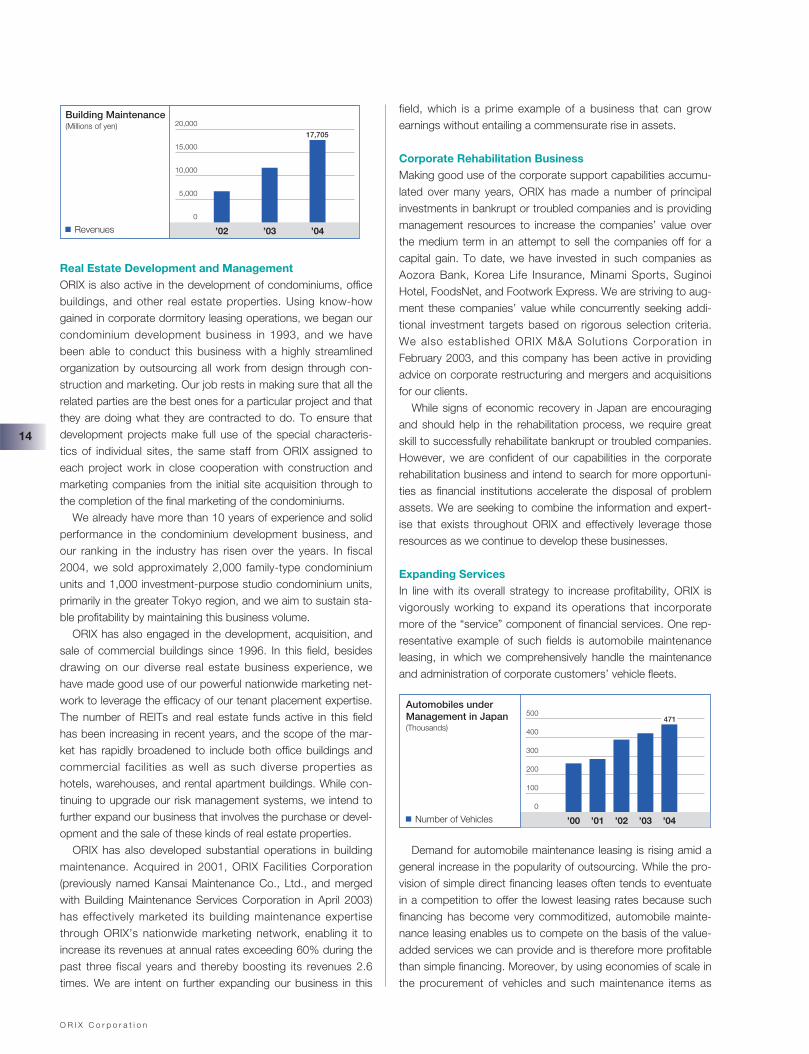
’02 ’03 ’04
(Millions of yen)Building Maintenance
0
5,000
10,000
15,000
20,000
Revenues
17,705
Real Estate Development and Management ORIX is also active in the development of condominiums, officebuildings, and other real estate properties. Using know-howgained in corporate dormitory leasing operations, we began ourcondominium development business in 1993, and we havebeen able to conduct this business with a highly streamlinedorganization by outsourcing all work from design through con-struction and marketing. Our job rests in making sure that all therelated parties are the best ones for a particular project and thatthey are doing what they are contracted to do. To ensure thatdevelopment projects make full use of the special characteris-tics of individual sites, the same staff from ORIX assigned toeach project work in close cooperation with construction andmarketing companies from the initial site acquisition through tothe completion of the final marketing of the condominiums.
We already have more than 10 years of experience and solidperformance in the condominium development business, andour ranking in the industry has risen over the years. In fiscal2004, we sold approximately 2,000 family-type condominiumunits and 1,000 investment-purpose studio condominium units,primarily in the greater Tokyo region, and we aim to sustain sta-ble profitability by maintaining this business volume.
ORIX has also engaged in the development, acquisition, andsale of commercial buildings since 1996. In this field, besidesdrawing on our diverse real estate business experience, wehave made good use of our powerful nationwide marketing net-work to leverage the efficacy of our tenant placement expertise.The number of REITs and real estate funds active in this fieldhas been increasing in recent years, and the scope of the mar-ket has rapidly broadened to include both office buildings andcommercial facilities as well as such diverse properties ashotels, warehouses, and rental apartment buildings. While con-tinuing to upgrade our risk management systems, we intend tofurther expand our business that involves the purchase or devel-opment and the sale of these kinds of real estate properties.
ORIX has also developed substantial operations in buildingmaintenance. Acquired in 2001, ORIX Facilities Corporation(previously named Kansai Maintenance Co., Ltd., and mergedwith Building Maintenance Services Corporation in April 2003)has effectively marketed its building maintenance expertisethrough ORIX’s nationwide marketing network, enabling it toincrease its revenues at annual rates exceeding 60% during thepast three fiscal years and thereby boosting its revenues 2.6times. We are intent on further expanding our business in this
field, which is a prime example of a business that can growearnings without entailing a commensurate rise in assets.
Corporate Rehabilitation BusinessMaking good use of the corporate support capabilities accumu-lated over many years, ORIX has made a number of principalinvestments in bankrupt or troubled companies and is providingmanagement resources to increase the companies’ value overthe medium term in an attempt to sell the companies off for acapital gain. To date, we have invested in such companies asAozora Bank, Korea Life Insurance, Minami Sports, SuginoiHotel, FoodsNet, and Footwork Express. We are striving to aug-ment these companies’ value while concurrently seeking addi-tional investment targets based on rigorous selection criteria.We also established ORIX M&A Solutions Corporation inFebruary 2003, and this company has been active in providingadvice on corporate restructuring and mergers and acquisitionsfor our clients.
While signs of economic recovery in Japan are encouragingand should help in the rehabilitation process, we require greatskill to successfully rehabilitate bankrupt or troubled companies.However, we are confident of our capabilities in the corporaterehabilitation business and intend to search for more opportuni-ties as financial institutions accelerate the disposal of problemassets. We are seeking to combine the information and expert-ise that exists throughout ORIX and effectively leverage thoseresources as we continue to develop these businesses.
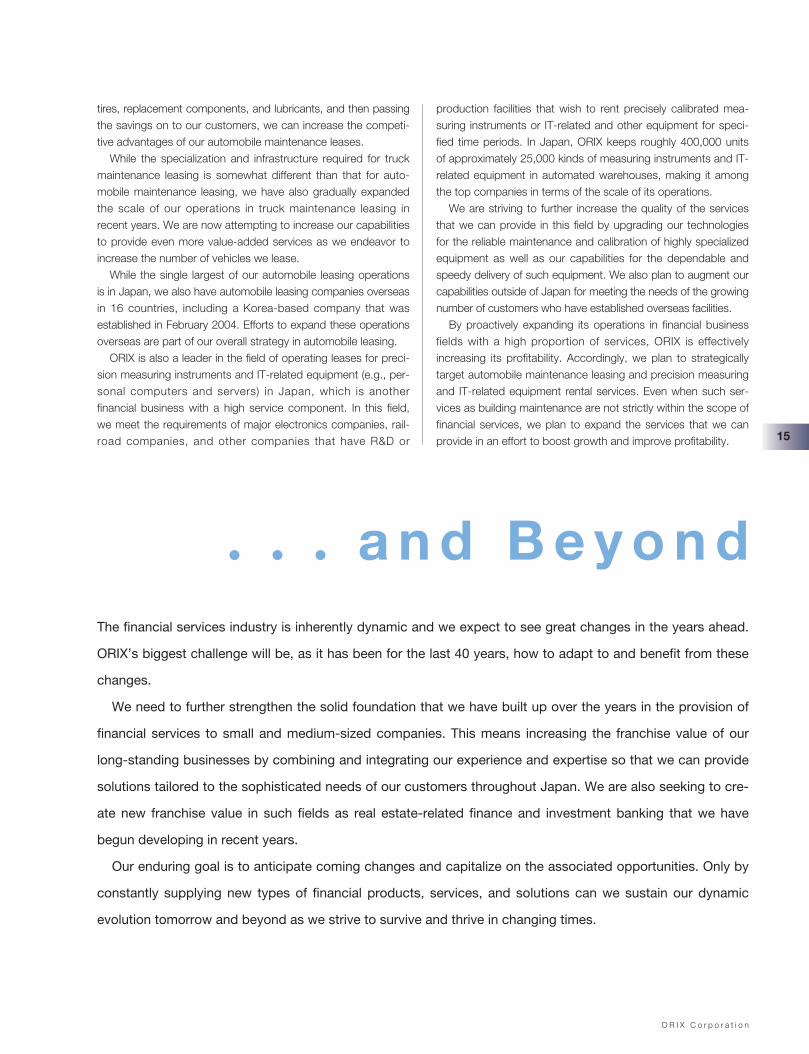
Expanding ServicesIn line with its overall strategy to increase profitability, ORIX isvigorously working to expand its operations that incorporatemore of the “service” component of financial services. One rep-resentative example of such fields is automobile maintenanceleasing, in which we comprehensively handle the maintenanceand administration of corporate customers’ vehicle fleets.
’00 ’01 ’02 ’03 ’04
(Thousands)
Automobiles under Management in Japan
0
100
200
300
400
500
Number of Vehicles
471
Demand for automobile maintenance leasing is rising amid ageneral increase in the popularity of outsourcing. While the pro-vision of simple direct financing leases often tends to eventuatein a competition to offer the lowest leasing rates because suchfinancing has become very commoditized, automobile mainte-nance leasing enables us to compete on the basis of the value-added services we can provide and is therefore more profitablethan simple financing. Moreover, by using economies of scale inthe procurement of vehicles and such maintenance items as
O R I X C o r p o r a t i o n
15
tires, replacement components, and lubricants, and then passingthe savings on to our customers, we can increase the competi-tive advantages of our automobile maintenance leases.
While the specialization and infrastructure required for truckmaintenance leasing is somewhat different than that for auto-mobile maintenance leasing, we have also gradually expandedthe scale of our operations in truck maintenance leasing inrecent years. We are now attempting to increase our capabilitiesto provide even more value-added services as we endeavor toincrease the number of vehicles we lease.
While the single largest of our automobile leasing operationsis in Japan, we also have automobile leasing companies overseasin 16 countries, including a Korea-based company that wasestablished in February 2004. Efforts to expand these operationsoverseas are part of our overall strategy in automobile leasing.
ORIX is also a leader in the field of operating leases for preci-sion measuring instruments and IT-related equipment (e.g., per-sonal computers and servers) in Japan, which is anotherfinancial business with a high service component. In this field,we meet the requirements of major electronics companies, rail-road companies, and other companies that have R&D or
� � � a n d B e y o n dThe financial services industry is inherently dynamic and we expect to see great changes in the years ahead.
ORIX’s biggest challenge will be, as it has been for the last 40 years, how to adapt to and benefit from these
changes.
We need to further strengthen the solid foundation that we have built up over the years in the provision of
financial services to small and medium-sized companies. This means increasing the franchise value of our
long-standing businesses by combining and integrating our experience and expertise so that we can provide
solutions tailored to the sophisticated needs of our customers throughout Japan. We are also seeking to cre-
ate new franchise value in such fields as real estate-related finance and investment banking that we have
begun developing in recent years.
Our enduring goal is to anticipate coming changes and capitalize on the associated opportunities. Only by
constantly supplying new types of financial products, services, and solutions can we sustain our dynamic
evolution tomorrow and beyond as we strive to survive and thrive in changing times.
production facilities that wish to rent precisely calibrated mea-suring instruments or IT-related and other equipment for speci-fied time periods. In Japan, ORIX keeps roughly 400,000 unitsof approximately 25,000 kinds of measuring instruments and IT-related equipment in automated warehouses, making it amongthe top companies in terms of the scale of its operations.
We are striving to further increase the quality of the servicesthat we can provide in this field by upgrading our technologiesfor the reliable maintenance and calibration of highly specializedequipment as well as our capabilities for the dependable andspeedy delivery of such equipment. We also plan to augment ourcapabilities outside of Japan for meeting the needs of the growingnumber of customers who have established overseas facilities.
By proactively expanding its operations in financial businessfields with a high proportion of services, ORIX is effectivelyincreasing its profitability. Accordingly, we plan to strategicallytarget automobile maintenance leasing and precision measuringand IT-related equipment rental services. Even when such ser-vices as building maintenance are not strictly within the scope offinancial services, we plan to expand the services that we canprovide in an effort to boost growth and improve profitability.
G U I D E T O O R I X ’ S F I N A N C I A L S T A T E M E N T S
O R I X C o r p o r a t i o n
Revenues/Operating Assets & Segment Information
Since our establishment in 1964, we have used accounting prin-
ciples generally accepted in the United States (U.S. GAAP), and,
since our listing on the New York Stock Exchange (NYSE) in
September 1998, we have filed financial reports under U.S.
GAAP with the United States Securit ies and Exchange
Commission (SEC) and the NYSE. Financial information used
internally by management and information provided to share-
holders is based on U.S. GAAP.
Under U.S. GAAP, we are required to disclose information
based upon the individual items for revenues and operating
assets in our consolidated statements of income and consolidat-
ed balance sheets. In the notes to our consolidated financial
statements, we are also required to disclose segment information.
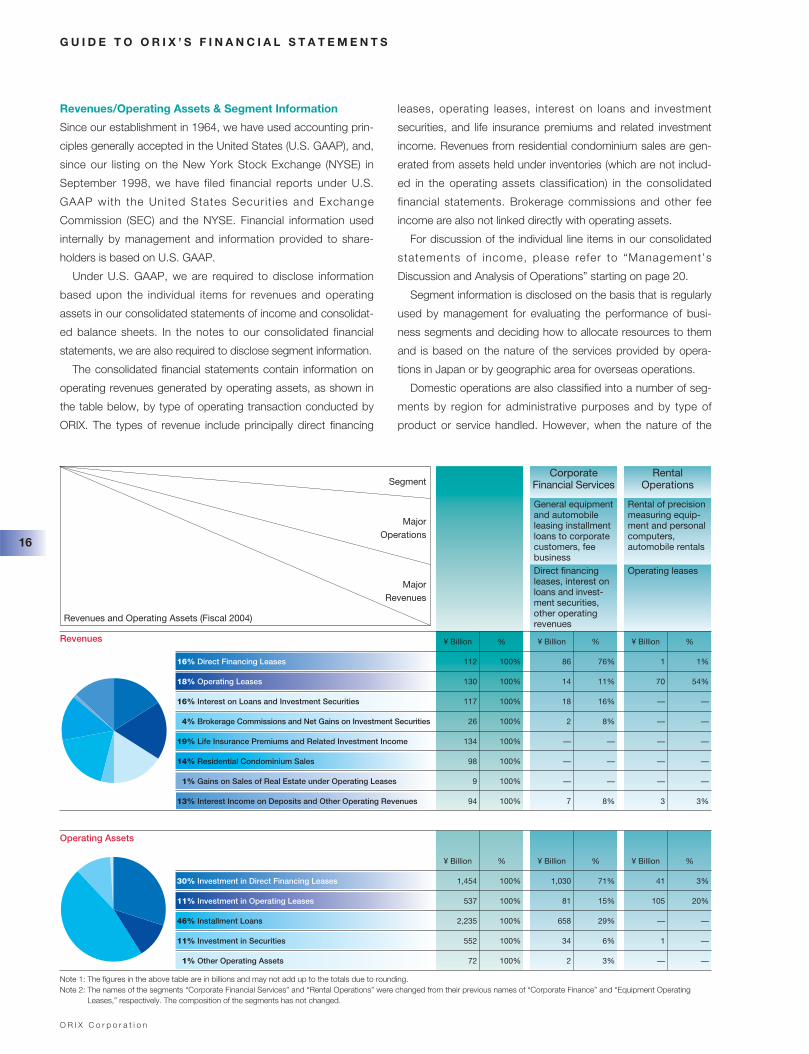
The consolidated financial statements contain information on
operating revenues generated by operating assets, as shown in
the table below, by type of operating transaction conducted by
ORIX. The types of revenue include principally direct financing
leases, operating leases, interest on loans and investment
securities, and life insurance premiums and related investment
income. Revenues from residential condominium sales are gen-
erated from assets held under inventories (which are not includ-
ed in the operating assets classification) in the consolidated
financial statements. Brokerage commissions and other fee
income are also not linked directly with operating assets.
For discussion of the individual line items in our consolidated
statements of income, please refer to “Management’s
Discussion and Analysis of Operations” starting on page 20.
Segment information is disclosed on the basis that is regularly
used by management for evaluating the performance of busi-
ness segments and deciding how to allocate resources to them
and is based on the nature of the services provided by opera-
tions in Japan or by geographic area for overseas operations.
Domestic operations are also classified into a number of seg-
ments by region for administrative purposes and by type of
product or service handled. However, when the nature of the
CorporateFinancial Services
General equipmentand automobileleasing installmentloans to corporatecustomers, feebusinessDirect financingleases, interest onloans and invest-ment securities,other operatingrevenues
Rental Operations
Rental of precisionmeasuring equip-ment and personalcomputers,automobile rentals
Operating leases
¥ Billion %
112 100%
130 100%
117 100%
26 100%
134 100%
98 100%
9 100%
94 100%
¥ Billion %
1,454 100%
537 100%
2,235 100%
552 100%
72 100%
16% Direct Financing Leases
18% Operating Leases
16% Interest on Loans and Investment Securities
4% Brokerage Commissions and Net Gains on Investment Securities
19% Life Insurance Premiums and Related Investment Income
14% Residential Condominium Sales
1% Gains on Sales of Real Estate under Operating Leases
13% Interest Income on Deposits and Other Operating Revenues
30% Investment in Direct Financing Leases
11% Investment in Operating Leases
46% Installment Loans
11% Investment in Securities
1% Other Operating Assets
¥ Billion %
86 76%
14 11%
18 16%
2 8%
— —
— —
— —
7 8%
¥ Billion %
1,030 71%
81 15%
658 29%
34 6%
2 3%
¥ Billion %
1 1%
70 54%
— —
— —
— —
— —
— —
3 3%
¥ Billion %
41 3%
105 20%
— —
1 —
— —
Revenues
Operating Assets
Segment
Major Revenues
Major Operations
Revenues and Operating Assets (Fiscal 2004)
Note 1: The figures in the above table are in billions and may not add up to the totals due to rounding.Note 2: The names of the segments “Corporate Financial Services” and “Rental Operations” were changed from their previous names of “Corporate Finance” and “Equipment Operating
Leases,” respectively. The composition of the segments has not changed.
16
O R I X C o r p o r a t i o n
transactions, the types of customers, and the operating environ-
ment are similar, certain such items are included in one segment.
Segment information is classified according to businesses
defined by management for performance evaluation purposes,
rather than by type of transaction.
Each segment conducts a range of transactions in response
to customer needs. For example, in the Corporate Financial
Services segment, our strategy is to provide small and medium-
sized corporate customers with not only direct financing leases
but also loans, life insurance policies, investment products, and
other products and services. Revenues from this segment
recorded in the consolidated statements of income are generat-
ed by transactions that yield direct financing lease revenues,
interest on loans, and other forms of operating revenues. From
an accounting perspective, these are different types of transac-
tions and must be recorded as different items in our consolidat-
ed statements of income. However, from a management
perspective, each is a tool for satisfying customer needs. When
evaluating the performance of a segment, different transactions
may belong to the same set of tools for meeting customer
needs and therefore are included in the same segment.
On the other hand, a single item on our consolidated state-
ments of income often appears in more than one segment. For
example, interest on loans from all sources is accounted for in
one category as “interest on loans and investment securities” on
our consolidated statements of income, but the types of loans,
borrowers, and other attributes may differ. Therefore, even
though all loan interest is combined into a single category for
accounting purposes, interest on loans and investment securi-
ties often appears in more than one segment category.
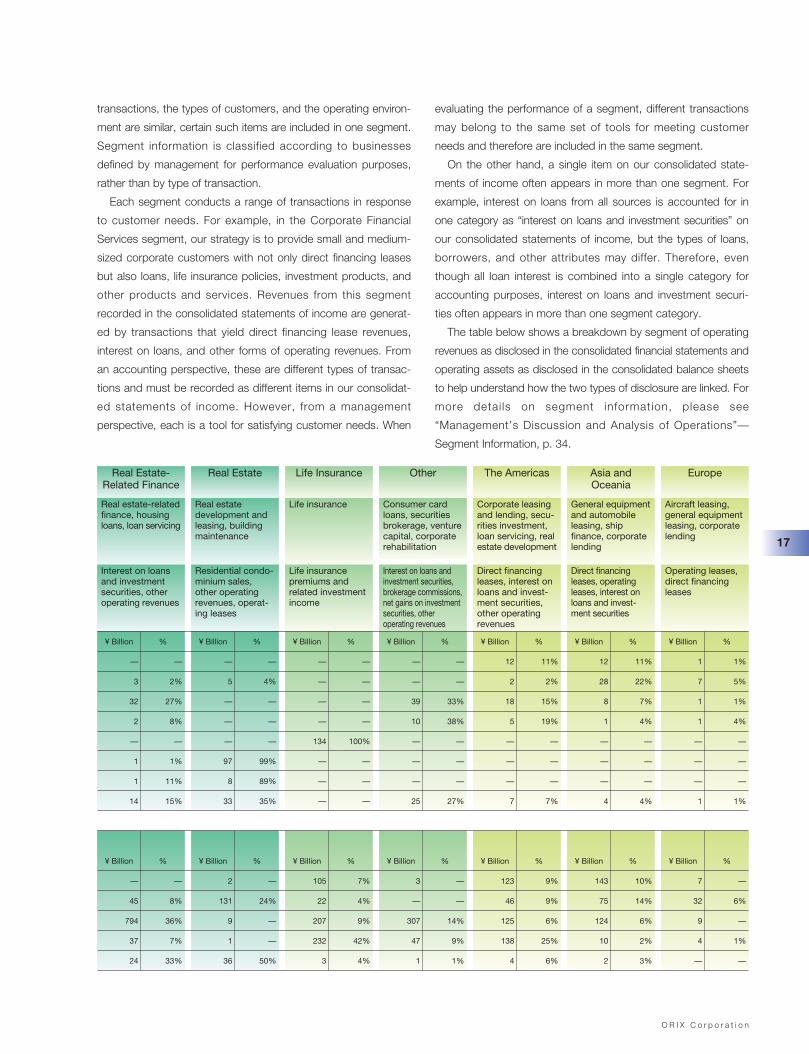
The table below shows a breakdown by segment of operating
revenues as disclosed in the consolidated financial statements and
operating assets as disclosed in the consolidated balance sheets
to help understand how the two types of disclosure are linked. For
more detai ls on segment information, please see
“Management’s Discussion and Analysis of Operations”—
Segment Information, p. 34.
Operating leases,direct financingleases
Direct financingleases, interest onloans and invest-ment securities,other operatingrevenues
Residential condo-minium sales,other operatingrevenues, operat-ing leases
Life insurancepremiums andrelated investmentincome
Interest on loans andinvestment securities,brokerage commissions,net gains on investmentsecurities, otheroperating revenues
Direct financingleases, operatingleases, interest onloans and invest-ment securities
Europe
Aircraft leasing,general equipmentleasing, corporatelending
Real Estate-Related Finance
Real estate-relatedfinance, housingloans, loan servicing
Interest on loansand investmentsecurities, otheroperating revenues
Real Estate
Real estatedevelopment andleasing, buildingmaintenance
Life Insurance
Life insurance
Other
Consumer cardloans, securitiesbrokerage, venturecapital, corporaterehabilitation
The Americas
Corporate leasingand lending, secu-rities investment,loan servicing, realestate development
Asia andOceania
General equipmentand automobileleasing, shipfinance, corporatelending
¥ Billion %
— —
3 2%
32 27%
2 8%
— —
1 1%
1 11%
14 15%
¥ Billion %
— —
45 8%
794 36%
37 7%
24 33%
¥ Billion %
— —
5 4%
— —
— —
— —
97 99%
8 89%
33 35%
¥ Billion %
2 —
131 24%
9 —
1 —
36 50%
¥ Billion %
— —
— —
— —
— —
134 100%
— —
— —
— —
¥ Billion %
105 7%
22 4%
207 9%
232 42%
3 4%
¥ Billion %
— —
— —
39 33%
10 38%
— —
— —
— —
25 27%
¥ Billion %
3 —
— —
307 14%
47 9%
1 1%
¥ Billion %
12 11%
2 2%
18 15%
5 19%
— —
— —
— —
7 7%
¥ Billion %
123 9%
46 9%
125 6%
138 25%
4 6%
¥ Billion %
12 11%
28 22%
8 7%
1 4%
— —
— —
— —
4 4%
¥ Billion %
143 10%
75 14%
124 6%
10 2%
2 3%
¥ Billion %
1 1%
7 5%
1 1%
1 4%
— —
— —
— —
1 1%
¥ Billion %
7 —
32 6%
9 —
4 1%
— —
17
O R I X C o r p o r a t i o n
G U I D E T O O R I X ’ S F I N A N C I A L S T A T E M E N T S ( C O N T I N U E D )
Our revenues are broken down based on how they are accounted for under U.S. GAAP. Since we are engaged in a diverse range of
businesses, operating revenues are classified into nine accounting items. There are 31 items on the consolidated statements of
income, including 25 accounting items. (For individual items, please refer to “Management’s Discussion and Analysis of Operations”
on page 20 and the “Notes to Consolidated Financial Statements” starting on page 67.) We provide detailed consolidated statements
of income for investors as required under U.S. GAAP, but, because the items are numerous, the analysis of our consolidated state-
ments of income can become quite complex. One approach to analyzing the consolidated financial statements is to look first at the
three major items of our statements of income and then further break these down into ten items as described below and on the oppo-
site page. Of course, this is not intended to be a substitute for the consolidated statements of income under U.S. GAAP, but it may
provide an aid in analyzing ORIX’s earnings.
1) Contributions to earnings from revenues, equity method affiliates, and others (colored yellow in the following examples)
2) Deductions from earnings for expenses, income taxes, and others (colored blue in the following examples)
3) Operating income, income before income taxes, and net income (colored green in the following examples)
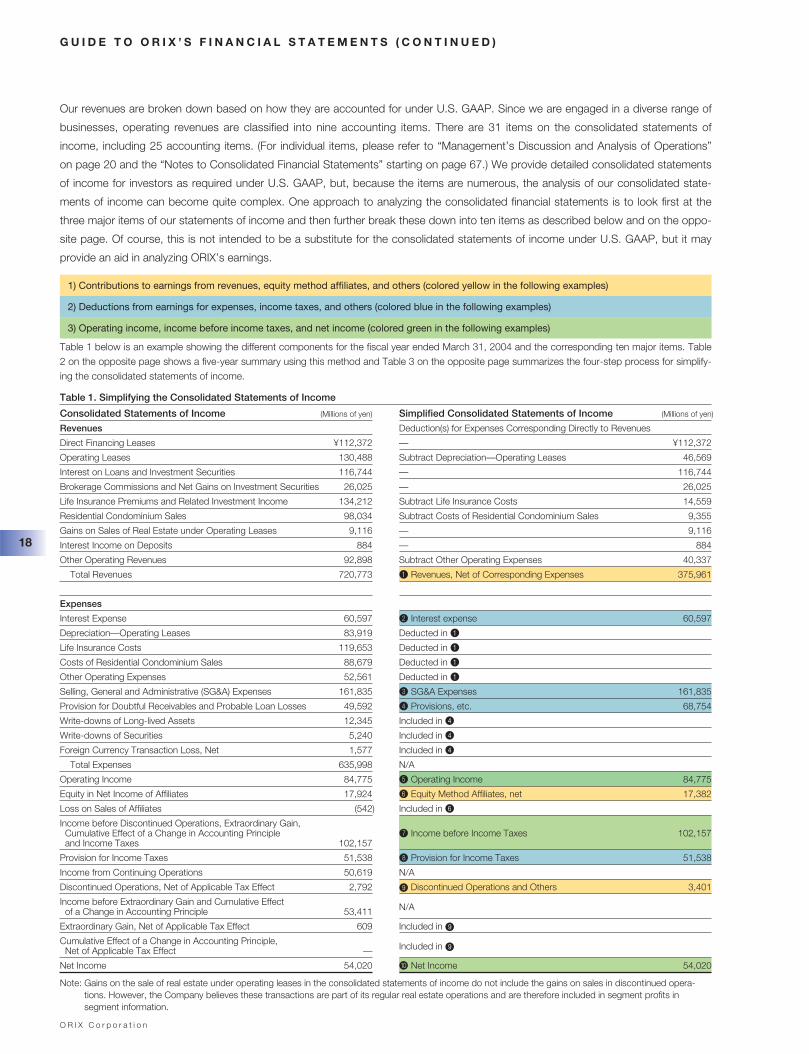
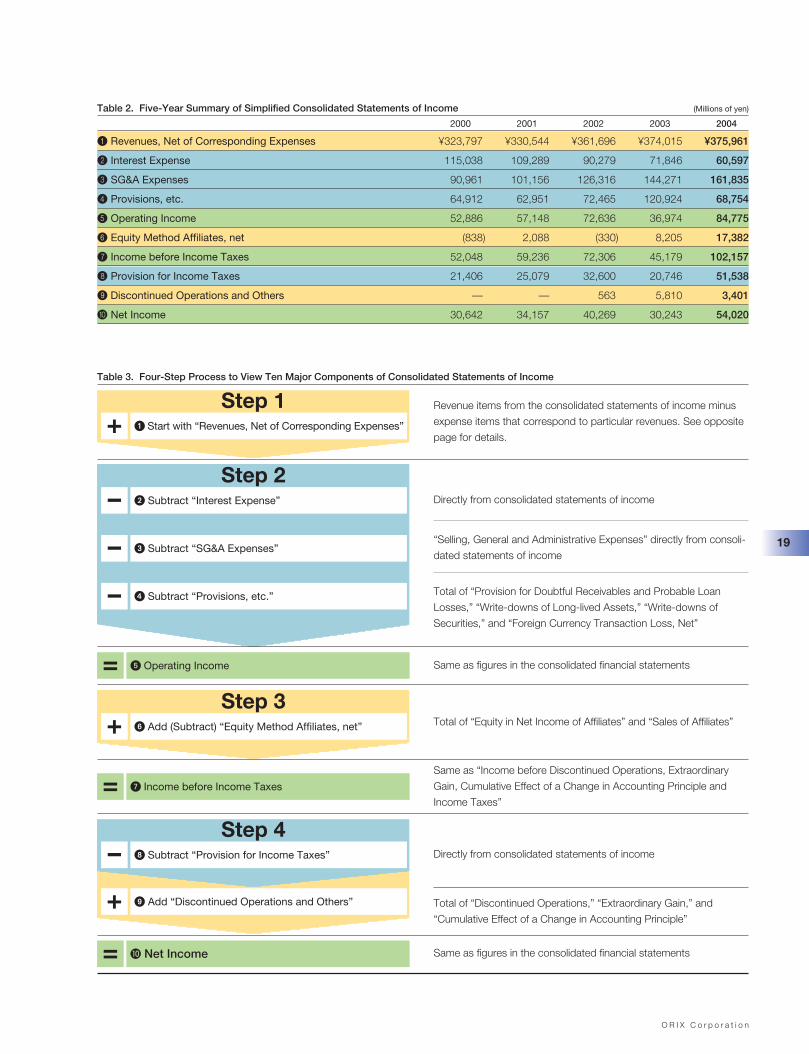
Table 1 below is an example showing the different components for the fiscal year ended March 31, 2004 and the corresponding ten major items. Table2 on the opposite page shows a five-year summary using this method and Table 3 on the opposite page summarizes the four-step process for simplify-ing the consolidated statements of income.
Consolidated Statements of Income (Millions of yen)
Revenues
Direct Financing Leases ¥112,372
Operating Leases 130,488
Interest on Loans and Investment Securities 116,744
Brokerage Commissions and Net Gains on Investment Securities 26,025
Life Insurance Premiums and Related Investment Income 134,212
Residential Condominium Sales 98,034
Gains on Sales of Real Estate under Operating Leases 9,116
Interest Income on Deposits 884
Other Operating Revenues 92,898
Total Revenues 720,773
Expenses
Interest Expense 60,597
Depreciation—Operating Leases 83,919
Life Insurance Costs 119,653
Costs of Residential Condominium Sales 88,679
Other Operating Expenses 52,561
Selling, General and Administrative (SG&A) Expenses 161,835
Provision for Doubtful Receivables and Probable Loan Losses 49,592
Write-downs of Long-lived Assets 12,345
Write-downs of Securities 5,240
Foreign Currency Transaction Loss, Net 1,577
Total Expenses 635,998
Operating Income 84,775
Equity in Net Income of Affiliates 17,924
Loss on Sales of Affiliates (542)
Income before Discontinued Operations, Extraordinary Gain, Cumulative Effect of a Change in Accounting Principle and Income Taxes 102,157
Provision for Income Taxes 51,538
Income from Continuing Operations 50,619
Discontinued Operations, Net of Applicable Tax Effect 2,792
Income before Extraordinary Gain and Cumulative Effect of a Change in Accounting Principle 53,411
Extraordinary Gain, Net of Applicable Tax Effect 609
Cumulative Effect of a Change in Accounting Principle, Net of Applicable Tax Effect —
Net Income 54,020
Simplified Consolidated Statements of Income (Millions of yen)
Deduction(s) for Expenses Corresponding Directly to Revenues
— ¥112,372
Subtract Depreciation—Operating Leases 46,569
— 116,744
— 26,025
Subtract Life Insurance Costs 14,559
Subtract Costs of Residential Condominium Sales 9,355
— 9,116
— 884
Subtract Other Operating Expenses 40,337
1 Revenues, Net of Corresponding Expenses 375,961
2 Interest expense 60,597
Deducted in 1
Deducted in 1
Deducted in 1
Deducted in 1
3 SG&A Expenses 161,835
4 Provisions, etc. 68,754
Included in 4
Included in 4
Included in 4
N/A
5 Operating Income 84,775
6 Equity Method Affiliates, net 17,382
Included in 6
7 Income before Income Taxes 102,157
8 Provision for Income Taxes 51,538
N/A
9 Discontinued Operations and Others 3,401
N/A
Included in 9
Included in 9
0 Net Income 54,020
Table 1. Simplifying the Consolidated Statements of Income
Note: Gains on the sale of real estate under operating leases in the consolidated statements of income do not include the gains on sales in discontinued opera-tions. However, the Company believes these transactions are part of its regular real estate operations and are therefore included in segment profits insegment information.
18
O R I X C o r p o r a t i o n
Table 2. Five-Year Summary of Simplified Consolidated Statements of Income (Millions of yen)
2000 2001 2002 2003 2004
1 Revenues, Net of Corresponding Expenses ¥323,797 ¥330,544 ¥361,696 ¥374,015 ¥375,961
2 Interest Expense 115,038 109,289 90,279 71,846 60,597
3 SG&A Expenses 90,961 101,156 126,316 144,271 161,835
4 Provisions, etc. 64,912 62,951 72,465 120,924 68,754
5 Operating Income 52,886 57,148 72,636 36,974 84,775
6 Equity Method Affiliates, net (838) 2,088 (330) 8,205 17,382
7 Income before Income Taxes 52,048 59,236 72,306 45,179 102,157
8 Provision for Income Taxes 21,406 25,079 32,600 20,746 51,538
9 Discontinued Operations and Others — — 563 5,810 3,401
0 Net Income 30,642 34,157 40,269 30,243 54,020
Table 3. Four-Step Process to View Ten Major Components of Consolidated Statements of Income
Step 2
� Operating Income
� Subtract “Interest Expense”
� Start with “Revenues, Net of Corresponding Expenses” +
–
� Subtract “SG&A Expenses”–
� Subtract “Provisions, etc.”–
Directly from consolidated statements of income
“Selling, General and Administrative Expenses” directly from consoli-
dated statements of income
Total of “Provision for Doubtful Receivables and Probable Loan
Losses,” “Write-downs of Long-lived Assets,” “Write-downs of
Securities,” and “Foreign Currency Transaction Loss, Net”
=
Step 1
� Add (Subtract) “Equity Method Affiliates, net”+Step 3
� Income before Income Taxes=
� Net Income=
Revenue items from the consolidated statements of income minus
expense items that correspond to particular revenues. See opposite
page for details.
Same as figures in the consolidated financial statements
Total of “Equity in Net Income of Affiliates” and “Sales of Affiliates”
Total of “Discontinued Operations,” “Extraordinary Gain,” and
“Cumulative Effect of a Change in Accounting Principle”
Same as “Income before Discontinued Operations, Extraordinary
Gain, Cumulative Effect of a Change in Accounting Principle and
Income Taxes”
Directly from consolidated statements of income
Same as figures in the consolidated financial statements
Add “Discontinued Operations and Others”+
Subtract “Provision for Income Taxes”–Step 4
19
O R I X C o r p o r a t i o n
20
M A N A G E M E N T ’ S D I S C U S S I O N A N D A N A L Y S I S O F O P E R A T I O N S
1. P e r f o r m a n c e S u m m a r y
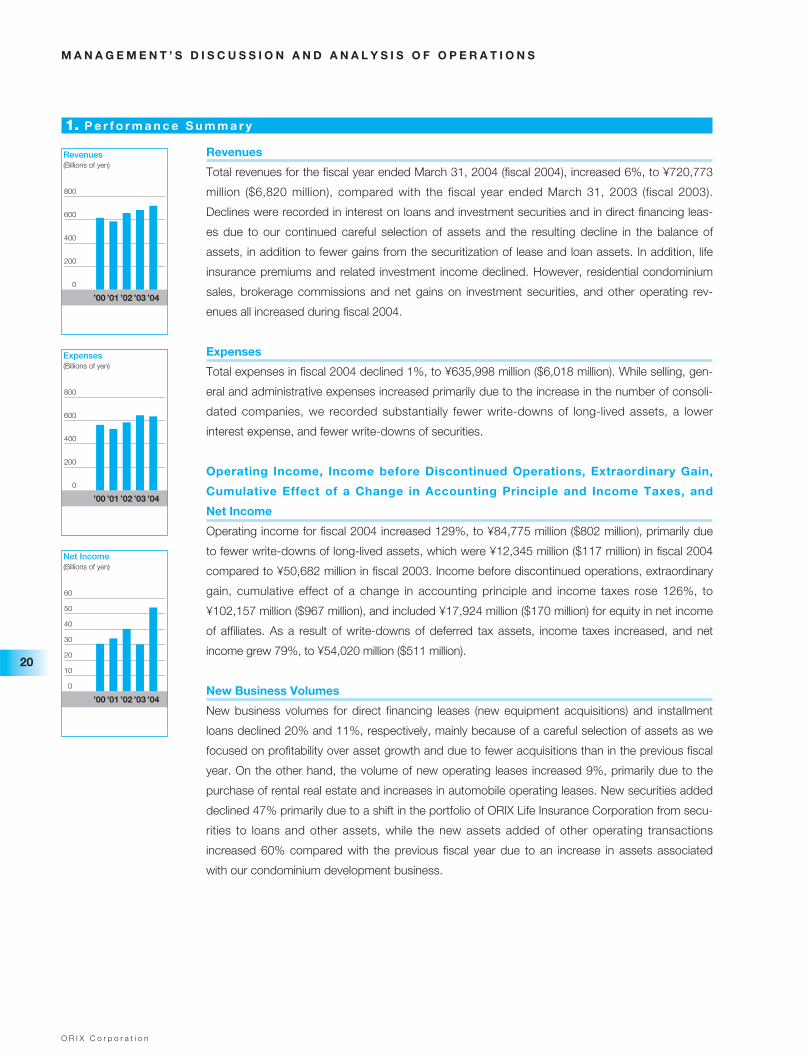
Revenues
Total revenues for the fiscal year ended March 31, 2004 (fiscal 2004), increased 6%, to ¥720,773
million ($6,820 million), compared with the fiscal year ended March 31, 2003 (fiscal 2003).
Declines were recorded in interest on loans and investment securities and in direct financing leas-
es due to our continued careful selection of assets and the resulting decline in the balance of
assets, in addition to fewer gains from the securitization of lease and loan assets. In addition, life
insurance premiums and related investment income declined. However, residential condominium
sales, brokerage commissions and net gains on investment securities, and other operating rev-
enues all increased during fiscal 2004.
Expenses
Total expenses in fiscal 2004 declined 1%, to ¥635,998 million ($6,018 million). While selling, gen-
eral and administrative expenses increased primarily due to the increase in the number of consoli-
dated companies, we recorded substantially fewer write-downs of long-lived assets, a lower
interest expense, and fewer write-downs of securities.
Operating Income, Income before Discontinued Operations, Extraordinary Gain,
Cumulative Effect of a Change in Accounting Principle and Income Taxes, and
Net Income
Operating income for fiscal 2004 increased 129%, to ¥84,775 million ($802 million), primarily due
to fewer write-downs of long-lived assets, which were ¥12,345 million ($117 million) in fiscal 2004
compared to ¥50,682 million in fiscal 2003. Income before discontinued operations, extraordinary
gain, cumulative effect of a change in accounting principle and income taxes rose 126%, to
¥102,157 million ($967 million), and included ¥17,924 million ($170 million) for equity in net income
of affiliates. As a result of write-downs of deferred tax assets, income taxes increased, and net
income grew 79%, to ¥54,020 million ($511 million).
New Business Volumes
New business volumes for direct financing leases (new equipment acquisitions) and installment
loans declined 20% and 11%, respectively, mainly because of a careful selection of assets as we
focused on profitability over asset growth and due to fewer acquisitions than in the previous fiscal
year. On the other hand, the volume of new operating leases increased 9%, primarily due to the
purchase of rental real estate and increases in automobile operating leases. New securities added
declined 47% primarily due to a shift in the portfolio of ORIX Life Insurance Corporation from secu-
rities to loans and other assets, while the new assets added of other operating transactions
increased 60% compared with the previous fiscal year due to an increase in assets associated
with our condominium development business.
’00 ’01 ’02 ’03 ’04
Revenues(Billions of yen)
0
200
400
600
800
’00 ’01 ’02 ’03 ’04
Expenses(Billions of yen)
0
200
400
600
800
0
10
20
30
40
50
60
’00 ’01 ’02 ’03 ’04
Net Income(Billions of yen)
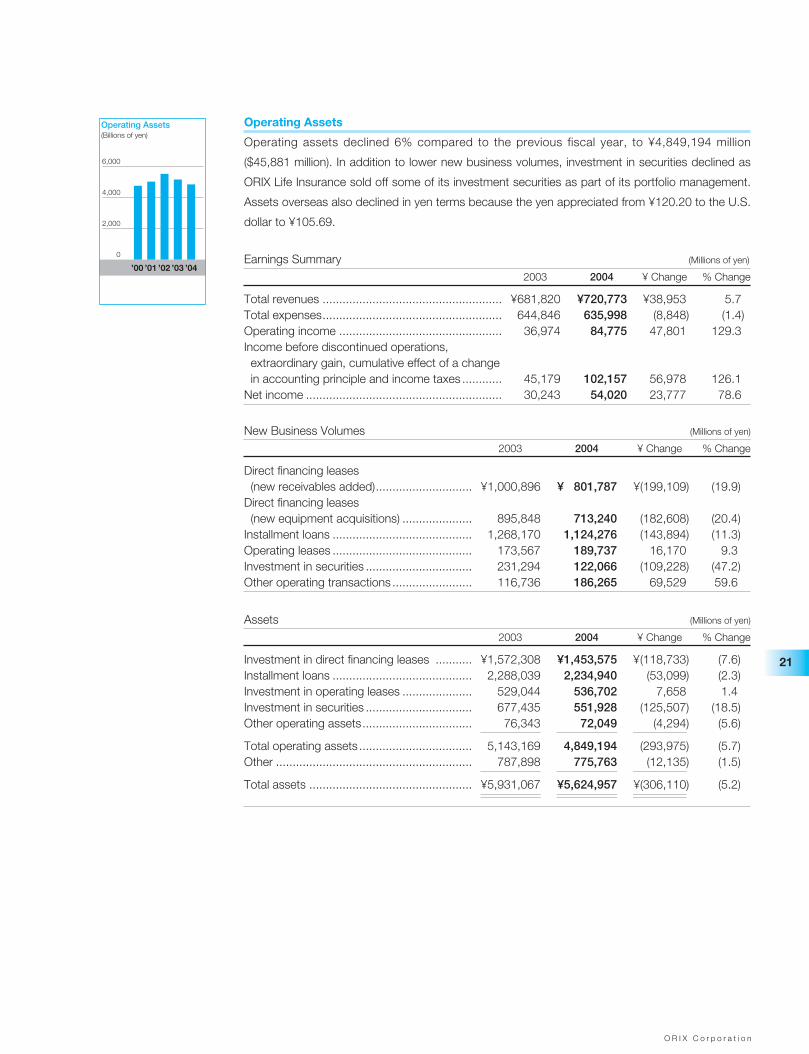
O R I X C o r p o r a t i o n
21
Operating Assets
Operating assets declined 6% compared to the previous fiscal year, to ¥4,849,194 million
($45,881 million). In addition to lower new business volumes, investment in securities declined as
ORIX Life Insurance sold off some of its investment securities as part of its portfolio management.
Assets overseas also declined in yen terms because the yen appreciated from ¥120.20 to the U.S.
dollar to ¥105.69.
Earnings Summary (Millions of yen)
2003 2004 ¥ Change % Change
Total revenues ...................................................... ¥681,820 ¥720,773 ¥38,953 5.7Total expenses...................................................... 644,846 635,998 (8,848) (1.4)Operating income ................................................. 36,974 84,775 47,801 129.3Income before discontinued operations, extraordinary gain, cumulative effect of a change in accounting principle and income taxes ............ 45,179 102,157 56,978 126.1
Net income ........................................................... 30,243 54,020 23,777 78.6
New Business Volumes (Millions of yen)
2003 2004 ¥ Change % Change
Direct financing leases (new receivables added)............................. ¥1,000,896 ¥ 801,787 ¥(199,109) (19.9)
Direct financing leases (new equipment acquisitions) ..................... 895,848 713,240 (182,608) (20.4)
Installment loans .......................................... 1,268,170 1,124,276 (143,894) (11.3)Operating leases .......................................... 173,567 189,737 16,170 9.3Investment in securities ................................ 231,294 122,066 (109,228) (47.2)Other operating transactions ........................ 116,736 186,265 69,529 59.6
Assets (Millions of yen)
2003 2004 ¥ Change % Change
Investment in direct financing leases ........... ¥1,572,308 ¥1,453,575 ¥(118,733) (7.6)Installment loans .......................................... 2,288,039 2,234,940 (53,099) (2.3)Investment in operating leases ..................... 529,044 536,702 7,658 1.4Investment in securities ................................ 677,435 551,928 (125,507) (18.5)Other operating assets................................. 76,343 72,049 (4,294) (5.6)
Total operating assets .................................. 5,143,169 4,849,194 (293,975) (5.7)Other ........................................................... 787,898 775,763 (12,135) (1.5)
Total assets ................................................. ¥5,931,067 ¥5,624,957 ¥(306,110) (5.2)
’00 ’01 ’02 ’03 ’04
Operating Assets(Billions of yen)
0
2,000
4,000
6,000
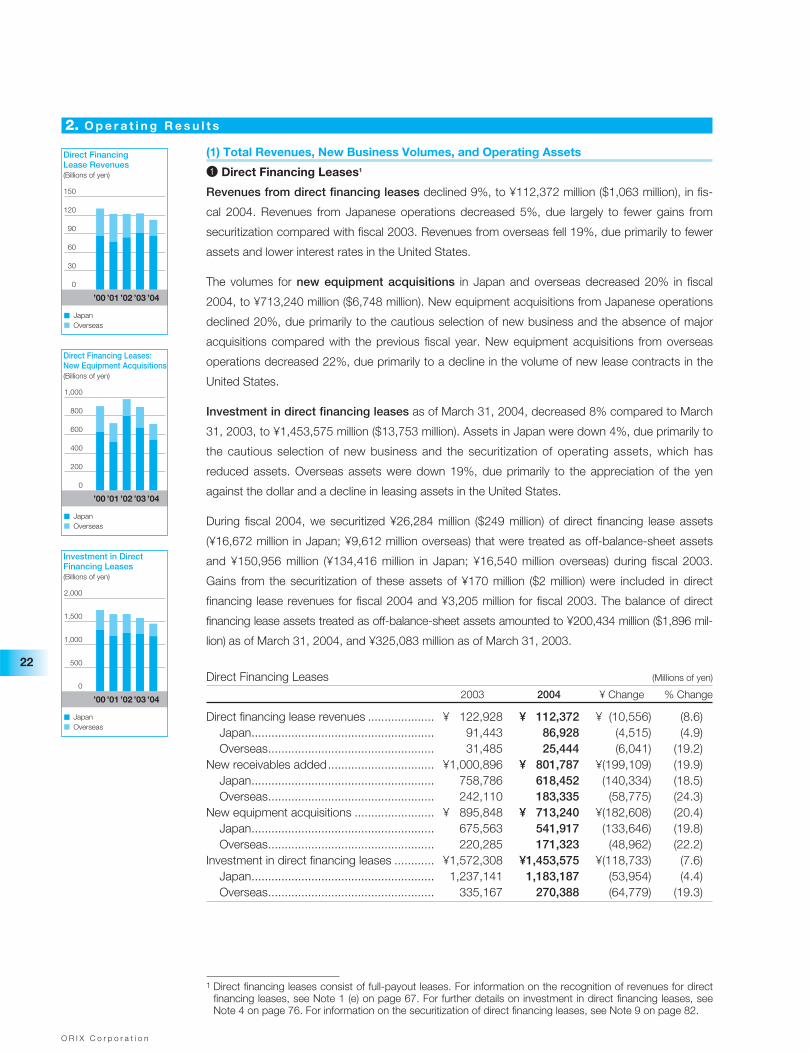
O R I X C o r p o r a t i o n
22
2. O p e r a t i n g R e s u l t s
(1) Total Revenues, New Business Volumes, and Operating Assets
1 Direct Financing Leases1
Revenues from direct financing leases declined 9%, to ¥112,372 million ($1,063 million), in fis-
cal 2004. Revenues from Japanese operations decreased 5%, due largely to fewer gains from
securitization compared with fiscal 2003. Revenues from overseas fell 19%, due primarily to fewer
assets and lower interest rates in the United States.
The volumes for new equipment acquisitions in Japan and overseas decreased 20% in fiscal
2004, to ¥713,240 million ($6,748 million). New equipment acquisitions from Japanese operations
declined 20%, due primarily to the cautious selection of new business and the absence of major
acquisitions compared with the previous fiscal year. New equipment acquisitions from overseas
operations decreased 22%, due primarily to a decline in the volume of new lease contracts in the
United States.
Investment in direct financing leases as of March 31, 2004, decreased 8% compared to March
31, 2003, to ¥1,453,575 million ($13,753 million). Assets in Japan were down 4%, due primarily to
the cautious selection of new business and the securitization of operating assets, which has
reduced assets. Overseas assets were down 19%, due primarily to the appreciation of the yen
against the dollar and a decline in leasing assets in the United States.
During fiscal 2004, we securitized ¥26,284 million ($249 million) of direct financing lease assets
(¥16,672 million in Japan; ¥9,612 million overseas) that were treated as off-balance-sheet assets
and ¥150,956 million (¥134,416 million in Japan; ¥16,540 million overseas) during fiscal 2003.
Gains from the securitization of these assets of ¥170 million ($2 million) were included in direct
financing lease revenues for fiscal 2004 and ¥3,205 million for fiscal 2003. The balance of direct
financing lease assets treated as off-balance-sheet assets amounted to ¥200,434 million ($1,896 mil-
lion) as of March 31, 2004, and ¥325,083 million as of March 31, 2003.
Direct Financing Leases (Millions of yen)
2003 2004 ¥ Change % Change
Direct financing lease revenues .................... ¥ 122,928 ¥ 112,372 ¥ (10,556) (8.6)Japan....................................................... 91,443 86,928 (4,515) (4.9)Overseas.................................................. 31,485 25,444 (6,041) (19.2)
New receivables added................................ ¥1,000,896 ¥ 801,787 ¥(199,109) (19.9)Japan....................................................... 758,786 618,452 (140,334) (18.5)Overseas.................................................. 242,110 183,335 (58,775) (24.3)
New equipment acquisitions ........................ ¥ 895,848 ¥ 713,240 ¥(182,608) (20.4)Japan....................................................... 675,563 541,917 (133,646) (19.8)Overseas.................................................. 220,285 171,323 (48,962) (22.2)
Investment in direct financing leases ............ ¥1,572,308 ¥1,453,575 ¥(118,733) (7.6)Japan....................................................... 1,237,141 1,183,187 (53,954) (4.4)Overseas.................................................. 335,167 270,388 (64,779) (19.3)
’00 ’01 ’02 ’03 ’04
Direct Financing Lease Revenues(Billions of yen)
0
30
120
60
90
150
JapanOverseas
’00 ’01 ’02 ’03 ’04
Direct Financing Leases:New Equipment Acquisitions(Billions of yen)
0
200
800
400
600
1,000
JapanOverseas
’00 ’01 ’02 ’03 ’04
Investment in Direct Financing Leases(Billions of yen)
0
1,500
500
1,000
2,000
JapanOverseas
1 Direct financing leases consist of full-payout leases. For information on the recognition of revenues for directfinancing leases, see Note 1 (e) on page 67. For further details on investment in direct financing leases, seeNote 4 on page 76. For information on the securitization of direct financing leases, see Note 9 on page 82.
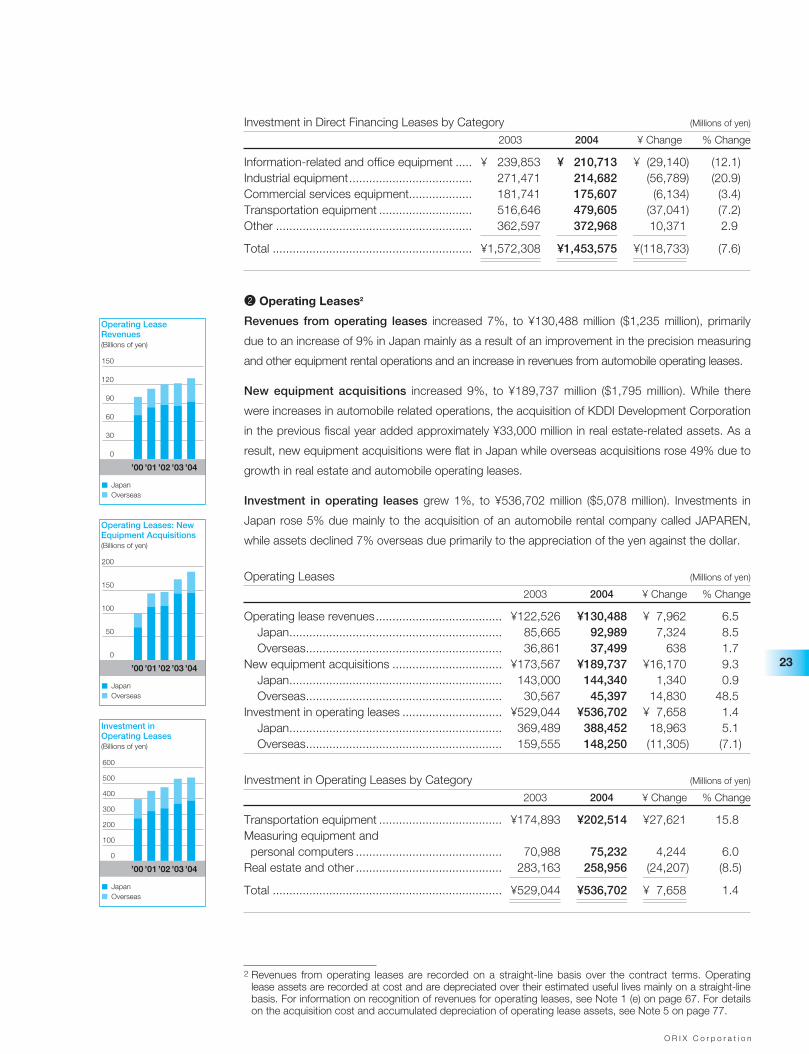
O R I X C o r p o r a t i o n
23
Investment in Direct Financing Leases by Category (Millions of yen)
2003 2004 ¥ Change % Change
Information-related and office equipment ..... ¥ 239,853 ¥ 210,713 ¥ (29,140) (12.1)Industrial equipment..................................... 271,471 214,682 (56,789) (20.9)Commercial services equipment................... 181,741 175,607 (6,134) (3.4)Transportation equipment ............................ 516,646 479,605 (37,041) (7.2)Other ........................................................... 362,597 372,968 10,371 2.9
Total ............................................................ ¥1,572,308 ¥1,453,575 ¥(118,733) (7.6)
2 Operating Leases2
Revenues from operating leases increased 7%, to ¥130,488 million ($1,235 million), primarily
due to an increase of 9% in Japan mainly as a result of an improvement in the precision measuring
and other equipment rental operations and an increase in revenues from automobile operating leases.
New equipment acquisitions increased 9%, to ¥189,737 million ($1,795 million). While there
were increases in automobile related operations, the acquisition of KDDI Development Corporation
in the previous fiscal year added approximately ¥33,000 million in real estate-related assets. As a
result, new equipment acquisitions were flat in Japan while overseas acquisitions rose 49% due to
growth in real estate and automobile operating leases.
Investment in operating leases grew 1%, to ¥536,702 million ($5,078 million). Investments in
Japan rose 5% due mainly to the acquisition of an automobile rental company called JAPAREN,
while assets declined 7% overseas due primarily to the appreciation of the yen against the dollar.
Operating Leases (Millions of yen)
2003 2004 ¥ Change % Change
Operating lease revenues...................................... ¥122,526 ¥130,488 ¥ 7,962 6.5Japan................................................................ 85,665 92,989 7,324 8.5Overseas........................................................... 36,861 37,499 638 1.7
New equipment acquisitions ................................. ¥173,567 ¥189,737 ¥16,170 9.3Japan................................................................ 143,000 144,340 1,340 0.9Overseas........................................................... 30,567 45,397 14,830 48.5
Investment in operating leases .............................. ¥529,044 ¥536,702 ¥ 7,658 1.4Japan................................................................ 369,489 388,452 18,963 5.1Overseas........................................................... 159,555 148,250 (11,305) (7.1)
Investment in Operating Leases by Category (Millions of yen)
2003 2004 ¥ Change % Change
Transportation equipment ..................................... ¥174,893 ¥202,514 ¥27,621 15.8Measuring equipment and personal computers ............................................ 70,988 75,232 4,244 6.0
Real estate and other ............................................ 283,163 258,956 (24,207) (8.5)
Total ..................................................................... ¥529,044 ¥536,702 ¥ 7,658 1.4
2 Revenues from operating leases are recorded on a straight-line basis over the contract terms. Operatinglease assets are recorded at cost and are depreciated over their estimated useful lives mainly on a straight-linebasis. For information on recognition of revenues for operating leases, see Note 1 (e) on page 67. For detailson the acquisition cost and accumulated depreciation of operating lease assets, see Note 5 on page 77.
’00 ’01 ’02 ’03 ’04
Operating Lease Revenues(Billions of yen)
0
120
60
30
90
150
JapanOverseas
’00 ’01 ’02 ’03 ’04
Operating Leases: New Equipment Acquisitions(Billions of yen)
0
100
50
150
200
JapanOverseas
’00 ’01 ’02 ’03 ’04
Investment in Operating Leases(Billions of yen)
0
100
200
500
300
400
600
JapanOverseas
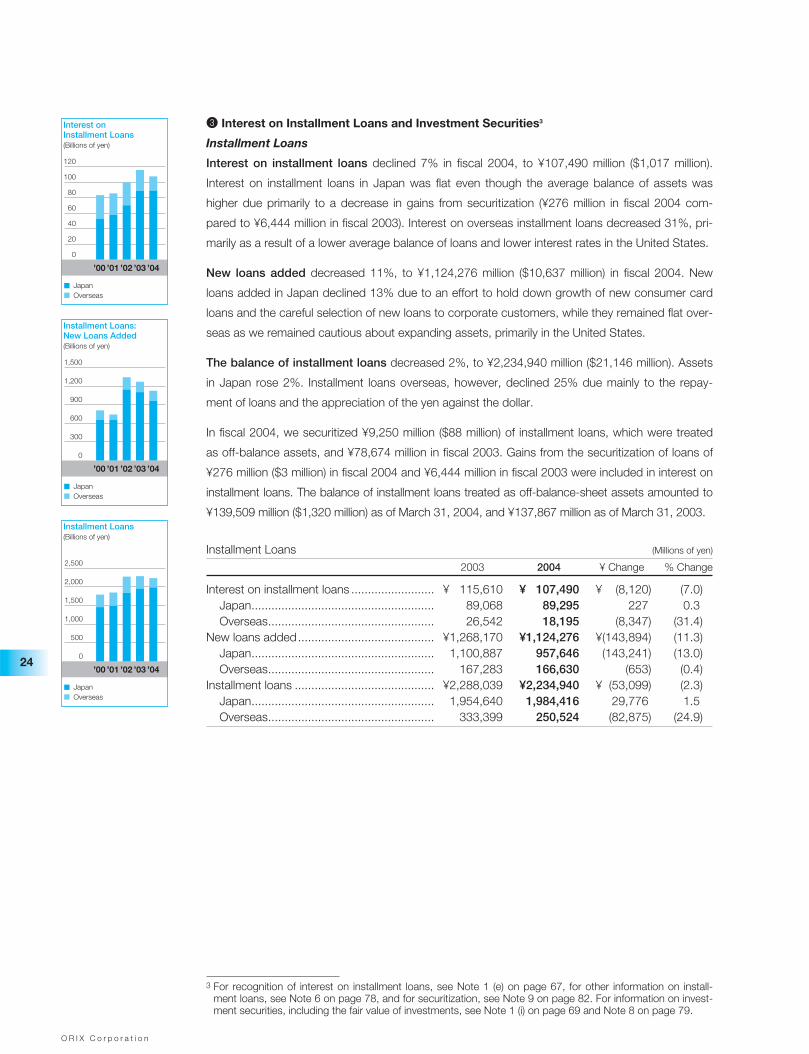
O R I X C o r p o r a t i o n
24
3 Interest on Installment Loans and Investment Securities3
Installment Loans
Interest on installment loans declined 7% in fiscal 2004, to ¥107,490 million ($1,017 million).
Interest on installment loans in Japan was flat even though the average balance of assets was
higher due primarily to a decrease in gains from securitization (¥276 million in fiscal 2004 com-
pared to ¥6,444 million in fiscal 2003). Interest on overseas installment loans decreased 31%, pri-
marily as a result of a lower average balance of loans and lower interest rates in the United States.
New loans added decreased 11%, to ¥1,124,276 million ($10,637 million) in fiscal 2004. New
loans added in Japan declined 13% due to an effort to hold down growth of new consumer card
loans and the careful selection of new loans to corporate customers, while they remained flat over-
seas as we remained cautious about expanding assets, primarily in the United States.
The balance of installment loans decreased 2%, to ¥2,234,940 million ($21,146 million). Assets
in Japan rose 2%. Installment loans overseas, however, declined 25% due mainly to the repay-
ment of loans and the appreciation of the yen against the dollar.
In fiscal 2004, we securitized ¥9,250 million ($88 million) of installment loans, which were treated
as off-balance assets, and ¥78,674 million in fiscal 2003. Gains from the securitization of loans of
¥276 million ($3 million) in fiscal 2004 and ¥6,444 million in fiscal 2003 were included in interest on
installment loans. The balance of installment loans treated as off-balance-sheet assets amounted to
¥139,509 million ($1,320 million) as of March 31, 2004, and ¥137,867 million as of March 31, 2003.
Installment Loans (Millions of yen)
2003 2004 ¥ Change % Change
Interest on installment loans ......................... ¥ 115,610 ¥ 107,490 ¥ (8,120) (7.0)Japan....................................................... 89,068 89,295 227 0.3Overseas.................................................. 26,542 18,195 (8,347) (31.4)
New loans added......................................... ¥1,268,170 ¥1,124,276 ¥(143,894) (11.3)Japan....................................................... 1,100,887 957,646 (143,241) (13.0)Overseas.................................................. 167,283 166,630 (653) (0.4)
Installment loans .......................................... ¥2,288,039 ¥2,234,940 ¥ (53,099) (2.3)Japan....................................................... 1,954,640 1,984,416 29,776 1.5Overseas.................................................. 333,399 250,524 (82,875) (24.9)
3 For recognition of interest on installment loans, see Note 1 (e) on page 67, for other information on install-ment loans, see Note 6 on page 78, and for securitization, see Note 9 on page 82. For information on invest-ment securities, including the fair value of investments, see Note 1 (i) on page 69 and Note 8 on page 79.
’00 ’01 ’02 ’03 ’04
Interest on Installment Loans(Billions of yen)
0
40
20
100
60
80
120
JapanOverseas
’00 ’01 ’02 ’03 ’04
Installment Loans: New Loans Added(Billions of yen)
0
300
1,200
600
900
1,500
JapanOverseas
’00 ’01 ’02 ’03 ’04
Installment Loans(Billions of yen)
0
500
2,000
1,000
1,500
2,500
JapanOverseas
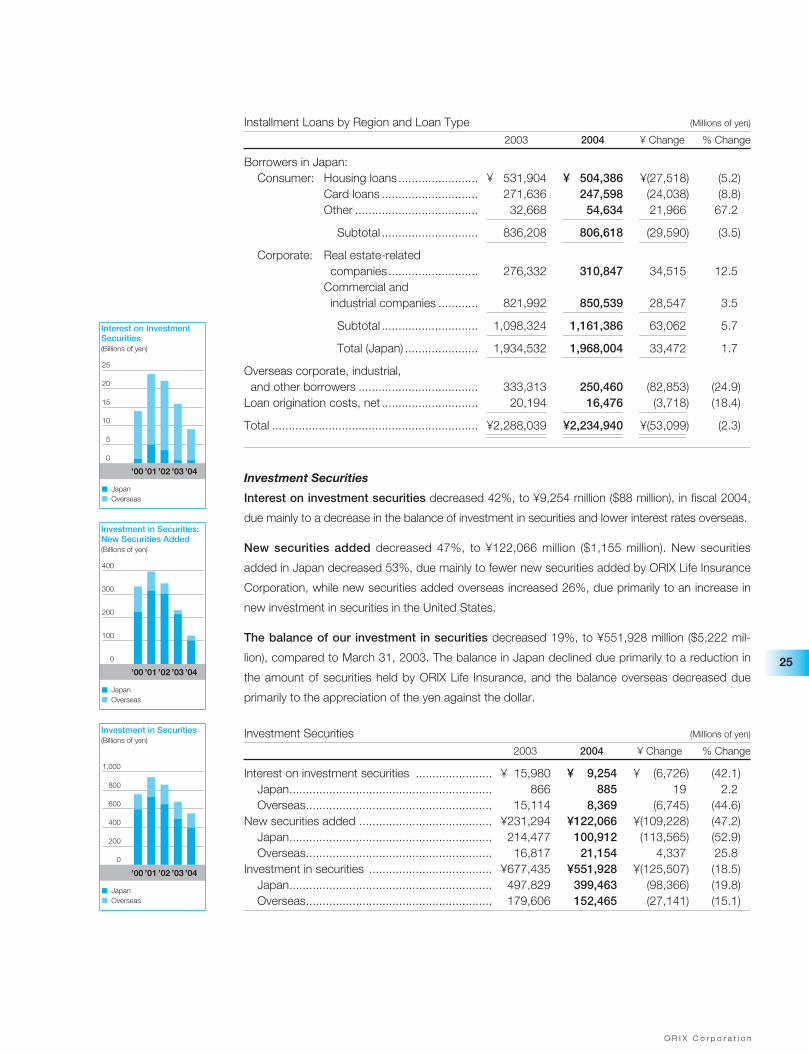
O R I X C o r p o r a t i o n
25
Installment Loans by Region and Loan Type (Millions of yen)
2003 2004 ¥ Change % Change
Borrowers in Japan: Consumer: Housing loans........................ ¥ 531,904 ¥ 504,386 ¥(27,518) (5.2)
Card loans ............................. 271,636 247,598 (24,038) (8.8)Other ..................................... 32,668 54,634 21,966 67.2
Subtotal ............................. 836,208 806,618 (29,590) (3.5)
Corporate: Real estate-related companies........................... 276,332 310,847 34,515 12.5
Commercial and industrial companies ............ 821,992 850,539 28,547 3.5
Subtotal ............................. 1,098,324 1,161,386 63,062 5.7
Total (Japan) ...................... 1,934,532 1,968,004 33,472 1.7
Overseas corporate, industrial, and other borrowers .................................... 333,313 250,460 (82,853) (24.9)
Loan origination costs, net ............................. 20,194 16,476 (3,718) (18.4)
Total .............................................................. ¥2,288,039 ¥2,234,940 ¥(53,099) (2.3)
Investment Securities
Interest on investment securities decreased 42%, to ¥9,254 million ($88 million), in fiscal 2004,
due mainly to a decrease in the balance of investment in securities and lower interest rates overseas.
New securities added decreased 47%, to ¥122,066 million ($1,155 million). New securities
added in Japan decreased 53%, due mainly to fewer new securities added by ORIX Life Insurance
Corporation, while new securities added overseas increased 26%, due primarily to an increase in
new investment in securities in the United States.
The balance of our investment in securities decreased 19%, to ¥551,928 million ($5,222 mil-
lion), compared to March 31, 2003. The balance in Japan declined due primarily to a reduction in
the amount of securities held by ORIX Life Insurance, and the balance overseas decreased due
primarily to the appreciation of the yen against the dollar.
Investment Securities (Millions of yen)
2003 2004 ¥ Change % Change
Interest on investment securities ....................... ¥ 15,980 ¥ 9,254 ¥ (6,726) (42.1)Japan............................................................. 866 885 19 2.2Overseas........................................................ 15,114 8,369 (6,745) (44.6)
New securities added ........................................ ¥231,294 ¥122,066 ¥(109,228) (47.2)Japan............................................................. 214,477 100,912 (113,565) (52.9)Overseas........................................................ 16,817 21,154 4,337 25.8
Investment in securities ..................................... ¥677,435 ¥551,928 ¥(125,507) (18.5)Japan............................................................. 497,829 399,463 (98,366) (19.8)Overseas........................................................ 179,606 152,465 (27,141) (15.1)
’00 ’01 ’02 ’03 ’04
Interest on Investment Securities(Billions of yen)
0
5
20
10
15
25
JapanOverseas
’00 ’01 ’02 ’03 ’04
Investment in Securities: New Securities Added(Billions of yen)
0
300
100
200
400
JapanOverseas
’00 ’01 ’02 ’03 ’04
Investment in Securities(Billions of yen)
0
200
800
400
600
1,000
JapanOverseas
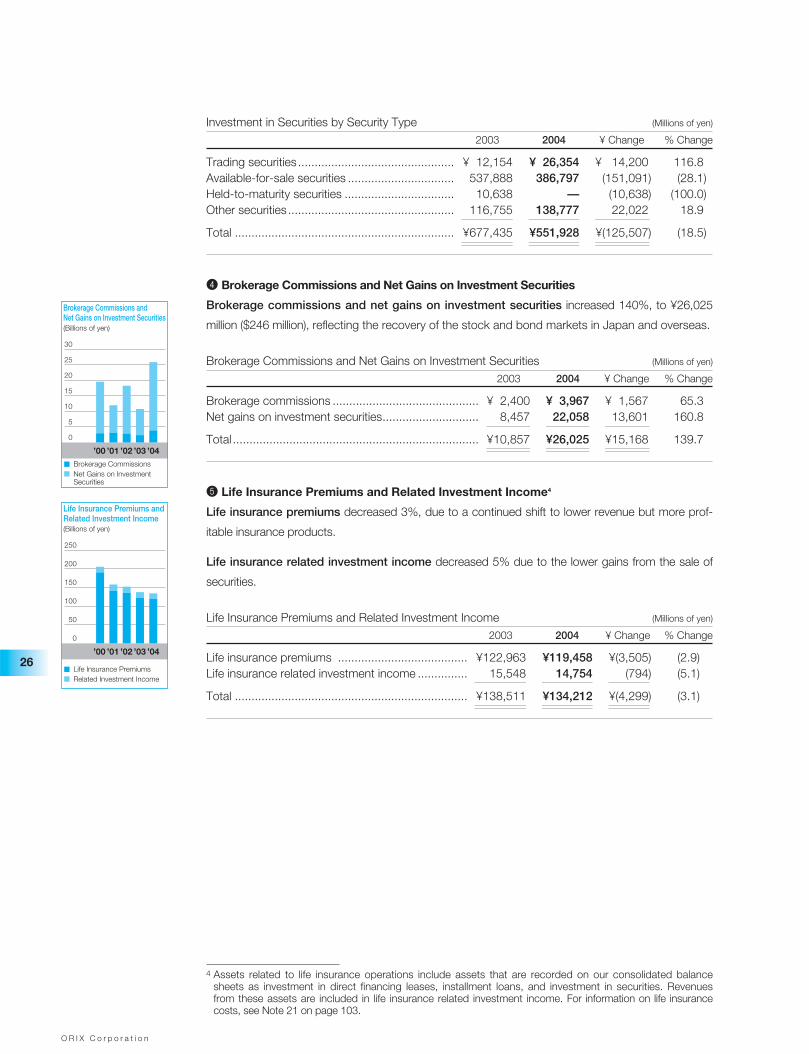
O R I X C o r p o r a t i o n
26
Investment in Securities by Security Type (Millions of yen)
2003 2004 ¥ Change % Change
Trading securities ............................................... ¥ 12,154 ¥ 26,354 ¥ 14,200 116.8Available-for-sale securities ................................ 537,888 386,797 (151,091) (28.1)Held-to-maturity securities ................................. 10,638 — (10,638) (100.0)Other securities .................................................. 116,755 138,777 22,022 18.9
Total .................................................................. ¥677,435 ¥551,928 ¥(125,507) (18.5)
4 Brokerage Commissions and Net Gains on Investment Securities
Brokerage commissions and net gains on investment securities increased 140%, to ¥26,025
million ($246 million), reflecting the recovery of the stock and bond markets in Japan and overseas.
Brokerage Commissions and Net Gains on Investment Securities (Millions of yen)
2003 2004 ¥ Change % Change
Brokerage commissions ............................................ ¥ 2,400 ¥ 3,967 ¥ 1,567 65.3Net gains on investment securities............................. 8,457 22,058 13,601 160.8
Total .......................................................................... ¥10,857 ¥26,025 ¥15,168 139.7
5 Life Insurance Premiums and Related Investment Income4
Life insurance premiums decreased 3%, due to a continued shift to lower revenue but more prof-
itable insurance products.
Life insurance related investment income decreased 5% due to the lower gains from the sale of
securities.
Life Insurance Premiums and Related Investment Income (Millions of yen)
2003 2004 ¥ Change % Change
Life insurance premiums ....................................... ¥122,963 ¥119,458 ¥(3,505) (2.9)Life insurance related investment income ............... 15,548 14,754 (794) (5.1)
Total ...................................................................... ¥138,511 ¥134,212 ¥(4,299) (3.1)
’00 ’01 ’02 ’03 ’04
Brokerage Commissions and Net Gains on Investment Securities(Billions of yen)
Brokerage CommissionsNet Gains on Investment Securities
0
5
10
15
20
25
30
4 Assets related to life insurance operations include assets that are recorded on our consolidated balancesheets as investment in direct financing leases, installment loans, and investment in securities. Revenuesfrom these assets are included in life insurance related investment income. For information on life insurancecosts, see Note 21 on page 103.
’00 ’01 ’02 ’03 ’04
Life Insurance Premiums and Related Investment Income(Billions of yen)
0
50
200
100
150
250
Life Insurance PremiumsRelated Investment Income
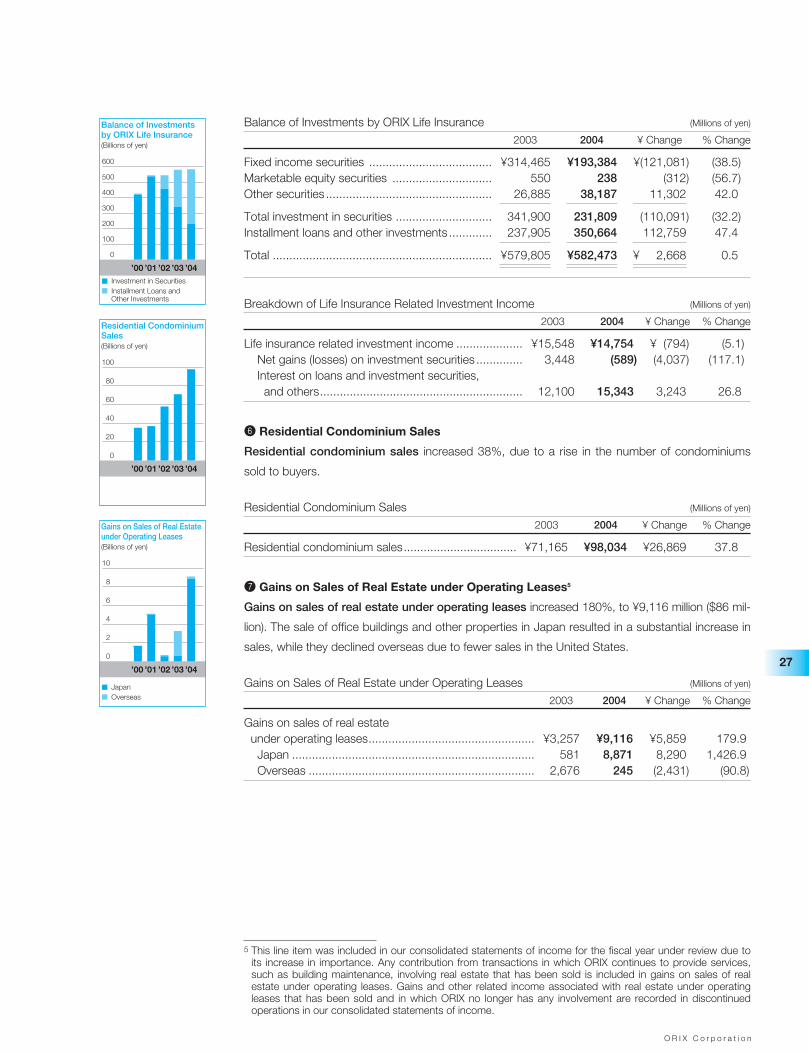
O R I X C o r p o r a t i o n
27
Balance of Investments by ORIX Life Insurance (Millions of yen)
2003 2004 ¥ Change % Change
Fixed income securities ..................................... ¥314,465 ¥193,384 ¥(121,081) (38.5)Marketable equity securities .............................. 550 238 (312) (56.7)Other securities .................................................. 26,885 38,187 11,302 42.0
Total investment in securities ............................. 341,900 231,809 (110,091) (32.2)Installment loans and other investments ............. 237,905 350,664 112,759 47.4
Total .................................................................. ¥579,805 ¥582,473 ¥ 2,668 0.5
Breakdown of Life Insurance Related Investment Income (Millions of yen)
2003 2004 ¥ Change % Change
Life insurance related investment income .................... ¥15,548 ¥14,754 ¥ (794) (5.1)Net gains (losses) on investment securities .............. 3,448 (589) (4,037) (117.1)Interest on loans and investment securities, and others............................................................. 12,100 15,343 3,243 26.8
6 Residential Condominium Sales
Residential condominium sales increased 38%, due to a rise in the number of condominiums
sold to buyers.
Residential Condominium Sales (Millions of yen)
2003 2004 ¥ Change % Change
Residential condominium sales.................................. ¥71,165 ¥98,034 ¥26,869 37.8
7 Gains on Sales of Real Estate under Operating Leases5
Gains on sales of real estate under operating leases increased 180%, to ¥9,116 million ($86 mil-
lion). The sale of office buildings and other properties in Japan resulted in a substantial increase in
sales, while they declined overseas due to fewer sales in the United States.
Gains on Sales of Real Estate under Operating Leases (Millions of yen)
2003 2004 ¥ Change % Change
Gains on sales of real estate under operating leases.................................................. ¥3,257 ¥9,116 ¥5,859 179.9Japan ......................................................................... 581 8,871 8,290 1,426.9Overseas .................................................................... 2,676 245 (2,431) (90.8)
’00 ’01 ’02 ’03 ’04
Balance of Investments by ORIX Life Insurance(Billions of yen)
0
200
100
500
300
400
600
Investment in SecuritiesInstallment Loans and Other Investments
5 This line item was included in our consolidated statements of income for the fiscal year under review due toits increase in importance. Any contribution from transactions in which ORIX continues to provide services,such as building maintenance, involving real estate that has been sold is included in gains on sales of realestate under operating leases. Gains and other related income associated with real estate under operatingleases that has been sold and in which ORIX no longer has any involvement are recorded in discontinuedoperations in our consolidated statements of income.
’00 ’01 ’02 ’03 ’04
Residential Condominium Sales(Billions of yen)
0
20
40
60
80
100
’00 ’01 ’02 ’03 ’04
Gains on Sales of Real Estate under Operating Leases(Billions of yen)
0
2
8
4
6
10
JapanOverseas
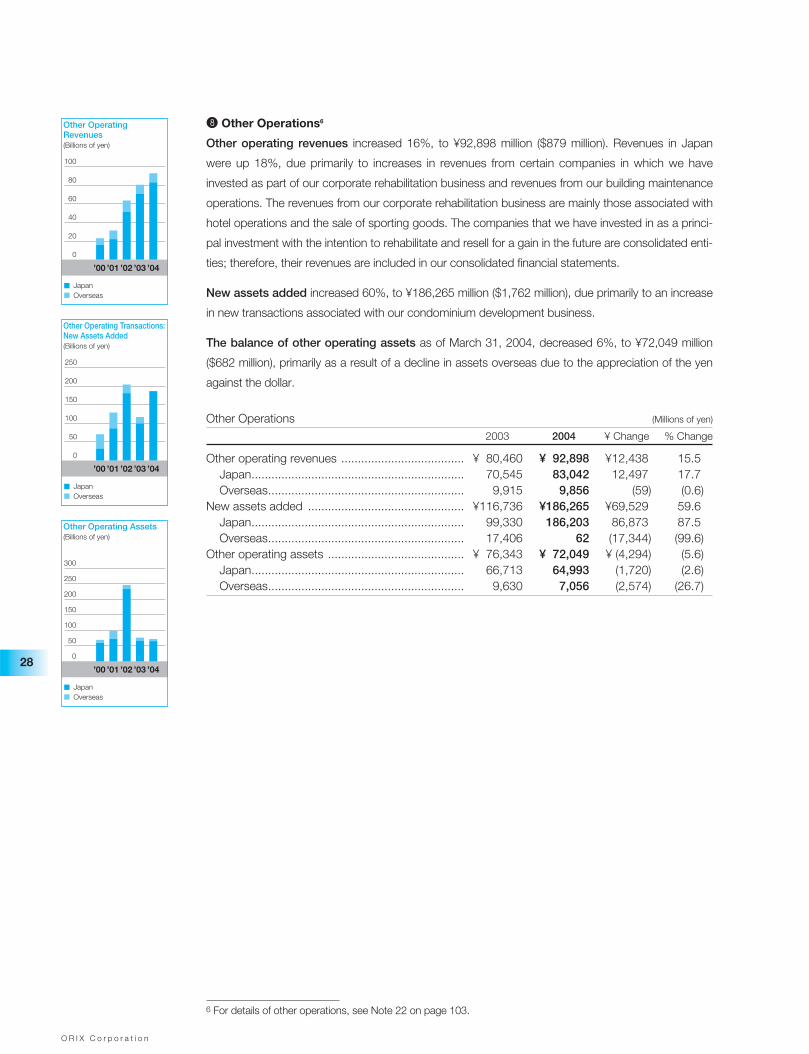
O R I X C o r p o r a t i o n
28
8 Other Operations6
Other operating revenues increased 16%, to ¥92,898 million ($879 million). Revenues in Japan
were up 18%, due primarily to increases in revenues from certain companies in which we have
invested as part of our corporate rehabilitation business and revenues from our building maintenance
operations. The revenues from our corporate rehabilitation business are mainly those associated with
hotel operations and the sale of sporting goods. The companies that we have invested in as a princi-
pal investment with the intention to rehabilitate and resell for a gain in the future are consolidated enti-
ties; therefore, their revenues are included in our consolidated financial statements.
New assets added increased 60%, to ¥186,265 million ($1,762 million), due primarily to an increase
in new transactions associated with our condominium development business.
The balance of other operating assets as of March 31, 2004, decreased 6%, to ¥72,049 million
($682 million), primarily as a result of a decline in assets overseas due to the appreciation of the yen
against the dollar.
Other Operations (Millions of yen)
2003 2004 ¥ Change % Change
Other operating revenues ..................................... ¥ 80,460 ¥ 92,898 ¥12,438 15.5Japan................................................................ 70,545 83,042 12,497 17.7Overseas........................................................... 9,915 9,856 (59) (0.6)
New assets added ............................................... ¥116,736 ¥186,265 ¥69,529 59.6Japan................................................................ 99,330 186,203 86,873 87.5Overseas........................................................... 17,406 62 (17,344) (99.6)
Other operating assets ......................................... ¥ 76,343 ¥ 72,049 ¥ (4,294) (5.6)Japan................................................................ 66,713 64,993 (1,720) (2.6)Overseas........................................................... 9,630 7,056 (2,574) (26.7)
’00 ’01 ’02 ’03 ’04
Other Operating Revenues(Billions of yen)
0
20
80
40
60
100
JapanOverseas
’00 ’01 ’02 ’03 ’04
Other Operating Transactions: New Assets Added(Billions of yen)
0
50
200
100
150
250
JapanOverseas
’00 ’01 ’02 ’03 ’04
Other Operating Assets(Billions of yen)
0
100
50
250
150
200
300
JapanOverseas
6 For details of other operations, see Note 22 on page 103.
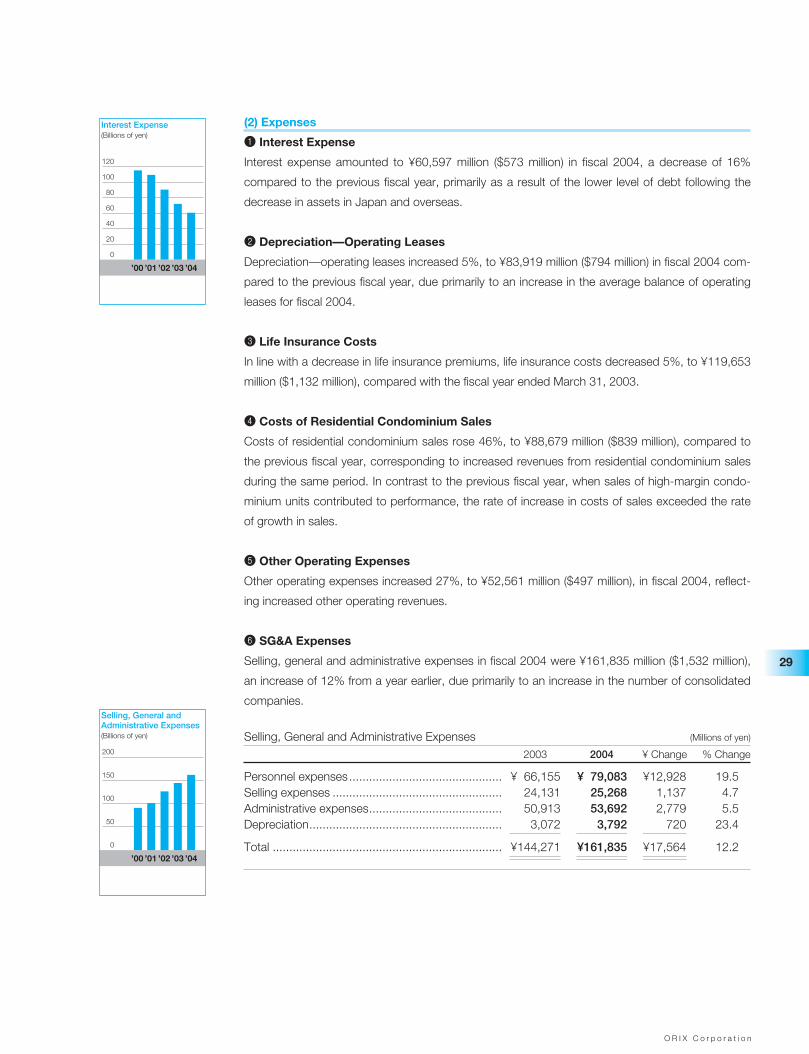
O R I X C o r p o r a t i o n
29
(2) Expenses
1 Interest Expense
Interest expense amounted to ¥60,597 million ($573 million) in fiscal 2004, a decrease of 16%
compared to the previous fiscal year, primarily as a result of the lower level of debt following the
decrease in assets in Japan and overseas.
2 Depreciation—Operating Leases
Depreciation—operating leases increased 5%, to ¥83,919 million ($794 million) in fiscal 2004 com-
pared to the previous fiscal year, due primarily to an increase in the average balance of operating
leases for fiscal 2004.
3 Life Insurance Costs
In line with a decrease in life insurance premiums, life insurance costs decreased 5%, to ¥119,653
million ($1,132 million), compared with the fiscal year ended March 31, 2003.
4 Costs of Residential Condominium Sales
Costs of residential condominium sales rose 46%, to ¥88,679 million ($839 million), compared to
the previous fiscal year, corresponding to increased revenues from residential condominium sales
during the same period. In contrast to the previous fiscal year, when sales of high-margin condo-
minium units contributed to performance, the rate of increase in costs of sales exceeded the rate
of growth in sales.
5 Other Operating Expenses
Other operating expenses increased 27%, to ¥52,561 million ($497 million), in fiscal 2004, reflect-
ing increased other operating revenues.
6 SG&A Expenses
Selling, general and administrative expenses in fiscal 2004 were ¥161,835 million ($1,532 million),
an increase of 12% from a year earlier, due primarily to an increase in the number of consolidated
companies.
Selling, General and Administrative Expenses (Millions of yen)
2003 2004 ¥ Change % Change
Personnel expenses.............................................. ¥ 66,155 ¥ 79,083 ¥12,928 19.5Selling expenses ................................................... 24,131 25,268 1,137 4.7Administrative expenses........................................ 50,913 53,692 2,779 5.5Depreciation.......................................................... 3,072 3,792 720 23.4
Total ..................................................................... ¥144,271 ¥161,835 ¥17,564 12.2
’00 ’01 ’02 ’03 ’04
Interest Expense(Billions of yen)
0
40
20
60
80
100
120
0
50
100
150
200
’00 ’01 ’02 ’03 ’04
Selling, General and Administrative Expenses(Billions of yen)
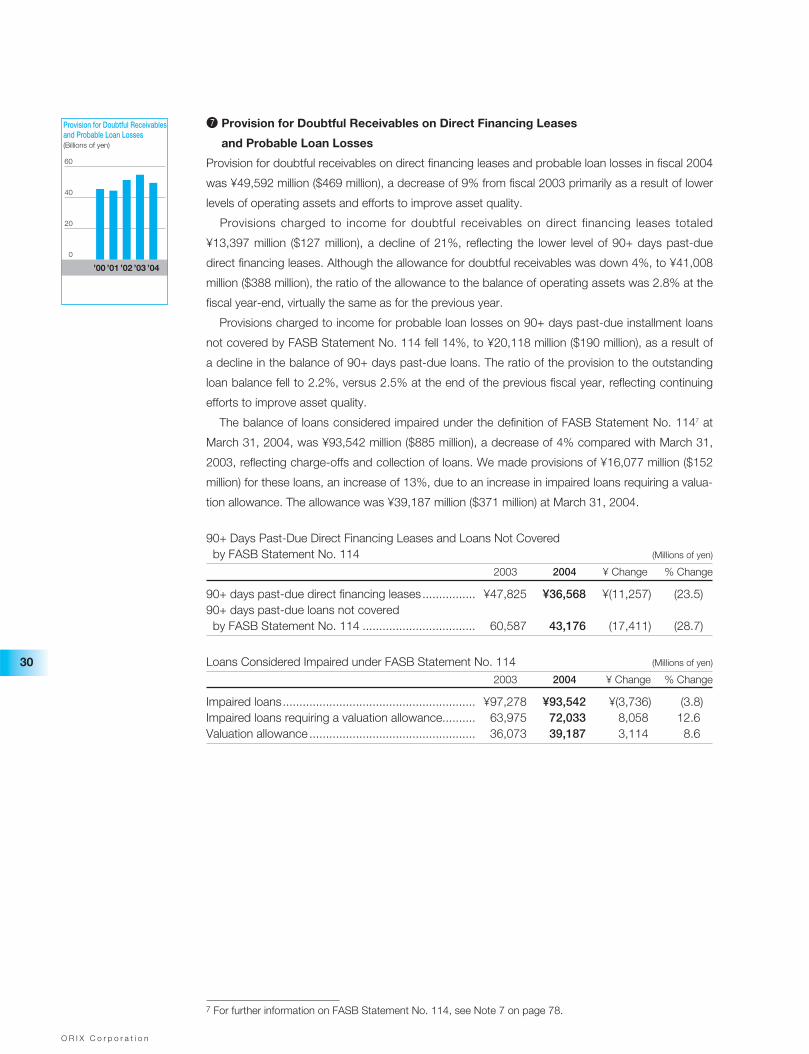
O R I X C o r p o r a t i o n
30
7 Provision for Doubtful Receivables on Direct Financing Leases
and Probable Loan Losses
Provision for doubtful receivables on direct financing leases and probable loan losses in fiscal 2004
was ¥49,592 million ($469 million), a decrease of 9% from fiscal 2003 primarily as a result of lower
levels of operating assets and efforts to improve asset quality.
Provisions charged to income for doubtful receivables on direct financing leases totaled
¥13,397 million ($127 million), a decline of 21%, reflecting the lower level of 90+ days past-due
direct financing leases. Although the allowance for doubtful receivables was down 4%, to ¥41,008
million ($388 million), the ratio of the allowance to the balance of operating assets was 2.8% at the
fiscal year-end, virtually the same as for the previous year.
Provisions charged to income for probable loan losses on 90+ days past-due installment loans
not covered by FASB Statement No. 114 fell 14%, to ¥20,118 million ($190 million), as a result of
a decline in the balance of 90+ days past-due loans. The ratio of the provision to the outstanding
loan balance fell to 2.2%, versus 2.5% at the end of the previous fiscal year, reflecting continuing
efforts to improve asset quality.
The balance of loans considered impaired under the definition of FASB Statement No. 1147 at
March 31, 2004, was ¥93,542 million ($885 million), a decrease of 4% compared with March 31,
2003, reflecting charge-offs and collection of loans. We made provisions of ¥16,077 million ($152
million) for these loans, an increase of 13%, due to an increase in impaired loans requiring a valua-
tion allowance. The allowance was ¥39,187 million ($371 million) at March 31, 2004.
90+ Days Past-Due Direct Financing Leases and Loans Not Covered by FASB Statement No. 114 (Millions of yen)
2003 2004 ¥ Change % Change
90+ days past-due direct financing leases................ ¥47,825 ¥36,568 ¥(11,257) (23.5)90+ days past-due loans not covered by FASB Statement No. 114 .................................. 60,587 43,176 (17,411) (28.7)
Loans Considered Impaired under FASB Statement No. 114 (Millions of yen)
2003 2004 ¥ Change % Change
Impaired loans.......................................................... ¥97,278 ¥93,542 ¥(3,736) (3.8)Impaired loans requiring a valuation allowance.......... 63,975 72,033 8,058 12.6Valuation allowance .................................................. 36,073 39,187 3,114 8.6
7 For further information on FASB Statement No. 114, see Note 7 on page 78.
’00 ’01 ’02 ’03 ’04
Provision for Doubtful Receivables and Probable Loan Losses(Billions of yen)
0
20
40
60
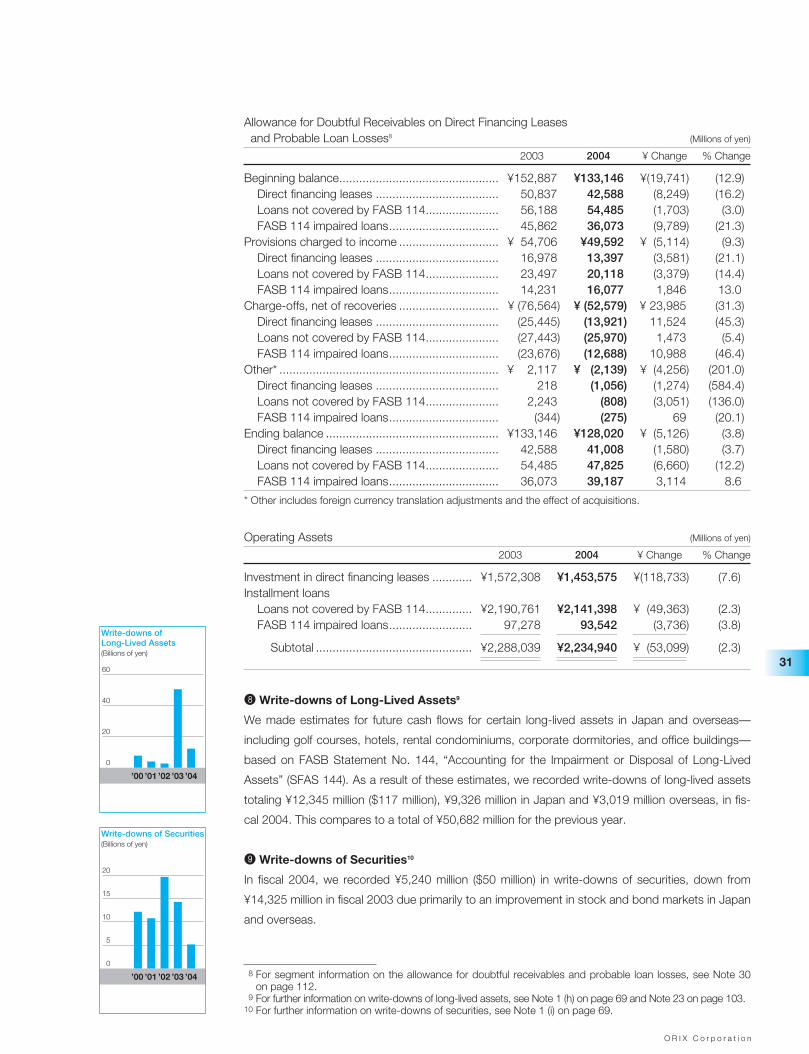
O R I X C o r p o r a t i o n
31
Allowance for Doubtful Receivables on Direct Financing Leases and Probable Loan Losses8 (Millions of yen)
2003 2004 ¥ Change % Change
Beginning balance................................................ ¥152,887 ¥133,146 ¥(19,741) (12.9)Direct financing leases ..................................... 50,837 42,588 (8,249) (16.2)Loans not covered by FASB 114...................... 56,188 54,485 (1,703) (3.0)FASB 114 impaired loans................................. 45,862 36,073 (9,789) (21.3)
Provisions charged to income .............................. ¥ 54,706 ¥49,592 ¥ (5,114) (9.3)Direct financing leases ..................................... 16,978 13,397 (3,581) (21.1)Loans not covered by FASB 114...................... 23,497 20,118 (3,379) (14.4)FASB 114 impaired loans................................. 14,231 16,077 1,846 13.0
Charge-offs, net of recoveries .............................. ¥ (76,564) ¥ (52,579) ¥ 23,985 (31.3)Direct financing leases ..................................... (25,445) (13,921) 11,524 (45.3)Loans not covered by FASB 114...................... (27,443) (25,970) 1,473 (5.4)FASB 114 impaired loans................................. (23,676) (12,688) 10,988 (46.4)
Other* .................................................................. ¥ 2,117 ¥ (2,139) ¥ (4,256) (201.0)Direct financing leases ..................................... 218 (1,056) (1,274) (584.4)Loans not covered by FASB 114...................... 2,243 (808) (3,051) (136.0)FASB 114 impaired loans................................. (344) (275) 69 (20.1)
Ending balance .................................................... ¥133,146 ¥128,020 ¥ (5,126) (3.8)Direct financing leases ..................................... 42,588 41,008 (1,580) (3.7)Loans not covered by FASB 114...................... 54,485 47,825 (6,660) (12.2)FASB 114 impaired loans................................. 36,073 39,187 3,114 8.6
* Other includes foreign currency translation adjustments and the effect of acquisitions.
Operating Assets (Millions of yen)
2003 2004 ¥ Change % Change
Investment in direct financing leases ............ ¥1,572,308 ¥1,453,575 ¥(118,733) (7.6)Installment loans
Loans not covered by FASB 114.............. ¥2,190,761 ¥2,141,398 ¥ (49,363) (2.3)FASB 114 impaired loans......................... 97,278 93,542 (3,736) (3.8)
Subtotal ............................................... ¥2,288,039 ¥2,234,940 ¥ (53,099) (2.3)
8Write-downs of Long-Lived Assets9
We made estimates for future cash flows for certain long-lived assets in Japan and overseas—
including golf courses, hotels, rental condominiums, corporate dormitories, and office buildings—
based on FASB Statement No. 144, “Accounting for the Impairment or Disposal of Long-Lived
Assets” (SFAS 144). As a result of these estimates, we recorded write-downs of long-lived assets
totaling ¥12,345 million ($117 million), ¥9,326 million in Japan and ¥3,019 million overseas, in fis-
cal 2004. This compares to a total of ¥50,682 million for the previous year.
9Write-downs of Securities10
In fiscal 2004, we recorded ¥5,240 million ($50 million) in write-downs of securities, down from
¥14,325 million in fiscal 2003 due primarily to an improvement in stock and bond markets in Japan
and overseas.
8 For segment information on the allowance for doubtful receivables and probable loan losses, see Note 30on page 112.
9 For further information on write-downs of long-lived assets, see Note 1 (h) on page 69 and Note 23 on page 103.10 For further information on write-downs of securities, see Note 1 (i) on page 69.
’00 ’01 ’02 ’03 ’04
Write-downs of Long-Lived Assets(Billions of yen)
0
20
40
60
’00 ’01 ’02 ’03 ’04
Write-downs of Securities(Billions of yen)
0
5
10
15
20
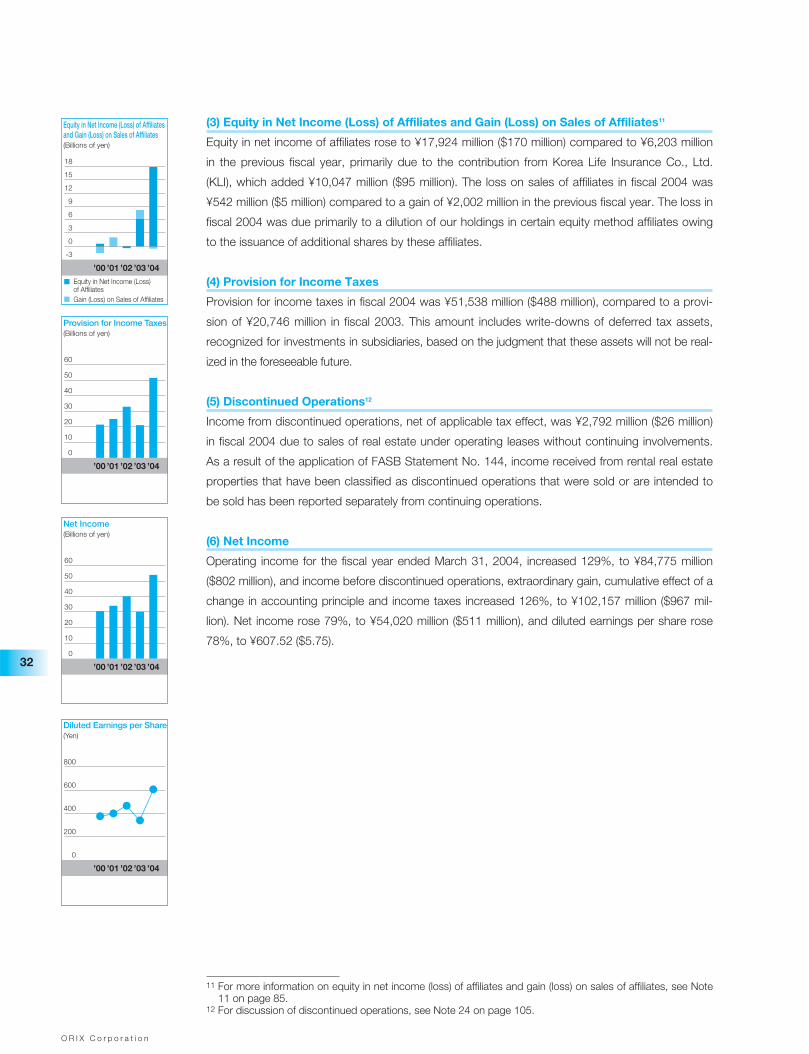
O R I X C o r p o r a t i o n
32
(3) Equity in Net Income (Loss) of Affiliates and Gain (Loss) on Sales of Affiliates11
Equity in net income of affiliates rose to ¥17,924 million ($170 million) compared to ¥6,203 million
in the previous fiscal year, primarily due to the contribution from Korea Life Insurance Co., Ltd.
(KLI), which added ¥10,047 million ($95 million). The loss on sales of affiliates in fiscal 2004 was
¥542 million ($5 million) compared to a gain of ¥2,002 million in the previous fiscal year. The loss in
fiscal 2004 was due primarily to a dilution of our holdings in certain equity method affiliates owing
to the issuance of additional shares by these affiliates.
(4) Provision for Income Taxes
Provision for income taxes in fiscal 2004 was ¥51,538 million ($488 million), compared to a provi-
sion of ¥20,746 million in fiscal 2003. This amount includes write-downs of deferred tax assets,
recognized for investments in subsidiaries, based on the judgment that these assets will not be real-
ized in the foreseeable future.
(5) Discontinued Operations12
Income from discontinued operations, net of applicable tax effect, was ¥2,792 million ($26 million)
in fiscal 2004 due to sales of real estate under operating leases without continuing involvements.
As a result of the application of FASB Statement No. 144, income received from rental real estate
properties that have been classified as discontinued operations that were sold or are intended to
be sold has been reported separately from continuing operations.
(6) Net Income
Operating income for the fiscal year ended March 31, 2004, increased 129%, to ¥84,775 million
($802 million), and income before discontinued operations, extraordinary gain, cumulative effect of a
change in accounting principle and income taxes increased 126%, to ¥102,157 million ($967 mil-
lion). Net income rose 79%, to ¥54,020 million ($511 million), and diluted earnings per share rose
78%, to ¥607.52 ($5.75).0
10
20
30
40
50
60
’00 ’01 ’02 ’03 ’04
Net Income(Billions of yen)
’00 ’01 ’02 ’03 ’04
Diluted Earnings per Share(Yen)
0
200
400
600
800
-3
0
3
6
9
12
15
18
’00 ’01 ’02 ’03 ’04
Equity in Net Income (Loss) of Affiliates and Gain (Loss) on Sales of Affiliates(Billions of yen)
Equity in Net Income (Loss) of AffiliatesGain (Loss) on Sales of Affiliates
’00 ’01 ’02 ’03 ’04
Provision for Income Taxes(Billions of yen)
0
10
20
30
40
50
60
11 For more information on equity in net income (loss) of affiliates and gain (loss) on sales of affiliates, see Note11 on page 85.
12 For discussion of discontinued operations, see Note 24 on page 105.
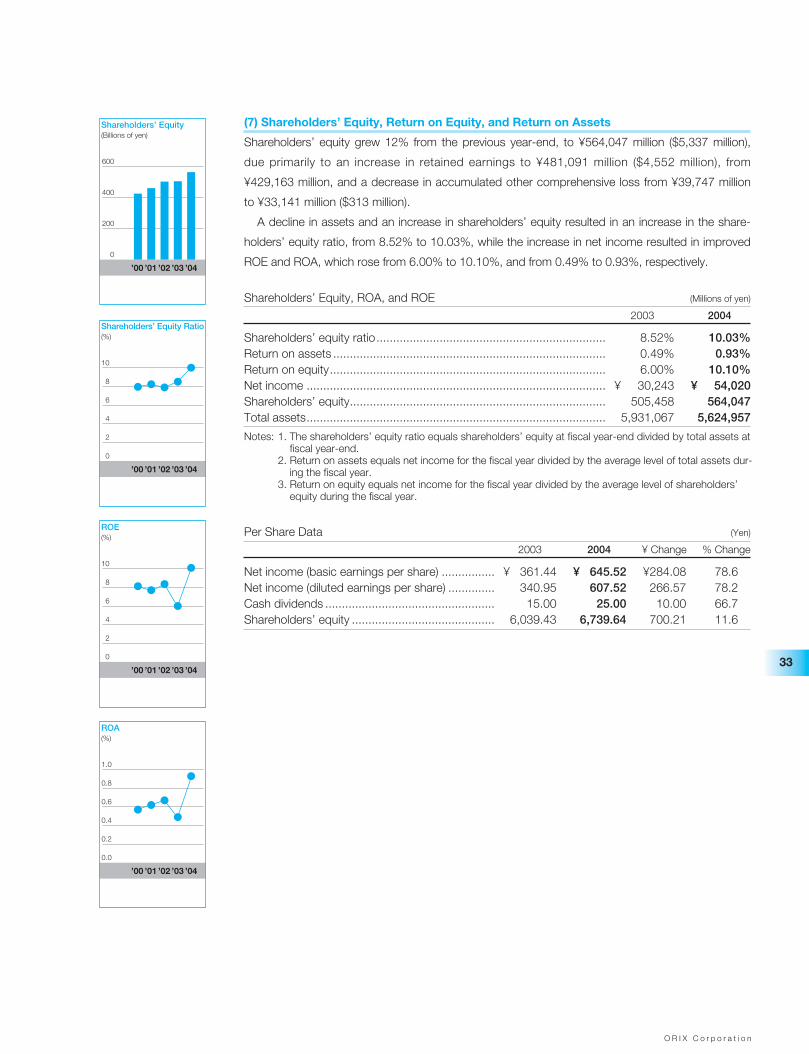
O R I X C o r p o r a t i o n
33
’00 ’01 ’02 ’03 ’04
Shareholders’ Equity(Billions of yen)
0
200
400
600
’00 ’01 ’02 ’03 ’04
Shareholders’ Equity Ratio(%)
0
8
2
4
6
10
’00 ’01 ’02 ’03 ’04
ROE(%)
0
8
2
4
6
10
’00 ’01 ’02 ’03 ’04
ROA(%)
0.0
0.2
0.4
0.6
0.8
1.0
(7) Shareholders’ Equity, Return on Equity, and Return on Assets
Shareholders’ equity grew 12% from the previous year-end, to ¥564,047 million ($5,337 million),
due primarily to an increase in retained earnings to ¥481,091 million ($4,552 million), from
¥429,163 million, and a decrease in accumulated other comprehensive loss from ¥39,747 million
to ¥33,141 million ($313 million).
A decline in assets and an increase in shareholders’ equity resulted in an increase in the share-
holders’ equity ratio, from 8.52% to 10.03%, while the increase in net income resulted in improved
ROE and ROA, which rose from 6.00% to 10.10%, and from 0.49% to 0.93%, respectively.
Shareholders’ Equity, ROA, and ROE (Millions of yen)
2003 2004
Shareholders’ equity ratio..................................................................... 8.52% 10.03%Return on assets .................................................................................. 0.49% 0.93%Return on equity................................................................................... 6.00% 10.10%Net income .......................................................................................... ¥ 30,243 ¥ 54,020Shareholders’ equity............................................................................. 505,458 564,047Total assets.......................................................................................... 5,931,067 5,624,957
Notes: 1. The shareholders’ equity ratio equals shareholders’ equity at fiscal year-end divided by total assets atfiscal year-end.
2. Return on assets equals net income for the fiscal year divided by the average level of total assets dur-ing the fiscal year.
3. Return on equity equals net income for the fiscal year divided by the average level of shareholders’equity during the fiscal year.
Per Share Data (Yen)
2003 2004 ¥ Change % Change
Net income (basic earnings per share) ................ ¥ 361.44 ¥ 645.52 ¥284.08 78.6Net income (diluted earnings per share) .............. 340.95 607.52 266.57 78.2Cash dividends ................................................... 15.00 25.00 10.00 66.7Shareholders’ equity ........................................... 6,039.43 6,739.64 700.21 11.6
O R I X C o r p o r a t i o n
34
3. C a s h F l o w s
Cash and cash equivalents in fiscal 2004 decreased by 26%, or ¥52,442 million, to ¥152,235 mil-
lion ($1,440 million) from fiscal 2003, due primarily to a lower level of net proceeds from securitiza-
tion of lease and loan receivables compared with fiscal 2003 and a continuing repayment of debts
due to the decrease of operating assets.
Net cash provided by operating activities declined by ¥57,338 million, to ¥152,812 million
($1,446 million), in fiscal 2004 compared to ¥210,150 million in fiscal 2003. While net income
increased by ¥23,777 million, to ¥54,020 million ($511 million) in fiscal 2004, compared with
¥30,243 million, the decrease in net cash provided by operating activities is mainly due to a
decrease in write-downs of long-lived assets and write-downs of securities, which are expenses
not associated with cash payments, and a decrease of equity in net (income) loss of affiliates con-
tributed from investment in KLI. In addition, a decrease of ¥15,771 million in policy liabilities in
fiscal 2004, compared with an increase of ¥5,889 million in fiscal 2003, is another reason.
Net cash provided by investing activities decreased by ¥58,972 million, to ¥123,978 million
($1,173 million), in fiscal 2004, compared to ¥182,950 million in fiscal 2003. While cash outflows
for the purchase of lease equipment, installment loans made to customers, and the purchase of
available-for-sale securities all declined as a result of lower business volumes in comparison with
fiscal 2003, inflows also declined due primarily to a decrease in net proceeds from securitization of
lease and loan receivables and a reduction in proceeds from sales of available-for-sale securities.
Net cash used in financing activities in fiscal 2004 was ¥328,284 million ($3,106 million), com-
pared to ¥542,040 million in fiscal 2003, due primarily to a lower level debt repayment resulting
from the reduced level of operating assets.
4. S e g m e n t I n f o r m a t i o n 1 3
The following discussion presents segment financial information on the basis that is regularly used
by management for evaluating the performance of business segments and deciding how to allo-
cate resources to them. The reporting segments are identified based on the nature of services for
operations in Japan and based on geographic areas for overseas operations.
Segments in Japan accounted for 79% of total segment profit in fiscal 2004 compared to 80%
in the previous fiscal year. As of March 31, 2004, ¥4,167,472 million ($39,431 million), or approxi-
mately 82%, of total segment assets were in Japan.
Segments overseas accounted for 21% of total segment profits in fiscal 2004 compared to
20% in the previous fiscal year. As of March 31, 2004, ¥472,595 million ($4,472 million), or 9%, of
total segment assets were in the Americas, ¥413,041 million ($3,908 million), or 8%, in Asia and
Oceania, and ¥56,634 million ($535 million), or 1%, in Europe.
13 For more details on segment information, see Note 30 on page 112. For more information on the majorbusiness divisions and subsidiaries in each segment, refer to the “Directory (by Segment)” on page 117.
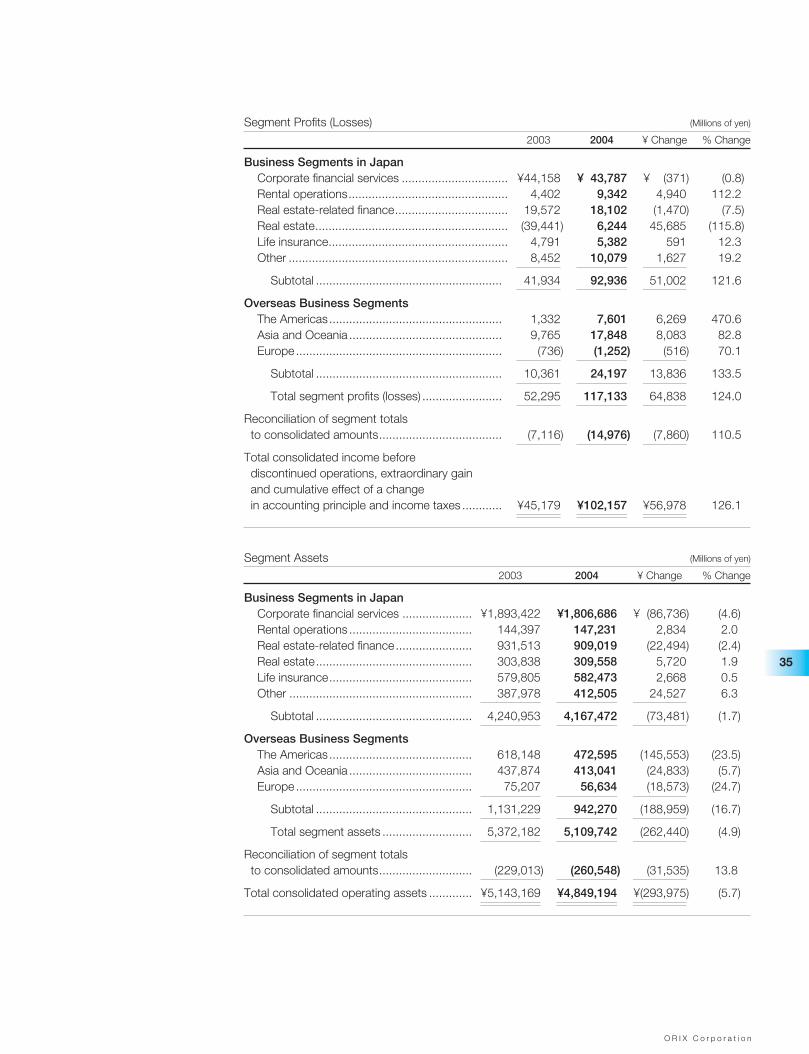
O R I X C o r p o r a t i o n
35
Segment Profits (Losses) (Millions of yen)
2003 2004 ¥ Change % Change
Business Segments in JapanCorporate financial services ................................ ¥44,158 ¥ 43,787 ¥ (371) (0.8)Rental operations................................................ 4,402 9,342 4,940 112.2Real estate-related finance.................................. 19,572 18,102 (1,470) (7.5)Real estate.......................................................... (39,441) 6,244 45,685 (115.8)Life insurance...................................................... 4,791 5,382 591 12.3Other .................................................................. 8,452 10,079 1,627 19.2
Subtotal ........................................................ 41,934 92,936 51,002 121.6
Overseas Business SegmentsThe Americas.................................................... 1,332 7,601 6,269 470.6Asia and Oceania .............................................. 9,765 17,848 8,083 82.8Europe .............................................................. (736) (1,252) (516) 70.1
Subtotal ........................................................ 10,361 24,197 13,836 133.5
Total segment profits (losses) ........................ 52,295 117,133 64,838 124.0
Reconciliation of segment totals to consolidated amounts..................................... (7,116) (14,976) (7,860) 110.5
Total consolidated income before discontinued operations, extraordinary gain and cumulative effect of a change in accounting principle and income taxes ............ ¥45,179 ¥102,157 ¥56,978 126.1
Segment Assets (Millions of yen)
2003 2004 ¥ Change % Change
Business Segments in JapanCorporate financial services ..................... ¥1,893,422 ¥1,806,686 ¥ (86,736) (4.6)Rental operations ..................................... 144,397 147,231 2,834 2.0Real estate-related finance....................... 931,513 909,019 (22,494) (2.4)Real estate............................................... 303,838 309,558 5,720 1.9Life insurance........................................... 579,805 582,473 2,668 0.5Other ....................................................... 387,978 412,505 24,527 6.3
Subtotal ............................................... 4,240,953 4,167,472 (73,481) (1.7)
Overseas Business SegmentsThe Americas........................................... 618,148 472,595 (145,553) (23.5)Asia and Oceania ..................................... 437,874 413,041 (24,833) (5.7)Europe ..................................................... 75,207 56,634 (18,573) (24.7)
Subtotal ............................................... 1,131,229 942,270 (188,959) (16.7)
Total segment assets ........................... 5,372,182 5,109,742 (262,440) (4.9)
Reconciliation of segment totals to consolidated amounts............................ (229,013) (260,548) (31,535) 13.8
Total consolidated operating assets ............. ¥5,143,169 ¥4,849,194 ¥(293,975) (5.7)
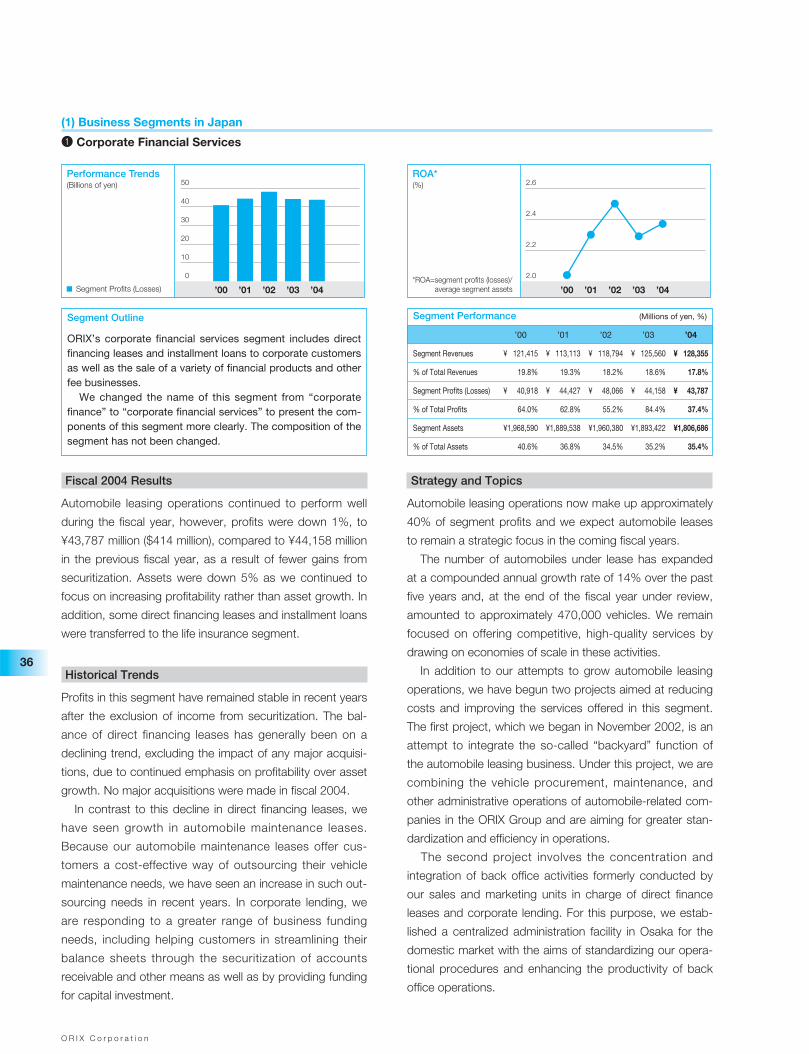
O R I X C o r p o r a t i o n
36
Fiscal 2004 Results
Automobile leasing operations continued to perform well
during the fiscal year, however, profits were down 1%, to
¥43,787 million ($414 million), compared to ¥44,158 million
in the previous fiscal year, as a result of fewer gains from
securitization. Assets were down 5% as we continued to
focus on increasing profitability rather than asset growth. In
addition, some direct financing leases and installment loans
were transferred to the life insurance segment.
Historical Trends
Profits in this segment have remained stable in recent years
after the exclusion of income from securitization. The bal-
ance of direct financing leases has generally been on a
declining trend, excluding the impact of any major acquisi-
tions, due to continued emphasis on profitability over asset
growth. No major acquisitions were made in fiscal 2004.
In contrast to this decline in direct financing leases, we
have seen growth in automobile maintenance leases.
Because our automobile maintenance leases offer cus-
tomers a cost-effective way of outsourcing their vehicle
maintenance needs, we have seen an increase in such out-
sourcing needs in recent years. In corporate lending, we
are responding to a greater range of business funding
needs, including helping customers in streamlining their
balance sheets through the securitization of accounts
receivable and other means as well as by providing funding
for capital investment.
Strategy and Topics
Automobile leasing operations now make up approximately
40% of segment profits and we expect automobile leases
to remain a strategic focus in the coming fiscal years.
The number of automobiles under lease has expanded
at a compounded annual growth rate of 14% over the past
five years and, at the end of the fiscal year under review,
amounted to approximately 470,000 vehicles. We remain
focused on offering competitive, high-quality services by
drawing on economies of scale in these activities.
In addition to our attempts to grow automobile leasing
operations, we have begun two projects aimed at reducing
costs and improving the services offered in this segment.
The first project, which we began in November 2002, is an
attempt to integrate the so-called “backyard” function of
the automobile leasing business. Under this project, we are
combining the vehicle procurement, maintenance, and
other administrative operations of automobile-related com-
panies in the ORIX Group and are aiming for greater stan-
dardization and efficiency in operations.
The second project involves the concentration and
integration of back office activities formerly conducted by
our sales and marketing units in charge of direct finance
leases and corporate lending. For this purpose, we estab-
lished a centralized administration facility in Osaka for the
domestic market with the aims of standardizing our opera-
tional procedures and enhancing the productivity of back
office operations.
(1) Business Segments in Japan
1 Corporate Financial Services
’00 ’01 ’02 ’03 ’04Segment Profits (Losses)
(Billions of yen)Performance Trends
0
10
20
30
40
50
’00 ’01 ’02 ’03 ’04
(%)ROA*
2.0
2.2
2.4
2.6
*ROA=segment profits (losses)/average segment assets
Segment Outline
ORIX’s corporate financial services segment includes directfinancing leases and installment loans to corporate customersas well as the sale of a variety of financial products and otherfee businesses.
We changed the name of this segment from “corporatefinance” to “corporate financial services” to present the com-ponents of this segment more clearly. The composition of thesegment has not been changed.
Segment Performance (Millions of yen, %)
’00 ’01 ’02 ’03 ’04
Segment Revenues ¥ 121,415 ¥ 113,113 ¥ 118,794 ¥ 125,560 ¥ 128,355
% of Total Revenues 19.8% 19.3% 18.2% 18.6% 17.8%
Segment Profits (Losses) ¥ 40,918 ¥ 44,427 ¥ 48,066 ¥ 44,158 ¥ 43,787
% of Total Profits 64.0% 62.8% 55.2% 84.4% 37.4%
Segment Assets ¥1,968,590 ¥1,889,538 ¥1,960,380 ¥1,893,422 ¥1,806,686
% of Total Assets 40.6% 36.8% 34.5% 35.2% 35.4%
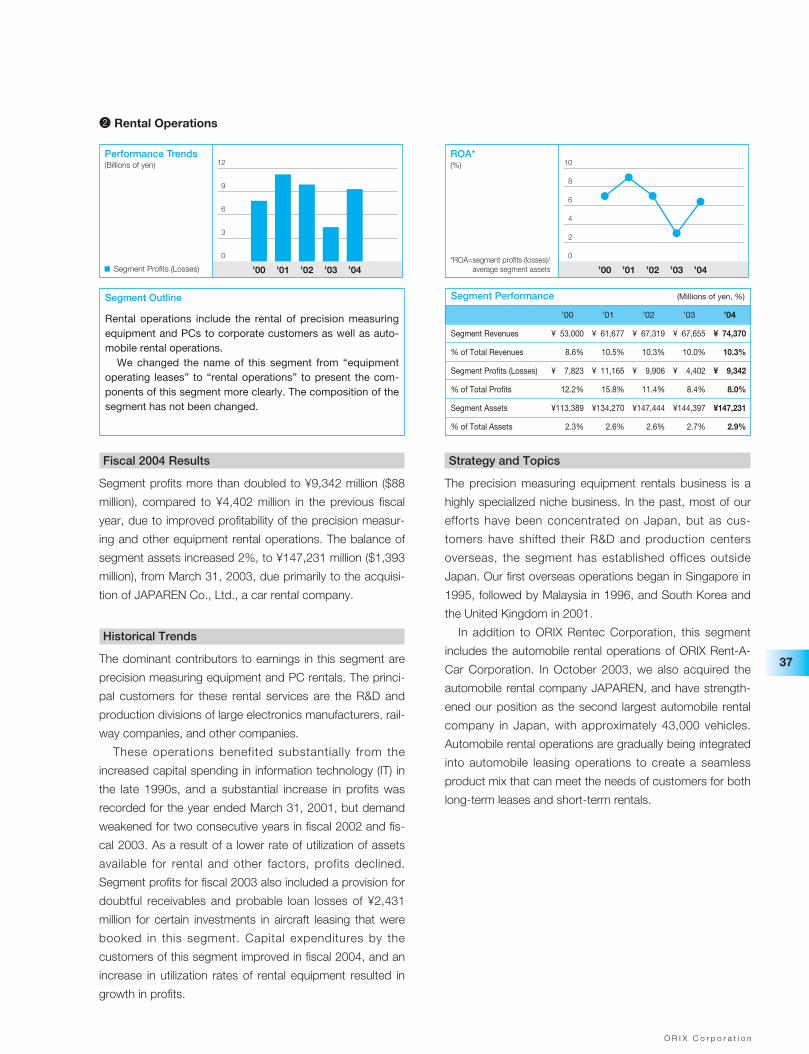
O R I X C o r p o r a t i o n
37
Fiscal 2004 Results
Segment profits more than doubled to ¥9,342 million ($88
million), compared to ¥4,402 million in the previous fiscal
year, due to improved profitability of the precision measur-
ing and other equipment rental operations. The balance of
segment assets increased 2%, to ¥147,231 million ($1,393
million), from March 31, 2003, due primarily to the acquisi-
tion of JAPAREN Co., Ltd., a car rental company.
Historical Trends
The dominant contributors to earnings in this segment are
precision measuring equipment and PC rentals. The princi-
pal customers for these rental services are the R&D and
production divisions of large electronics manufacturers, rail-
way companies, and other companies.
These operations benefited substantially from the
increased capital spending in information technology (IT) in
the late 1990s, and a substantial increase in profits was
recorded for the year ended March 31, 2001, but demand
weakened for two consecutive years in fiscal 2002 and fis-
cal 2003. As a result of a lower rate of utilization of assets
available for rental and other factors, profits declined.
Segment profits for fiscal 2003 also included a provision for
doubtful receivables and probable loan losses of ¥2,431
million for certain investments in aircraft leasing that were
booked in this segment. Capital expenditures by the
customers of this segment improved in fiscal 2004, and an
increase in utilization rates of rental equipment resulted in
growth in profits.
Strategy and Topics
The precision measuring equipment rentals business is a
highly specialized niche business. In the past, most of our
efforts have been concentrated on Japan, but as cus-
tomers have shifted their R&D and production centers
overseas, the segment has established offices outside
Japan. Our first overseas operations began in Singapore in
1995, followed by Malaysia in 1996, and South Korea and
the United Kingdom in 2001.
In addition to ORIX Rentec Corporation, this segment
includes the automobile rental operations of ORIX Rent-A-
Car Corporation. In October 2003, we also acquired the
automobile rental company JAPAREN, and have strength-
ened our position as the second largest automobile rental
company in Japan, with approximately 43,000 vehicles.
Automobile rental operations are gradually being integrated
into automobile leasing operations to create a seamless
product mix that can meet the needs of customers for both
long-term leases and short-term rentals.
2 Rental Operations
’00 ’01 ’02 ’03 ’04Segment Profits (Losses)
(Billions of yen)Performance Trends
0
3
6
9
12
’00 ’01 ’02 ’03 ’04
(%)ROA*
0
2
4
6
8
10
*ROA=segment profits (losses)/average segment assets
Segment Outline
Rental operations include the rental of precision measuringequipment and PCs to corporate customers as well as auto-mobile rental operations.
We changed the name of this segment from “equipmentoperating leases” to “rental operations” to present the com-ponents of this segment more clearly. The composition of thesegment has not been changed.
Segment Performance (Millions of yen, %)
’00 ’01 ’02 ’03 ’04
Segment Revenues ¥ 53,000 ¥ 61,677 ¥ 67,319 ¥ 67,655 ¥ 74,370
% of Total Revenues 8.6% 10.5% 10.3% 10.0% 10.3%
Segment Profits (Losses) ¥ 7,823 ¥ 11,165 ¥ 9,906 ¥ 4,402 ¥ 9,342
% of Total Profits 12.2% 15.8% 11.4% 8.4% 8.0%
Segment Assets ¥113,389 ¥134,270 ¥147,444 ¥144,397 ¥147,231
% of Total Assets 2.3% 2.6% 2.6% 2.7% 2.9%
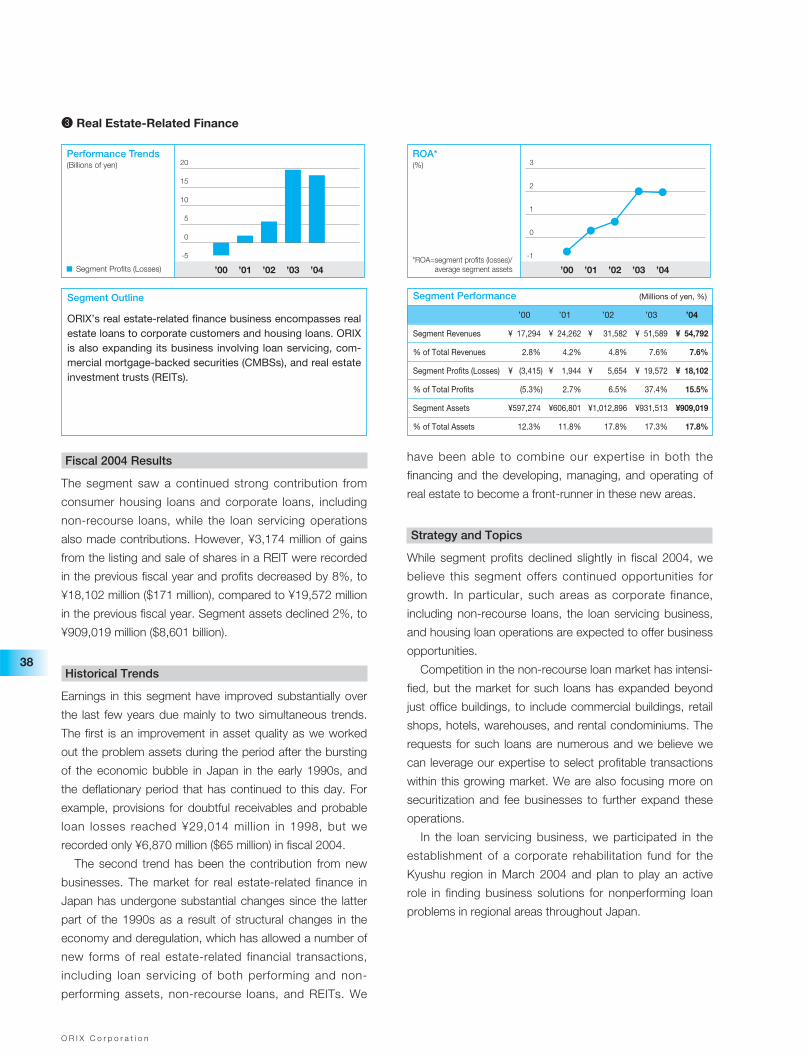
O R I X C o r p o r a t i o n
38
Fiscal 2004 Results
The segment saw a continued strong contribution from
consumer housing loans and corporate loans, including
non-recourse loans, while the loan servicing operations
also made contributions. However, ¥3,174 million of gains
from the listing and sale of shares in a REIT were recorded
in the previous fiscal year and profits decreased by 8%, to
¥18,102 million ($171 million), compared to ¥19,572 million
in the previous fiscal year. Segment assets declined 2%, to
¥909,019 million ($8,601 billion).
Historical Trends
Earnings in this segment have improved substantially over
the last few years due mainly to two simultaneous trends.
The first is an improvement in asset quality as we worked
out the problem assets during the period after the bursting
of the economic bubble in Japan in the early 1990s, and
the deflationary period that has continued to this day. For
example, provisions for doubtful receivables and probable
loan losses reached ¥29,014 million in 1998, but we
recorded only ¥6,870 million ($65 million) in fiscal 2004.
The second trend has been the contribution from new
businesses. The market for real estate-related finance in
Japan has undergone substantial changes since the latter
part of the 1990s as a result of structural changes in the
economy and deregulation, which has allowed a number of
new forms of real estate-related financial transactions,
including loan servicing of both performing and non-
performing assets, non-recourse loans, and REITs. We
have been able to combine our expertise in both the
financing and the developing, managing, and operating of
real estate to become a front-runner in these new areas.
Strategy and Topics
While segment profits declined slightly in fiscal 2004, we
believe this segment offers continued opportunities for
growth. In particular, such areas as corporate finance,
including non-recourse loans, the loan servicing business,
and housing loan operations are expected to offer business
opportunities.
Competition in the non-recourse loan market has intensi-
fied, but the market for such loans has expanded beyond
just office buildings, to include commercial buildings, retail
shops, hotels, warehouses, and rental condominiums. The
requests for such loans are numerous and we believe we
can leverage our expertise to select profitable transactions
within this growing market. We are also focusing more on
securitization and fee businesses to further expand these
operations.
In the loan servicing business, we participated in the
establishment of a corporate rehabilitation fund for the
Kyushu region in March 2004 and plan to play an active
role in finding business solutions for nonperforming loan
problems in regional areas throughout Japan.
3 Real Estate-Related Finance
’00 ’01 ’02 ’03 ’04Segment Profits (Losses)
(Billions of yen)Performance Trends
-5
0
5
10
15
20
’00 ’01 ’02 ’03 ’04
(%)ROA*
-1
0
1
2
3
*ROA=segment profits (losses)/average segment assets
Segment Outline
ORIX’s real estate-related finance business encompasses realestate loans to corporate customers and housing loans. ORIXis also expanding its business involving loan servicing, com-mercial mortgage-backed securities (CMBSs), and real estateinvestment trusts (REITs).
Segment Performance (Millions of yen, %)
’00 ’01 ’02 ’03 ’04
Segment Revenues ¥ 17,294 ¥ 24,262 ¥ 31,582 ¥ 51,589 ¥ 54,792
% of Total Revenues 2.8% 4.2% 4.8% 7.6% 7.6%
Segment Profits (Losses) ¥ (3,415) ¥ 1,944 ¥ 5,654 ¥ 19,572 ¥ 18,102
% of Total Profits (5.3%) 2.7% 6.5% 37.4% 15.5%
Segment Assets ¥597,274 ¥606,801 ¥1,012,896 ¥931,513 ¥909,019
% of Total Assets 12.3% 11.8% 17.8% 17.3% 17.8%
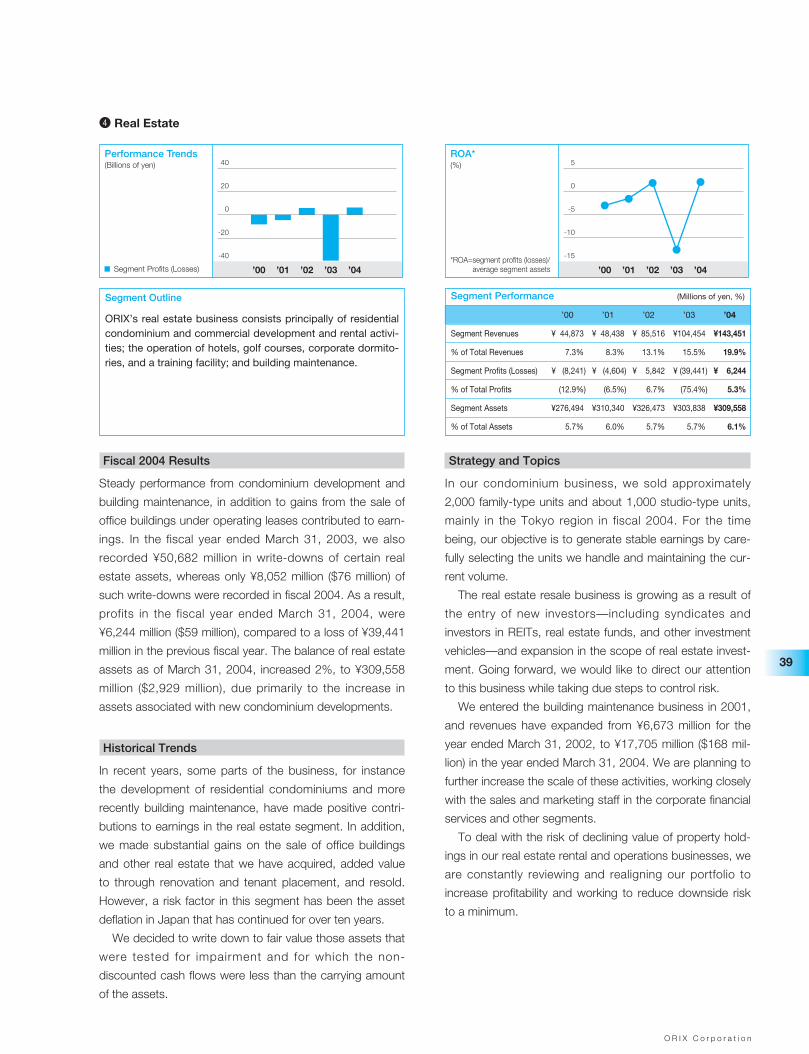
O R I X C o r p o r a t i o n
39
Fiscal 2004 Results
Steady performance from condominium development and
building maintenance, in addition to gains from the sale of
office buildings under operating leases contributed to earn-
ings. In the fiscal year ended March 31, 2003, we also
recorded ¥50,682 million in write-downs of certain real
estate assets, whereas only ¥8,052 million ($76 million) of
such write-downs were recorded in fiscal 2004. As a result,
profits in the fiscal year ended March 31, 2004, were
¥6,244 million ($59 million), compared to a loss of ¥39,441
million in the previous fiscal year. The balance of real estate
assets as of March 31, 2004, increased 2%, to ¥309,558
million ($2,929 million), due primarily to the increase in
assets associated with new condominium developments.
Historical Trends
In recent years, some parts of the business, for instance
the development of residential condominiums and more
recently building maintenance, have made positive contri-
butions to earnings in the real estate segment. In addition,
we made substantial gains on the sale of office buildings
and other real estate that we have acquired, added value
to through renovation and tenant placement, and resold.
However, a risk factor in this segment has been the asset
deflation in Japan that has continued for over ten years.
We decided to write down to fair value those assets that
were tested for impairment and for which the non-
discounted cash flows were less than the carrying amount
of the assets.
Strategy and Topics
In our condominium business, we sold approximately
2,000 family-type units and about 1,000 studio-type units,
mainly in the Tokyo region in fiscal 2004. For the time
being, our objective is to generate stable earnings by care-
fully selecting the units we handle and maintaining the cur-
rent volume.
The real estate resale business is growing as a result of
the entry of new investors—including syndicates and
investors in REITs, real estate funds, and other investment
vehicles—and expansion in the scope of real estate invest-
ment. Going forward, we would like to direct our attention
to this business while taking due steps to control risk.
We entered the building maintenance business in 2001,
and revenues have expanded from ¥6,673 million for the
year ended March 31, 2002, to ¥17,705 million ($168 mil-
lion) in the year ended March 31, 2004. We are planning to
further increase the scale of these activities, working closely
with the sales and marketing staff in the corporate financial
services and other segments.
To deal with the risk of declining value of property hold-
ings in our real estate rental and operations businesses, we
are constantly reviewing and realigning our portfolio to
increase profitability and working to reduce downside risk
to a minimum.
4 Real Estate
’00 ’01 ’02 ’03 ’04Segment Profits (Losses)
(Billions of yen)Performance Trends
-40
-20
0
20
40
’00 ’01 ’02 ’03 ’04
(%)ROA*
-15
-10
-5
0
5
*ROA=segment profits (losses)/average segment assets
Segment Outline
ORIX’s real estate business consists principally of residentialcondominium and commercial development and rental activi-ties; the operation of hotels, golf courses, corporate dormito-ries, and a training facility; and building maintenance.
Segment Performance (Millions of yen, %)
’00 ’01 ’02 ’03 ’04
Segment Revenues ¥ 44,873 ¥ 48,438 ¥ 85,516 ¥104,454 ¥143,451
% of Total Revenues 7.3% 8.3% 13.1% 15.5% 19.9%
Segment Profits (Losses) ¥ (8,241) ¥ (4,604) ¥ 5,842 ¥ (39,441) ¥ 6,244
% of Total Profits (12.9%) (6.5%) 6.7% (75.4%) 5.3%
Segment Assets ¥276,494 ¥310,340 ¥326,473 ¥303,838 ¥309,558
% of Total Assets 5.7% 6.0% 5.7% 5.7% 6.1%
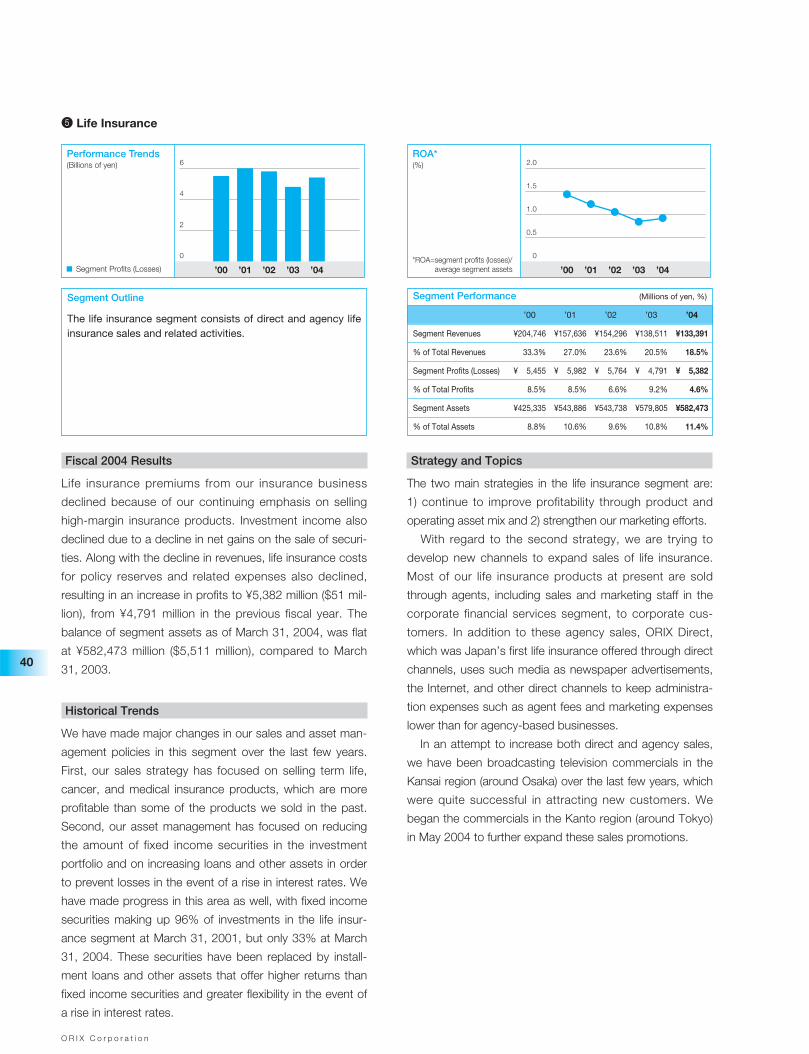
O R I X C o r p o r a t i o n
40
Fiscal 2004 Results
Life insurance premiums from our insurance business
declined because of our continuing emphasis on selling
high-margin insurance products. Investment income also
declined due to a decline in net gains on the sale of securi-
ties. Along with the decline in revenues, life insurance costs
for policy reserves and related expenses also declined,
resulting in an increase in profits to ¥5,382 million ($51 mil-
lion), from ¥4,791 million in the previous fiscal year. The
balance of segment assets as of March 31, 2004, was flat
at ¥582,473 million ($5,511 million), compared to March
31, 2003.
Historical Trends
We have made major changes in our sales and asset man-
agement policies in this segment over the last few years.
First, our sales strategy has focused on selling term life,
cancer, and medical insurance products, which are more
profitable than some of the products we sold in the past.
Second, our asset management has focused on reducing
the amount of fixed income securities in the investment
portfolio and on increasing loans and other assets in order
to prevent losses in the event of a rise in interest rates. We
have made progress in this area as well, with fixed income
securities making up 96% of investments in the life insur-
ance segment at March 31, 2001, but only 33% at March
31, 2004. These securities have been replaced by install-
ment loans and other assets that offer higher returns than
fixed income securities and greater flexibility in the event of
a rise in interest rates.
Strategy and Topics
The two main strategies in the life insurance segment are:
1) continue to improve profitability through product and
operating asset mix and 2) strengthen our marketing efforts.
With regard to the second strategy, we are trying to
develop new channels to expand sales of life insurance.
Most of our life insurance products at present are sold
through agents, including sales and marketing staff in the
corporate financial services segment, to corporate cus-
tomers. In addition to these agency sales, ORIX Direct,
which was Japan’s first life insurance offered through direct
channels, uses such media as newspaper advertisements,
the Internet, and other direct channels to keep administra-
tion expenses such as agent fees and marketing expenses
lower than for agency-based businesses.
In an attempt to increase both direct and agency sales,
we have been broadcasting television commercials in the
Kansai region (around Osaka) over the last few years, which
were quite successful in attracting new customers. We
began the commercials in the Kanto region (around Tokyo)
in May 2004 to further expand these sales promotions.
5 Life Insurance
’00 ’01 ’02 ’03 ’04Segment Profits (Losses)
(Billions of yen)Performance Trends
0
2
4
6
’00 ’01 ’02 ’03 ’04
(%)ROA*
0
0.5
1.0
1.5
2.0
*ROA=segment profits (losses)/average segment assets
Segment Outline
The life insurance segment consists of direct and agency lifeinsurance sales and related activities.
Segment Performance (Millions of yen, %)
’00 ’01 ’02 ’03 ’04
Segment Revenues ¥204,746 ¥157,636 ¥154,296 ¥138,511 ¥133,391
% of Total Revenues 33.3% 27.0% 23.6% 20.5% 18.5%
Segment Profits (Losses) ¥ 5,455 ¥ 5,982 ¥ 5,764 ¥ 4,791 ¥ 5,382
% of Total Profits 8.5% 8.5% 6.6% 9.2% 4.6%
Segment Assets ¥425,335 ¥543,886 ¥543,738 ¥579,805 ¥582,473
% of Total Assets 8.8% 10.6% 9.6% 10.8% 11.4%
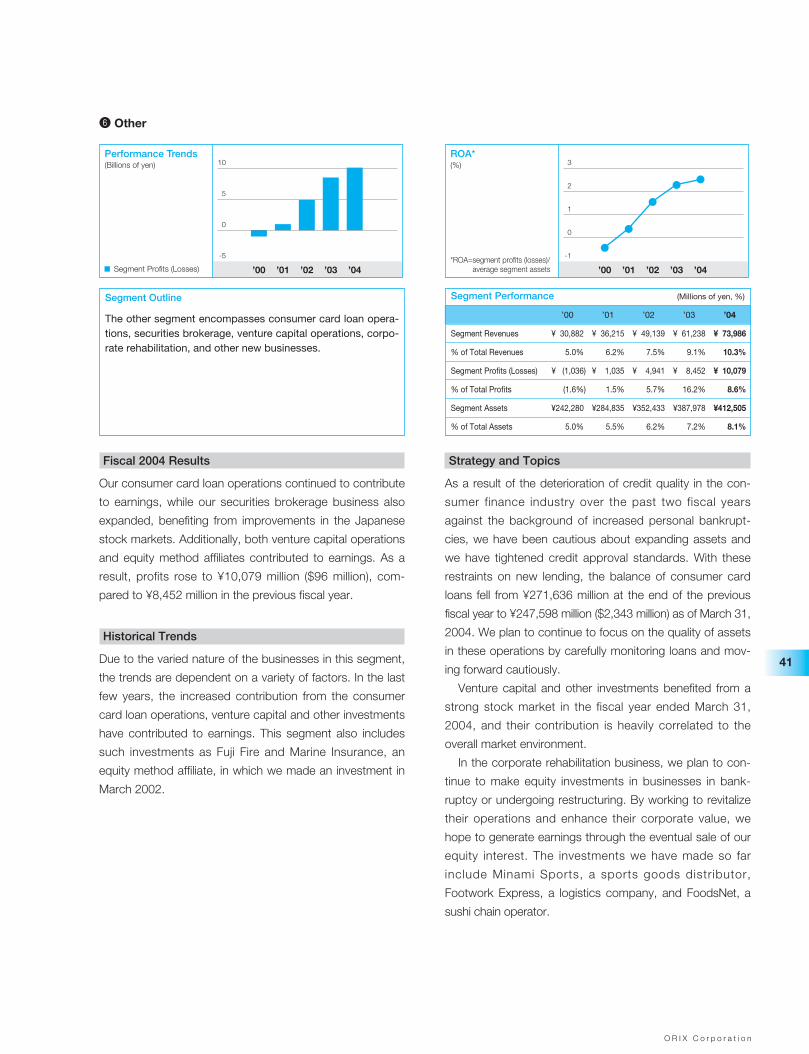
O R I X C o r p o r a t i o n
41
Fiscal 2004 Results
Our consumer card loan operations continued to contribute
to earnings, while our securities brokerage business also
expanded, benefiting from improvements in the Japanese
stock markets. Additionally, both venture capital operations
and equity method affiliates contributed to earnings. As a
result, profits rose to ¥10,079 million ($96 million), com-
pared to ¥8,452 million in the previous fiscal year.
Historical Trends
Due to the varied nature of the businesses in this segment,
the trends are dependent on a variety of factors. In the last
few years, the increased contribution from the consumer
card loan operations, venture capital and other investments
have contributed to earnings. This segment also includes
such investments as Fuji Fire and Marine Insurance, an
equity method affiliate, in which we made an investment in
March 2002.
Strategy and Topics
As a result of the deterioration of credit quality in the con-
sumer finance industry over the past two fiscal years
against the background of increased personal bankrupt-
cies, we have been cautious about expanding assets and
we have tightened credit approval standards. With these
restraints on new lending, the balance of consumer card
loans fell from ¥271,636 million at the end of the previous
fiscal year to ¥247,598 million ($2,343 million) as of March 31,
2004. We plan to continue to focus on the quality of assets
in these operations by carefully monitoring loans and mov-
ing forward cautiously.
Venture capital and other investments benefited from a
strong stock market in the fiscal year ended March 31,
2004, and their contribution is heavily correlated to the
overall market environment.
In the corporate rehabilitation business, we plan to con-
tinue to make equity investments in businesses in bank-
ruptcy or undergoing restructuring. By working to revitalize
their operations and enhance their corporate value, we
hope to generate earnings through the eventual sale of our
equity interest. The investments we have made so far
include Minami Sports, a sports goods distributor,
Footwork Express, a logistics company, and FoodsNet, a
sushi chain operator.
6 Other
’00 ’01 ’02 ’03 ’04Segment Profits (Losses)
(Billions of yen)Performance Trends
-5
0
5
10
’00 ’01 ’02 ’03 ’04
(%)ROA*
-1
0
1
2
3
*ROA=segment profits (losses)/average segment assets
Segment Outline
The other segment encompasses consumer card loan opera-tions, securities brokerage, venture capital operations, corpo-rate rehabilitation, and other new businesses.
Segment Performance (Millions of yen, %)
’00 ’01 ’02 ’03 ’04
Segment Revenues ¥ 30,882 ¥ 36,215 ¥ 49,139 ¥ 61,238 ¥ 73,986
% of Total Revenues 5.0% 6.2% 7.5% 9.1% 10.3%
Segment Profits (Losses) ¥ (1,036) ¥ 1,035 ¥ 4,941 ¥ 8,452 ¥ 10,079
% of Total Profits (1.6%) 1.5% 5.7% 16.2% 8.6%
Segment Assets ¥242,280 ¥284,835 ¥352,433 ¥387,978 ¥412,505
% of Total Assets 5.0% 5.5% 6.2% 7.2% 8.1%
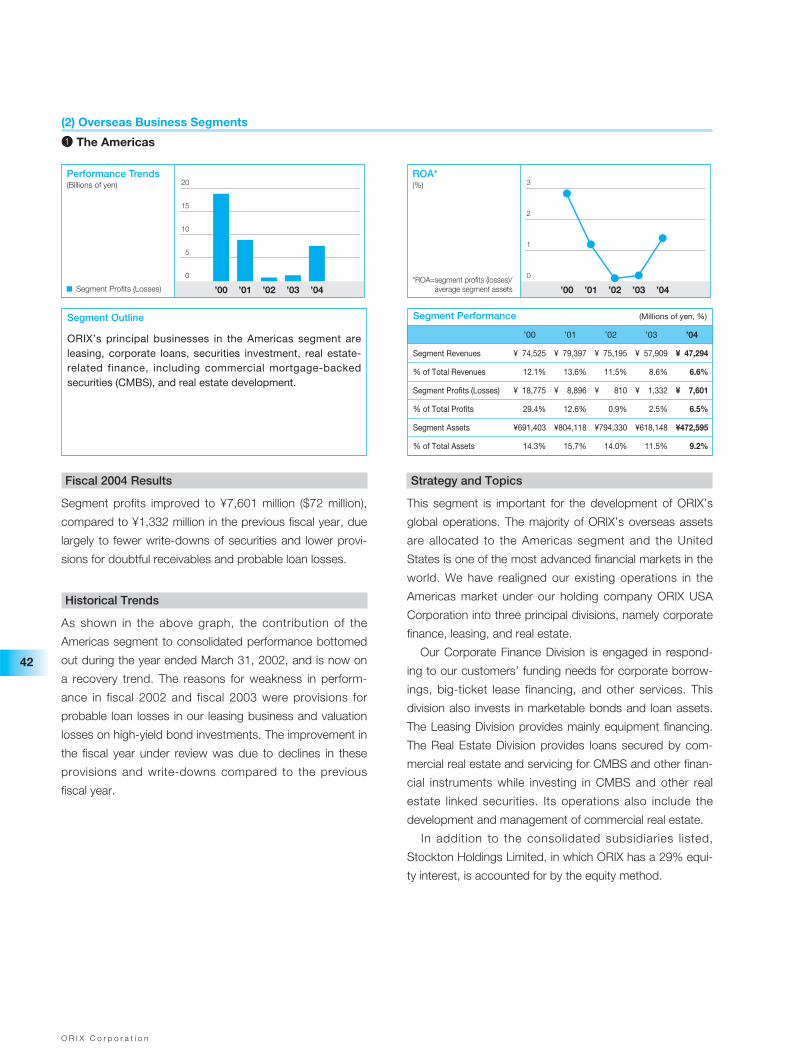
O R I X C o r p o r a t i o n
42
Fiscal 2004 Results
Segment profits improved to ¥7,601 million ($72 million),
compared to ¥1,332 million in the previous fiscal year, due
largely to fewer write-downs of securities and lower provi-
sions for doubtful receivables and probable loan losses.
Historical Trends
As shown in the above graph, the contribution of the
Americas segment to consolidated performance bottomed
out during the year ended March 31, 2002, and is now on
a recovery trend. The reasons for weakness in perform-
ance in fiscal 2002 and fiscal 2003 were provisions for
probable loan losses in our leasing business and valuation
losses on high-yield bond investments. The improvement in
the fiscal year under review was due to declines in these
provisions and write-downs compared to the previous
fiscal year.
Strategy and Topics
This segment is important for the development of ORIX’s
global operations. The majority of ORIX’s overseas assets
are allocated to the Americas segment and the United
States is one of the most advanced financial markets in the
world. We have realigned our existing operations in the
Americas market under our holding company ORIX USA
Corporation into three principal divisions, namely corporate
finance, leasing, and real estate.
Our Corporate Finance Division is engaged in respond-
ing to our customers’ funding needs for corporate borrow-
ings, big-ticket lease financing, and other services. This
division also invests in marketable bonds and loan assets.
The Leasing Division provides mainly equipment financing.
The Real Estate Division provides loans secured by com-
mercial real estate and servicing for CMBS and other finan-
cial instruments while investing in CMBS and other real
estate linked securities. Its operations also include the
development and management of commercial real estate.
In addition to the consolidated subsidiaries listed,
Stockton Holdings Limited, in which ORIX has a 29% equi-
ty interest, is accounted for by the equity method.
(2) Overseas Business Segments
1 The Americas
’00 ’01 ’02 ’03 ’04Segment Profits (Losses)
(Billions of yen)Performance Trends
0
5
10
15
20
’00 ’01 ’02 ’03 ’04
(%)ROA*
0
1
2
3
*ROA=segment profits (losses)/average segment assets
Segment Outline
ORIX’s principal businesses in the Americas segment areleasing, corporate loans, securities investment, real estate-related finance, including commercial mortgage-backedsecurities (CMBS), and real estate development.
Segment Performance (Millions of yen, %)
’00 ’01 ’02 ’03 ’04
Segment Revenues ¥ 74,525 ¥ 79,397 ¥ 75,195 ¥ 57,909 ¥ 47,294
% of Total Revenues 12.1% 13.6% 11.5% 8.6% 6.6%
Segment Profits (Losses) ¥ 18,775 ¥ 8,896 ¥ 810 ¥ 1,332 ¥ 7,601
% of Total Profits 29.4% 12.6% 0.9% 2.5% 6.5%
Segment Assets ¥691,403 ¥804,118 ¥794,330 ¥618,148 ¥472,595
% of Total Assets 14.3% 15.7% 14.0% 11.5% 9.2%
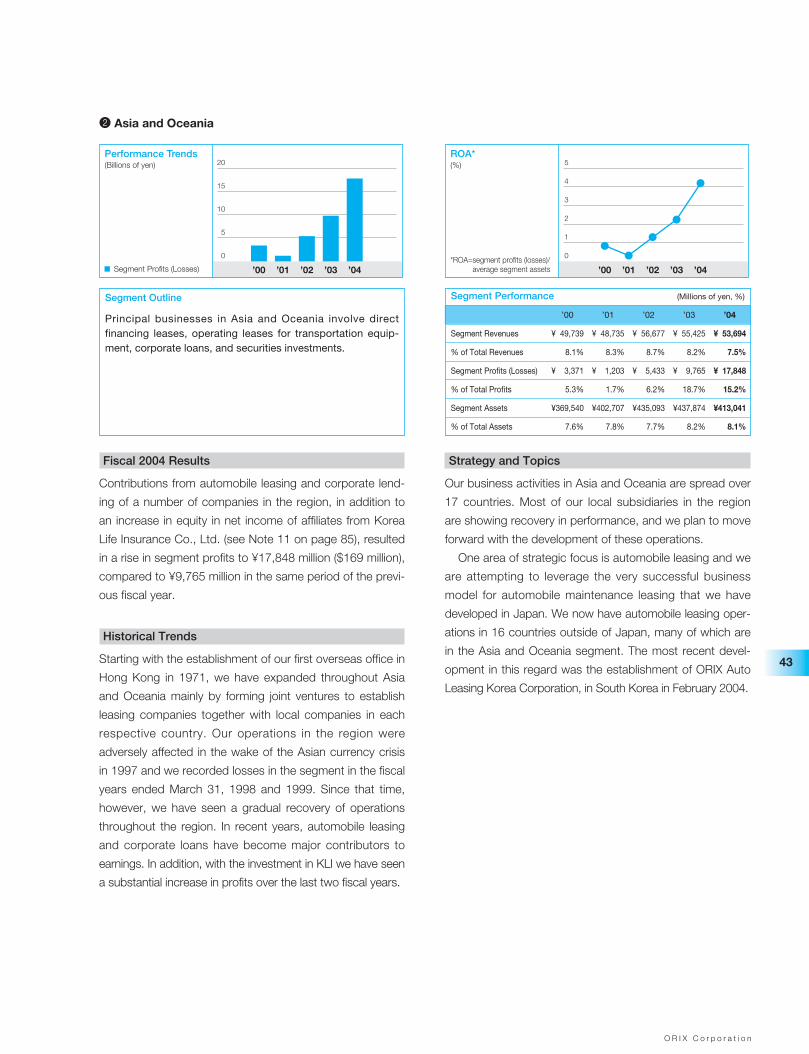
O R I X C o r p o r a t i o n
43
Fiscal 2004 Results
Contributions from automobile leasing and corporate lend-
ing of a number of companies in the region, in addition to
an increase in equity in net income of affiliates from Korea
Life Insurance Co., Ltd. (see Note 11 on page 85), resulted
in a rise in segment profits to ¥17,848 million ($169 million),
compared to ¥9,765 million in the same period of the previ-
ous fiscal year.
Historical Trends
Starting with the establishment of our first overseas office in
Hong Kong in 1971, we have expanded throughout Asia
and Oceania mainly by forming joint ventures to establish
leasing companies together with local companies in each
respective country. Our operations in the region were
adversely affected in the wake of the Asian currency crisis
in 1997 and we recorded losses in the segment in the fiscal
years ended March 31, 1998 and 1999. Since that time,
however, we have seen a gradual recovery of operations
throughout the region. In recent years, automobile leasing
and corporate loans have become major contributors to
earnings. In addition, with the investment in KLI we have seen
a substantial increase in profits over the last two fiscal years.
Strategy and Topics
Our business activities in Asia and Oceania are spread over
17 countries. Most of our local subsidiaries in the region
are showing recovery in performance, and we plan to move
forward with the development of these operations.
One area of strategic focus is automobile leasing and we
are attempting to leverage the very successful business
model for automobile maintenance leasing that we have
developed in Japan. We now have automobile leasing oper-
ations in 16 countries outside of Japan, many of which are
in the Asia and Oceania segment. The most recent devel-
opment in this regard was the establishment of ORIX Auto
Leasing Korea Corporation, in South Korea in February 2004.
2 Asia and Oceania
’00 ’01 ’02 ’03 ’04Segment Profits (Losses)
(Billions of yen)Performance Trends
0
5
10
15
20
’00 ’01 ’02 ’03 ’04
(%)ROA*
0
1
2
3
4
5
*ROA=segment profits (losses)/average segment assets
Segment Outline
Principal businesses in Asia and Oceania involve directfinancing leases, operating leases for transportation equip-ment, corporate loans, and securities investments.
Segment Performance (Millions of yen, %)
’00 ’01 ’02 ’03 ’04
Segment Revenues ¥ 49,739 ¥ 48,735 ¥ 56,677 ¥ 55,425 ¥ 53,694
% of Total Revenues 8.1% 8.3% 8.7% 8.2% 7.5%
Segment Profits (Losses) ¥ 3,371 ¥ 1,203 ¥ 5,433 ¥ 9,765 ¥ 17,848
% of Total Profits 5.3% 1.7% 6.2% 18.7% 15.2%
Segment Assets ¥369,540 ¥402,707 ¥435,093 ¥437,874 ¥413,041
% of Total Assets 7.6% 7.8% 7.7% 8.2% 8.1%
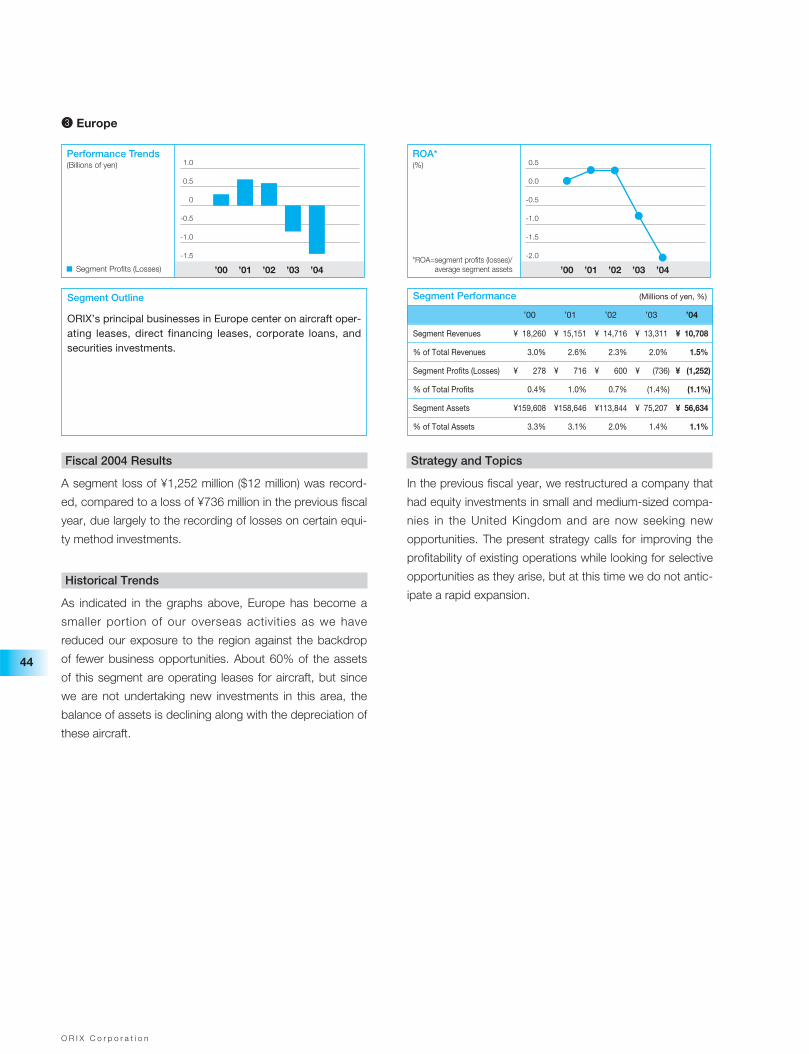
O R I X C o r p o r a t i o n
44
Fiscal 2004 Results
A segment loss of ¥1,252 million ($12 million) was record-
ed, compared to a loss of ¥736 million in the previous fiscal
year, due largely to the recording of losses on certain equi-
ty method investments.
Historical Trends
As indicated in the graphs above, Europe has become a
smaller portion of our overseas activities as we have
reduced our exposure to the region against the backdrop
of fewer business opportunities. About 60% of the assets
of this segment are operating leases for aircraft, but since
we are not undertaking new investments in this area, the
balance of assets is declining along with the depreciation of
these aircraft.
Strategy and Topics
In the previous fiscal year, we restructured a company that
had equity investments in small and medium-sized compa-
nies in the United Kingdom and are now seeking new
opportunities. The present strategy calls for improving the
profitability of existing operations while looking for selective
opportunities as they arise, but at this time we do not antic-
ipate a rapid expansion.
3 Europe
’00 ’01 ’02 ’03 ’04Segment Profits (Losses)
(Billions of yen)Performance Trends
-1.5
-1.0
-0.5
0
0.5
1.0
’00 ’01 ’02 ’03 ’04
(%)ROA*
-2.0
-1.5
-1.0
-0.5
0.0
0.5
*ROA=segment profits (losses)/average segment assets
Segment Outline
ORIX’s principal businesses in Europe center on aircraft oper-ating leases, direct financing leases, corporate loans, andsecurities investments.
Segment Performance (Millions of yen, %)
’00 ’01 ’02 ’03 ’04
Segment Revenues ¥ 18,260 ¥ 15,151 ¥ 14,716 ¥ 13,311 ¥ 10,708
% of Total Revenues 3.0% 2.6% 2.3% 2.0% 1.5%
Segment Profits (Losses) ¥ 278 ¥ 716 ¥ 600 ¥ (736) ¥ (1,252)
% of Total Profits 0.4% 1.0% 0.7% (1.4%) (1.1%)
Segment Assets ¥159,608 ¥158,646 ¥113,844 ¥ 75,207 ¥ 56,634
% of Total Assets 3.3% 3.1% 2.0% 1.4% 1.1%
O R I X C o r p o r a t i o n
45
5. F u n d i n g a n d L i q u i d i t y
(1) Funding Strategy
ORIX has continued to diversify its funding methods and
sources over the years in order to maintain stable access
to funding and reduce its interest expense. We also flexibly
adjust our funding structure to adapt to changing market
environments and strive to consistently monitor risks asso-
ciated with fluctuations in interest rates and liquidity levels
to promptly respond to changes in the financial environment.
(2) Balance of Borrowings from Financial Institutions
and the Capital Markets
ORIX’s funding includes borrowings from financial institu-
tions and direct fund procurement from the capital mar-
kets. Among our diverse borrowing sources are city banks,
trust banks, regional banks, agriculture-related financial
institutions, life insurance companies, casualty insurance
companies, and foreign banks. ORIX had borrowings from
approximately 200 such institutions as of March 31, 2004.
We procure funds directly from the capital markets through
the issuance of corporate bonds, commercial paper (CP),
and medium-term notes (MTNs) as well as the securitiza-
tion of leasing and other assets.
To facilitate funding operations, we have obtained credit
ratings for our notes and bonds from two Japanese rating
agencies. As of May 31, 2004, ORIX’s domestically issued
straight bonds and a euro MTN program have been
assigned A+ ratings by both Rating and Investment
Information Inc. (R&I) and Japan Credit Rating Agency, Ltd.
(JCR). ORIX’s domestic CP is rated a-1 by R&I and J-1 by
JCR. Standard & Poor’s has assigned ORIX a rating of
BBB+ and Moody’s Investors Service, a rating of Baa3.
The share of funds raised directly from the capital mar-
kets (excluding off-balance-sheet sources) at March 31,
2004, was 48%, the same as for the previous fiscal year-
end. We adjust the ratios of borrowings from financial insti-
tutions and capital markets depending on the market
environment and aim to consistently maintain an optimal
funding structure.
(3) Diversification of Funding Methods
As deregulation gains momentum in Japan, we are diversi-
fying our funding by continually seeking out and developing
new procurement methods. Moreover, because our funding
from the capital markets targets a wide range of investors,
we have been able to make our funding operations increas-
ingly diverse and stable.
The prohibition on the issuance of CP by finance com-
panies was eliminated in June 1993 in Japan. In April 1998,
the sale of CP directly to investors without going through
brokers was made possible by additional deregulation.
ORIX has energetically worked to increase the number of
investors to whom it directly sells CP, which include such
entities as asset management companies, life and casualty
insurance companies, regional banks, and other types of
companies.
ORIX’s outstanding balance of CP, as of March 31,
2004, was ¥420,280 million, versus ¥527,263 million at the
end of the previous fiscal year. Also, at the end of the fiscal
year under review, the number of companies that had
invested directly in ORIX’s CP was 455, and the balance
of CP issued directly to such investors in Japan accounted
for 91% of ORIX’s domestic CP outstanding. In addition,
beginning March 31, 2003, paperless (electronic) CP trans-
actions were introduced into Japan, and ORIX made the
first domestic issue of electronic CP on the same day.
Moreover, in February 2004, ORIX made the first public
offering in Japan of electronic CP to small and medium-
sized enterprises, with the objectives of diversifying its
funding sources and enlarging its base of investors. While
attempting to control the risks associated with settlement
and clearance, we plan to continue to issue electronic CP
to broaden our investor base and promote the creation
of more efficient and broad-based primary and secondary
CP markets. At the end of fiscal 2004, electronic CP
accounted for 61% of ORIX’s balance of CP outstanding
in Japan.
In step with the expansion of the bond market in Japan,
we have actively issued yen-denominated straight bonds in
the Japanese market. In order to further diversify funding
methods and investors, ORIX separately issues bonds that
are primarily for institutional investors and those that are
primarily for individual investors.
The balance of straight bonds issued by ORIX (including
private placements) held by domestic institutional investors
was ¥378,000 million ($3,576 million) at March 31, 2004,
versus ¥388,000 million held at the end of the previous
O R I X C o r p o r a t i o n
46
fiscal year. Individual investors owned ¥365,000 million
($3,453 million) of ORIX’s straight bonds at March 31,
2004, and ¥370,000 million at the previous fiscal year-end.
In January 1992, ORIX became the first company in
Japan to securitize leasing assets. Since that time, we have
actively used asset securitization in Japan and overseas.
As of March 31, 2004, the outstanding balance of securitized
assets, including such assets as leasing and loan assets,
stood at ¥437,650 million ($4,140 million) on a consolidat-
ed basis. Of this figure, the portion accounted for as off-
balance sheet assets was ¥339,943 million ($3,216 million).
Regarding overseas funding operations, in addition to
borrowing from local markets, efforts have been made to
increase the diversity of funding methods through such
measures as MTN issuance. ORIX and five overseas sub-
sidiaries are participants in a Multi-Issuer Euro MTN pro-
gram with a maximum issuance limit of $5 billion. This
arrangement enables ORIX to have a highly flexible funding
program. Euro MTN issuance is determined based on the
funding needs of overseas companies under the supervi-
sion of ORIX’s Treasury Department in Tokyo. As of March
31, 2004, the outstanding balance of ORIX’s MTNs was
¥159,332 million ($1,508 million).
In September 1998, ORIX listed its shares on the New
York Stock Exchange (NYSE), a move that has facilitated
raising funds through the issuance of stock outside Japan
since that date. In October 1999, ORIX became the first
Japan-based company to make a global offering involving
the simultaneous issue of new shares and convertible
notes registered with the Securit ies & Exchange
Commission (SEC) and listed on the NYSE, issuing 3.3 mil-
lion new shares and ¥40 billion (principal amount) in con-
vertible bonds due 2005. In December 2001, ORIX made
another dual offering of new shares and convertible bonds,
issuing 1.8 million new shares and ¥28 billion (principal
amount) in convertible bonds due 2007.
As part of our continued efforts to diversify funding
sources, in June 2002 we issued Liquid Yield Option
NotesTM with stock acquisition rights, due June 14, 2022
(par value of $1,022 million), and procured $400 million.
Because these notes included a contingent conversion
provision that effectively makes conversion more difficult,
the securities are not required to be included in the calcula-
tion of diluted earnings per share if ORIX’s share price does
not reach a certain trigger price. The issuance was the first
of its kind by a Japanese company.
In October 2003, we filed a universal shelf registration
statement with the SEC on Form F-3, permitting offerings
in the United States of up to an aggregate maximum offer-
ing price of $500 million or the equivalent in foreign denom-
inated currency or currency units of senior debt securities,
subordinated debt securities, warrants, common stock,
preferred stock, and American Depository Shares (ADSs).
These securities may be offered separately or together with
other offered securities.
(4) Liquidity
ORIX manages its liquidity by monitoring the schedule for
maturities of assets and liabilities and raises funds as need-
ed from financial institutions and capital markets in Japan
and overseas. Funds raised are used efficiently to acquire
new assets or to meet obligations for repayment of liabili-
ties. ORIX raises the funds it requires while monitoring both
operating cash needs and the inflow and outflow of funds.
To sustain a high level of liquidity, ORIX has secured
committed credit lines with a number of financial institu-
tions. Total committed credit lines for ORIX and its sub-
sidiaries were ¥862,147 million and ¥875,797 million
($8,286 million) at March 31, 2003 and 2004, respectively.
Of these lines, ¥797,449 million and ¥765,608 million
($7,244 million) were available at March 31, 2003 and
2004, respectively. Included in these commitment lines are
global commitment lines for major overseas subsidiaries
totaling ¥97,926 million ($927 million), with ¥94,657 million
($896 million) available at March 31, 2004.
O R I X C o r p o r a t i o n
47
6. R i s k M a n a g e m e n t
Overview
We consider the management of risk such as credit risk,
market risk, and other risks essential to conducting our
businesses and to increasing our corporate value.
Accordingly, we have designed our risk management sys-
tem to identify, analyze, evaluate, and measure our risks,
and to set appropriate policies and limits to manage and
hedge such risks. Our risk management system has been
established through the development of what we consider
to be reliable administrative and information systems and
other policies and programs. We attempt to control or
hedge these risks by utilizing a risk management system
that manages both overall risk as well as specific risks
associated with individual transactions, businesses, and
overseas geographical regions.
(1) Four Components of Risk Management
Our risk management system is made up of four principal
components. The first component consists of the sales and
marketing departments. For example, our sales and mar-
keting staff are responsible for important credit risk man-
agement functions, including carrying out initial credit
analyses and evaluations with respect to potential transac-
tions. These staff are also required to monitor risks and
manage and collect problem assets with respect to origi-
nated transactions.
The second component involves specialized groups
responsible for risk management. These include:
• The Risk Management Headquarters, which is primari-
ly responsible for risks associated with asset quality
and comprises four groups—the Credit Evaluation and
Due Diligence Group, the Risk Monitoring Group, the
Risk Management Group, and the Real Estate
Appraisal Group.
• The Treasury Department, which is responsible for
domestic and overseas funding strategy as well as
funding-related risks, including interest-rate risk, liquidi-
ty risk, exchange rate risk, and derivative risk.
• The Compliance Coordination Office, which creates
and operates systems for ensuring rigorous compli-
ance with laws and regulations as well as ORIX’s own
internal rules.
The third component of our risk management system is
our Investment and Credit Committee which comprises top
management, including the CEO, COO, CFO, and the
executive officer in charge of risk management. The
Investment and Credit Committee meets on average three
times a month to review and approve or reject individual
credit transactions and investments that exceed certain
specified credit or investment amounts.
In addition to the detailed risk management that is car-
ried out for each transaction with regard to the aforemen-
tioned three components, our monthly strategy meetings
add a fourth component to our risk management system.
These meetings perform a particularly important role in the
monitoring and control of the various businesses in which
we are involved. Top management, including ordinarily the
CEO, COO, and CFO, attend these meetings. The meet-
ings are held separately once a month for each of our divi-
sions and for each of our major subsidiaries, including our
overseas subsidiaries. In the meetings, the management
directly responsible for the division or subsidiary in question
discusses its respective businesses with top management.
The meetings begin with quantitative reports of financial
targets and results of the division or subsidiary in question.
Discussions are then conducted on current and future proj-
ects, market trends, and other issues that could potentially
affect the particular division or subsidiary’s profitability.
Matters considered vitally important to our operations are
decided on by the Investment and Credit Committee and
reported to the Board of Directors as appropriate.
(2) Controlling a Variety of Risks
Our business activities involve various elements of risk. We
consider the principal risks of our business to be credit risk
and market risk, although our business is also subject to
other risks such as liquidity risk, operational risk, legal risk,
and investment risk. We attempt to control these risks as
described below.
(a) Credit Risk Management
Our credit risk management system consists of three basic
steps: 1 initial evaluations of each potential transaction;
2 corrective action implementation for the management of
defaults and other problem transactions; and 3 portfolio
management of originated transactions.
O R I X C o r p o r a t i o n
48
1 Initial Evaluation
Based on criteria that include the total exposure to a cus-
tomer, staff members in ORIX’s sales and marketing
departments are authorized to approve individual credit
transactions within specific limits according to the seniority
of the relevant staff member. If a proposed transaction
exceeds such limits, it must be referred to the Risk
Management Headquarters for approval. If the transaction
value exceeds the approval limit of the Risk Management
Headquarters, the matter is referred to the Investment and
Credit Committee for approval.
In connection with each potential credit transaction, the
relevant sales and marketing department and the Risk
Management Headquarters each perform a comprehensive
customer credit analysis and evaluation based on the rele-
vant customer’s financial position, past transactional per-
formance, and potential cash flow, and on the quality of the
relevant collateral. The credit risk analysis and evaluation
also cover the proposed contractual structure, terms and
conditions, and potential profitability of the transaction.
To ensure that the credit evaluation process is efficiently
executed, we have created a database of rules and manu-
als on credit limits, procedures, credit evaluations, collateral,
and collection. These rules define credit evaluation standards,
including fundamental credit limits based on each customer’s
aggregate credit balance as well as other standards that
enable flexible and rapid decision making, with clear guide-
lines for determining which transactions should be handled
speedily and which should be afforded more prudent atten-
tion in line with such factors as the nature of the proposed
transaction as well as the proposed collateral, the exis-
tence of guarantees, the term of the credit, and the use of
proceeds. We regularly review these manuals and improve
and revise them as we deem necessary or desirable.
Limits on investments and on the provision of credit by
our subsidiaries in Japan and overseas are set in a similar
manner. Each subsidiary is authorized to approve credit
transactions up to a specific limit and any amounts above
that l imit are referred to our Risk Management
Headquarters or the Investment and Credit Committee, as
appropriate, for ultimate determination. Our subsidiaries in
Japan and overseas observe systems and procedure man-
uals that are similar to those used by ORIX. These systems
and procedure manuals contain appropriate modifications,
however, to take into account: (i) in the case of our
subsidiaries in Japan, the particular nature of each such
subsidiary’s business and (ii) in the case of our overseas
subsidiaries, the particular local business practices and
economic conditions present and the nature of the transac-
tions being undertaken by each such subsidiary. For some of
these subsidiaries, the Risk Management Headquarters reg-
ularly conducts by-country, by-region, and by-industry evalu-
ations to minimize exposure to potentially high-risk markets.
2 Corrective Action
Our Risk Management Headquarters obtains information
on bankruptcies, dishonored bills, and corporate perform-
ance from a number of credit data banks on a daily basis.
This information is entered into a central database, which is
used to prepare industry analysis reports and warning
reports that are provided to relevant sales and marketing
departments to keep them current on the condition of
important customers. In cases where concerns associated
with certain industries or customers arise, we take meas-
ures that may include freezing the extension of new credit,
or reducing our existing exposure, to the industry or cus-
tomer in question.
In October 2003, ORIX consolidated the collection sec-
tions formerly operating in each sales and marketing
department and the credit analysis department into a single
Receivables Administration Office with the aim of taking
speedy and efficient action for problem assets and improv-
ing capabilities for recovering such assets. The objectives
of this unit include concentrating the knowledge and know-
how regarding debt collection, and, when problem assets
emerge, working with the sales and marketing departments
from an early stage to adopt effective collection methods
and thereby contribute to improving collection results.
Preliminary reports on problem assets are prepared and
delivered to the appropriate responsible person in accor-
dance with internal procedures as soon as the problems
occur, and all pertinent data on such problem assets are
entered into our proprietary database. Our sales and mar-
keting departments work together with our Receivables
Administration Office to maintain accurate records of delin-
quencies and to collect on individual problem assets.
Collection progress is reported to different levels of man-
agement depending on the size of the assets at stake.
Furthermore, our sales and marketing departments make
regular reports to top management on the amount and
O R I X C o r p o r a t i o n
49
expected recovery of individual nonperforming assets
exceeding specified amounts. In addition, our Receivables
Administration Office carries out a detailed analysis of all
new problem assets reported each month and on the con-
ditions of those assets. This analysis is reported to top
management monthly.
In making collections, an early response is extremely
important. When information is received regarding the
emergence of nonperforming assets, the Receivables
Administration Office goes into action immediately in coop-
eration with the relevant sales and marketing departments
to take steps to secure the exposure and make collections.
The Receivables Administration Office plays a highly effec-
tive role in recovering problem exposure by drawing on its
accumulated experience in collections and, working closely
with the sales and marketing departments, provides them
with appropriate direction, beginning with early surveillance
and extending to compulsory legal measures including
seizure of collateral pledged against the exposure and
other assets.
3 Portfolio Management
Just as we must manage the risks inherent in each individ-
ual credit extension and transaction, in the Risk
Management Headquarters we separately manage the
credit risks associated with the individual and overall asset
portfolios themselves. Both in Japan and overseas, we reg-
ularly evaluate our asset portfolios involving major borrow-
ers by each transactional category as well as by industry and
type of collateral guarantee in an attempt to prevent undue
levels of exposure to specific customers or industries.
In our operations in Japan, we perform the analysis of
asset portfolios from different perspectives to focus on
trends in certain industries or particular transactions, such
as non-recourse loan transactions. The results of these
analyses are reported regularly to top management. We
further classify and manage overseas asset portfolios by
region, country, transactional currency, and other charac-
teristics. Assessments of each of our subsidiary’s asset
quality and internal credit procedures are reported regularly
to top management.
Using a default probability model developed by ORIX,
the Risk Management Headquarters performs a value-at-risk
analysis on certain operating assets in Japan and measures
risks by credit rating, industry, and business segment.
(b) Market Risk Management
We believe the market risk of our business comprises six
primary components: 1 interest rate risk; 2 exchange rate
risk; 3 derivatives risk; 4 asset deflation risk; 5 residual
value risk; and 6 risk associated with the market values of
equity and debt securities.
1 Interest Rate Risk Management
We attempt to manage interest rate risk through our asset-
liability management, or ALM, systems. Our ALM systems
are designed to provide quantitative indicators of interest
rate risk by incorporating information on our interest-earning
assets and interest-bearing liabilities as well as market
interest rates. In fiscal 2003, IFCO Inc. became one of the
five group companies covered by our combined ALM sys-
tem, which also covers ORIX, ORIX Alpha Corporation,
ORIX Auto Leasing Corporation, and ORIX Credit
Corporation. Including the independent ALM systems of
ORIX Trust and Banking Corporation and ORIX Life
Insurance Corporation, seven companies in Japan are now
covered by an ALM system and we plan to expand the
systems to cover more of our subsidiaries in the future.
The ALM report is updated monthly and reported at our
monthly strategy meetings to enable rapid decision making
with regard to interest rate risk. The analysis in these
reports help us identify and manage the mismatch in the
duration of assets and liabilities. We measure our liquidity
risk with cash flow maps that are provided in the reports.
The reports help us monitor and manage the effects of
duration and basis point value, or BPV, on interest rate
fluctuations. In this way, we attempt to implement risk con-
trol procedures that keep the impact of interest rate fluctu-
ations on our operations within a specified target range
based on our expectations.
Our principal overseas subsidiaries regularly submit
reports on their respective asset-liability situations to the
Treasury Department in Tokyo permitting us to manage
interest rate risk and risks relating to the relevant local cur-
rency on an individual basis. We also use interest-rate
swaps, caps, floors, and collars to hedge against changes
in interest rates.
2 Exchange Rate Risk Management
We employ foreign currency borrowings, foreign exchange
forward contracts, and foreign currency swap agreements
O R I X C o r p o r a t i o n
50
to hedge risks associated with certain transactions and
investments denominated in foreign currencies. Similarly,
each of our overseas subsidiaries structures its liabilities to
match the currency denomination of assets in its respective
region. We manage certain positions involving foreign cur-
rency risk individually.
3 Derivatives Risk Management
We use currency and interest-rate swaps, caps, floors, and
collars for hedging purposes. The Investment and Credit
Committee has established comprehensive market risk
management rules which set specific market risk manage-
ment parameters for each of our consolidated companies
that engages in derivatives transactions. These parameters
clarify the types of risks to be managed and the types of
hedging methods to be employed. An internal control sys-
tem ensures that responsibility for execution, evaluation,
and certain administrative tasks relating to these derivatives
transactions is allocated to separate departments.
Departments responsible for executing derivatives trans-
actions monitor the notional principal and market value of
these transactions by counterparty, rating, and hedging
method. They also maintain management systems
designed to respond rapidly to sharp market changes and
other unanticipated developments. Departments responsi-
ble for evaluation perform checks to ensure that the types
of hedging methods employed are appropriate and, period-
ically, or as necessary, evaluate the effectiveness of the
hedging methods. Working in cooperation with banks and
other outside entities, departments responsible for adminis-
trative tasks undertake administrative checks on all deriva-
tives transactions. In addition, they prepare quarterly
reports on each company’s transactions that include the
notional principal, fair market value, hedging method, and
hedging efficacy associated with each type of transaction
and each counterparty. These reports are then presented
to our Treasury Department and Compliance Coordination
Office. The Treasury Department uses these reports to
manage our Companywide derivatives, whi le the
Compliance Coordination Office inspects derivatives-related
accounts and performs checks to ensure that relevant
internal regulations are observed.
4 Asset Deflation Risk Management—Real Estate
Asset deflation has continued in Japan for more than 10
years since the bursting of the inflationary bubble in the
early 1990s. Asset deflation risk, in particular its effect on
real property prices, is therefore an important risk that we
believe must be managed. The activities of our real estate-
related operations consist principally of the provision of
non-recourse loans, the development of residential condo-
miniums, the leasing, purchase and sale of real estate, and
the private finance initiative, or PFI, business as well as the
operation of hotels, golf courses, and a training facility. In
line with the expansion of real estate-related finance and
investments in real estate, we have attempted to create a
comprehensive system in our Risk Management
Headquarters to analyze and evaluate various real estate-
related transactions.
We attempt to control or mitigate risks associated with
our real estate-related businesses by drawing on what we
believe are our strengths in the following areas
• Experience in Real Estate Operations. We have many
years experience in real estate operations. We believe
we have accumulated expertise in evaluating the cash
flows of office buildings, commercial buildings, and
other types of real estate.
• Real Estate Evaluation Specialists. The Real Estate
Appraisal Group of our Risk Management Headquarters
has a total of 19 certified real estate appraisers and
assistant real estate appraisers, while the construction
management section of ORIX Real Estate includes 12
certified architects. We are able to quickly obtain real
estate appraisals and engineering reports from these
internal real estate specialists.
• Credit Evaluation Experience. We believe that we have
accumulated substantial know-how in evaluating the
credit of prospective tenants, general contractors, and
other related parties.
• Access to Information. We have the ability to obtain
detailed information relating to various aspects of real
estate thanks to the know-how of subsidiaries that
specialize in property management, due diligence, and
appraisal who have first-hand access to such information.
• Specialist Cooperation. We believe that we can make
swift real estate-related investment decisions because
our management structure facilitates close cooperation
amongst a number of our specialist groups, including
O R I X C o r p o r a t i o n
51
those responsible for legal, accounting, tax, and com-
pliance issues.
We believe our accumulated experience in evaluating
real estate cash flows when we consider a particular trans-
action allows us to mitigate risks. We also believe we are
able to mitigate asset price deflation risk by adding value
through our development expertise to real estate we have
purchased.
Based on a number of indices for measuring profitability,
real estate investment decisions are made by the
Investment and Credit Committee using reports that ana-
lyze a variety of risks, including reputation risk. Considering
securitizations of loan receivables and purchases of real
estate, such as buildings, that we intend to resell, the li-
quidity of real estate investments has become an important
issue that we believe we must evaluate in order to manage
asset deflation risk.
All transactions involving our real estate business are
reported regularly to top management at the monthly strat-
egy meetings and to the Investment and Credit Committee.
This system allows us to monitor the progress of each proj-
ect and the total balance of assets and revenues, to control
delays in the receipt, and volatility, of revenues, and to
reduce asset deflation risk. As a result of our monitoring
activities, real estate in which we have invested is sold if we
judge that there will be no recovery in the revenue stream.
5 Residual Value Risk Management
We provide both direct financing leases and operating leas-
es, which are subject to residual value risk. We record a
loss at the end of a leasing period if we are unable to
recover the residual value of the lease (the amount remain-
ing after depreciation charges have been subtracted from
the original cost). We believe the residual value risk for
direct financing leases is relatively small, from our perspec-
tive as lessor, since the non-cancelable nature of these
transactions means that the residual value risk associated
with holding an asset essentially lies primarily with the les-
see. The residual value risk for operating leases, however,
is usually higher because the contracts may be renewed a
number of times during the life of an asset and we bear this
residual value risk. Accordingly, the setting and monitoring
of the estimated residual value of operating leases is very
important. We calculate residual value based on secondary
market values of the assets at the time of the origination of
the lease and assumptions about the obsolescence of a
particular piece of equipment.
Some operating lease items such as ships or aircraft
have long lives but may only be leased out for a few years,
and the secondary market values of these types of equip-
ment are volatile. We primarily limit our ship operating leas-
es to general-purpose ships that are relatively easy to
repossess and re-lease. We finance larger ships that may
have specific uses, but we do not own them, as we do in
the case of operating leases, in order to reduce residual
value risk. For aircraft, we have limited our inventory prima-
rily to narrow-bodied aircraft, which are relatively versatile
and relatively easy to lease. We monitor the market values
of these ships and aircraft and sell off assets as necessary
or desirable to reduce our exposure to downward trends in
the market.
We regularly monitor secondary market values for equip-
ment such as PCs and automobiles and set and adjust
residual value assumptions depending on our assessment
of past and future trends in the market values for such
equipment.
6 Equity and Debt Securities Risk Management
Our subsidiaries in Japan and overseas that make invest-
ments in the equity or debt securities of other companies,
along with our Risk Management Headquarters in Tokyo,
monitor market trends and the condition of those compa-
nies in order to respond quickly and mitigate market risks
associated with those investments. A substantial portion of
the marketable equity securities we hold consists of those
held to maintain our business relationships in Japan. As
with general credit risk management, our sales and market-
ing departments monitor the market environments, operat-
ing results, and financial conditions of the companies in
which we invest, and our Risk Management Headquarters
provides credit information and industry analysis reports to
our sales and marketing departments. Based on informa-
tion on the unrealized gains or losses of the securities and
the probability of companies defaulting on their commit-
ments, our Risk Management Headquarters makes recom-
mendations each month, including to sell securities or
conduct more detailed analyses of particular companies.
A substantial portion of our total bond investments are
made by ORIX Life Insurance in Japan and ORIX Capital
Markets LLC, or OCM, in the United States. In connection
O R I X C o r p o r a t i o n
52
with such investments, the investment departments of
ORIX Life and OCM regularly monitor interest rate policies,
economic conditions, and securities and financial market
trends. They also analyze price movements of securities,
the financial conditions of companies in which they invest,
and other factors daily. The investment departments take
action based on our approved guidelines for conducting
sales of securities to recognize gains, to cut losses, or to
reduce positions. The risk management departments and
bond trading departments of each company review and
compare daily reports with these internal guidelines and
macro- and microeconomic conditions, while the risk man-
agement departments verify that the guidelines are being
followed properly.
(c) Managing Other Risks
1 Liquidity Risk Management
Liquidity risk arises from the risk that we will have insuffi-
cient funds, or be unable to access sufficient funding, to
meet our business commitments or to pay back our obliga-
tions as they become due, which could result in a payment
default on our borrowings. We manage liquidity risk by
diversifying our funding sources, establishing committed
credit lines with financial institutions, and adjusting levels of
short- and long-term funding in consideration of market
conditions. As part of our ALM system, we also use cash
flow maps to measure and monitor liquidity risk.
2 Legal Risk Management
Transactional legal risk is a major type of legal risk that we
face in our business. Transactional legal risk includes the
risk that the contracts into which we enter contain unin-
tended conditions, are not legally effective, or cannot be
carried out as stipulated in the contract, or that the trans-
actions in which we participate involve activities that are
against, or not in strict compliance with, applicable laws.
When we consider a new transaction, new product devel-
opment, or other new business activity, our risk manage-
ment system requires an examination of these types of
legal risks.
In an attempt to avoid, prevent, and mitigate such legal
risks, we require that our Risk Management Headquarters
be involved in transactions from the early stages when a
transaction is first considered through the documentation
process in which transaction-related contracts are
prepared for internal review and final approval. Contracts
may not be approved internally unless they follow our pre-
scribed rules and guidelines. Our Risk Management
Headquarters is also involved in the approval of such
contracts. Depending on the size and importance of a
given transaction, we may also utilize the expertise of out-
side lawyers.
We monitor possible changes in the law by collecting
information on proposed legal reforms, as such information
becomes available. As necessary or appropriate, we may
also initiate preparatory measures to address the require-
ments of new laws that are expected to take effect in the
future and implement steps to ensure that we are, and con-
tinue to be, in compliance with new laws as they take effect.
To ensure that proper legal procedures are followed in
connection with legal disputes and litigation, we require
that our Risk Management Headquarters and other related
sections be involved in such disputes and litigation, includ-
ing lawsuits that have been, or are expected to be, brought
against us and lawsuits that we bring, or expect to bring,
against third parties.
3 Operational Risk Management
As our business has expanded in recent years, we view
operational risk management as a significant component of
overall risk management. Operational risk refers generally
to the risk arising in connection with the computer net-
works that we use, the administrative procedures and day-
to-day operational procedures that we have established,
and any breakdown in these networks or procedures, or
the systems that support them, as well as the risk of repu-
tational damage arising from such a breakdown. In order to
mit igate operational r isks, our Risk Management
Headquarters and Compliance Coordination Office monitor
compliance with administrative procedures and ORIX
Computer Systems Corporation upgrades our computer
systems as we deem necessary or desirable.
As part of operational risk management, we have attempt-
ed to further strengthen the functions of internal control and
compliance in recent years. The Compliance Coordination
Office is responsible for internal controls. Based on annual
internal audit plans, the office regularly monitors company-
wide compliance with internal rules and regulations and the
accuracy of self-assessment reports prepared by branch
offices concerning internal controls. Based on this monitoring,
O R I X C o r p o r a t i o n
53
the office evaluates the effectiveness of existing internal
controls and revises such controls as it deems necessary
or desirable.
We created a compliance manual in 2002 that is distrib-
uted to all employees in Japan and the senior management
of significant overseas subsidiaries. Since fiscal 2003, we
have conducted a number of companywide training
sessions in Japan to educate employees and to increase
their awareness of compliance issues. Based on the analy-
sis of these sessions, we are continuing our efforts to
achieve a more effective compliance system.
3 Dealing with New Risks in Changing Times
In an attempt to increase profitability, we have developed
new businesses in real estate-related finance and invest-
ment banking that are different from our traditional busi-
nesses focusing primarily on the provision of debt finance
in the form of leases and loans. We believe that we must
continue to evolve our risk management systems in order
to manage such risks.
In response to the recent expansion of real estate-related
finance and investment banking operations, ORIX has
determined that it must create additional new risk manage-
ment capabilities, including those involving the unified man-
agement of financing and investment risks, the analysis of
risks associated with such new financial schemes devel-
oped overseas as CMBS, methods for appraising assets in
connection with M&A transactions and new business
investments, and portfolio management systems with
higher levels of sophistication, comprehensiveness, and
multidimensionality.
In order for us to have effective checks and balances on
our operations we are also examining new business trans-
actions from perspectives different from those traditionally
employed by our Risk Management Headquarters in credit
evaluations. For example, we may consider the viability of a
particular business along with its investment and financing
scheme.
In order to examine new business transactions from dif-
ferent perspectives, we make use of our accounting, tax,
and legal specialists in our risk management groups. For
novel, complicated, or large new business transactions, we
require these specialists to be involved from the initial
stages through the signing and execution of the transac-
tion. We believe this minimizes risks and permits appropriate
advice to be disseminated to our sales and marketing
departments. Our risk management group specialists work
together with outside specialists to assess target companies
or assets before an acquisition is made and to analyze the
progress of management plans after acquisition.
We have also tried to strengthen our monitoring system
for real estate-related investments, asset acquisitions, and
private equity investments. We require monthly or quarterly
reports to be made to top management that describe the
progress of particular investments and provide comparative
analyses of projected and actual results.
In order to further improve our ROE, we believe we must
effectively use our management resources. We believe this
will entail making capital investments in areas of high prof-
itability and growth potential. We believe that we will be
able to maximize our corporate value by allocating capital
into these areas, thereby balancing the risks that we esti-
mate may be involved against our commitment to maintain-
ing the soundness of our operations.
Although our risk management has focused on tradition-
al areas that provide a stable source of earnings derived
from our customer base, we believe that it is necessary to
further strengthen our risk monitoring functions as we
become more involved in real estate-related finance and
investment banking activities that we expect to become
important sources of profitability and growth over the
medium-to-long term.
We feel that the growth of a company that focuses on
profitability, soundness, and growth potential is further pro-
moted by the management of risk capital under a sound
governance infrastructure.
O R I X C o r p o r a t i o n
54
7. C o r p o r a t e G o v e r n a n c e
(1) Strengthening Corporate Governance
Since the June 1997 establishment of an Advisory Board,
which included experienced and resourceful individuals
from outside the Company, ORIX has strengthened its cor-
porate governance framework with the aim of objectively
determining whether its business activities are emphasizing
the interests of its shareholders. In June 1998, we intro-
duced a Corporate Executive Officer system to help sepa-
rate strategic decision-making functions from day-to-day
administrative operations. In June 1999, ORIX reduced the
number of members of the Board of Directors, arranged for
three Advisory Board members to fill two positions as
independent directors and one position as an advisor to
the Board, and phased out the Advisory Board. In addition,
the Nominating Committee and the Compensation
Committee were established to operate as support units
for the Board of Directors.
In order to make a more effective separation of roles and
responsibilities between the decision-making and monitor-
ing functions of the Board of Directors and the executive
function of management, ORIX decided to adopt a
“Company with Committees” board model, which became
possible in April 2003 as a result of a revision to the
Commercial Code of Japan.
The establishment of audit, nominating, and compensa-
tion committees under the Board of Directors is required
under this new structure. In addition, ORIX has set up a
Compliance Coordination Office as an internal control sys-
tem to support the Audit Committee, which is responsible
for supervising ORIX’s operations.
In compliance with the Commercial Code, ORIX’s Audit
Committee includes three directors. Two of these directors
are considered outside directors under the Commercial
Code. The Audit Committee receives quarterly perform-
ance reports from the executive officer responsible for the
Accounting Department, reports from the independent
public auditor concerning audits, and business summary
reports from the COO. It also receives internal audit report
results and other reports related to internal control systems
from the executive officer responsible for the Compliance
Coordination Office, which is a unit that supports the com-
mittee. Moreover, the Audit Committee nominates and
empowers its inside director member to conduct operational
studies and report on the studies to the committee, and
the committee also may instruct executive officers to
present reports on the units for which they are responsible.
The committee discusses the various reports and evaluates
the performance of executive officers and the internal con-
trol system.
As stipulated in the Commercial Code, the Nominating
Committee is authorized to nominate director candidates
as well as to participate in the selection of executive officers.
As st ipulated in the Commercial Code, the
Compensation Committee is authorized to determine poli-
cies regarding the remuneration of directors and executive
officers as well as the monetary remuneration of each indi-
vidual director and executive officer.
At the meeting of the Board of Directors following the
Annual General Meeting of Shareholders in June 2004,
ORIX added another outside director to its Board, thus
bringing the total number of outside directors to five. With
the inclusion of the seven internal directors, the Board has
a total of 12 members.
ORIX is working to improve its disclosure of information
to investors and the function of its investor relations. In
order to further improve this function, we established a
Disclosure Committee that oversees the management and
dissemination of information to the public.
(2) Compliance
We feel that compliance is a crucial foundation for sound
corporate governance and we proactively implement rigor-
ous compliance programs.
In April 1989, when we changed our name from Orient
Leasing Co., Ltd., to ORIX Corporation, we introduced an
ORIX Group Corporate Identity program that specified
Group Ideals, Group Management Goals, and Group
Action Principles. This is the conceptual root of our compli-
ance programs.
As we neared the 21st century, we articulated three
concepts in April 1998 that would characterize our identity
and operations in the new century—pride, trust, and
respect—thereby extending the conceptual scope of the
ideals, management goals, and action principles of the cor-
porate identity program. To foster pride, trust, and respect
throughout our operations, we drafted our Corporate
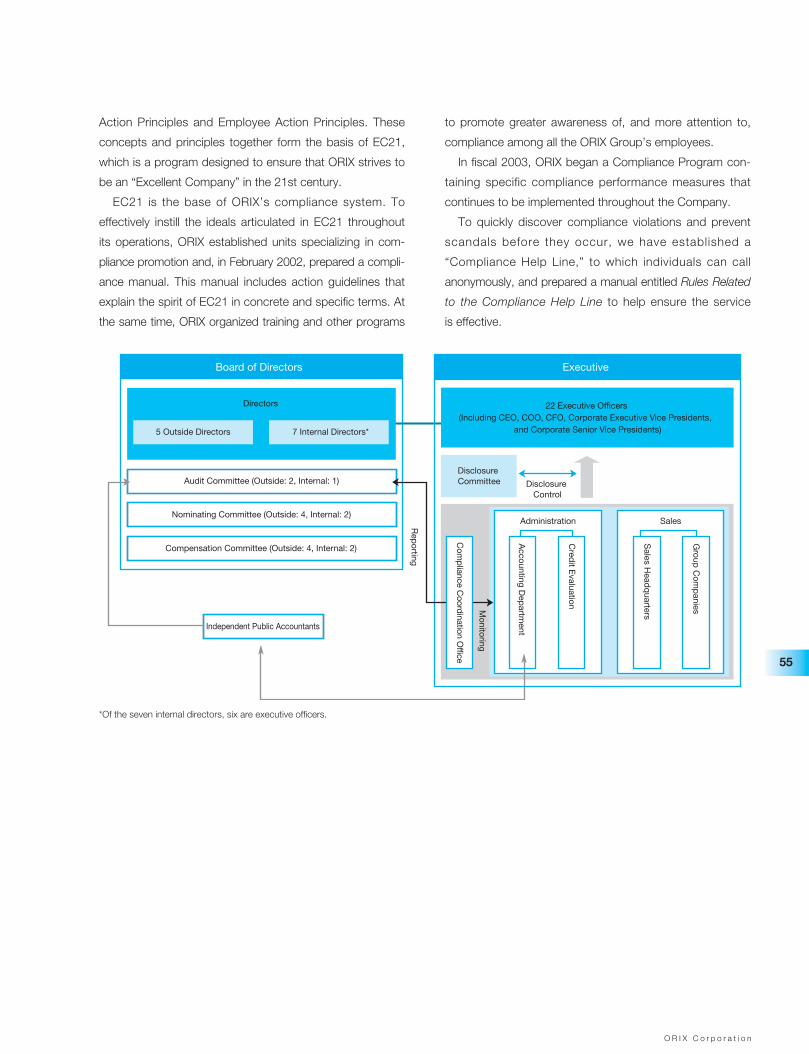
O R I X C o r p o r a t i o n
55
Action Principles and Employee Action Principles. These
concepts and principles together form the basis of EC21,
which is a program designed to ensure that ORIX strives to
be an “Excellent Company” in the 21st century.
EC21 is the base of ORIX’s compliance system. To
effectively instill the ideals articulated in EC21 throughout
its operations, ORIX established units specializing in com-
pliance promotion and, in February 2002, prepared a compli-
ance manual. This manual includes action guidelines that
explain the spirit of EC21 in concrete and specific terms. At
the same time, ORIX organized training and other programs
to promote greater awareness of, and more attention to,
compliance among all the ORIX Group’s employees.
In fiscal 2003, ORIX began a Compliance Program con-
taining specific compliance performance measures that
continues to be implemented throughout the Company.
To quickly discover compliance violations and prevent
scandals before they occur, we have established a
“Compliance Help Line,” to which individuals can call
anonymously, and prepared a manual entitled Rules Related
to the Compliance Help Line to help ensure the service
is effective.
Directors
5 Outside Directors 7 Internal Directors*
Audit Committee (Outside: 2, Internal: 1)
Nominating Committee (Outside: 4, Internal: 2)
Compensation Committee (Outside: 4, Internal: 2)
Independent Public Accountants
22 Executive Officers (Including CEO, COO, CFO, Corporate Executive Vice Presidents,
and Corporate Senior Vice Presidents)
Disclosure Committee Disclosure
Control
Administration Sales
Monitoring
Accounting D
epartm
ent
Rep
orting
Cred
it Evaluation
Sales H
eadq
uarters
Group
Com
panies
Executive
Com
pliance Coordination O
ffice
Board of Directors
*Of the seven internal directors, six are executive officers.
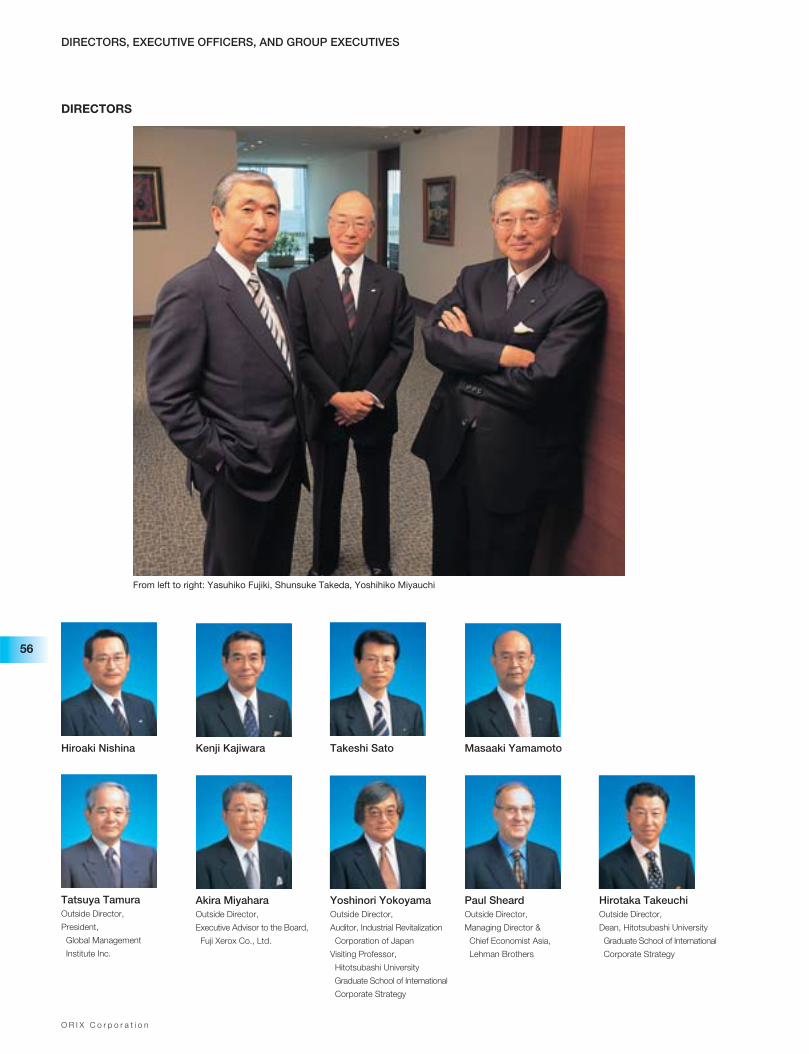
O R I X C o r p o r a t i o n
56
DIRECTORS, EXECUTIVE OFFICERS, AND GROUP EXECUTIVES
DIRECTORS
Takeshi Sato Masaaki Yamamoto
Hirotaka TakeuchiOutside Director,
Dean, Hitotsubashi University
Graduate School of International
Corporate Strategy
Hiroaki Nishina Kenji Kajiwara
Tatsuya TamuraOutside Director,
President,
Global Management
Institute Inc.
Akira MiyaharaOutside Director,
Executive Advisor to the Board,
Fuji Xerox Co., Ltd.
Yoshinori YokoyamaOutside Director,
Auditor, Industrial Revitalization
Corporation of Japan
Visiting Professor,
Hitotsubashi University
Graduate School of International
Corporate Strategy
Paul SheardOutside Director,
Managing Director &
Chief Economist Asia,
Lehman Brothers
From left to right: Yasuhiko Fujiki, Shunsuke Takeda, Yoshihiko Miyauchi
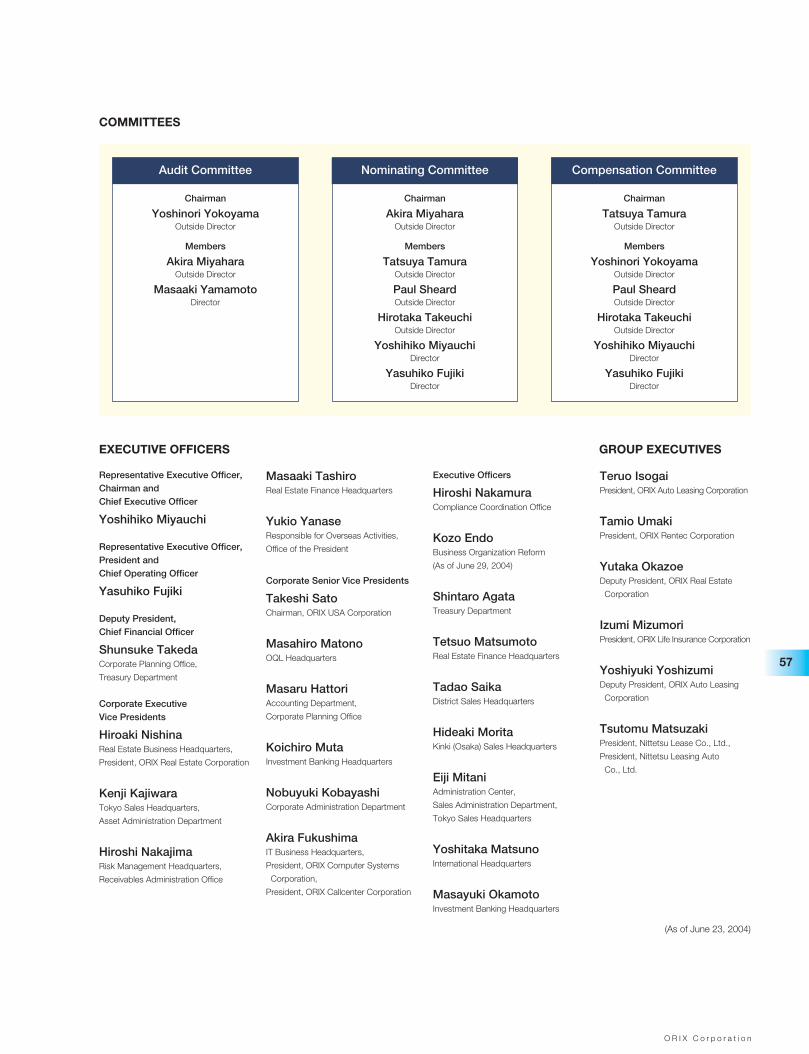
O R I X C o r p o r a t i o n
57
Representative Executive Officer,Chairman and Chief Executive Officer
Yoshihiko Miyauchi
Representative Executive Officer,President and Chief Operating Officer
Yasuhiko Fujiki
Deputy President, Chief Financial Officer
Shunsuke TakedaCorporate Planning Office,
Treasury Department
Corporate Executive Vice Presidents
Hiroaki NishinaReal Estate Business Headquarters,
President, ORIX Real Estate Corporation
Kenji KajiwaraTokyo Sales Headquarters,
Asset Administration Department
Hiroshi NakajimaRisk Management Headquarters,
Receivables Administration Office
Masaaki TashiroReal Estate Finance Headquarters
Yukio YanaseResponsible for Overseas Activities,
Office of the President
Corporate Senior Vice Presidents
Takeshi SatoChairman, ORIX USA Corporation
Masahiro MatonoOQL Headquarters
Masaru HattoriAccounting Department,
Corporate Planning Office
Koichiro MutaInvestment Banking Headquarters
Nobuyuki KobayashiCorporate Administration Department
Akira FukushimaIT Business Headquarters,
President, ORIX Computer Systems
Corporation,
President, ORIX Callcenter Corporation
Executive Officers
Hiroshi NakamuraCompliance Coordination Office
Kozo EndoBusiness Organization Reform
(As of June 29, 2004)
Shintaro AgataTreasury Department
Tetsuo MatsumotoReal Estate Finance Headquarters
Tadao SaikaDistrict Sales Headquarters
Hideaki MoritaKinki (Osaka) Sales Headquarters
Eiji MitaniAdministration Center,
Sales Administration Department,
Tokyo Sales Headquarters
Yoshitaka MatsunoInternational Headquarters
Masayuki Okamoto Investment Banking Headquarters
Teruo IsogaiPresident, ORIX Auto Leasing Corporation
Tamio UmakiPresident, ORIX Rentec Corporation
Yutaka OkazoeDeputy President, ORIX Real Estate
Corporation
Izumi MizumoriPresident, ORIX Life Insurance Corporation
Yoshiyuki YoshizumiDeputy President, ORIX Auto Leasing
Corporation
Tsutomu MatsuzakiPresident, Nittetsu Lease Co., Ltd.,
President, Nittetsu Leasing Auto
Co., Ltd.
(As of June 23, 2004)
COMMITTEES
Chairman
Yoshinori YokoyamaOutside Director
Members
Akira MiyaharaOutside Director
Masaaki YamamotoDirector
Audit Committee
Chairman
Akira MiyaharaOutside Director
Members
Tatsuya TamuraOutside Director
Paul SheardOutside Director
Hirotaka TakeuchiOutside Director
Yoshihiko MiyauchiDirector
Yasuhiko FujikiDirector
Nominating Committee
Chairman
Tatsuya TamuraOutside Director
Members
Yoshinori YokoyamaOutside Director
Paul SheardOutside Director
Hirotaka TakeuchiOutside Director
Yoshihiko MiyauchiDirector
Yasuhiko FujikiDirector
Compensation Committee
EXECUTIVE OFFICERS GROUP EXECUTIVES
O R I X C o r p o r a t i o n
58
Our ADRs have been listed on the New York Stock
Exchange, the NYSE, since 1998. We are therefore
required to comply with the NYSE’s new corporate gover-
nance listing standards, Section 303A.11, which were
approved by the SEC in November 2003. As a foreign
issuer, we are not required to follow several of the NYSE
listing standards.
Our corporate governance practices differ in certain signif-
icant respects from those that U.S. companies must adopt
in order to maintain an NYSE listing and, in accordance
with Section 303A.11 of the NYSE’s Listed Company Manual,
we provide a brief, general summary of such differences.
The composition of our Board of Directors and of the
committees of our board differs significantly in terms of
independence from the composition requirements for
boards and committees that U.S. companies must satisfy
in order to maintain a NYSE listing. We are not required to
meet the NYSE’s independence requirements for individu-
als on our Board of Directors or our nominating, compen-
sation, and audit committees. Under Japanese law, a
majority of the membership on our committees must be
“outside directors”—a Japanese law concept that shares
similarities with the U.S. concept of “independent director.”
However, we are not required to include on our Board of
Directors a majority of outside directors, nor are we
required to compose our committees exclusively from out-
side directors. Five of our twelve directors are considered
outside directors.
Under the Commercial Code of Japan, an outside direc-
tor is a director (i) who does not execute the company’s
business, (ii) who has not before executed the business of
the company or its subsidiaries in the capacity of director,
executive officer (shikkou-yaku), manager, or employee, and
(iii) who does not execute the business of any subsidiary of
the company in the capacity of director or executive officer
of such subsidiary or in the capacity of manager or any
other employee of the company or any of its subsidiaries.
In addition to differences in composition requirements for
our board, we are not required to:
• make publicly available one or more documents that
summarize all aspects of our corporate governance
guidelines or prepare a written code that states the
objectives, responsibilities, and performance evaluation
criteria in a manner that satisfies the NYSE’s require-
ments; or
• adopt a code of business conduct and ethics for our
directors, officers, and employees that addresses fully
the topics necessary to satisfy the NYSE’s require-
ments.
THE NEW YORK STOCK EXCHANGE CORPORATE GOVERNANCE LISTING STANDARDS
O R I X C o r p o r a t i o n
59
C O N T E N T S
60 Ten-Year Summary
62 Consolidated Balance Sheets
64 Consolidated Statements of Income
65 Consolidated Statements of Shareholders’ Equity
66 Consolidated Statements of Cash Flows
67 Notes to Consolidated Financial Statements
67 1. Significant Accounting and Reporting Policies
75 2. Acquisitions
76 3. Cash Flow Information
76 4. Investment in Direct Financing Leases
77 5. Investment in Operating Leases
78 6. Installment Loans
78 7. Allowance for Doubtful Receivables on Direct Financing Leasesand Probable Loan Losses
79 8. Investment in Securities
82 9. Securitization Transactions
84 10. Business Transactions with Special Purpose Entities
85 11. Investment in Affiliates
88 12. Goodwill and Other Intangible Assets
90 13. Short-Term and Long-Term Debt
92 14. Deposits
93 15. Income Taxes
97 16. Pension Plans
99 17. Stock-Based Compensation
100 18. Accumulated Other Comprehensive Income (Loss)
102 19. Shareholders’ Equity
103 20. Brokerage Commissions and Net Gains on Investment Securities
103 21. Life Insurance Operations
103 22. Other Operations
103 23. Write-downs of Long-Lived Assets
105 24. Discontinued Operations
105 25. Per Share Data
106 26. Derivative Financial Instruments and Hedging
107 27. Significant Concentrations of Credit Risk
108 28. Estimated Fair Value of Financial Instruments
110 29. Commitments, Guarantees and Contingent Liabilities
112 30. Segment Information
116 Report of Independent Registered Public Accountants
F I N A N C I A L S E C T I O N
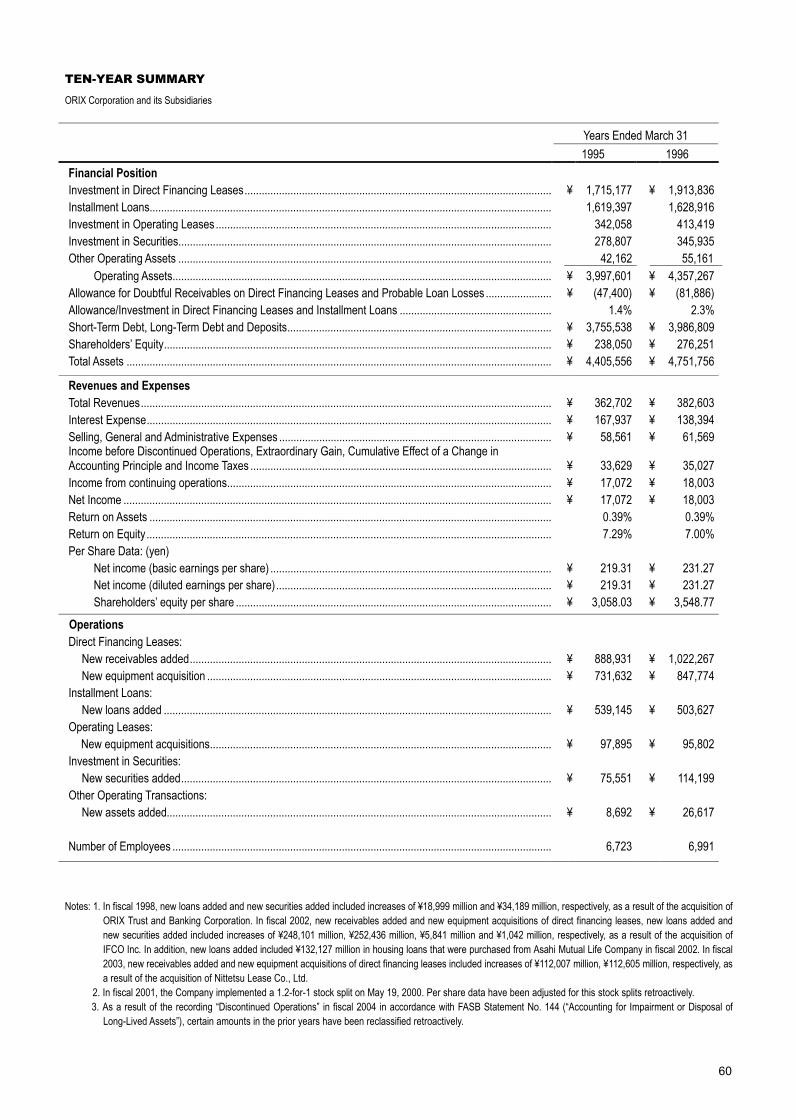
60
TEN-YEAR SUMMARY
ORIX Corporation and its Subsidiaries
Notes: 1. In fiscal 1998, new loans added and new securities added included increases of ¥18,999 million and ¥34,189 million, respectively, as a result of the acquisition of
ORIX Trust and Banking Corporation. In fiscal 2002, new receivables added and new equipment acquisitions of direct financing leases, new loans added and new securities added included increases of ¥248,101 million, ¥252,436 million, ¥5,841 million and ¥1,042 million, respectively, as a result of the acquisition of IFCO Inc. In addition, new loans added included ¥132,127 million in housing loans that were purchased from Asahi Mutual Life Company in fiscal 2002. In fiscal 2003, new receivables added and new equipment acquisitions of direct financing leases included increases of ¥112,007 million, ¥112,605 million, respectively, as a result of the acquisition of Nittetsu Lease Co., Ltd.
2. In fiscal 2001, the Company implemented a 1.2-for-1 stock split on May 19, 2000. Per share data have been adjusted for this stock splits retroactively. 3. As a result of the recording “Discontinued Operations” in fiscal 2004 in accordance with FASB Statement No. 144 (“Accounting for Impairment or Disposal of
Long-Lived Assets”), certain amounts in the prior years have been reclassified retroactively.
Years Ended March 31 1995 1996 Financial Position Investment in Direct Financing Leases........................................................................................................... ¥ 1,715,177 ¥ 1,913,836Installment Loans............................................................................................................................................ 1,619,397 1,628,916Investment in Operating Leases..................................................................................................................... 342,058 413,419Investment in Securities.................................................................................................................................. 278,807 345,935Other Operating Assets .................................................................................................................................. 42,162 55,161
Operating Assets.................................................................................................................................... ¥ 3,997,601 ¥ 4,357,267Allowance for Doubtful Receivables on Direct Financing Leases and Probable Loan Losses ....................... ¥ (47,400) ¥ (81,886)Allowance/Investment in Direct Financing Leases and Installment Loans ..................................................... 1.4% 2.3%Short-Term Debt, Long-Term Debt and Deposits............................................................................................ ¥ 3,755,538 ¥ 3,986,809Shareholders’ Equity....................................................................................................................................... ¥ 238,050 ¥ 276,251Total Assets .................................................................................................................................................... ¥ 4,405,556 ¥ 4,751,756
Revenues and Expenses Total Revenues............................................................................................................................................... ¥ 362,702 ¥ 382,603Interest Expense............................................................................................................................................. ¥ 167,937 ¥ 138,394Selling, General and Administrative Expenses ............................................................................................... ¥ 58,561 ¥ 61,569Income before Discontinued Operations, Extraordinary Gain, Cumulative Effect of a Change in Accounting Principle and Income Taxes ......................................................................................................... ¥ 33,629 ¥ 35,027Income from continuing operations................................................................................................................. ¥ 17,072 ¥ 18,003Net Income ..................................................................................................................................................... ¥ 17,072 ¥ 18,003Return on Assets ............................................................................................................................................ 0.39% 0.39%Return on Equity............................................................................................................................................. 7.29% 7.00%Per Share Data: (yen)
Net income (basic earnings per share) .................................................................................................. ¥ 219.31 ¥ 231.27Net income (diluted earnings per share)................................................................................................ ¥ 219.31 ¥ 231.27Shareholders’ equity per share .............................................................................................................. ¥ 3,058.03 ¥ 3,548.77
Operations Direct Financing Leases:
New receivables added.............................................................................................................................. ¥ 888,931 ¥ 1,022,267New equipment acquisition ........................................................................................................................ ¥ 731,632 ¥ 847,774
Installment Loans: New loans added ....................................................................................................................................... ¥ 539,145 ¥ 503,627
Operating Leases: New equipment acquisitions....................................................................................................................... ¥ 97,895 ¥ 95,802
Investment in Securities: New securities added................................................................................................................................. ¥ 75,551 ¥ 114,199
Other Operating Transactions: New assets added...................................................................................................................................... ¥ 8,692 ¥ 26,617
Number of Employees .................................................................................................................................... 6,723 6,991
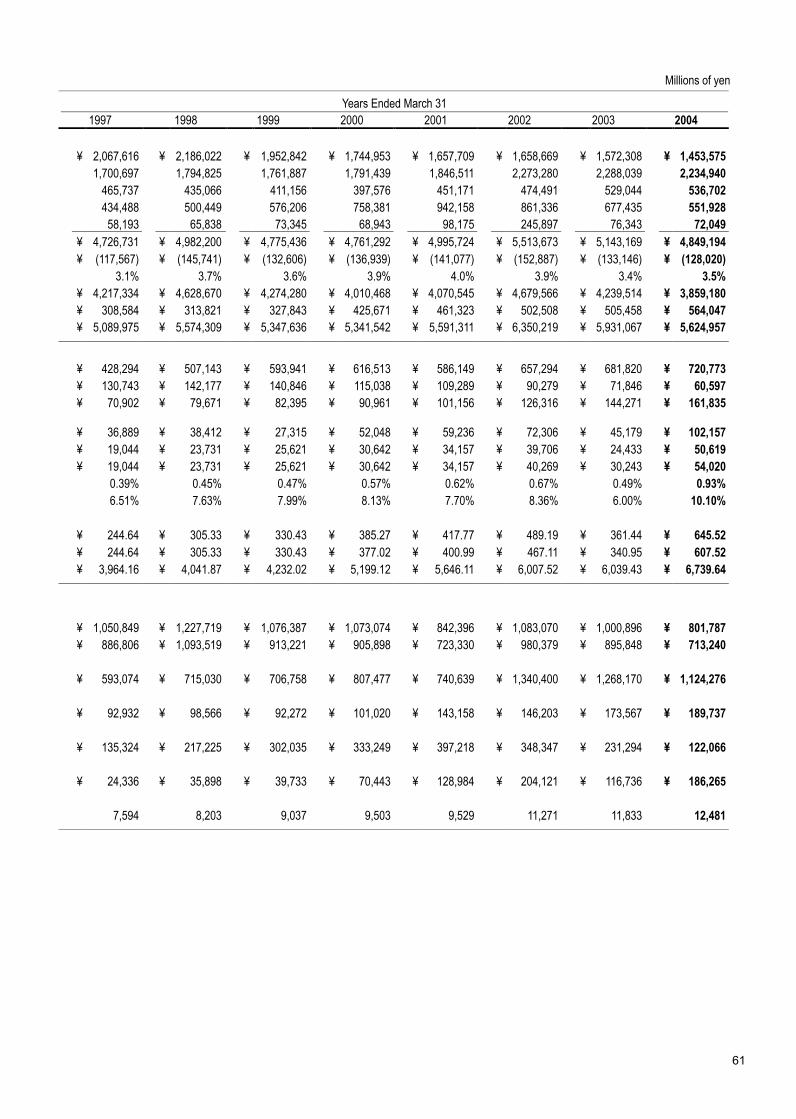
61
Millions of yen Years Ended March 31
1997 1998 1999 2000 2001 2002 2003 2004
¥ 2,067,616 ¥ 2,186,022 ¥ 1,952,842 ¥ 1,744,953 ¥ 1,657,709 ¥ 1,658,669 ¥ 1,572,308 ¥ 1,453,575 1,700,697 1,794,825 1,761,887 1,791,439 1,846,511 2,273,280 2,288,039 2,234,940 465,737 435,066 411,156 397,576 451,171 474,491 529,044 536,702 434,488 500,449 576,206 758,381 942,158 861,336 677,435 551,928
58,193 65,838 73,345 68,943 98,175 245,897 76,343 72,049¥ 4,726,731 ¥ 4,982,200 ¥ 4,775,436 ¥ 4,761,292 ¥ 4,995,724 ¥ 5,513,673 ¥ 5,143,169 ¥ 4,849,194¥ (117,567) ¥ (145,741) ¥ (132,606) ¥ (136,939) ¥ (141,077) ¥ (152,887) ¥ (133,146) ¥ (128,020) 3.1% 3.7% 3.6% 3.9% 4.0% 3.9% 3.4% 3.5%
¥ 4,217,334 ¥ 4,628,670 ¥ 4,274,280 ¥ 4,010,468 ¥ 4,070,545 ¥ 4,679,566 ¥ 4,239,514 ¥ 3,859,180¥ 308,584 ¥ 313,821 ¥ 327,843 ¥ 425,671 ¥ 461,323 ¥ 502,508 ¥ 505,458 ¥ 564,047¥ 5,089,975 ¥ 5,574,309 ¥ 5,347,636 ¥ 5,341,542 ¥ 5,591,311 ¥ 6,350,219 ¥ 5,931,067 ¥ 5,624,957
¥ 428,294 ¥ 507,143 ¥ 593,941 ¥ 616,513 ¥ 586,149 ¥ 657,294 ¥ 681,820 ¥ 720,773¥ 130,743 ¥ 142,177 ¥ 140,846 ¥ 115,038 ¥ 109,289 ¥ 90,279 ¥ 71,846 ¥ 60,597¥ 70,902 ¥ 79,671 ¥ 82,395 ¥ 90,961 ¥ 101,156 ¥ 126,316 ¥ 144,271 ¥ 161,835
¥ 36,889 ¥ 38,412 ¥ 27,315 ¥ 52,048 ¥ 59,236 ¥ 72,306 ¥ 45,179 ¥ 102,157¥ 19,044 ¥ 23,731 ¥ 25,621 ¥ 30,642 ¥ 34,157 ¥ 39,706 ¥ 24,433 ¥ 50,619¥ 19,044 ¥ 23,731 ¥ 25,621 ¥ 30,642 ¥ 34,157 ¥ 40,269 ¥ 30,243 ¥ 54,020 0.39% 0.45% 0.47% 0.57% 0.62% 0.67% 0.49% 0.93% 6.51% 7.63% 7.99% 8.13% 7.70% 8.36% 6.00% 10.10%
¥ 244.64 ¥ 305.33 ¥ 330.43 ¥ 385.27 ¥ 417.77 ¥ 489.19 ¥ 361.44 ¥ 645.52¥ 244.64 ¥ 305.33 ¥ 330.43 ¥ 377.02 ¥ 400.99 ¥ 467.11 ¥ 340.95 ¥ 607.52¥ 3,964.16 ¥ 4,041.87 ¥ 4,232.02 ¥ 5,199.12 ¥ 5,646.11 ¥ 6,007.52 ¥ 6,039.43 ¥ 6,739.64
¥ 1,050,849 ¥ 1,227,719 ¥ 1,076,387 ¥ 1,073,074 ¥ 842,396 ¥ 1,083,070 ¥ 1,000,896 ¥ 801,787¥ 886,806 ¥ 1,093,519 ¥ 913,221 ¥ 905,898 ¥ 723,330 ¥ 980,379 ¥ 895,848 ¥ 713,240
¥ 593,074 ¥ 715,030 ¥ 706,758 ¥ 807,477 ¥ 740,639 ¥ 1,340,400 ¥ 1,268,170 ¥ 1,124,276
¥ 92,932 ¥ 98,566 ¥ 92,272 ¥ 101,020 ¥ 143,158 ¥ 146,203 ¥ 173,567 ¥ 189,737
¥ 135,324 ¥ 217,225 ¥ 302,035 ¥ 333,249 ¥ 397,218 ¥ 348,347 ¥ 231,294 ¥ 122,066
¥ 24,336 ¥ 35,898 ¥ 39,733 ¥ 70,443 ¥ 128,984 ¥ 204,121 ¥ 116,736 ¥ 186,265 7,594 8,203 9,037 9,503 9,529 11,271 11,833 12,481
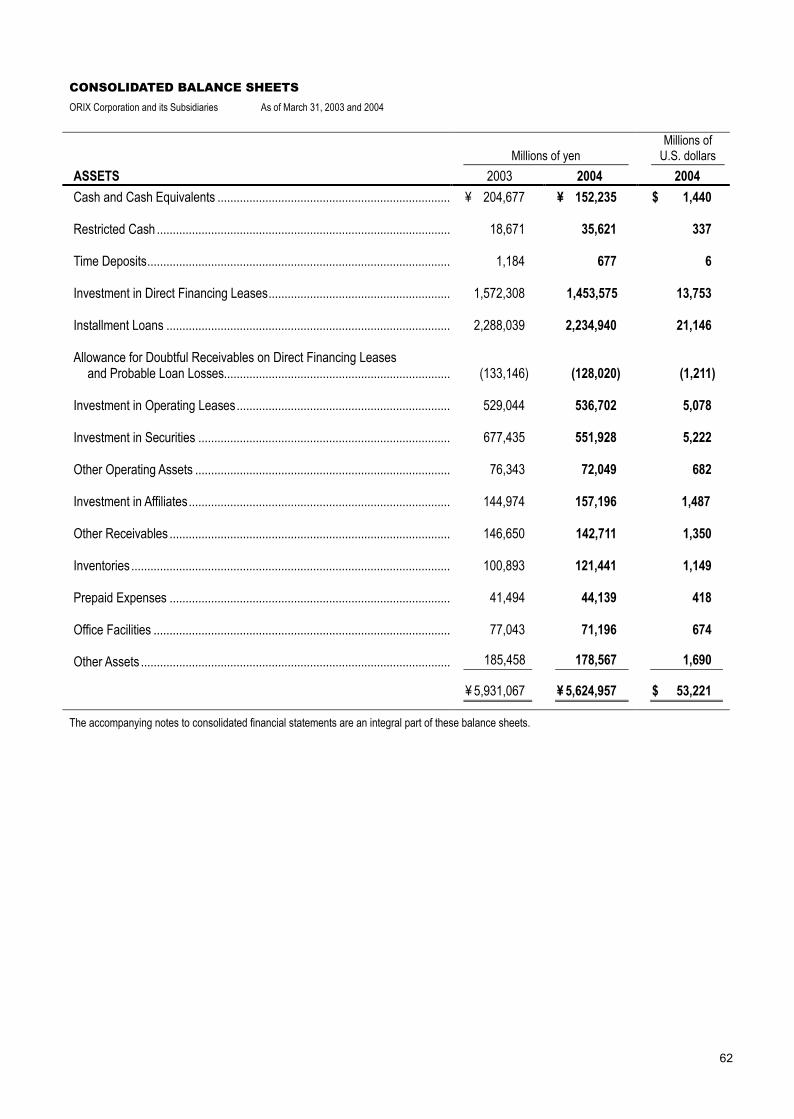
62
CONSOLIDATED BALANCE SHEETS ORIX Corporation and its Subsidiaries As of March 31, 2003 and 2004
Millions of yen Millions of
U.S. dollars ASSETS 2003 2004 2004 Cash and Cash Equivalents ......................................................................... ¥ 204,677 ¥ 152,235 $ 1,440 Restricted Cash ............................................................................................ 18,671 35,621 337 Time Deposits............................................................................................... 1,184 677 6 Investment in Direct Financing Leases......................................................... 1,572,308 1,453,575 13,753 Installment Loans ......................................................................................... 2,288,039 2,234,940 21,146 Allowance for Doubtful Receivables on Direct Financing Leases and Probable Loan Losses....................................................................... (133,146) (128,020) (1,211) Investment in Operating Leases................................................................... 529,044 536,702 5,078 Investment in Securities ............................................................................... 677,435 551,928 5,222 Other Operating Assets ................................................................................ 76,343 72,049 682 Investment in Affiliates.................................................................................. 144,974 157,196 1,487 Other Receivables ........................................................................................ 146,650 142,711 1,350 Inventories .................................................................................................... 100,893 121,441 1,149 Prepaid Expenses ........................................................................................ 41,494 44,139 418 Office Facilities ............................................................................................. 77,043 71,196 674 Other Assets ................................................................................................. 185,458 178,567 1,690 ¥ 5,931,067 ¥ 5,624,957 $ 53,221
The accompanying notes to consolidated financial statements are an integral part of these balance sheets.
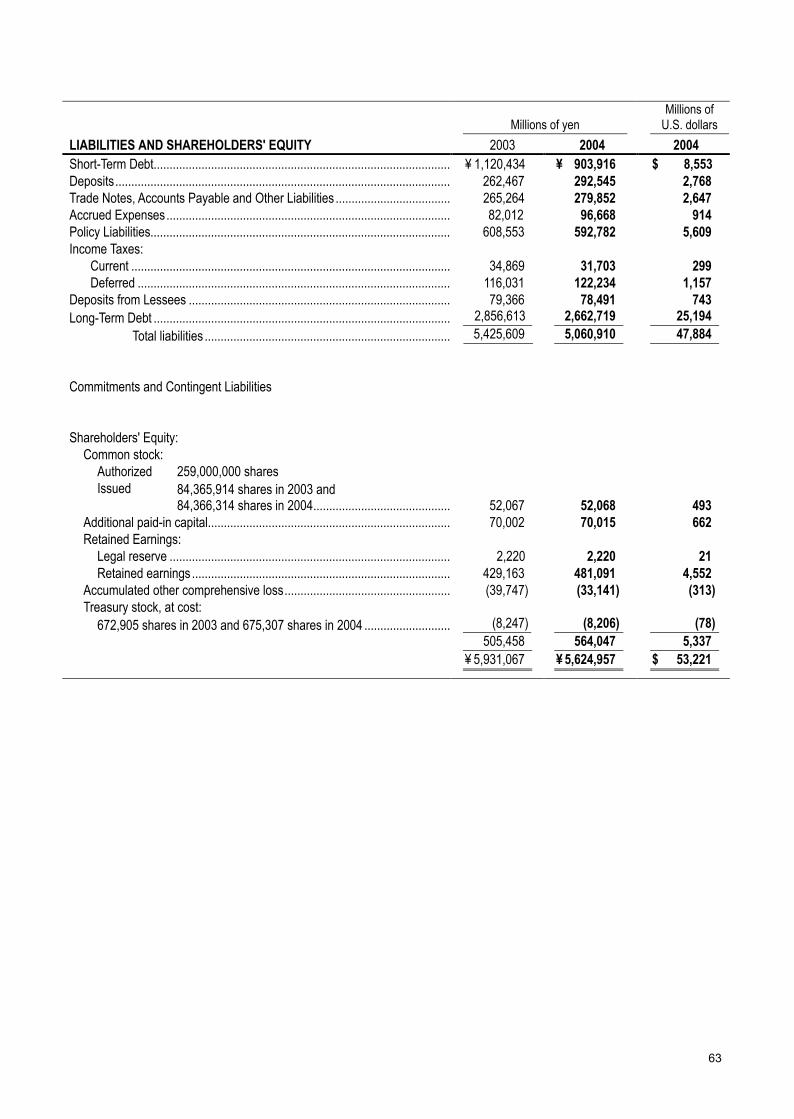
63
Millions of yen Millions of
U.S. dollars LIABILITIES AND SHAREHOLDERS' EQUITY 2003 2004 2004 Short-Term Debt............................................................................................. ¥ 1,120,434 ¥ 903,916 $ 8,553 Deposits......................................................................................................... 262,467 292,545 2,768 Trade Notes, Accounts Payable and Other Liabilities .................................... 265,264 279,852 2,647 Accrued Expenses......................................................................................... 82,012 96,668 914 Policy Liabilities.............................................................................................. 608,553 592,782 5,609 Income Taxes: Current .................................................................................................... 34,869 31,703 299 Deferred .................................................................................................. 116,031 122,234 1,157 Deposits from Lessees .................................................................................. 79,366 78,491 743 Long-Term Debt ............................................................................................. 2,856,613 2,662,719 25,194 Total liabilities ............................................................................. 5,425,609 5,060,910 47,884 Commitments and Contingent Liabilities Shareholders' Equity:
Common stock: Authorized 259,000,000 shares Issued
84,365,914 shares in 2003 and 84,366,314 shares in 2004........................................... 52,067 52,068 493
Additional paid-in capital............................................................................ 70,002 70,015 662 Retained Earnings:
Legal reserve ........................................................................................ 2,220 2,220 21 Retained earnings ................................................................................. 429,163 481,091 4,552
Accumulated other comprehensive loss.................................................... (39,747) (33,141) (313) Treasury stock, at cost:
672,905 shares in 2003 and 675,307 shares in 2004 ........................... (8,247) (8,206) (78) 505,458 564,047 5,337 ¥ 5,931,067 ¥ 5,624,957 $ 53,221
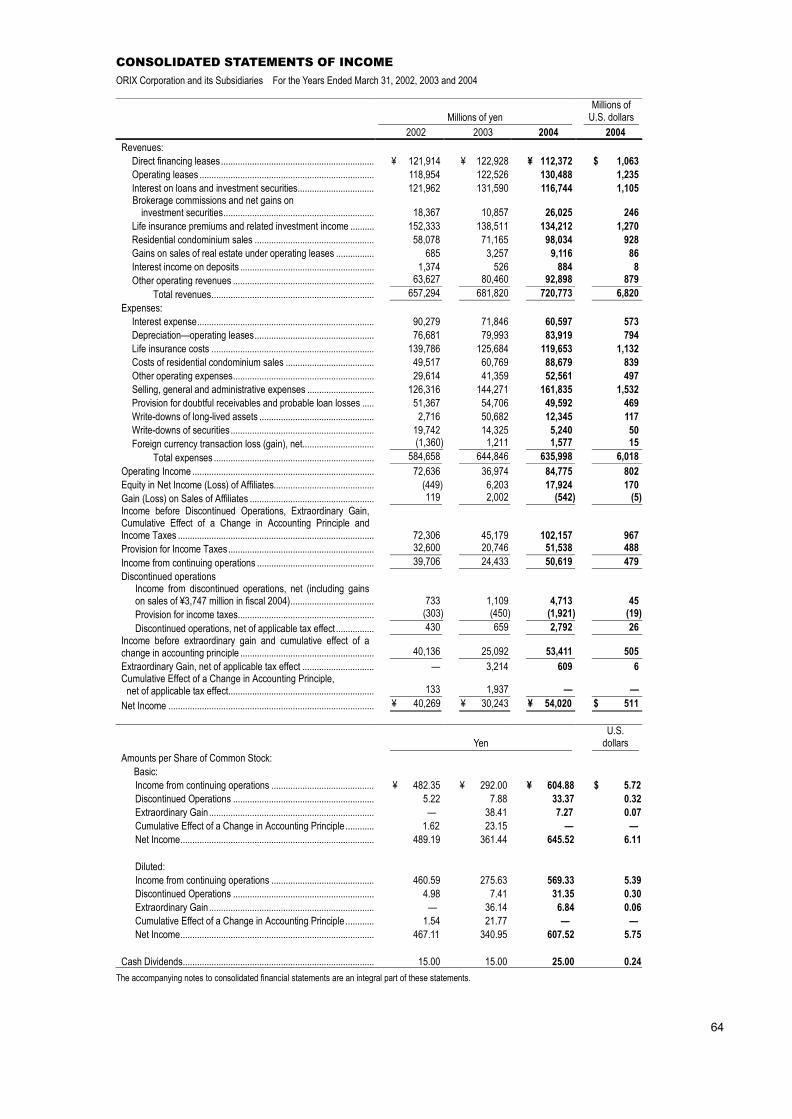
64
CONSOLIDATED STATEMENTS OF INCOME ORIX Corporation and its Subsidiaries For the Years Ended March 31, 2002, 2003 and 2004
Millions of yen Millions of
U.S. dollars 2002 2003 2004 2004
Revenues: Direct financing leases................................................................ ¥ 121,914 ¥ 122,928 ¥ 112,372 $ 1,063Operating leases ......................................................................... 118,954 122,526 130,488 1,235Interest on loans and investment securities................................ 121,962 131,590 116,744 1,105Brokerage commissions and net gains on
investment securities............................................................... 18,367 10,857 26,025 246Life insurance premiums and related investment income .......... 152,333 138,511 134,212 1,270Residential condominium sales .................................................. 58,078 71,165 98,034 928Gains on sales of real estate under operating leases ................ 685 3,257 9,116 86Interest income on deposits ........................................................ 1,374 526 884 8Other operating revenues ........................................................... 63,627 80,460 92,898 879
Total revenues.................................................................... 657,294 681,820 720,773 6,820Expenses:
Interest expense.......................................................................... 90,279 71,846 60,597 573Depreciation—operating leases.................................................. 76,681 79,993 83,919 794Life insurance costs .................................................................... 139,786 125,684 119,653 1,132Costs of residential condominium sales ..................................... 49,517 60,769 88,679 839Other operating expenses........................................................... 29,614 41,359 52,561 497Selling, general and administrative expenses ............................ 126,316 144,271 161,835 1,532Provision for doubtful receivables and probable loan losses ..... 51,367 54,706 49,592 469Write-downs of long-lived assets ................................................ 2,716 50,682 12,345 117Write-downs of securities............................................................ 19,742 14,325 5,240 50Foreign currency transaction loss (gain), net.............................. (1,360) 1,211 1,577 15
Total expenses ................................................................... 584,658 644,846 635,998 6,018Operating Income ............................................................................ 72,636 36,974 84,775 802Equity in Net Income (Loss) of Affiliates.......................................... (449) 6,203 17,924 170Gain (Loss) on Sales of Affiliates .................................................... 119 2,002 (542) (5)Income before Discontinued Operations, Extraordinary Gain, Cumulative Effect of a Change in Accounting Principle and Income Taxes .................................................................................. 72,306 45,179 102,157 967Provision for Income Taxes............................................................. 32,600 20,746 51,538 488Income from continuing operations ................................................. 39,706 24,433 50,619 479Discontinued operations
Income from discontinued operations, net (including gains on sales of ¥3,747 million in fiscal 2004)................................... 733 1,109 4,713 45Provision for income taxes......................................................... (303) (450) (1,921) (19)Discontinued operations, net of applicable tax effect ................ 430 659 2,792 26
Income before extraordinary gain and cumulative effect of a change in accounting principle ........................................................ 40,136 25,092 53,411 505Extraordinary Gain, net of applicable tax effect .............................. — 3,214 609 6Cumulative Effect of a Change in Accounting Principle, net of applicable tax effect............................................................. 133 1,937 — —Net Income ...................................................................................... ¥ 40,269 ¥ 30,243 ¥ 54,020 $ 511
Yen U.S.
dollars Amounts per Share of Common Stock:
Basic: Income from continuing operations ........................................... ¥ 482.35 ¥ 292.00 ¥ 604.88 $ 5.72Discontinued Operations ........................................................... 5.22 7.88 33.37 0.32Extraordinary Gain..................................................................... — 38.41 7.27 0.07Cumulative Effect of a Change in Accounting Principle ............ 1.62 23.15 — —Net Income................................................................................. 489.19 361.44 645.52 6.11
Diluted: Income from continuing operations ........................................... 460.59 275.63 569.33 5.39Discontinued Operations ........................................................... 4.98 7.41 31.35 0.30Extraordinary Gain..................................................................... — 36.14 6.84 0.06Cumulative Effect of a Change in Accounting Principle ............ 1.54 21.77 — —Net Income................................................................................. 467.11 340.95 607.52 5.75
Cash Dividends................................................................................ 15.00 15.00 25.00 0.24
The accompanying notes to consolidated financial statements are an integral part of these statements.
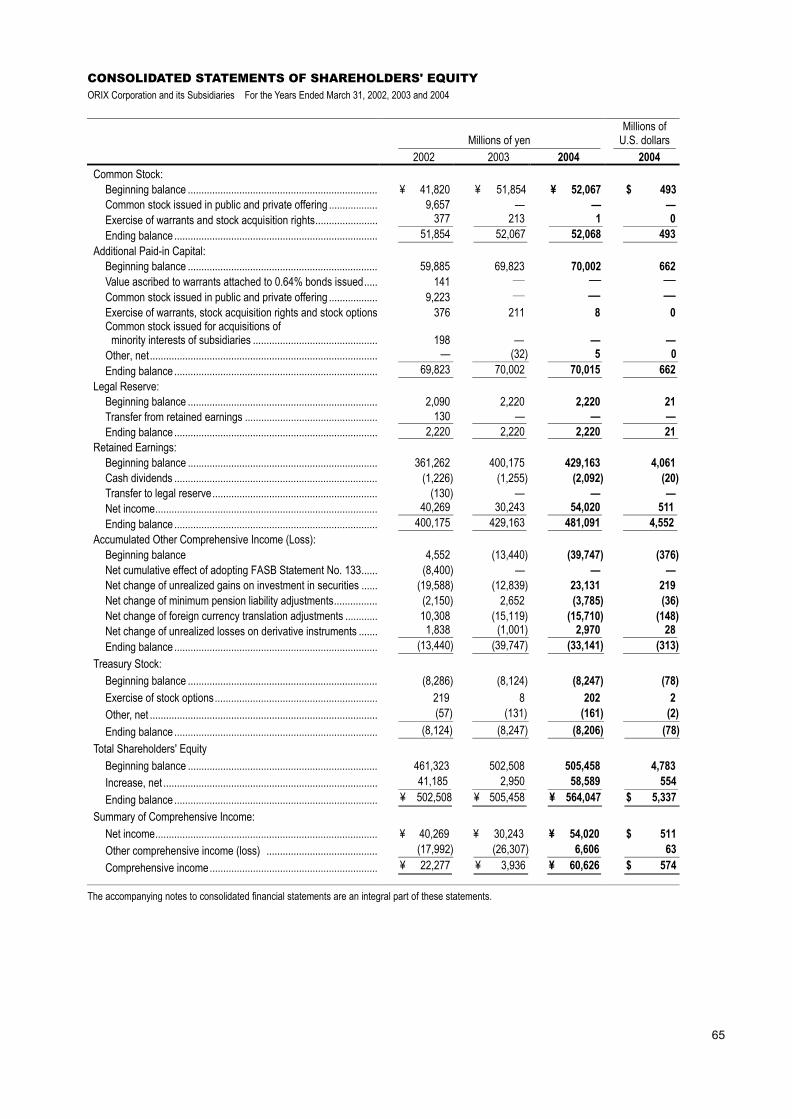
65
CONSOLIDATED STATEMENTS OF SHAREHOLDERS' EQUITY ORIX Corporation and its Subsidiaries For the Years Ended March 31, 2002, 2003 and 2004
Millions of yen Millions of
U.S. dollars 2002 2003 2004 2004
Common Stock: Beginning balance ...................................................................... ¥ 41,820 ¥ 51,854 ¥ 52,067 $ 493Common stock issued in public and private offering .................. 9,657 — — —Exercise of warrants and stock acquisition rights....................... 377 213 1 0Ending balance ........................................................................... 51,854 52,067 52,068 493
Additional Paid-in Capital: Beginning balance ...................................................................... 59,885 69,823 70,002 662Value ascribed to warrants attached to 0.64% bonds issued..... 141 ― ―――― ――――
Common stock issued in public and private offering .................. 9,223 ― ―――― ――――
Exercise of warrants, stock acquisition rights and stock options 376 211 8 0Common stock issued for acquisitions of minority interests of subsidiaries .............................................. 198 — — —Other, net.................................................................................... — (32) 5 0Ending balance ........................................................................... 69,823 70,002 70,015 662
Legal Reserve: Beginning balance ...................................................................... 2,090 2,220 2,220 21Transfer from retained earnings ................................................. 130 — — —Ending balance ........................................................................... 2,220 2,220 2,220 21
Retained Earnings: Beginning balance ...................................................................... 361,262 400,175 429,163 4,061Cash dividends ........................................................................... (1,226) (1,255) (2,092) (20)Transfer to legal reserve............................................................. (130) — — —Net income.................................................................................. 40,269 30,243 54,020 511Ending balance ........................................................................... 400,175 429,163 481,091 4,552
Accumulated Other Comprehensive Income (Loss): Beginning balance 4,552 (13,440) (39,747) (376)Net cumulative effect of adopting FASB Statement No. 133...... (8,400) — — —Net change of unrealized gains on investment in securities ...... (19,588) (12,839) 23,131 219Net change of minimum pension liability adjustments................ (2,150) 2,652 (3,785) (36)Net change of foreign currency translation adjustments ............ 10,308 (15,119) (15,710) (148)Net change of unrealized losses on derivative instruments ....... 1,838 (1,001) 2,970 28Ending balance ........................................................................... (13,440) (39,747) (33,141) (313)
Treasury Stock: Beginning balance ...................................................................... (8,286) (8,124) (8,247) (78)Exercise of stock options............................................................ 219 8 202 2Other, net .................................................................................... (57) (131) (161) (2)Ending balance ........................................................................... (8,124) (8,247) (8,206) (78)
Total Shareholders' Equity Beginning balance ...................................................................... 461,323 502,508 505,458 4,783Increase, net ............................................................................... 41,185 2,950 58,589 554Ending balance ........................................................................... ¥ 502,508 ¥ 505,458 ¥ 564,047 $ 5,337
Summary of Comprehensive Income: Net income.................................................................................. ¥ 40,269 ¥ 30,243 ¥ 54,020 $ 511Other comprehensive income (loss) ......................................... (17,992) (26,307) 6,606 63Comprehensive income.............................................................. ¥ 22,277 ¥ 3,936 ¥ 60,626 $ 574
The accompanying notes to consolidated financial statements are an integral part of these statements.
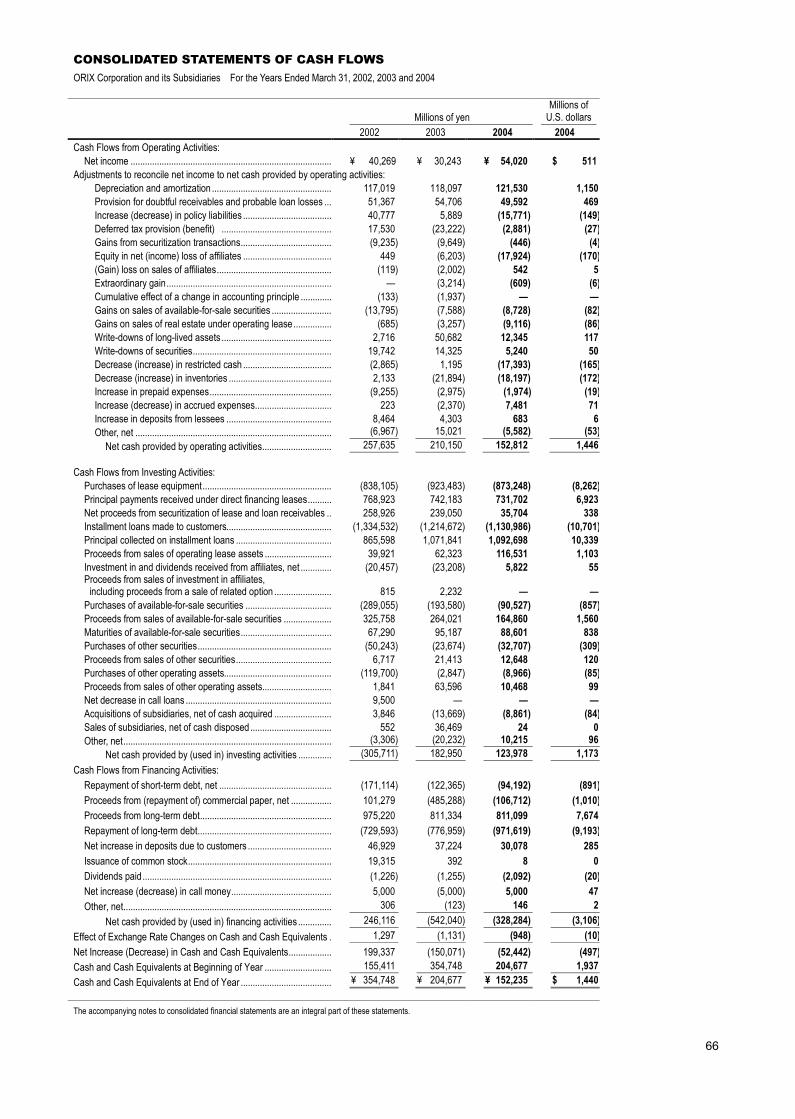
66
CONSOLIDATED STATEMENTS OF CASH FLOWS ORIX Corporation and its Subsidiaries For the Years Ended March 31, 2002, 2003 and 2004
Millions of yen Millions of
U.S. dollars 2002 2003 2004 2004
Cash Flows from Operating Activities: Net income .................................................................................... ¥ 40,269 ¥ 30,243 ¥ 54,020 $ 511
Adjustments to reconcile net income to net cash provided by operating activities: Depreciation and amortization .................................................. 117,019 118,097 121,530 1,150Provision for doubtful receivables and probable loan losses ... 51,367 54,706 49,592 469Increase (decrease) in policy liabilities ..................................... 40,777 5,889 (15,771) (149)Deferred tax provision (benefit) .............................................. 17,530 (23,222) (2,881) (27)Gains from securitization transactions...................................... (9,235) (9,649) (446) (4)Equity in net (income) loss of affiliates ..................................... 449 (6,203) (17,924) (170)(Gain) loss on sales of affiliates................................................ (119) (2,002) 542 5Extraordinary gain..................................................................... — (3,214) (609) (6)Cumulative effect of a change in accounting principle ............. (133) (1,937) — —Gains on sales of available-for-sale securities ......................... (13,795) (7,588) (8,728) (82)Gains on sales of real estate under operating lease................ (685) (3,257) (9,116) (86)Write-downs of long-lived assets .............................................. 2,716 50,682 12,345 117Write-downs of securities.......................................................... 19,742 14,325 5,240 50Decrease (increase) in restricted cash ..................................... (2,865) 1,195 (17,393) (165)Decrease (increase) in inventories ........................................... 2,133 (21,894) (18,197) (172)Increase in prepaid expenses................................................... (9,255) (2,975) (1,974) (19)Increase (decrease) in accrued expenses................................ 223 (2,370) 7,481 71Increase in deposits from lessees ............................................ 8,464 4,303 683 6Other, net .................................................................................. (6,967) 15,021 (5,582) (53)
Net cash provided by operating activities............................. 257,635 210,150 152,812 1,446 Cash Flows from Investing Activities:
Purchases of lease equipment...................................................... (838,105) (923,483) (873,248) (8,262)Principal payments received under direct financing leases.......... 768,923 742,183 731,702 6,923Net proceeds from securitization of lease and loan receivables .. 258,926 239,050 35,704 338Installment loans made to customers............................................ (1,334,532) (1,214,672) (1,130,986) (10,701)Principal collected on installment loans ........................................ 865,598 1,071,841 1,092,698 10,339Proceeds from sales of operating lease assets ............................ 39,921 62,323 116,531 1,103Investment in and dividends received from affiliates, net ............. (20,457) (23,208) 5,822 55Proceeds from sales of investment in affiliates, including proceeds from a sale of related option ........................ 815 2,232 — —Purchases of available-for-sale securities .................................... (289,055) (193,580) (90,527) (857)Proceeds from sales of available-for-sale securities .................... 325,758 264,021 164,860 1,560Maturities of available-for-sale securities...................................... 67,290 95,187 88,601 838Purchases of other securities........................................................ (50,243) (23,674) (32,707) (309)Proceeds from sales of other securities........................................ 6,717 21,413 12,648 120Purchases of other operating assets............................................. (119,700) (2,847) (8,966) (85)Proceeds from sales of other operating assets............................. 1,841 63,596 10,468 99Net decrease in call loans ............................................................. 9,500 — — —Acquisitions of subsidiaries, net of cash acquired ........................ 3,846 (13,669) (8,861) (84)Sales of subsidiaries, net of cash disposed.................................. 552 36,469 24 0Other, net....................................................................................... (3,306) (20,232) 10,215 96
Net cash provided by (used in) investing activities .............. (305,711) 182,950 123,978 1,173Cash Flows from Financing Activities:
Repayment of short-term debt, net ............................................... (171,114) (122,365) (94,192) (891)Proceeds from (repayment of) commercial paper, net ................. 101,279 (485,288) (106,712) (1,010)Proceeds from long-term debt....................................................... 975,220 811,334 811,099 7,674Repayment of long-term debt........................................................ (729,593) (776,959) (971,619) (9,193)Net increase in deposits due to customers ................................... 46,929 37,224 30,078 285Issuance of common stock............................................................ 19,315 392 8 0Dividends paid............................................................................... (1,226) (1,255) (2,092) (20)Net increase (decrease) in call money.......................................... 5,000 (5,000) 5,000 47Other, net....................................................................................... 306 (123) 146 2
Net cash provided by (used in) financing activities .............. 246,116 (542,040) (328,284) (3,106)Effect of Exchange Rate Changes on Cash and Cash Equivalents . 1,297 (1,131) (948) (10)Net Increase (Decrease) in Cash and Cash Equivalents.................. 199,337 (150,071) (52,442) (497)Cash and Cash Equivalents at Beginning of Year ............................ 155,411 354,748 204,677 1,937Cash and Cash Equivalents at End of Year ...................................... ¥ 354,748 ¥ 204,677 ¥ 152,235 $ 1,440 The accompanying notes to consolidated financial statements are an integral part of these statements.
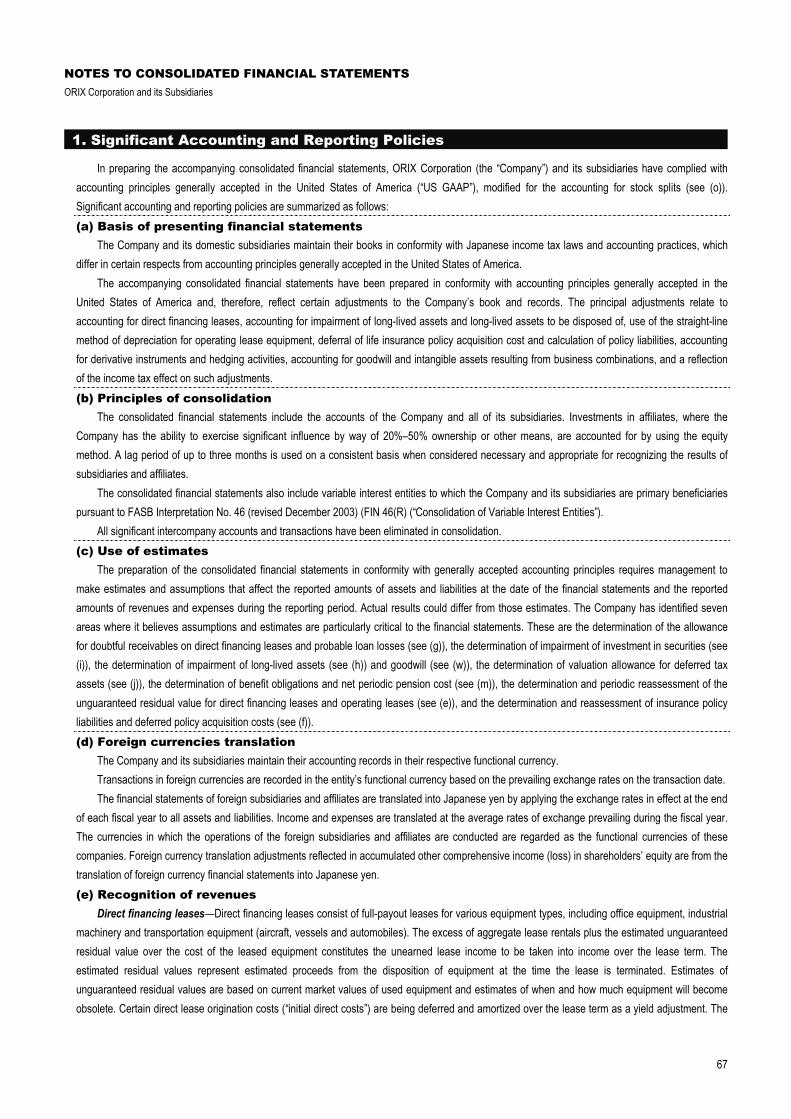
67
NOTES TO CONSOLIDATED FINANCIAL STATEMENTS ORIX Corporation and its Subsidiaries
1. Significant Accounting and Reporting Policies
In preparing the accompanying consolidated financial statements, ORIX Corporation (the “Company”) and its subsidiaries have complied with accounting principles generally accepted in the United States of America (“US GAAP”), modified for the accounting for stock splits (see (o)). Significant accounting and reporting policies are summarized as follows: (a) Basis of presenting financial statements
The Company and its domestic subsidiaries maintain their books in conformity with Japanese income tax laws and accounting practices, which differ in certain respects from accounting principles generally accepted in the United States of America.
The accompanying consolidated financial statements have been prepared in conformity with accounting principles generally accepted in the United States of America and, therefore, reflect certain adjustments to the Company’s book and records. The principal adjustments relate to accounting for direct financing leases, accounting for impairment of long-lived assets and long-lived assets to be disposed of, use of the straight-line method of depreciation for operating lease equipment, deferral of life insurance policy acquisition cost and calculation of policy liabilities, accounting for derivative instruments and hedging activities, accounting for goodwill and intangible assets resulting from business combinations, and a reflection of the income tax effect on such adjustments. (b) Principles of consolidation
The consolidated financial statements include the accounts of the Company and all of its subsidiaries. Investments in affiliates, where the Company has the ability to exercise significant influence by way of 20%–50% ownership or other means, are accounted for by using the equity method. A lag period of up to three months is used on a consistent basis when considered necessary and appropriate for recognizing the results of subsidiaries and affiliates.
The consolidated financial statements also include variable interest entities to which the Company and its subsidiaries are primary beneficiaries pursuant to FASB Interpretation No. 46 (revised December 2003) (FIN 46(R) (“Consolidation of Variable Interest Entities”).
All significant intercompany accounts and transactions have been eliminated in consolidation. (c) Use of estimates
The preparation of the consolidated financial statements in conformity with generally accepted accounting principles requires management to make estimates and assumptions that affect the reported amounts of assets and liabilities at the date of the financial statements and the reported amounts of revenues and expenses during the reporting period. Actual results could differ from those estimates. The Company has identified seven areas where it believes assumptions and estimates are particularly critical to the financial statements. These are the determination of the allowance for doubtful receivables on direct financing leases and probable loan losses (see (g)), the determination of impairment of investment in securities (see (i)), the determination of impairment of long-lived assets (see (h)) and goodwill (see (w)), the determination of valuation allowance for deferred tax assets (see (j)), the determination of benefit obligations and net periodic pension cost (see (m)), the determination and periodic reassessment of the unguaranteed residual value for direct financing leases and operating leases (see (e)), and the determination and reassessment of insurance policy liabilities and deferred policy acquisition costs (see (f)). (d) Foreign currencies translation
The Company and its subsidiaries maintain their accounting records in their respective functional currency. Transactions in foreign currencies are recorded in the entity’s functional currency based on the prevailing exchange rates on the transaction date. The financial statements of foreign subsidiaries and affiliates are translated into Japanese yen by applying the exchange rates in effect at the end
of each fiscal year to all assets and liabilities. Income and expenses are translated at the average rates of exchange prevailing during the fiscal year. The currencies in which the operations of the foreign subsidiaries and affiliates are conducted are regarded as the functional currencies of these companies. Foreign currency translation adjustments reflected in accumulated other comprehensive income (loss) in shareholders’ equity are from the translation of foreign currency financial statements into Japanese yen. (e) Recognition of revenues
Direct financing leases—Direct financing leases consist of full-payout leases for various equipment types, including office equipment, industrial machinery and transportation equipment (aircraft, vessels and automobiles). The excess of aggregate lease rentals plus the estimated unguaranteed residual value over the cost of the leased equipment constitutes the unearned lease income to be taken into income over the lease term. The estimated residual values represent estimated proceeds from the disposition of equipment at the time the lease is terminated. Estimates of unguaranteed residual values are based on current market values of used equipment and estimates of when and how much equipment will become obsolete. Certain direct lease origination costs (“initial direct costs”) are being deferred and amortized over the lease term as a yield adjustment. The
68
unamortized balance of initial direct costs is reflected as a component of investment in direct financing leases. Amortization of unearned lease income and initial direct cost is computed using the interest method.
Installment loans—Interest income on installment loans is recognized on an accrual basis. Certain direct loan origination costs, offset by loan origination fees (“loan origination costs, net”), are being deferred and amortized over the contractual term of the loan as an adjustment of the related loan’s yield using the interest method.
Interest payments received on impaired loans are recorded as interest income unless the collection of the remaining investment is doubtful at which time payments received are recorded as reductions of principal (see Note 7).
Non-accrual policy—Revenues on direct financing leases and installment loans are no longer accrued at the time when principal or interest become past due 90 days or more, or earlier, if management believes their collectibility is doubtful. The Company and its subsidiaries used 180 days for suspending recognition of income in the prior fiscal years. This change from 180 to 90 days did not have a significant effect on the Company and its subsidiaries’ results of operations or financial position. Accrued but uncollected interest is reclassified to investment in direct financing leases or installment loans in the accompanying consolidated balance sheet and becomes subject to the allowance for doubtful receivables and probable loan loss process. Cash repayments received on these accounts are applied first against any due but unpaid principal payments with the balance taken to income until qualifying for a return to accrual status.
Operating leases—Revenues from operating leases are recognized on a straight-line basis over the contract terms. Operating lease assets are recorded at cost and are depreciated over their estimated useful lives mainly on a straight-line basis. Estimated average useful lives of operating leases assets classified as transportation equipment is 9 years, as measuring equipment and personal computers is 5 years, as real estate and other is 33 years. Gains or losses arising from dispositions of operating lease assets, except real estate under operating leases, are included in operating lease revenues. Gains or losses arising from dispositions of real estate under operating leases are separately disclosed as “Gains on sales of real estate under operating leases” or “Discontinued operations-Income from discontinued operations, net” depending on the continuing involvement in such real estate by the Company or its subsidiaries. If the Company or its subsidiaries have significant continuing involvement in operations of disposed real estate, in the form such as asset or property management, gains or losses are presented as “Gains on sales of real estate under operating leases.” Estimates of residual values are based on current market values of used equipment and estimates of when and how much equipment will become obsolete.
Brokerage commissions and net gains on investment securities—Brokerage commissions and net gains on investment securities are recorded on a trade date basis.
Residential condominiums—Revenues from the sales of residential condominiums are recognized when a contract is in place, a closing has taken place, the buyer’s initial and continuing investment is adequate to demonstrate a commitment to pay for the property and the Company and its subsidiaries do not have a substantial continuing involvement in the property. (f) Insurance premiums and expenses
Premium income from life insurance policies are recognized as earned premiums when due. Life insurance benefits are recorded as expenses when they are incurred. Policy liabilities for future policy benefits are established for by the net
level premium method, based on actuarial estimates of the amount of future policyholder benefits. The policies are characterized as long-duration policies and mainly consist of endowments, term life insurance and whole life insurance. Computation of policy liabilities and reserves necessarily includes assumptions about mortality, lapse rates and future yields on related investments and other factors applicable at the time the policies are written. The average rates of assumed investment yields are 2.8%, 2.0% and 1.7% for fiscal 2002, 2003 and 2004, respectively. The Company continually evaluates the potential for changes in the estimates and assumptions applied in determining policy liabilities, both positive and negative, and uses the results of these evaluations both to adjust recorded liabilities and to adjust underwriting criteria and product offerings.
FASB Statement No. 60 (“Accounting and Reporting by Insurance Enterprises”) requires insurance companies to defer certain costs associated with writing insurances (“deferred policy acquisition costs”) and amortize over the respective policy periods in proportion to anticipated premium revenue. Deferred policy acquisition costs are the costs related to the acquisition of new and renewal insurance policies and consist primarily of first-year commissions in excess of recurring policy maintenance costs and certain variable costs and expenses for underwriting policies. Amortization charged to income for fiscal 2002, 2003 and 2004 amounted to ¥11,424 million, ¥11,740 million and ¥10,017 million ($95 million), respectively. (g) Allowance for doubtful receivables on direct financing leases and probable loan losses
The allowance for doubtful receivables on direct financing leases and probable loan losses is maintained at a level which, in the judgment of management, is adequate to provide for probable losses inherent in lease and loan portfolios. The allowance is increased by provisions charged to income and is decreased by charge-offs, net of recoveries.
Developing the allowance for doubtful receivables on direct financing leases and probable loan losses is subject to numerous estimates and judgments. In evaluating the adequacy of the allowance, management considers various factors, including the nature and characteristics of the obligor, current economic conditions, credit concentrations or deterioration in pledged collateral, historical loss experience, delinquencies and future cash flows expected to be received. Generally, large-balance non-homogeneous loans are individually assessed whether each of the loans is impaired. If a
69
loan is deemed to be impaired, it is evaluated based on the present value of expected future cash flows or the fair value of the collateral securing the loan if the loan is collateral dependent. Smaller-balance homogeneous loans and lease receivables are collectively evaluated considering current economic conditions and trends, prior charge-off experience for each category of collateralized receivables and uncollateralized receivables, delinquencies and non-accruals.
Receivables are charged off when, in the opinion of management, the likelihood of any future collection is believed to be minimal. The Company and its subsidiaries do not have a practice of charging loans off after they are past due for a specific arbitrary period, for example, six months or one year. (h) Impairment of long-lived assets
Effective April 1, 2002, the Company and its subsidiaries adopted FASB Statement No. 144 (“Accounting for the Impairment or Disposal of Long-Lived Assets”), FASB Statement No. 144 superseded FASB Statement No. 121 (“Accounting for the Impairment of Long-Lived Assets and for Long-Lived Assets to Be Disposed Of”). Under FASB Statement No. 144, impairment losses are recorded with respect to long-lived assets used in operations, consisting primarily of real estate development projects, golf courses and other operating assets, when events and circumstances indicate that the assets might be impaired and the undiscounted cash flows estimated to be generated by those assets are less than the carrying amount of those assets. The net carrying value of assets not recoverable is reduced to fair value if lower than the carrying value. In determining fair value, recent transactions involving sales of similar assets, appraisals prepared internally by the Company’s own staff of appraisers, independent third party appraisals and other valuation techniques are utilized. (i) Investment in securities
Trading securities are reported at fair value with unrealized gains and losses included in income. Available-for-sale securities are reported at fair value, and unrealized gains or losses are recorded through other comprehensive income (loss), net
of applicable income taxes. Held-to-maturity securities are recorded at amortized cost. Generally, the Company and its subsidiaries recognize losses related to available-for-sale securities and held-to-maturity securities for which the
market price has been significantly below the acquisition cost (or current carrying value if an adjustment has been made in the past) for more than six months. In determining whether the decline in the market value of a debt security is other than temporary, the Company and its subsidiaries consider whether there has been a significant deterioration in a bond issuer’s credit rating, an issuer’s default or a similar event. In addition, the Company and its subsidiaries charge against income losses related to securities in certain other situations where, even though the market value has not remained significantly below the carrying value for six months, the decline in the market value of a security is based on issuer’s specific economic conditions and not just general declines in the related market and where it is considered unlikely that the market value of the security will recover within the next six months. For financial periods prior to the quarter ended March 31, 2003, the period used for considering whether impairment was other than temporary was twelve months.
However, with respect to equity securities, if the Company and its subsidiaries have a significant long-term business relationship with the company, management considers the probability of the market value recovering within the following six months. As part of this review, the company’s operating results, net asset value and future performance forecasts as well as general market conditions are taken into consideration. If management believes, based on this review, that the market value of an equity security may realistically be expected to recover, the loss will continue to be classified as temporary. Temporary declines in market value are recorded through other comprehensive income (loss), net of applicable income taxes. If after an additional six months the market value is still significantly below the acquisition cost, the loss will be considered other than temporary and the decline in market value charged to income. For the financial periods prior to the quarter ended March 31, 2003, the additional consideration period was twelve months. (j) Income taxes
Income taxes are accounted for under the asset and liability method. Deferred tax assets and liabilities are recognized for the future tax consequences attributable to differences between the financial statement carrying amounts of existing assets and liabilities and their respective tax bases and operating loss and tax credit carryforwards. Deferred tax assets and liabilities are measured using enacted tax rates expected to apply to taxable income in the year in which those temporary differences are expected to be recovered or settled. The effect on deferred tax assets and liabilities of a change in tax rate is recognized in income in the period that includes the enactment date. A valuation allowance is recognized if, based on the weight of available evidence, it is “more likely than not” that some portion or all of the deferred tax asset will not be realized. (k) Securitized assets
The Company and its subsidiaries have securitized and sold to investors certain lease receivables, loan receivables and investment in securities. In the securitization process, the assets to be securitized (“the assets”) are sold to special-purpose entities that issue asset-backed securities to the investors. The Company and its subsidiaries account for the sale when control over the assets is surrendered. When the Company and its subsidiaries sell the assets in a securitization transaction, the carrying value of the assets is allocated to the portion retained and the portion sold,
70
based on relative fair values. The Company and its subsidiaries recognize gains or losses for the difference between the net proceeds received and the allocated carrying value of the assets sold. Any gain or loss from a securitization transaction is recorded as revenue of direct financing leases, interest on loans and investment securities, or brokerage commissions and net gains on investment securities.
Retained interests include subordinated interests, servicing assets, excess spread assets and cash collateral. Retained interests are initially recorded at allocated carrying value of the assets based on their fair value and are periodically reviewed for impairment. When a decline in fair value below the carrying value of a retained interests is other than temporary, the Company and its subsidiaries consider the value of the retained interests to be impaired and record a write-down of the retained interests to fair value.
Fair values of retained interests are estimated by determining the present value of future expected cash flows based on management’s estimates of key assumptions, including expected credit loss, discount rate and prepayment rate. (l) Derivative financial instruments
On April 1, 2001, the Company and its subsidiaries adopted FASB Statement No. 133 (“Accounting for Derivative Instruments and Hedging Activities”) and FASB Statement No. 138 (“Accounting for Certain Derivative Instruments and Certain Hedging Activity, an amendment of FASB Statement No. 133”). All derivatives are recognized on the balance sheet at their fair values. On the date the Company or a subsidiary enters into a derivative contract, the Company or its subsidiary designates the derivative as either a hedge of the fair value of a recognized asset or liability or of an unrecognized firm commitment (“fair value” hedge), a hedge of a forecasted transaction or of the variability of cash flows to be received or paid related to a recognized asset or liability (“cash flow” hedge), a foreign-currency fair-value or cash-flow hedge (“foreign currency” hedge), a hedge of a net investment in foreign operation or a non-hedging transaction. For all hedging relationships, at inception the Company and its subsidiaries formally document the risk-management objective and strategy for undertaking the hedge transaction. The Company and its subsidiaries also document the hedged risk, the hedge type and the hedging instrument for each hedging activity. The Company and its subsidiaries also formally assess, both at the hedge’s inception and on an ongoing basis, whether the derivatives that are used in hedging transactions are highly effective in offsetting changes in fair values or cash flows of hedged items. When it is determined that a derivative is not highly effective for a hedge, hedge accounting is discontinued.
Changes in the fair value of a derivative that is highly effective and that is designated and qualifies as a fair-value hedge, along with the loss or gain on the hedged asset or liability or unrecognized firm commitment of the hedged item that is attributable to the hedged risk, are recorded in earnings. Changes in the fair value of a derivative that is highly effective and that is designated and qualifies as a cash-flow hedge are recorded in other comprehensive income (loss) to the extent that the derivative is effective as a hedge, until earnings are affected by the variability in cash flows of the designated hedged item. Changes in the fair value of derivatives that are highly effective as hedges and that are designated and qualify as foreign-currency hedges are recorded in either earnings or other comprehensive income (loss), depending on whether the hedge transaction is a fair-value hedge or a cash-flow hedge. However, if a derivative is used as a hedge of a net investment in a foreign operation, its changes in fair value, to the extent effective as a hedge, are recorded in the cumulative translation adjustments account within other comprehensive income (loss). The ineffective portion of the change in fair value of a derivative instrument that qualifies as either a fair-value hedge or a cash-flow hedge is reported in earnings.
The Company and its subsidiaries discontinue hedge accounting prospectively when it is determined that the derivative is no longer effective in offsetting changes in the fair value or cash flows of the hedged item, the derivative expires or is sold, terminated, or exercised, the derivative is no longer designated as a hedging instrument, because it is unlikely that a forecasted transaction will occur, a hedged firm commitment no longer meets the definition of a firm commitment, or management determines that designation of the derivative as a hedging instrument is no longer appropriate.
When hedge accounting is discontinued because it is determined that the derivative no longer qualifies as an effective fair-value hedge, the Company and its subsidiaries continue to carry the derivative on the balance sheet at its fair value and no longer adjusts the hedged asset or liability for changes in fair value. When hedge accounting is discontinued because the hedged item no longer meets the definition of a firm commitment, the Company and its subsidiaries continue to carry the derivative on the balance sheet at its fair value, removes any asset or liability that was recorded pursuant to recognition of the firm commitment from the balance sheet, and recognize any gain or loss in earnings. When hedge accounting is discontinued because it is probable that a forecasted transaction will not occur, the Company and its subsidiaries continue to carry the derivative on the balance sheet at its fair value with subsequent changes in fair value included in earnings, and gains and losses that were accumulated in other comprehensive income (loss) are recognized immediately in earnings. In all other situations in which hedge accounting is discontinued, the Company and its subsidiaries continue to carry the derivative at its fair value on the balance sheet and recognize any subsequent changes in its fair value in earnings.
The Company and its subsidiaries also hold derivative instruments for trading purposes, customer accommodation or not qualified as hedging instruments. The Company and its subsidiaries record these derivative instruments on the balance sheet at fair value. The changes in fair values are recorded in earnings.
The Company and its subsidiaries occasionally purchase or originate financial instruments that contain an embedded derivative instrument. Upon acquisition of such financial instrument, the Company and its subsidiaries assess whether the economic characteristics of the embedded derivative instrument are clearly and closely related to the economic characteristics of the financial instrument (“host contract”), whether the financial instrument
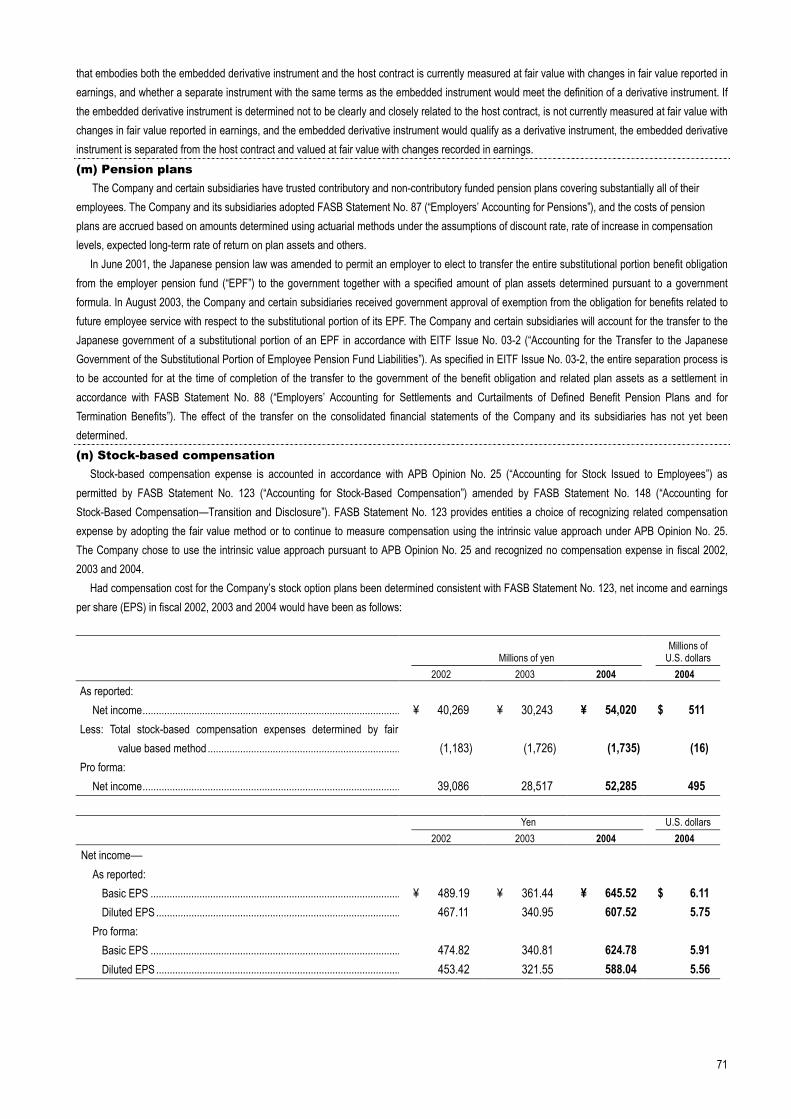
71
that embodies both the embedded derivative instrument and the host contract is currently measured at fair value with changes in fair value reported in earnings, and whether a separate instrument with the same terms as the embedded instrument would meet the definition of a derivative instrument. If the embedded derivative instrument is determined not to be clearly and closely related to the host contract, is not currently measured at fair value with changes in fair value reported in earnings, and the embedded derivative instrument would qualify as a derivative instrument, the embedded derivative instrument is separated from the host contract and valued at fair value with changes recorded in earnings. (m) Pension plans
The Company and certain subsidiaries have trusted contributory and non-contributory funded pension plans covering substantially all of their employees. The Company and its subsidiaries adopted FASB Statement No. 87 (“Employers’ Accounting for Pensions”), and the costs of pension plans are accrued based on amounts determined using actuarial methods under the assumptions of discount rate, rate of increase in compensation levels, expected long-term rate of return on plan assets and others.
In June 2001, the Japanese pension law was amended to permit an employer to elect to transfer the entire substitutional portion benefit obligation from the employer pension fund (“EPF”) to the government together with a specified amount of plan assets determined pursuant to a government formula. In August 2003, the Company and certain subsidiaries received government approval of exemption from the obligation for benefits related to future employee service with respect to the substitutional portion of its EPF. The Company and certain subsidiaries will account for the transfer to the Japanese government of a substitutional portion of an EPF in accordance with EITF Issue No. 03-2 (“Accounting for the Transfer to the Japanese Government of the Substitutional Portion of Employee Pension Fund Liabilities”). As specified in EITF Issue No. 03-2, the entire separation process is to be accounted for at the time of completion of the transfer to the government of the benefit obligation and related plan assets as a settlement in accordance with FASB Statement No. 88 (“Employers’ Accounting for Settlements and Curtailments of Defined Benefit Pension Plans and for Termination Benefits”). The effect of the transfer on the consolidated financial statements of the Company and its subsidiaries has not yet been determined. (n) Stock-based compensation
Stock-based compensation expense is accounted in accordance with APB Opinion No. 25 (“Accounting for Stock Issued to Employees”) as permitted by FASB Statement No. 123 (“Accounting for Stock-Based Compensation”) amended by FASB Statement No. 148 (“Accounting for Stock-Based Compensation—Transition and Disclosure”). FASB Statement No. 123 provides entities a choice of recognizing related compensation expense by adopting the fair value method or to continue to measure compensation using the intrinsic value approach under APB Opinion No. 25. The Company chose to use the intrinsic value approach pursuant to APB Opinion No. 25 and recognized no compensation expense in fiscal 2002, 2003 and 2004.
Had compensation cost for the Company’s stock option plans been determined consistent with FASB Statement No. 123, net income and earnings per share (EPS) in fiscal 2002, 2003 and 2004 would have been as follows:
Millions of yen Millions of
U.S. dollars 2002 2003 2004 2004
As reported: Net income............................................................................................... ¥ 40,269 ¥ 30,243 ¥ 54,020 $ 511
Less: Total stock-based compensation expenses determined by fair value based method ....................................................................... (1,183) (1,726) (1,735) (16)
Pro forma: Net income............................................................................................... 39,086 28,517 52,285 495
Yen U.S. dollars 2002 2003 2004 2004
Net income— As reported:
Basic EPS ............................................................................................ ¥ 489.19 ¥ 361.44 ¥ 645.52 $ 6.11Diluted EPS.......................................................................................... 467.11 340.95 607.52 5.75
Pro forma: Basic EPS ............................................................................................ 474.82 340.81 624.78 5.91Diluted EPS.......................................................................................... 453.42 321.55 588.04 5.56
72
(o) Stock splits Stock splits implemented prior to October 1, 2001 have been accounted for by transferring an amount equivalent to the par value of the shares
from additional paid-in capital to common stock as required by the Japanese Commercial Code (the “Code”). No accounting recognition is made for stock splits when common stock already includes a portion of the proceeds from shares issued at a price in excess of par value. This method of accounting is in conformity with accounting principles generally accepted in Japan.
Based on an amendment to the Code, effective on October 1, 2001, the above-mentioned method of accounting based on the regulation has become unnecessary.
In the United States, stock splits in comparable circumstances are considered to be stock dividends and are accounted for by transferring from retained earnings to common stock and additional paid-in capital amounts equal to the fair market value of the shares issued. Common stock is increased by the par value of the shares and additional paid-in capital is increased by the excess of the market value over par value of the shares issued. Had such stock splits made prior to October 1, 2001 been accounted for in this manner, additional paid-in capital as of March 31, 2004 would have increased by approximately ¥24,674 million ($233 million), with a corresponding decrease in retained earnings. Total shareholders’ equity would remain unchanged. A stock split on May 19, 2000 was excluded from the above amounts because the stock split was not considered to be a stock dividend under accounting principles generally accepted in the United States of America. (p) Cash and cash equivalents
Cash and cash equivalents include cash on hand, deposits placed with banks and short-term highly liquid investments with original maturities of three months or less. (q) Restricted cash
Restricted cash consists of cash held in trusts for the segregation of assets under an investor protection fund and deposits related to servicing agreements. (r) Other operating assets
Other operating assets consist primarily of operating facilities (including golf courses, hotels and a training facility), which are stated at cost less accumulated depreciation, and depreciation is calculated mainly on the straight-line basis over the estimated useful lives of the assets. Accumulated depreciation is ¥2,926 million and ¥4,248 million ($40 million) as of March 31, 2003 and 2004, respectively. Estimated useful lives range up to 50 years for buildings, up to 75 years for fixtures and up to 20 years for machinery and equipment. (s) Other receivables
Other receivables consist primarily of payments made on behalf of lessees for property tax, maintenance fees and insurance premiums in relation to direct financing lease contracts and receivables from the sale of lease assets. (t) Inventories
Inventories include advance and/or progress payments for development of residential condominiums for sale and completed residential condominiums (including completed residential condominiums waiting to be delivered to buyers under the contracts for sale). Advance and/or progress payments for sale are carried at cost less any impairment losses and finished goods (including completed residential condominiums) are stated at the lower of cost or market. As of March 31, 2003 and 2004, advance and/or progress payments were ¥75,755 million and ¥93,822 million ($888 million), respectively, and finished goods were ¥25,138 million and ¥27,619 million ($261 million), respectively. (u) Office facilities
Office facilities are stated at cost less accumulated depreciation. Depreciation is calculated on a declining-balance basis or straight-line basis over the estimated useful lives of the assets. Accumulated depreciation is ¥23,234 million and ¥22,670 million ($214 million) as of March 31, 2003 and 2004, respectively. Estimated useful lives range up to 50 years for buildings and fixtures and up to 20 years for machinery and equipment. (v) Other assets
Other assets consist primarily of the excess of purchase prices over the net assets acquired in acquisitions (goodwill) and other intangible assets (see (w)), deferred policy acquisition costs which are amortized over the contract periods, leasehold deposits and advance payments made in relation to purchases of assets to be leased. (w) Goodwill and other intangible assets
In June 2001, FASB Statement No. 141 (“Business Combinations”) and FASB Statement No. 142 (“Goodwill and Other Intangible Assets”) were issued. FASB Statement No. 141 requires that all business combinations be accounted for using the purchase method. Accounting for business combinations using the pooling of interests method is no longer allowed. FASB Statement No. 141 also requires that intangible assets acquired in a business combination be recognized apart from goodwill if the intangible assets meet one of two criteria—either the contractual-legal criterion or the separability criterion. The provisions of FASB Statement No. 141 apply to all business combinations initiated or business combinations accounted for by the purchase method completed after June 30, 2001. On April 1, 2002, as a result of the adoption of FASB Statement No. 141, the Company and its subsidiaries recorded a transition gain of ¥1,937 million, net of tax of ¥353 million, as a cumulative effect of a change in accounting principle, due to
73
the write-off of unamortized deferred credits that existed as of March 31, 2002. The deferred credits relate to an excess of the fair value over cost arising from business combinations completed and investments accounted for by the equity method acquired before July 1, 2001.
FASB Statement No. 142 establishes how intangible assets (other than those acquired in a business combination) should be accounted for upon acquisition. It also addresses how goodwill and other intangible assets should be accounted for subsequent to their acquisition. Both goodwill and intangible assets that have indefinite useful lives will no longer be amortized but will be tested at least annually for impairment. Intangible assets with finite lives will continue to be amortized over their useful lives. The provisions of FASB Statement No. 142 were adopted in their entirety by the Company and its subsidiaries as of April 1, 2002.
Until March 31, 2002, the Company and its subsidiaries amortized goodwill over the periods ranging from 5 to 25 years, with respect to acquisitions that occurred prior to July 1, 2001. Beginning April 1, 2002 (July 1, 2001 for acquisitions occurring on or after that date), the Company and its subsidiaries ceased amortization of goodwill pursuant to the provisions of FASB Statement No. 142 (See Note 12). (x) Trade notes, accounts payable and other liabilities
Trade notes, accounts payable and other liabilities include derivative payables and minority interests. (y) Capitalization of interest costs
The Company and its subsidiaries capitalized interest costs of ¥3,260 million, ¥490 million and ¥222 million ($2 million) in fiscal 2002, 2003 and 2004, respectively, related to specific long-term real estate development projects. (z) Advertising
The costs of advertising are expensed as incurred. The total amounts charged to advertising expense in fiscal 2002, 2003 and 2004 are ¥9,103 million, ¥9,472 million and ¥9,725 million ($92 million), respectively. (aa) Restructuring costs
During April 2001, a subsidiary in the United States announced its intention to consolidate certain of its U.S. locations into one location. The consolidation allowed the subsidiary to substantially reduce operating expenses, increase efficiency and redesign processes as the subsidiary pursues new business opportunities. In connection therewith, in accordance with EITF Issue No. 94-3 (“Liability Recognition for Certain Employee Termination Benefits and Other Costs to Exit an Activity (including Certain Costs Incurred in a Restructuring)”), the subsidiary recorded accrued expenses of ¥2,585 million and ¥93 million in selling, general and administrative expenses in the accompanying consolidated statements of income in fiscal 2002 and 2003, respectively. No additional accrued expense was recorded in fiscal 2004. As of March 31, 2004, the remaining balance of ¥83 million ($1 million) is included in trade notes, accounts payable and other liabilities in the accompanying consolidated balance sheets consisting primarily of remaining severance and lease obligations.
In June 2002, FASB Statement No. 146 (“Accounting for Costs Associated with Exit or Disposal Activities”) was issued, and has been adopted for the exit or disposal activities initiated after December 31, 2002. Adoption of this Statement did not have a significant effect on the Company and its subsidiaries’ results of operations or financial position. (ab) Discontinued operations
The Company and its subsidiaries have followed FASB Statement No.144 (“Accounting for the Impairment or Disposal of Long-Lived Assets”). FASB Statement No.144 broadened the scope of discontinued operations to the operating results of any assets with their own identifiable cash flows, which the Company and its subsidiaries will not have significant continuing involvement. Certain properties were sold or to be disposed of by sale in fiscal 2004 without significant continuing involvements and the related results of operations for the presented periods in the accompanying consolidated financial statements were reclassified. (ac) Financial statements presentation in U.S. dollars
The translations of the Japanese yen amounts into U.S. dollars are included solely for the convenience of the readers, using the prevailing exchange rate at March 31, 2004, which was ¥105.69 to $1.00. The convenience translations should not be construed as representations that the Japanese yen amounts have been, could have been, or could in the future be, converted into U.S. dollars at this or any other rate of exchange. (ad) Earnings per share
Basic earnings per share is computed by dividing income from continuing operations and net income by the weighted average number of shares of common stock outstanding in each period and diluted earnings per share reflects the potential dilution that could occur if securities or other contracts to issue common stock were exercised or converted into common stock.
Earnings per share is adjusted for any stock splits and stock dividends retroactively. (ae) Issuance of stock by a subsidiary or an affiliate
When a subsidiary or an affiliate issues stocks to unrelated third parties, the Company’s ownership interest in the subsidiary or the affiliate decreases. In the event that the price per share is more or less than the Company’s average carrying amount per share, the Company adjusts the carrying amount of its investment in the subsidiary and the affiliate and recognizes gain or loss in the year in which the change in ownership interest occurs.
74
(af) New accounting pronouncements In June 2001, the FASB issued Statement No. 143 (“Accounting for Asset Retirement Obligations”), which addresses financial accounting and
reporting for recognition of a liability for an asset retirement obligation and the associated asset retirement cost. Companies are required to recognize a liability equal to the fair value of the asset retirement obligation as of the date the retirement obligation is incurred. The Company and its subsidiaries adopted FASB Statement No. 143 as of April 1, 2003. Adoption of this Statement did not have a significant effect on the Company and its subsidiaries’ results of operations or financial position.
In April 2002, the FASB issued Statement No. 145 (“Rescission of FASB Statements No. 4, 44, and 64, Amendment of FASB Statement No. 13, and Technical Corrections”), which rescinds certain authoritative pronouncements and amends, or clarifies the applicability of others. This Statement is effective for fiscal years beginning after May 15, 2002, but the provisions related to the amendment of FASB Statement No. 13 are effective for transactions occurring after May 15, 2002. The provisions of this Statement were adopted by the Company on April 1, 2003. Adoption of this Statement did not have a significant effect on the Company and its subsidiaries’ results of operations or financial position.
In January 2003, the FASB issued Interpretation No. 46 (“Consolidation of Variable Interest Entities”). FASB Interpretation No. 46 addresses consolidation by business enterprises of variable interest entities, representing those entities whose total equity investment at risk is not sufficient to permit the entity to finance its activities without additional subordinated financial support from other parties, or whose equity investors cannot make significant decisions about the entity’s operations or do not absorb the entity’s expected losses or residual returns. The Interpretation requires that the primary beneficiary (defined as the person or entity that is expected to absorb a majority of the entity’s expected losses or receive a majority of the entity’s expected residual returns or both) to consolidate the VIE. Qualifying SPEs in FASB Statement No. 140 (“Accounting for Transfers and Servicing of Financial Assets and Extinguishments of Liabilities—a replacement of FASB Statement No. 125”) are not affected by the Interpretation. The revised Interpretation No. 46 (FIN 46 (R)) was issued in December 2003. The Company and its subsidiaries fully adopted FIN 46(R) at March 31, 2004. See Note 10 for further information concerning the Company’s VIEs and the effects of the adoption of this Interpretation on the Company and its subsidiaries’ results of operations or financial position.
In April 2003, FASB Statement No. 149 (“Amendment of Statement 133 on Derivative Instruments and Hedging Activities”) was issued. This Statement amends and clarifies financial accounting and reporting for derivative instruments, including certain derivative instruments embedded in other contracts (collectively referred to as derivatives) and for hedging activities under FASB Statement No. 133 (“Accounting for Derivative Instruments and Hedging Activities”). This Statement is effective for contracts entered into or modified after June 30, 2003, and for hedging relationships designated after June 30, 2003. All provisions of this Statement were applied prospectively. Adoption of this Statement did not have a significant effect on the Company and its subsidiaries’ results of operations or financial position.
In May 2003, FASB Statement No. 150 (“Accounting for Certain Financial Instruments with Characteristics of both Liabilities and Equity”) was issued. The Statement improves the accounting for certain financial instruments that, under previous guidance, issuers could account for as equity. The new Statement requires that those instruments be classified as liabilities in the statement of financial position. Part of the classification and measurement provisions of this Statement are deferred indefinitely pending further Board action. Adoption of this Statement will not have a significant effect on the Company and its subsidiaries’ results of operations or financial position.
In December 2003, FASB Statement No. 132 (revised 2003) (FASB Statement No. 132 (R)) (“Employers’ Disclosures about Pensions and Other Postretirement Benefits”) was issued. FASB Statement No. 132(R) revises and prescribes employers’ disclosures about pension plans and other postretirement benefit plans; it does not change the measurement or recognition of those plans. FASB Statement No. 132(R) retains the disclosures required by the original FASB Statement No. 132 and required additional disclosures about plan assets, benefit obligations, cash flows and other relevant quantitative and qualitative information. FASB Statement No. 132(R) is generally effective for fiscal years ending after December 15, 2003. The Company and its subsidiaries adopted this Statement for fiscal 2004 and provided Note 16 in accordance with the disclosure requirements of this Statement. (ag) Reclassifications
Certain amounts in the 2002 and 2003 consolidated financial statements have been reclassified to conform to the 2004 presentation. On the consolidated balance sheets, certain inventories included in advances and other operating assets as of March 31, 2003 were reclassified to a separate account as inventories. The remaining amount in advances after the reclassification to inventories has been included in other assets. On the consolidated statements of income, gains on sales of real estate under operating leases included in operating leases for the years ended March 31, 2002 and 2003 were reclassified as a separate account.
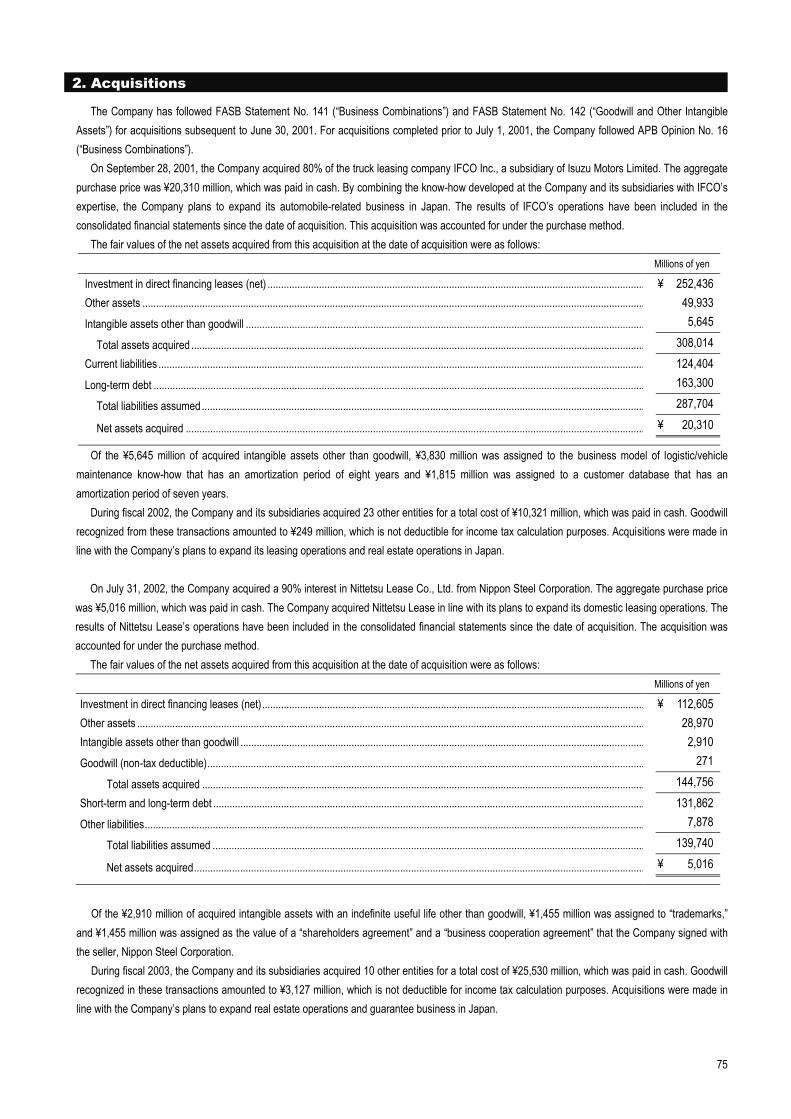
75
2. Acquisitions
The Company has followed FASB Statement No. 141 (“Business Combinations”) and FASB Statement No. 142 (“Goodwill and Other Intangible Assets”) for acquisitions subsequent to June 30, 2001. For acquisitions completed prior to July 1, 2001, the Company followed APB Opinion No. 16 (“Business Combinations”).
On September 28, 2001, the Company acquired 80% of the truck leasing company IFCO Inc., a subsidiary of Isuzu Motors Limited. The aggregate purchase price was ¥20,310 million, which was paid in cash. By combining the know-how developed at the Company and its subsidiaries with IFCO’s expertise, the Company plans to expand its automobile-related business in Japan. The results of IFCO’s operations have been included in the consolidated financial statements since the date of acquisition. This acquisition was accounted for under the purchase method.
The fair values of the net assets acquired from this acquisition at the date of acquisition were as follows: Millions of yen
Investment in direct financing leases (net) ........................................................................................................................................... ¥ 252,436Other assets ......................................................................................................................................................................................... 49,933Intangible assets other than goodwill ................................................................................................................................................... 5,645
Total assets acquired ....................................................................................................................................................................... 308,014Current liabilities ................................................................................................................................................................................... 124,404Long-term debt ..................................................................................................................................................................................... 163,300
Total liabilities assumed................................................................................................................................................................... 287,704
Net assets acquired ......................................................................................................................................................................... ¥ 20,310
Of the ¥5,645 million of acquired intangible assets other than goodwill, ¥3,830 million was assigned to the business model of logistic/vehicle maintenance know-how that has an amortization period of eight years and ¥1,815 million was assigned to a customer database that has an amortization period of seven years.
During fiscal 2002, the Company and its subsidiaries acquired 23 other entities for a total cost of ¥10,321 million, which was paid in cash. Goodwill recognized from these transactions amounted to ¥249 million, which is not deductible for income tax calculation purposes. Acquisitions were made in line with the Company’s plans to expand its leasing operations and real estate operations in Japan.
On July 31, 2002, the Company acquired a 90% interest in Nittetsu Lease Co., Ltd. from Nippon Steel Corporation. The aggregate purchase price
was ¥5,016 million, which was paid in cash. The Company acquired Nittetsu Lease in line with its plans to expand its domestic leasing operations. The results of Nittetsu Lease’s operations have been included in the consolidated financial statements since the date of acquisition. The acquisition was accounted for under the purchase method.
The fair values of the net assets acquired from this acquisition at the date of acquisition were as follows: Millions of yen
Investment in direct financing leases (net)............................................................................................................................................. ¥ 112,605Other assets ........................................................................................................................................................................................... 28,970Intangible assets other than goodwill ..................................................................................................................................................... 2,910Goodwill (non-tax deductible)................................................................................................................................................................. 271
Total assets acquired ................................................................................................................................................................... 144,756Short-term and long-term debt ............................................................................................................................................................... 131,862Other liabilities........................................................................................................................................................................................ 7,878
Total liabilities assumed ............................................................................................................................................................... 139,740
Net assets acquired...................................................................................................................................................................... ¥ 5,016
Of the ¥2,910 million of acquired intangible assets with an indefinite useful life other than goodwill, ¥1,455 million was assigned to “trademarks,”
and ¥1,455 million was assigned as the value of a “shareholders agreement” and a “business cooperation agreement” that the Company signed with the seller, Nippon Steel Corporation.
During fiscal 2003, the Company and its subsidiaries acquired 10 other entities for a total cost of ¥25,530 million, which was paid in cash. Goodwill recognized in these transactions amounted to ¥3,127 million, which is not deductible for income tax calculation purposes. Acquisitions were made in line with the Company’s plans to expand real estate operations and guarantee business in Japan.
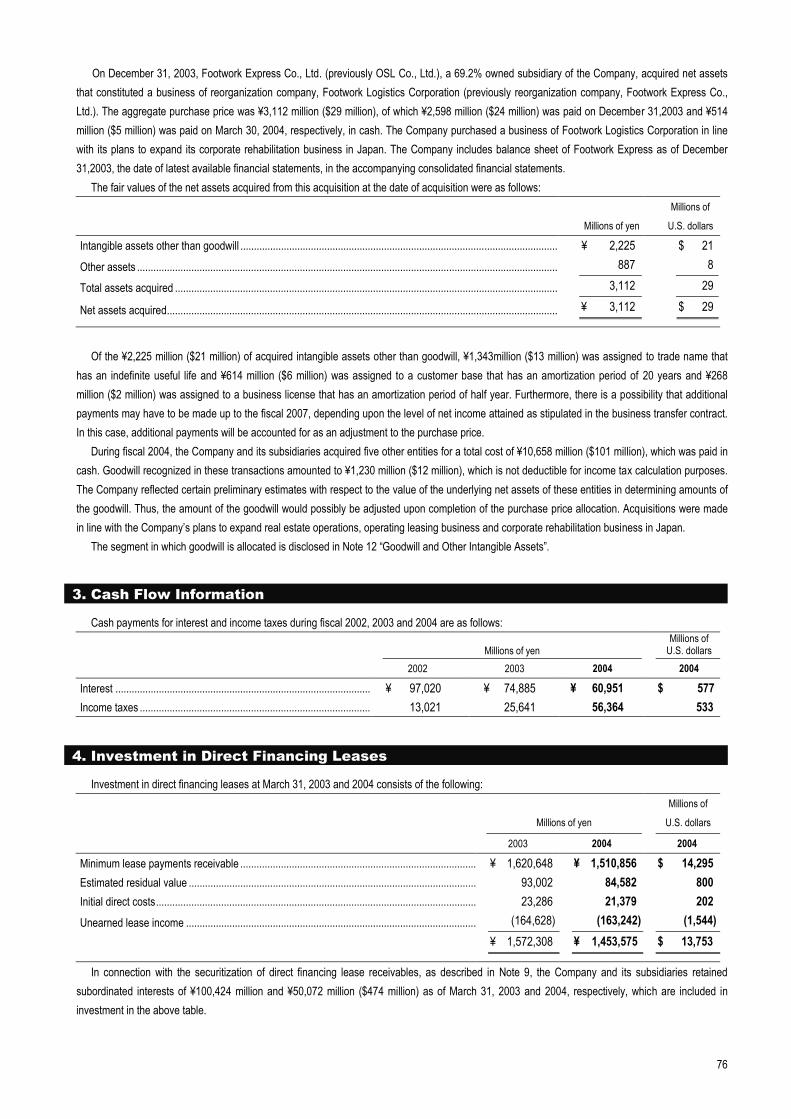
76
On December 31, 2003, Footwork Express Co., Ltd. (previously OSL Co., Ltd.), a 69.2% owned subsidiary of the Company, acquired net assets that constituted a business of reorganization company, Footwork Logistics Corporation (previously reorganization company, Footwork Express Co., Ltd.). The aggregate purchase price was ¥3,112 million ($29 million), of which ¥2,598 million ($24 million) was paid on December 31,2003 and ¥514 million ($5 million) was paid on March 30, 2004, respectively, in cash. The Company purchased a business of Footwork Logistics Corporation in line with its plans to expand its corporate rehabilitation business in Japan. The Company includes balance sheet of Footwork Express as of December 31,2003, the date of latest available financial statements, in the accompanying consolidated financial statements.
The fair values of the net assets acquired from this acquisition at the date of acquisition were as follows:
Millions of yen
Millions of
U.S. dollars
Intangible assets other than goodwill ..................................................................................................................... ¥ 2,225 $ 21Other assets ........................................................................................................................................................... 887 8
Total assets acquired ............................................................................................................................................. 3,112 29
Net assets acquired................................................................................................................................................ ¥ 3,112 $ 29
Of the ¥2,225 million ($21 million) of acquired intangible assets other than goodwill, ¥1,343million ($13 million) was assigned to trade name that
has an indefinite useful life and ¥614 million ($6 million) was assigned to a customer base that has an amortization period of 20 years and ¥268 million ($2 million) was assigned to a business license that has an amortization period of half year. Furthermore, there is a possibility that additional payments may have to be made up to the fiscal 2007, depending upon the level of net income attained as stipulated in the business transfer contract. In this case, additional payments will be accounted for as an adjustment to the purchase price.
During fiscal 2004, the Company and its subsidiaries acquired five other entities for a total cost of ¥10,658 million ($101 million), which was paid in cash. Goodwill recognized in these transactions amounted to ¥1,230 million ($12 million), which is not deductible for income tax calculation purposes. The Company reflected certain preliminary estimates with respect to the value of the underlying net assets of these entities in determining amounts of the goodwill. Thus, the amount of the goodwill would possibly be adjusted upon completion of the purchase price allocation. Acquisitions were made in line with the Company’s plans to expand real estate operations, operating leasing business and corporate rehabilitation business in Japan.
The segment in which goodwill is allocated is disclosed in Note 12 “Goodwill and Other Intangible Assets”.
3. Cash Flow Information
Cash payments for interest and income taxes during fiscal 2002, 2003 and 2004 are as follows:
Millions of yen Millions of
U.S. dollars
2002 2003 2004 2004
Interest .............................................................................................. ¥ 97,020 ¥ 74,885 ¥ 60,951 $ 577Income taxes ..................................................................................... 13,021 25,641 56,364 533
4. Investment in Direct Financing Leases
Investment in direct financing leases at March 31, 2003 and 2004 consists of the following:
Millions of yen
Millions of
U.S. dollars
2003 2004 2004
Minimum lease payments receivable ....................................................................................... ¥ 1,620,648 ¥ 1,510,856 $ 14,295Estimated residual value .......................................................................................................... 93,002 84,582 800Initial direct costs...................................................................................................................... 23,286 21,379 202Unearned lease income ........................................................................................................... (164,628) (163,242) (1,544)
¥ 1,572,308 ¥ 1,453,575 $ 13,753
In connection with the securitization of direct financing lease receivables, as described in Note 9, the Company and its subsidiaries retained subordinated interests of ¥100,424 million and ¥50,072 million ($474 million) as of March 31, 2003 and 2004, respectively, which are included in investment in the above table.
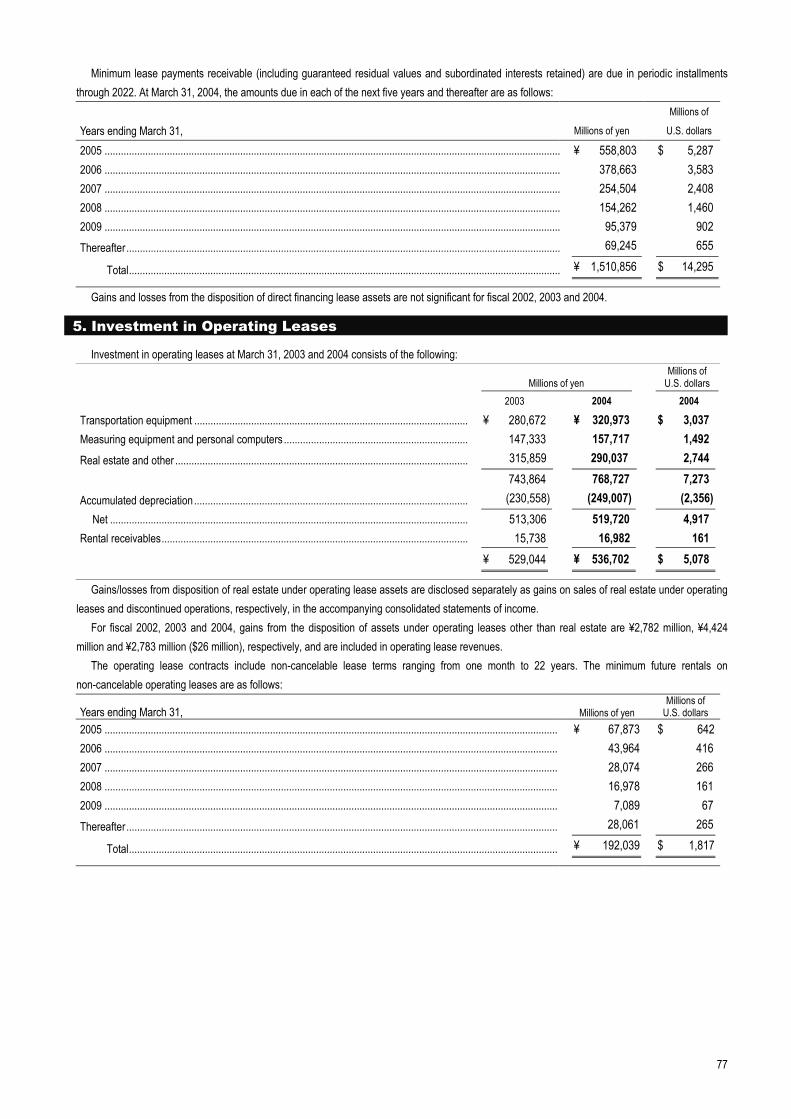
77
Minimum lease payments receivable (including guaranteed residual values and subordinated interests retained) are due in periodic installments through 2022. At March 31, 2004, the amounts due in each of the next five years and thereafter are as follows:
Years ending March 31, Millions of yen Millions of
U.S. dollars
2005 ........................................................................................................................................................................ ¥ 558,803 $ 5,2872006 ........................................................................................................................................................................ 378,663 3,5832007 ........................................................................................................................................................................ 254,504 2,4082008 ........................................................................................................................................................................ 154,262 1,4602009 ........................................................................................................................................................................ 95,379 902Thereafter................................................................................................................................................................ 69,245 655
Total............................................................................................................................................................... ¥ 1,510,856 $ 14,295
Gains and losses from the disposition of direct financing lease assets are not significant for fiscal 2002, 2003 and 2004.
5. Investment in Operating Leases
Investment in operating leases at March 31, 2003 and 2004 consists of the following:
Millions of yen Millions of
U.S. dollars 2003 2004 2004
Transportation equipment ..................................................................................................... ¥ 280,672 ¥ 320,973 $ 3,037Measuring equipment and personal computers .................................................................... 147,333 157,717 1,492Real estate and other ............................................................................................................ 315,859 290,037 2,744 743,864 768,727 7,273Accumulated depreciation..................................................................................................... (230,558) (249,007) (2,356)
Net .................................................................................................................................... 513,306 519,720 4,917Rental receivables.................................................................................................................
15,738 ¥ 529,044
16,982 ¥ 536,702
161$ 5,078
Gains/losses from disposition of real estate under operating lease assets are disclosed separately as gains on sales of real estate under operating leases and discontinued operations, respectively, in the accompanying consolidated statements of income.
For fiscal 2002, 2003 and 2004, gains from the disposition of assets under operating leases other than real estate are ¥2,782 million, ¥4,424 million and ¥2,783 million ($26 million), respectively, and are included in operating lease revenues.
The operating lease contracts include non-cancelable lease terms ranging from one month to 22 years. The minimum future rentals on non-cancelable operating leases are as follows:
Years ending March 31, Millions of yen Millions of
U.S. dollars 2005 ....................................................................................................................................................................... ¥ 67,873 $ 6422006 ....................................................................................................................................................................... 43,964 4162007 ....................................................................................................................................................................... 28,074 2662008 ....................................................................................................................................................................... 16,978 1612009 ....................................................................................................................................................................... 7,089 67Thereafter............................................................................................................................................................... 28,061 265
Total.............................................................................................................................................................. ¥ 192,039 $ 1,817
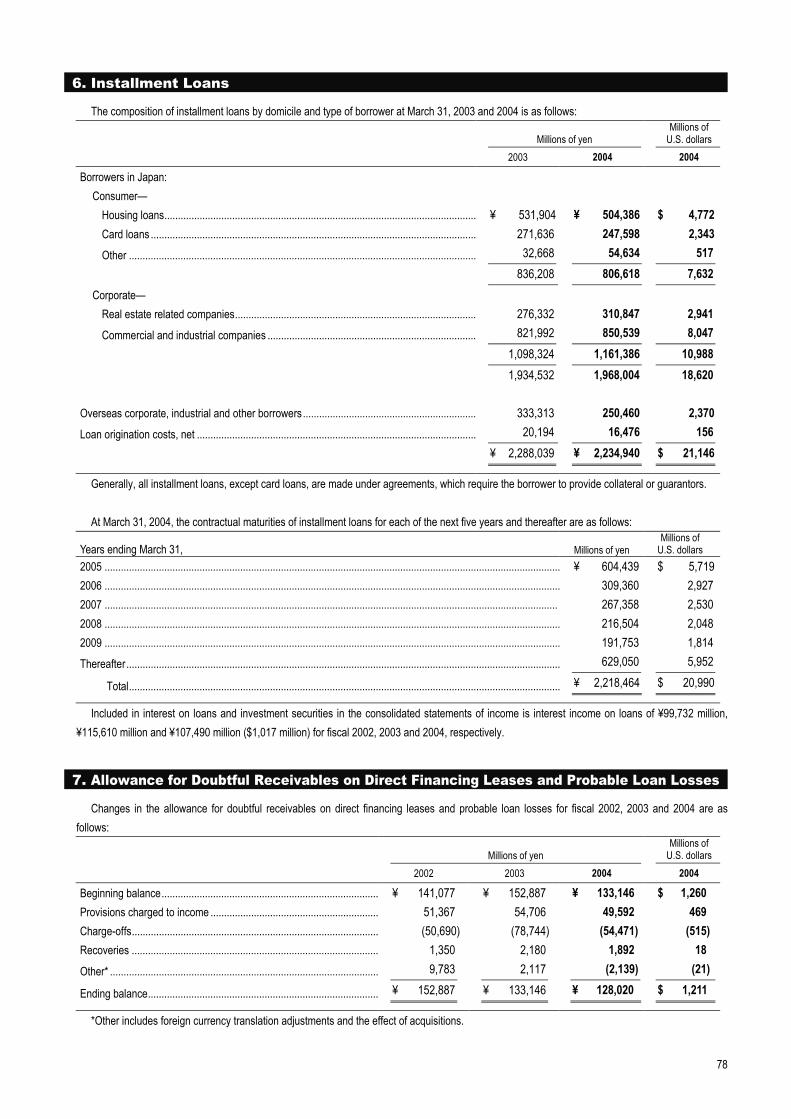
78
6. Installment Loans
The composition of installment loans by domicile and type of borrower at March 31, 2003 and 2004 is as follows:
Millions of yen Millions of
U.S. dollars 2003 2004 2004
Borrowers in Japan: Consumer—
Housing loans................................................................................................................... ¥ 531,904 ¥ 504,386 $ 4,772Card loans ........................................................................................................................ 271,636 247,598 2,343Other ................................................................................................................................ 32,668 54,634 517
836,208 806,618 7,632Corporate—
Real estate related companies......................................................................................... 276,332 310,847 2,941Commercial and industrial companies ............................................................................. 821,992 850,539 8,047
1,098,324 1,161,386 10,988 1,934,532 1,968,004 18,620
Overseas corporate, industrial and other borrowers................................................................ 333,313 250,460 2,370Loan origination costs, net ....................................................................................................... 20,194 16,476 156
¥ 2,288,039 ¥ 2,234,940 $ 21,146
Generally, all installment loans, except card loans, are made under agreements, which require the borrower to provide collateral or guarantors. At March 31, 2004, the contractual maturities of installment loans for each of the next five years and thereafter are as follows:
Years ending March 31, Millions of yen Millions of
U.S. dollars 2005 ........................................................................................................................................................................ ¥ 604,439 $ 5,7192006 ........................................................................................................................................................................ 309,360 2,9272007 ....................................................................................................................................................................... 267,358 2,5302008 ........................................................................................................................................................................ 216,504 2,0482009 ........................................................................................................................................................................ 191,753 1,814Thereafter................................................................................................................................................................ 629,050 5,952
Total............................................................................................................................................................... ¥ 2,218,464 $ 20,990
Included in interest on loans and investment securities in the consolidated statements of income is interest income on loans of ¥99,732 million, ¥115,610 million and ¥107,490 million ($1,017 million) for fiscal 2002, 2003 and 2004, respectively.
7. Allowance for Doubtful Receivables on Direct Financing Leases and Probable Loan Losses
Changes in the allowance for doubtful receivables on direct financing leases and probable loan losses for fiscal 2002, 2003 and 2004 are as follows:
Millions of yen Millions of
U.S. dollars
2002 2003 2004 2004
Beginning balance................................................................................ ¥ 141,077 ¥ 152,887 ¥ 133,146 $ 1,260 Provisions charged to income .............................................................. 51,367 54,706 49,592 469 Charge-offs........................................................................................... (50,690) (78,744) (54,471) (515)Recoveries ........................................................................................... 1,350 2,180 1,892 18 Other* ................................................................................................... 9,783 2,117 (2,139) (21)
Ending balance..................................................................................... ¥ 152,887 ¥ 133,146 ¥ 128,020 $ 1,211
*Other includes foreign currency translation adjustments and the effect of acquisitions.
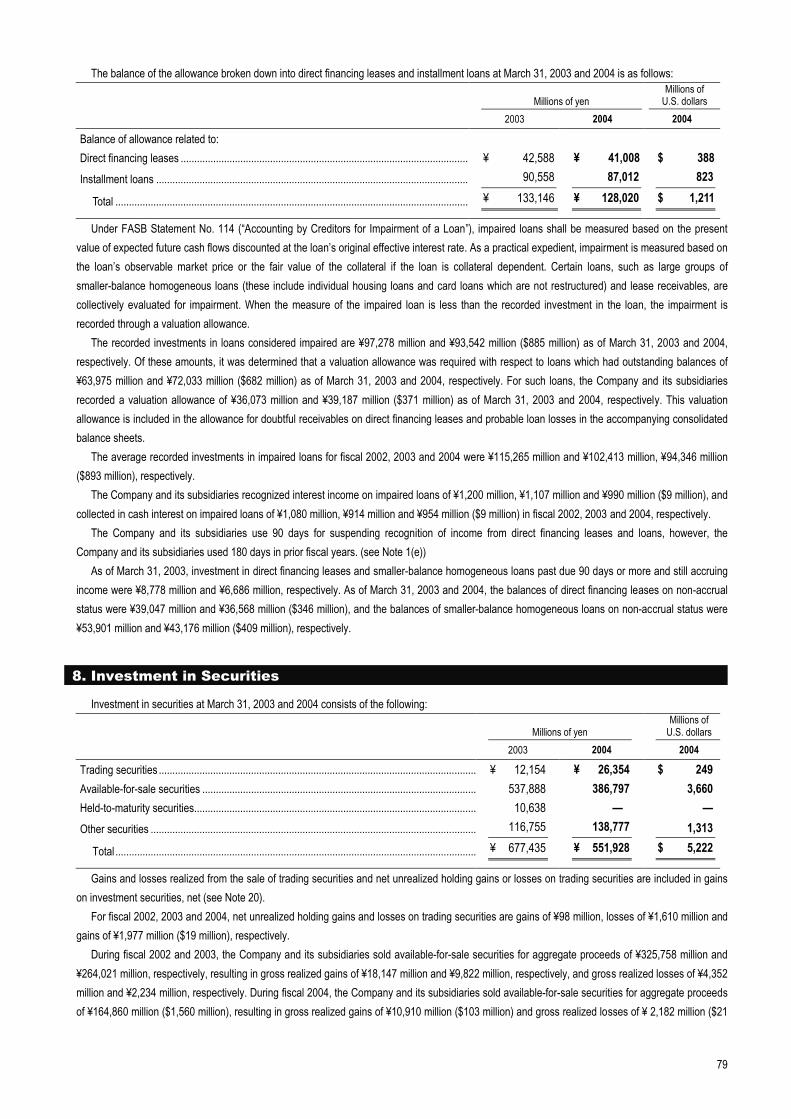
79
The balance of the allowance broken down into direct financing leases and installment loans at March 31, 2003 and 2004 is as follows:
Millions of yen Millions of
U.S. dollars 2003 2004 2004
Balance of allowance related to: Direct financing leases .......................................................................................................... ¥ 42,588 ¥ 41,008 $ 388Installment loans ................................................................................................................... 90,558 87,012 823
Total .................................................................................................................................. ¥ 133,146 ¥ 128,020 $ 1,211
Under FASB Statement No. 114 (“Accounting by Creditors for Impairment of a Loan”), impaired loans shall be measured based on the present value of expected future cash flows discounted at the loan’s original effective interest rate. As a practical expedient, impairment is measured based on the loan’s observable market price or the fair value of the collateral if the loan is collateral dependent. Certain loans, such as large groups of smaller-balance homogeneous loans (these include individual housing loans and card loans which are not restructured) and lease receivables, are collectively evaluated for impairment. When the measure of the impaired loan is less than the recorded investment in the loan, the impairment is recorded through a valuation allowance.
The recorded investments in loans considered impaired are ¥97,278 million and ¥93,542 million ($885 million) as of March 31, 2003 and 2004, respectively. Of these amounts, it was determined that a valuation allowance was required with respect to loans which had outstanding balances of ¥63,975 million and ¥72,033 million ($682 million) as of March 31, 2003 and 2004, respectively. For such loans, the Company and its subsidiaries recorded a valuation allowance of ¥36,073 million and ¥39,187 million ($371 million) as of March 31, 2003 and 2004, respectively. This valuation allowance is included in the allowance for doubtful receivables on direct financing leases and probable loan losses in the accompanying consolidated balance sheets.
The average recorded investments in impaired loans for fiscal 2002, 2003 and 2004 were ¥115,265 million and ¥102,413 million, ¥94,346 million ($893 million), respectively.
The Company and its subsidiaries recognized interest income on impaired loans of ¥1,200 million, ¥1,107 million and ¥990 million ($9 million), and collected in cash interest on impaired loans of ¥1,080 million, ¥914 million and ¥954 million ($9 million) in fiscal 2002, 2003 and 2004, respectively.
The Company and its subsidiaries use 90 days for suspending recognition of income from direct financing leases and loans, however, the Company and its subsidiaries used 180 days in prior fiscal years. (see Note 1(e))
As of March 31, 2003, investment in direct financing leases and smaller-balance homogeneous loans past due 90 days or more and still accruing income were ¥8,778 million and ¥6,686 million, respectively. As of March 31, 2003 and 2004, the balances of direct financing leases on non-accrual status were ¥39,047 million and ¥36,568 million ($346 million), and the balances of smaller-balance homogeneous loans on non-accrual status were ¥53,901 million and ¥43,176 million ($409 million), respectively.
8. Investment in Securities
Investment in securities at March 31, 2003 and 2004 consists of the following:
Millions of yen Millions of
U.S. dollars 2003 2004 2004
Trading securities ..................................................................................................................... ¥ 12,154 ¥ 26,354 $ 249Available-for-sale securities ..................................................................................................... 537,888 386,797 3,660Held-to-maturity securities........................................................................................................ 10,638 — —Other securities ........................................................................................................................ 116,755 138,777
Total ..................................................................................................................................... ¥ 677,435 ¥ 551,928 1,313
$ 5,222
Gains and losses realized from the sale of trading securities and net unrealized holding gains or losses on trading securities are included in gains on investment securities, net (see Note 20).
For fiscal 2002, 2003 and 2004, net unrealized holding gains and losses on trading securities are gains of ¥98 million, losses of ¥1,610 million and gains of ¥1,977 million ($19 million), respectively.
During fiscal 2002 and 2003, the Company and its subsidiaries sold available-for-sale securities for aggregate proceeds of ¥325,758 million and ¥264,021 million, respectively, resulting in gross realized gains of ¥18,147 million and ¥9,822 million, respectively, and gross realized losses of ¥4,352 million and ¥2,234 million, respectively. During fiscal 2004, the Company and its subsidiaries sold available-for-sale securities for aggregate proceeds of ¥164,860 million ($1,560 million), resulting in gross realized gains of ¥10,910 million ($103 million) and gross realized losses of ¥ 2,182 million ($21
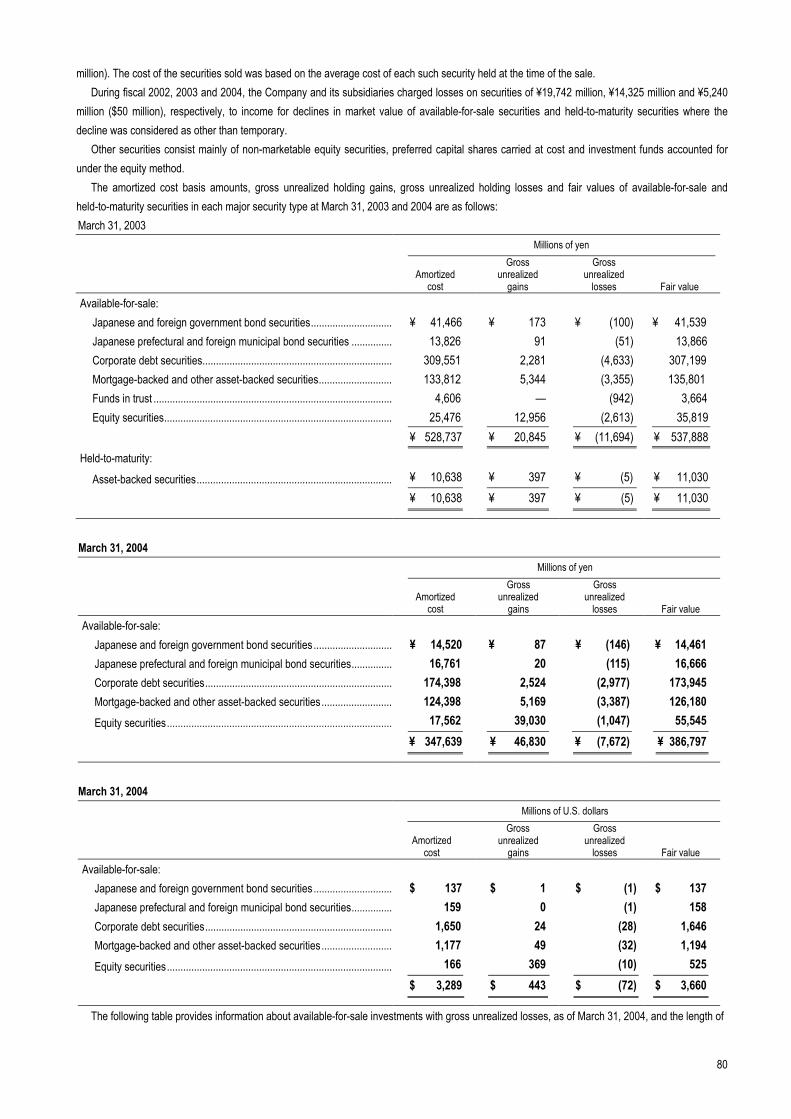
80
million). The cost of the securities sold was based on the average cost of each such security held at the time of the sale. During fiscal 2002, 2003 and 2004, the Company and its subsidiaries charged losses on securities of ¥19,742 million, ¥14,325 million and ¥5,240
million ($50 million), respectively, to income for declines in market value of available-for-sale securities and held-to-maturity securities where the decline was considered as other than temporary.
Other securities consist mainly of non-marketable equity securities, preferred capital shares carried at cost and investment funds accounted for under the equity method.
The amortized cost basis amounts, gross unrealized holding gains, gross unrealized holding losses and fair values of available-for-sale and held-to-maturity securities in each major security type at March 31, 2003 and 2004 are as follows: March 31, 2003
Millions of yen
Amortized
cost
Gross unrealized
gains
Gross unrealized
losses Fair value Available-for-sale:
Japanese and foreign government bond securities.............................. ¥ 41,466 ¥ 173 ¥ (100) ¥ 41,539 Japanese prefectural and foreign municipal bond securities ............... 13,826 91 (51) 13,866 Corporate debt securities...................................................................... 309,551 2,281 (4,633) 307,199 Mortgage-backed and other asset-backed securities........................... 133,812 5,344 (3,355) 135,801 Funds in trust ........................................................................................ 4,606 — (942) 3,664 Equity securities.................................................................................... 25,476 12,956 (2,613) 35,819
¥ 528,737 ¥ 20,845 ¥ (11,694) ¥ 537,888 Held-to-maturity:
Asset-backed securities........................................................................ ¥ 10,638 ¥ 397 ¥ (5) ¥ 11,030
¥ 10,638 ¥ 397 ¥ (5) ¥ 11,030
March 31, 2004
Millions of yen
Amortized
cost
Gross unrealized
gains
Gross unrealized
losses Fair value Available-for-sale:
Japanese and foreign government bond securities ............................. ¥ 14,520 ¥ 87 ¥ (146) ¥ 14,461 Japanese prefectural and foreign municipal bond securities............... 16,761 20 (115) 16,666 Corporate debt securities..................................................................... 174,398 2,524 (2,977) 173,945 Mortgage-backed and other asset-backed securities.......................... 124,398 5,169 (3,387) 126,180 Equity securities................................................................................... 17,562 39,030 (1,047) 55,545
¥ 347,639 ¥ 46,830 ¥ (7,672) ¥ 386,797
March 31, 2004
Millions of U.S. dollars
Amortized
cost
Gross unrealized
gains
Gross unrealized
losses Fair value Available-for-sale:
Japanese and foreign government bond securities ............................. $ 137 $ 1 $ (1) $ 137 Japanese prefectural and foreign municipal bond securities............... 159 0 (1) 158 Corporate debt securities..................................................................... 1,650 24 (28) 1,646 Mortgage-backed and other asset-backed securities.......................... 1,177 49 (32) 1,194 Equity securities................................................................................... 166 369 (10) 525
$ 3,289 $ 443 $ (72) $ 3,660
The following table provides information about available-for-sale investments with gross unrealized losses, as of March 31, 2004, and the length of
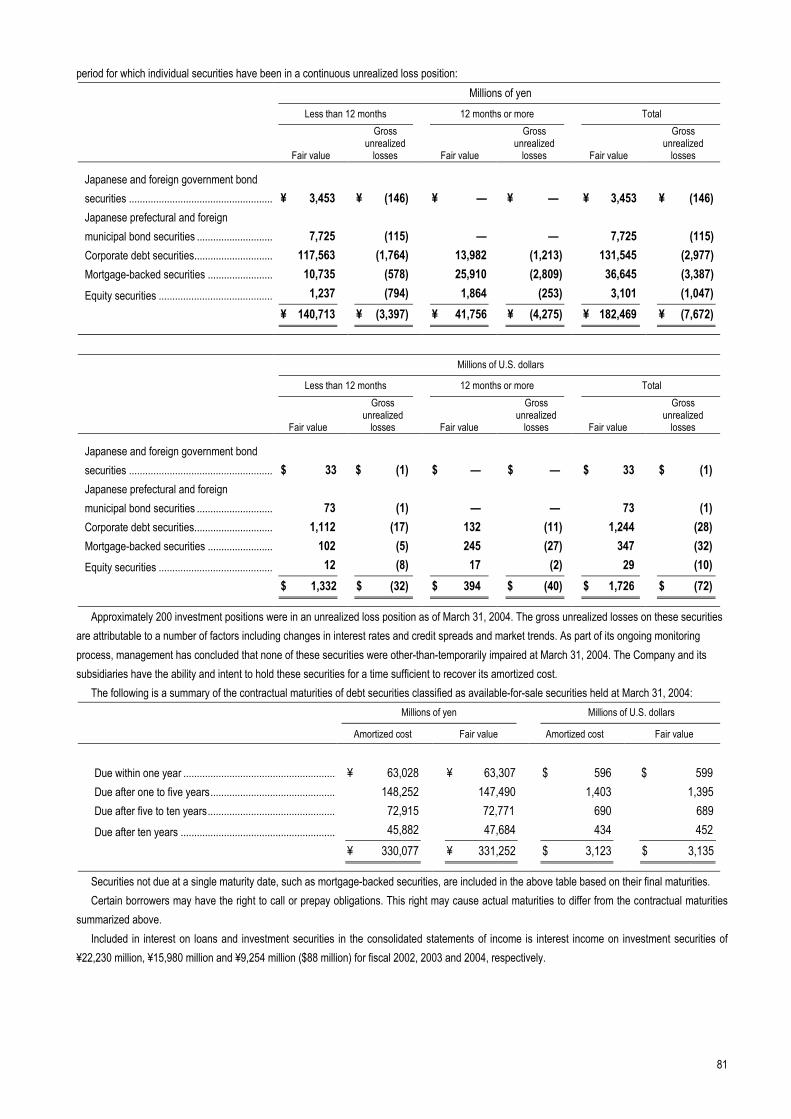
81
period for which individual securities have been in a continuous unrealized loss position: Millions of yen
Less than 12 months 12 months or more Total
Fair value
Gross unrealized
losses Fair value
Gross unrealized
losses Fair value
Gross unrealized
losses
Japanese and foreign government bond securities ..................................................... ¥ 3,453 ¥ (146) ¥ — ¥ — ¥ 3,453 ¥ (146)Japanese prefectural and foreign municipal bond securities ............................ 7,725 (115) — — 7,725 (115)Corporate debt securities............................. 117,563 (1,764) 13,982 (1,213) 131,545 (2,977)Mortgage-backed securities ........................ 10,735 (578) 25,910 (2,809) 36,645 (3,387)Equity securities .......................................... 1,237 (794) 1,864 (253) 3,101 (1,047) ¥ 140,713 ¥ (3,397) ¥ 41,756 ¥ (4,275) ¥ 182,469 ¥ (7,672)
Millions of U.S. dollars
Less than 12 months 12 months or more Total
Fair value
Gross unrealized
losses Fair value
Gross unrealized
losses Fair value
Gross unrealized
losses
Japanese and foreign government bond securities ..................................................... $ 33 $ (1) $ — $ — $ 33 $ (1)Japanese prefectural and foreign municipal bond securities ............................ 73 (1) — — 73 (1)Corporate debt securities............................. 1,112 (17) 132 (11) 1,244 (28)Mortgage-backed securities ........................ 102 (5) 245 (27) 347 (32)Equity securities .......................................... 12 (8) 17 (2) 29 (10) $ 1,332 $ (32) $ 394 $ (40) $ 1,726 $ (72)
Approximately 200 investment positions were in an unrealized loss position as of March 31, 2004. The gross unrealized losses on these securities are attributable to a number of factors including changes in interest rates and credit spreads and market trends. As part of its ongoing monitoring process, management has concluded that none of these securities were other-than-temporarily impaired at March 31, 2004. The Company and its subsidiaries have the ability and intent to hold these securities for a time sufficient to recover its amortized cost.
The following is a summary of the contractual maturities of debt securities classified as available-for-sale securities held at March 31, 2004:
Millions of yen Millions of U.S. dollars
Amortized cost Fair value Amortized cost Fair value
Due within one year ......................................................... ¥ 63,028 ¥ 63,307 $ 596 $ 599Due after one to five years............................................... 148,252 147,490 1,403 1,395Due after five to ten years................................................ 72,915 72,771 690 689Due after ten years .......................................................... 45,882 47,684 434 452
¥ 330,077 ¥ 331,252 $ 3,123 $ 3,135
Securities not due at a single maturity date, such as mortgage-backed securities, are included in the above table based on their final maturities. Certain borrowers may have the right to call or prepay obligations. This right may cause actual maturities to differ from the contractual maturities
summarized above. Included in interest on loans and investment securities in the consolidated statements of income is interest income on investment securities of
¥22,230 million, ¥15,980 million and ¥9,254 million ($88 million) for fiscal 2002, 2003 and 2004, respectively.
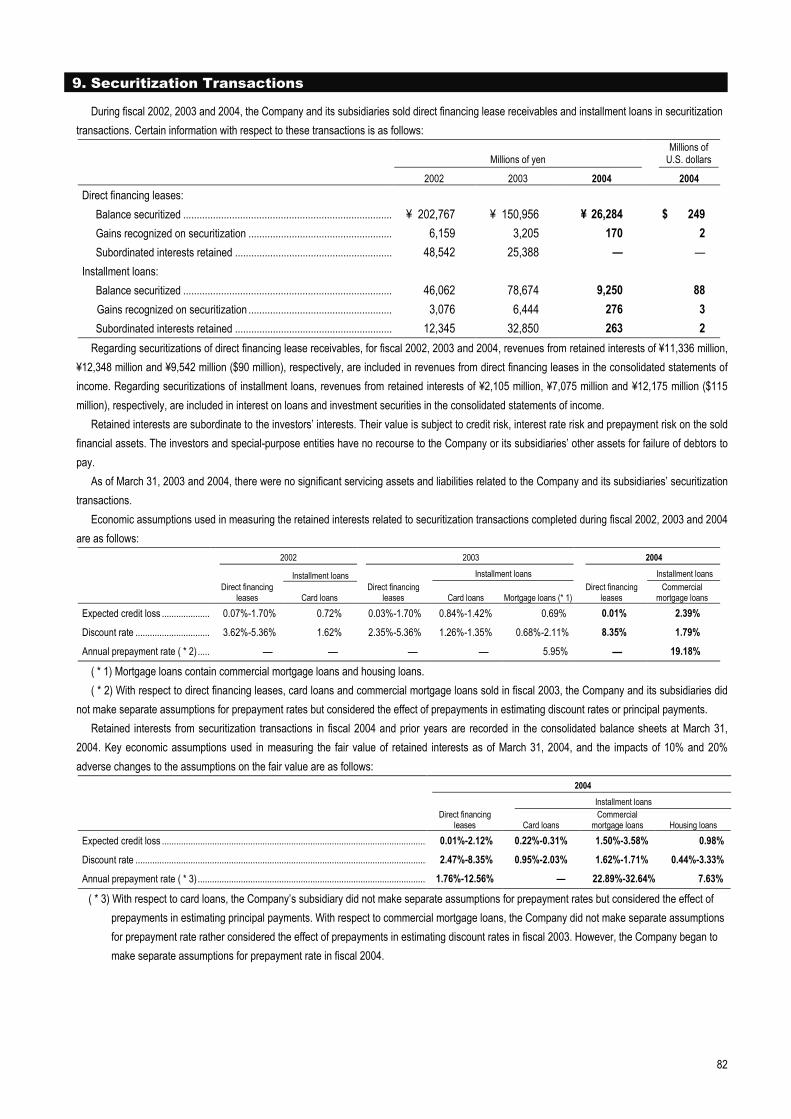
82
9. Securitization Transactions
During fiscal 2002, 2003 and 2004, the Company and its subsidiaries sold direct financing lease receivables and installment loans in securitization transactions. Certain information with respect to these transactions is as follows:
Millions of yen Millions of
U.S. dollars
2002 2003 2004 2004 Direct financing leases:
Balance securitized ............................................................................. ¥ 202,767 ¥ 150,956 ¥ 26,284 $ 249 Gains recognized on securitization ..................................................... 6,159 3,205 170 2 Subordinated interests retained .......................................................... 48,542 25,388 — —
Installment loans: Balance securitized ............................................................................. 46,062 78,674 9,250 88 Gains recognized on securitization ..................................................... 3,076 6,444 276 3 Subordinated interests retained .......................................................... 12,345 32,850 263 2
Regarding securitizations of direct financing lease receivables, for fiscal 2002, 2003 and 2004, revenues from retained interests of ¥11,336 million, ¥12,348 million and ¥9,542 million ($90 million), respectively, are included in revenues from direct financing leases in the consolidated statements of income. Regarding securitizations of installment loans, revenues from retained interests of ¥2,105 million, ¥7,075 million and ¥12,175 million ($115 million), respectively, are included in interest on loans and investment securities in the consolidated statements of income.
Retained interests are subordinate to the investors’ interests. Their value is subject to credit risk, interest rate risk and prepayment risk on the sold financial assets. The investors and special-purpose entities have no recourse to the Company or its subsidiaries’ other assets for failure of debtors to pay.
As of March 31, 2003 and 2004, there were no significant servicing assets and liabilities related to the Company and its subsidiaries’ securitization transactions.
Economic assumptions used in measuring the retained interests related to securitization transactions completed during fiscal 2002, 2003 and 2004 are as follows:
2002 2003 2004
Installment loans Installment loans Installment loans
Direct financing
leases Card loans Direct financing
leases Card loans Mortgage loans (* 1) Direct financing
leases Commercial
mortgage loans Expected credit loss .................... 0.07%-1.70% 0.72% 0.03%-1.70% 0.84%-1.42% 0.69% 0.01% 2.39%
Discount rate ............................... 3.62%-5.36% 1.62% 2.35%-5.36% 1.26%-1.35% 0.68%-2.11% 8.35% 1.79%
Annual prepayment rate ( * 2) ..... — — — — 5.95% — 19.18%
( * 1) Mortgage loans contain commercial mortgage loans and housing loans. ( * 2) With respect to direct financing leases, card loans and commercial mortgage loans sold in fiscal 2003, the Company and its subsidiaries did
not make separate assumptions for prepayment rates but considered the effect of prepayments in estimating discount rates or principal payments. Retained interests from securitization transactions in fiscal 2004 and prior years are recorded in the consolidated balance sheets at March 31,
2004. Key economic assumptions used in measuring the fair value of retained interests as of March 31, 2004, and the impacts of 10% and 20% adverse changes to the assumptions on the fair value are as follows: 2004
Installment loans
Direct financing
leases Card loans Commercial
mortgage loans Housing loans Expected credit loss ............................................................................................................... 0.01%-2.12% 0.22%-0.31% 1.50%-3.58% 0.98%
Discount rate .......................................................................................................................... 2.47%-8.35% 0.95%-2.03% 1.62%-1.71% 0.44%-3.33%
Annual prepayment rate ( * 3) ................................................................................................ 1.76%-12.56% — 22.89%-32.64% 7.63%
( * 3) With respect to card loans, the Company’s subsidiary did not make separate assumptions for prepayment rates but considered the effect of prepayments in estimating principal payments. With respect to commercial mortgage loans, the Company did not make separate assumptions for prepayment rate rather considered the effect of prepayments in estimating discount rates in fiscal 2003. However, the Company began to make separate assumptions for prepayment rate in fiscal 2004.
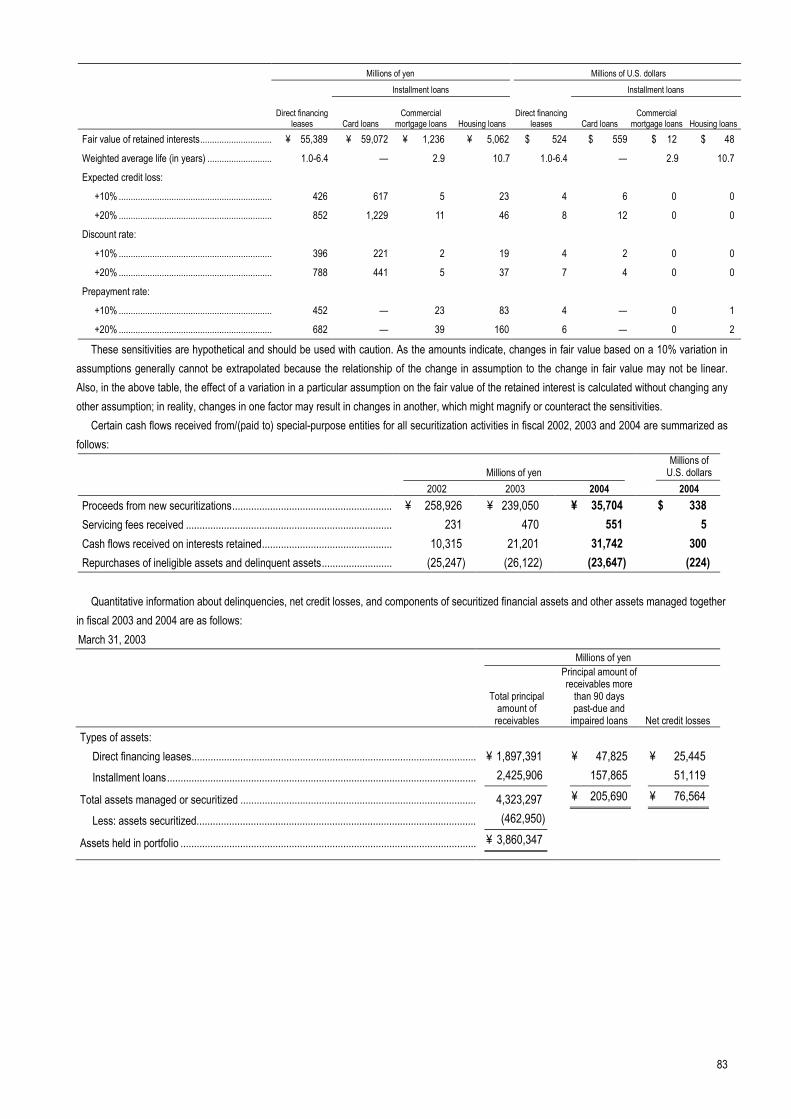
83
Millions of yen Millions of U.S. dollars
Installment loans Installment loans
Direct financing
leases Card loans Commercial
mortgage loans Housing loansDirect financing
leases Card loans
Commercial
mortgage loans Housing loansFair value of retained interests.............................. ¥ 55,389 ¥ 59,072 ¥ 1,236 ¥ 5,062 $ 524 $ 559 $ 12 $ 48
Weighted average life (in years) ........................... 1.0-6.4 — 2.9 10.7 1.0-6.4 — 2.9 10.7
Expected credit loss:
+10% ................................................................ 426 617 5 23 4 6 0 0
+20% ................................................................ 852 1,229 11 46 8 12 0 0
Discount rate:
+10% ................................................................ 396 221 2 19 4 2 0 0
+20% ................................................................ 788 441 5 37 7 4 0 0
Prepayment rate:
+10% ................................................................ 452 — 23 83 4 — 0 1
+20% ................................................................ 682 — 39 160 6 — 0 2
These sensitivities are hypothetical and should be used with caution. As the amounts indicate, changes in fair value based on a 10% variation in assumptions generally cannot be extrapolated because the relationship of the change in assumption to the change in fair value may not be linear. Also, in the above table, the effect of a variation in a particular assumption on the fair value of the retained interest is calculated without changing any other assumption; in reality, changes in one factor may result in changes in another, which might magnify or counteract the sensitivities.
Certain cash flows received from/(paid to) special-purpose entities for all securitization activities in fiscal 2002, 2003 and 2004 are summarized as follows:
Millions of yen Millions of
U.S. dollars 2002 2003 2004 2004
Proceeds from new securitizations........................................................... ¥ 258,926 ¥ 239,050 ¥ 35,704 $ 338 Servicing fees received ............................................................................ 231 470 551 5 Cash flows received on interests retained................................................ 10,315 21,201 31,742 300 Repurchases of ineligible assets and delinquent assets.......................... (25,247) (26,122) (23,647) (224)
Quantitative information about delinquencies, net credit losses, and components of securitized financial assets and other assets managed together
in fiscal 2003 and 2004 are as follows: March 31, 2003 Millions of yen
Total principal amount of
receivables
Principal amount of receivables more
than 90 days past-due and
impaired loans Net credit losses Types of assets:
Direct financing leases......................................................................................................... ¥ 1,897,391 ¥ 47,825 ¥ 25,445 Installment loans.................................................................................................................. 2,425,906 157,865 51,119
Total assets managed or securitized ....................................................................................... 4,323,297 ¥ 205,690 ¥ 76,564
Less: assets securitized....................................................................................................... (462,950)
Assets held in portfolio ............................................................................................................. ¥ 3,860,347
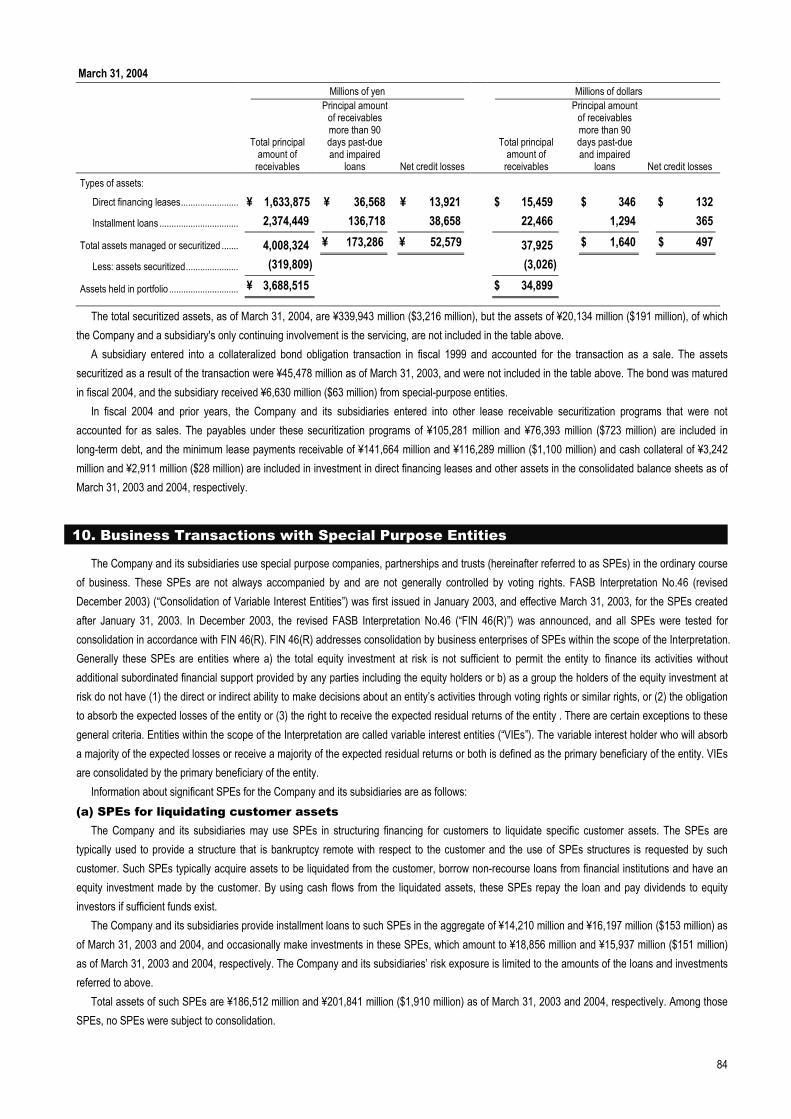
84
March 31, 2004 Millions of yen Millions of dollars
Total principal amount of
receivables
Principal amount of receivables more than 90 days past-due and impaired
loans Net credit losses
Total principal amount of
receivables
Principal amount of receivables more than 90 days past-due and impaired
loans Net credit lossesTypes of assets:
Direct financing leases........................ ¥ 1,633,875 ¥ 36,568 ¥ 13,921 $ 15,459 $ 346 $ 132Installment loans ................................. 2,374,449 136,718 38,658 22,466 1,294 365
Total assets managed or securitized ....... 4,008,324 ¥ 173,286 ¥ 52,579 37,925 $ 1,640 $ 497
Less: assets securitized...................... (319,809) (3,026) Assets held in portfolio ............................. ¥ 3,688,515 $ 34,899
The total securitized assets, as of March 31, 2004, are ¥339,943 million ($3,216 million), but the assets of ¥20,134 million ($191 million), of which the Company and a subsidiary's only continuing involvement is the servicing, are not included in the table above.
A subsidiary entered into a collateralized bond obligation transaction in fiscal 1999 and accounted for the transaction as a sale. The assets securitized as a result of the transaction were ¥45,478 million as of March 31, 2003, and were not included in the table above. The bond was matured in fiscal 2004, and the subsidiary received ¥6,630 million ($63 million) from special-purpose entities.
In fiscal 2004 and prior years, the Company and its subsidiaries entered into other lease receivable securitization programs that were not accounted for as sales. The payables under these securitization programs of ¥105,281 million and ¥76,393 million ($723 million) are included in long-term debt, and the minimum lease payments receivable of ¥141,664 million and ¥116,289 million ($1,100 million) and cash collateral of ¥3,242 million and ¥2,911 million ($28 million) are included in investment in direct financing leases and other assets in the consolidated balance sheets as of March 31, 2003 and 2004, respectively.
10. Business Transactions with Special Purpose Entities
The Company and its subsidiaries use special purpose companies, partnerships and trusts (hereinafter referred to as SPEs) in the ordinary course of business. These SPEs are not always accompanied by and are not generally controlled by voting rights. FASB Interpretation No.46 (revised December 2003) (“Consolidation of Variable Interest Entities”) was first issued in January 2003, and effective March 31, 2003, for the SPEs created after January 31, 2003. In December 2003, the revised FASB Interpretation No.46 (“FIN 46(R)”) was announced, and all SPEs were tested for consolidation in accordance with FIN 46(R). FIN 46(R) addresses consolidation by business enterprises of SPEs within the scope of the Interpretation. Generally these SPEs are entities where a) the total equity investment at risk is not sufficient to permit the entity to finance its activities without additional subordinated financial support provided by any parties including the equity holders or b) as a group the holders of the equity investment at risk do not have (1) the direct or indirect ability to make decisions about an entity’s activities through voting rights or similar rights, or (2) the obligation to absorb the expected losses of the entity or (3) the right to receive the expected residual returns of the entity . There are certain exceptions to these general criteria. Entities within the scope of the Interpretation are called variable interest entities (“VIEs”). The variable interest holder who will absorb a majority of the expected losses or receive a majority of the expected residual returns or both is defined as the primary beneficiary of the entity. VIEs are consolidated by the primary beneficiary of the entity.
Information about significant SPEs for the Company and its subsidiaries are as follows: (a) SPEs for liquidating customer assets
The Company and its subsidiaries may use SPEs in structuring financing for customers to liquidate specific customer assets. The SPEs are typically used to provide a structure that is bankruptcy remote with respect to the customer and the use of SPEs structures is requested by such customer. Such SPEs typically acquire assets to be liquidated from the customer, borrow non-recourse loans from financial institutions and have an equity investment made by the customer. By using cash flows from the liquidated assets, these SPEs repay the loan and pay dividends to equity investors if sufficient funds exist.
The Company and its subsidiaries provide installment loans to such SPEs in the aggregate of ¥14,210 million and ¥16,197 million ($153 million) as of March 31, 2003 and 2004, and occasionally make investments in these SPEs, which amount to ¥18,856 million and ¥15,937 million ($151 million) as of March 31, 2003 and 2004, respectively. The Company and its subsidiaries’ risk exposure is limited to the amounts of the loans and investments referred to above.
Total assets of such SPEs are ¥186,512 million and ¥201,841 million ($1,910 million) as of March 31, 2003 and 2004, respectively. Among those SPEs, no SPEs were subject to consolidation.
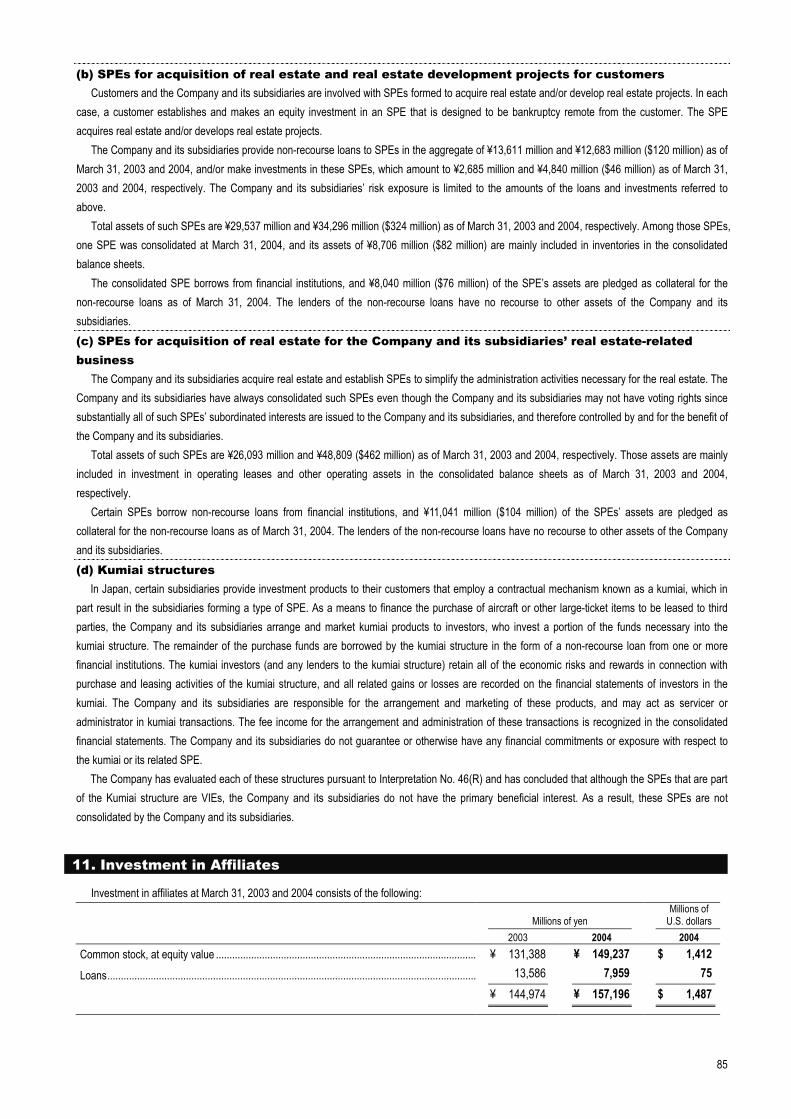
85
(b) SPEs for acquisition of real estate and real estate development projects for customers Customers and the Company and its subsidiaries are involved with SPEs formed to acquire real estate and/or develop real estate projects. In each
case, a customer establishes and makes an equity investment in an SPE that is designed to be bankruptcy remote from the customer. The SPE acquires real estate and/or develops real estate projects.
The Company and its subsidiaries provide non-recourse loans to SPEs in the aggregate of ¥13,611 million and ¥12,683 million ($120 million) as of March 31, 2003 and 2004, and/or make investments in these SPEs, which amount to ¥2,685 million and ¥4,840 million ($46 million) as of March 31, 2003 and 2004, respectively. The Company and its subsidiaries’ risk exposure is limited to the amounts of the loans and investments referred to above.
Total assets of such SPEs are ¥29,537 million and ¥34,296 million ($324 million) as of March 31, 2003 and 2004, respectively. Among those SPEs, one SPE was consolidated at March 31, 2004, and its assets of ¥8,706 million ($82 million) are mainly included in inventories in the consolidated balance sheets.
The consolidated SPE borrows from financial institutions, and ¥8,040 million ($76 million) of the SPE’s assets are pledged as collateral for the non-recourse loans as of March 31, 2004. The lenders of the non-recourse loans have no recourse to other assets of the Company and its subsidiaries. (c) SPEs for acquisition of real estate for the Company and its subsidiaries’ real estate-related business
The Company and its subsidiaries acquire real estate and establish SPEs to simplify the administration activities necessary for the real estate. The Company and its subsidiaries have always consolidated such SPEs even though the Company and its subsidiaries may not have voting rights since substantially all of such SPEs’ subordinated interests are issued to the Company and its subsidiaries, and therefore controlled by and for the benefit of the Company and its subsidiaries.
Total assets of such SPEs are ¥26,093 million and ¥48,809 ($462 million) as of March 31, 2003 and 2004, respectively. Those assets are mainly included in investment in operating leases and other operating assets in the consolidated balance sheets as of March 31, 2003 and 2004, respectively.
Certain SPEs borrow non-recourse loans from financial institutions, and ¥11,041 million ($104 million) of the SPEs’ assets are pledged as collateral for the non-recourse loans as of March 31, 2004. The lenders of the non-recourse loans have no recourse to other assets of the Company and its subsidiaries. (d) Kumiai structures
In Japan, certain subsidiaries provide investment products to their customers that employ a contractual mechanism known as a kumiai, which in part result in the subsidiaries forming a type of SPE. As a means to finance the purchase of aircraft or other large-ticket items to be leased to third parties, the Company and its subsidiaries arrange and market kumiai products to investors, who invest a portion of the funds necessary into the kumiai structure. The remainder of the purchase funds are borrowed by the kumiai structure in the form of a non-recourse loan from one or more financial institutions. The kumiai investors (and any lenders to the kumiai structure) retain all of the economic risks and rewards in connection with purchase and leasing activities of the kumiai structure, and all related gains or losses are recorded on the financial statements of investors in the kumiai. The Company and its subsidiaries are responsible for the arrangement and marketing of these products, and may act as servicer or administrator in kumiai transactions. The fee income for the arrangement and administration of these transactions is recognized in the consolidated financial statements. The Company and its subsidiaries do not guarantee or otherwise have any financial commitments or exposure with respect to the kumiai or its related SPE.
The Company has evaluated each of these structures pursuant to Interpretation No. 46(R) and has concluded that although the SPEs that are part of the Kumiai structure are VIEs, the Company and its subsidiaries do not have the primary beneficial interest. As a result, these SPEs are not consolidated by the Company and its subsidiaries.
11. Investment in Affiliates
Investment in affiliates at March 31, 2003 and 2004 consists of the following:
Millions of yen Millions of
U.S. dollars 2003 2004 2004 Common stock, at equity value ................................................................................................ ¥ 131,388 ¥ 149,237 $ 1,412Loans........................................................................................................................................ 13,586 7,959 75
¥ 144,974 ¥ 157,196 $ 1,487
86
Certain affiliates are listed on stock exchanges. The aggregate investment in and quoted market value of those affiliates amounted to ¥38,664 million and ¥37,385 million, respectively, as of March 31, 2003 and ¥45,548 million ($431 million) and ¥51,884 million ($491 million), respectively, as of March 31, 2004.
In fiscal 2002, 2003 and 2004, the Company and its subsidiaries received dividends from affiliates of ¥473 million, ¥2,060 million and ¥3,136 million ($30 million), respectively.
The balance of excess of cost over the underlying equity at acquisition dates of investment in affiliates amounted to ¥30,487 million and ¥31,189 million ($295 million) as of March 31, 2003 and 2004, respectively.
During fiscal year ended March 31, 2003, the Company acquired an interest in two affiliates accounted for under the equity method for which the purchase price allocation was not complete as of March 31, 2003. Upon completion of valuation of investees’ assets and liabilities during fiscal 2004 it was determined that the fair value of investees’ assets and liabilities exceeded the purchase price paid. This excess of fair value of the Company's proportionate interest in the net assets of investees upon acquisition has been recorded first as a reduction of noncurrent assets of the investees with the excess reported as an extraordinary gain of ¥609 million ($6 million), net of tax of ¥421 million ($ 4 million), during fiscal 2004.
On March 30, 2002, the Company acquired approximately a 22% interest in The Fuji Fire and Marine Insurance Company Limited (“Fuji”) for ¥18,105 million. The Company recorded its share of earnings by the equity method from the date of acquisition through December 31, 2002, the date of latest available financial statements for the year ended March 31, 2003. At March 31, 2002, the Company reflected certain preliminary estimates with respect to the value of the underlying net assets of Fuji in the Company’s consolidated financial statements. Fuji had not, prior to the investment by the Company, prepared financial statements in accordance with US GAAP. Fuji began the process of preparing financial statements in accordance with US GAAP shortly after the investment in Fuji was made by the Company. However, the process of preparing US GAAP financial statements as of the acquisition date was not completed until January 2003. At that time it was determined that the Company’s proportionate share of the fair value of the net assets acquired exceeded the acquisition cost. In accordance with the provisions of FASB Statement No. 141, the excess remaining after first reducing noncurrent assets to zero was recorded as an extraordinary gain of ¥3,214 million, net of tax of ¥2,206 million, in the year ended March 31, 2003.
The Company formed a consortium with the Hanwha Group (a conglomerate or chaebol located in the Republic of Korea), and Macquarie Life Limited (a life insurance company located in Australia). The consortium entered into a stock purchase agreement (“Purchase Agreement”) with Korea Deposit Insurance Corporation (“KDIC”), and acquired 51% of the outstanding shares of Korea Life Insurance Co., Ltd. (“KLI”) on December 12, 2002. Pursuant to the Purchase Agreement, the Company acquired 17% of the outstanding shares for approximately 275 billion Korean won (¥27,778 million) and made a payment for half of this amount on December 12, 2002. With respect to the other half of the purchase price (the “second payment”), the Company is required to make the second payment two years from the date of the Purchase Agreement. At the acquisition date, the excess of the purchase price over the Company’s proportionate share of the fair value of the net assets of KLI was equal to the purchase price of ¥27,778 million, as KLI had negative assets as of the acquisition date.
The Purchase Agreement also provides that the Company and other consortium members have the right to obtain additional shares of the KLI from KDIC (“the Right”). With respect to the Right, the Company and the Hanwha Group entered into a separate agreement providing that the Company can sell the Right to the Hanwha Group at any time from the date of the acquisition through the fifth anniversary of the acquisition date. On the acquisition date, the Company sold 50% of the Right to the Hanwha Group for 21,133 million Korean won (¥2,170 million) as the consideration for the Right. The Company recorded the proceeds in gain on sales of affiliates in the consolidated statements of income.
Since the Company, through the Consortium Agreement and the Shareholders Agreement, has the ability to influence the operations and the financial policies of KLI, the Company accounts for this investment by the equity method and has recorded its share of earnings from the date of acquisition through December 31, 2002, the date of latest available financial statements, for the year ended March 31, 2003.
On June 11, 2002, ORIX JREIT Inc. (“ORIX JREIT”), a wholly-owned Japanese real estate investment corporation as of March 31, 2002, completed an initial public offering of its investment units, which had been previously issued by ORIX JREIT to the Company. Through this initial public offering, the Company as a unitholder sold to investors 80% or 98,700 units out of 123,372 units of the outstanding units of ORIX JREIT and recognized ¥3,174 million of gain included in other operating revenues in the accompanying consolidated statements of income for the year ended March 31, 2003. The Company received aggregate net cash proceeds from the sale of ¥49,528 million or ¥501,800 per unit. As of the date of the public offering, ORIX JREIT invested in 40 properties located in Japan, including 33 office buildings, three residential buildings and four commercial properties such as hotels and retail buildings with total assets of approximately ¥116,775 million.
Subsequent to the initial public offering, the Company accounted for the remaining investment in ORIX JREIT using the equity method of accounting. In addition, ORIX JREIT entered into an asset management agreement with one of the Company’s subsidiaries and paid ¥470 million of management fees from June 2002 to March 2003 for the year ended March 31, 2003, ¥847 million ($8 million) for the year ended March 31, 2004, respectively.
The Company and its subsidiaries sold office buildings under operating leases to ORIX JREIT and recognized ¥7,617 million ($72 million) of gains on the sales, which were included in gains on sales of real estate under operating leases in the accompanying consolidated statements of income for
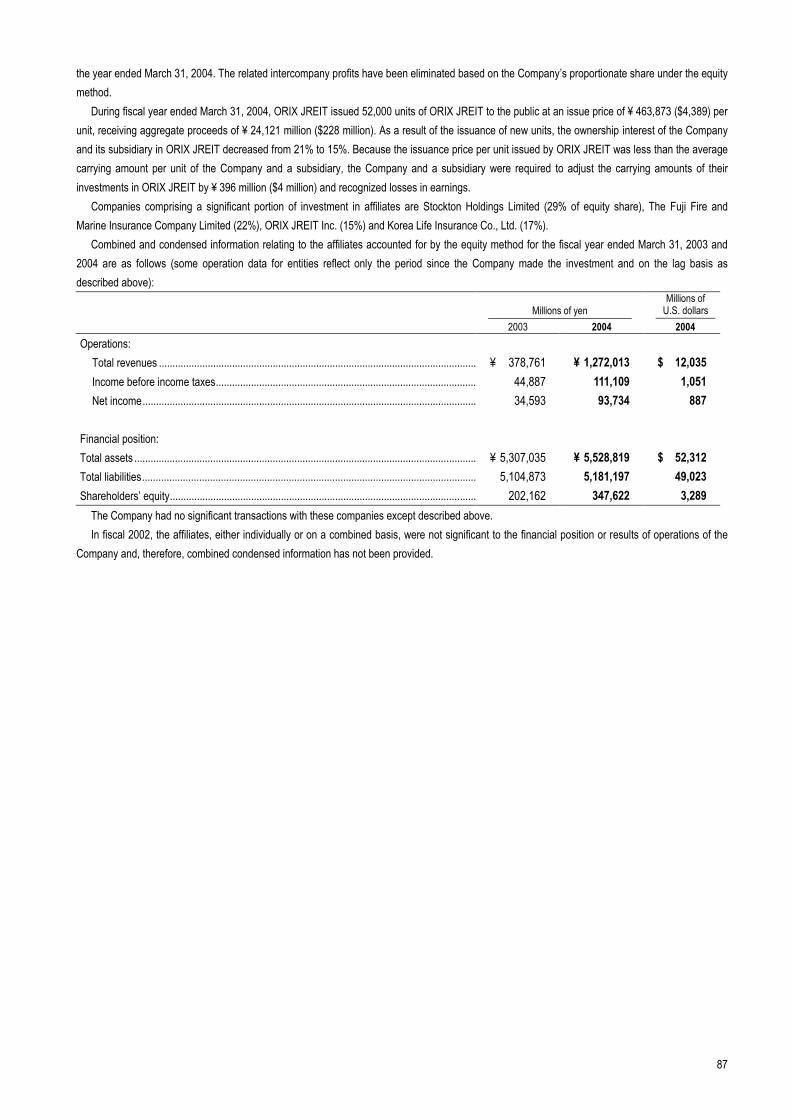
87
the year ended March 31, 2004. The related intercompany profits have been eliminated based on the Company’s proportionate share under the equity method.
During fiscal year ended March 31, 2004, ORIX JREIT issued 52,000 units of ORIX JREIT to the public at an issue price of ¥ 463,873 ($4,389) per unit, receiving aggregate proceeds of ¥ 24,121 million ($228 million). As a result of the issuance of new units, the ownership interest of the Company and its subsidiary in ORIX JREIT decreased from 21% to 15%. Because the issuance price per unit issued by ORIX JREIT was less than the average carrying amount per unit of the Company and a subsidiary, the Company and a subsidiary were required to adjust the carrying amounts of their investments in ORIX JREIT by ¥ 396 million ($4 million) and recognized losses in earnings.
Companies comprising a significant portion of investment in affiliates are Stockton Holdings Limited (29% of equity share), The Fuji Fire and Marine Insurance Company Limited (22%), ORIX JREIT Inc. (15%) and Korea Life Insurance Co., Ltd. (17%).
Combined and condensed information relating to the affiliates accounted for by the equity method for the fiscal year ended March 31, 2003 and 2004 are as follows (some operation data for entities reflect only the period since the Company made the investment and on the lag basis as described above):
Millions of yen Millions of
U.S. dollars 2003 2004 2004
Operations: Total revenues ..................................................................................................................... ¥ 378,761 ¥ 1,272,013 $ 12,035 Income before income taxes................................................................................................ 44,887 111,109 1,051 Net income........................................................................................................................... 34,593 93,734 887
Financial position: Total assets .............................................................................................................................. ¥ 5,307,035 ¥ 5,528,819 $ 52,312 Total liabilities........................................................................................................................... 5,104,873 5,181,197 49,023 Shareholders’ equity................................................................................................................. 202,162 347,622 3,289
The Company had no significant transactions with these companies except described above. In fiscal 2002, the affiliates, either individually or on a combined basis, were not significant to the financial position or results of operations of the
Company and, therefore, combined condensed information has not been provided.
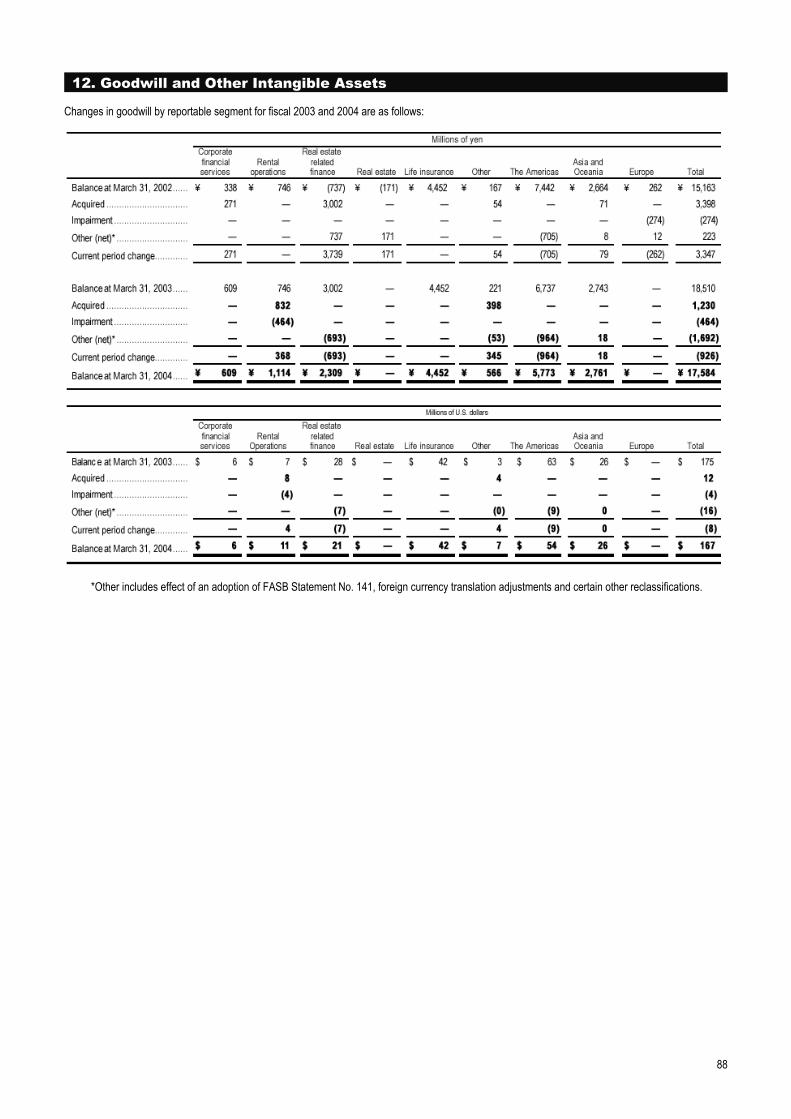
88
12. Goodwill and Other Intangible Assets
Changes in goodwill by reportable segment for fiscal 2003 and 2004 are as follows:
*Other includes effect of an adoption of FASB Statement No. 141, foreign currency translation adjustments and certain other reclassifications.
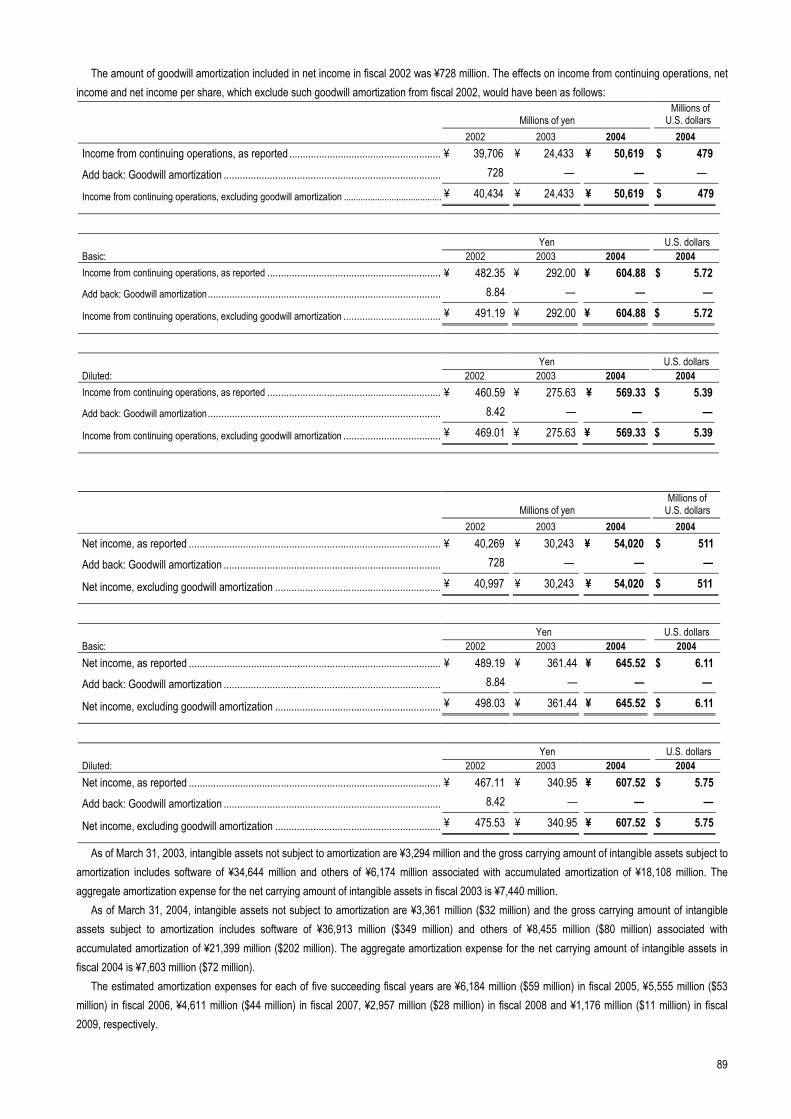
89
The amount of goodwill amortization included in net income in fiscal 2002 was ¥728 million. The effects on income from continuing operations, net income and net income per share, which exclude such goodwill amortization from fiscal 2002, would have been as follows:
Millions of yen Millions of
U.S. dollars 2002 2003 2004 2004
Income from continuing operations, as reported ........................................................ ¥ 39,706 ¥ 24,433 ¥ 50,619 $ 479
Add back: Goodwill amortization ................................................................................ 728 — — —
Income from continuing operations, excluding goodwill amortization ......................................... ¥ 40,434 ¥ 24,433 ¥ 50,619 $ 479
Yen U.S. dollarsBasic: 2002 2003 2004 2004 Income from continuing operations, as reported ................................................................ ¥ 482.35 ¥ 292.00 ¥ 604.88 $ 5.72Add back: Goodwill amortization...................................................................................... 8.84 — — —
Income from continuing operations, excluding goodwill amortization .................................... ¥ 491.19 ¥ 292.00 ¥ 604.88 $ 5.72
Yen U.S. dollars
Diluted: 2002 2003 2004 2004 Income from continuing operations, as reported ................................................................ ¥ 460.59 ¥ 275.63 ¥ 569.33 $ 5.39Add back: Goodwill amortization...................................................................................... 8.42 — — —
Income from continuing operations, excluding goodwill amortization .................................... ¥ 469.01 ¥ 275.63 ¥ 569.33 $ 5.39
Millions of yen Millions of
U.S. dollars 2002 2003 2004 2004
Net income, as reported ............................................................................................. ¥ 40,269 ¥ 30,243 ¥ 54,020 $ 511Add back: Goodwill amortization ................................................................................ 728 — — —
Net income, excluding goodwill amortization ............................................................. ¥ 40,997 ¥ 30,243 ¥ 54,020 $ 511
Yen U.S. dollars Basic: 2002 2003 2004 2004 Net income, as reported ............................................................................................. ¥ 489.19 ¥ 361.44 ¥ 645.52 $ 6.11Add back: Goodwill amortization ................................................................................ 8.84 — — —
Net income, excluding goodwill amortization ............................................................. ¥ 498.03 ¥ 361.44 ¥ 645.52 $ 6.11
Yen U.S. dollarsDiluted: 2002 2003 2004 2004 Net income, as reported ............................................................................................. ¥ 467.11 ¥ 340.95 ¥ 607.52 $ 5.75Add back: Goodwill amortization ................................................................................ 8.42 — — —
Net income, excluding goodwill amortization ............................................................. ¥ 475.53 ¥ 340.95 ¥ 607.52 $ 5.75
As of March 31, 2003, intangible assets not subject to amortization are ¥3,294 million and the gross carrying amount of intangible assets subject to amortization includes software of ¥34,644 million and others of ¥6,174 million associated with accumulated amortization of ¥18,108 million. The aggregate amortization expense for the net carrying amount of intangible assets in fiscal 2003 is ¥7,440 million.
As of March 31, 2004, intangible assets not subject to amortization are ¥3,361 million ($32 million) and the gross carrying amount of intangible assets subject to amortization includes software of ¥36,913 million ($349 million) and others of ¥8,455 million ($80 million) associated with accumulated amortization of ¥21,399 million ($202 million). The aggregate amortization expense for the net carrying amount of intangible assets in fiscal 2004 is ¥7,603 million ($72 million).
The estimated amortization expenses for each of five succeeding fiscal years are ¥6,184 million ($59 million) in fiscal 2005, ¥5,555 million ($53 million) in fiscal 2006, ¥4,611 million ($44 million) in fiscal 2007, ¥2,957 million ($28 million) in fiscal 2008 and ¥1,176 million ($11 million) in fiscal 2009, respectively.
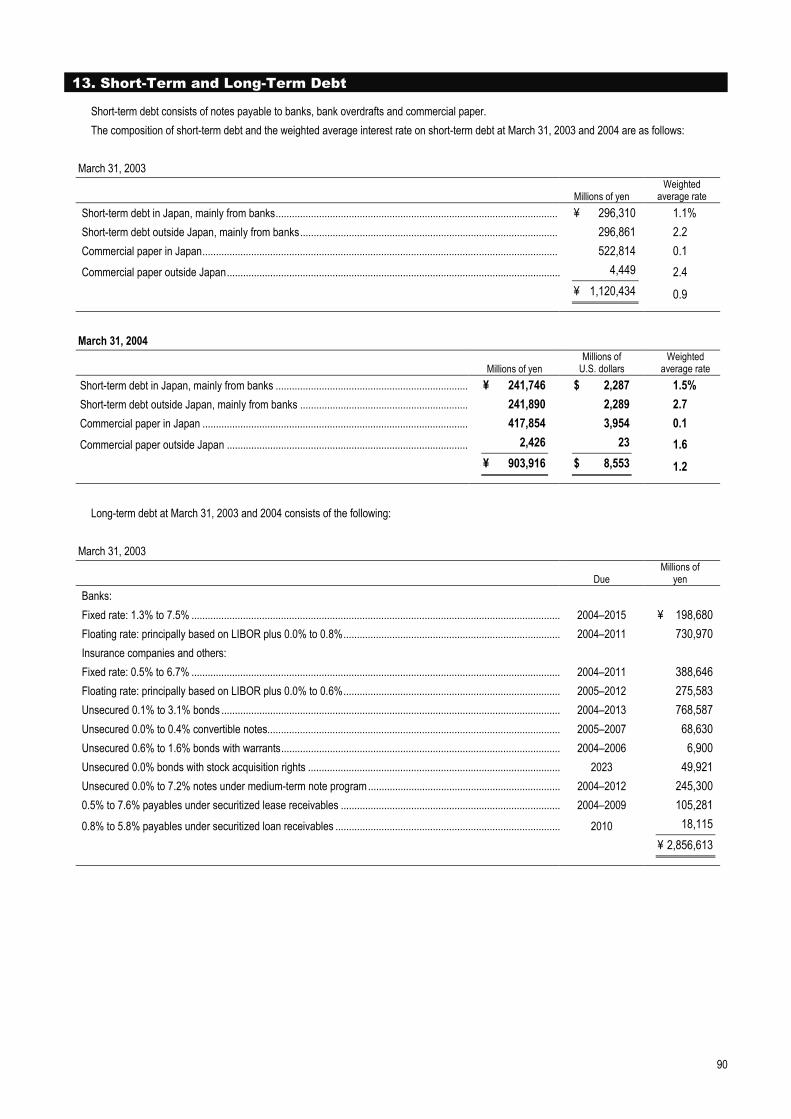
90
13. Short-Term and Long-Term Debt
Short-term debt consists of notes payable to banks, bank overdrafts and commercial paper. The composition of short-term debt and the weighted average interest rate on short-term debt at March 31, 2003 and 2004 are as follows:
March 31, 2003
Millions of yen Weighted
average rate Short-term debt in Japan, mainly from banks........................................................................................................ ¥ 296,310 1.1% Short-term debt outside Japan, mainly from banks............................................................................................... 296,861 2.2 Commercial paper in Japan................................................................................................................................... 522,814 0.1 Commercial paper outside Japan........................................................................................................................... 4,449 2.4
¥ 1,120,434 0.9
March 31, 2004
Millions of yen Millions of
U.S. dollars Weighted
average rate Short-term debt in Japan, mainly from banks ....................................................................... ¥ 241,746 $ 2,287 1.5% Short-term debt outside Japan, mainly from banks .............................................................. 241,890 2,289 2.7 Commercial paper in Japan .................................................................................................. 417,854 3,954 0.1 Commercial paper outside Japan ......................................................................................... 2,426 23 1.6
¥ 903,916 $ 8,553 1.2
Long-term debt at March 31, 2003 and 2004 consists of the following:
March 31, 2003
Due Millions of
yen Banks: Fixed rate: 1.3% to 7.5% ........................................................................................................................................ 2004–2015 ¥ 198,680Floating rate: principally based on LIBOR plus 0.0% to 0.8%................................................................................ 2004–2011 730,970Insurance companies and others: Fixed rate: 0.5% to 6.7% ........................................................................................................................................ 2004–2011 388,646Floating rate: principally based on LIBOR plus 0.0% to 0.6%................................................................................ 2005–2012 275,583Unsecured 0.1% to 3.1% bonds ............................................................................................................................. 2004–2013 768,587Unsecured 0.0% to 0.4% convertible notes............................................................................................................ 2005–2007 68,630Unsecured 0.6% to 1.6% bonds with warrants....................................................................................................... 2004–2006 6,900Unsecured 0.0% bonds with stock acquisition rights ............................................................................................. 2023 49,921Unsecured 0.0% to 7.2% notes under medium-term note program....................................................................... 2004–2012 245,3000.5% to 7.6% payables under securitized lease receivables ................................................................................. 2004–2009 105,2810.8% to 5.8% payables under securitized loan receivables ................................................................................... 2010 18,115
¥ 2,856,613
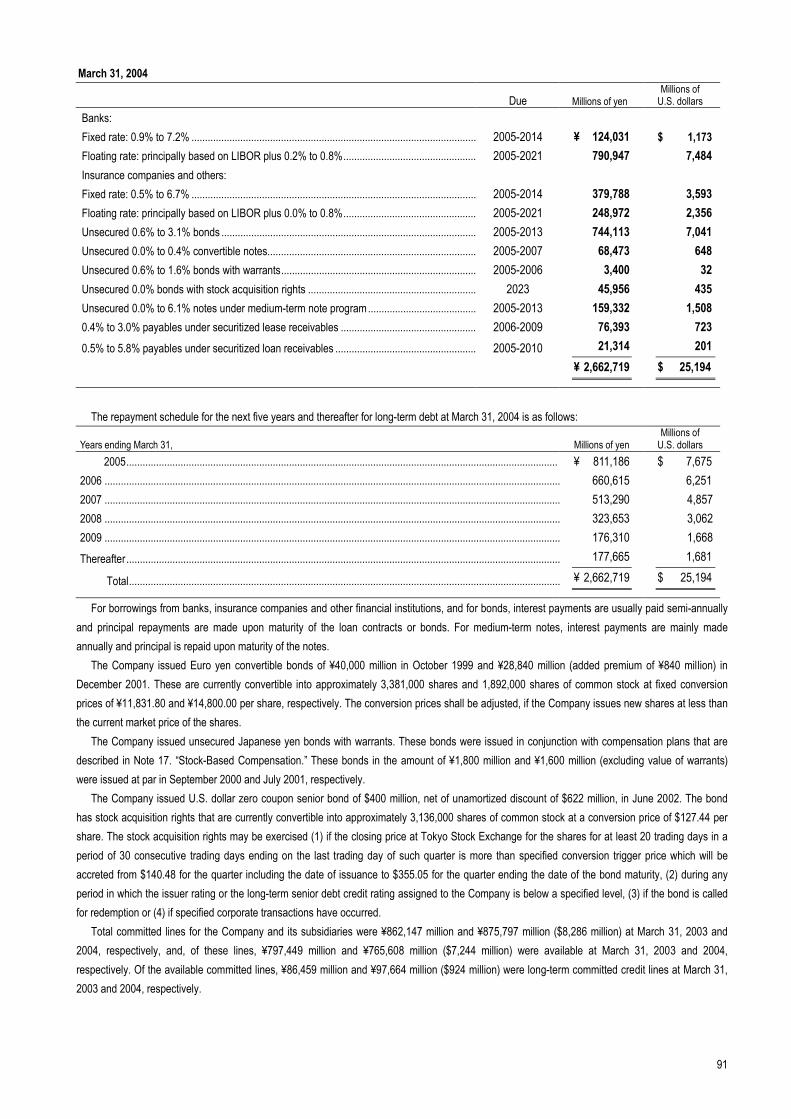
91
March 31, 2004
Due Millions of yen Millions of
U.S. dollars Banks: Fixed rate: 0.9% to 7.2% ......................................................................................................... 2005-2014 ¥ 124,031 $ 1,173Floating rate: principally based on LIBOR plus 0.2% to 0.8%................................................. 2005-2021 790,947 7,484Insurance companies and others: Fixed rate: 0.5% to 6.7% ......................................................................................................... 2005-2014 379,788 3,593Floating rate: principally based on LIBOR plus 0.0% to 0.8%................................................. 2005-2021 248,972 2,356Unsecured 0.6% to 3.1% bonds .............................................................................................. 2005-2013 744,113 7,041Unsecured 0.0% to 0.4% convertible notes............................................................................. 2005-2007 68,473 648Unsecured 0.6% to 1.6% bonds with warrants........................................................................ 2005-2006 3,400 32Unsecured 0.0% bonds with stock acquisition rights .............................................................. 2023 45,956 435Unsecured 0.0% to 6.1% notes under medium-term note program........................................ 2005-2013 159,332 1,5080.4% to 3.0% payables under securitized lease receivables .................................................. 2006-2009 76,393 7230.5% to 5.8% payables under securitized loan receivables .................................................... 2005-2010 21,314 201
¥ 2,662,719 $ 25,194
The repayment schedule for the next five years and thereafter for long-term debt at March 31, 2004 is as follows:
Years ending March 31, Millions of yen Millions of
U.S. dollars 2005............................................................................................................................................................... ¥ 811,186 $ 7,675
2006 ........................................................................................................................................................................ 660,615 6,2512007 ........................................................................................................................................................................ 513,290 4,8572008 ........................................................................................................................................................................ 323,653 3,0622009 ........................................................................................................................................................................ 176,310 1,668Thereafter................................................................................................................................................................ 177,665 1,681
Total............................................................................................................................................................... ¥ 2,662,719 $ 25,194
For borrowings from banks, insurance companies and other financial institutions, and for bonds, interest payments are usually paid semi-annually and principal repayments are made upon maturity of the loan contracts or bonds. For medium-term notes, interest payments are mainly made annually and principal is repaid upon maturity of the notes.
The Company issued Euro yen convertible bonds of ¥40,000 million in October 1999 and ¥28,840 million (added premium of ¥840 million) in December 2001. These are currently convertible into approximately 3,381,000 shares and 1,892,000 shares of common stock at fixed conversion prices of ¥11,831.80 and ¥14,800.00 per share, respectively. The conversion prices shall be adjusted, if the Company issues new shares at less than the current market price of the shares.
The Company issued unsecured Japanese yen bonds with warrants. These bonds were issued in conjunction with compensation plans that are described in Note 17. “Stock-Based Compensation.” These bonds in the amount of ¥1,800 million and ¥1,600 million (excluding value of warrants) were issued at par in September 2000 and July 2001, respectively.
The Company issued U.S. dollar zero coupon senior bond of $400 million, net of unamortized discount of $622 million, in June 2002. The bond has stock acquisition rights that are currently convertible into approximately 3,136,000 shares of common stock at a conversion price of $127.44 per share. The stock acquisition rights may be exercised (1) if the closing price at Tokyo Stock Exchange for the shares for at least 20 trading days in a period of 30 consecutive trading days ending on the last trading day of such quarter is more than specified conversion trigger price which will be accreted from $140.48 for the quarter including the date of issuance to $355.05 for the quarter ending the date of the bond maturity, (2) during any period in which the issuer rating or the long-term senior debt credit rating assigned to the Company is below a specified level, (3) if the bond is called for redemption or (4) if specified corporate transactions have occurred.
Total committed lines for the Company and its subsidiaries were ¥862,147 million and ¥875,797 million ($8,286 million) at March 31, 2003 and 2004, respectively, and, of these lines, ¥797,449 million and ¥765,608 million ($7,244 million) were available at March 31, 2003 and 2004, respectively. Of the available committed lines, ¥86,459 million and ¥97,664 million ($924 million) were long-term committed credit lines at March 31, 2003 and 2004, respectively.
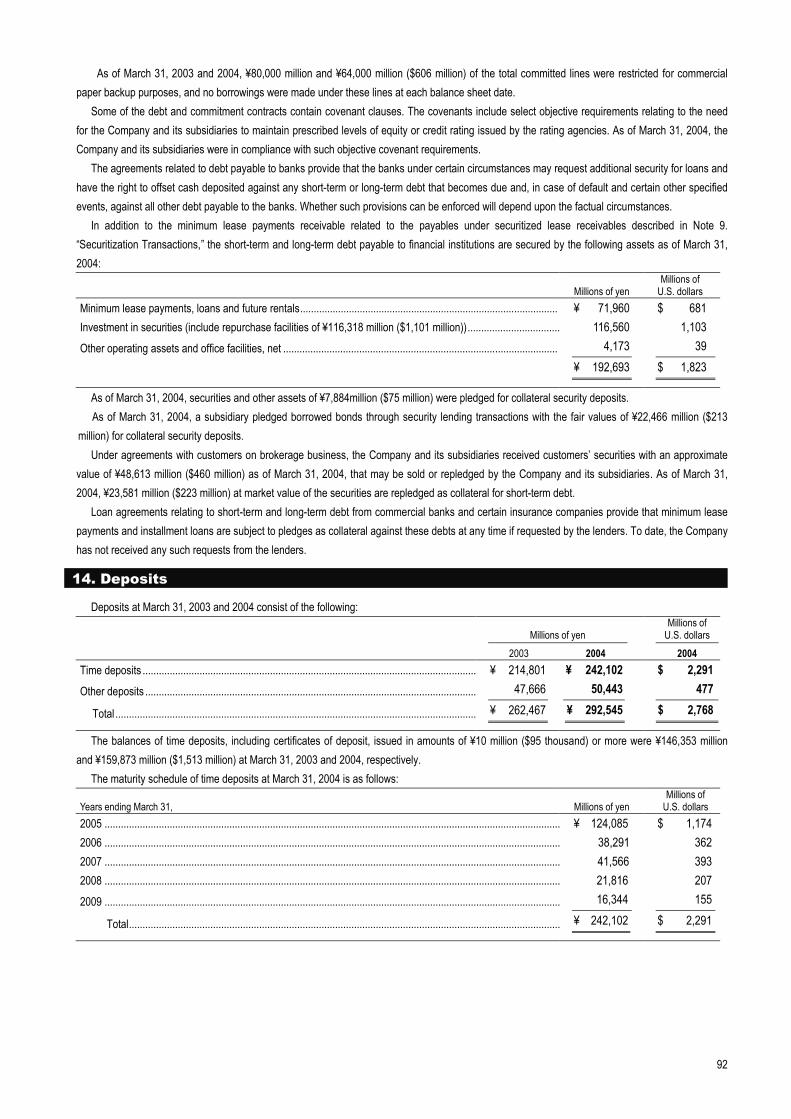
92
As of March 31, 2003 and 2004, ¥80,000 million and ¥64,000 million ($606 million) of the total committed lines were restricted for commercial paper backup purposes, and no borrowings were made under these lines at each balance sheet date.
Some of the debt and commitment contracts contain covenant clauses. The covenants include select objective requirements relating to the need for the Company and its subsidiaries to maintain prescribed levels of equity or credit rating issued by the rating agencies. As of March 31, 2004, the Company and its subsidiaries were in compliance with such objective covenant requirements.
The agreements related to debt payable to banks provide that the banks under certain circumstances may request additional security for loans and have the right to offset cash deposited against any short-term or long-term debt that becomes due and, in case of default and certain other specified events, against all other debt payable to the banks. Whether such provisions can be enforced will depend upon the factual circumstances.
In addition to the minimum lease payments receivable related to the payables under securitized lease receivables described in Note 9. “Securitization Transactions,” the short-term and long-term debt payable to financial institutions are secured by the following assets as of March 31, 2004:
Millions of yen Millions of
U.S. dollars Minimum lease payments, loans and future rentals............................................................................................... ¥ 71,960 $ 681 Investment in securities (include repurchase facilities of ¥116,318 million ($1,101 million)).................................. 116,560 1,103 Other operating assets and office facilities, net ..................................................................................................... 4,173 39
¥ 192,693 $ 1,823
As of March 31, 2004, securities and other assets of ¥7,884million ($75 million) were pledged for collateral security deposits. As of March 31, 2004, a subsidiary pledged borrowed bonds through security lending transactions with the fair values of ¥22,466 million ($213
million) for collateral security deposits. Under agreements with customers on brokerage business, the Company and its subsidiaries received customers’ securities with an approximate
value of ¥48,613 million ($460 million) as of March 31, 2004, that may be sold or repledged by the Company and its subsidiaries. As of March 31, 2004, ¥23,581 million ($223 million) at market value of the securities are repledged as collateral for short-term debt.
Loan agreements relating to short-term and long-term debt from commercial banks and certain insurance companies provide that minimum lease payments and installment loans are subject to pledges as collateral against these debts at any time if requested by the lenders. To date, the Company has not received any such requests from the lenders.
14. Deposits
Deposits at March 31, 2003 and 2004 consist of the following:
Millions of yen Millions of
U.S. dollars 2003 2004 2004
Time deposits ........................................................................................................................... ¥ 214,801 ¥ 242,102 $ 2,291Other deposits .......................................................................................................................... 47,666 50,443 477
Total ..................................................................................................................................... ¥ 262,467 ¥ 292,545 $ 2,768
The balances of time deposits, including certificates of deposit, issued in amounts of ¥10 million ($95 thousand) or more were ¥146,353 million and ¥159,873 million ($1,513 million) at March 31, 2003 and 2004, respectively.
The maturity schedule of time deposits at March 31, 2004 is as follows:
Years ending March 31, Millions of yen Millions of
U.S. dollars 2005 ........................................................................................................................................................................ ¥ 124,085 $ 1,1742006 ........................................................................................................................................................................ 38,291 3622007 ........................................................................................................................................................................ 41,566 3932008 ........................................................................................................................................................................ 21,816 2072009 ........................................................................................................................................................................ 16,344 155
Total............................................................................................................................................................... ¥ 242,102 $ 2,291
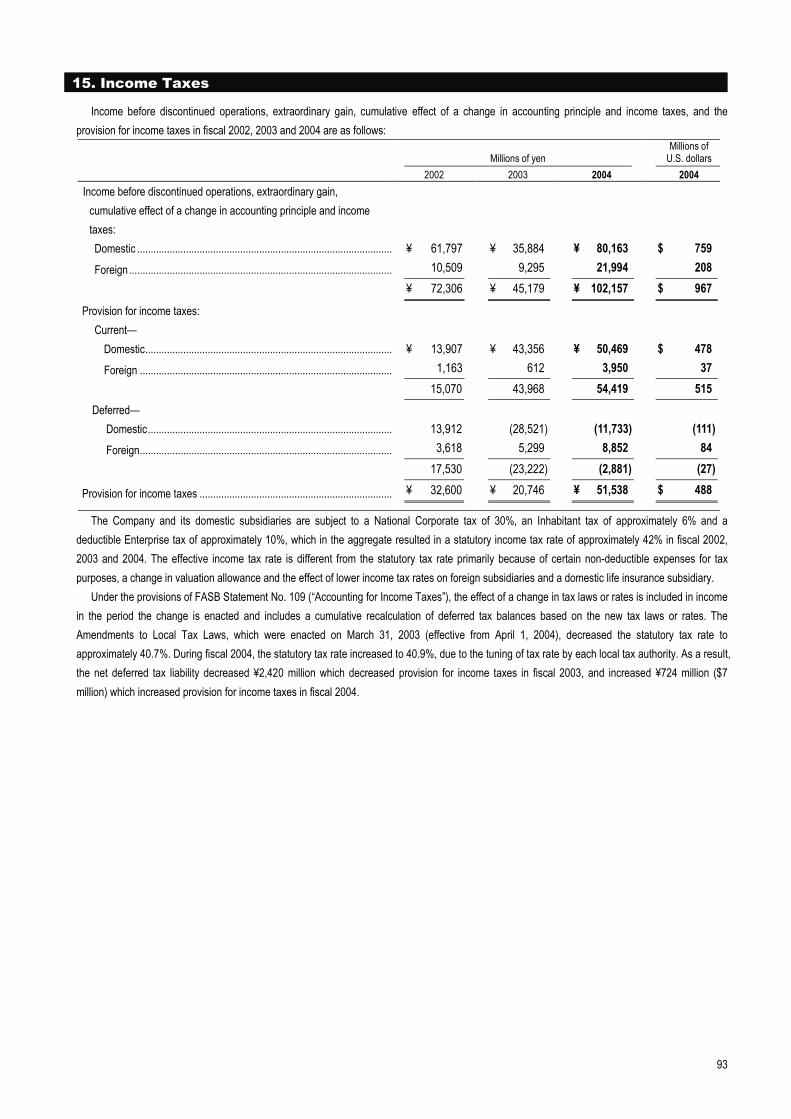
93
15. Income Taxes
Income before discontinued operations, extraordinary gain, cumulative effect of a change in accounting principle and income taxes, and the provision for income taxes in fiscal 2002, 2003 and 2004 are as follows:
Millions of yen Millions of
U.S. dollars 2002 2003 2004 2004
Income before discontinued operations, extraordinary gain, cumulative effect of a change in accounting principle and income taxes: Domestic .............................................................................................. ¥ 61,797 ¥ 35,884 ¥ 80,163 $ 759Foreign................................................................................................. 10,509 9,295 21,994 208
¥ 72,306 ¥ 45,179 ¥ 102,157 $ 967
Provision for income taxes: Current—
Domestic........................................................................................... ¥ 13,907 ¥ 43,356 ¥ 50,469 $ 478Foreign ............................................................................................. 1,163 612 3,950 37
15,070 43,968 54,419 515Deferred—
Domestic.......................................................................................... 13,912 (28,521) (11,733) (111)Foreign............................................................................................. 3,618 5,299 8,852 84
17,530 (23,222) (2,881) (27)
Provision for income taxes ....................................................................... ¥ 32,600 ¥ 20,746 ¥ 51,538 $ 488
The Company and its domestic subsidiaries are subject to a National Corporate tax of 30%, an Inhabitant tax of approximately 6% and a deductible Enterprise tax of approximately 10%, which in the aggregate resulted in a statutory income tax rate of approximately 42% in fiscal 2002, 2003 and 2004. The effective income tax rate is different from the statutory tax rate primarily because of certain non-deductible expenses for tax purposes, a change in valuation allowance and the effect of lower income tax rates on foreign subsidiaries and a domestic life insurance subsidiary.
Under the provisions of FASB Statement No. 109 (“Accounting for Income Taxes”), the effect of a change in tax laws or rates is included in income in the period the change is enacted and includes a cumulative recalculation of deferred tax balances based on the new tax laws or rates. The Amendments to Local Tax Laws, which were enacted on March 31, 2003 (effective from April 1, 2004), decreased the statutory tax rate to approximately 40.7%. During fiscal 2004, the statutory tax rate increased to 40.9%, due to the tuning of tax rate by each local tax authority. As a result, the net deferred tax liability decreased ¥2,420 million which decreased provision for income taxes in fiscal 2003, and increased ¥724 million ($7 million) which increased provision for income taxes in fiscal 2004.
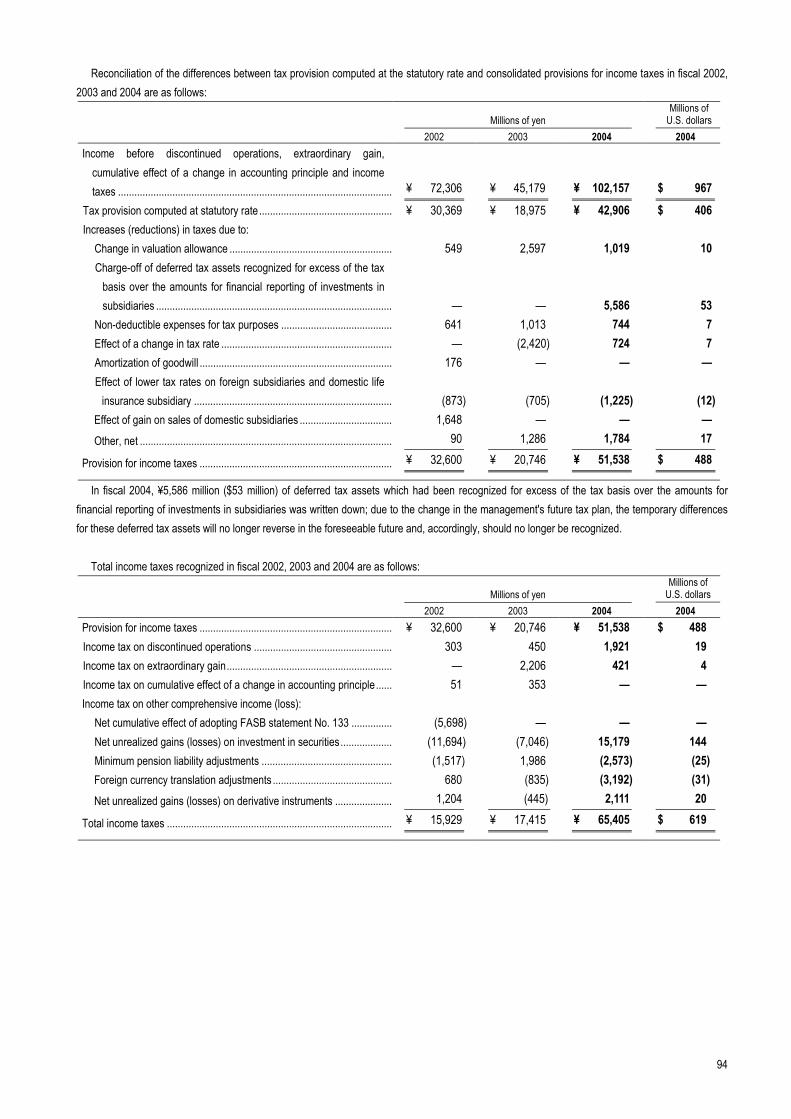
94
Reconciliation of the differences between tax provision computed at the statutory rate and consolidated provisions for income taxes in fiscal 2002, 2003 and 2004 are as follows:
Millions of yen Millions of
U.S. dollars 2002 2003 2004 2004 Income before discontinued operations, extraordinary gain,
cumulative effect of a change in accounting principle and income taxes ..................................................................................................... ¥ 72,306 ¥ 45,179 ¥ 102,157 $ 967
Tax provision computed at statutory rate................................................. ¥ 30,369 ¥ 18,975 ¥ 42,906 $ 406Increases (reductions) in taxes due to:
Change in valuation allowance ............................................................ 549 2,597 1,019 10Charge-off of deferred tax assets recognized for excess of the tax
basis over the amounts for financial reporting of investments in subsidiaries ....................................................................................... — — 5,586 53
Non-deductible expenses for tax purposes ......................................... 641 1,013 744 7Effect of a change in tax rate ............................................................... — (2,420) 724 7Amortization of goodwill ....................................................................... 176 — — —Effect of lower tax rates on foreign subsidiaries and domestic life
insurance subsidiary ......................................................................... (873) (705) (1,225) (12)Effect of gain on sales of domestic subsidiaries .................................. 1,648 — — —Other, net ............................................................................................. 90 1,286 1,784 17
Provision for income taxes ....................................................................... ¥ 32,600 ¥ 20,746 ¥ 51,538 $ 488
In fiscal 2004, ¥5,586 million ($53 million) of deferred tax assets which had been recognized for excess of the tax basis over the amounts for financial reporting of investments in subsidiaries was written down; due to the change in the management's future tax plan, the temporary differences for these deferred tax assets will no longer reverse in the foreseeable future and, accordingly, should no longer be recognized.
Total income taxes recognized in fiscal 2002, 2003 and 2004 are as follows:
Millions of yen Millions of
U.S. dollars 2002 2003 2004 2004 Provision for income taxes ....................................................................... ¥ 32,600 ¥ 20,746 ¥ 51,538 $ 488 Income tax on discontinued operations ................................................... 303 450 1,921 19 Income tax on extraordinary gain............................................................. — 2,206 421 4 Income tax on cumulative effect of a change in accounting principle...... 51 353 — — Income tax on other comprehensive income (loss):
Net cumulative effect of adopting FASB statement No. 133 ............... (5,698) — — — Net unrealized gains (losses) on investment in securities................... (11,694) (7,046) 15,179 144 Minimum pension liability adjustments ................................................ (1,517) 1,986 (2,573) (25)Foreign currency translation adjustments ............................................ 680 (835) (3,192) (31)Net unrealized gains (losses) on derivative instruments ..................... 1,204 (445) 2,111 20
Total income taxes ................................................................................... ¥ 15,929 ¥ 17,415 ¥ 65,405 $ 619
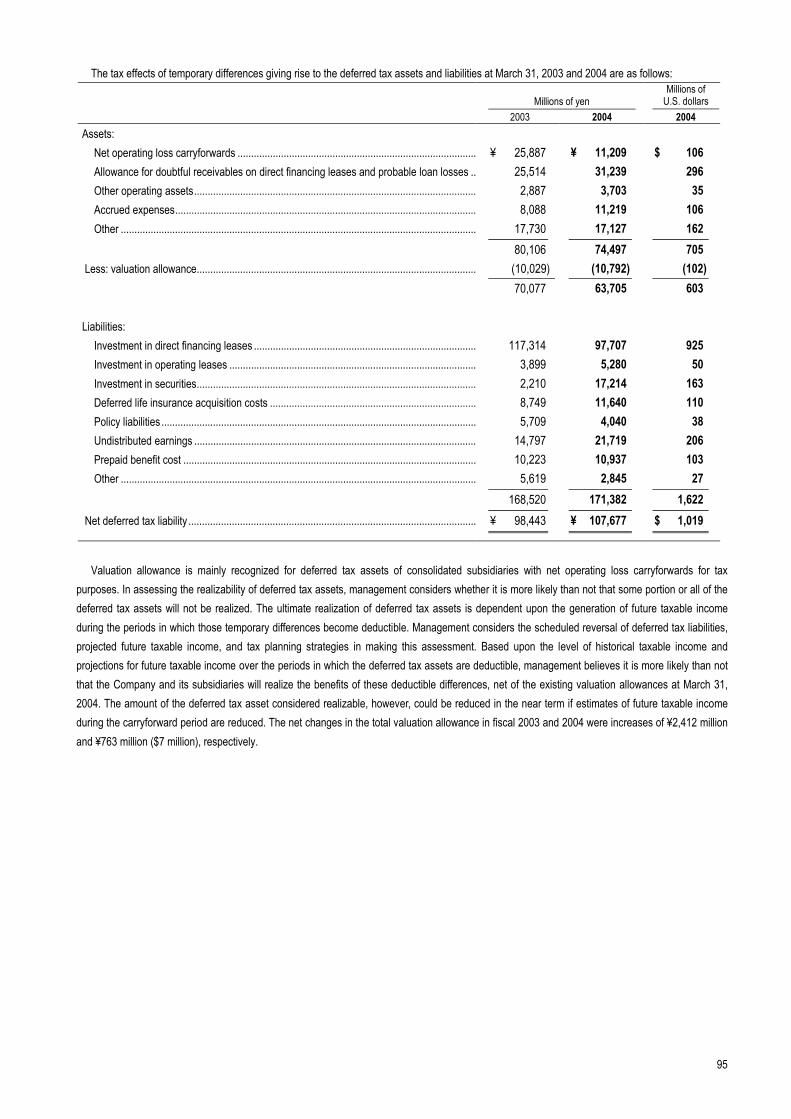
95
The tax effects of temporary differences giving rise to the deferred tax assets and liabilities at March 31, 2003 and 2004 are as follows:
Millions of yen Millions of
U.S. dollars 2003 2004 2004
Assets: Net operating loss carryforwards ........................................................................................ ¥ 25,887 ¥ 11,209 $ 106 Allowance for doubtful receivables on direct financing leases and probable loan losses .. 25,514 31,239 296 Other operating assets........................................................................................................ 2,887 3,703 35 Accrued expenses............................................................................................................... 8,088 11,219 106 Other ................................................................................................................................... 17,730 17,127 162
80,106 74,497 705 Less: valuation allowance....................................................................................................... (10,029) (10,792) (102) 70,077 63,705 603 Liabilities:
Investment in direct financing leases .................................................................................. 117,314 97,707 925 Investment in operating leases ........................................................................................... 3,899 5,280 50 Investment in securities....................................................................................................... 2,210 17,214 163 Deferred life insurance acquisition costs ............................................................................ 8,749 11,640 110 Policy liabilities .................................................................................................................... 5,709 4,040 38 Undistributed earnings ........................................................................................................ 14,797 21,719 206 Prepaid benefit cost ............................................................................................................ 10,223 10,937 103 Other ................................................................................................................................... 5,619 2,845 27
168,520 171,382 1,622 Net deferred tax liability .......................................................................................................... ¥ 98,443 ¥ 107,677 $ 1,019
Valuation allowance is mainly recognized for deferred tax assets of consolidated subsidiaries with net operating loss carryforwards for tax
purposes. In assessing the realizability of deferred tax assets, management considers whether it is more likely than not that some portion or all of the deferred tax assets will not be realized. The ultimate realization of deferred tax assets is dependent upon the generation of future taxable income during the periods in which those temporary differences become deductible. Management considers the scheduled reversal of deferred tax liabilities, projected future taxable income, and tax planning strategies in making this assessment. Based upon the level of historical taxable income and projections for future taxable income over the periods in which the deferred tax assets are deductible, management believes it is more likely than not that the Company and its subsidiaries will realize the benefits of these deductible differences, net of the existing valuation allowances at March 31, 2004. The amount of the deferred tax asset considered realizable, however, could be reduced in the near term if estimates of future taxable income during the carryforward period are reduced. The net changes in the total valuation allowance in fiscal 2003 and 2004 were increases of ¥2,412 million and ¥763 million ($7 million), respectively.
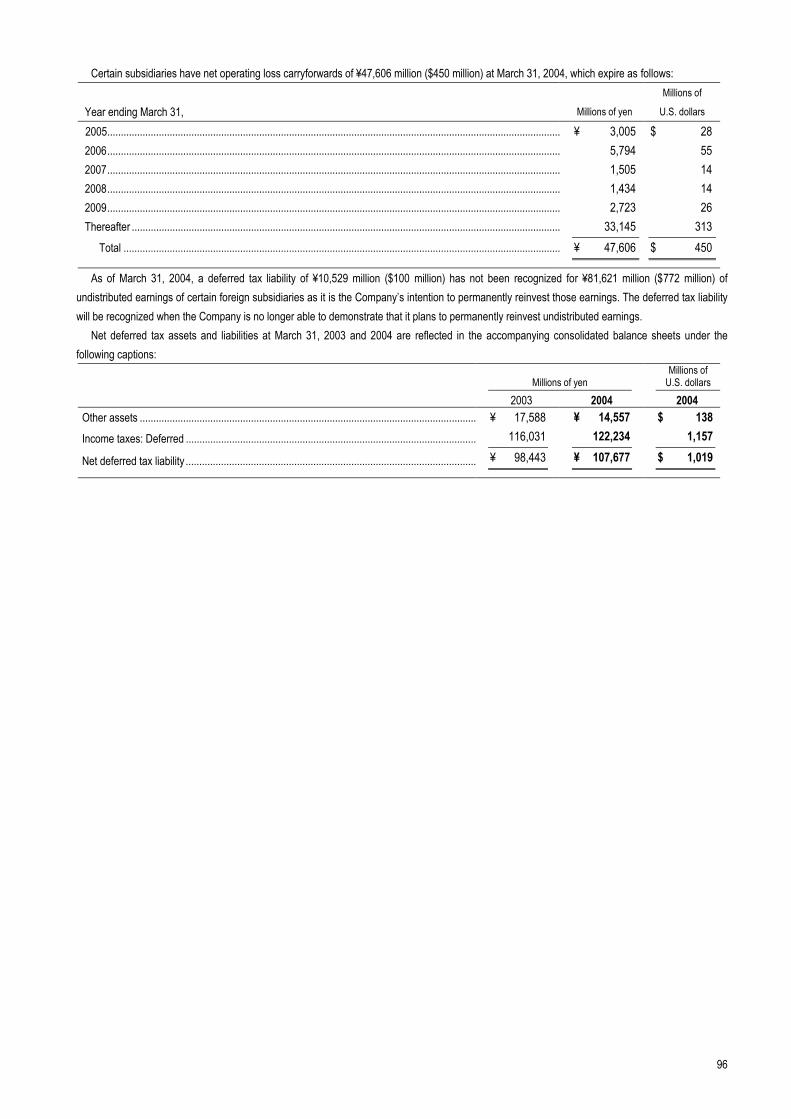
96
Certain subsidiaries have net operating loss carryforwards of ¥47,606 million ($450 million) at March 31, 2004, which expire as follows:
Year ending March 31, Millions of yen
Millions of
U.S. dollars
2005....................................................................................................................................................................... ¥ 3,005 $ 282006....................................................................................................................................................................... 5,794 552007....................................................................................................................................................................... 1,505 142008....................................................................................................................................................................... 1,434 142009....................................................................................................................................................................... 2,723 26Thereafter .............................................................................................................................................................. 33,145 313
Total ................................................................................................................................................................. ¥ 47,606 $ 450
As of March 31, 2004, a deferred tax liability of ¥10,529 million ($100 million) has not been recognized for ¥81,621 million ($772 million) of undistributed earnings of certain foreign subsidiaries as it is the Company’s intention to permanently reinvest those earnings. The deferred tax liability will be recognized when the Company is no longer able to demonstrate that it plans to permanently reinvest undistributed earnings.
Net deferred tax assets and liabilities at March 31, 2003 and 2004 are reflected in the accompanying consolidated balance sheets under the following captions:
Millions of yen Millions of
U.S. dollars 2003 2004 2004 Other assets ............................................................................................................................ ¥ 17,588 ¥ 14,557 $ 138Income taxes: Deferred ........................................................................................................... 116,031 122,234 1,157
Net deferred tax liability ........................................................................................................... ¥ 98,443 ¥ 107,677 $ 1,019
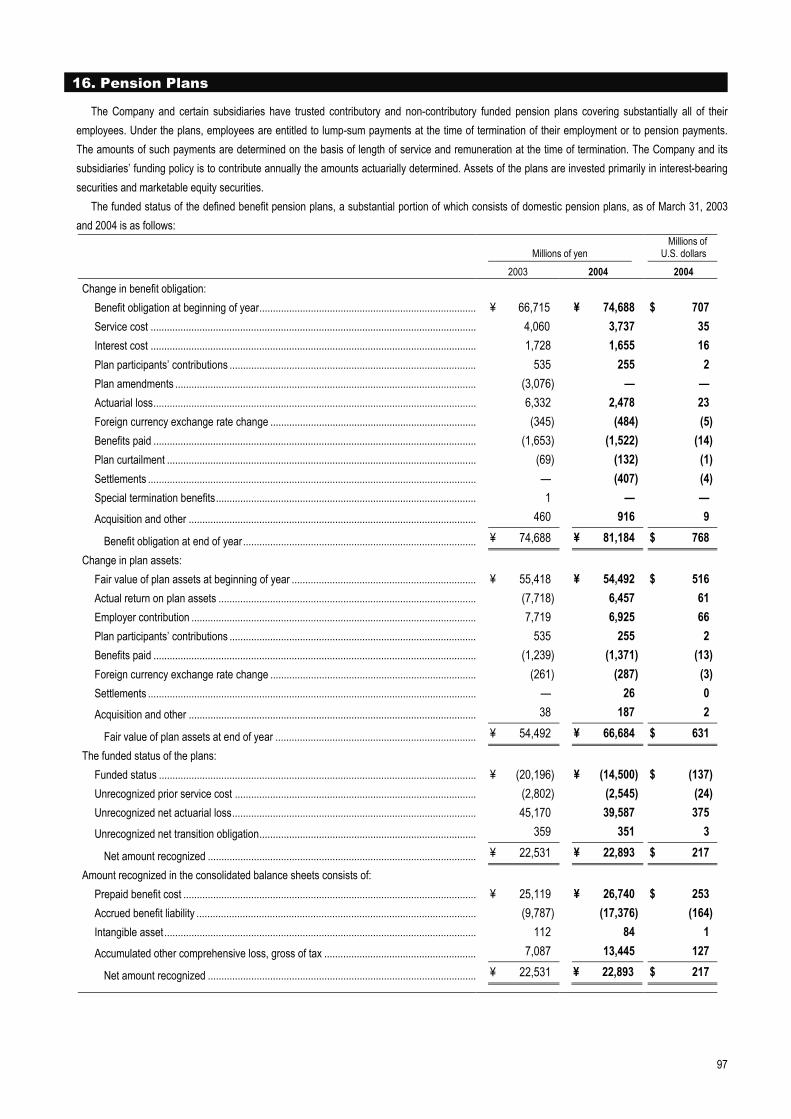
97
16. Pension Plans
The Company and certain subsidiaries have trusted contributory and non-contributory funded pension plans covering substantially all of their employees. Under the plans, employees are entitled to lump-sum payments at the time of termination of their employment or to pension payments. The amounts of such payments are determined on the basis of length of service and remuneration at the time of termination. The Company and its subsidiaries’ funding policy is to contribute annually the amounts actuarially determined. Assets of the plans are invested primarily in interest-bearing securities and marketable equity securities.
The funded status of the defined benefit pension plans, a substantial portion of which consists of domestic pension plans, as of March 31, 2003 and 2004 is as follows:
Millions of yen Millions of
U.S. dollars 2003 2004 2004 Change in benefit obligation:
Benefit obligation at beginning of year................................................................................ ¥ 66,715 ¥ 74,688 $ 707Service cost ........................................................................................................................ 4,060 3,737 35Interest cost ........................................................................................................................ 1,728 1,655 16Plan participants’ contributions ........................................................................................... 535 255 2Plan amendments ............................................................................................................... (3,076) — —Actuarial loss....................................................................................................................... 6,332 2,478 23Foreign currency exchange rate change ............................................................................ (345) (484) (5)Benefits paid ....................................................................................................................... (1,653) (1,522) (14)Plan curtailment .................................................................................................................. (69) (132) (1)Settlements ......................................................................................................................... — (407) (4)Special termination benefits................................................................................................ 1 — —Acquisition and other .......................................................................................................... 460 916 9
Benefit obligation at end of year...................................................................................... ¥ 74,688 ¥ 81,184 $ 768
Change in plan assets: Fair value of plan assets at beginning of year .................................................................... ¥ 55,418 ¥ 54,492 $ 516Actual return on plan assets ............................................................................................... (7,718) 6,457 61Employer contribution ......................................................................................................... 7,719 6,925 66Plan participants’ contributions ........................................................................................... 535 255 2Benefits paid ....................................................................................................................... (1,239) (1,371) (13)Foreign currency exchange rate change ............................................................................ (261) (287) (3)Settlements ......................................................................................................................... — 26 0Acquisition and other .......................................................................................................... 38 187 2
Fair value of plan assets at end of year .......................................................................... ¥ 54,492 ¥ 66,684 $ 631
The funded status of the plans: Funded status ..................................................................................................................... ¥ (20,196) ¥ (14,500) $ (137)Unrecognized prior service cost ......................................................................................... (2,802) (2,545) (24)Unrecognized net actuarial loss.......................................................................................... 45,170 39,587 375Unrecognized net transition obligation................................................................................ 359 351 3
Net amount recognized ................................................................................................... ¥ 22,531 ¥ 22,893 $ 217
Amount recognized in the consolidated balance sheets consists of: Prepaid benefit cost ............................................................................................................ ¥ 25,119 ¥ 26,740 $ 253Accrued benefit liability ....................................................................................................... (9,787) (17,376) (164)Intangible asset................................................................................................................... 112 84 1Accumulated other comprehensive loss, gross of tax ........................................................ 7,087 13,445 127
Net amount recognized ................................................................................................... ¥ 22,531 ¥ 22,893 $ 217
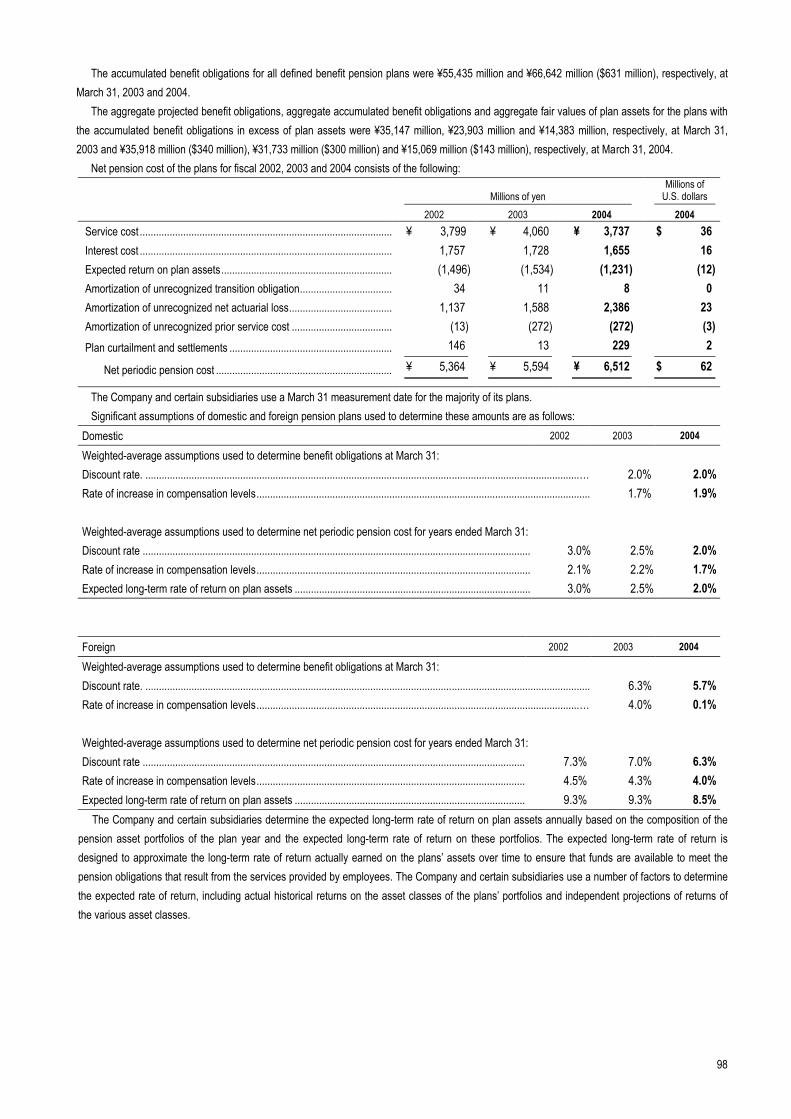
98
The accumulated benefit obligations for all defined benefit pension plans were ¥55,435 million and ¥66,642 million ($631 million), respectively, at March 31, 2003 and 2004.
The aggregate projected benefit obligations, aggregate accumulated benefit obligations and aggregate fair values of plan assets for the plans with the accumulated benefit obligations in excess of plan assets were ¥35,147 million, ¥23,903 million and ¥14,383 million, respectively, at March 31, 2003 and ¥35,918 million ($340 million), ¥31,733 million ($300 million) and ¥15,069 million ($143 million), respectively, at March 31, 2004.
Net pension cost of the plans for fiscal 2002, 2003 and 2004 consists of the following:
Millions of yen Millions of
U.S. dollars 2002 2003 2004 2004 Service cost ............................................................................................. ¥ 3,799 ¥ 4,060 ¥ 3,737 $ 36Interest cost ............................................................................................. 1,757 1,728 1,655 16Expected return on plan assets............................................................... (1,496) (1,534) (1,231) (12)Amortization of unrecognized transition obligation.................................. 34 11 8 0Amortization of unrecognized net actuarial loss...................................... 1,137 1,588 2,386 23Amortization of unrecognized prior service cost ..................................... (13) (272) (272) (3)Plan curtailment and settlements ............................................................ 146 13 229 2
Net periodic pension cost ................................................................. ¥ 5,364 ¥ 5,594 ¥ 6,512 $ 62
The Company and certain subsidiaries use a March 31 measurement date for the majority of its plans. Significant assumptions of domestic and foreign pension plans used to determine these amounts are as follows:
Domestic 2002 2003 2004
Weighted-average assumptions used to determine benefit obligations at March 31:
Discount rate. ................................................................................................................................................................… 2.0% 2.0%Rate of increase in compensation levels........................................................................................................................... 1.7% 1.9%
Weighted-average assumptions used to determine net periodic pension cost for years ended March 31: Discount rate ................................................................................................................................................ 3.0% 2.5% 2.0%Rate of increase in compensation levels...................................................................................................... 2.1% 2.2% 1.7%Expected long-term rate of return on plan assets ........................................................................................ 3.0% 2.5% 2.0%
Foreign 2002 2003 2004
Weighted-average assumptions used to determine benefit obligations at March 31:
Discount rate. .................................................................................................................................................................... 6.3% 5.7%Rate of increase in compensation levels.......................................................................................................................… 4.0% 0.1%
Weighted-average assumptions used to determine net periodic pension cost for years ended March 31: Discount rate ............................................................................................................................................. 7.3% 7.0% 6.3%Rate of increase in compensation levels................................................................................................... 4.5% 4.3% 4.0%Expected long-term rate of return on plan assets ..................................................................................... 9.3% 9.3% 8.5%
The Company and certain subsidiaries determine the expected long-term rate of return on plan assets annually based on the composition of the pension asset portfolios of the plan year and the expected long-term rate of return on these portfolios. The expected long-term rate of return is designed to approximate the long-term rate of return actually earned on the plans’ assets over time to ensure that funds are available to meet the pension obligations that result from the services provided by employees. The Company and certain subsidiaries use a number of factors to determine the expected rate of return, including actual historical returns on the asset classes of the plans’ portfolios and independent projections of returns of the various asset classes.
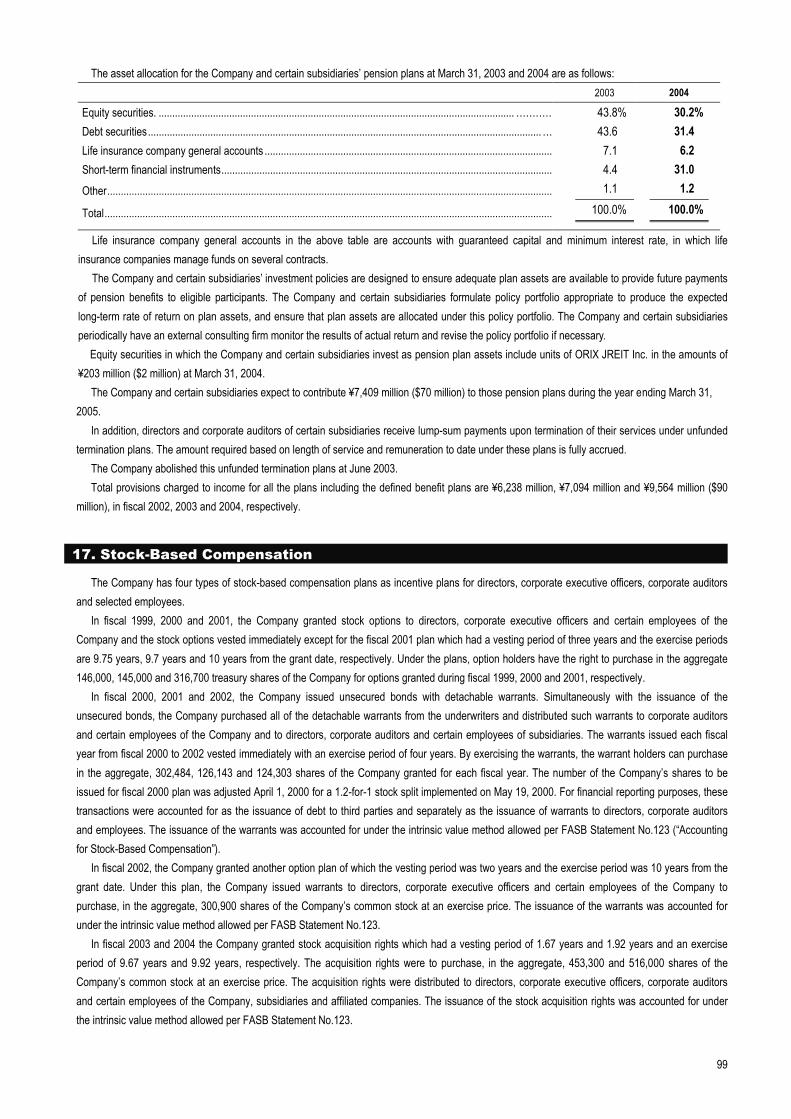
99
The asset allocation for the Company and certain subsidiaries’ pension plans at March 31, 2003 and 2004 are as follows: 2003 2004
Equity securities. ................................................................................................................................... ………… 43.8% 30.2% Debt securities.................................................................................................................................................… 43.6 31.4 Life insurance company general accounts .......................................................................................................... 7.1 6.2 Short-term financial instruments.......................................................................................................................... 4.4 31.0 Other.................................................................................................................................................................... 1.1 1.2
Total..................................................................................................................................................................... 100.0% 100.0%
Life insurance company general accounts in the above table are accounts with guaranteed capital and minimum interest rate, in which life insurance companies manage funds on several contracts.
The Company and certain subsidiaries’ investment policies are designed to ensure adequate plan assets are available to provide future payments of pension benefits to eligible participants. The Company and certain subsidiaries formulate policy portfolio appropriate to produce the expected long-term rate of return on plan assets, and ensure that plan assets are allocated under this policy portfolio. The Company and certain subsidiaries periodically have an external consulting firm monitor the results of actual return and revise the policy portfolio if necessary.
Equity securities in which the Company and certain subsidiaries invest as pension plan assets include units of ORIX JREIT Inc. in the amounts of ¥203 million ($2 million) at March 31, 2004.
The Company and certain subsidiaries expect to contribute ¥7,409 million ($70 million) to those pension plans during the year ending March 31, 2005.
In addition, directors and corporate auditors of certain subsidiaries receive lump-sum payments upon termination of their services under unfunded termination plans. The amount required based on length of service and remuneration to date under these plans is fully accrued.
The Company abolished this unfunded termination plans at June 2003. Total provisions charged to income for all the plans including the defined benefit plans are ¥6,238 million, ¥7,094 million and ¥9,564 million ($90
million), in fiscal 2002, 2003 and 2004, respectively.
17. Stock-Based Compensation
The Company has four types of stock-based compensation plans as incentive plans for directors, corporate executive officers, corporate auditors and selected employees.
In fiscal 1999, 2000 and 2001, the Company granted stock options to directors, corporate executive officers and certain employees of the Company and the stock options vested immediately except for the fiscal 2001 plan which had a vesting period of three years and the exercise periods are 9.75 years, 9.7 years and 10 years from the grant date, respectively. Under the plans, option holders have the right to purchase in the aggregate 146,000, 145,000 and 316,700 treasury shares of the Company for options granted during fiscal 1999, 2000 and 2001, respectively.
In fiscal 2000, 2001 and 2002, the Company issued unsecured bonds with detachable warrants. Simultaneously with the issuance of the unsecured bonds, the Company purchased all of the detachable warrants from the underwriters and distributed such warrants to corporate auditors and certain employees of the Company and to directors, corporate auditors and certain employees of subsidiaries. The warrants issued each fiscal year from fiscal 2000 to 2002 vested immediately with an exercise period of four years. By exercising the warrants, the warrant holders can purchase in the aggregate, 302,484, 126,143 and 124,303 shares of the Company granted for each fiscal year. The number of the Company’s shares to be issued for fiscal 2000 plan was adjusted April 1, 2000 for a 1.2-for-1 stock split implemented on May 19, 2000. For financial reporting purposes, these transactions were accounted for as the issuance of debt to third parties and separately as the issuance of warrants to directors, corporate auditors and employees. The issuance of the warrants was accounted for under the intrinsic value method allowed per FASB Statement No.123 (“Accounting for Stock-Based Compensation”).
In fiscal 2002, the Company granted another option plan of which the vesting period was two years and the exercise period was 10 years from the grant date. Under this plan, the Company issued warrants to directors, corporate executive officers and certain employees of the Company to purchase, in the aggregate, 300,900 shares of the Company’s common stock at an exercise price. The issuance of the warrants was accounted for under the intrinsic value method allowed per FASB Statement No.123.
In fiscal 2003 and 2004 the Company granted stock acquisition rights which had a vesting period of 1.67 years and 1.92 years and an exercise period of 9.67 years and 9.92 years, respectively. The acquisition rights were to purchase, in the aggregate, 453,300 and 516,000 shares of the Company’s common stock at an exercise price. The acquisition rights were distributed to directors, corporate executive officers, corporate auditors and certain employees of the Company, subsidiaries and affiliated companies. The issuance of the stock acquisition rights was accounted for under the intrinsic value method allowed per FASB Statement No.123.
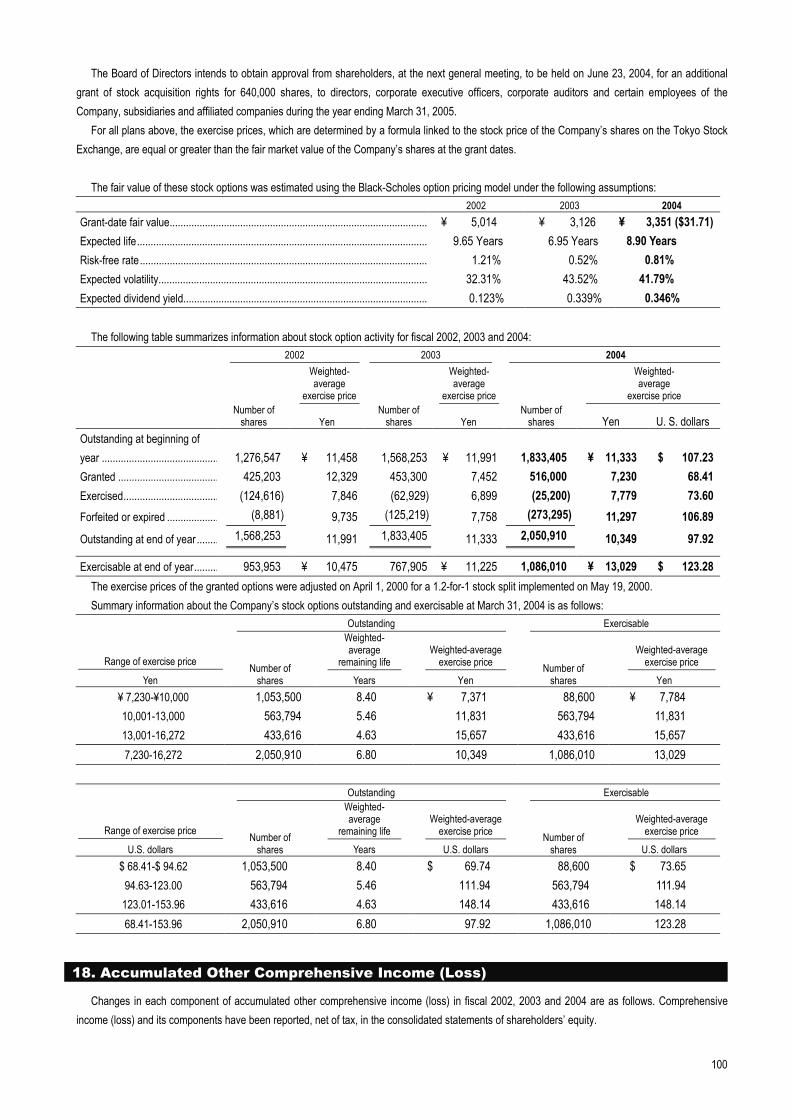
100
The Board of Directors intends to obtain approval from shareholders, at the next general meeting, to be held on June 23, 2004, for an additional grant of stock acquisition rights for 640,000 shares, to directors, corporate executive officers, corporate auditors and certain employees of the Company, subsidiaries and affiliated companies during the year ending March 31, 2005.
For all plans above, the exercise prices, which are determined by a formula linked to the stock price of the Company’s shares on the Tokyo Stock Exchange, are equal or greater than the fair market value of the Company’s shares at the grant dates.
The fair value of these stock options was estimated using the Black-Scholes option pricing model under the following assumptions:
2002 2003 2004 Grant-date fair value............................................................................................... ¥ 5,014 ¥ 3,126 ¥ 3,351 ($31.71)Expected life........................................................................................................... 9.65 Years 6.95 Years 8.90 Years Risk-free rate.......................................................................................................... 1.21% 0.52% 0.81% Expected volatility................................................................................................... 32.31% 43.52% 41.79% Expected dividend yield.......................................................................................... 0.123% 0.339% 0.346%
The following table summarizes information about stock option activity for fiscal 2002, 2003 and 2004:
2002 2003 2004
Weighted- average
exercise price
Weighted- average
exercise price
Weighted- average
exercise price
Number of
shares Yen Number of
shares Yen Number of
shares Yen U. S. dollarsOutstanding at beginning of year ........................................... 1,276,547 ¥ 11,458 1,568,253 ¥ 11,991 1,833,405 ¥ 11,333 $ 107.23Granted ..................................... 425,203 12,329 453,300 7,452 516,000 7,230 68.41Exercised................................... (124,616) 7,846 (62,929) 6,899 (25,200) 7,779 73.60Forfeited or expired ................... (8,881) 9,735 (125,219) 7,758 (273,295) 11,297 106.89
Outstanding at end of year ........ 1,568,253 11,991 1,833,405 11,333 2,050,910 10,349 97.92
Exercisable at end of year......... 953,953 ¥ 10,475 767,905 ¥ 11,225 1,086,010 ¥ 13,029 $ 123.28The exercise prices of the granted options were adjusted on April 1, 2000 for a 1.2-for-1 stock split implemented on May 19, 2000. Summary information about the Company’s stock options outstanding and exercisable at March 31, 2004 is as follows:
Outstanding Exercisable
Range of exercise price
Weighted- average
remaining life Weighted-average
exercise price Weighted-average
exercise price Yen
Number of shares Years Yen
Number of shares Yen
¥ 7,230-¥10,000 1,053,500 8.40 ¥ 7,371 88,600 ¥ 7,784 10,001-13,000 563,794 5.46 11,831 563,794 11,831 13,001-16,272 433,616 4.63 15,657 433,616 15,657 7,230-16,272 2,050,910 6.80 10,349 1,086,010 13,029
Outstanding Exercisable
Range of exercise price
Weighted- average
remaining life Weighted-average
exercise price Weighted-average
exercise price U.S. dollars
Number of shares Years U.S. dollars
Number of shares U.S. dollars
$ 68.41-$ 94.62 1,053,500 8.40 $ 69.74 88,600 $ 73.65 94.63-123.00 563,794 5.46 111.94 563,794 111.94 123.01-153.96 433,616 4.63 148.14 433,616 148.14 68.41-153.96 2,050,910 6.80 97.92 1,086,010 123.28
18. Accumulated Other Comprehensive Income (Loss)
Changes in each component of accumulated other comprehensive income (loss) in fiscal 2002, 2003 and 2004 are as follows. Comprehensive income (loss) and its components have been reported, net of tax, in the consolidated statements of shareholders’ equity.
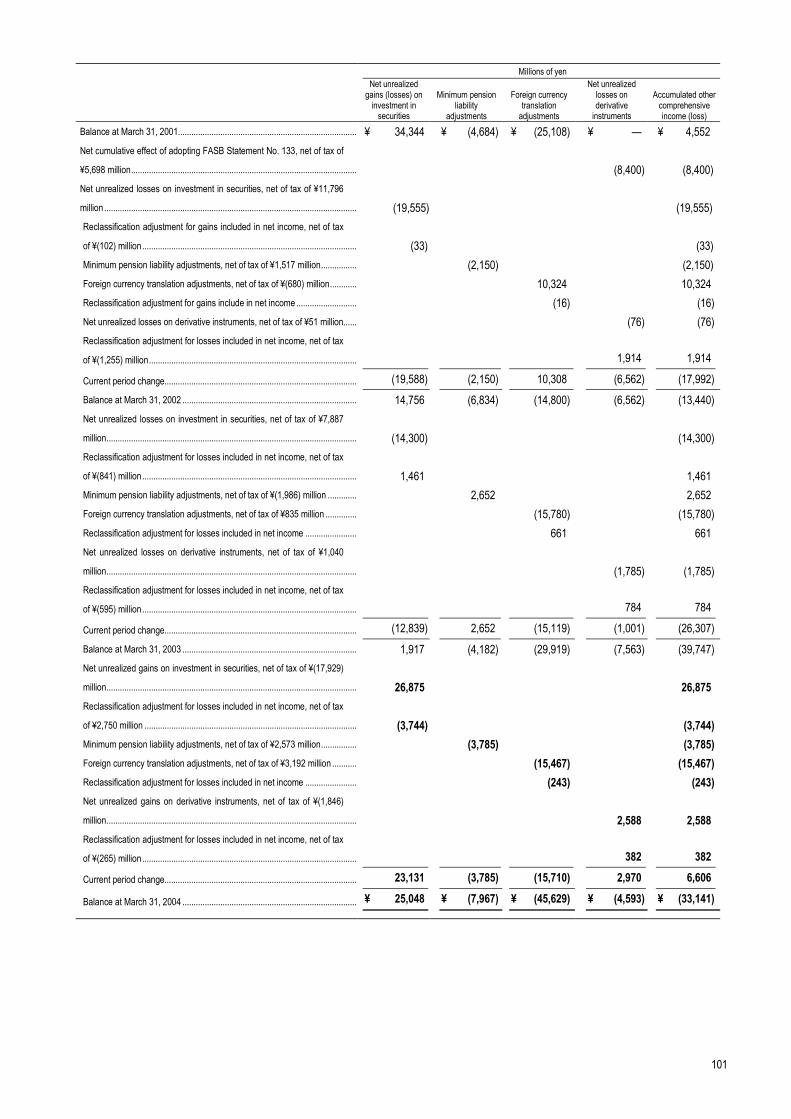
101
Millions of yen
Net unrealized gains (losses) on
investment in securities
Minimum pension liability
adjustments
Foreign currency translation
adjustments
Net unrealized losses on derivative
instruments
Accumulated other comprehensive income (loss)
Balance at March 31, 2001................................................................................ ¥ 34,344 ¥ (4,684) ¥ (25,108) ¥ — ¥ 4,552Net cumulative effect of adopting FASB Statement No. 133, net of tax of
¥5,698 million..................................................................................................... (8,400) (8,400)Net unrealized losses on investment in securities, net of tax of ¥11,796
million ................................................................................................................. (19,555) (19,555)Reclassification adjustment for gains included in net income, net of tax
of ¥(102) million................................................................................................ (33) (33)Minimum pension liability adjustments, net of tax of ¥1,517 million................ (2,150) (2,150)Foreign currency translation adjustments, net of tax of ¥(680) million............ 10,324 10,324Reclassification adjustment for gains include in net income ........................... (16) (16)Net unrealized losses on derivative instruments, net of tax of ¥51 million...... (76) (76)Reclassification adjustment for losses included in net income, net of tax
of ¥(1,255) million............................................................................................. 1,914 1,914
Current period change...................................................................................... (19,588) (2,150) 10,308 (6,562) (17,992)Balance at March 31, 2002 .............................................................................. 14,756 (6,834) (14,800) (6,562) (13,440)Net unrealized losses on investment in securities, net of tax of ¥7,887
million................................................................................................................ (14,300) (14,300)Reclassification adjustment for losses included in net income, net of tax
of ¥(841) million................................................................................................ 1,461 1,461Minimum pension liability adjustments, net of tax of ¥(1,986) million ............. 2,652 2,652Foreign currency translation adjustments, net of tax of ¥835 million .............. (15,780) (15,780)Reclassification adjustment for losses included in net income ....................... 661 661Net unrealized losses on derivative instruments, net of tax of ¥1,040
million................................................................................................................ (1,785) (1,785)Reclassification adjustment for losses included in net income, net of tax
of ¥(595) million................................................................................................ 784 784
Current period change...................................................................................... (12,839) 2,652 (15,119) (1,001) (26,307)Balance at March 31, 2003 .............................................................................. 1,917 (4,182) (29,919) (7,563) (39,747)Net unrealized gains on investment in securities, net of tax of ¥(17,929)
million................................................................................................................ 26,875 26,875Reclassification adjustment for losses included in net income, net of tax
of ¥2,750 million ............................................................................................... (3,744) (3,744)Minimum pension liability adjustments, net of tax of ¥2,573 million................ (3,785) (3,785)Foreign currency translation adjustments, net of tax of ¥3,192 million ........... (15,467) (15,467)Reclassification adjustment for losses included in net income ....................... (243) (243)Net unrealized gains on derivative instruments, net of tax of ¥(1,846)
million................................................................................................................ 2,588 2,588Reclassification adjustment for losses included in net income, net of tax
of ¥(265) million................................................................................................ 382 382
Current period change...................................................................................... 23,131 (3,785) (15,710) 2,970 6,606
Balance at March 31, 2004 .............................................................................. ¥ 25,048 ¥ (7,967) ¥ (45,629) ¥ (4,593) ¥ (33,141)
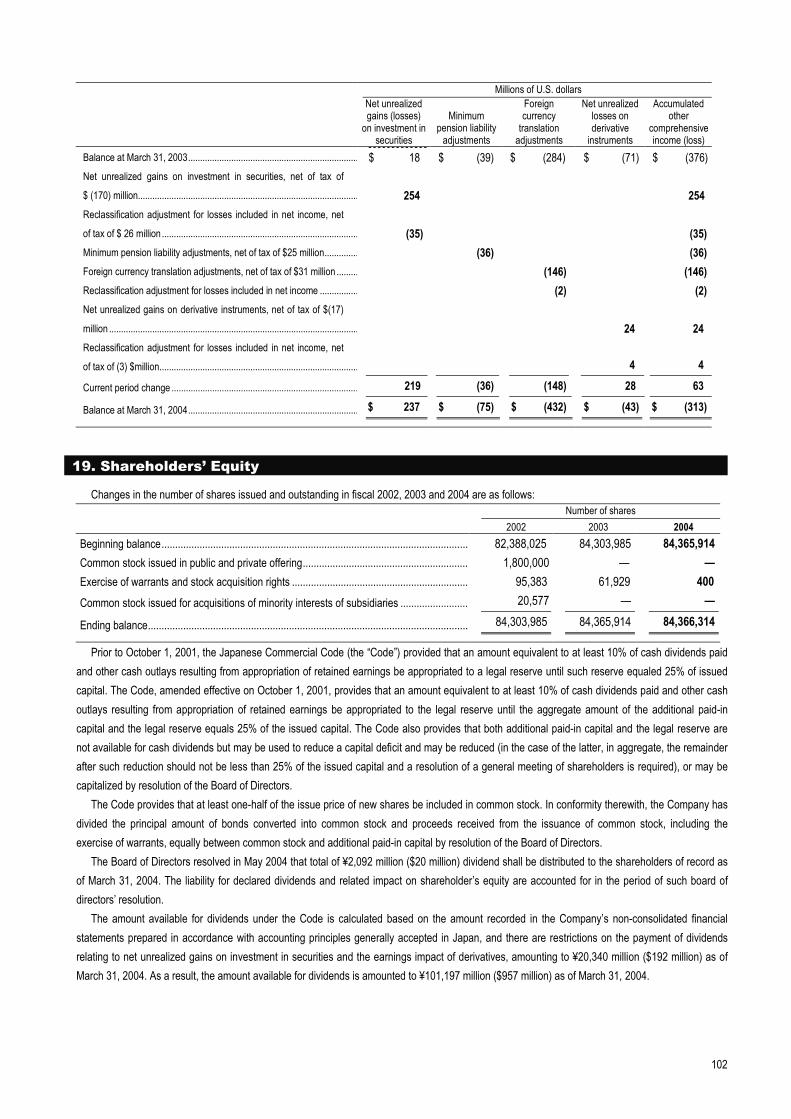
102
Millions of U.S. dollars
Net unrealized gains (losses)
on investment in securities
Minimum pension liability
adjustments
Foreign currency
translation adjustments
Net unrealized losses on derivative
instruments
Accumulated other
comprehensive income (loss)
Balance at March 31, 2003....................................................................... $ 18 $ (39) $ (284) $ (71) $ (376)Net unrealized gains on investment in securities, net of tax of
$ (170) million............................................................................................ 254 254Reclassification adjustment for losses included in net income, net
of tax of $ 26 million ..................................................................................
(35)
(35)
Minimum pension liability adjustments, net of tax of $25 million.............. (36) (36)Foreign currency translation adjustments, net of tax of $31 million ......... (146) (146)Reclassification adjustment for losses included in net income ................ (2) (2)Net unrealized gains on derivative instruments, net of tax of $(17)
million ........................................................................................................ 24 24Reclassification adjustment for losses included in net income, net
of tax of (3) $million................................................................................... 4 4
Current period change .............................................................................. 219 (36) (148) 28 63
Balance at March 31, 2004....................................................................... $ 237 $ (75) $ (432) $ (43) $ (313)
19. Shareholders’ Equity
Changes in the number of shares issued and outstanding in fiscal 2002, 2003 and 2004 are as follows: Number of shares 2002 2003 2004
Beginning balance................................................................................................................. 82,388,025 84,303,985 84,365,914Common stock issued in public and private offering............................................................. 1,800,000 — —Exercise of warrants and stock acquisition rights ................................................................. 95,383 61,929 400Common stock issued for acquisitions of minority interests of subsidiaries ......................... 20,577 — —
Ending balance...................................................................................................................... 84,303,985 84,365,914 84,366,314
Prior to October 1, 2001, the Japanese Commercial Code (the “Code”) provided that an amount equivalent to at least 10% of cash dividends paid and other cash outlays resulting from appropriation of retained earnings be appropriated to a legal reserve until such reserve equaled 25% of issued capital. The Code, amended effective on October 1, 2001, provides that an amount equivalent to at least 10% of cash dividends paid and other cash outlays resulting from appropriation of retained earnings be appropriated to the legal reserve until the aggregate amount of the additional paid-in capital and the legal reserve equals 25% of the issued capital. The Code also provides that both additional paid-in capital and the legal reserve are not available for cash dividends but may be used to reduce a capital deficit and may be reduced (in the case of the latter, in aggregate, the remainder after such reduction should not be less than 25% of the issued capital and a resolution of a general meeting of shareholders is required), or may be capitalized by resolution of the Board of Directors.
The Code provides that at least one-half of the issue price of new shares be included in common stock. In conformity therewith, the Company has divided the principal amount of bonds converted into common stock and proceeds received from the issuance of common stock, including the exercise of warrants, equally between common stock and additional paid-in capital by resolution of the Board of Directors.
The Board of Directors resolved in May 2004 that total of ¥2,092 million ($20 million) dividend shall be distributed to the shareholders of record as of March 31, 2004. The liability for declared dividends and related impact on shareholder’s equity are accounted for in the period of such board of directors’ resolution.
The amount available for dividends under the Code is calculated based on the amount recorded in the Company’s non-consolidated financial statements prepared in accordance with accounting principles generally accepted in Japan, and there are restrictions on the payment of dividends relating to net unrealized gains on investment in securities and the earnings impact of derivatives, amounting to ¥20,340 million ($192 million) as of March 31, 2004. As a result, the amount available for dividends is amounted to ¥101,197 million ($957 million) as of March 31, 2004.
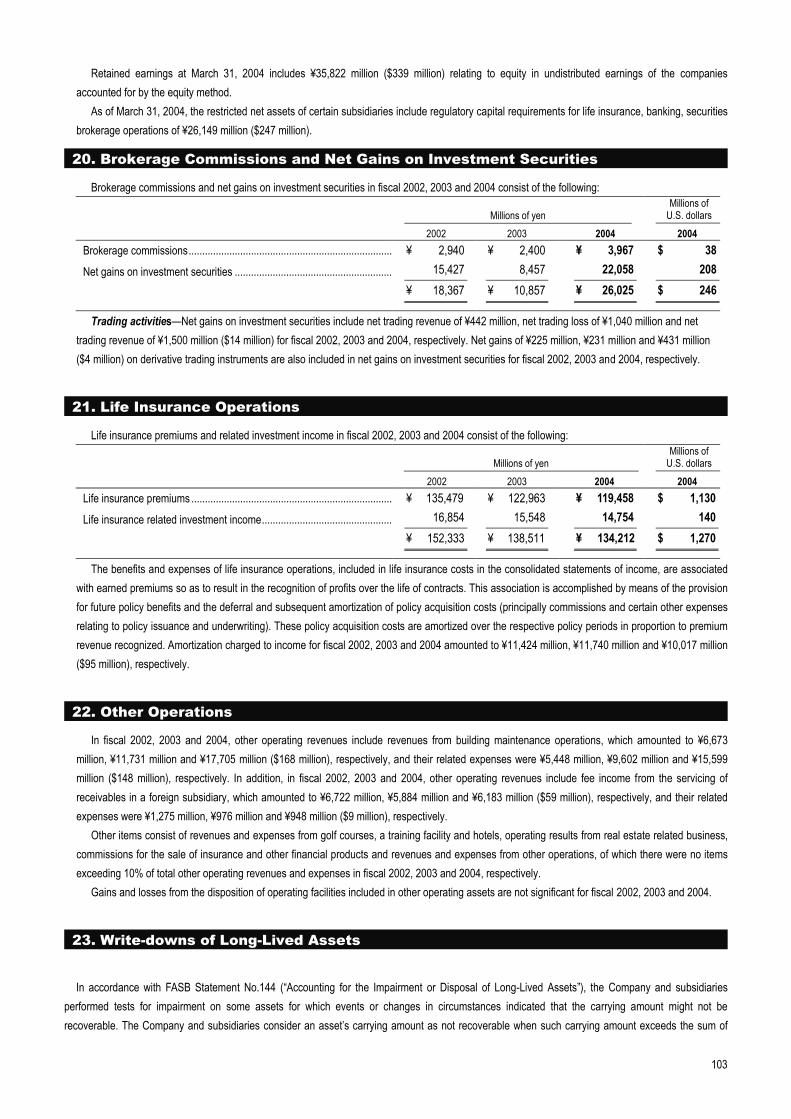
103
Retained earnings at March 31, 2004 includes ¥35,822 million ($339 million) relating to equity in undistributed earnings of the companies accounted for by the equity method.
As of March 31, 2004, the restricted net assets of certain subsidiaries include regulatory capital requirements for life insurance, banking, securities brokerage operations of ¥26,149 million ($247 million).
20. Brokerage Commissions and Net Gains on Investment Securities
Brokerage commissions and net gains on investment securities in fiscal 2002, 2003 and 2004 consist of the following:
Millions of yen Millions of
U.S. dollars 2002 2003 2004 2004 Brokerage commissions........................................................................... ¥ 2,940 ¥ 2,400 ¥ 3,967 $ 38Net gains on investment securities .......................................................... 15,427 8,457 22,058 208
¥ 18,367 ¥ 10,857 ¥ 26,025 $ 246
Trading activities—Net gains on investment securities include net trading revenue of ¥442 million, net trading loss of ¥1,040 million and net trading revenue of ¥1,500 million ($14 million) for fiscal 2002, 2003 and 2004, respectively. Net gains of ¥225 million, ¥231 million and ¥431 million ($4 million) on derivative trading instruments are also included in net gains on investment securities for fiscal 2002, 2003 and 2004, respectively.
21. Life Insurance Operations
Life insurance premiums and related investment income in fiscal 2002, 2003 and 2004 consist of the following:
Millions of yen Millions of
U.S. dollars 2002 2003 2004 2004 Life insurance premiums .......................................................................... ¥ 135,479 ¥ 122,963 ¥ 119,458 $ 1,130Life insurance related investment income................................................ 16,854 15,548 14,754 140
¥ 152,333 ¥ 138,511 ¥ 134,212 $ 1,270
The benefits and expenses of life insurance operations, included in life insurance costs in the consolidated statements of income, are associated with earned premiums so as to result in the recognition of profits over the life of contracts. This association is accomplished by means of the provision for future policy benefits and the deferral and subsequent amortization of policy acquisition costs (principally commissions and certain other expenses relating to policy issuance and underwriting). These policy acquisition costs are amortized over the respective policy periods in proportion to premium revenue recognized. Amortization charged to income for fiscal 2002, 2003 and 2004 amounted to ¥11,424 million, ¥11,740 million and ¥10,017 million ($95 million), respectively.
22. Other Operations
In fiscal 2002, 2003 and 2004, other operating revenues include revenues from building maintenance operations, which amounted to ¥6,673 million, ¥11,731 million and ¥17,705 million ($168 million), respectively, and their related expenses were ¥5,448 million, ¥9,602 million and ¥15,599 million ($148 million), respectively. In addition, in fiscal 2002, 2003 and 2004, other operating revenues include fee income from the servicing of receivables in a foreign subsidiary, which amounted to ¥6,722 million, ¥5,884 million and ¥6,183 million ($59 million), respectively, and their related expenses were ¥1,275 million, ¥976 million and ¥948 million ($9 million), respectively.
Other items consist of revenues and expenses from golf courses, a training facility and hotels, operating results from real estate related business, commissions for the sale of insurance and other financial products and revenues and expenses from other operations, of which there were no items exceeding 10% of total other operating revenues and expenses in fiscal 2002, 2003 and 2004, respectively.
Gains and losses from the disposition of operating facilities included in other operating assets are not significant for fiscal 2002, 2003 and 2004.
23. Write-downs of Long-Lived Assets
In accordance with FASB Statement No.144 (“Accounting for the Impairment or Disposal of Long-Lived Assets”), the Company and subsidiaries
performed tests for impairment on some assets for which events or changes in circumstances indicated that the carrying amount might not be recoverable. The Company and subsidiaries consider an asset’s carrying amount as not recoverable when such carrying amount exceeds the sum of
104
undiscounted cash flows expected to result from the use and eventual disposition of the asset. When it is determined that an asset’s carrying amount is not recoverable, an impairment loss is measured as the amount by which the carrying amount exceeds the asset’s estimated fair value. Fair value was calculated based on recent transactions involving sales of similar assets, by independent third party appraisals, appraisals prepared internally by the Company’s own staff of appraisers or other valuation techniques to estimate fair value. During fiscal 2002, 2003 and 2004, the Company and certain subsidiaries recognized impairment losses for differences between long-lived asset carrying values and estimated fair values in the amount of ¥2,716 million, ¥50,682 million and ¥12,345 million ($117 million), respectively, which are reflected as write-downs of long-lived assets. The losses of ¥8,052 million ($76 million) were included in the real estate segment, ¥3,019 million ($29 million) were included in the Americas’ segment and ¥143 million ($1 million) were included in the corporate financial services segment respectively, remaining ¥1,131 million ($11 million) of losses was recorded separately from segment information for assets considered corporate assets in the year ended March 31, 2004. The detail of significant write-downs is as follows. Golf courses—At the end of fiscal 2002, the prices of individual golf memberships were rising and no impairment losses were recorded during the year ended March 31, 2002. However, in fiscal 2003, after continuing to rise for a few months, the prices of individual golf course memberships fell steeply. Further, the fair value of individual golf courses fell during the year and competition resulted in the reduction in play fees at many courses. Certain subsidiaries reassessed, in some cases with the assistance of outside consultants, the expected future cash flows for all of the golf courses they own. Certain subsidiaries determined that the expected future cash flow for four golf courses was less than current carrying amount and wrote these golf courses down to their estimated fair value resulting in write-downs of long-lived assets of ¥25,270 million in the year ended March 31, 2003. In fiscal 2004, certain subsidiaries performed tests for impairment at four golf courses having indications that their cash flows had declined due to competition with surrounding golf courses, which resulted in the decrease in the number of visitors and playing fees. As results of the tests, certain subsidiaries have determined that the expected future cash flow was less than the current carrying value for two golf courses. Estimated fair values which were reassessed by independent third party appraisals, had been determined to be less than the current carrying value, and certain subsidiaries have written these two golf courses down to their estimated fair values resulting in write-downs of long-lived assets of ¥3,473 million ($33 million). Corporate Dormitories—The Company and a subsidiary have a business activity that consists of leasing corporate dormitory buildings to major corporations in Japan. During the year ended March 31, 2003, ¥3,137 million of write-downs for several dormitory properties were recorded, due to the deterioration of terms and conditions of lease contract between those corporations and the Company or a subsidiary. During the year ended March 31, 2004, some lease contracts with corporate customers were restructured at lower rental rates or expired without being renewed, due to cutbacks made by certain corporate customers of their welfare programs and relating costs. The Company and a subsidiary performed tests for impairment on all of dormitory buildings and have determined that expected future cash flows are less than the current carrying amounts for several dormitory properties. As results of the tests, the Company and a subsidiary have written these buildings down to their estimated fair value resulting in write-downs of long-lived assets of ¥2,071 million ($19 million) in the year ended March 31, 2004. Office Buildings—During the year ended March 31, 2003, ¥7,257 million of write-downs were recorded, due to decline in current rental rates. During fiscal 2004, business environments of office buildings have recovered slightly and rental rates have stopped declining in certain areas, but this trend did not spread to many other local cities. The Company and its subsidiaries performed tests for impairment. As results of the tests, the Company has determined that the expected future cash flow was less than the current carrying value and has written an office building down to the estimated fair value resulting in write-down of long-lived asset of ¥766 million ($7 million). Hotel properties and Commercial Complex—During the year ended March 31, 2003, ¥4,910 million of write-downs were recorded due to the decline in occupancy rates at several of the hotel properties owned by the Company and certain subsidiaries. During fiscal 2004, the Company and certain subsidiaries recorded no impairment losses on the hotel properties. However a subsidiary in the United State has determined that there was a significant decline in the expected future cash flow generated from a certain commercial complex in the redevelopment area due to changes of the development project. Accordingly the subsidiary has written this property down to the estimated fair value resulting in write-down of ¥3,019 million ($29 million). Condominiums—During the year ended March 31, 2003, ¥6,480 million of write-downs for approximately 540 units were recorded due to the decline in the expected cash flow by each unit. During the year ended March 31, 2004, the Company tested for impairment based on cash flow information by each unit and has written these condominiums down to their estimated fair value resulting in write-downs of long-lived assets of ¥915 million ($9 million) for approximately 160 units.
Others—During the year ended March 31, 2002 and 2003, the Company and certain subsidiaries recorded ¥2,716 million and ¥3,628 million of write-downs of long-lived assets, respectively, for other long-lived assets including developed and undeveloped land. During the year ended March 31, 2004, the Company and certain subsidiaries recorded impairment losses of ¥2,101 million ($20 million) for properties due to the continuous decline in the land value of local cities.
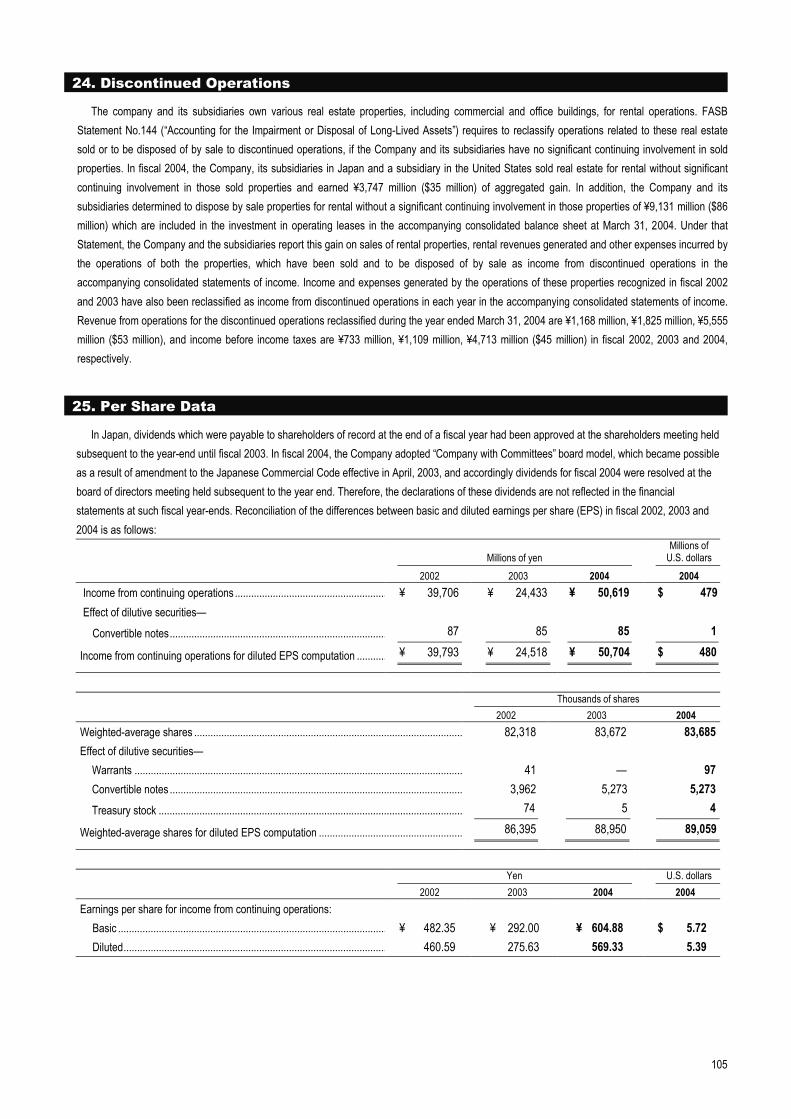
105
24. Discontinued Operations
The company and its subsidiaries own various real estate properties, including commercial and office buildings, for rental operations. FASB Statement No.144 (“Accounting for the Impairment or Disposal of Long-Lived Assets”) requires to reclassify operations related to these real estate sold or to be disposed of by sale to discontinued operations, if the Company and its subsidiaries have no significant continuing involvement in sold properties. In fiscal 2004, the Company, its subsidiaries in Japan and a subsidiary in the United States sold real estate for rental without significant continuing involvement in those sold properties and earned ¥3,747 million ($35 million) of aggregated gain. In addition, the Company and its subsidiaries determined to dispose by sale properties for rental without a significant continuing involvement in those properties of ¥9,131 million ($86 million) which are included in the investment in operating leases in the accompanying consolidated balance sheet at March 31, 2004. Under that Statement, the Company and the subsidiaries report this gain on sales of rental properties, rental revenues generated and other expenses incurred by the operations of both the properties, which have been sold and to be disposed of by sale as income from discontinued operations in the accompanying consolidated statements of income. Income and expenses generated by the operations of these properties recognized in fiscal 2002 and 2003 have also been reclassified as income from discontinued operations in each year in the accompanying consolidated statements of income. Revenue from operations for the discontinued operations reclassified during the year ended March 31, 2004 are ¥1,168 million, ¥1,825 million, ¥5,555 million ($53 million), and income before income taxes are ¥733 million, ¥1,109 million, ¥4,713 million ($45 million) in fiscal 2002, 2003 and 2004, respectively.
25. Per Share Data
In Japan, dividends which were payable to shareholders of record at the end of a fiscal year had been approved at the shareholders meeting held subsequent to the year-end until fiscal 2003. In fiscal 2004, the Company adopted “Company with Committees” board model, which became possible as a result of amendment to the Japanese Commercial Code effective in April, 2003, and accordingly dividends for fiscal 2004 were resolved at the board of directors meeting held subsequent to the year end. Therefore, the declarations of these dividends are not reflected in the financial statements at such fiscal year-ends. Reconciliation of the differences between basic and diluted earnings per share (EPS) in fiscal 2002, 2003 and 2004 is as follows:
Millions of yen Millions of
U.S. dollars 2002 2003 2004 2004 Income from continuing operations ........................................................ ¥ 39,706 ¥ 24,433 ¥ 50,619 $ 479Effect of dilutive securities—
Convertible notes................................................................................ 87 85 85 1
Income from continuing operations for diluted EPS computation ........... ¥ 39,793 ¥ 24,518 ¥ 50,704 $ 480
Thousands of shares
2002 2003 2004 Weighted-average shares ................................................................................................... 82,318 83,672 83,685Effect of dilutive securities—
Warrants ......................................................................................................................... 41 — 97Convertible notes ............................................................................................................ 3,962 5,273 5,273Treasury stock ................................................................................................................ 74 5 4
Weighted-average shares for diluted EPS computation ..................................................... 86,395 88,950 89,059
Yen U.S. dollars
2002 2003 2004 2004 Earnings per share for income from continuing operations:
Basic ................................................................................................... ¥ 482.35 ¥ 292.00 ¥ 604.88 $ 5.72 Diluted................................................................................................. 460.59 275.63 569.33 5.39
106
26. Derivative Financial Instruments and Hedging
The Company and its subsidiaries adopted FASB Statement No. 133 on April 1, 2001. (a) Risk management policy
The Company and its subsidiaries manage interest rate risk through asset liability management systems. The Company and its subsidiaries use derivative financial instruments to hedge interest rate risk and avoid changes in interest rates having a significant adverse effect. As a result of interest rate fluctuations, the fair value of hedged assets and liabilities will appreciate or depreciate. However, such appreciation or depreciation will generally be offset by using derivative financial instruments as hedging instruments. Derivative financial instruments that the Company and its subsidiaries use as part of the interest risk management include interest rate swaps and interest rate caps.
The Company and its subsidiaries employ foreign currency borrowings, foreign exchange forward contracts, and foreign currency swap agreements to hedge risks that are associated with certain transactions and investments denominated in foreign currencies due to the potential for changes in exchange rates. Similarly, in general, overseas subsidiaries structure their liabilities to match the currency-denomination of assets in each region.
By using derivative instruments, the Company and its subsidiaries are exposed to credit risk in the event of nonperformance by counterparties. The Company and its subsidiaries attempt to manage the credit risk by carefully evaluating the quality of counterparties in advance and regularly monitoring counterparties and derivative transactions after contracts have been concluded. (b) Cash flow hedges
The Company and its subsidiaries designate interest rate swap agreements, foreign currency swap agreements and foreign exchange forward contracts as cash flow hedges for variability of cash flows originating from floating rate borrowings and forecasted transactions. The interest rate swap agreements outstanding as of March 31, 2004 mature at various dates through 2009. Net losses on derivative contracts that were reclassified from other comprehensive loss into earnings through other operating expenses and other operating revenues were ¥1,914 million, ¥784 million and ¥382 million ($4 million) during fiscal 2002, 2003 and 2004, respectively. Net losses of ¥224 million, ¥124 million and net gains of ¥19 million ($0 million), which represents the total ineffectiveness of cash flow hedges, were recorded in earnings, through other operating expenses and other operating revenues, for fiscal 2002, 2003 and 2004, respectively. Approximately ¥1,558 million ($15 million) of net derivative losses included in accumulated other comprehensive loss, net of applicable income taxes at March 31, 2004 will be reclassified into earnings through other operating expenses within fiscal 2005. (c) Fair value hedges
The Company and its subsidiaries use financial instruments designated as fair value hedges to hedge their exposure to interest rate risk and foreign currency exchange risk. The Company and its subsidiaries designate foreign currency swap agreements and foreign exchange forward contracts to minimize foreign currency exposures on operating assets including lease receivables, loan receivables and borrowings. One subsidiary hedges a portion of the interest rate exposure of the fair values of certain asset-backed securities with fixed interest rates using sales of futures and forward contracts on U.S. treasury securities. Certain subsidiaries, which issued medium-term notes with fixed interest rates, use interest rate swap contracts to hedge interest rate exposure of the fair values of these medium-term notes. In cases where the medium-term notes were denominated in other than the subsidiaries’ local currency, foreign currency swap agreements are used to hedge foreign exchange rate exposure. For fiscal 2002, 2003 and 2004, a gain of ¥780 million, ¥0 million and ¥3 million ($0 million) of hedge ineffectiveness associated with instruments designated as fair value hedges were recorded in earnings through other operating expenses and other operating revenues, respectively. (d) Hedges of net investment in foreign operations
The Company uses foreign exchange forward contracts, foreign currency swap agreements and borrowings denominated in the subsidiaries’ local currencies to hedge the foreign currency exposure of the net investment in foreign subsidiaries. The gains and losses of these hedging instruments were recorded in foreign currency translation adjustments, which is a part of accumulated other comprehensive income (loss). The net gain or loss of foreign currency translation adjustments for fiscal 2002, 2003 and 2004 were a loss of ¥4,212 million, a gain of ¥5,052 million and ¥9,010 million ($85 million), respectively. (e) Trading and other derivatives
Certain subsidiaries engage in trading activities with various future contracts. The Company and certain subsidiaries entered into foreign currency swap agreements, interest rate swap agreements, caps, collars and foreign exchange forward contracts for risk management purposes but not qualified for hedge accounting under FASB Statement No. 133. In accordance with FASB Statement No. 133, conversion options were bifurcated from the Company and certain subsidiaries’ convertible bonds and are recorded as stand-alone derivative contracts. At March 31, 2003 and 2004, the total face amounts were ¥82,000 million and ¥29,735 million ($281 million), respectively, and the fair value of conversion option were ¥187 million and ¥910 million ($9 million), respectively.
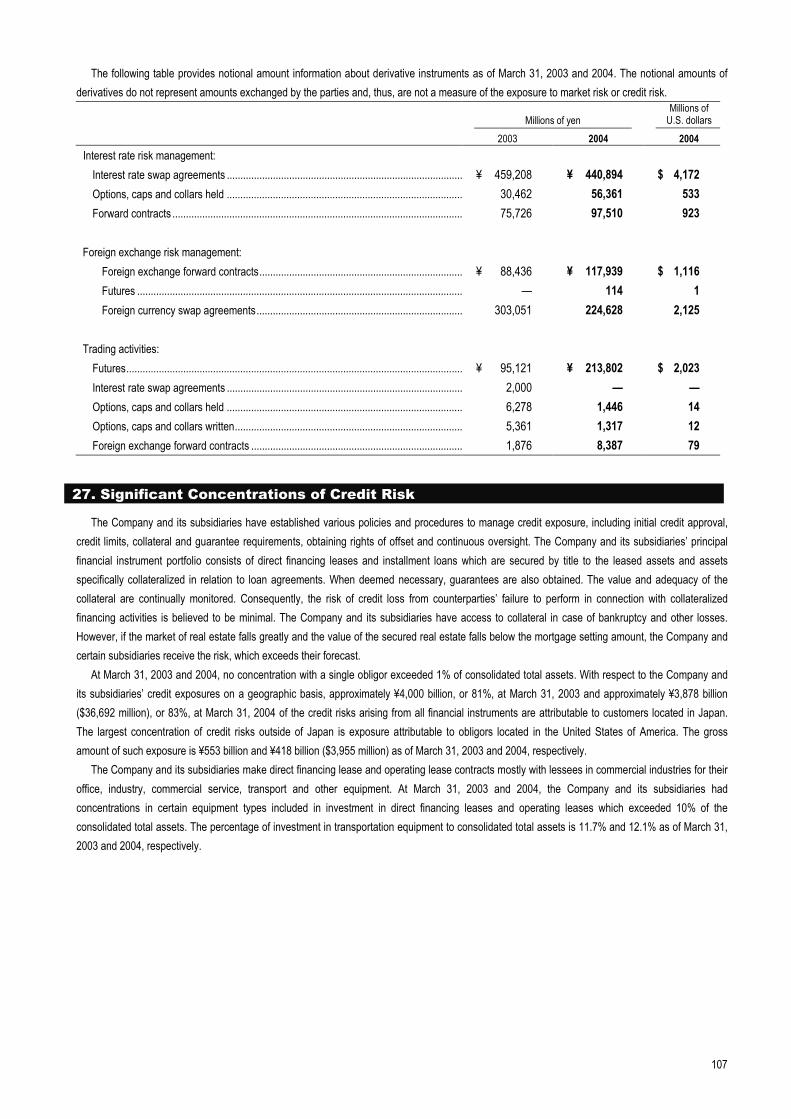
107
The following table provides notional amount information about derivative instruments as of March 31, 2003 and 2004. The notional amounts of derivatives do not represent amounts exchanged by the parties and, thus, are not a measure of the exposure to market risk or credit risk.
Millions of yen Millions of
U.S. dollars 2003 2004 2004 Interest rate risk management:
Interest rate swap agreements ....................................................................................... ¥ 459,208 ¥ 440,894 $ 4,172 Options, caps and collars held ....................................................................................... 30,462 56,361 533 Forward contracts ........................................................................................................... 75,726 97,510 923
Foreign exchange risk management: Foreign exchange forward contracts........................................................................... ¥ 88,436 ¥ 117,939 $ 1,116 Futures ........................................................................................................................ — 114 1 Foreign currency swap agreements............................................................................ 303,051 224,628 2,125
Trading activities: Futures............................................................................................................................ ¥ 95,121 ¥ 213,802 $ 2,023 Interest rate swap agreements ....................................................................................... 2,000 — — Options, caps and collars held ....................................................................................... 6,278 1,446 14 Options, caps and collars written.................................................................................... 5,361 1,317 12 Foreign exchange forward contracts .............................................................................. 1,876 8,387 79
27. Significant Concentrations of Credit Risk
The Company and its subsidiaries have established various policies and procedures to manage credit exposure, including initial credit approval, credit limits, collateral and guarantee requirements, obtaining rights of offset and continuous oversight. The Company and its subsidiaries’ principal financial instrument portfolio consists of direct financing leases and installment loans which are secured by title to the leased assets and assets specifically collateralized in relation to loan agreements. When deemed necessary, guarantees are also obtained. The value and adequacy of the collateral are continually monitored. Consequently, the risk of credit loss from counterparties’ failure to perform in connection with collateralized financing activities is believed to be minimal. The Company and its subsidiaries have access to collateral in case of bankruptcy and other losses. However, if the market of real estate falls greatly and the value of the secured real estate falls below the mortgage setting amount, the Company and certain subsidiaries receive the risk, which exceeds their forecast.
At March 31, 2003 and 2004, no concentration with a single obligor exceeded 1% of consolidated total assets. With respect to the Company and its subsidiaries’ credit exposures on a geographic basis, approximately ¥4,000 billion, or 81%, at March 31, 2003 and approximately ¥3,878 billion ($36,692 million), or 83%, at March 31, 2004 of the credit risks arising from all financial instruments are attributable to customers located in Japan. The largest concentration of credit risks outside of Japan is exposure attributable to obligors located in the United States of America. The gross amount of such exposure is ¥553 billion and ¥418 billion ($3,955 million) as of March 31, 2003 and 2004, respectively.
The Company and its subsidiaries make direct financing lease and operating lease contracts mostly with lessees in commercial industries for their office, industry, commercial service, transport and other equipment. At March 31, 2003 and 2004, the Company and its subsidiaries had concentrations in certain equipment types included in investment in direct financing leases and operating leases which exceeded 10% of the consolidated total assets. The percentage of investment in transportation equipment to consolidated total assets is 11.7% and 12.1% as of March 31, 2003 and 2004, respectively.
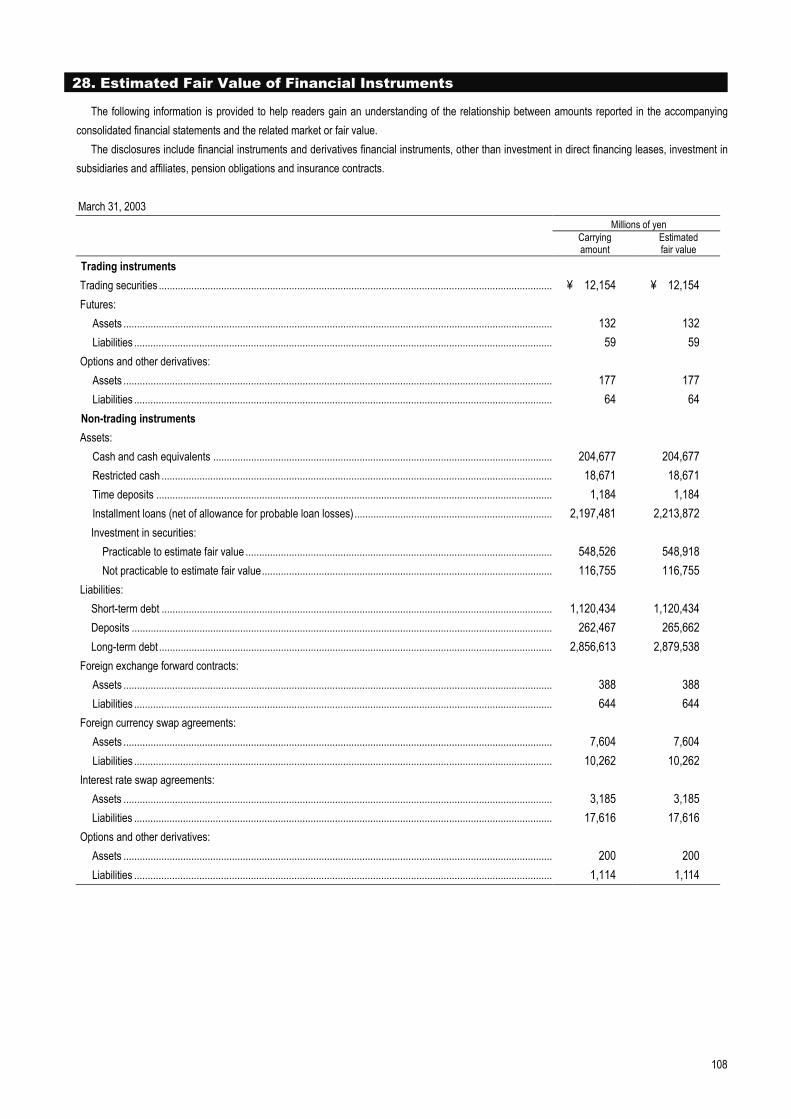
108
28. Estimated Fair Value of Financial Instruments
The following information is provided to help readers gain an understanding of the relationship between amounts reported in the accompanying consolidated financial statements and the related market or fair value.
The disclosures include financial instruments and derivatives financial instruments, other than investment in direct financing leases, investment in subsidiaries and affiliates, pension obligations and insurance contracts.
March 31, 2003 Millions of yen
Carrying amount
Estimated fair value
Trading instruments Trading securities ................................................................................................................................................. ¥ 12,154 ¥ 12,154 Futures:
Assets .............................................................................................................................................................. 132 132 Liabilities .......................................................................................................................................................... 59 59
Options and other derivatives: Assets .............................................................................................................................................................. 177 177 Liabilities .......................................................................................................................................................... 64 64
Non-trading instruments Assets:
Cash and cash equivalents ............................................................................................................................. 204,677 204,677 Restricted cash ................................................................................................................................................ 18,671 18,671 Time deposits .................................................................................................................................................. 1,184 1,184 Installment loans (net of allowance for probable loan losses)......................................................................... 2,197,481 2,213,872 Investment in securities:
Practicable to estimate fair value ................................................................................................................. 548,526 548,918 Not practicable to estimate fair value........................................................................................................... 116,755 116,755
Liabilities: Short-term debt ................................................................................................................................................ 1,120,434 1,120,434 Deposits ........................................................................................................................................................... 262,467 265,662 Long-term debt ................................................................................................................................................. 2,856,613 2,879,538
Foreign exchange forward contracts: Assets .............................................................................................................................................................. 388 388 Liabilities .......................................................................................................................................................... 644 644
Foreign currency swap agreements: Assets .............................................................................................................................................................. 7,604 7,604 Liabilities .......................................................................................................................................................... 10,262 10,262
Interest rate swap agreements: Assets .............................................................................................................................................................. 3,185 3,185 Liabilities .......................................................................................................................................................... 17,616 17,616
Options and other derivatives: Assets .............................................................................................................................................................. 200 200 Liabilities .......................................................................................................................................................... 1,114 1,114
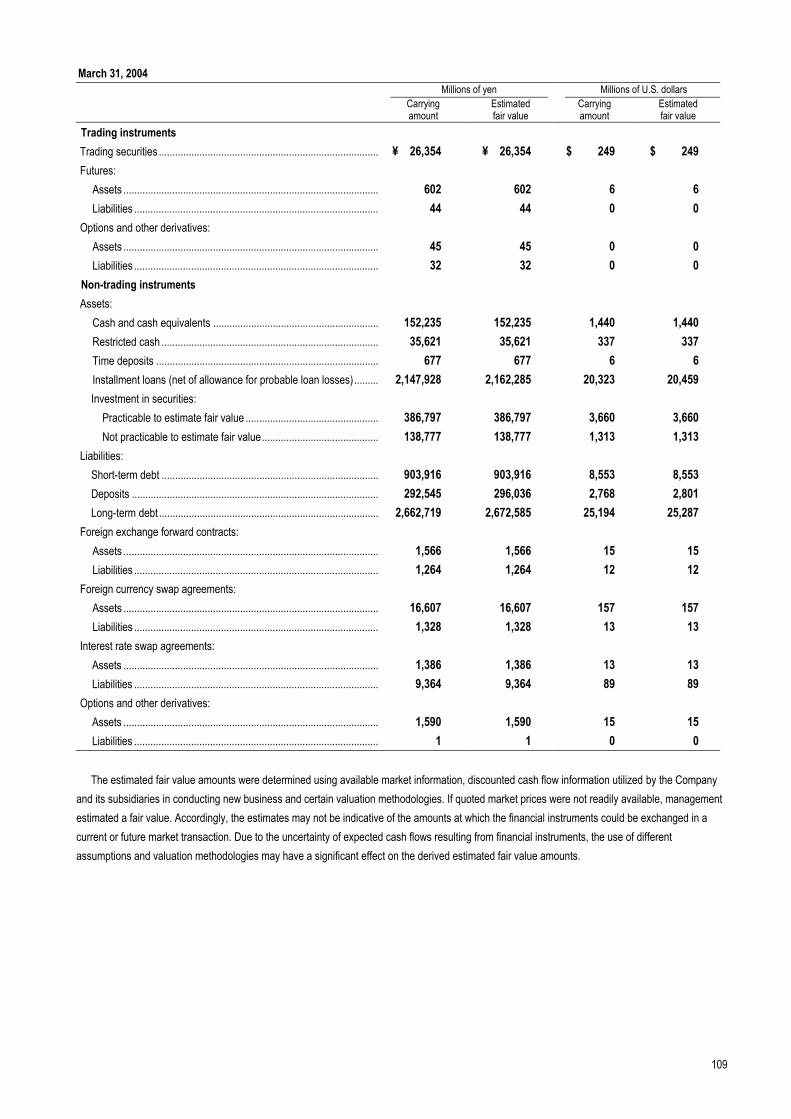
109
March 31, 2004 Millions of yen Millions of U.S. dollars
Carrying amount
Estimated fair value
Carrying amount
Estimated fair value
Trading instruments Trading securities ................................................................................. ¥ 26,354 ¥ 26,354 $ 249 $ 249 Futures:
Assets .............................................................................................. 602 602 6 6 Liabilities .......................................................................................... 44 44 0 0
Options and other derivatives: Assets .............................................................................................. 45 45 0 0 Liabilities .......................................................................................... 32 32 0 0
Non-trading instruments Assets:
Cash and cash equivalents ............................................................. 152,235 152,235 1,440 1,440 Restricted cash ................................................................................ 35,621 35,621 337 337 Time deposits .................................................................................. 677 677 6 6 Installment loans (net of allowance for probable loan losses)......... 2,147,928 2,162,285 20,323 20,459 Investment in securities:
Practicable to estimate fair value ................................................. 386,797 386,797 3,660 3,660 Not practicable to estimate fair value........................................... 138,777 138,777 1,313 1,313
Liabilities: Short-term debt ................................................................................ 903,916 903,916 8,553 8,553 Deposits ........................................................................................... 292,545 296,036 2,768 2,801 Long-term debt ................................................................................. 2,662,719 2,672,585 25,194 25,287
Foreign exchange forward contracts: Assets .............................................................................................. 1,566 1,566 15 15 Liabilities .......................................................................................... 1,264 1,264 12 12
Foreign currency swap agreements: Assets .............................................................................................. 16,607 16,607 157 157 Liabilities .......................................................................................... 1,328 1,328 13 13
Interest rate swap agreements: Assets .............................................................................................. 1,386 1,386 13 13 Liabilities .......................................................................................... 9,364 9,364 89 89
Options and other derivatives: Assets .............................................................................................. 1,590 1,590 15 15 Liabilities .......................................................................................... 1 1 0 0 The estimated fair value amounts were determined using available market information, discounted cash flow information utilized by the Company
and its subsidiaries in conducting new business and certain valuation methodologies. If quoted market prices were not readily available, management estimated a fair value. Accordingly, the estimates may not be indicative of the amounts at which the financial instruments could be exchanged in a current or future market transaction. Due to the uncertainty of expected cash flows resulting from financial instruments, the use of different assumptions and valuation methodologies may have a significant effect on the derived estimated fair value amounts.
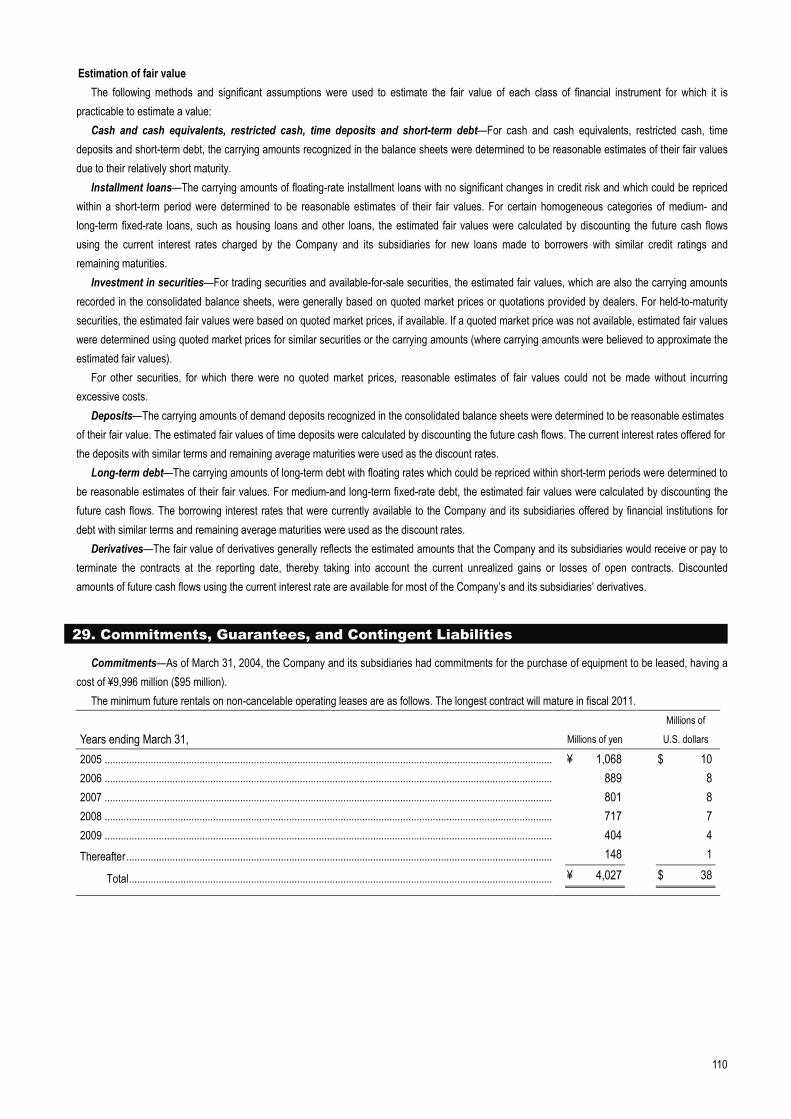
110
Estimation of fair value The following methods and significant assumptions were used to estimate the fair value of each class of financial instrument for which it is
practicable to estimate a value: Cash and cash equivalents, restricted cash, time deposits and short-term debt—For cash and cash equivalents, restricted cash, time
deposits and short-term debt, the carrying amounts recognized in the balance sheets were determined to be reasonable estimates of their fair values due to their relatively short maturity.
Installment loans—The carrying amounts of floating-rate installment loans with no significant changes in credit risk and which could be repriced within a short-term period were determined to be reasonable estimates of their fair values. For certain homogeneous categories of medium- and long-term fixed-rate loans, such as housing loans and other loans, the estimated fair values were calculated by discounting the future cash flows using the current interest rates charged by the Company and its subsidiaries for new loans made to borrowers with similar credit ratings and remaining maturities.
Investment in securities—For trading securities and available-for-sale securities, the estimated fair values, which are also the carrying amounts recorded in the consolidated balance sheets, were generally based on quoted market prices or quotations provided by dealers. For held-to-maturity securities, the estimated fair values were based on quoted market prices, if available. If a quoted market price was not available, estimated fair values were determined using quoted market prices for similar securities or the carrying amounts (where carrying amounts were believed to approximate the estimated fair values).
For other securities, for which there were no quoted market prices, reasonable estimates of fair values could not be made without incurring excessive costs.
Deposits—The carrying amounts of demand deposits recognized in the consolidated balance sheets were determined to be reasonable estimates of their fair value. The estimated fair values of time deposits were calculated by discounting the future cash flows. The current interest rates offered for the deposits with similar terms and remaining average maturities were used as the discount rates.
Long-term debt—The carrying amounts of long-term debt with floating rates which could be repriced within short-term periods were determined to be reasonable estimates of their fair values. For medium-and long-term fixed-rate debt, the estimated fair values were calculated by discounting the future cash flows. The borrowing interest rates that were currently available to the Company and its subsidiaries offered by financial institutions for debt with similar terms and remaining average maturities were used as the discount rates.
Derivatives—The fair value of derivatives generally reflects the estimated amounts that the Company and its subsidiaries would receive or pay to terminate the contracts at the reporting date, thereby taking into account the current unrealized gains or losses of open contracts. Discounted amounts of future cash flows using the current interest rate are available for most of the Company’s and its subsidiaries’ derivatives.
29. Commitments, Guarantees, and Contingent Liabilities
Commitments—As of March 31, 2004, the Company and its subsidiaries had commitments for the purchase of equipment to be leased, having a cost of ¥9,996 million ($95 million).
The minimum future rentals on non-cancelable operating leases are as follows. The longest contract will mature in fiscal 2011.
Years ending March 31, Millions of yen Millions of
U.S. dollars 2005 ..................................................................................................................................................................... ¥ 1,068 $ 102006 ..................................................................................................................................................................... 889 82007 ..................................................................................................................................................................... 801 82008 ..................................................................................................................................................................... 717 72009 ..................................................................................................................................................................... 404 4Thereafter............................................................................................................................................................. 148 1
Total............................................................................................................................................................ ¥ 4,027 $ 38
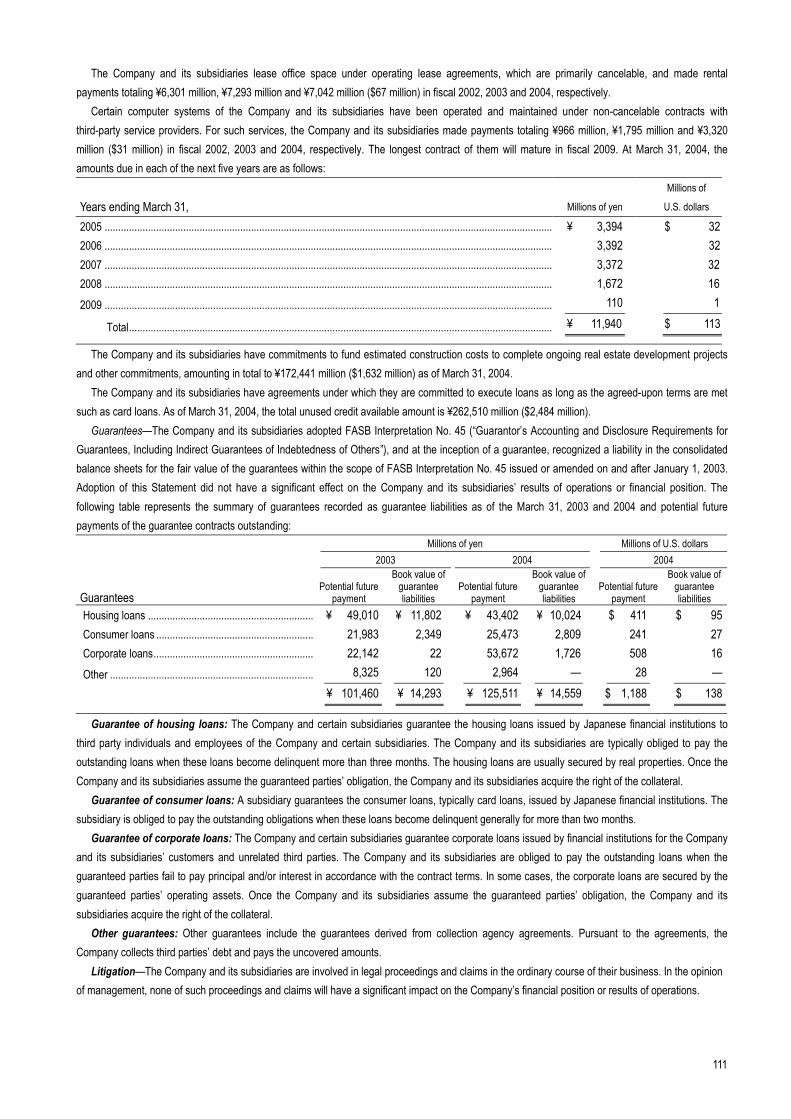
111
The Company and its subsidiaries lease office space under operating lease agreements, which are primarily cancelable, and made rental payments totaling ¥6,301 million, ¥7,293 million and ¥7,042 million ($67 million) in fiscal 2002, 2003 and 2004, respectively.
Certain computer systems of the Company and its subsidiaries have been operated and maintained under non-cancelable contracts with third-party service providers. For such services, the Company and its subsidiaries made payments totaling ¥966 million, ¥1,795 million and ¥3,320 million ($31 million) in fiscal 2002, 2003 and 2004, respectively. The longest contract of them will mature in fiscal 2009. At March 31, 2004, the amounts due in each of the next five years are as follows:
Years ending March 31, Millions of yen Millions of
U.S. dollars 2005 ..................................................................................................................................................................... ¥ 3,394 $ 322006 ..................................................................................................................................................................... 3,392 322007 ..................................................................................................................................................................... 3,372 322008 ..................................................................................................................................................................... 1,672 162009 ..................................................................................................................................................................... 110 1
Total............................................................................................................................................................ ¥ 11,940 $ 113
The Company and its subsidiaries have commitments to fund estimated construction costs to complete ongoing real estate development projects and other commitments, amounting in total to ¥172,441 million ($1,632 million) as of March 31, 2004.
The Company and its subsidiaries have agreements under which they are committed to execute loans as long as the agreed-upon terms are met such as card loans. As of March 31, 2004, the total unused credit available amount is ¥262,510 million ($2,484 million).
Guarantees—The Company and its subsidiaries adopted FASB Interpretation No. 45 (“Guarantor’s Accounting and Disclosure Requirements for Guarantees, Including Indirect Guarantees of Indebtedness of Others”), and at the inception of a guarantee, recognized a liability in the consolidated balance sheets for the fair value of the guarantees within the scope of FASB Interpretation No. 45 issued or amended on and after January 1, 2003. Adoption of this Statement did not have a significant effect on the Company and its subsidiaries’ results of operations or financial position. The following table represents the summary of guarantees recorded as guarantee liabilities as of the March 31, 2003 and 2004 and potential future payments of the guarantee contracts outstanding: Millions of yen Millions of U.S. dollars 2003 2004 2004
Guarantees Potential future
payment
Book value of guarantee liabilities
Potential future payment
Book value of guarantee liabilities
Potential future payment
Book value of guarantee liabilities
Housing loans ............................................................. ¥ 49,010 ¥ 11,802 ¥ 43,402 ¥ 10,024 $ 411 $ 95Consumer loans .......................................................... 21,983 2,349 25,473 2,809 241 27Corporate loans........................................................... 22,142 22 53,672 1,726 508 16Other ........................................................................... 8,325 120 2,964 — 28 —
¥ 101,460 ¥ 14,293 ¥ 125,511 ¥ 14,559 $ 1,188 $ 138
Guarantee of housing loans: The Company and certain subsidiaries guarantee the housing loans issued by Japanese financial institutions to third party individuals and employees of the Company and certain subsidiaries. The Company and its subsidiaries are typically obliged to pay the outstanding loans when these loans become delinquent more than three months. The housing loans are usually secured by real properties. Once the Company and its subsidiaries assume the guaranteed parties’ obligation, the Company and its subsidiaries acquire the right of the collateral.
Guarantee of consumer loans: A subsidiary guarantees the consumer loans, typically card loans, issued by Japanese financial institutions. The subsidiary is obliged to pay the outstanding obligations when these loans become delinquent generally for more than two months.
Guarantee of corporate loans: The Company and certain subsidiaries guarantee corporate loans issued by financial institutions for the Company and its subsidiaries’ customers and unrelated third parties. The Company and its subsidiaries are obliged to pay the outstanding loans when the guaranteed parties fail to pay principal and/or interest in accordance with the contract terms. In some cases, the corporate loans are secured by the guaranteed parties’ operating assets. Once the Company and its subsidiaries assume the guaranteed parties’ obligation, the Company and its subsidiaries acquire the right of the collateral.
Other guarantees: Other guarantees include the guarantees derived from collection agency agreements. Pursuant to the agreements, the Company collects third parties’ debt and pays the uncovered amounts.
Litigation—The Company and its subsidiaries are involved in legal proceedings and claims in the ordinary course of their business. In the opinion of management, none of such proceedings and claims will have a significant impact on the Company’s financial position or results of operations.
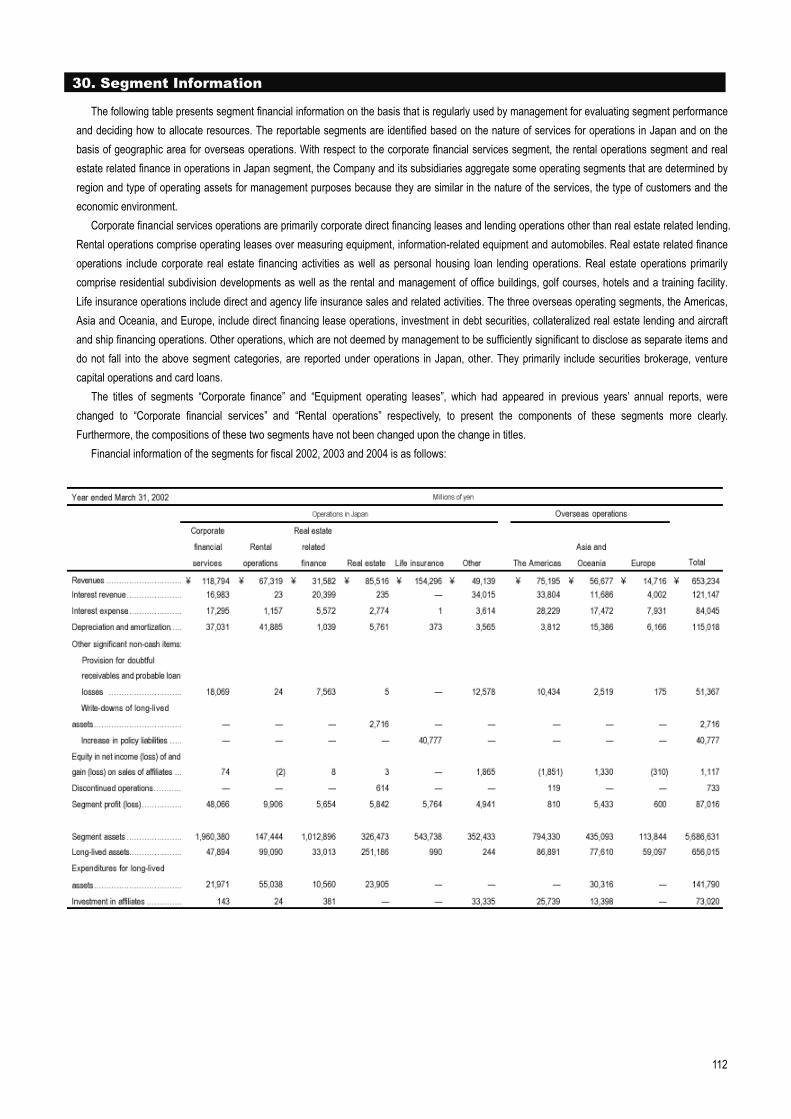
112
30. Segment Information
The following table presents segment financial information on the basis that is regularly used by management for evaluating segment performance and deciding how to allocate resources. The reportable segments are identified based on the nature of services for operations in Japan and on the basis of geographic area for overseas operations. With respect to the corporate financial services segment, the rental operations segment and real estate related finance in operations in Japan segment, the Company and its subsidiaries aggregate some operating segments that are determined by region and type of operating assets for management purposes because they are similar in the nature of the services, the type of customers and the economic environment.
Corporate financial services operations are primarily corporate direct financing leases and lending operations other than real estate related lending. Rental operations comprise operating leases over measuring equipment, information-related equipment and automobiles. Real estate related finance operations include corporate real estate financing activities as well as personal housing loan lending operations. Real estate operations primarily comprise residential subdivision developments as well as the rental and management of office buildings, golf courses, hotels and a training facility. Life insurance operations include direct and agency life insurance sales and related activities. The three overseas operating segments, the Americas, Asia and Oceania, and Europe, include direct financing lease operations, investment in debt securities, collateralized real estate lending and aircraft and ship financing operations. Other operations, which are not deemed by management to be sufficiently significant to disclose as separate items and do not fall into the above segment categories, are reported under operations in Japan, other. They primarily include securities brokerage, venture capital operations and card loans.
The titles of segments “Corporate finance” and “Equipment operating leases”, which had appeared in previous years’ annual reports, were changed to “Corporate financial services” and “Rental operations” respectively, to present the components of these segments more clearly. Furthermore, the compositions of these two segments have not been changed upon the change in titles.
Financial information of the segments for fiscal 2002, 2003 and 2004 is as follows:
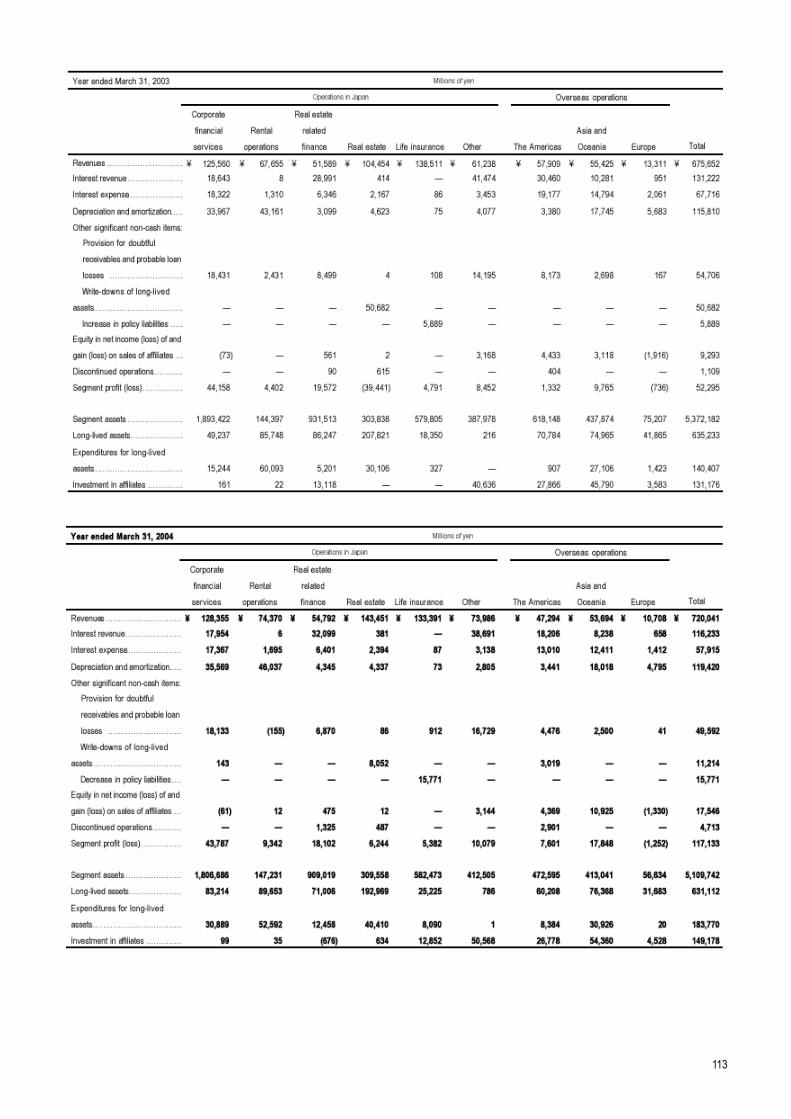
113
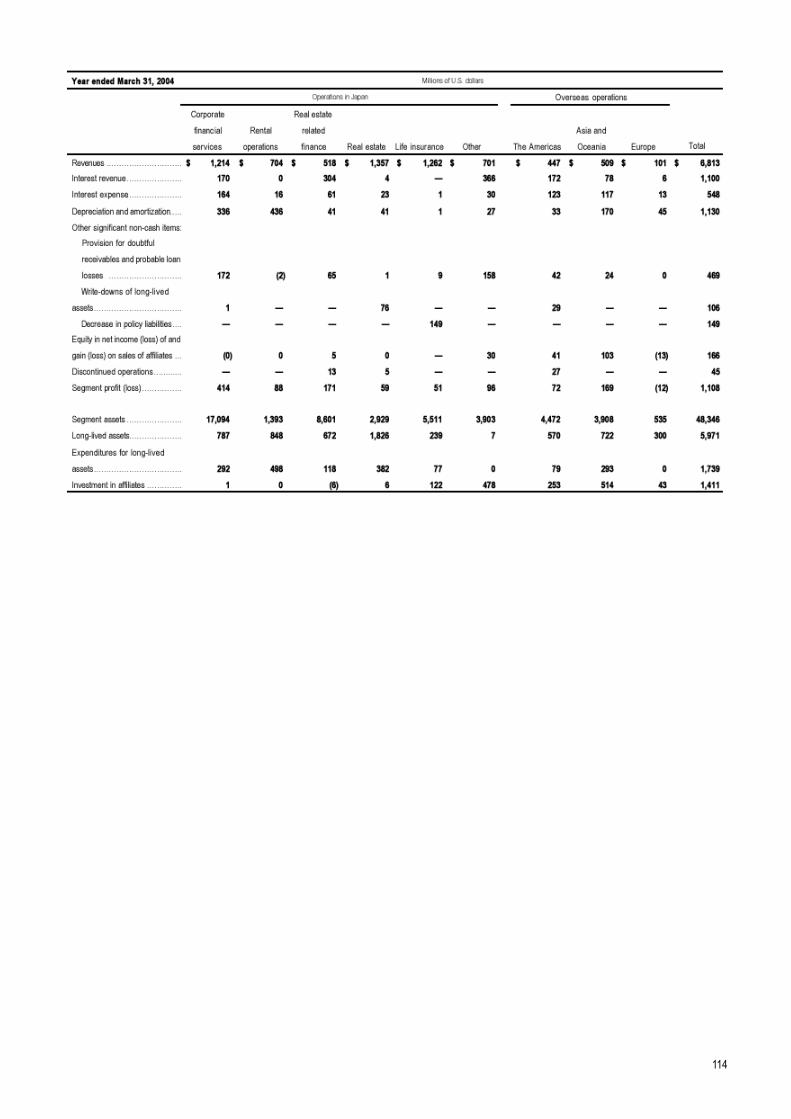
114
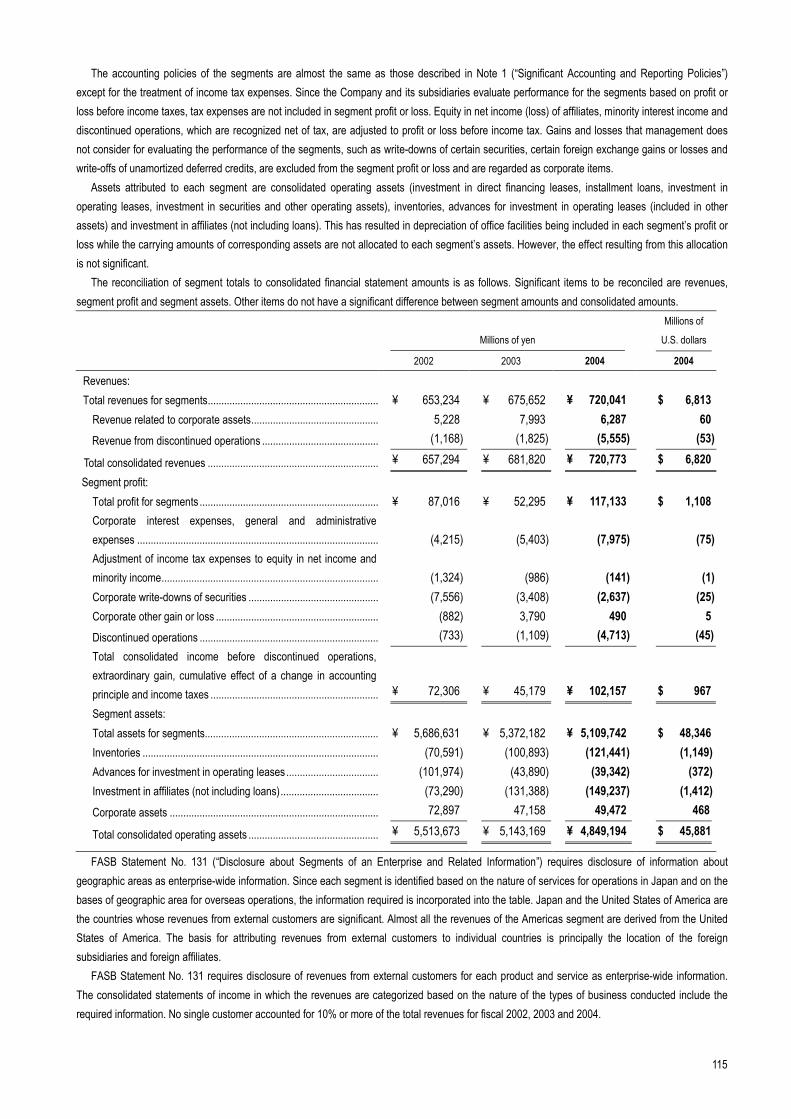
115
The accounting policies of the segments are almost the same as those described in Note 1 (“Significant Accounting and Reporting Policies”) except for the treatment of income tax expenses. Since the Company and its subsidiaries evaluate performance for the segments based on profit or loss before income taxes, tax expenses are not included in segment profit or loss. Equity in net income (loss) of affiliates, minority interest income and discontinued operations, which are recognized net of tax, are adjusted to profit or loss before income tax. Gains and losses that management does not consider for evaluating the performance of the segments, such as write-downs of certain securities, certain foreign exchange gains or losses and write-offs of unamortized deferred credits, are excluded from the segment profit or loss and are regarded as corporate items.
Assets attributed to each segment are consolidated operating assets (investment in direct financing leases, installment loans, investment in operating leases, investment in securities and other operating assets), inventories, advances for investment in operating leases (included in other assets) and investment in affiliates (not including loans). This has resulted in depreciation of office facilities being included in each segment’s profit or loss while the carrying amounts of corresponding assets are not allocated to each segment’s assets. However, the effect resulting from this allocation is not significant.
The reconciliation of segment totals to consolidated financial statement amounts is as follows. Significant items to be reconciled are revenues, segment profit and segment assets. Other items do not have a significant difference between segment amounts and consolidated amounts.
Millions of yen
Millions of
U.S. dollars
2002 2003 2004 2004
Revenues: Total revenues for segments............................................................... ¥ 653,234 ¥ 675,652 ¥ 720,041 $ 6,813
Revenue related to corporate assets............................................... 5,228 7,993 6,287 60Revenue from discontinued operations ........................................... (1,168) (1,825) (5,555) (53)
Total consolidated revenues ............................................................... ¥ 657,294 ¥ 681,820 ¥ 720,773 $ 6,820
Segment profit: Total profit for segments .................................................................. ¥ 87,016 ¥ 52,295 ¥ 117,133 $ 1,108Corporate interest expenses, general and administrative expenses ......................................................................................... (4,215) (5,403) (7,975) (75)Adjustment of income tax expenses to equity in net income and minority income................................................................................ (1,324) (986) (141) (1)Corporate write-downs of securities ................................................ (7,556) (3,408) (2,637) (25)Corporate other gain or loss ............................................................ (882) 3,790 490 5Discontinued operations .................................................................. (733) (1,109) (4,713) (45)Total consolidated income before discontinued operations, extraordinary gain, cumulative effect of a change in accounting principle and income taxes .............................................................. ¥ 72,306 ¥ 45,179 ¥ 102,157 $ 967
Segment assets: Total assets for segments................................................................ ¥ 5,686,631 ¥ 5,372,182 ¥ 5,109,742 $ 48,346Inventories ....................................................................................... (70,591) (100,893) (121,441) (1,149)Advances for investment in operating leases.................................. (101,974) (43,890) (39,342) (372)Investment in affiliates (not including loans).................................... (73,290) (131,388) (149,237) (1,412)Corporate assets ............................................................................. 72,897 47,158 49,472 468
Total consolidated operating assets ................................................ ¥ 5,513,673 ¥ 5,143,169 ¥ 4,849,194 $ 45,881
FASB Statement No. 131 (“Disclosure about Segments of an Enterprise and Related Information”) requires disclosure of information about geographic areas as enterprise-wide information. Since each segment is identified based on the nature of services for operations in Japan and on the bases of geographic area for overseas operations, the information required is incorporated into the table. Japan and the United States of America are the countries whose revenues from external customers are significant. Almost all the revenues of the Americas segment are derived from the United States of America. The basis for attributing revenues from external customers to individual countries is principally the location of the foreign subsidiaries and foreign affiliates.
FASB Statement No. 131 requires disclosure of revenues from external customers for each product and service as enterprise-wide information. The consolidated statements of income in which the revenues are categorized based on the nature of the types of business conducted include the required information. No single customer accounted for 10% or more of the total revenues for fiscal 2002, 2003 and 2004.
116
REPORT OF INDEPENDENT REGISTERED PUBLIC ACCOUNTING FIRM To the Shareholders and the Board of Directors of ORIX Corporation:
We have audited the accompanying consolidated balance sheets of ORIX Corporation (a Japanese corporation)
and its subsidiaries as of March 31, 2003 and 2004, and the related consolidated statements of income, shareholders’
equity and cash flows for each of the years in the three-year period ended March 31, 2004. These consolidated
financial statements are the responsibility of the Company’s management. Our responsibility is to express an opinion
on these consolidated financial statements based on our audits.
We conducted our audits in accordance with the standards of the Public Company Accounting Oversight Board
(United States). Those standards require that we plan and perform the audit to obtain reasonable assurance about
whether the financial statements are free of material misstatement. An audit includes examining, on a test basis,
evidence supporting the amounts and disclosures in the financial statements. An audit also includes assessing the
accounting principles used and significant estimates made by management, as well as evaluating the overall financial
statement presentation. We believe that our audits provide a reasonable basis for our opinion.
In our opinion, the consolidated financial statements referred to above present fairly, in all material respects, the
financial position of ORIX Corporation and its subsidiaries as of March 31, 2003 and 2004, and the results of their
operations and their cash flows for each of the years in the three-year period ended March 31, 2004, in conformity
with U.S. generally accepted accounting principles.
As discussed in Note 1 to the consolidated financial statements, the Company and its subsidiaries have adopted
new accounting pronouncements resulting in changes in the manner certain transactions are accounted. The method
for accounting for goodwill and intangible assets resulting from business combinations was changed with respect to
combinations consummated after June 30, 2001. As of April 1, 2002, the Company and its subsidiaries changed the
accounting for unamortized deferred credits and goodwill resulting from prior business combinations and equity
method investments.
The accompanying consolidated financial statements as of and for the year ended March 31, 2004 have been
translated into United States dollars solely for the convenience of the readers. We have recomputed the translation,
and, in our opinion, the consolidated financial statements expressed in Japanese yen have been translated into
United States dollars on the basis set forth in Note 1 (ac).
Tokyo, Japan May 7, 2004
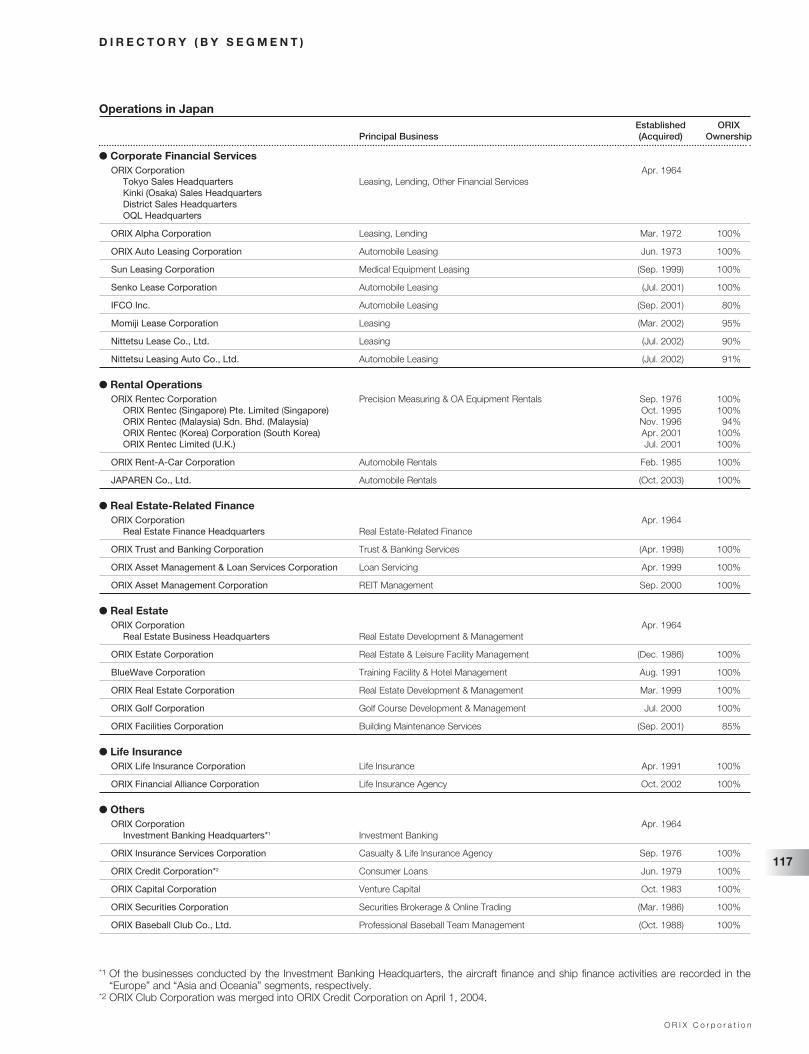
D I R E C T O R Y ( B Y S E G M E N T )
Operations in JapanEstablished ORIX
Principal Business (Acquired) Ownership
● Corporate Financial ServicesORIX Corporation Apr. 1964
Tokyo Sales Headquarters Leasing, Lending, Other Financial ServicesKinki (Osaka) Sales HeadquartersDistrict Sales HeadquartersOQL Headquarters
ORIX Alpha Corporation Leasing, Lending Mar. 1972 100%
ORIX Auto Leasing Corporation Automobile Leasing Jun. 1973 100%
Sun Leasing Corporation Medical Equipment Leasing (Sep. 1999) 100%
Senko Lease Corporation Automobile Leasing (Jul. 2001) 100%
IFCO Inc. Automobile Leasing (Sep. 2001) 80%
Momiji Lease Corporation Leasing (Mar. 2002) 95%
Nittetsu Lease Co., Ltd. Leasing (Jul. 2002) 90%
Nittetsu Leasing Auto Co., Ltd. Automobile Leasing (Jul. 2002) 91%
● Rental OperationsORIX Rentec Corporation Precision Measuring & OA Equipment Rentals Sep. 1976 100%
ORIX Rentec (Singapore) Pte. Limited (Singapore) Oct. 1995 100%ORIX Rentec (Malaysia) Sdn. Bhd. (Malaysia) Nov. 1996 94%ORIX Rentec (Korea) Corporation (South Korea) Apr. 2001 100%ORIX Rentec Limited (U.K.) Jul. 2001 100%
ORIX Rent-A-Car Corporation Automobile Rentals Feb. 1985 100%
JAPAREN Co., Ltd. Automobile Rentals (Oct. 2003) 100%
● Real Estate-Related FinanceORIX Corporation Apr. 1964
Real Estate Finance Headquarters Real Estate-Related Finance
ORIX Trust and Banking Corporation Trust & Banking Services (Apr. 1998) 100%
ORIX Asset Management & Loan Services Corporation Loan Servicing Apr. 1999 100%
ORIX Asset Management Corporation REIT Management Sep. 2000 100%
● Real EstateORIX Corporation Apr. 1964
Real Estate Business Headquarters Real Estate Development & Management
ORIX Estate Corporation Real Estate & Leisure Facility Management (Dec. 1986) 100%
BlueWave Corporation Training Facility & Hotel Management Aug. 1991 100%
ORIX Real Estate Corporation Real Estate Development & Management Mar. 1999 100%
ORIX Golf Corporation Golf Course Development & Management Jul. 2000 100%
ORIX Facilities Corporation Building Maintenance Services (Sep. 2001) 85%
● Life InsuranceORIX Life Insurance Corporation Life Insurance Apr. 1991 100%
ORIX Financial Alliance Corporation Life Insurance Agency Oct. 2002 100%
● OthersORIX Corporation Apr. 1964
Investment Banking Headquarters*1 Investment Banking
ORIX Insurance Services Corporation Casualty & Life Insurance Agency Sep. 1976 100%
ORIX Credit Corporation*2 Consumer Loans Jun. 1979 100%
ORIX Capital Corporation Venture Capital Oct. 1983 100%
ORIX Securities Corporation Securities Brokerage & Online Trading (Mar. 1986) 100%
ORIX Baseball Club Co., Ltd. Professional Baseball Team Management (Oct. 1988) 100%
*1 Of the businesses conducted by the Investment Banking Headquarters, the aircraft finance and ship finance activities are recorded in the“Europe” and “Asia and Oceania” segments, respectively.
*2 ORIX Club Corporation was merged into ORIX Credit Corporation on April 1, 2004.
O R I X C o r p o r a t i o n
117
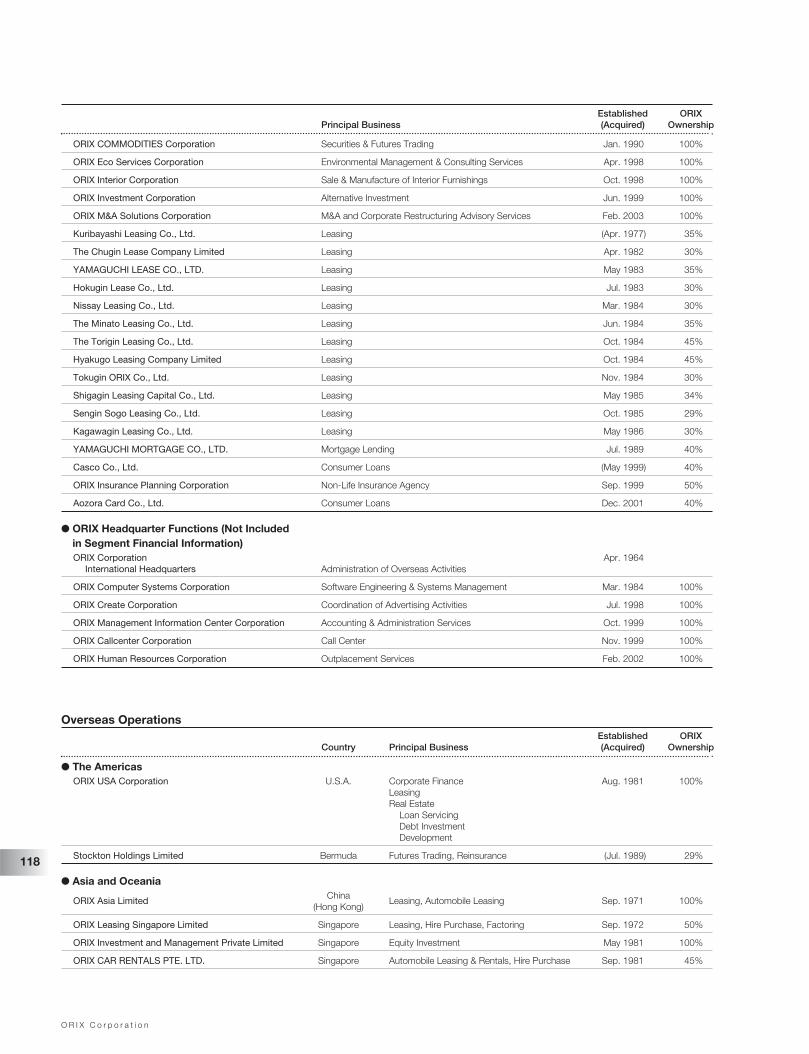
O R I X C o r p o r a t i o n
118
Established ORIX Principal Business (Acquired) Ownership
ORIX COMMODITIES Corporation Securities & Futures Trading Jan. 1990 100%
ORIX Eco Services Corporation Environmental Management & Consulting Services Apr. 1998 100%
ORIX Interior Corporation Sale & Manufacture of Interior Furnishings Oct. 1998 100%
ORIX Investment Corporation Alternative Investment Jun. 1999 100%
ORIX M&A Solutions Corporation M&A and Corporate Restructuring Advisory Services Feb. 2003 100%
Kuribayashi Leasing Co., Ltd. Leasing (Apr. 1977) 35%
The Chugin Lease Company Limited Leasing Apr. 1982 30%
YAMAGUCHI LEASE CO., LTD. Leasing May 1983 35%
Hokugin Lease Co., Ltd. Leasing Jul. 1983 30%
Nissay Leasing Co., Ltd. Leasing Mar. 1984 30%
The Minato Leasing Co., Ltd. Leasing Jun. 1984 35%
The Torigin Leasing Co., Ltd. Leasing Oct. 1984 45%
Hyakugo Leasing Company Limited Leasing Oct. 1984 45%
Tokugin ORIX Co., Ltd. Leasing Nov. 1984 30%
Shigagin Leasing Capital Co., Ltd. Leasing May 1985 34%
Sengin Sogo Leasing Co., Ltd. Leasing Oct. 1985 29%
Kagawagin Leasing Co., Ltd. Leasing May 1986 30%
YAMAGUCHI MORTGAGE CO., LTD. Mortgage Lending Jul. 1989 40%
Casco Co., Ltd. Consumer Loans (May 1999) 40%
ORIX Insurance Planning Corporation Non-Life Insurance Agency Sep. 1999 50%
Aozora Card Co., Ltd. Consumer Loans Dec. 2001 40%
● ORIX Headquarter Functions (Not Included in Segment Financial Information)ORIX Corporation Apr. 1964
International Headquarters Administration of Overseas Activities
ORIX Computer Systems Corporation Software Engineering & Systems Management Mar. 1984 100%
ORIX Create Corporation Coordination of Advertising Activities Jul. 1998 100%
ORIX Management Information Center Corporation Accounting & Administration Services Oct. 1999 100%
ORIX Callcenter Corporation Call Center Nov. 1999 100%
ORIX Human Resources Corporation Outplacement Services Feb. 2002 100%
Overseas OperationsEstablished ORIX
Country Principal Business (Acquired) Ownership
● The Americas ORIX USA Corporation U.S.A. Corporate Finance Aug. 1981 100%
LeasingReal Estate
Loan ServicingDebt InvestmentDevelopment
Stockton Holdings Limited Bermuda Futures Trading, Reinsurance (Jul. 1989) 29%
● Asia and Oceania
ORIX Asia Limited China Leasing, Automobile Leasing Sep. 1971 100%(Hong Kong)
ORIX Leasing Singapore Limited Singapore Leasing, Hire Purchase, Factoring Sep. 1972 50%
ORIX Investment and Management Private Limited Singapore Equity Investment May 1981 100%
ORIX CAR RENTALS PTE. LTD. Singapore Automobile Leasing & Rentals, Hire Purchase Sep. 1981 45%
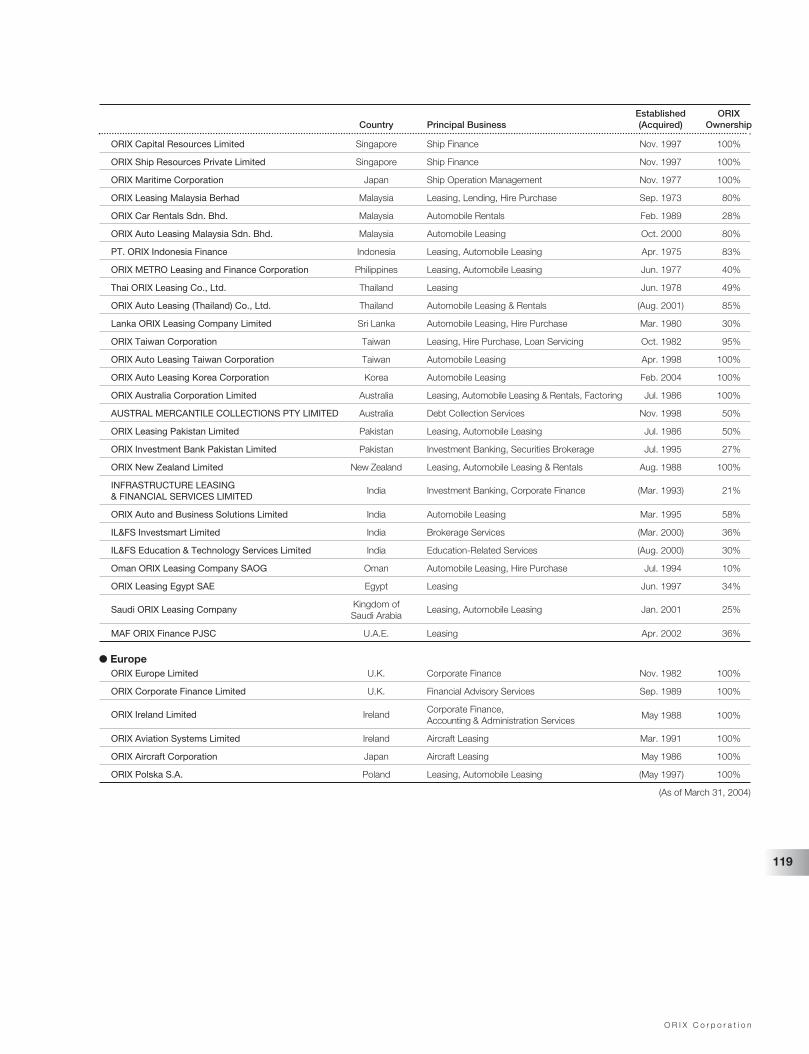
O R I X C o r p o r a t i o n
119
Established ORIXCountry Principal Business (Acquired) Ownership
ORIX Capital Resources Limited Singapore Ship Finance Nov. 1997 100%
ORIX Ship Resources Private Limited Singapore Ship Finance Nov. 1997 100%
ORIX Maritime Corporation Japan Ship Operation Management Nov. 1977 100%
ORIX Leasing Malaysia Berhad Malaysia Leasing, Lending, Hire Purchase Sep. 1973 80%
ORIX Car Rentals Sdn. Bhd. Malaysia Automobile Rentals Feb. 1989 28%
ORIX Auto Leasing Malaysia Sdn. Bhd. Malaysia Automobile Leasing Oct. 2000 80%
PT. ORIX Indonesia Finance Indonesia Leasing, Automobile Leasing Apr. 1975 83%
ORIX METRO Leasing and Finance Corporation Philippines Leasing, Automobile Leasing Jun. 1977 40%
Thai ORIX Leasing Co., Ltd. Thailand Leasing Jun. 1978 49%
ORIX Auto Leasing (Thailand) Co., Ltd. Thailand Automobile Leasing & Rentals (Aug. 2001) 85%
Lanka ORIX Leasing Company Limited Sri Lanka Automobile Leasing, Hire Purchase Mar. 1980 30%
ORIX Taiwan Corporation Taiwan Leasing, Hire Purchase, Loan Servicing Oct. 1982 95%
ORIX Auto Leasing Taiwan Corporation Taiwan Automobile Leasing Apr. 1998 100%
ORIX Auto Leasing Korea Corporation Korea Automobile Leasing Feb. 2004 100%
ORIX Australia Corporation Limited Australia Leasing, Automobile Leasing & Rentals, Factoring Jul. 1986 100%
AUSTRAL MERCANTILE COLLECTIONS PTY LIMITED Australia Debt Collection Services Nov. 1998 50%
ORIX Leasing Pakistan Limited Pakistan Leasing, Automobile Leasing Jul. 1986 50%
ORIX Investment Bank Pakistan Limited Pakistan Investment Banking, Securities Brokerage Jul. 1995 27%
ORIX New Zealand Limited New Zealand Leasing, Automobile Leasing & Rentals Aug. 1988 100%
INFRASTRUCTURE LEASING India Investment Banking, Corporate Finance (Mar. 1993) 21%& FINANCIAL SERVICES LIMITED
ORIX Auto and Business Solutions Limited India Automobile Leasing Mar. 1995 58%
IL&FS Investsmart Limited India Brokerage Services (Mar. 2000) 36%
IL&FS Education & Technology Services Limited India Education-Related Services (Aug. 2000) 30%
Oman ORIX Leasing Company SAOG Oman Automobile Leasing, Hire Purchase Jul. 1994 10%
ORIX Leasing Egypt SAE Egypt Leasing Jun. 1997 34%
Saudi ORIX Leasing Company Kingdom of Leasing, Automobile Leasing Jan. 2001 25%Saudi Arabia
MAF ORIX Finance PJSC U.A.E. Leasing Apr. 2002 36%
● EuropeORIX Europe Limited U.K. Corporate Finance Nov. 1982 100%
ORIX Corporate Finance Limited U.K. Financial Advisory Services Sep. 1989 100%
ORIX Ireland Limited Ireland Corporate Finance, Accounting & Administration Services May 1988 100%
ORIX Aviation Systems Limited Ireland Aircraft Leasing Mar. 1991 100%
ORIX Aircraft Corporation Japan Aircraft Leasing May 1986 100%
ORIX Polska S.A. Poland Leasing, Automobile Leasing (May 1997) 100%
(As of March 31, 2004)
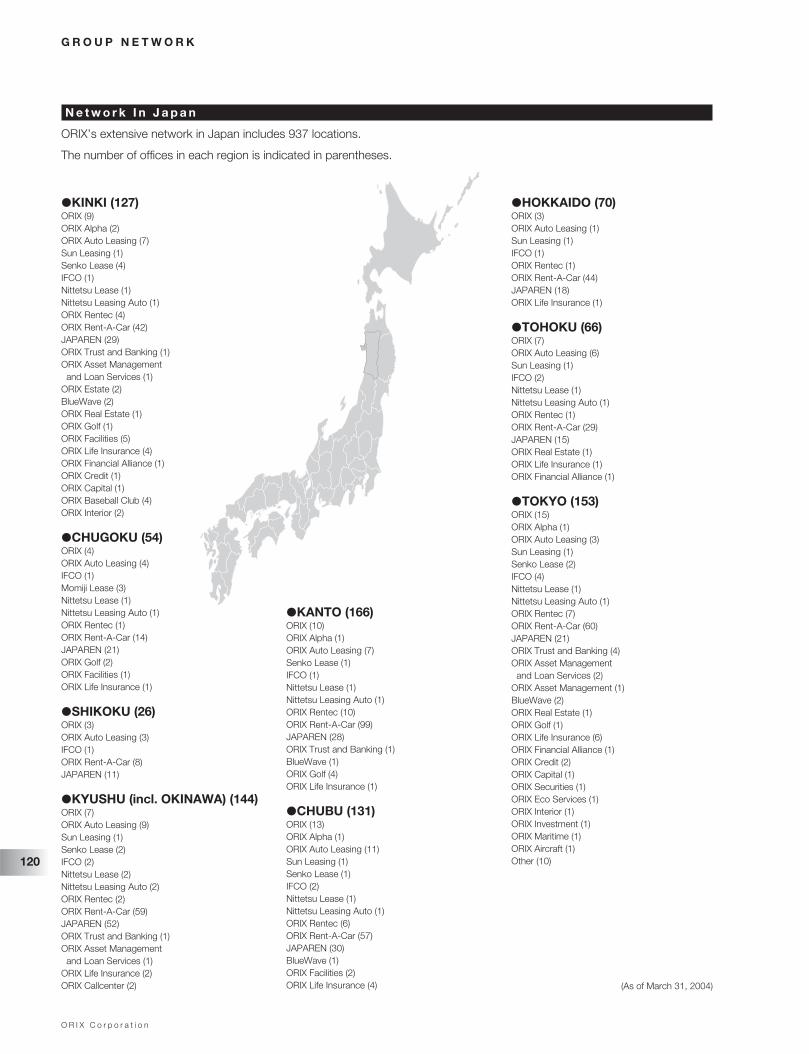
O R I X C o r p o r a t i o n
120
G R O U P N E T W O R K
N e t w o r k I n J a p a n
ORIX’s extensive network in Japan includes 937 locations.
The number of offices in each region is indicated in parentheses.
(As of March 31, 2004)
�KINKI (127)ORIX (9)ORIX Alpha (2)ORIX Auto Leasing (7)Sun Leasing (1)Senko Lease (4)IFCO (1)Nittetsu Lease (1)Nittetsu Leasing Auto (1)ORIX Rentec (4)ORIX Rent-A-Car (42)JAPAREN (29)ORIX Trust and Banking (1)ORIX Asset Management and Loan Services (1)
ORIX Estate (2)BlueWave (2)ORIX Real Estate (1)ORIX Golf (1)ORIX Facilities (5)ORIX Life Insurance (4)ORIX Financial Alliance (1)ORIX Credit (1)ORIX Capital (1)ORIX Baseball Club (4)ORIX Interior (2)
�CHUGOKU (54)ORIX (4)ORIX Auto Leasing (4)IFCO (1)Momiji Lease (3)Nittetsu Lease (1)Nittetsu Leasing Auto (1)ORIX Rentec (1)ORIX Rent-A-Car (14)JAPAREN (21)ORIX Golf (2)ORIX Facilities (1)ORIX Life Insurance (1)
�SHIKOKU (26)ORIX (3)ORIX Auto Leasing (3)IFCO (1)ORIX Rent-A-Car (8)JAPAREN (11)
�KYUSHU (incl. OKINAWA) (144)ORIX (7)ORIX Auto Leasing (9)Sun Leasing (1)Senko Lease (2)IFCO (2)Nittetsu Lease (2)Nittetsu Leasing Auto (2)ORIX Rentec (2)ORIX Rent-A-Car (59)JAPAREN (52)ORIX Trust and Banking (1)ORIX Asset Management and Loan Services (1)
ORIX Life Insurance (2)ORIX Callcenter (2)
�KANTO (166)ORIX (10)ORIX Alpha (1)ORIX Auto Leasing (7)Senko Lease (1)IFCO (1)Nittetsu Lease (1)Nittetsu Leasing Auto (1)ORIX Rentec (10)ORIX Rent-A-Car (99)JAPAREN (28)ORIX Trust and Banking (1)BlueWave (1)ORIX Golf (4)ORIX Life Insurance (1)
�CHUBU (131)ORIX (13)ORIX Alpha (1)ORIX Auto Leasing (11)Sun Leasing (1)Senko Lease (1)IFCO (2)Nittetsu Lease (1)Nittetsu Leasing Auto (1)ORIX Rentec (6)ORIX Rent-A-Car (57)JAPAREN (30)BlueWave (1)ORIX Facilities (2)ORIX Life Insurance (4)
�HOKKAIDO (70)ORIX (3)ORIX Auto Leasing (1)Sun Leasing (1)IFCO (1)ORIX Rentec (1)ORIX Rent-A-Car (44)JAPAREN (18)ORIX Life Insurance (1)
�TOHOKU (66)ORIX (7)ORIX Auto Leasing (6)Sun Leasing (1)IFCO (2)Nittetsu Lease (1)Nittetsu Leasing Auto (1)ORIX Rentec (1)ORIX Rent-A-Car (29)JAPAREN (15)ORIX Real Estate (1)ORIX Life Insurance (1)ORIX Financial Alliance (1)
�TOKYO (153)ORIX (15)ORIX Alpha (1)ORIX Auto Leasing (3)Sun Leasing (1)Senko Lease (2)IFCO (4)Nittetsu Lease (1)Nittetsu Leasing Auto (1)ORIX Rentec (7)ORIX Rent-A-Car (60)JAPAREN (21)ORIX Trust and Banking (4)ORIX Asset Management and Loan Services (2)
ORIX Asset Management (1)BlueWave (2)ORIX Real Estate (1)ORIX Golf (1)ORIX Life Insurance (6)ORIX Financial Alliance (1)ORIX Credit (2)ORIX Capital (1)ORIX Securities (1)ORIX Eco Services (1)ORIX Interior (1)ORIX Investment (1)ORIX Maritime (1)ORIX Aircraft (1)Other (10)
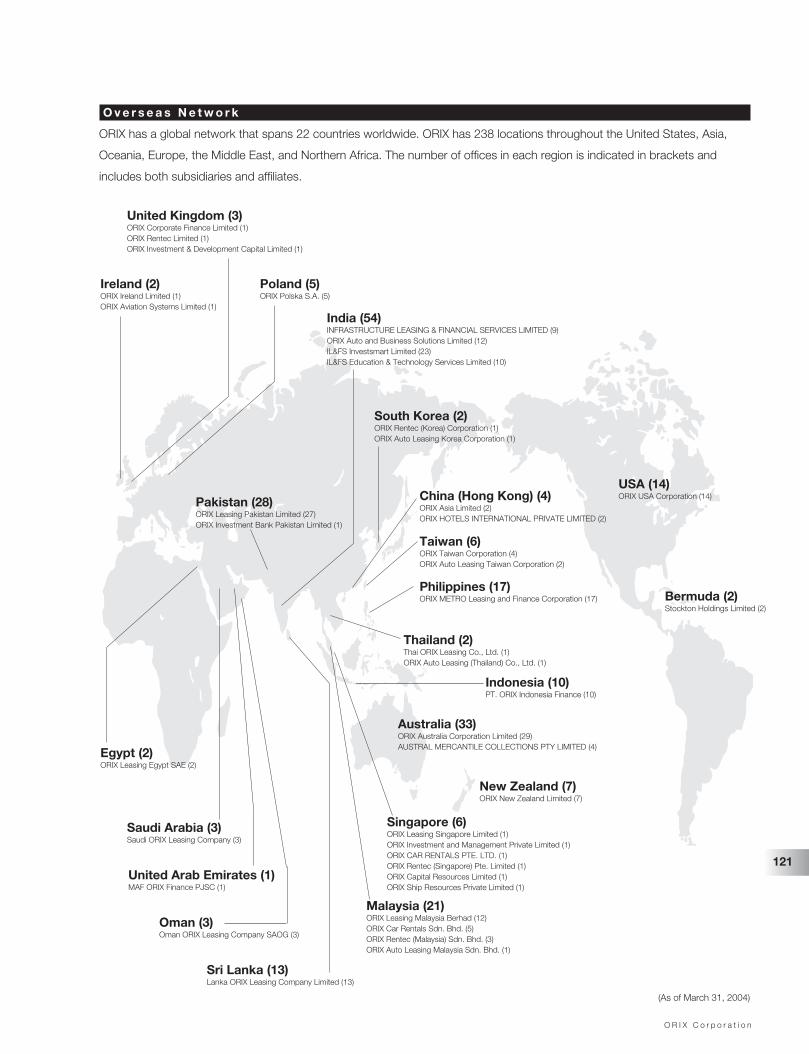
O R I X C o r p o r a t i o n
121
O v e r s e a s N e t w o r k
ORIX has a global network that spans 22 countries worldwide. ORIX has 238 locations throughout the United States, Asia,
Oceania, Europe, the Middle East, and Northern Africa. The number of offices in each region is indicated in brackets and
includes both subsidiaries and affiliates.
(As of March 31, 2004)
United Kingdom (3)ORIX Corporate Finance Limited (1)ORIX Rentec Limited (1)ORIX Investment & Development Capital Limited (1)
Ireland (2)ORIX Ireland Limited (1)ORIX Aviation Systems Limited (1)
Poland (5)ORIX Polska S.A. (5)
India (54)INFRASTRUCTURE LEASING & FINANCIAL SERVICES LIMITED (9)ORIX Auto and Business Solutions Limited (12)IL&FS Investsmart Limited (23)IL&FS Education & Technology Services Limited (10)
South Korea (2)ORIX Rentec (Korea) Corporation (1)ORIX Auto Leasing Korea Corporation (1)
USA (14)ORIX USA Corporation (14)
Taiwan (6)ORIX Taiwan Corporation (4)ORIX Auto Leasing Taiwan Corporation (2)
Philippines (17)ORIX METRO Leasing and Finance Corporation (17)
China (Hong Kong) (4)ORIX Asia Limited (2)ORIX HOTELS INTERNATIONAL PRIVATE LIMITED (2)
Bermuda (2)Stockton Holdings Limited (2)
Pakistan (28)ORIX Leasing Pakistan Limited (27)ORIX Investment Bank Pakistan Limited (1)
Australia (33)ORIX Australia Corporation Limited (29)AUSTRAL MERCANTILE COLLECTIONS PTY LIMITED (4)
New Zealand (7)ORIX New Zealand Limited (7)
Singapore (6)ORIX Leasing Singapore Limited (1)ORIX Investment and Management Private Limited (1)ORIX CAR RENTALS PTE. LTD. (1)ORIX Rentec (Singapore) Pte. Limited (1)ORIX Capital Resources Limited (1)ORIX Ship Resources Private Limited (1)
Indonesia (10)PT. ORIX Indonesia Finance (10)
Malaysia (21)ORIX Leasing Malaysia Berhad (12)ORIX Car Rentals Sdn. Bhd. (5)ORIX Rentec (Malaysia) Sdn. Bhd. (3)ORIX Auto Leasing Malaysia Sdn. Bhd. (1)
Egypt (2)ORIX Leasing Egypt SAE (2)
Saudi Arabia (3)Saudi ORIX Leasing Company (3)
Thailand (2)Thai ORIX Leasing Co., Ltd. (1)ORIX Auto Leasing (Thailand) Co., Ltd. (1)
United Arab Emirates (1)MAF ORIX Finance PJSC (1)
Oman (3)Oman ORIX Leasing Company SAOG (3)
Sri Lanka (13)Lanka ORIX Leasing Company Limited (13)
O R I X C o r p o r a t i o n
122
WEBSITE GUIDE
1. About ORIX: http://www.orix.co.jp/grp/index_e.htm
Our History: A short review of the development of ORIX covering the last40 years
Financial Data: Historical financial data
Management: Management profiles and recent management interviews
Corporate Network: Descriptions and contact information for ORIX Group com-panies in Japan and overseas
Corporate Governance: Developments of ORIX’s corporate governance over the years
Compliance: Outline of the Compliance Manual used by ORIX
2. Investor Relations: http://www.orix.co.jp/grp/ir_e/ir_index.htm
Who is ORIX?: An introduction to ORIX for first time visitors
CEO Message: An introduction of ORIX’s CEO Message from the currentannual report
Financial Data: Historical financial data
�Quarterly Release: ORIX’s most recent quarterly earnings release
�Five-Year Summary: A summary of financial information for the last five years
�Financial Reports: http://www.orix.co.jp/grp/ir_e/data/report/index.htm
Annual Report: Released in July of every year, includes the CEO’smessage to shareholders, explanation of the fiscalyear’s results, and detailed financial information
Quarterly Financial Results: Quarterly financial information, with outline of quarterlyresults and consolidated financial statements
Analysis of Quarterly Financial Results: Explanation of financial results based on “QuarterlyFinancial Results” using graphs and tables, includeshistorical information of major financial data
Update Newsletter: Newsletter sent to shareholders in the first, second, andthird quarters
U.S. SEC Form 20-F:Annual report filed with the United States Securitiesand Exchange Commission usually in July of every year
Five-Year Excel Data: Downloadable excel file containing five years of finan-cial data compiled from information disclosed in ORIX’sannual reports and U.S. SEC Form 20-Fs
Stock & Bond Information: Stock and corporate bond information
�Stock Information: Stock and security exchange listings and other stockinformation
�Stock Price: Details of ORIX’s current historical stock prices
�Analyst Coverage: List of analysts covering ORIX
�Corporate Bonds & Ratings: Information on corporate bonds issued and ratings information
Management: Management profiles and recent management interviews
�Management Profiles: Information on management
�Management Presentations: Downloadable management interviews (PDF format)
IR Calendar & Earnings Presentations: Downloadable past results presentations (with audio) andschedule for future results presentations
FAQs: List of useful questions and answers
Contact ORIX IR: Contact information
Information Requests: Form for requesting ORIX publications and signing up forORIX’s e-mail service
3. News Releases: http://www.orix.co.jp/grp/prs_e/index.htm
ORIX’s website has been reorganized in fiscal 2004 to better meet the needs of a variety of users. The new website has been
divided into three main sections that include: 1. About ORIX; 2. Investor Relations; and 3. News Releases. Please visit our website
to access the information that you are interested in.
O R I X C o r p o r a t i o n
123
C O R P O R A T E I N F O R M A T I O N
O R I X C o r p o r a t i o n
3-22-8, Shiba, Minato-ku, Tokyo 105-8683, JapanTel: 81-3-5419-5000Fax: 81-3-5419-5903
Established: April 17, 1964
Shareholders’ Equity: ¥564,047 million
Number of Employees: 12,481
S h a r e h o l d e r I n f o r m a t i o n
Total Number of Shares Authorized:259,000,000 shares
Total Number of Shares Outstanding:84,366,314 shares
Total Number of American Depository Shares Outstanding:1,021,620 shares
Number of Shareholders: 9,259
Transfer Agent for Common Shares:UFJ Trust Bank Limited1-4-3, Marunouchi, Chiyoda-ku,Tokyo 100-0005, Japan
Depositary Bank for ADRs:Citibank, N.A.111 Wall Street, New York, New York 10043, U.S.A.
S t o c k E x c h a n g e L i s t i n g s
Common Shares and Convertible Notes:Tokyo Stock ExchangeOsaka Securities ExchangeNagoya Stock Exchange
Securities Code: 8591
New York Stock ExchangeTrading Symbol: IX
If you would like to contact an Investor Relations or MediaRepresentative, please contact us by e-mail or telephone atthe address below. Contact information for ORIX subsidiariesnearest you can be found in our Corporate Network inJapan (http://www.orix.co.jp/grp/co_e/list_japan.htm) orour Overseas Corporate Network (http://www.orix.co.jp/grp/co_e/list_world.htm) on our website.
ORIX CorporationCorporate Communications,Office of the President3-22-8, Shiba, Minato-ku, Tokyo 105-8683, JapanTel: 81-3-5419-5102Fax: 81-3-5419-5901E-mail: [email protected]: www.orix.co.jp
(As of March 31, 2004)
To U.S. Holders: PFIC
It is expected, and the following discussion assumes, thatthe Company will be a “passive foreign investment company”(a “PFIC”) as defined in Section 1297(a) of the Internal RevenueCode in the year of the Offering and in future years by reasonof the composition of its assets and the nature of its income.
A U.S. Holder who holds Shares will generally be subject tospecial rules (the “PFIC Rules”) with respect to (i) any “excessdistributions” on the Shares (generally, any distributionsreceived by the U.S. Holder on the Shares in a taxable yearthat are greater than 125% of the average annual distributionsreceived by the U.S. Holder in the three preceding taxableyears, or, if shorter, the U.S. Holder’s holding period for theShares) and (ii) any gain realized on the sale or other disposi-tion (including a pledge) of the Shares. Under these rules, (i)the excess distribution or gain would be allocated ratably overthe U.S. Holder’s holding period for the Shares, (ii) the amountallocated to the current taxable year would be taxed as ordi-nary income, and (iii) the amount allocated to each of the priortaxable years would be subject to tax at the highest rate of taxin effect for the applicable class of taxpayer for such year, andan interest charge for the deemed deferral benefit would beimposed with respect to the resulting tax attributable to eachsuch prior year.
Under the recently enacted Taxpayer Relief Act of 1997, aU.S. Holder, in lieu of being subject to the special tax andinterest charges described above, may make an election toinclude gain, as ordinary income, on the stock of a PFIC undera mark-to-market method. Under such an election, the U.S.Holder generally includes in income each year an amountequal to the excess, if any, of the fair market value of the PFICstock as of the close of the taxable year over the U.S. Holder’sadjusted basis in such stock. The U.S. Holder is allowed adeduction for the excess, if any, of the adjusted basis of thePFIC stock over its fair market value as of the close of the tax-able year to the extent of any unreversed mark-to-marketgains previously included in income with respect to the stock.Prospective investors should consult their tax advisors aboutthe desirability of making such a mark-to-market election.
A U.S. Holder would also avoid the application of such spe-cial tax and interest charges if it made an election to treat thePFIC as a “qualified electing fund” under Section 1295 of theCode, provided that the corporation complies with certainreporting and other requirements. The Company, however,does not intend to comply with the requirements necessary topermit a holder to make an election to have the Companytreated as a “qualified electing fund.”
A U.S. Holder who beneficially owns Shares on a PFIC dur-ing any year must make an annual return on IRS Form 8621that describes the distributions received with respect to suchShares and any gain realized on the sale or other disposition ofsuch Shares.
Printed in JapanPrinted in Japan
on recycled paper
Recommended