ASSESSMENT OF NUCLEAR DATA FILES V I A B E N C W K CALCULATIONS -- I A PREL?HINARY REPORT ON THE NEACRPfIAEA INTERNATIONAL COHPARISON $
1 CALCULATION OF A LARGE L'IFBR
2
. . . s
L. G. LeSage, D. C. Wade, R. D. IlcKnight and K. E. Freese !,
Argonne National Laboratory 'I i
Applied Physics Division 2 9700 South Cass Avenue I
Argonne, I l l i n o i s 60439 USA ' . i
ABSTRACT
The r e s u l t s of an in t e rna t ioda l comparison ca lcu la t ion
0 of a l a rge (1250 We) LMFBR benchmark model a r e presented and discussed. Eight r eac to r configurations were calcu- la ted . Parameters included with the comparison were: eigen- value, k,, neutron balance data , breeding r eac t ion r a t e r a t i o s , r e a c t i v i t y worths, cen t r a l control rod worth, regional sodium void r e a c t i v i t y , core Doppler and e f f e c t i v e delayed neutron f rac t ion . Ten countr ies par t ic ipa ted i n t h e comparison, and fourteen solut ions were contributed. The discussion focuses on the va r i a t i on inpa rame te r values, t he degree of consistency among the various parameters and solut ions , and t h e iden t i f i ca t ion of unexpected ' r e su l t s . The r e s u l t s a r e displayed and discussed both by individual pa r t i c ipan t and by groupings of pa r t i c ipan t s (e.g., r e s u l t s from adjusted data s e t s versus non-adjusted da t a s e t s ) . Unexpected l a rge va r i a t i ons among r e s u l t s were observed f o r r a d i a l react ion r a t e and worth d i s t r i bu t ions and f o r the' c en t r a l cont ro l rod worth.
INTRODUCTION AND BACKGROUND
Resul ts of an in t e rna t iona l comparison ca lcu la t ion of a l a r g e (1250 NWe) LNFBR benchmark model were presented and discussed a t a s p e c i a l i s t ' s meeting a t Argonne National Lnhoratory i n February 1978. The meeting was sponsored by the Nuclear Energy Agency Committee on Reactor Physlcs (NEACRP) i n col laborat ion with IAEA. The purpose of t h e ana ly t i ca l exer- c i s e was t o evaluate and document the agreement and d i f fe rences i n t h e ca lcu la t ion of key LNFBR physics and safe ty parameters a s a function of
. the d i f f e r en t data s e t s and processing codes used by the p a r t i c i p a t i n g countries.
: I
This comparison ca lcu la t ion was the f i r s t such in t e rna t iona l com- parison exercise s ince the so cal led "Baker Model" comparison1 of 1970 which focused on breeding and neutron balance. It a l so was the f i r s t

comparison f o r a l a r g e "commercial sized" LMFBR system, t he f i r s t com- prehensive comparison between the current adjusted data s e t s (e.g., FGL5 and CARNAVAL.-111) and the unadjusted s e t s (e.g., ENDFIB-IV), and is the most comprehensive of such comparisons -- including a number of para- meters no t included i n previous comparisons (e.g., con t ro l rods and cer- t a i n s a f e ty parameters).
Plans' f o r t he comparison ca l cu l a t i on were i n i t i a t e d a t t he annual NEACRP meeting i n 1975 i n Bologna. ANL prepared the problem spec i f i ca t i on
' which was reviewed by Winfri th p r i o r t o d i s t r i bu t ion t o t he NEACRP and1AF.A . membership. Solutions were submitted t o ANL i n the f a l l of 1977. These
. . were compiled i n t o f i gu re s and t a b l e s and copies were sent t o each of the pa r t i c ipan t s i n January 1978. The s p e c i a l i s t ' s meeting was held February
. . 7-9, 1 9 7 8 , a t Argonne National Laboratory. . A list of t he pa r t i c ipa t i ng countr ies , meeting a t tendees , so lu t ion
authors, and da ta s e t s used i n t he so lu t ions i s included i n Table I. The success of t he comparison ca l cu l a t i on wasdue i n l a r g e p a r t t o the ex- c e l l e n t cooperation of t h e so lu t i on authors i n following t h e problem spec i f i ca t i ons and meeting t h e schedules.
The purpose of t h i s paper is t o present a preliminary repor t on the r e s u l t s of the comparison and of t he s p e c i a l i s t ' s meeting. A de ta i led r epo r t of t he meeting w i l l be issued a s a combined ANL/NEAcRP repor t l a t e r t h i s year. This r epo r t should be considered a s a compilation of t h e wurk of the individuals l i s t e d i n Table I. .
ThRLE I. L i s t of Sa lu t i oo r and P a r t i c ~ y a ~ : s
--- - Solu t ion*
Label Country Deta Set Adjusted So lu t i on W h o r r and Yeetinq Attendees -- - AIIL CSA (AliL) V&F/3-IV 40 R. 0. W n i o h t . L. G . LeSage, 0. C. Wade
BELGILIM Eeloium ECAK-? 110 C. l ' inmrt, R. deL!outers
CACAPACIIE F r z n c e CF?::WAL-1 Yes Y. Y. Bouget. P. Warner
CllEll I t a l y . . E!lDF/S-1V I:c C. Convetsana, C. L i v r i e r i . F. Raooni, D. G ina ld i s . and 5. Zero
. . ElR-1 Sw i t ze r land EllOilR-!V !Ic
P. I.lvdler, J. Hademann. Y. Peer. and H. 0. Venaer
FIR-? Swi tze r land EtlDF-P.11 I 1 Ne
. KAQLSRUHE Germany KEDX-3 110
SVEOEN Sweden ~ l 1 ~ ~ / ~ - 1 1 1 I!o
C. Broeders
Klas J i r l o w
UffiEA England ' FGL-5 Yes J. L. Golands. C. J. Dean. C. 6. Campbell
USSR USSR 8'1A3-71 ti0 P. Traynoov + - ... --
*Additional so lu t ions from Karlsruhe and Cadarache a r e n o t included.

PROBLEM SPECIFICATION
The benchmark reac tor spec i f ica t ion was based on a 3260 >tWt con- vent ional mixed oxide design with a 0.300 inch p in s i z e developed a t ANL i n 1975. The benchmark model was s e t up f o r R,Z modeling with specif ied homogeneous compositions f o r each region of the reactor. The model con- ta ined no- cont ro l rods o r cont ro l rod posit ions. The core height was 40 inches (101.6 cm) and the r a d i i of t he inner and outer core regions were 136.85 cm and 176.53 cm, respect ively, giving a t o t a l core volume of
' 9950 l i t e r s . The core volume f r ac t ions were 41% f o r fue l , 38% for t o t a l sodium and 21% f o r t o t a l s t ruc tu ra l .
Eight configurations of t nchmark reac tor were specified. These
0~. ~. .. - . ' ~ e f e r e n c e . . . . Na-Voided Inner Cor
. . 3. , Na-Voided Inner ~ore,::$uter Core and Axial Blanket 4. Reference with a ~ e n t G l Na-Filled Control Rod Posi t ion
, 5. ~ e f e r e n c e . xiith a c e n t r a l . or on Control Rod 6. Na-Voided Inner Core, Outer Core and Axial Blanket with a Cen-
t r a l Boron Control Rod 7. Reference with Hot Fuel 8. Na-Voided Inner Core, Outer Core and Axial Blanket with Hot Fuel
The parameters requested by- the problem spec i f ica t ion included:
- Eigenvalues f o r t h e e ight configurations - k- f o r the inner core composition - Neutron balance data - Breeding and conversion r a t i o s (global and regional) - - Central f l ux and ad io in t spectra. react ion r a t e . r a t i o s and reac- -
t i v i t y worths - Central cont ro l rod worths (with and without sodium)
. . - Fiss ion r a t e and r e a c t i v i t y worth d i s t r i bu t ions a x i a l l y and i I
r a d i a l l y i - Effect ive delayed neutron f r a c t i o n - Regional sodium void r eac t iv i ty , and - Isothermal core f u e l Doppler r e a c t i v i t i e s . .
SURVEY OF RESULTS
The fourteen so lu t ions (see Table I) which make up t h i s exercise re- present a l a rge amount of data which has been processed and compiled i n t o many t ab l e s and f igures . Although i t i s possible t o include only a p a r t of t h i s mater ia l , the most important and in t e r e s t i ng r e s u l t s a r e summar- i z e d . i n Tables 11-V and Figures 1-4.

TABLE TI. Eigenvalue, k,, Leakage F r a c t i o n . Reac t ion Rat6 R a t i o s and Breeding R a t i o
C o n f i g u r a t i o n 1 Leak?xe F r a c t i o n Reac t ion Rate 8 a t t o s a Rreedinp. p i c l o
S o l u t i o n k e f f k-(IC) ~ o i e Reac tor 28c/'9f 2Pf/*"f *'cIb3f Core Blanke t T o t a l
, Nean 1.0032 1.1273 0.167 Std. Dev. 0.0124 O.DlR6 0.00s
.*k x 10'
Aln Belxiun Cadarache CNFN
. - -. IrmL , -0.11 -0.77 - JAER 1-1 0.34 -0.91 -4.e JAERI-2 0.88 0.74 O.R JAERI-3 1.12 n.40 -3.3 a r l s r u h e -0.44 - 0.1 Sr'eden -2.27 1.56 I .O W F A 1.01 2.12 1.5 USSR n.51 0.48 1.2
Percen t Il lfferrnce P e l a t i r e t o :!can
?7.7 . ' I -1.7 3.1 -1.2 9.4 -1.1 -16.0 13.1 -3.7 -2.6 3.2
-12.0 -1.6 2.7 . 1.7 -16.6 -7.4 -4.2 3.1 -15.8 0.7 -2.8- 1.0
"per a t m r e a c t i o n r a t e r a t i o s are g iven , and f and c re fer t o capture and f i s s i o n r . a tes r e s p e c t i v e l y . . .
TABLE 111. C e n t r a l C o n t r o l Rod, Sodium Void and Fue l Doppler R e a c t i v i t y K'orths
I s ~ t h e r c a l Fue l Doppler C e n t r a l BbC Cont ro l Rod b!o:orth Va-Void Vor th I'o r t h
(krod-kref) lkref (''void-krcf)lkref (kz:no-kllno)lkllno -
Na I n lia I n ~a void I n n e r Core P l u s Conf. 1 Conf. 3 S o l u t i o n Rel. t o Fue l Rel. t o Yo Rel. t o F u e l Core A ~ i a l b l a n k e t 6. I n Fa Void
Mean -0.00350 -0.nnZQl -0.On451 0.0213 0.0212 - -0.0Q7L3 -0.00439 s t d . Dev. . 0.nnW7 n.onn41 0.00043 0.0027 0.0037 0 . 0 ~ 6 0.00085
P e r c e n t D i f f e r e n c e R e l a t i v e re I t e m
lun -4.2 -4.8 -0.7 11.0 1 5 . ~ -3.1 2.6 Eelp.iun -1.~ n.5 -0.7 . -32.0 -45.11 . . -1.2 Caderachc 21.8 24.1 21.7 6.1 .5.4 1.5 10.8 CNEN -3.6 -4.1 -1n.9 - 7.3 4.2. -0.2 d.8 FIR-1 -11.1 -11 .n -S.Q 14.2. . 22.n -17.0 -24.1 : EIR-2 -4.4 -0.2 -4.4 -7.9 -R. n 3.1 17.6 ~n:nr. -4.2 -1.1 -2.5 -7.7 -7.4 -1.6 1 n . s .lAER 1-1 -0 .4 -0. h -5.6 7.5 8.3 6.1 15.6 JAFR 1-2 -10.5 -12.0 -6.7 11.0 11.7 -11.1 -5.8 .MIX 1-3 . -1 1.2 -11.5 -51.1 10.7 16.3 24.1 L1.4 X e r l r r u l ~ e 0.1 -0.1 0.7 0.0 -2.1 4 . 0 -4. 0
Sweden -2.2 -3.0 - 2.2 2.8 28.2 -32.3 UKA FA 11.2 17.1 1n.h . . -3.7 -5.2 -2.0 -2.0 USSR 34.4 . 34.1 13.0 -13.9 -21.5 -13.8 -24.6
---- - - - - - - - - - --- - - - - . - - -. . . I . . .. . -~ -

. .
TABLE Iv. Onexroup Crcss Sections ncd Yean Flux Enerry
- E ( e ) . 23Pu 21Cr 21?pu 23?pu . 2 ! ? ~ " I P S Fe Ca 0
% I n t i o n (key) capture rissinn Cnptlre Flsston ,\lphe Transnor: Tronsport Tmosport Traaspart
Mean 110.4 0.308 0.0L15 0.5% l.Rh0 0.298 5.40 .&.I6 4.30 3.50 . Srd. ner. 1.6 0.010 ' 0.0020 n.nb2 0 . w ~ 0.019 0.12 O.61 0.22 0.11
percent nifference ve la t i?c t o ?lean
ER. -2.5 -0.3 . -7.R 2.4 -P.9 3.5 -0.7 -3.1 -3.4 0.9 ?+-leiurn -2.2 7.8 -3.4 '18.5 -1.1 ' -16.R - 13.3 11.4 7.0 cadaraclle" 6.8 -7.8 - 2 . ' 3.8 0.1 3.5 - - - -
P.0 . 3.6 1.0 2.6 -I. 6 -1.9 -1.4 1.1 EIK-1 -1;z -1 .o n. s 28.9 5.7 2.5
0.1 9.2 1.0 0.1 il.7 15.2 3.6 0.5 0.5 -5.1 -3.6 -0.2 5.6 -4.5 , 1.9 0.1 - -24.9 -5.6 -4.3
0 . 1 -9.4 -2.6 -0.5 LlAM 1.4 -5.3 3.7 - 6 -1.5 -0.1 -1.4 -15.0 d.6 . -5.4 USSR 6.9 0.5 -7.3 -10.1 -6.0 -5.5 -Z.L -2.2 o -1.7
amePEp cross se=* values c a l ~ l a t e d hy A i l . from neutron balance data and other lnfornacion. - ---- . .
. .
TABLE V. C e n t r a l I s o t o p i c R e a c t i v i t y I'orths nklk p e r 10'" acomslcc)
C o n f i g u r a t i o n 1 (Xa I n ) C o n f i e u r a t i o n 3 (Sa Poi<)
. 2 3 9 ~ " z 3 e ~ Na Fe l o R 2 3 9 ~ " 2 3 ~ ~ : tia Fe 1 %
Efem 11R.5 -7.3 -0.70 -0.R7 -77.5 1 3 4 . 1 -7.6 -0.94 -1.06 -74.1 Std. D m . 5.0 0.3 . 0.09 n . 0 ~ P.2 4.6 0.2 n.13 0 . 0 5 3.5
Percent D i f f e r e n c e R e l a t i v e t o Mean
n?JL . -0.7 -3.7 0.5 -0.3 -6.2 0 . 1 -1.8 3.8 1 .6 -2.6 Brlfiium ' , -5.7 4.8 -21.1 1 5 . 6 3.9 -b .R 5.2 1.2 -0.1 -3.1 Cadarache P.4 4.6 5 -1P.l 6 .1 -1.0 -0.6 10 .6 -11.1 2.2 W E N -0.3 6.8 1.9 1 . 9 -5.0 3.8 1.5 7.L 3.4 0.0 EIR-1 . -4.4 -6.3 -16.4 12.2 -5.3 -1.6 -0.9 -26.6 7.2 -0.1 Em-2 -3.1 0.0 -11.5' -2.n -6.4 - 0 . 3.L -6.8 0.L -3.4 .lAERI-1 -3.8 4 . 2 -1.8 -0.8 -5.2 -7.3 -1.1 2 .5 1 . 6 -3.2 JAl:R 7-2 0.6 -6.9 ?h.S -16.1 1.1 -0.1 4 . 0 13 .8 1 .I 1 .8 JAl'P T-I -1.1 -1.1 2.1 -4:l , 11.0 -1.5 n.6 h.5 0.A 13.2 ) :nrlsruhe b.5 -2.1 14 .3 7.6 0.8 1.9 O.n . 17 .0 0.8 -1.1 W3VA 8.6 ' , 0.9 -3.7 h.1 3.8 R.6 -2.6 -9.1 1 .5 1.6 USSR 1.3 5.3 -3.3 -9.5 - 6 -2.2 0 .5 -20.4 -7.0 -5.2
~ ~ .. . .. ...~.. .. . . .- . . .
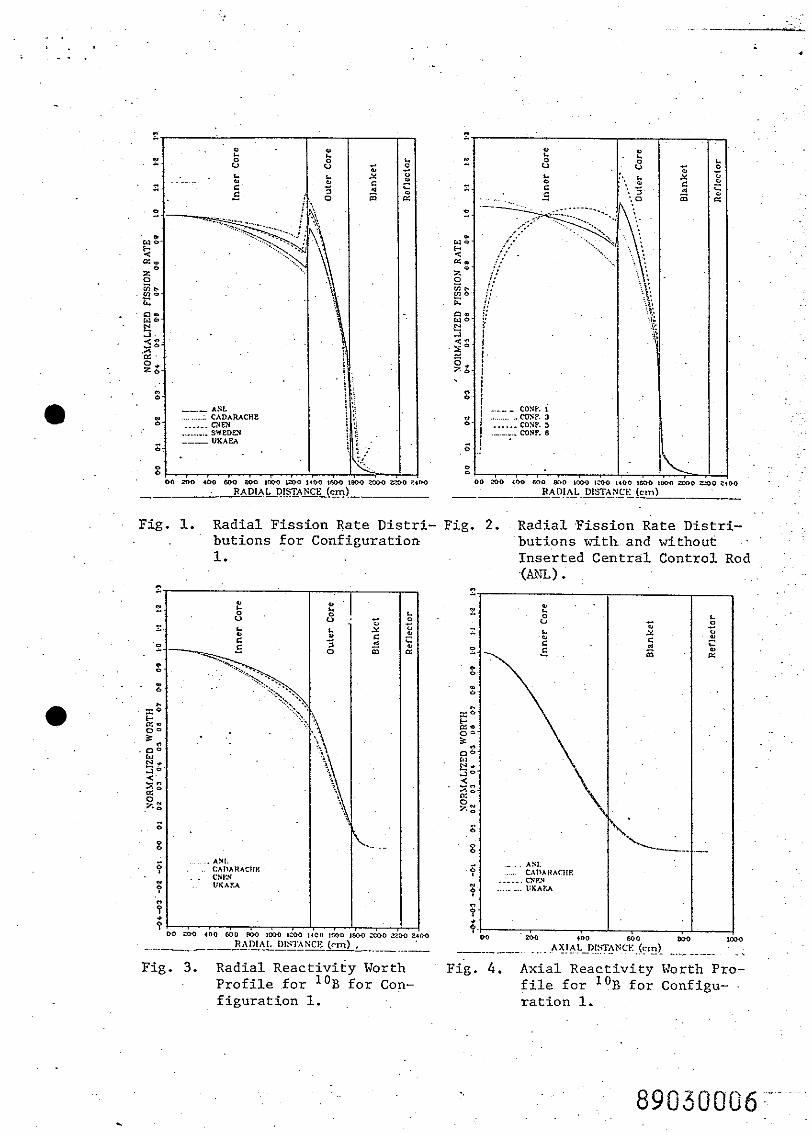
Fig. 1. Rad ia l F i s s i o n Rate D i s t r i - Fig. 2. Rad ia l F i s s i o n Rate D i s t r i - bu t ions f o r Conf igura t ion b u t i o n s w i t h and wi thout
I n s e r t e d C e n t r a l Con t ro l Rod (ANL) .
i ;L DO Zoo 4 W m0 GO-3 to,O ,ceo
R A D I A I . 1)IhTA - - . - - - - - Fig. 3. Radia l ~ e a c t i v i t ~ Worth
P r o f i l e f o r 'OB f o r Con- f i g u r a t i o n 1.
Fig . 4. Ax ia l R e a c t i v i t y Worth Pro- f i l e f o r ' OB f o r Configu- r a t i o n 1.

I n each t a b l e the mean value and the standard deviation of the re- s u l t s a r e presented i n t he top two l ines . I n the remainder of the t ab l e the percent d i f fe rence from the mean value f o r each parameter and solu- t i o n a r e l i s t e d . The r e s u l t s a r e presented i n t h i s way to f a c i l i t a t e an intercomparison. There is one exception i n Table 111. For the para- meters keff and km the Ak differences ( ~ 1 0 ~ ) a r e l i s t e d r a t h e r than per- cent differences. Whenever a number i s missing from one of t h e tab les i t can be assumed t h a t t h i s value was not supplied (not a l l pa r t i c ipan t s submitted complete solut ions) .
Some of t h e key parameters a r e discussed i n t he following paragraphs. Here, t h e discussions w i l l focus on:
- t he r e l a t i v e s c a t t e r i n t h e values, - individual values t h a t a r e pa r t i cu l a r ly i n t e r e s t i ng o r possibly
8' discrepant and - t he co r r e l a t i ons among the r e s u l t s f o r d i f f e r e n t parameters. . . . . .. ~
.~. I n t he following discussions e f f ec t ive one-group cross sect ions a r e indicated by <u>, c e n t r a l r e a c t i v i t y worths by p and per atom react ion r a t e r a t i o s by r a t i o s of f and c. Superscripts r e f e r t o the isotopes
; and subscr ip t s f , c and tr r e f e r t o f i s s ion , capture and t ranspor t reac- t ions. A l o standard deviat ion i n the r e s u l t s i s indicated by lo .
.Eigenvalue and k,
Re la t ive ly l a rge l o va r i a t i ons of 1.2% and 1.6% a r e observed f o r the eigenvalue and k, (see Table 11). These r e s u l t s a r e comparable to those obtained i n t h e e a r l i e r "Baker Nodel" comparison.' The so lu t ions with
* have :
t h e l a r g e s t eigenvalues (UKhEA and Cadarache) a l so have:
- t he l a r g e s t km - t h e smallest 2'c/49f, - t he smallest <ut8> (with t he JAERI-2 Solution), . . - t h e l a r g e s t p 4 9 (with t he Karlsruhe sd lu t ion) and - t he smal les t core breeding r a t i o . . .
The so lu t ions with t h e smallest eigenvalues (Belgium and Sweden)
- the smallest km (Gelgium only'), - t he l a r g e s t 28c/49f (with the USSR so lu t ion) , - t he smal les t <u:'> (Belgium only), - - t he l a r g e s t p4' (Belgium only) and - t he l a r g e s t core breeding r a t i o s (with t h e USSR solut ion) .
There appears t o be no s ign i f i can t cor re la t ion between keff and 4 9 , 3
<of >, p28, o r core o r r eac to r leakage. The k, va lues general ly cor- ' . r e l a t e with keff values but t he re a r e some exceptions. The Swedish
so lu t ion has a high k-, t he smal les t keff and t h e smallest r eac to r

. .
leakage, a combination t h a t seems t o be inconsis tent with t h e o ther solutions. That the keff f o r t h e USSR so lu t ion i s 0.5% above the mean i s s u r p r i s i n s ince i t has among the l a rges t values of 28c/49f and t h e smallest <a:&; however, i t does have a small *9c/*gf. Using calculated
. s e n s i t i v i t y coef f ic ien ts , c o l l i n s 2 has shown t h a t t he keff d i f fe rences between ANL and UKAEA and between ANL and Cadarache can be explained by . . t he c ross sec t ion differences.
. .
. . .
Core and Reactor Leakage
The l a v a r i a t i o n of t he core leakage (see able 11) i s only 3% while- t h a t f o r t h e r eac to r leakage i s 19%. This i s not su rp r i s ing due t o t h e r e l a t i v e small f r a c t i o n (4 .7%) of the neutrons t h a t l e a k from the reactor . . ~
The AN, so lu t ion ind ica tes a reac tor leakage considerably l a rge r than t h e . - . . . .
a o t h e r ~ s o l u t i o n s . I n order t o check t h i s r e s u l t , one of t h e authors @lcKnight) ran a V I M Monte Carlo ca lcu la t ion using the same ENDFIB-IV data . . ' - base a s used f o r t he ANL d i i fu s ion solution. The r eac to r leakage, a s well a s most of t he other neutron balance parameters, was ca lcu la ted by VDf to
. . be near ly i d e n t i c a l t o t he values from the ANL di f fus ion solut ion. The VDf . . . ' ~
r e s u l t appa ren t ly confirms t h a t t h e difference between ANL and. t he o ther r e s u l t s is not due t o approximations i n ANL di f fus ion code, and leaves the
. . . . question of t h e cause o f t h e d i f fe rence unanswered. -
. . . . . . .
'Breeding Ratio . .
The l o va r i a t i on f o r t he core breeding r a t i o (4.9%) is about t h e same a s t h a t f o r 28c/49f (4 .2Z) , a s expected, but i s about double t h e value f o r t he blanket breeding r a t i o (2.5%). The so lu t ions wi th t he smallest breeding r a t i o s (UKAEA and Cadarache) a l so have:
. - t h e smallest 28c/49f, - t h e smal les t <oE8> (with t he JAERI-2 so lu t ion) , - t he l a r g e s t k f and k, and - t he l a r g e s t pG4 (with t h e Karlsruhe s o l u ~ i o n ) . ~
. .
The so lu t ions with t h e l a r g e s t breeding r a t i o s (Belgium and USSR have :
- t h e l a r g e s t 28c/49f , - t he smallest <02'>,
- t he smallest k f f and km (Belgium only), - t he l a r g e s t p2$ (with t he CNEN and Cadarache so lu t ions) and - t he smallest sodium-void.
Most of these t rends a r e consis tent and e a s i l y understandable. The -
cor re la t ion with sodium void is not apparent and may be only accidental . The strong cor re la t ion between 28c/49f and breeding r a t i o , k,ff and k, i s
'very apparent. . .

C e n t r a l Contro l Rod North
The l a r g e incons i s t ency i n t h e s e r e s u l t s (see Table 111) was one o f t h e r e a l s u r p r i s e s a s s o c i a t e d w i t h t h i s exe rc i se . The l o v a r i a t i o n s f o r t h e sodium-in and sodium-voided c a s e s of 14% and 10% a r e unusua l ly l a r g e compared t o normal accuracy requirements f o r c o n t r o l rod c a l c u l a t i o n s . The s o l u t i o n s wi th t h e l a r g e s t c e n t r a l c o n t r o l rod worths (USSR, Cadarache and UK4FA) a r e n o t we l l - co r re l a t ed w i t h t h e s o l u t i o n s w i t h t h e l a r g e s t -
B10 c e n t r a l p o r a l though t h e Cadarache and UKAEA s o l u t i o n s d i d
L L
. have r e l a t i v e l y l a r g e v a l u e s of p B l O . The 1 u v a r i a t i o n f o r t h e c e n t r a l c o n t r o l rod r e s u l t s i s two t o t h r e e t imes l a r g e r than t h a t f o r t h e cen-
B10 t r a l p r e s u l t s i n d i c a t i n g t h a t t h e l a r g e v a r i a t i o n i n t h e c o n t r o l rod r e s u l t s i s more than simply a normal i za t ion problem. D i f f e r e n c e s i n t h e c a l c u l a t e d r a d i a l power shapes ( t o b e more f u l l y d i scussed below) con- t r i b u t e s i g n i f i c a n t l y t o t h e c e n t r a l c o n t r o l rod problem. The more * h i g h l y buckled shapes (see Fig. 1 ) of t h e UKAEA and Cadarache s o l u t i o n s tend t o enhance t h e worth o f t h e c e n t r a l rod: however. t h e s e s h a ~ e s have
. .
a similar a f f e c t on t h e c e n t r a l pB10 and t h e o t h e r c e n t r a l worths. Thus, t h e buckl ing e f f e c t c o n t r i b u t e s b u t does not e x p l a i n t h e c o n t r o l rod pro- blem. F i g u r e 2 shows ANL c a l c u l a t i o n s of t h e r a d i a l d i s t r i b u t i o n s r r i th
t h e rod i n s e r t e d i n d i c a t i n g l a r g e s p a t i a l p e r t u r b a t i o n s , and d i f f e r i n g s p a t i a l f l u x p e r t u r b a t i o n s r e s u l t i n g from rod i n s e r t i o n may be c o n t r i - , ..
bu t ing t o t h e c o n t r o l rod problem. F u r t h e r a n a l y s i s i s needed on t h i s po in t .
Another low energy i n d i c a t o r i s t h e Doppler e f f e c t , bu t t h e r e ap- p e a r s t o be no c o r r e l a t i o n w i t h t h e c o n t r o l rod worths. The UKAEA and Cadarache s o l u t i o n s had average Doppler v a l u e s and t h e USSR s o l u t i o n a c t u a l l y had a low Doppler va lue . I n another apparen t incons i s t ency , t h e JAERI-3 s o l u t i o n has e s s e n t i a l l y t h e s m a l l e s t c e n t r a l c o n t r o l rod r e s u l t s
. bu t h a s t h e l a r g e s t <uBlO>, pB10 and Doppler values." t r
Sodium-Void R e a c t i v i t y
Considering t h e t r a d i t i o n a l d i f f i c u l t y i n sodium-void c a l c u l a t i o n s , t h e l a v a r i a t i o n s of 13% and 17% i n t h e r e s u l t s ( see Table 111) a r e s u r p r i s i n g l y good. The Belgium v a l u e s seem t o be somewhat i n c o n s i s t e n t and c o n t r i b u t e s i g n i f i c a n t l y t o t h e l a v a r i a t i o n and t h e maximum spread i n t h e r e s u l t s . The sodium-void r e s u l t s do n o t c o r r e l a t e w e l l wi th
Na Na <'tr
> o r p . The s o l u t i o n s w i t h t h e s m a l l e s t sodium-void r e s u l t s a r e
Belgium and USSR, and t h e s o l u t i o n wi th t h e l a r g e s t r e s u l t i s EIR-1. Na
The Belgium and EIR-1 s o l u t i o n s have t h e sma l l e s t p and t h e Belgium
s o l u t i o n h a s t h e l a r g e s t ?crNaz which appea r s t o be i n c o n s i s t e n t . t r . , . -
*Note added i n press;? The.JAER1-3 Doppler r e s u l t w i l l be r e v i s e d and t h e .. EIR-1 Doppler r e s u l t does n o t inc lude t h e unresolved resonance con t r ibu - t i o n and may be r ev i sed . . . . . .

Doppler React ivi ty
The l a va r i a t i ons of t h e Doppler va lues . ( l 3% and 18%) a r e s l i g h t l y l a rge r than f o r t he sodium-void values. This i s a somewhat unexpected r e s u l t which could be due t o e i t h e r t he temperature dependence of t h e 2 3 8 ~ c ros s sec t ion o r the low energy flux. There i s no s t rong evidence t h a t the spread i n t h e Doppler r e s u l t s is correla ted with d i f fe rences i n t h e low energy flux. The USSR solut ion, which has among t h e lowest Dop- p l e r values , has t he l a r g e s t c e n t r a l control rod r e s u l t s and an average . .
: pB10 r e s u l t . The JAERI-3 solution* has l a rge Doppler values; however, it has t h e smallest c e n t r a l contro1,rod value. The c e n t r a l control rod . .
r e s u l t s have cons is ten t ly not correla ted with other low energy indica-' tors . There appears t o be some d i f f i c u l t y with the Swedish Doppler sol-
. . ut ion which has t he l a r g e s t sodium-in Doppler and the smal les t sodium- . . void Doppler.
Radial Dis t r ibut ions
Another of t he more surpr i s ing r e s u l t s is the large' spread i n t he . .
r a d i a l worth and power d i s t r i bu t ions a s seen i n Figs. 1 and 3. This spread i s not indicated i n the a x i a l worth p r o f i l e s (shown i n Fig. 4) which a r e very consis tent . The Cadarache, UKAEA and USSR r a d i a l solu- t i o n s show the l a r g e s t inner core buckling while the Swedish s o l u t i o n , . .
had the smallest, inner core buckling. . . . .
1t is apparent t h a t d i f f e r ing r a d i a l d i s t r i bu t ions a f f e c t , by sev- e r a l percent, both the inner core t o .outer core power s p l i t and center t o core-average f l u x and ad jo in t r a t i o s . These l a t t e r r a t i o s , of course, a f f e c t t h e c e n t r a l ' r e a c t i v i t y worths - bringing the values of Cadarache, UKAEA, and USSR up r e l a t i v e to those of t he other par t ic ipants . The ef- f e c t i s about 10% due to S % , e f f e c t s f o r both the f l ux and adjoint . The c e n t r a l control rod i s s imi l a r ly affected. - I t i s a l s o i n t e r e s t i n g t o
. a note t h a t t he Cadarache and UKAEA solu t ions have the l a r g e s t keff values while t h e Swedish so lu t ion has t h e smallest keff . The funct ional form of the r e l a t i onsh ip ( i f any) between. t he r a d i a l d i s t r i bu t ions a n d . k e f f . i s not known. . .
. .
Because of t h e consistency i n the a x i a l p r o f i l e s (e.g., s e e t h a t of B10
p i n Fig. 4) i t i s concluded t h a t the discrepancies i n t he r a d i a l d i s t r i bu t ions a r e not due simply t o d i f fus ion coe f f i c i en t e f f e c t s r e su l t - ing from differences i n thc t ransport cross sections. I n f a c t , i t op- pears t h a t the cause of the d i f f e r ing r a d i a l d i s t r i bu t ions is re l a t ed t o d i f f e r i n g k, increments produced by the inner core t o ou te r core en- richment change. Given t h e inner core k,, the specif ied enrichment change produces a k, increment which depends on the cross 'sections (which d i f f e r between pa r t i c ipan t s ) ; and the k, s p l i t between inner and , I
*Note added i n press. The JAERI-3 Doppler r e s u l t w i l l be revised and the EIR-1 Doppler r e s u l t does not include the unresolved resonance cont r i - bution and may be revised.
outer cores determines t he r a d i a l power p ro f i l e . The inner core to ou te r core k 2 r a t i o* i s l a rges t f o r the Swedish so lu t ion and smal les t f o r
B the Cadarache so lu t ion which cor re la tes well with the f a c t t ha t the Swedish so lu t ion displays the f l a t t e s t r ad i a l power p r o f i l e while t he Cadarache so lu t ion is among the steepest . This cor re la t ion between k
~2 s p l i t and inner core/outer core power s p l i t was observed f o r most p a r t i c i - pant ' s solut ions .
A s shorm i n Fig. 2, t h e cen t r a l cont ro l rod causes a l a rge perturba- '
. t i o n i n t h e r a d i a l power prof i le . The s i z e of t he r a d i a l f l u x s h i f t in- duced by cont ro l rod in se r t i on almost ce r t a in ly depends on the inner . core t o ou te r core k, r a t i o . Thus, i t is expected t h a t t he d i f f e r ing inner core t o outer core k, r a t i o s among the pa r t i c ipan t s a r e contribu- t i ng t o t he l a r g e observed var ia t ions i n control rod w r t h . Also,, a s shown i n Fig. 2, a r ad i a lpower s h i f t occurs upon sodium voiding. The . .
s i z e of t h i s s h i f t i s expected t o depend on the inner core t o ou te r core k, r a t i o . Further ana lys i s i s needed t o quant i ta t ive ly understand these e f fec t s . The apparent s e n s i t i v i t y of the r a d i a l d i s t r i b u t i o n s i n l a r g e
' two-zone cores is an in te res t ing ' and po ten t i a l l y important problem.
S t ruc tura l Cross Sections
Large va r i a t i ons i n t he s t r u c t u r a l cross sec t ions are.observed. The Fe
l u va r i a t i ons are' 15% f o r <u > (see Table IV) and 25%, 39% and 15%, tr
respect ively, f o r t he iron, chromium and n icke l capture r a t e s (not shown i n t he tables) .
Central Worth Discrepancy
Typical C/E values f o r f i s s i l e isotope c e n t r a l r e a c t i v i t y worths i n c r i t i c a l assemblies a r e 1.15-1.20 f o r ENDFIB-IV ca lcu la t ions and -1.0 f o r ca lcu la t ions using t h e adjusted s e t s (e.g., CARANVAL-I11 and FGL~). These differences could be due t o dif ferences i n the calculated c e n t r a l worths (6k/k u n i t s ) , d i f fe rences i n the B e f f ' s used i n t he data re- duction o r o the r d i f fe rences i n t he experiments. When corrected f o r d i f - ferences i n t he r a d i a l f l u x d i s t r i bu t ions the calculated c e n t r a l worths f o r ENDFIB-IV and the adjusted s e t s a r e about t he same. The B e f f va lues d i f f e r by 5.5-7.0%, which leaves about 10% of the cen t r a l worth discre- pancy due t o e i t he r experimental problems o r unaccounted f o r i n t h i s ex- ercise . It is unl ikely t h a t a dif ference a s l a rge a s 10% can be a t t r i - buted t o the experimental techniques.
*While t he k, values f o r the outer core were not calculated, a r e l a t ed parameter can be calcula,ted,from the neutron balance data . Called kRZ
- i t i s the r a t i o of f i s s i o n production t o absorption f o r t h e c r i t i c a l l y - buckled spectrum.
COMPARISON OF RESULTS FROM ADJUSTED AND NON-ADJUSTED DATA SETS
The comparison ca lcu la t ion provided an opportunity t o intercompare predict ions based onnon-adjusted and adjusted data se t s . To f a c i l i t a t e such a comparison, t he r e s u l t s f o r one group e f f ec t ive c ros s sec t ions and f o r several key i n t e g r a l parameters have been organized i n t o the cat- egories: *
- A l l Solutions - Adjusted-Data-Set Solutions Only - Non-Adjusted Data Set Solutions Only - ENDF/B-IV Data Set Solutions Only
For each of t h e categories, the mean value and the standard deviat ion a r e
e computed. Tables V I and V I I show the r e s u l t s of such a grouping.
A s regards t he s i z e s of var ia t ions i n cross sect ions , inspect ion of Table V I l eads t o t he following conclusions:
- For pa r t i c ipan t s using the same (ENDF/B-IV~ basic da t a s e t , but d i f f e r e n t processing codes:
% The va r i a t i on i n heavy element <u>'s i s small (<I%) except f o r
. <uG8> where a 7% standard deviat ion is . seen, but .
the va r i a t i on i n l ighc-element <btr> i s l a rge i a r t i c u l a r l y f o r Fe ('16.92%).
- It appears then, t h a t even with a given basic data s e t , c ross . ' ' sec t ion processing d i f fe rences lead t o non t r iv i a l d i f fe rences ---. i n cross sections.
.\ - For pa r t i c ipan t s using adjusted basic data se t s :
va r i a t i ons i n both heavy element and l i g h t element <u>'s a r e of t h e same c h a r a c t e r i s t i c s i z e a s t h e v a r i a t i o n s observed among the pa r t i c ipan t s using non-adjusted data se t s . . . ' . . . .
~~ .. .
- Independent adjustment processes then, do not lead t o a comon s e t of cross s ec t ions -- though (as w i l l be discussed next) they may lead t o a common s e t of calculated in t eg ra l parrimeters.
A s regards s i z e s of va r i a t i ons i n t he i n t eg ra l parameters, inspec- t i o n of Table V I I leads t o t he following conclusions:
- The users of adjusted s e t s generally achieve a smal ler v a r i a t i o n i n i n t e g r a l parameters than do the users of non-adjusted s e t s .
r I
- ; *The HEDLresults a r e not included i n any of t he groupings s ince they were
submitted a f t e r the i n i t i a l compilation of t h e r e s u l t s . .I
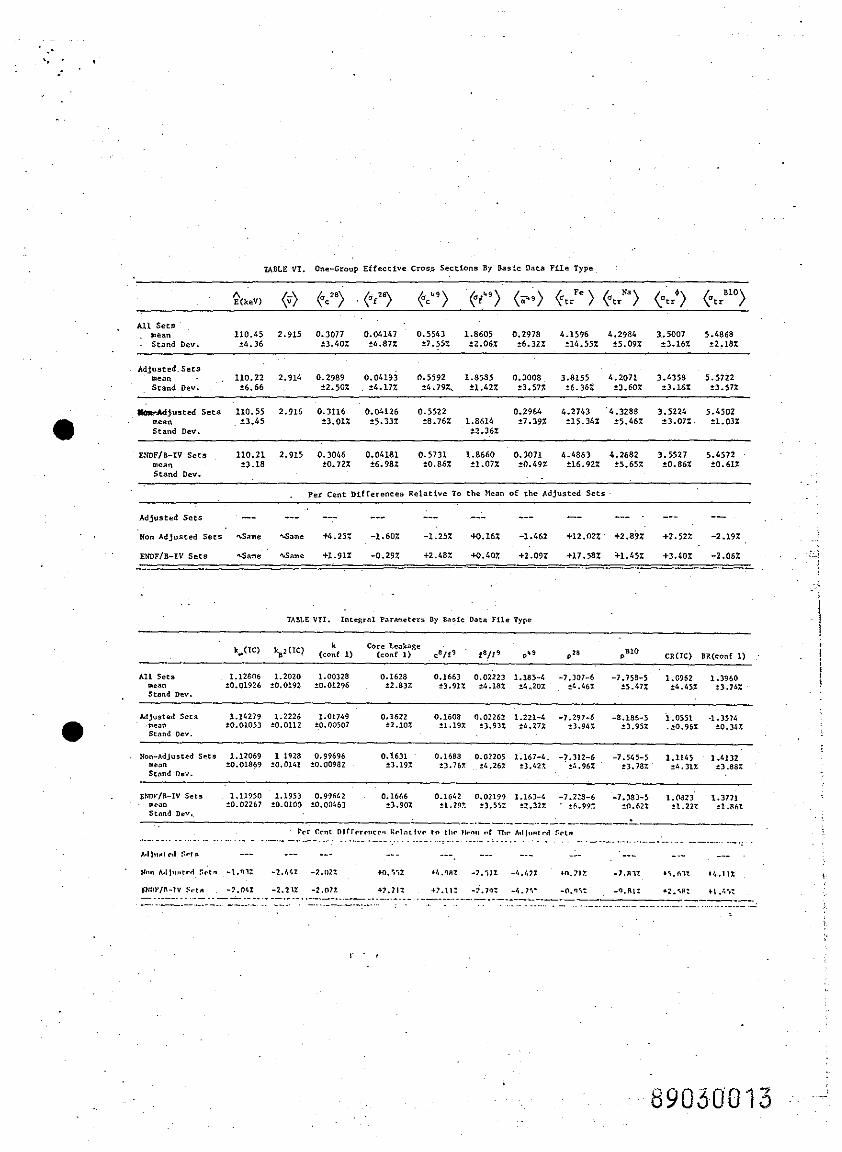
AIL Sets mean 110.45 2.915 0.3077 0.04147 0.5543 1.8605 0.2978 4.1596 1.2981 3.5007 5.6868 Stnnd Dev. $4.36 L3.401 14.871 ?7.551 f2.06X 6 . 1 2 '14.55% $5,091 $3.161 f2.181
Adjusted s e r a mean 110.22 2.914 0.2989 0.04193 0.5592 1.8535 0.3008 3.8155 4.2071 3.4358 5.5722 S t a n d Dev. t6.66 $2.501 f4.17Z f4.79& f1.42Z $3.571 f6.36Z 13.60% r3.161 '3.57%
-)usred Sets 110.55 2.916 0.3116 O.OL126 0.5522 0.2964 4.2741 C.3288 3.5224 5.4502 meen 23.45 t3.012 5 . 3 3 1 f8.761 1.8614 ?7.39% 15.14% 25.46% ?1.07% 5 . 0 3 1 Stand D ~ V . $2.16%
E ! ~ F / & - I V S e r r 110.21 2.915 0.3046 0.04181 0.5731 1.8660 0.1071 4.C861 4.2682 3.5527 5.4572 mean $3.18 t0.721 5 . 9 8 1 $0.861 *1.071 37.492 ?16.921 $5.651 9 .86% e0.612 Brand Dev.
Adjusted Sets -- --- -.- --- --- --- --- -- --- . - -- -- ' ~ ~ ~ A d j u r r e d S e r + %Same G a m e i 4 .25 i -1.60% -1.25% +3.16% - 1 . 6 +12.021 r 2 . 8 9 ~ +2.52% -2.19:
E N D F / B - I V S ~ ~ S *.Same Gene +1.91% -0.291 +2.48% m.407. r2.091 + I 7 8 5 % +3.40% -2.06% -. - - -. . -- -- .
I . ,

Variation among Variation among users of adjusted users of Non-adjusted
Parameter Sets Sets
k, 20.01 +o. 02
keff 20.005 .+0.010
28c149f +l. 2% 53.7% . .
CR (IC) 21% . +4 % . .
. . BR (Config. 1 ) t0.3% t3.9%
B10 - For 28c/49f, pb9, p2* and p . , however, t he va r i a t i ons a r e of..about . t h e same s ize . This i sunexpec ted s ince these measurable parameters
were used i n t h e adjustment procedure. (The l a r g e - v a r i a t i o n s i n the c e n t r a l worths. a s discussed above. a r e due i n Dart t o t h e d i f f e r e n t r a d i a l f l u x prof i les . )
- The va r i a t i on i n i n t eg ra l parameters among pa r t i c ipan t s using t h e same (ENDFIB-IV) basic data s e t but d i f f e r en t processing codes is, a s a ru le , a s l a rge a s t h e var ia t ion among' a l l par t ic ipants . Thus, va r f a t ions due t o processing alone introduce s u b s t a n t i a l v a r i a t i o n i n i n t e g r a l parameter prediction. . . . .
' Tables V I and V I I display, i n t he bottom two rows, t he percent . .
. deviat ions of t he mean values of t h e non-adjusted and the EhQEIB-IV , s e t s from the corresponding mean values f o r t he adjusted sets . An examination . . .' -. of these da ta can be made t o observe cor re la t ions between t rends i n effec- t i v e cross s ec t ion values and the r e su l t i ng trends i n i n t eg ra l parameters. Study o f T a b l e s V I and V I I leads t o the following conclusions.
- For heavy element c ross sections:
f o r <T> and <1% Difference Between ~ r o u ~ i n ~ s
f o r <a:% Adjusted Sets ?A% < Non-Adjusted I t " %2% < ENDFIB-IV
f o r <a49> Adjusted Sets ?1.5% > Non-Adjusted I t
I' %2% < E~FIB- IV . f o r <aZ8> Adjusted Sets %1.6% > Non-Adjusted
11 " %\.Same a s ENDFIB-IV
- For l i g h t element c ross sections:
f o r <bFe> tr Adjusted Sets 'l.12 t o 18%' <Nan-Adjusted
and ENDFIB-IV
Na f o r <otr> and <a6 > Adjusted Sets i1.5 t o 3% Non-Adjustgd t r and ENDFIB-IV
B10> 4 , <a Adjusted Sets %2% > Non-Adjusted and t r ENDFI B-IV
Based on these t rends one might expect tha t , r e l a t i v e t o the non- adjusted and ENDF/B-IV s e t s , t he adjusted s e t s would:
- underpredict conversion r a t i o , breeding r a t i o , 28c/49f and p28, - overpredict km, 28f/49f , and core leaka e and - produce about t he same r e s u l t on ph9 , p g l O , and keff
Examination of Table VII shows t h a t these expectations a r e eneral ly met f o r core conversion r a t i o , breeding racio, 28c/49f , L, and 58f/49f . However, some surpr i ses occurred:
B10 - p4' and p changed more than expected, - p28 changed l e s s than expected and - core leakage changed opposite t o expectation.
CONCLUSIONS
Some of the more important conclusions r e su l t i ng from t h i s exer- c i s e a r e summarized below.
- There a r e l a rge differences i n t he r a d i a l f i s s i o n r a t e and worth d i s t r i bu t ions among the solutions. The r a d i a l d i s t r i bu t ions appear t o be sens i t i ve t o small var ia t ions i n the inner core t o outer core k, increment produced by the specif ied inner core t o outer core en- richment change. Par t ic ipants whose solut ions disagree on the 1250
' MI?e s i z e comparison ca lcu la t ion have each obtained good agreement with experiments on 300 MlJe s i z e c r i t i c a l experiments. Thus, t he re i s a s t rong i n t e r e s t i n t he r e s u l t s of l a rge r c r i t i c a l experiment r eac t ion r a t e d i s t r i bu t ion measurements.
- There a r e very l a rge differences (over 45%) i n t he calculated ' c e n t r a l control rod worth. These differences a r e not well- cor re la ted with t he c e n t r a l boron worths. They a re , however, r e l a t ed t o (but not f u l l y explained by) the differences i n r a d i a l d i s t r ibu t ions . A s above, a strong i n t e r e s t e x i s t s i n control rod measurements on l a rge r core c r i t i c a l s .
- Generally, s t rong cor re la t ions were observed among the parameters kef f , k,, breeding r a t i o , <uZ8>, and 28c/49f (e.g., so lu t ions having high and 28c /49f , displayed high breeding r a t i o and low keff). On the other hand, the cor re la t ions among the c e n t r a l worths, cont ro l rod worth, leakage, and sa fe ty paraneters were found t o be weak.
- There a r e l a rge va r i a t i ons i n the s t r u c t u r a l cross sec t ions and capture r a t e s . These appear t o be due a s much t o processing a s t o basic data f i l e s . ,

. . .
- Signif icant dif ferences a r e observed between the one-group effec- t i v e c ross sec t ions from t h e adjusted da ta s e t s compared t o t h o s e from the non-adjusted da t a se t s .
~ - The s c a t t e r i n t he values of t he adjusted c ross sec t ions i s a s g rea t a s t h e s c a t t e r i n t h e values of thenon-adjusted cross sec- t ions . The s c a t t e r due t o d i f f e r en t processing of t he same da ta s e t i s a s l a rge a s the s c a t t e r between data se t s . . .
- The s c a t t e r i n t he i n t e g r a l parameters calculated from adjusted da ta s e t s i s l e s s than t h a t f o r parameters ca lcu la ted fromnon-
. adjusted s e t s f o r keff, k,, breeding r a t i o and28c/49f . On ' t he o the r hand, t h e s c a t t e r i n .28 f /49 f , cen t r a l worths, and the
. . ' s a f e ty parameters i s a s l a r g e among the use r s of adjusted da ta s e t s a s i t i s among users of non-adjusted data s e t s .
- The f a c t t h a t t he u s e r s of ENDF data have t r ad i t i ona l lyobse rved . . a cen t r a l worth discrepancy of 15 t o 20% i n f i s s i l e r e a c t i v i t y .
0 worths while u se r s of FGL5 and CARNAVAL-I11 data have n o t o b - served t h i s d i s c r e p a n c y i s inconsis tant with the r e s u l t s of t h i s comparison exercise. . .
- The va r i a t i on i n t he r e s u l t s observed i n t he NEACRP comparison e x e r c i s e i s a measure of t he d i f fe rences i n the nuclear. data f i l e s and/or t h e d a t a processing codes i n t h e p a r t i c i p a t i n g coun- t r i e s . It is re la ted to , but not a measure o f , t he uncer ta inty i n the ca lcu la t ion of LMFBR parameters. The a c t u a l design un- ce r t a in ty i n most of t h e parameters is l e s s than i s indicated by t h e spread i n t he calculated r e s u l t s because r eac to r designers
. . rou t ine ly apply b i a s f a c t o r s (usually derived from c r i t i c a l ex- periments) t o t h e i r calculated r e su l t s . The b ias f ac to r s , which would have the e f f e c t of reducing the spread among t h e r e s u l t s , have not been applied i n t h i s exercise.
. .
- The. NEACRP comparison exerc i se has c l e a r l y pointed out an uncer- , . .
t a i n t y concerning the a b i l i t y t o cor rec t ly compute t he r a d i a l power d i s t r i bu t ion i n l a r g e f a s t reactors . This uncer ta inty
. . impacts most r eac to r performance and sa fe ty parameters.
. .
REFERENCES
1. Baker, A. R., and Hammond, A. D., "Calculations f o r a Large Fast Reactor," TRG Report 2133 (R) 1971.
2. C o l l i n s , P. J., pr iva te communication.
Recommended