2 © Nokia Siemens Networks Network VQE/ THEPIE FAPI/ October 2007
Network Voice Quality Enhancement Through LPC Parameters
Modifications:’’ Noise Reduction Within Network through Modification of the
LPC Parameters’’, 7th ITG-SCC 2008.
October 2007
Emmanuel THEPIE FAPI
3 © Nokia Siemens Networks Network VQE/ THEPIE FAPI/ October 2007
Outline
� Introduction.
� Network Speech Enhancement: The Concept.
� CELP Overview.
� LPC Analysis: The LPC coefficients.
� Noise Reduction through LPC coefficients.
� Voice Activity Detector (VAD).
� Experiments Results.
� Simulation Results.
� Conclusion.
4 © Nokia Siemens Networks Network VQE/ THEPIE FAPI/ October 2007
Introduction
Voice Quality Enhancement (VQE) algorithms now appear as solution to improve speech quality whithin network.
Classical Algorithms: decoding of the bitstream, performing the enhancement on the decoded signal and re-encoding the processed speech signal.
Consequence:computational expensive, additive delay and reduction of the speech quality due to tandeming effect.
Alternative Approach: modification of the bitstream itself to avoid tandeming effect.
5 © Nokia Siemens Networks Network VQE/ THEPIE FAPI/ October 2007
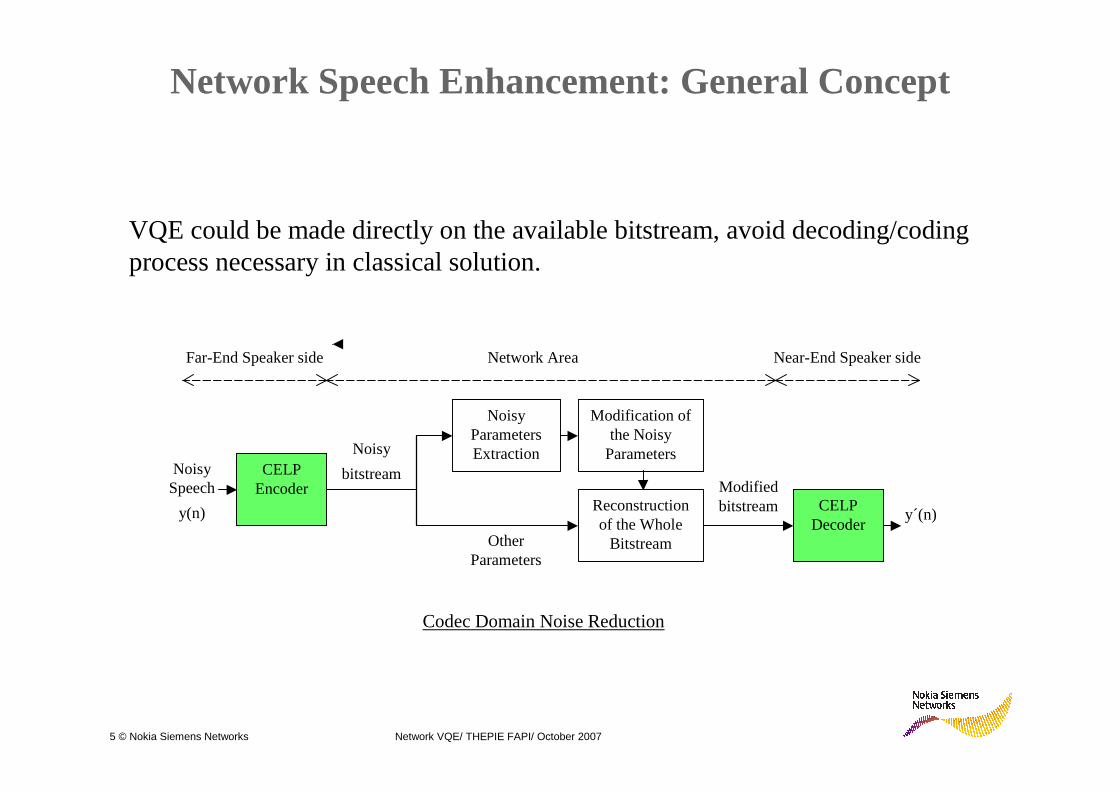
Network Speech Enhancement: General Concept
VQE could be made directly on the available bitstream, avoid decoding/coding process necessary in classical solution.
CELP Encoder
Noisy Speech
y(n)
Noisy Parameters ExtractionNoisy
bitstream
Modification of the Noisy
Parameters
OtherParameters
Reconstruction of the Whole
Bitstream
Modified bitstream CELP
Decoder
Network AreaFar-End Speaker side Near-End Speaker side
y´(n)
Codec Domain Noise Reduction
6 © Nokia Siemens Networks Network VQE/ THEPIE FAPI/ October 2007
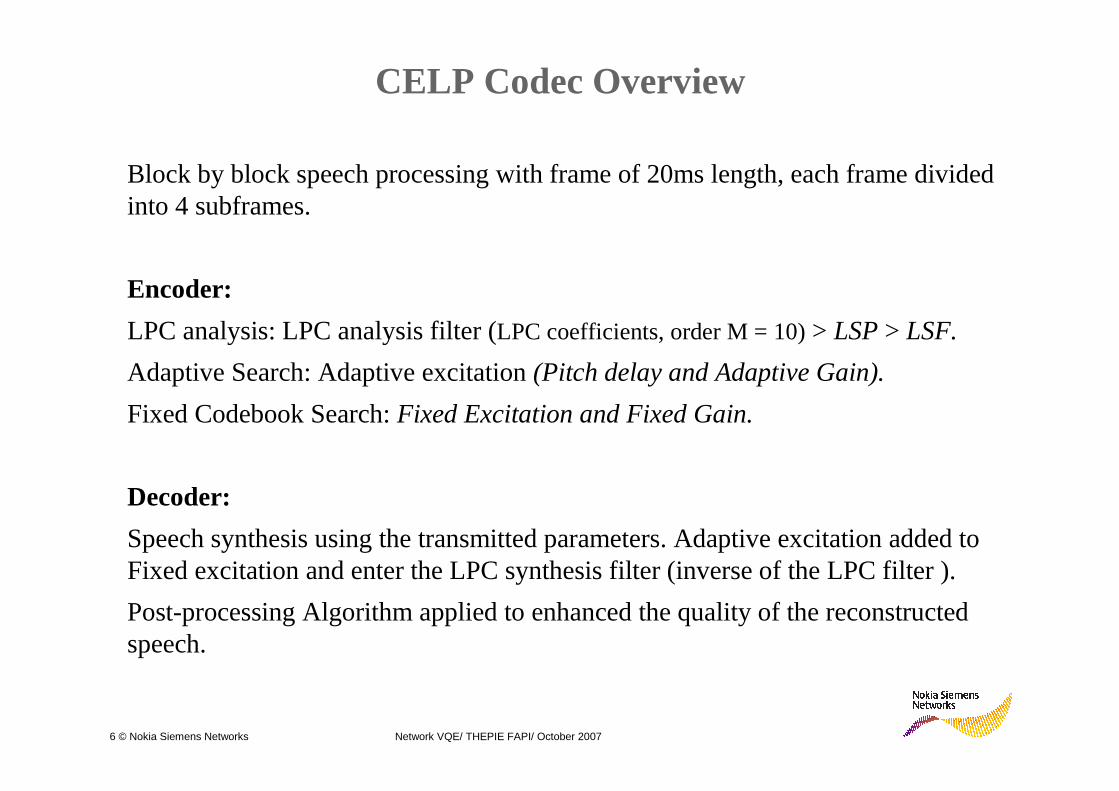
CELP Codec Overview
Block by block speech processing with frame of 20ms length, each frame divided into 4 subframes.
Encoder:
LPC analysis: LPC analysis filter (LPC coefficients, order M = 10)> LSP> LSF.
Adaptive Search: Adaptive excitation (Pitch delay and Adaptive Gain).
Fixed Codebook Search: Fixed Excitation and Fixed Gain.
Decoder:
Speech synthesis using the transmitted parameters. Adaptive excitation added to Fixed excitation and enter the LPC synthesis filter (inverse of the LPC filter ).
Post-processing Algorithm applied to enhanced the quality of the reconstructed speech.
7 © Nokia Siemens Networks Network VQE/ THEPIE FAPI/ October 2007
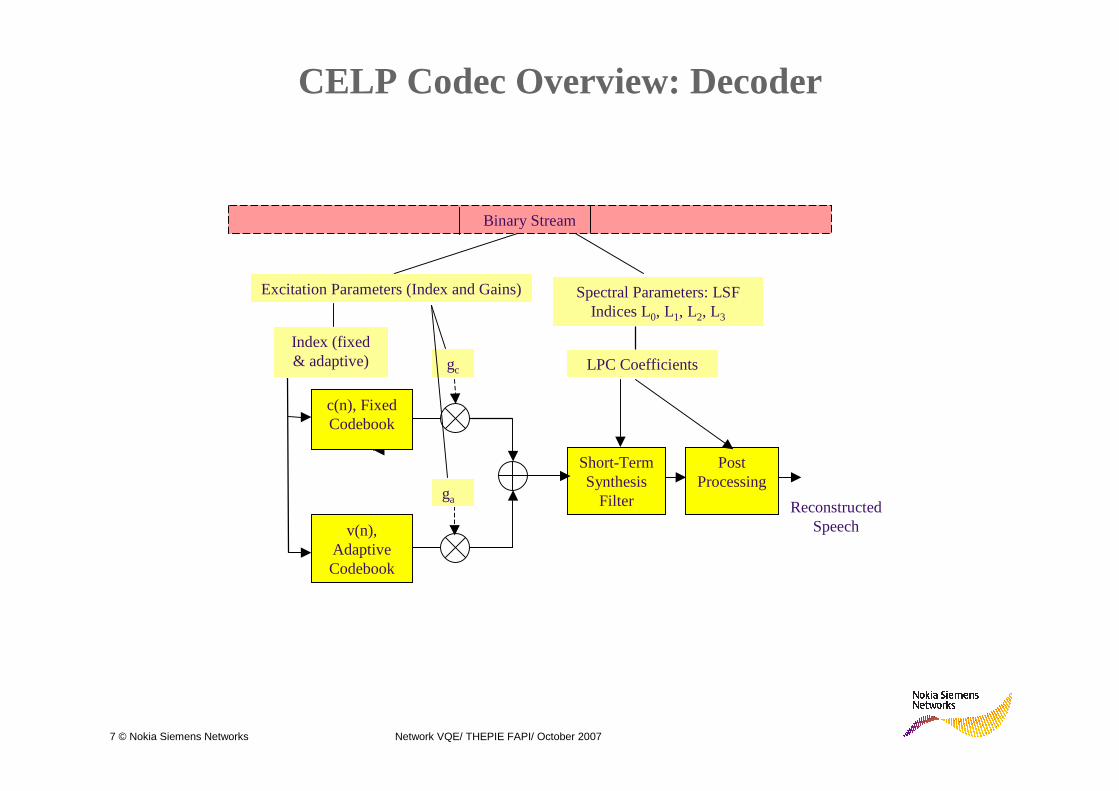
CELP Codec Overview: Decoder
v(n), Adaptive Codebook
Short-Term Synthesis
Filter
c(n), Fixed Codebook
Post Processing
gc
Reconstructed Speech
ga
Index (fixed & adaptive) LPC Coefficients
Binary Stream
Excitation Parameters (Index and Gains) Spectral Parameters: LSF Indices L0, L1, L2, L3
8 © Nokia Siemens Networks Network VQE/ THEPIE FAPI/ October 2007
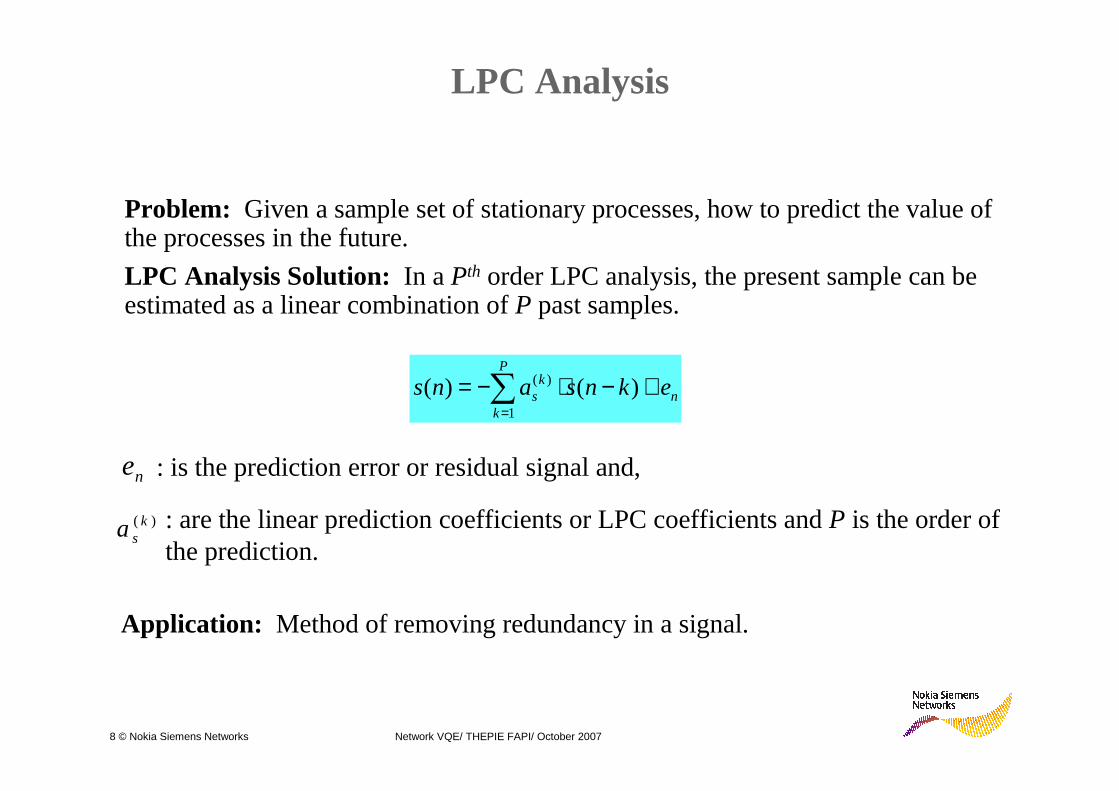
LPC Analysis
Problem: Given a sample set of stationary processes, how to predict the value of the processes in the future.
LPC Analysis Solution: In a Pth order LPC analysis, the present sample can be estimated as a linear combination of P past samples.
n
P
k
ks eknsans +−⋅−= ∑
=1
)( )()(
ne
)( ksa
: is the prediction error or residual signal and,
: are the linear prediction coefficients or LPC coefficients andP is the order of the prediction.
Application: Method of removing redundancy in a signal.
9 © Nokia Siemens Networks Network VQE/ THEPIE FAPI/ October 2007
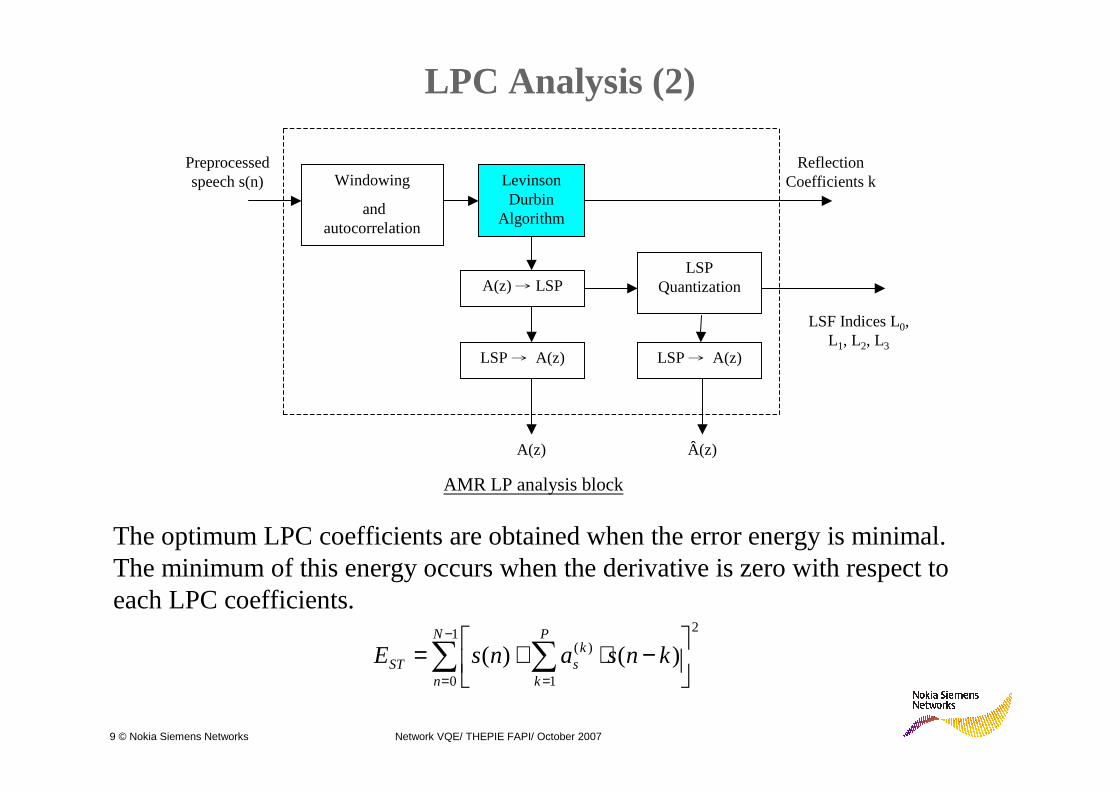
LPC Analysis (2)
AMR LP analysis block
Windowing
and autocorrelation
Levinson Durbin
Algorithm
A(z) → LSP
LSF Indices L0, L1, L2, L3
LSP → A(z)
LSP Quantization
LSP → A(z)
A(z) Â(z)
Preprocessed speech s(n)
Reflection Coefficients k
The optimum LPC coefficients are obtained when the error energy is minimal. The minimum of this energy occurs when the derivative is zero with respect to each LPC coefficients.
∑ ∑−
= =
−⋅+=1
0
2
1
)( )()(N
n
P
k
ksST knsansE
10 © Nokia Siemens Networks Network VQE/ THEPIE FAPI/ October 2007
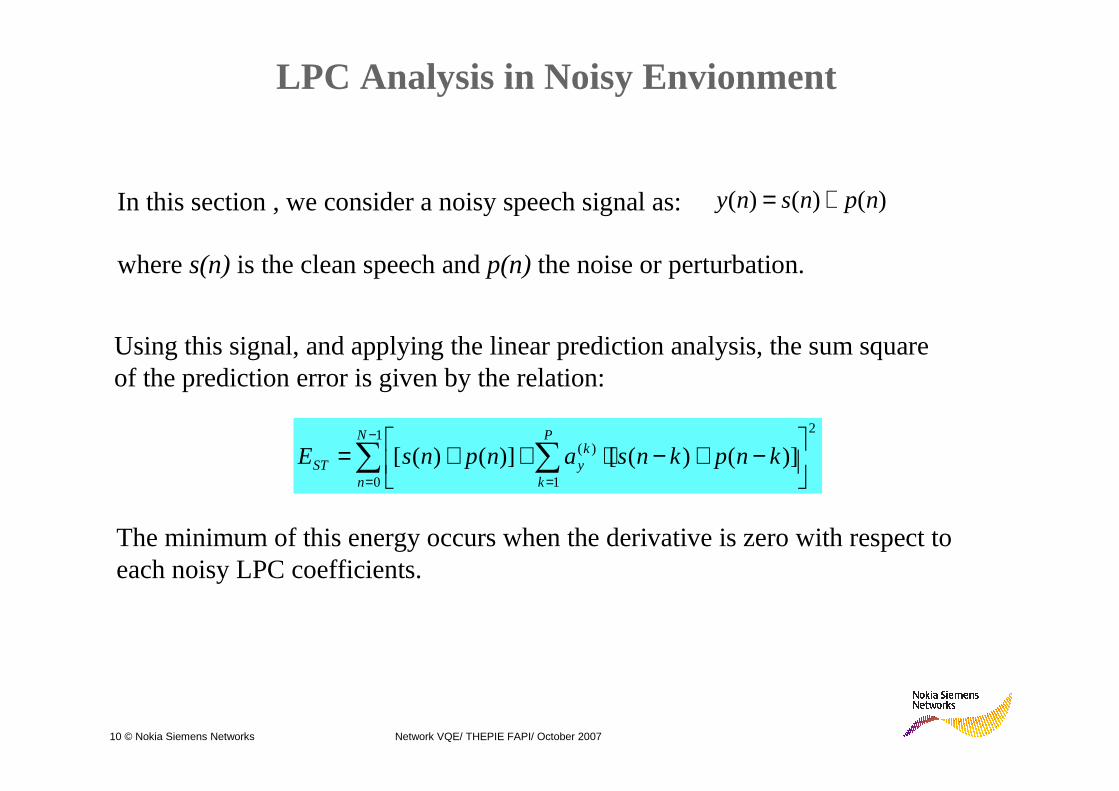
LPC Analysis in Noisy Envionment
In this section , we consider a noisy speech signal as: )()()( npnsny +=
where s(n) is the clean speech and p(n) the noise or perturbation.
Using this signal, and applying the linear prediction analysis, the sum square of the prediction error is given by the relation:
∑ ∑−
= =
−+−⋅++=1
0
2
1
)( )]()([)]()([N
n
P
k
kyST knpknsanpnsE
The minimum of this energy occurs when the derivative is zero with respect to each noisy LPC coefficients.
11 © Nokia Siemens Networks Network VQE/ THEPIE FAPI/ October 2007
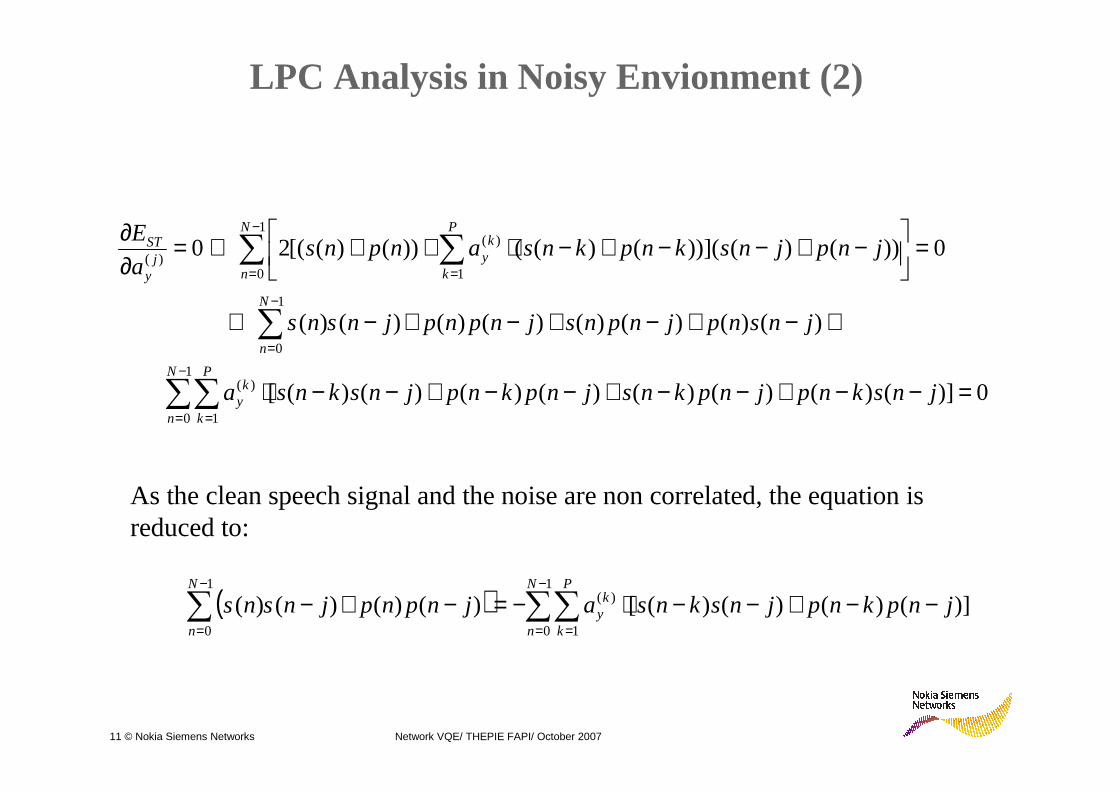
LPC Analysis in Noisy Envionment (2)
0)]()()()()()()()([
)()()()()()()()(
0))()())](()(())()([(20
1
0 1
)(
1
0
1
0 1
)()(
=−−+−−+−−+−−⋅
+−+−+−+−⇔
=
−+−−+−⋅++⇔=∂∂
∑∑
∑
∑ ∑
−
= =
−
=
−
= =
jnsknpjnpknsjnpknpjnsknsa
jnsnpjnpnsjnpnpjnsns
jnpjnsknpknsanpnsa
E
N
n
P
k
ky
N
n
N
n
P
k
kyj
y
ST
As the clean speech signal and the noise are non correlated, the equation is reduced to:
( ) )]()()()([)()()()(1
0 1
)(1
0
jnpknpjnsknsajnpnpjnsnsN
n
P
k
ky
N
n
−−+−−⋅−=−+− ∑∑∑−
= =
−
=
12 © Nokia Siemens Networks Network VQE/ THEPIE FAPI/ October 2007
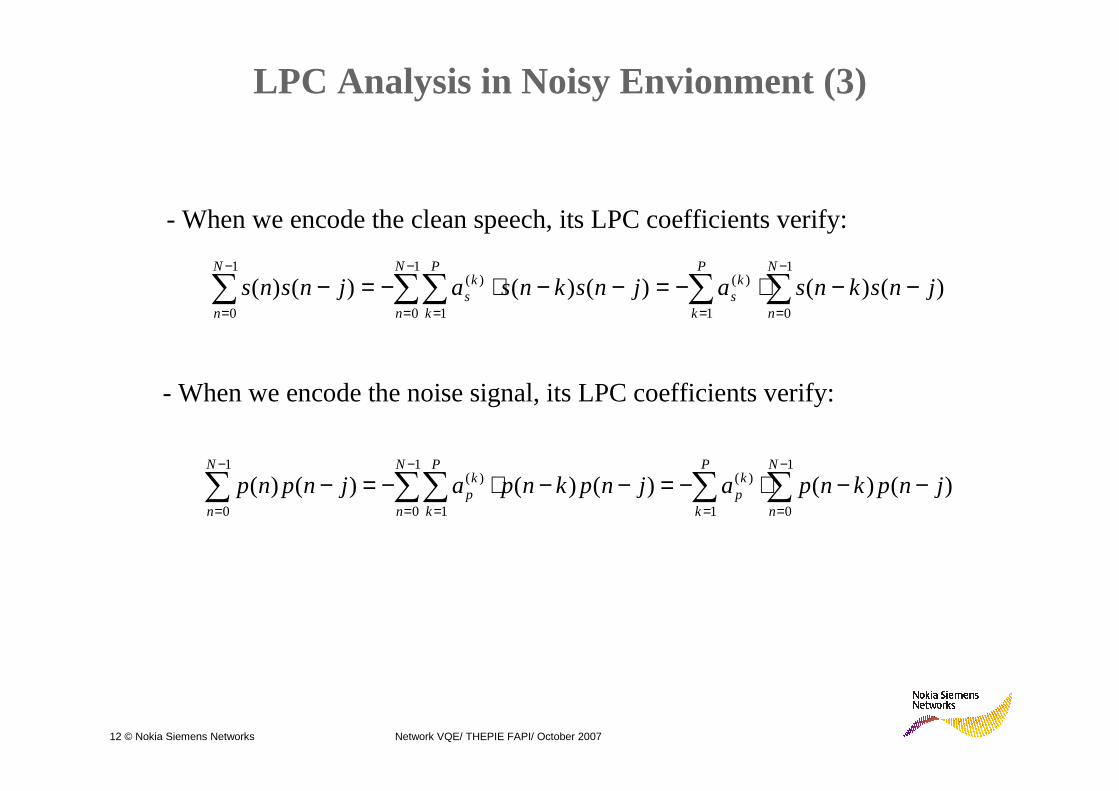
LPC Analysis in Noisy Envionment (3)
∑ ∑∑∑∑=
−
=
−
= =
−
=
−−⋅−=−−⋅−=−P
k
N
n
ks
N
n
P
k
ks
N
n
jnsknsajnsknsajnsns1
1
0
)(1
0 1
)(1
0
)()()()()()(
- When we encode the clean speech, its LPC coefficients verify:
∑ ∑∑∑∑=
−
=
−
= =
−
=
−−⋅−=−−⋅−=−P
k
N
n
kp
N
n
P
k
kp
N
n
jnpknpajnpknpajnpnp1
1
0
)(1
0 1
)(1
0
)()()()()()(
- When we encode the noise signal, its LPC coefficients verify:
13 © Nokia Siemens Networks Network VQE/ THEPIE FAPI/ October 2007
LPC Analysis in Noisy Envionment (4)
( ) )]()()()([)()()()(1
0 1
)(1
0
jnpknpjnsknsajnpnpjnsnsN
n
P
k
ky
N
n
−−+−−⋅−=−+− ∑∑∑−
= =
−
=
)]()()()([
)()()()(
1
0 1
)(
1
01
)(1
01
)(
jnpknpjnsknsa
jnpknpajnsknsa
N
n
P
k
ky
N
n
P
k
kp
N
n
P
k
ks
−−+−−⋅−
=−−−−−−
∑∑
∑∑∑∑−
= =
−
==
−
==
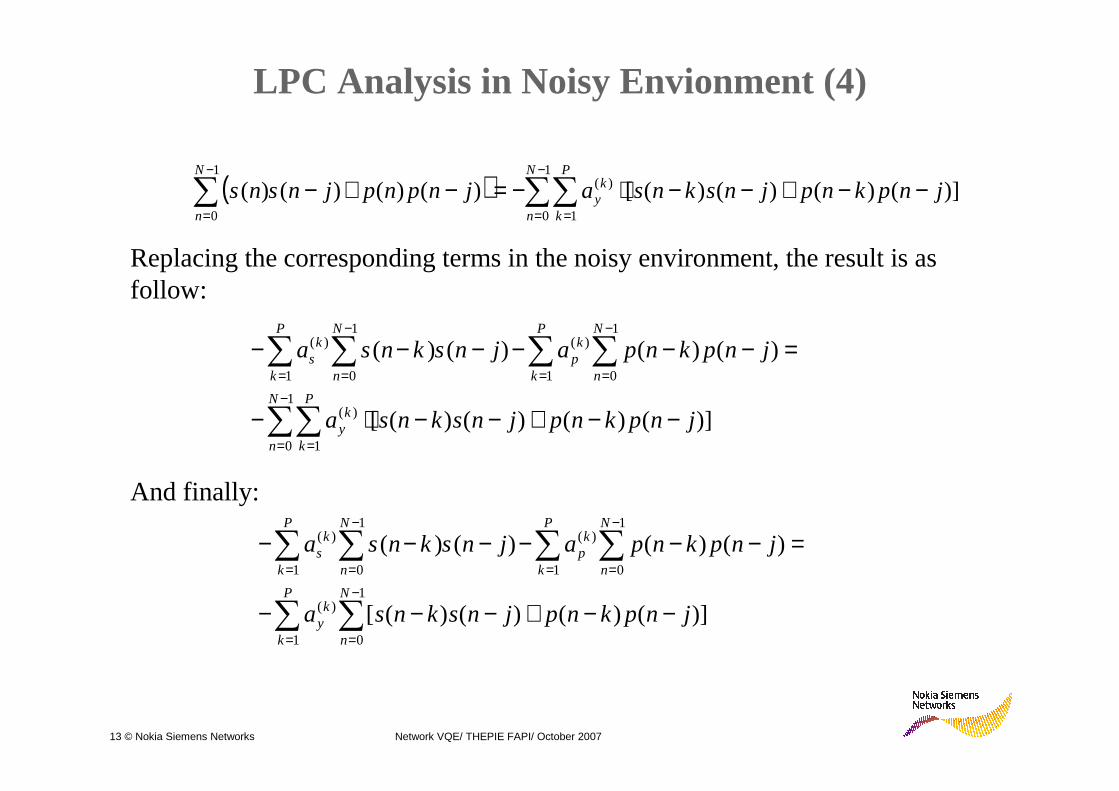
Replacing the corresponding terms in the noisy environment, the result is as follow:
∑ ∑
∑∑∑∑
=
−
=
−
==
−
==
−−+−−−
=−−−−−−
P
k
N
n
ky
N
n
P
k
kp
N
n
P
k
ks
jnpknpjnsknsa
jnpknpajnsknsa
1
1
0
)(
1
01
)(1
01
)(
)]()()()([
)()()()(
And finally:
14 © Nokia Siemens Networks Network VQE/ THEPIE FAPI/ October 2007
LPC Analysis in Noisy Envionment (5)
ypskjnkinkjirN
nk ,,,)()()(
1
0
=−⋅−=− ∑−
=
ypskjir Pjikk ,,,))(( ,1 =−=Γ ≤≤
ypskinknkirN
nk ,,,)()()(
1
0
=−⋅=∑−
=
ypska Piti
kk ,,,)( ,,1)( ==Α = K
ypsppss Α⋅Γ+Γ=Α⋅Γ+Α⋅Γ )(
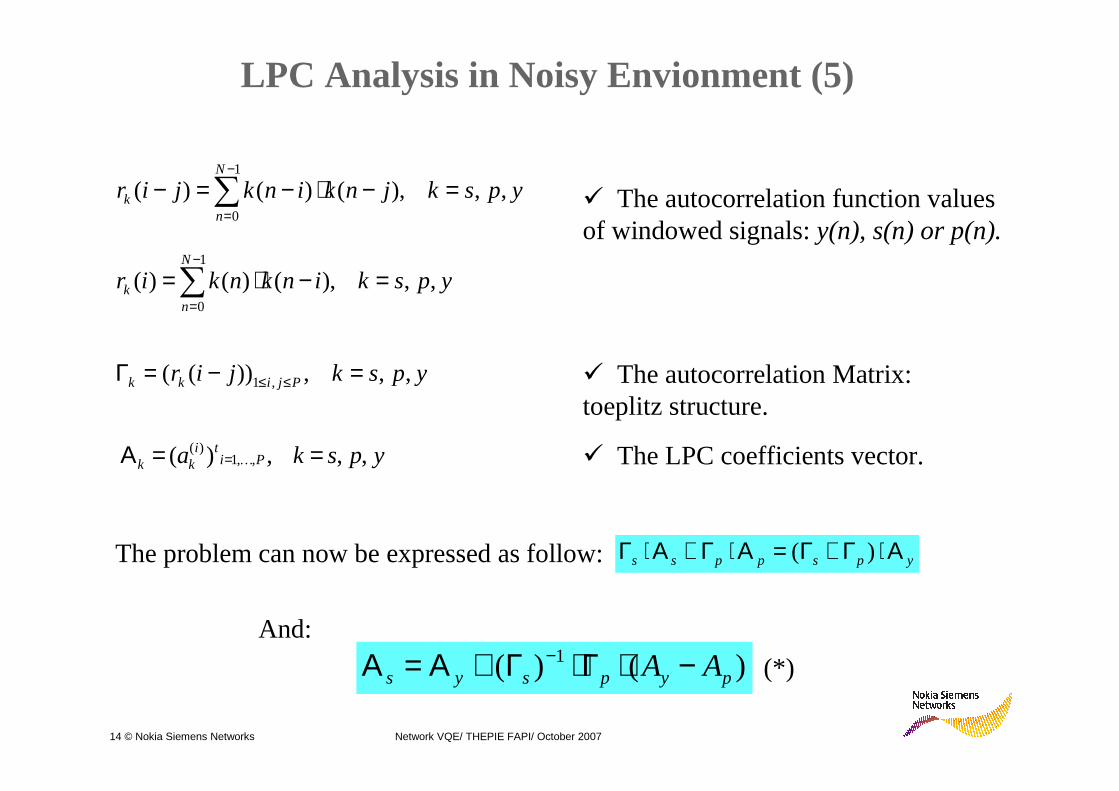
� The autocorrelation function values of windowed signals: y(n), s(n) or p(n).
� The autocorrelation Matrix: toeplitz structure.
� The LPC coefficients vector.
The problem can now be expressed as follow:
And:
)()( 1pypsys AA −⋅Γ⋅Γ+Α=Α − (*)
15 © Nokia Siemens Networks Network VQE/ THEPIE FAPI/ October 2007
Noise Reduction Through LPC Coefficients
ENCODER
Noisy Speech Signal
Âs
Bitstream
Decoding of the noisy LPC coefficients
Other Parameters keep unchanged
Mapping Âs
In the bitstream
F
G Modified Bitstream
Pitch delay index, Adaptive Gain index, Fixed codebook index
Ay
Terminal Network Area
VAD 1
0
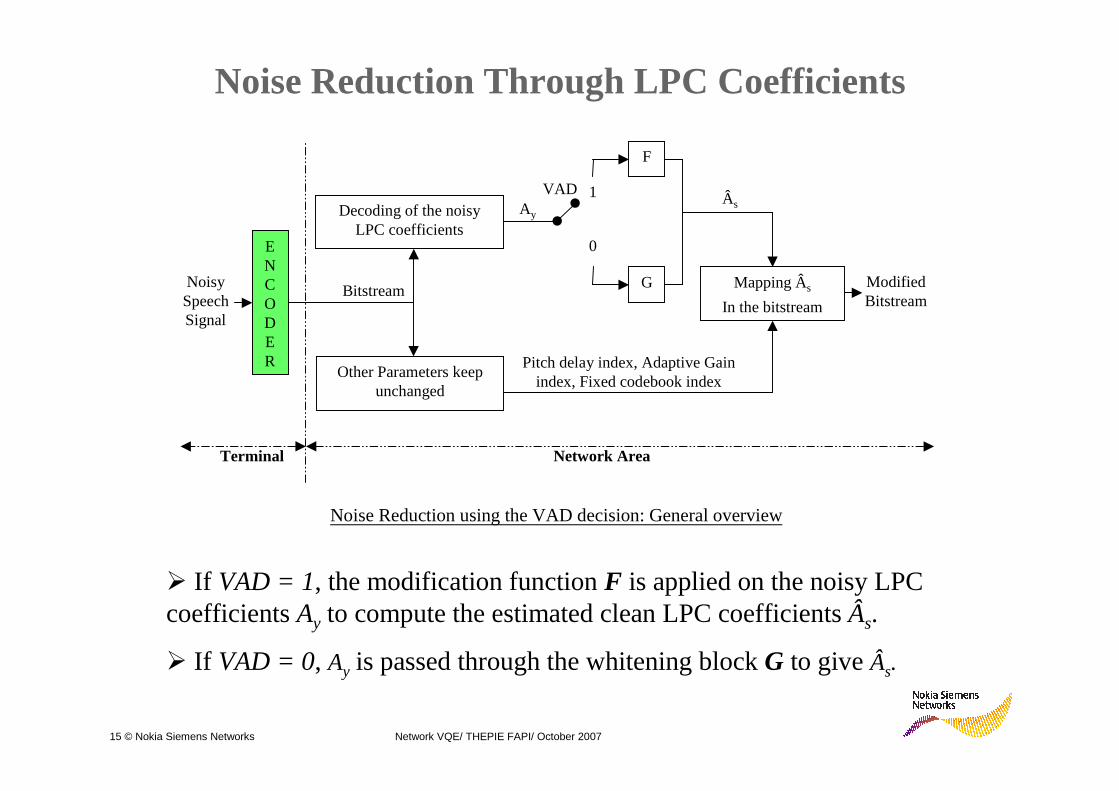
Noise Reduction using the VAD decision: General overview
� If VAD = 1, the modification function F is applied on the noisy LPC coefficients Ay to compute the estimated clean LPC coefficients Âs.
� If VAD = 0, Ay is passed through the whitening block G to giveÂs.
16 © Nokia Siemens Networks Network VQE/ THEPIE FAPI/ October 2007
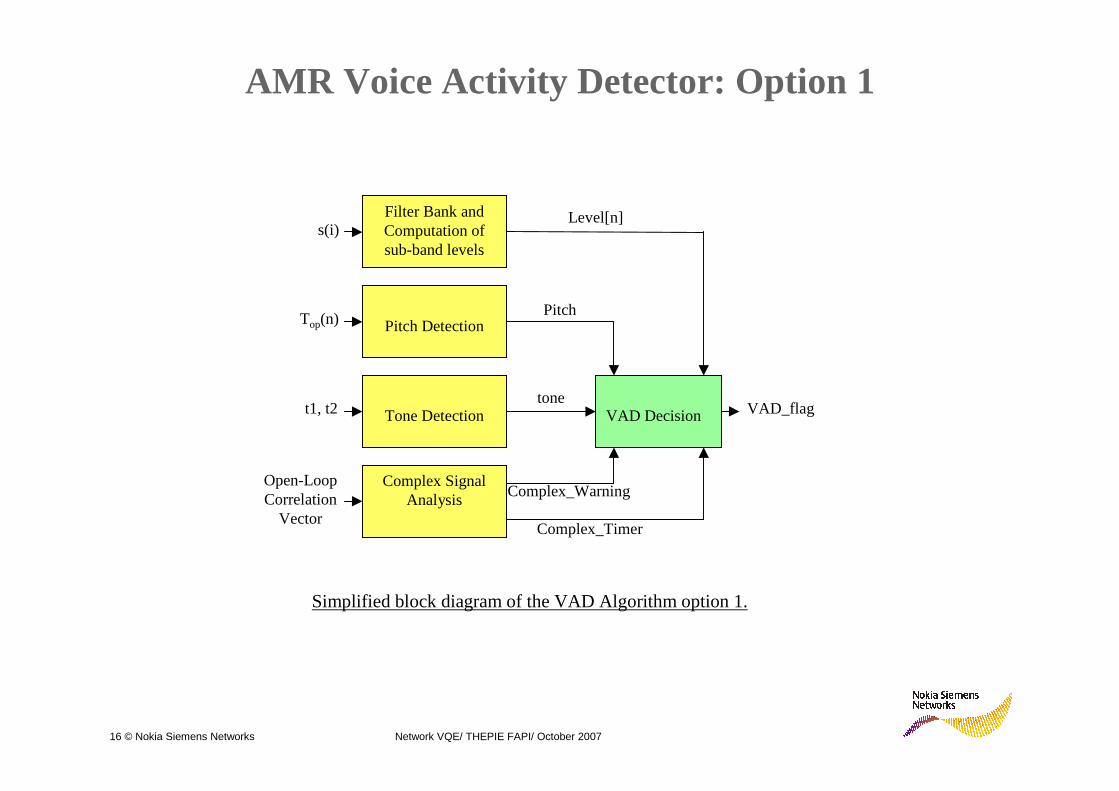
AMR Voice Activity Detector: Option 1
s(i)Filter Bank and Computation of sub-band levels
VAD Decisiont1, t2
Pitch Detection
Tone Detection
Complex Signal Analysis
Top(n)
Open-Loop Correlation
Vector
VAD_flag
Level[n]
Pitch
tone
Complex_Warning
Complex_Timer
Simplified block diagram of the VAD Algorithm option 1.
17 © Nokia Siemens Networks Network VQE/ THEPIE FAPI/ October 2007
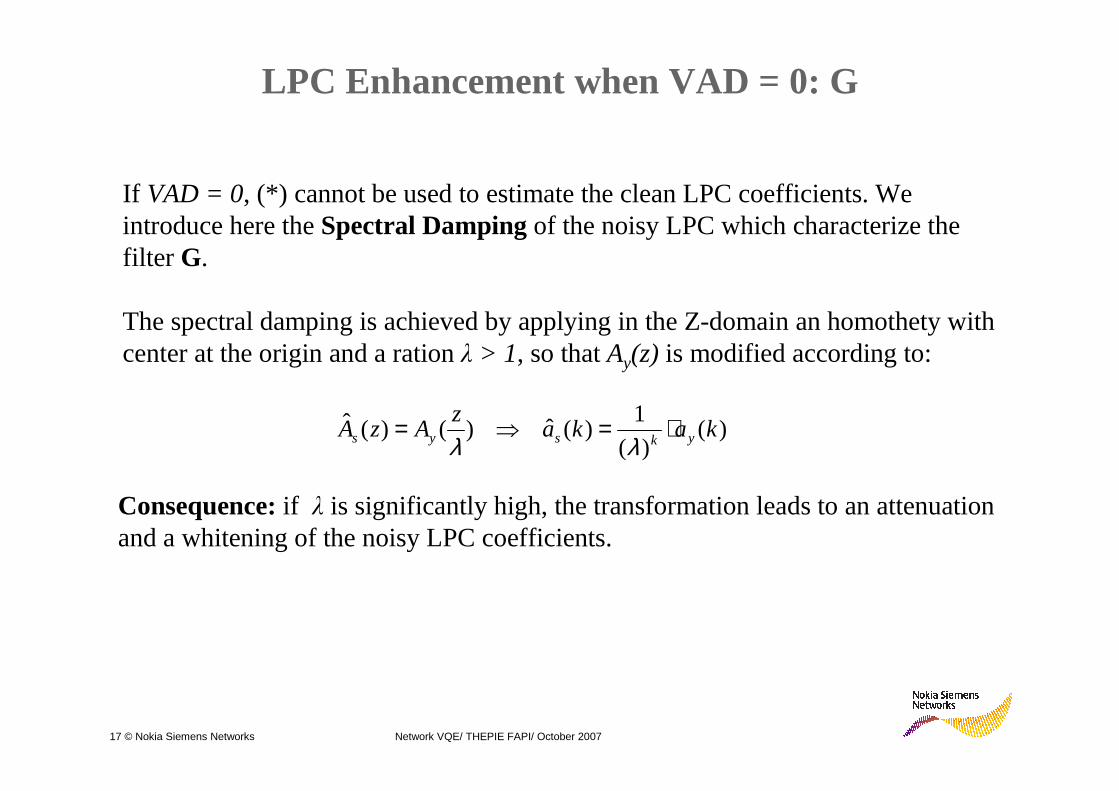
LPC Enhancement when VAD = 0: G
If VAD = 0, (*) cannot be used to estimate the clean LPC coefficients. We introduce here the Spectral Dampingof the noisy LPC which characterize the filter G.
The spectral damping is achieved by applying in the Z-domain an homothety with center at the origin and a ration λ > 1, so that Ay(z) is modified according to:
)()(
1)(ˆ)()(ˆ kaka
zAzA yksys ⋅=⇒=
λλ
Consequence:if λ is significantly high, the transformation leads to an attenuation and a whitening of the noisy LPC coefficients.
18 © Nokia Siemens Networks Network VQE/ THEPIE FAPI/ October 2007
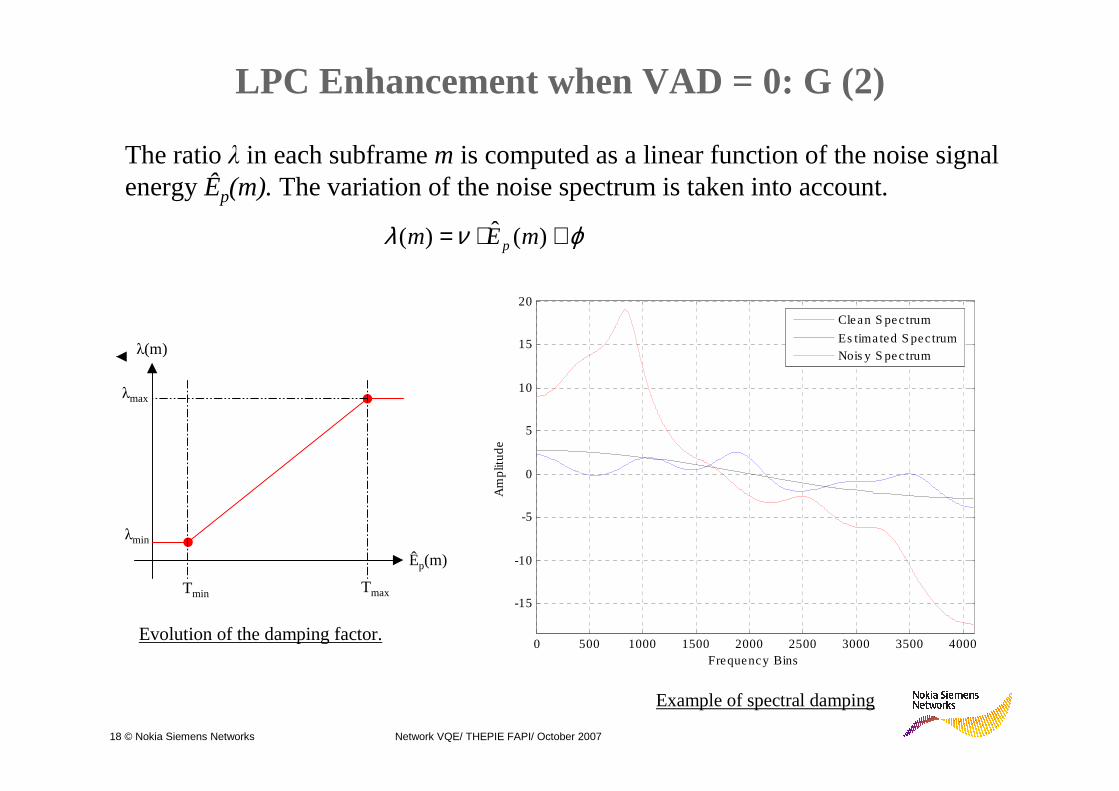
LPC Enhancement when VAD = 0: G (2)
The ratio λ in each subframe m is computed as a linear function of the noise signal energy Êp(m).The variation of the noise spectrum is taken into account.
ϕνλ +⋅= )(ˆ)( mEm p
Êp(m)
Tmin Tmax
λmin
λmax
λ(m)
Evolution of the damping factor.0 500 1000 1500 2000 2500 3000 3500 4000
-15
-10
-5
0
5
10
15
20
Frequency Bins
Am
plit
ud
e
Clean S pectrum
Es timated S pectrumNois y S pectrum
Example of spectral damping
19 © Nokia Siemens Networks Network VQE/ THEPIE FAPI/ October 2007
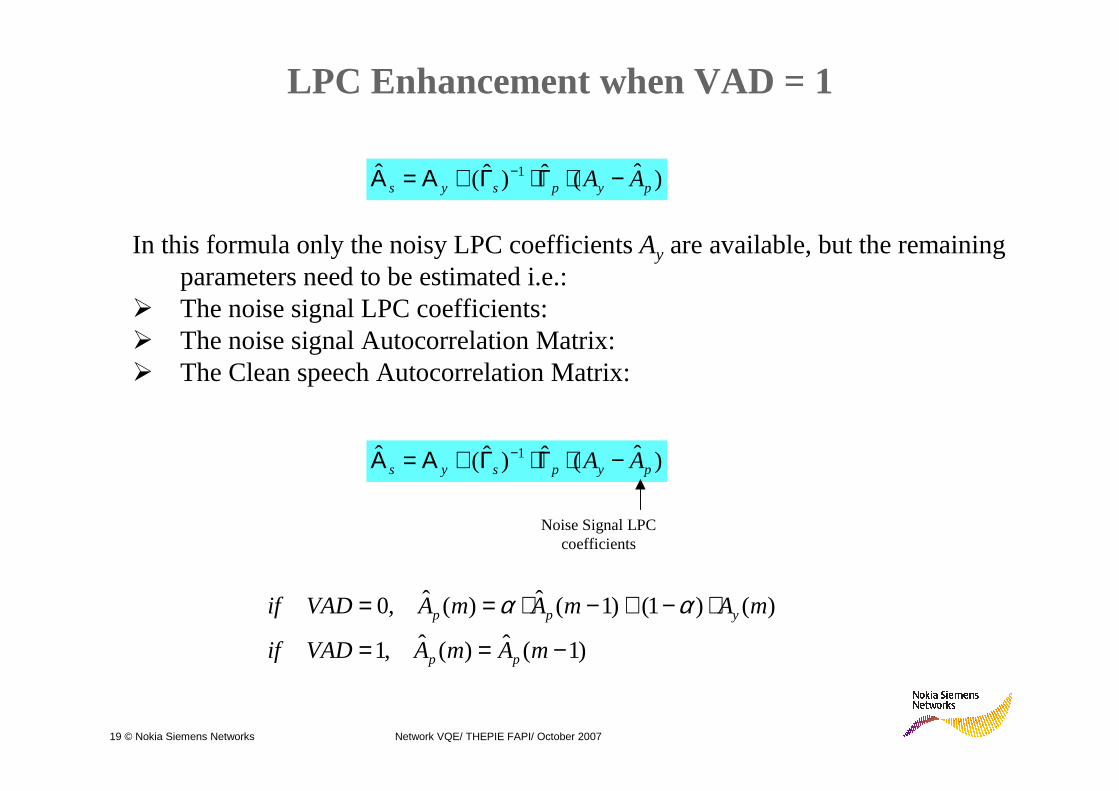
LPC Enhancement when VAD = 1
)ˆ(ˆ)ˆ(ˆ 1pypsys AA −⋅Γ⋅Γ+Α=Α −
In this formula only the noisy LPC coefficients Ay are available, but the remaining parameters need to be estimated i.e.:
� The noise signal LPC coefficients: � The noise signal Autocorrelation Matrix:� The Clean speech Autocorrelation Matrix:
)ˆ(ˆ)ˆ(ˆ 1pypsys AA −⋅Γ⋅Γ+Α=Α −
Noise Signal LPC coefficients
)1(ˆ)(ˆ,1
)()1()1(ˆ)(ˆ,0
−==
⋅−+−⋅==
mAmAVADif
mAmAmAVADif
pp
ypp αα
20 © Nokia Siemens Networks Network VQE/ THEPIE FAPI/ October 2007
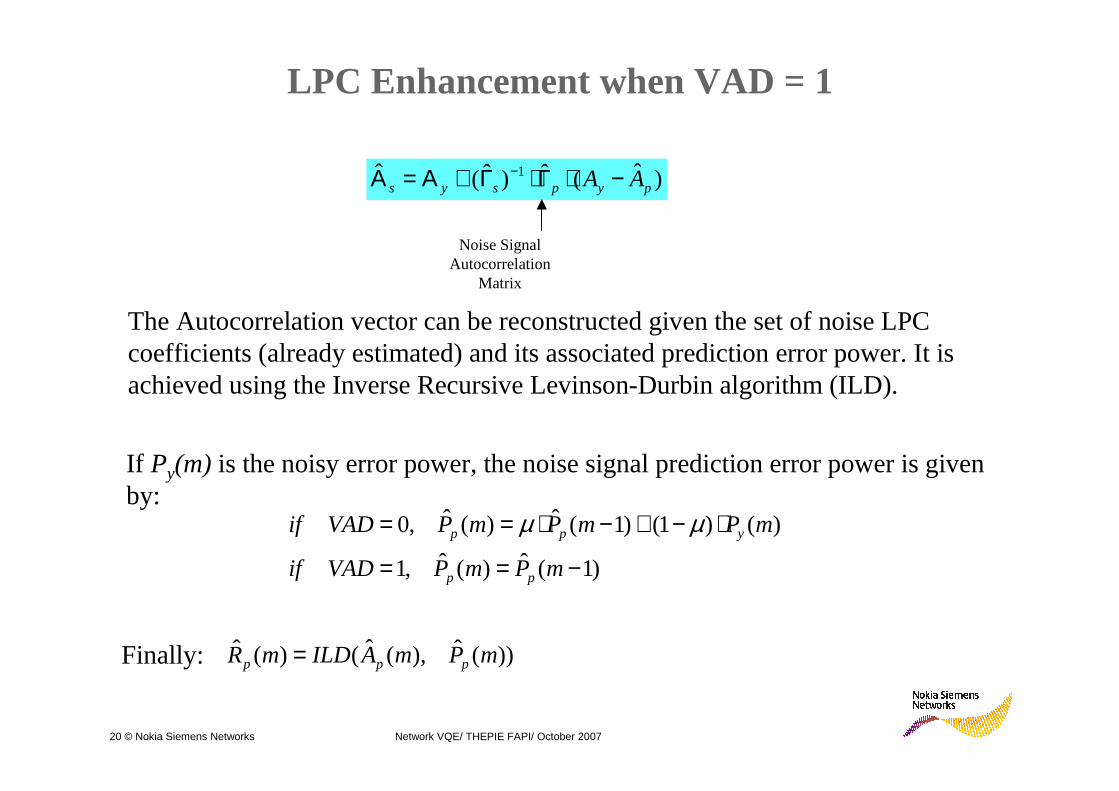
LPC Enhancement when VAD = 1
)ˆ(ˆ)ˆ(ˆ 1pypsys AA −⋅Γ⋅Γ+Α=Α −
Noise Signal Autocorrelation
Matrix
The Autocorrelation vector can be reconstructed given the set of noise LPC coefficients (already estimated) and its associated prediction error power. It is achieved using the Inverse Recursive Levinson-Durbin algorithm (ILD).
If Py(m) is the noisy error power, the noise signal prediction error power is given by:
)1(ˆ)(ˆ,1
)()1()1(ˆ)(ˆ,0
−==
⋅−+−⋅==
mPmPVADif
mPmPmPVADif
pp
ypp µµ
))(ˆ),(ˆ()(ˆ mPmAILDmR ppp =Finally:
21 © Nokia Siemens Networks Network VQE/ THEPIE FAPI/ October 2007
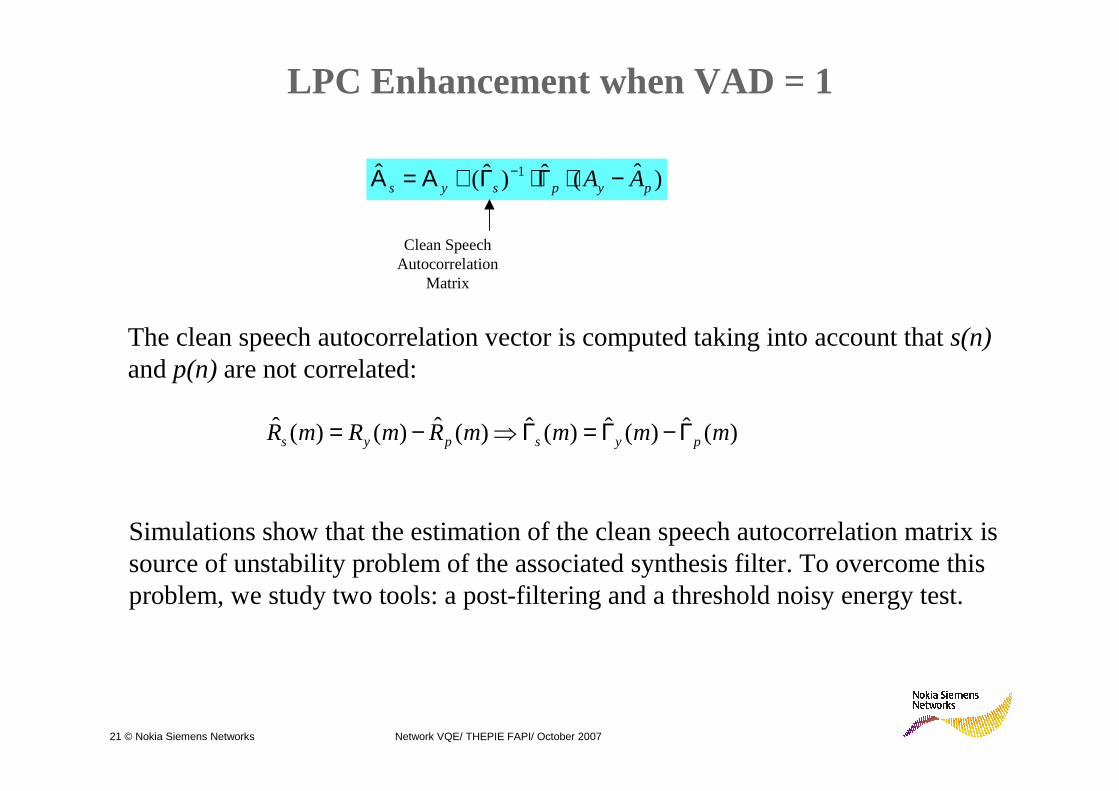
LPC Enhancement when VAD = 1
)ˆ(ˆ)ˆ(ˆ 1pypsys AA −⋅Γ⋅Γ+Α=Α −
Clean Speech Autocorrelation
Matrix
The clean speech autocorrelation vector is computed taking into account that s(n)and p(n)are not correlated:
)(ˆ)(ˆ)(ˆ)(ˆ)()(ˆ mmmmRmRmR pyspys Γ−Γ=Γ⇒−=
Simulations show that the estimation of the clean speech autocorrelation matrix is source of unstability problem of the associated synthesis filter. To overcome this problem, we study two tools: a post-filtering and a threshold noisy energy test.
22 © Nokia Siemens Networks Network VQE/ THEPIE FAPI/ October 2007
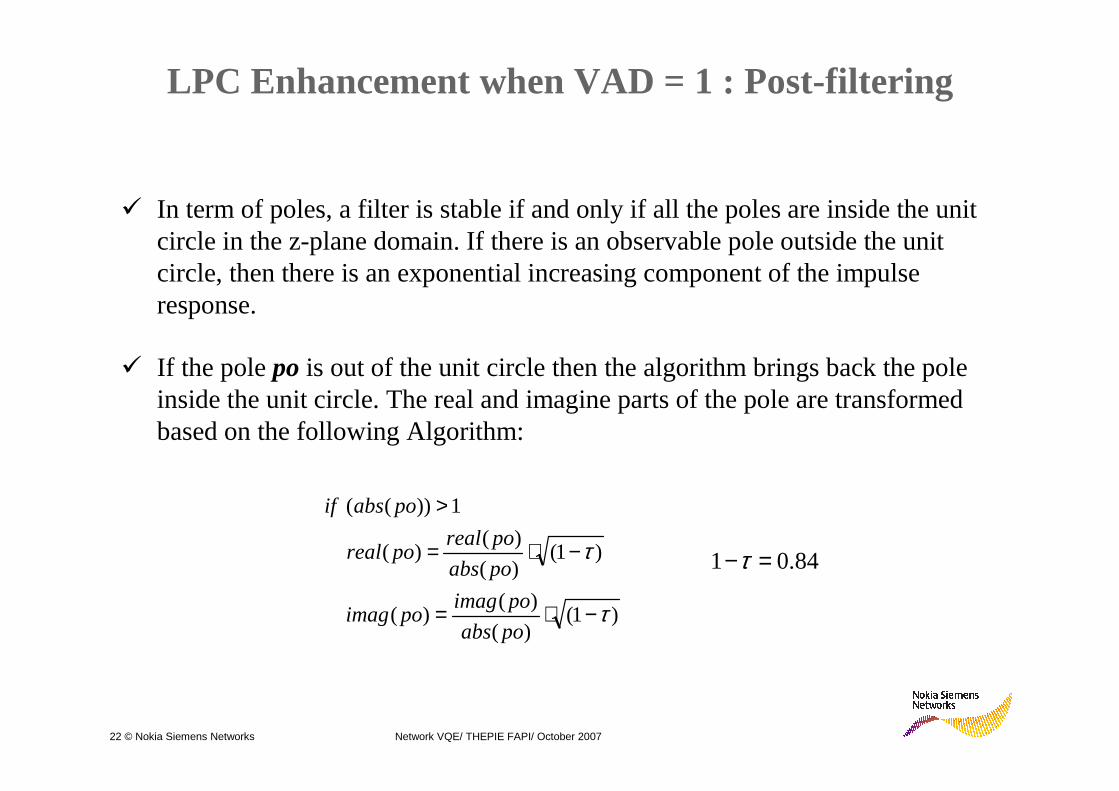
LPC Enhancement when VAD = 1 : Post-filtering
)1()(
)()(
)1()(
)()(
1))((
τ
τ
−⋅=
−⋅=
>
poabs
poimagpoimag
poabs
porealporeal
poabsif
84.01 =−τ
� If the pole po is out of the unit circle then the algorithm brings back the pole inside the unit circle. The real and imagine parts of the pole are transformed based on the following Algorithm:
� In term of poles, a filter is stable if and only if all the poles are inside the unit circle in the z-plane domain. If there is an observable pole outside the unit circle, then there is an exponential increasing component of the impulse response.
23 © Nokia Siemens Networks Network VQE/ THEPIE FAPI/ October 2007
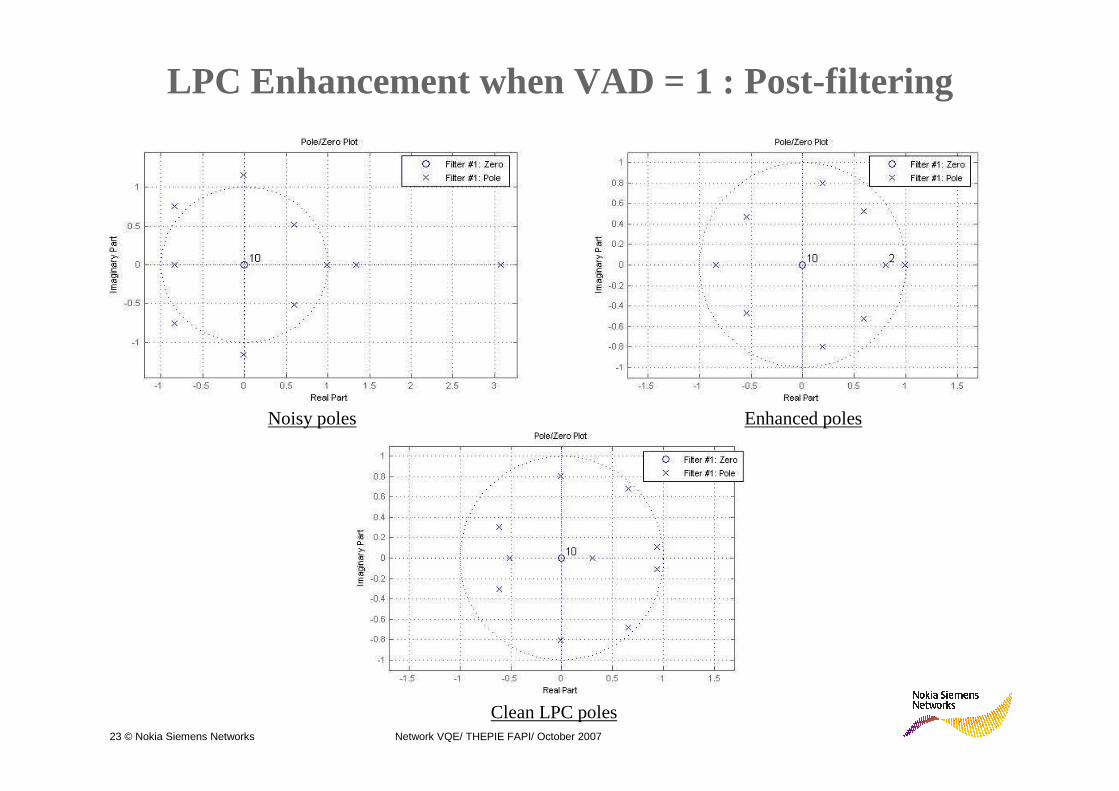
Noisy poles Enhanced poles
Clean LPC poles
LPC Enhancement when VAD = 1 : Post-filtering
24 © Nokia Siemens Networks Network VQE/ THEPIE FAPI/ October 2007
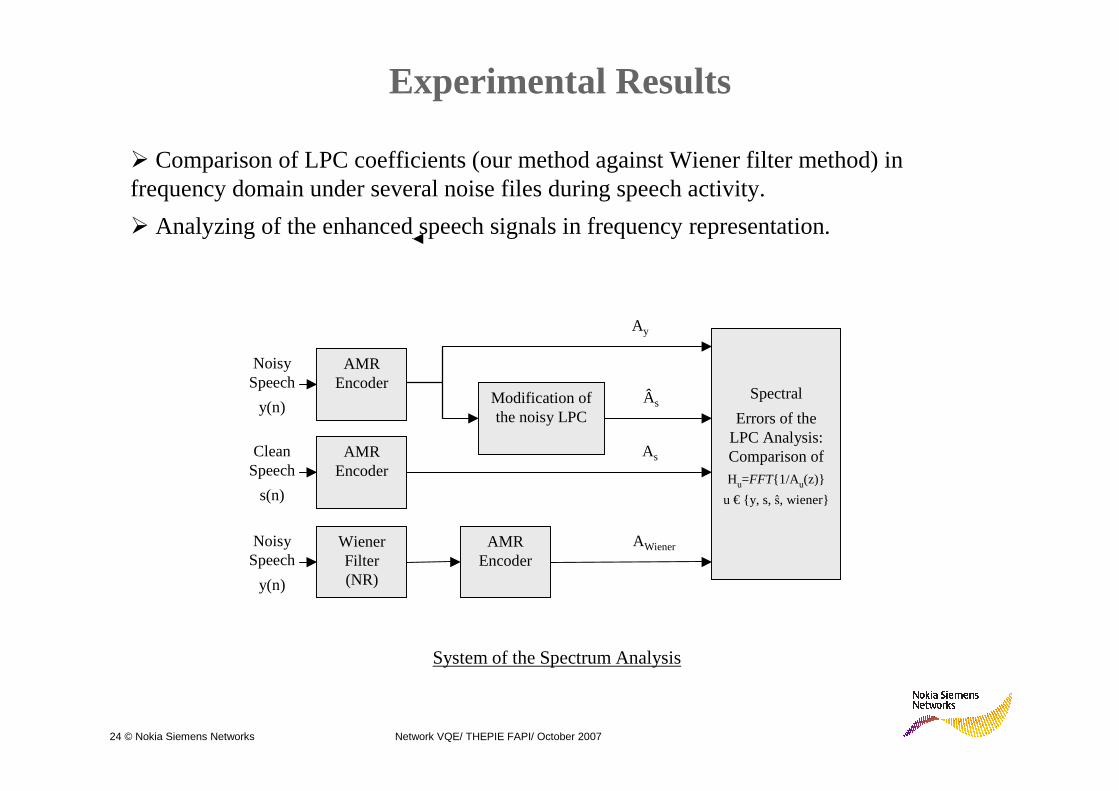
Experimental Results
� Comparison of LPC coefficients (our method against Wiener filter method) in frequency domain under several noise files during speech activity.
� Analyzing of the enhanced speech signals in frequency representation.
AMR Encoder
Noisy Speech
y(n)
Noisy Speech
y(n)
Clean Speech
s(n)
AMR Encoder
Wiener Filter (NR)
AMR Encoder
Modification of the noisy LPC
Spectral
Errors of the LPC Analysis: Comparison of Hu=FFT{1/A u(z)}
u € {y, s, ŝ, wiener}
Ay
As
AWiener
Âs
System of the Spectrum Analysis
25 © Nokia Siemens Networks Network VQE/ THEPIE FAPI/ October 2007
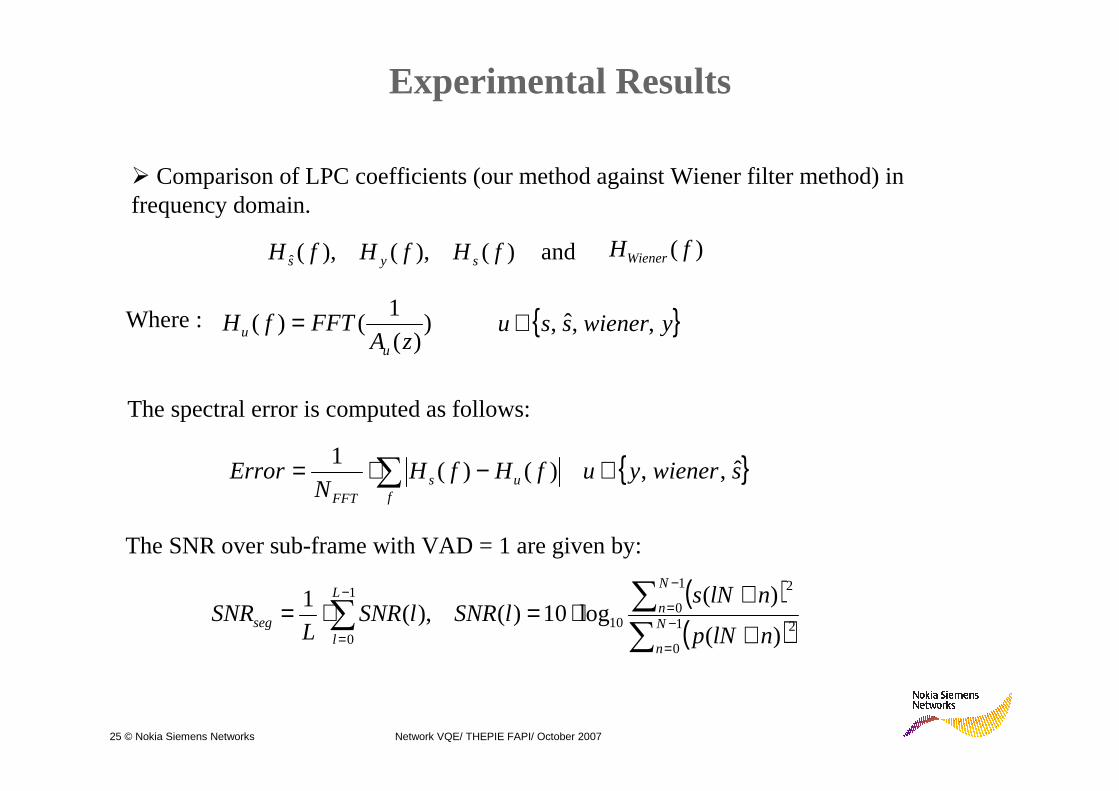
Experimental Results
� Comparison of LPC coefficients (our method against Wiener filter method) in frequency domain.
)(),(),(ˆ fHfHfH sys and )( fHWiener
{ }swieneryufHfHN
Errorf
usFFT
ˆ,,)()(1 ∈−⋅= ∑
( )( )∑
∑∑ −
=
−
=−
= +
+⋅=⋅= 1
0
2
1
0
2
10
1
0 )(
)(log10)(,)(
1N
n
N
nL
lseg
nlNp
nlNslSNRlSNR
LSNR
The spectral error is computed as follows:
The SNR over sub-frame with VAD = 1 are given by:
))(
1()(
zAFFTfH
uu =Where : { }ywienerssu ,,ˆ,∈
26 © Nokia Siemens Networks Network VQE/ THEPIE FAPI/ October 2007
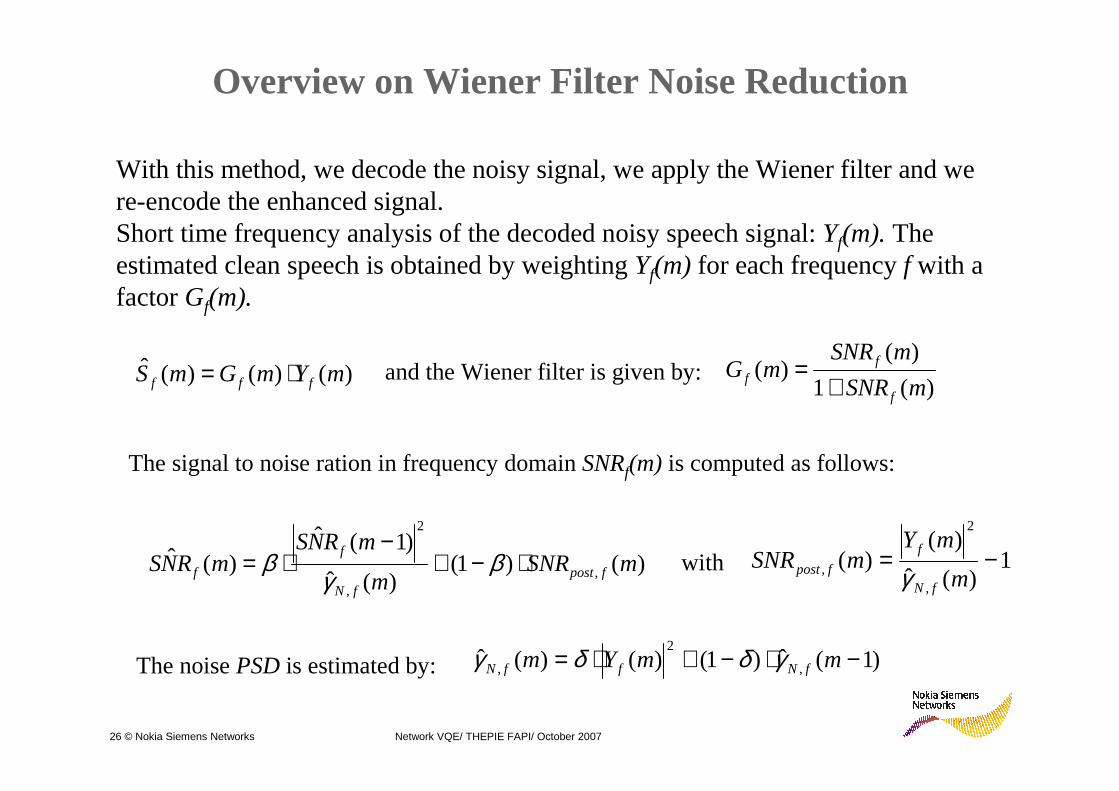
Overview on Wiener Filter Noise Reduction
With this method, we decode the noisy signal, we apply the Wiener filter and we re-encode the enhanced signal.Short time frequency analysis of the decoded noisy speech signal: Yf(m).The estimated clean speech is obtained by weighting Yf(m) for each frequencyf with a factor Gf(m).
)()()(ˆ mYmGmS fff ⋅=)(1
)()(
mSNR
mSNRmG
f
ff +
=and the Wiener filter is given by:
The signal to noise ration in frequency domain SNRf(m) is computed as follows:
)()1()(ˆ
)1(ˆ)(ˆ
,,
2
mSNRm
mRNSmRNS fpost
fN
f
f ⋅−+−
⋅= βγ
β 1)(ˆ
)()(
,
2
, −=m
mYmSNR
fN
f
fpost γ
)1(ˆ)1()()(ˆ ,
2
, −⋅−+⋅= mmYm fNffN γδδγ
with
The noise PSDis estimated by:
27 © Nokia Siemens Networks Network VQE/ THEPIE FAPI/ October 2007
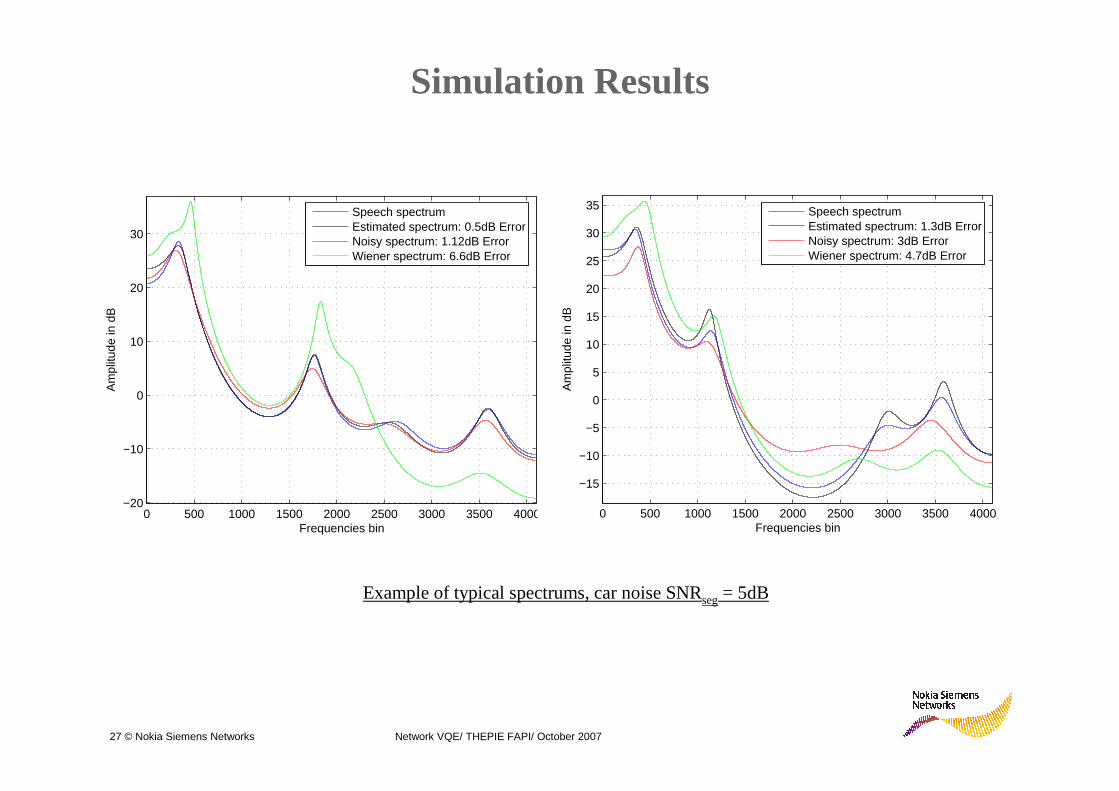
Simulation Results
0 500 1000 1500 2000 2500 3000 3500 4000−20
−10
0
10
20
30
Frequencies bin
Am
plitu
de in
dB
Speech spectrumEstimated spectrum: 0.5dB ErrorNoisy spectrum: 1.12dB ErrorWiener spectrum: 6.6dB Error
0 500 1000 1500 2000 2500 3000 3500 4000
−15
−10
−5
0
5
10
15
20
25
30
35
Frequencies bin
Am
plitu
de in
dB
Speech spectrumEstimated spectrum: 1.3dB ErrorNoisy spectrum: 3dB ErrorWiener spectrum: 4.7dB Error
Example of typical spectrums, car noise SNRseg= 5dB
28 © Nokia Siemens Networks Network VQE/ THEPIE FAPI/ October 2007
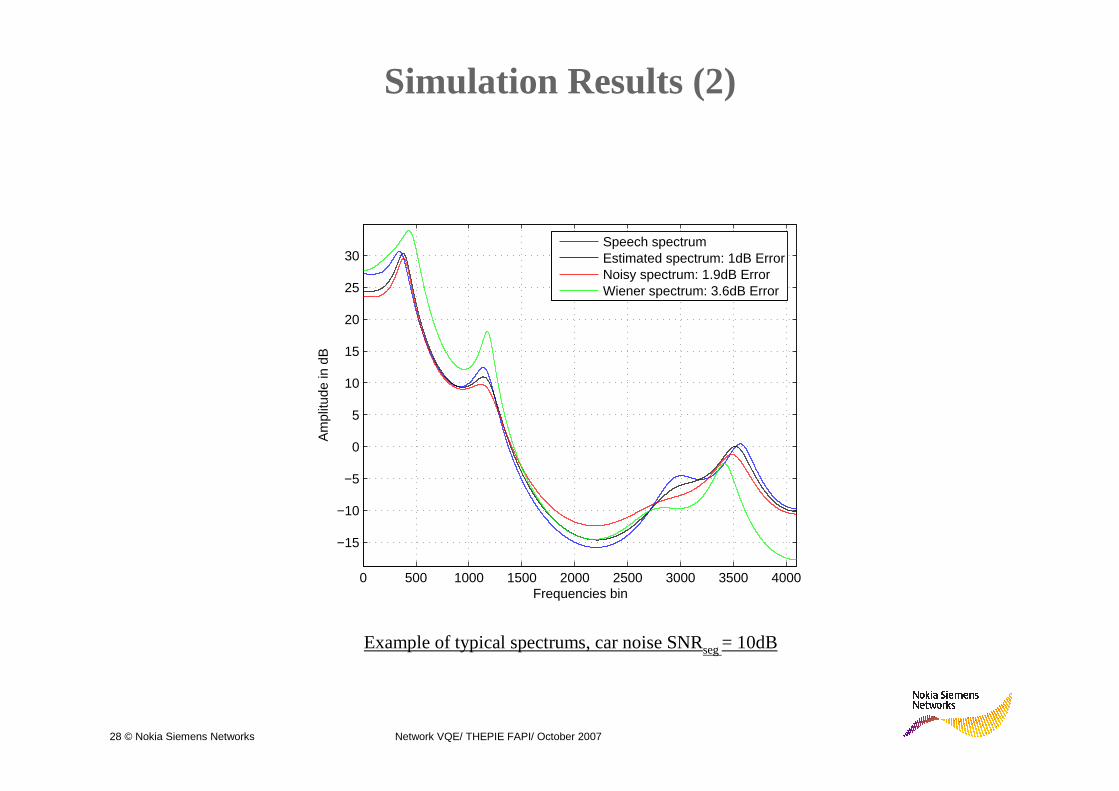
Simulation Results (2)
0 500 1000 1500 2000 2500 3000 3500 4000
−15
−10
−5
0
5
10
15
20
25
30
Frequencies bin
Am
plitu
de in
dB
Speech spectrumEstimated spectrum: 1dB ErrorNoisy spectrum: 1.9dB ErrorWiener spectrum: 3.6dB Error
Example of typical spectrums, car noise SNRseg = 10dB
29 © Nokia Siemens Networks Network VQE/ THEPIE FAPI/ October 2007
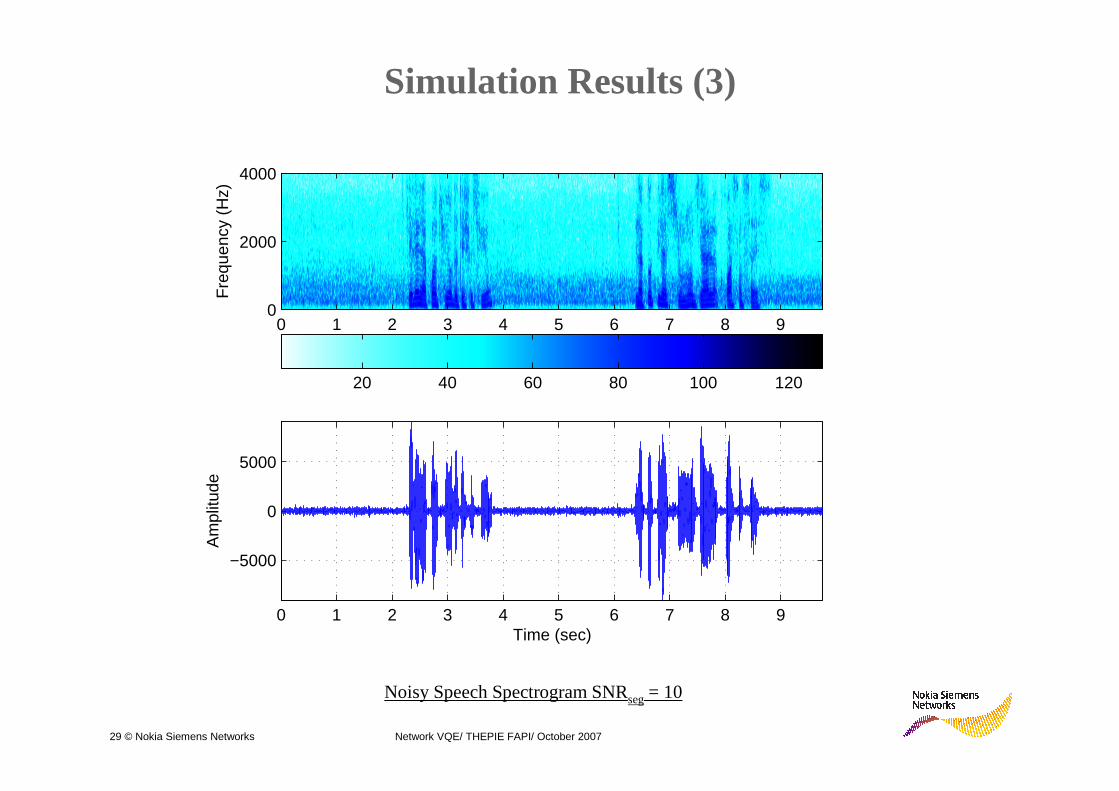
Simulation Results (3)
Fre
quen
cy (
Hz)
0 1 2 3 4 5 6 7 8 90
2000
4000
20 40 60 80 100 120
0 1 2 3 4 5 6 7 8 9
−5000
0
5000
Time (sec)
Am
plitu
de
Noisy Speech Spectrogram SNRseg= 10
30 © Nokia Siemens Networks Network VQE/ THEPIE FAPI/ October 2007
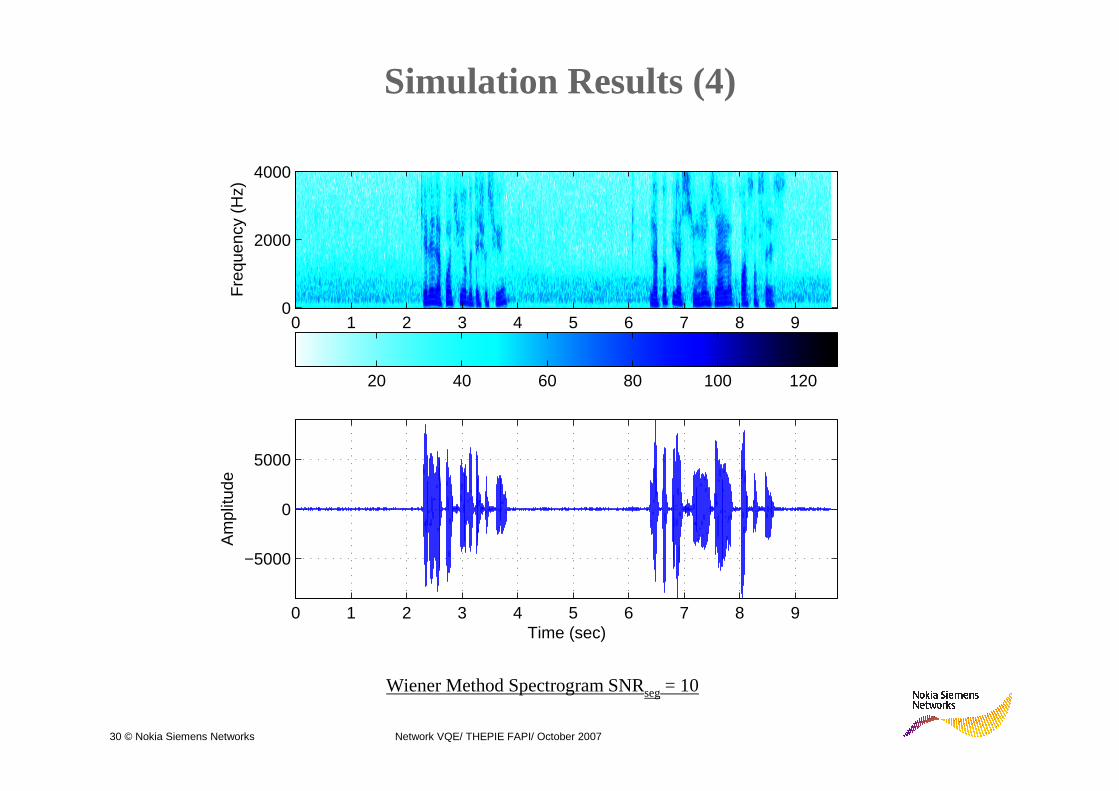
Simulation Results (4)
Fre
quen
cy (
Hz)
0 1 2 3 4 5 6 7 8 90
2000
4000
20 40 60 80 100 120
0 1 2 3 4 5 6 7 8 9
−5000
0
5000
Time (sec)
Am
plitu
de
Wiener Method Spectrogram SNRseg= 10
31 © Nokia Siemens Networks Network VQE/ THEPIE FAPI/ October 2007
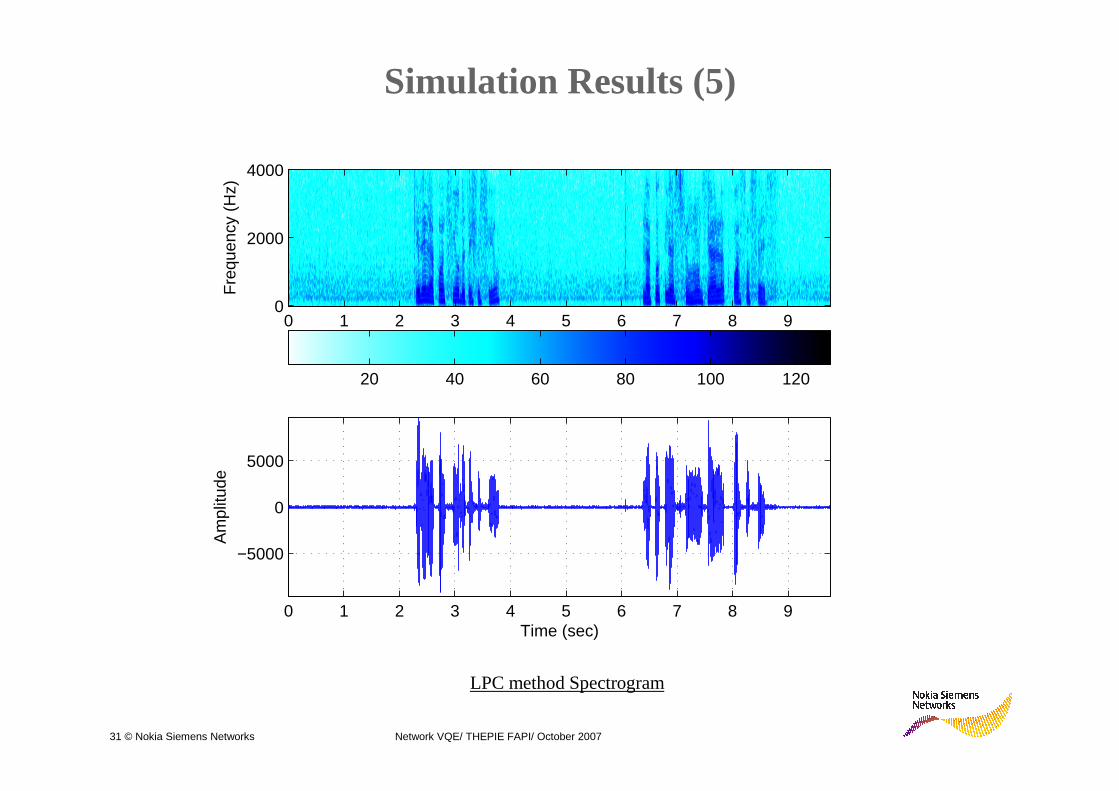
Simulation Results (5)
Fre
quen
cy (
Hz)
0 1 2 3 4 5 6 7 8 90
2000
4000
20 40 60 80 100 120
0 1 2 3 4 5 6 7 8 9
−5000
0
5000
Time (sec)
Am
plitu
de
LPC method Spectrogram
32 © Nokia Siemens Networks Network VQE/ THEPIE FAPI/ October 2007
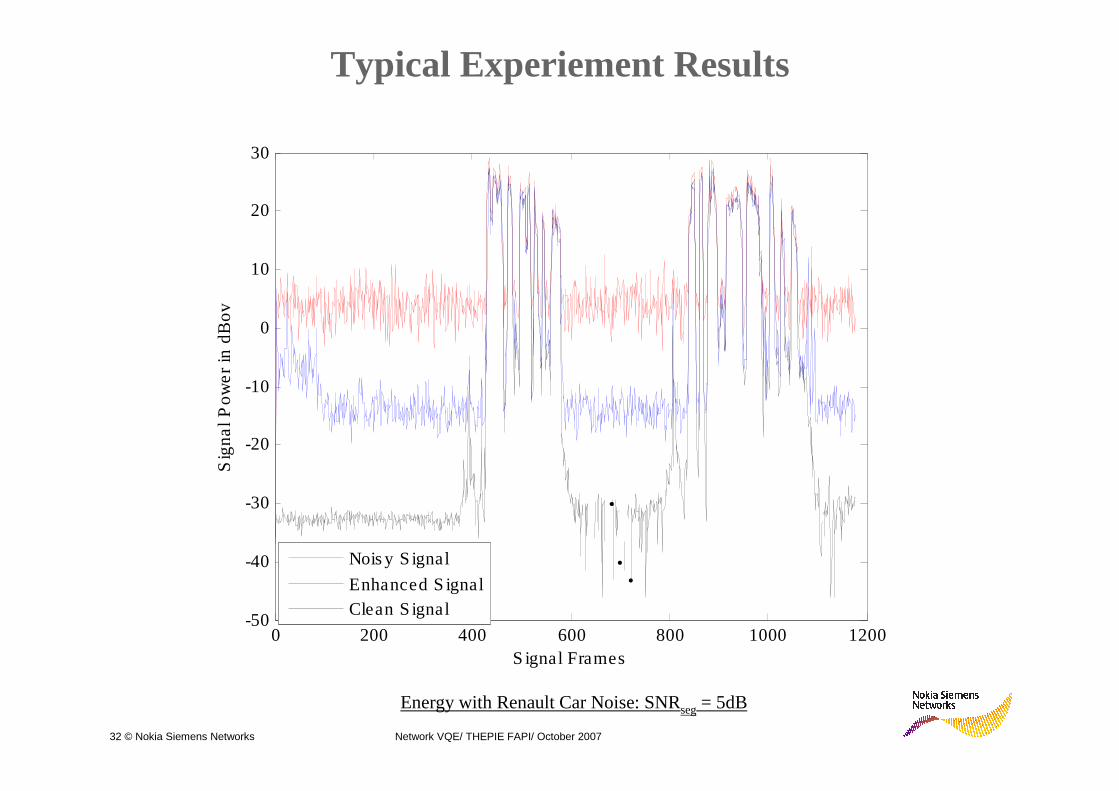
0 200 400 600 800 1000 1200-50
-40
-30
-20
-10
0
10
20
30
S ignal Frames
Sig
na
l Po
we
r in
dB
ov
Nois y S ignal
Enhanced S ignalClean S ignal
Energy with Renault Car Noise: SNRseg= 5dB
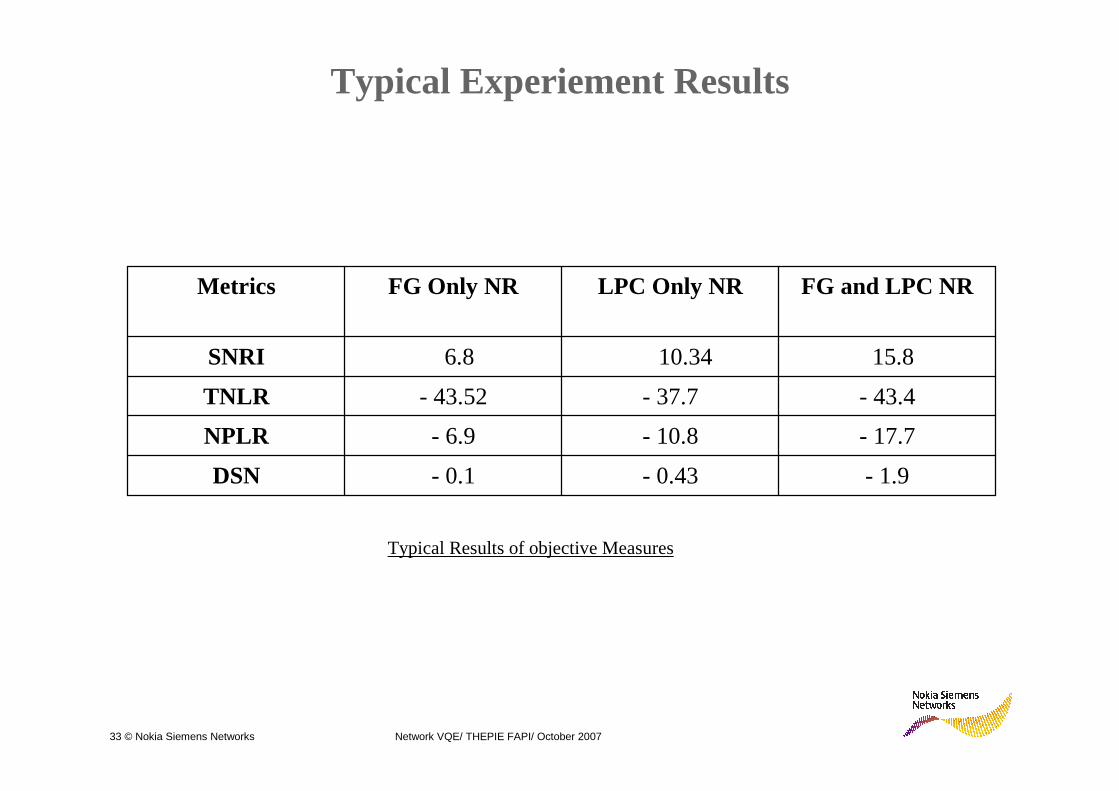
Typical Experiement Results
33 © Nokia Siemens Networks Network VQE/ THEPIE FAPI/ October 2007
Typical Experiement Results
- 1.9- 0.43- 0.1DSN
- 17.7- 10.8- 6.9NPLR
- 43.4- 37.7- 43.52TNLR
15.810.346.8SNRI
FG and LPC NRLPC Only NRFG Only NRMetrics
Typical Results of objective Measures
34 © Nokia Siemens Networks Network VQE/ THEPIE FAPI/ October 2007
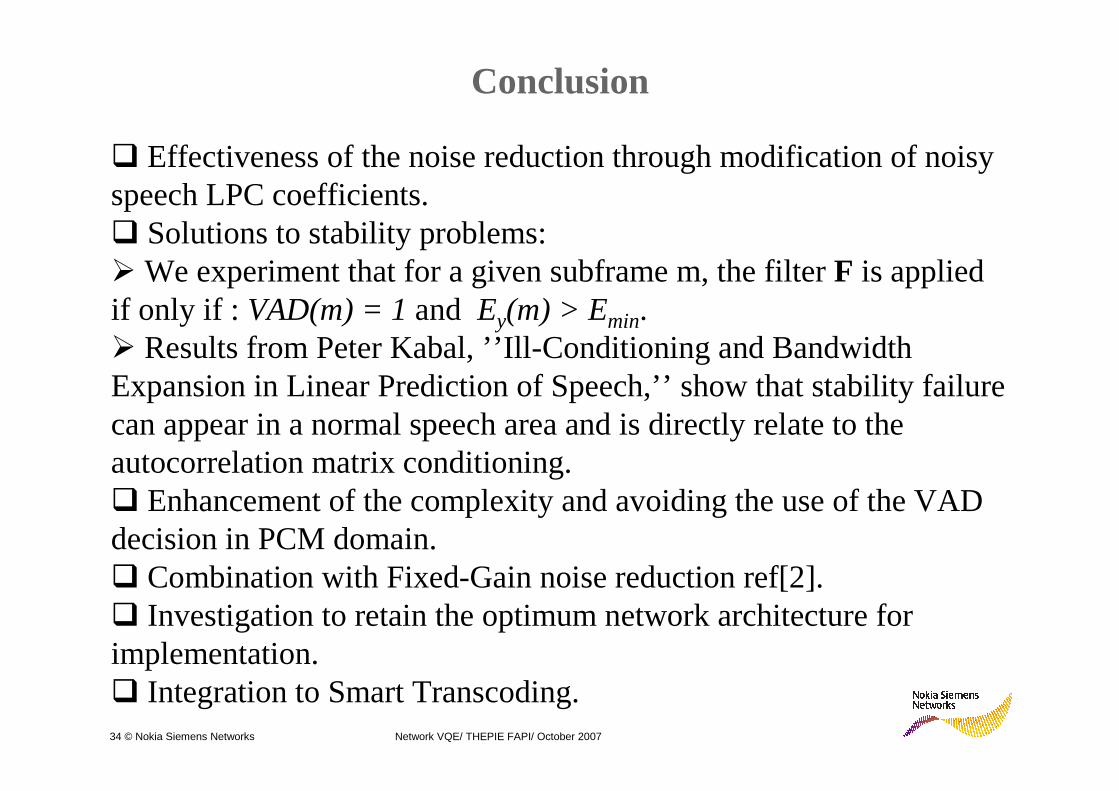
Conclusion
� Effectiveness of the noise reduction through modification of noisy speech LPC coefficients.� Solutions to stability problems:� We experiment that for a given subframe m, the filter F is applied if only if : VAD(m) = 1and Ey(m) > Emin.� Results from Peter Kabal, ’’Ill-Conditioning and Bandwidth Expansion in Linear Prediction of Speech,’’ show that stability failure can appear in a normal speech area and is directly relate to theautocorrelation matrix conditioning.� Enhancement of the complexity and avoiding the use of the VAD decision in PCM domain.� Combination with Fixed-Gain noise reduction ref[2].� Investigation to retain the optimum network architecture for implementation.� Integration to Smart Transcoding.
35 © Nokia Siemens Networks Network VQE/ THEPIE FAPI/ October 2007
References
[1] – R. Chandran and D. J. Marchok, ’’Compressed domain noise reduction and echo suppression for network speech enhancement,’’ in Proc. of the 34rd IEEE Midwest Symposium on Circuit and Systems, 2000, vol. 1, pp. 10-13.
[2] – Taddei H., Beaugeant C., and De Meuleneire M., ’’Noise reduction on speech parameters,’’ in ICASSP, 2004.
[3] – Sukkar R. A, Younce R., and Zhang P., ‘‘Dynamic scaling of encoded speech through direct modification od coded parameters,‘‘ in ICASSP, 2006.
[4] – Pasanen A., ‘‘Coded domain level control for AMR speech codec,‘‘in ICASSP, 2006.
[5] – Gordy J. D., Goubran R. A., and Matthews M. B., ‘‘Reduced-delay mixing of compressed speech signals for VoIP and cellular telephony,‘‘ in Asilomar Conf. on Signal System and Computers, 2004, vol. 2, pp. 2270-2274.
[6] – Un, C. and Choi K., ‘‘Improving LPC analysis of noisy speech by autocorrelation subtraction method,‘‘ in ICASSP, 1981, vol.6, pp. 1082-1085.
36 © Nokia Siemens Networks Network VQE/ THEPIE FAPI/ October 2007
References (2)
[7] – 3GPP TS 26.071, Mandatory Speech Codec speech processing functions; AMR speech codec; General Description, June 2002.
[8] – Atal B. S. and Schroeder M. R., ‘‘Coded-excited linear prediction (CELP): High-quality speech at very low bit rates,‘‘ in ICASSP, 1985, pp. 937-940.
[9] – 3GPP TS 26.094, Adaptive Multi-Rate (AMR) speech coded, Voice Activity Detector (VAD), Release. 6, June 2006.
[10] – Simon Haykin, ‘‘Adaptive Filter Theory,‘‘ Prentice Hall Information and System Series, 2002.
[11] – El-Jaroudi, A. and Makhoul J., ‘‘Dicrete all-pole modeling,‘‘ in IEEE Trans. on signal Proc. 1991, vol. 39, pp. 411-423.
[12] – Ephraim Y. and Malah D., ‘‘Speech enhancementusing a minimum mean square error short time amplitude estimator,‘‘ in IEEE Trans. on ASSP, 1984, vol. 32, pp. 1109-1121.
37 © Nokia Siemens Networks Network VQE/ THEPIE FAPI/ October 2007
References (3)
[13] – A. M. Kondoz, ’’Digital Speech Coding for Low Bit Rate Communication System,’’Wiley and Sons, 1994.
[14] – Peter Kabal, ’’Ill-Conditioning and Bandwidth Expansion in Linear Prediction of Speech,’’Proc. IEEE int. Conf. Acoustic, Speech, Signal Processing (Hong Kong), pp. I-824-I-827, April 2003.
Recommended