1
Meta-analysis of problematic alcohol use in 435,563 individuals identifies 29 risk variants 1
and yields insights into biology, pleiotropy and causality 2
3
Hang Zhou,1,2 Julia M. Sealock,3,4 Sandra Sanchez-Roige,5 Toni-Kim Clarke,6 Daniel Levey,1,2 4 Zhongshan Cheng,1,2 Boyang Li,7 Renato Polimanti,1,2 Rachel L. Kember,8,9 Rachel Vickers 5
Smith,10 Johan H. Thygesen,11 Marsha Y. Morgan,12 Stephen R. Atkinson,13 Mark R. Thursz,13 6 Mette Nyegaard,14,15,16,17 Manuel Mattheisen,14,18,19 Anders D. Børglum,14,15,16,17 Emma C. 7 Johnson,20 the VA Million Veteran Program, Amy C. Justice,2,21,22 Abraham A. Palmer,5,23 8
Andrew McQuillin,11 Lea K. Davis,3,4,24 Howard J. Edenberg,25,26 Arpana Agrawal,20 Henry R. 9 Kranzler,9,27* and Joel Gelernter1,2,28* 10
1Department of Psychiatry, Yale School of Medicine, New Haven, CT, USA 11 2Veterans Affairs Connecticut Healthcare System, West Haven, CT, USA 12 3Vanderbilt Genetics Institute, Vanderbilt University Medical Center, Nashville, TN, USA 13 4Division of Medical Genetics, Department of Medicine, Vanderbilt University Medical Center, 14 Nashville, TN, USA 15 5Department of Psychiatry, University of California San Diego, La Jolla, CA, USA 16 6Division of Psychiatry, University of Edinburgh, Edinburgh, UK 17 7Department of Biostatistics, Yale School of Public Health, New Haven, CT, USA 18 8Department of Genetics, University of Pennsylvania Perelman School of Medicine, Philadelphia, 19 PA, USA 20 9Crescenz Veterans Affairs Medical Center, Philadelphia, PA, USA 21 10University of Louisville School of Nursing, Louisville, KY, USA 22 11Division of Psychiatry, University College London, London, UK 23 12UCL Institute for Liver & Digestive Health, Division of Medicine, Royal Free Campus, 24 University College London, London, UK 25 13Department of Metabolism, Digestion & Reproduction, Imperial College London, London, UK 26 14Department of Biomedicine, Aarhus University, Aarhus, Denmark 27 15Centre for Integrative Sequencing, iSEQ, Aarhus University, Aarhus, Denmark 28 16The Lundbeck Foundation Initiative for Integrative Psychiatric Research, iPSYCH, Denmark 29 17Center for Genomics and Personalized Medicine, Aarhus, Denmark 30 18Department of Psychiatry, Psychosomatics and Psychotherapy, University of Würzburg, 31 Würzburg, Germany 32 19Department of Clinical Neuroscience, Karolinska Institutet, Stockholm, Sweden 33 20Department of Psychiatry, Washington University School of Medicine, St. Louis, MO, USA 34 21Department of Internal Medicine, Yale School of Medicine, New Haven, CT, USA 35 22Center for Interdisciplinary Research on AIDS, Yale School of Public Health, New Haven, CT, 36 USA 37 23Institute for Genomic Medicine, University of California San Diego, La Jolla, CA, USA 38 24Department of Psychiatry and Behavioral Sciences, Vanderbilt University Medical Center, 39 Nashville, TN, USA 40 25Department of Biochemistry and Molecular Biology, Indiana University School of Medicine, 41 Indianapolis, IN, USA 42 26Department of Medical and Molecular Genetics, Indiana University School of Medicine, 43 Indianapolis, IN, USA 44 27Department of Psychiatry, University of Pennsylvania Perelman School of Medicine, 45 Philadelphia, PA, USA 46
.CC-BY-NC-ND 4.0 International licenseIt is made available under a (which was not peer-reviewed) is the author/funder, who has granted bioRxiv a license to display the preprint in perpetuity.
The copyright holder for this preprint. http://dx.doi.org/10.1101/738088doi: bioRxiv preprint first posted online Aug. 16, 2019;

2
28Departments of Genetics and Neuroscience, Yale University School of Medicine 47 48
*co-senior authors 49
Corresponding Author: Joel Gelernter, Department of Psychiatry, Yale School of Medicine, 50 Veterans Affairs Connecticut Healthcare System, 116A2, 950 Campbell Ave, West Haven, CT 51 06516, USA. Phone: +1 (203) 494-6326 x3590; Fax: +1 (203) 937-4741; Email: 52 [email protected]. 53
.CC-BY-NC-ND 4.0 International licenseIt is made available under a (which was not peer-reviewed) is the author/funder, who has granted bioRxiv a license to display the preprint in perpetuity.
The copyright holder for this preprint. http://dx.doi.org/10.1101/738088doi: bioRxiv preprint first posted online Aug. 16, 2019;

3
Abstract 54
Problematic alcohol use (PAU) is a leading cause of death and disability worldwide. Although 55
genome-wide association studies (GWASs) have identified PAU risk genes, the genetic 56
architecture of this trait is not fully understood. We conducted a proxy-phenotype meta-analysis 57
of PAU combining alcohol use disorder and problematic drinking in 435,563 European-ancestry 58
individuals. We identified 29 independent risk variants, 19 of them novel. PAU was genetically 59
correlated with 138 phenotypes, including substance use and psychiatric traits. Phenome-wide 60
polygenic risk score analysis in an independent biobank sample (BioVU, n=67,589) confirmed 61
the genetic correlations between PAU and substance use and psychiatric disorders. Genetic 62
heritability of PAU was enriched in brain and in genomic conserved and regulatory regions. 63
Mendelian randomization suggested causal effects on liability to PAU of substance use, 64
psychiatric status, risk-taking behavior, and cognitive performance. In summary, this large PAU 65
meta-analysis identified novel risk loci and revealed genetic relationships with numerous other 66
outcomes. 67
.CC-BY-NC-ND 4.0 International licenseIt is made available under a (which was not peer-reviewed) is the author/funder, who has granted bioRxiv a license to display the preprint in perpetuity.
The copyright holder for this preprint. http://dx.doi.org/10.1101/738088doi: bioRxiv preprint first posted online Aug. 16, 2019;

4
Introduction 68
Alcohol use and alcohol use disorder (AUD) are leading causes of death and disability 69
worldwide [1]. Genome-wide association studies (GWAS) of AUD and problematic drinking 70
measured by different assessments have identified potential risk genes primarily in European 71
populations [2-5]. Quantity-frequency measures of drinking, for example the Alcohol Use 72
Disorders Identification Test–Consumption (AUDIT-C), which sometimes reflect alcohol 73
consumption in the normal range, differ genetically from AUD and measures of problematic 74
drinking (e.g., the Alcohol Use Disorders Identification Test–Problems [AUDIT-P]), and show a 75
divergent set of genetic correlations [3, 4]. The estimated SNP-based heritability (h2) of AUD 76
ranges from 5.6% to 10.0% [2-5]. To date, more than ten risk variants have been significantly 77
associated with AUD and AUDIT-P (p < 5 × 10⁻⁸). Variants mapped to several risk genes have 78
been detected in multiple studies, including ADH1B (Alcohol Dehydrogenase 1B), ADH1C 79
(Alcohol Dehydrogenase 1C), ALDH2 (Aldehyde Dehydrogenase 2, only in some Asian 80
samples), SLC39A8 (Solute Carrier Family 39 Member 8), GCKR (Glucokinase Regulator), and 81
CRHR1 (Corticotropin Releasing Hormone Receptor 1). In the context of the known extensive 82
polygenicity underlying AUD and AUDIT-P, we anticipate that additional significant risk loci can 83
be identified by increasing sample size; this is the pattern for GWAS of heterogenous complex 84
traits in general also. We can characterize both AUD itself and AUDIT-P, as “problematic 85
alcohol use” (PAU). To identify additional risk variants and enhance our understanding of the 86
genetic architecture of PAU, we conducted genome-wide meta-analysis of AUD and AUDIT-P in 87
435,563 individuals of European ancestry. The understanding of the genetic architecture of PAU 88
in African populations is far behind than Europeans; the largest sample published so far is 89
56,648 in MVP [3] and results have not moved beyond a single genomic region that includes 90
ADH1B. This study only focused on European samples because we cannot achieve a 91
substantial increment in African-ancestry subjects over previous studies. 92
.CC-BY-NC-ND 4.0 International licenseIt is made available under a (which was not peer-reviewed) is the author/funder, who has granted bioRxiv a license to display the preprint in perpetuity.
The copyright holder for this preprint. http://dx.doi.org/10.1101/738088doi: bioRxiv preprint first posted online Aug. 16, 2019;

5
Results 93
Figure 1 provides an overview of the meta-analysis of the 4 major datasets. The first is 94
the GWAS of AUD in European Americans (EA) from the Million Veteran Program (MVP) [6] 95
(herein designated “MVP phase1”), comprised 202,004 individuals phenotyped for AUD (ncase = 96
34,658, ncontrol = 167,346, neffective = 114,847) using International Classification of Diseases (ICD) 97
codes [3]. The second, MVP Phase2, included an additional 65,387 EA individuals from MVP 98
(ncase = 11,337, ncontrol = 54,050, neffective = 37,485) not previously analyzed. The third dataset is a 99
GWAS of DSM-IV alcohol dependence (AD) from the Psychiatric Genomics Consortium (PGC), 100
which included 46,568 European participants (ncase = 11,569, ncontrol = 34,999, neffective = 26,853) 101
[2]. The fourth dataset is a GWAS of Alcohol Use Disorders Identification Test–Problems 102
(AUDIT-P; a measure of problematic drinking) scores from a UK Biobank sample (UKB) [7] that 103
included 121,604 European participants [4]. 104
The genetic correlation (rg) between MVP phase1 AUD and PGC AD was 0.965 (se = 105
0.15, p = 1.21 × 10⁻¹⁰) [3]. Rg between the entire MVP (meta-analysis of phase1 and phase2) 106
and PGC increased to 0.98 (se = 0.11, p = 1.99 × 10⁻¹⁹), justifying the meta-analysis of AUD 107
across the three datasets (neffective = 179,185). 24 risk variants in 23 loci were detected in this 108
intermediary meta-analysis (Supplementary Figure 1, Supplementary Table 1). The rg between 109
UKB AUDIT-P and AUD (MVP+PGC) was 0.71 (se = 0.05, p = 8.15 × 10-52), and the polygenic 110
risk score (PRS) of AUD was associated with AUDIT-P in UKB (best p-value threshold PTbest = 111
0.001, R2 = 0.25%, p = 3.28 × 10-41, Supplementary Table 2, Supplementary Figure 2), justifying 112
the proxy-phenotype meta-analysis of problematic alcohol use (PAU) across all four datasets. 113
The total sample size was 435,563 in the discovery analysis (neffective = 300,789). 114
.CC-BY-NC-ND 4.0 International licenseIt is made available under a (which was not peer-reviewed) is the author/funder, who has granted bioRxiv a license to display the preprint in perpetuity.
The copyright holder for this preprint. http://dx.doi.org/10.1101/738088doi: bioRxiv preprint first posted online Aug. 16, 2019;

6
115
Figure 1. Overview of the analysis. Four datasets were meta-analyzed as the discovery 116
sample for problematic alcohol use (PAU) including MVP phase1, MVP phase2, PGC, and UK 117
Biobank (UKB). MVP phase1 and phase2 were meta-analyzed, and the result was used for 118
testing the genetic correlation with PGC alcohol dependence. An intermediary meta-analysis 119
(AUD meta) combining MVP phase1, phase2, and PGC was then conducted to measure the 120
genetic correlation with UKB AUDIT-P. Due to the sample overlap between UKB and GSCAN, 121
we used the AUD meta-analysis for Mendelian Randomization (MR) analysis rather than the 122
PAU (i.e., the second) meta-analysis. MTAG, which used the summary data from PAU and 123
DrnkWk (drinks per week) in GSCAN (without 23andMe samples as those data were not made 124
available) as input to increase the power for each trait without introducing bias from sample 125
overlap, returned summary results for PAU and DrnkWk separately. 126
127
Association results for PAU 128
.CC-BY-NC-ND 4.0 International licenseIt is made available under a (which was not peer-reviewed) is the author/funder, who has granted bioRxiv a license to display the preprint in perpetuity.
The copyright holder for this preprint. http://dx.doi.org/10.1101/738088doi: bioRxiv preprint first posted online Aug. 16, 2019;

7
Of 42 lead variants (mapping to 27 loci, Supplementary Figure 3, and Supplementary 129
Table 3) that were genome-wide significant (GWS) for PAU, 29 were independently associated 130
after conditioning on lead SNPs in the regions (see below and Table 1). Ten variants were 131
previously identified through the same index SNPs or tagged SNPs, located in or near the 132
following genes: GCKR, SIX3, KLB, ADH1B, ADH1C, SLC39A8, DRD2, and FTO [2-5]. Thus, 133
19 variants reported here were novel, of which 11 were located in gene regions, including 134
PDE4B (Phosphodiesterase 4B), THSD7B (Thrombospondin Type 1 Domain Containing 7B), 135
CADM2 (Cell Adhesion Molecule 2), ADH1B (different from the locus identified previously), 136
DPP6 (Dipeptidyl Peptidase Like 6), SLC39A13 (Solute Carrier Family 39 Member 13), TMX2 137
(Thioredoxin Related Transmembrane Protein 2), ARID4A (AT-Rich Interaction Domain 4A), 138
C14orf2 (Chromosome 14 open reading frame 2), TNRC6A (Trinucleotide Repeat Containing 139
Adaptor 6A), and FUT2 (Fucosyltransferase 2). A novel rare ADH1B variant, rs75967634 (p = 140
1.07 × 10⁻⁹, with a minor allele frequency of 0.003), which causes a substitution of histidine for 141
arginine, is in the same codon as rs2066702 (a well-known variant associated with AUD in 142
African populations[3, 8], but not polymorphic in European populations).This latter association is 143
independent from rs1229984 in ADH1B and rs13125415 (a tag SNP of rs1612735 in MVP 144
phase1 [3]) in ADH1C. The identification of rs75967634 demonstrates the present study’s 145
greater power to detect risk variants in this region, beyond the frequently reported 146
ADH1B*rs1229984. 147
Moderate genetic correlation between AUD and alcohol consumption, and also 148
pervasive pleiotropic effects of SNPs, were demonstrated previously [2-4]. Some of the novel 149
variants (10 out of 19) identified in this study were also associated with other alcohol-related 150
traits, including AUDIT-C score [3], total AUDIT score [4], and drinks per week (DrnkWk) from 151
the GSCAN study [9] (described below and Supplementary Table 3). Rs1402398, close to 152
VRK2, was associated with AUDIT-C score (tagged by rs2683616) [3]; rs492602 in FUT2 was 153
.CC-BY-NC-ND 4.0 International licenseIt is made available under a (which was not peer-reviewed) is the author/funder, who has granted bioRxiv a license to display the preprint in perpetuity.
The copyright holder for this preprint. http://dx.doi.org/10.1101/738088doi: bioRxiv preprint first posted online Aug. 16, 2019;

8
associated with DrnkWk [9] and total AUDIT score [4]; and rs6421482, rs62250713, rs2533200, 154
rs10717830, rs1783835, rs12296477, rs61974485, and rs72768626 were associated with 155
DrnkWk directly or through tag SNPs in high linkage disequilibrium (LD) [9]. Analysis 156
conditioned on DrnkWk shows that 11 of the 29 independent variants were independently 157
associated with PAU (i.e., not mediated by DrnkWk) (Supplementary Table 3). 158
159
Table 1. Genome-wide significant associations for PAU. 160
Chr Pos (hg19) rsID Gene A1 A2 EAF Z P Direction 1 66419905 rs6421482 PDE4Ba A G 0.4363 -6.315 2.7×10⁻¹⁰ ---- 1 73848610 rs61767420 [] A G 0.3999 5.714 1.11×10⁻⁸ ++++ 2 27730940 rs1260326 GCKRa T C 0.4033 -9.296 1.45×10⁻²⁰ --+- 2 45141180 rs494904 SIX3b T C 0.5961 -7.926 2.26×10⁻¹⁵ ---- 2 58042241 rs1402398 VRK2b A G 0.6274 7.098 1.27×10⁻¹² ++++ 2 104134432 rs9679319 [] T G 0.4797 -6.01 1.86×10⁻⁹ ---- 2 138264231 rs13382553 THSD7Ba A G 0.766 -6.001 1.97×10⁻⁹ ---- 2 227164653 rs2673136 IRS1b A G 0.6387 -5.872 4.31×10⁻⁹ ---- 3 85513793 rs62250713 CADM2a A G 0.368 6.049 1.46×10⁻⁹ ++++ 4 39404872 rs13129401 KLBb A G 0.4532 -8.906 5.29×10⁻¹⁹ ---- 4 100229016 rs75967634 ADH1Ba T C 0.003 -6.098 1.07×10⁻⁹ --?- 4 100239319 rs1229984 ADH1Ba T C 0.0302 -22 2.9×10-107 ---? 4 100270452 rs13125415 ADH1Ca A G 0.5849 -9.073 1.16×10⁻¹⁹ ---- 4 103198082 rs13135092 SLC39A8a A G 0.9192 11.673 1.75×10⁻³¹ ++++ 7 153489074 rs2533200 DPP6a C G 0.5163 -5.631 1.79×10⁻⁸ ---- 8 57424874 rs2582405 PENKb T C 0.237 5.751 8.86×10⁻⁹ ++++ 10 72907951 rs7900002 UNC5Bb T G 0.6012 -5.503 3.74×10⁻⁸ --+- 10 110537834 rs56722963 [] T C 0.2551 -6.374 1.85×10⁻¹⁰ ---- 11 47423920 rs10717830 SLC39A13a G GT 0.674 6.422 1.34×10⁻¹⁰ ++++ 11 57480623 rs576859 TMX2a A C 0.3272 5.67 1.43×10⁻⁸ +++? 11 113357710 rs138084129 DRD2b A AATAT 0.6274 7.824 5.13×10⁻¹⁵ ++++ 11 113443753 rs6589386 DRD2b T C 0.4323 -7.511 5.88×10⁻¹⁴ ---- 11 121542923 rs1783835 SORL1b A G 0.4569 -5.979 2.24×10⁻⁹ ---- 12 51903860 rs12296477 SLC4A8b C G 0.5469 5.484 4.15×10⁻⁸ ++++ 14 58765903 rs61974485 ARID4Aa T C 0.2646 5.506 3.67×10⁻⁸ ++++
.CC-BY-NC-ND 4.0 International licenseIt is made available under a (which was not peer-reviewed) is the author/funder, who has granted bioRxiv a license to display the preprint in perpetuity.
The copyright holder for this preprint. http://dx.doi.org/10.1101/738088doi: bioRxiv preprint first posted online Aug. 16, 2019;

9
14 104355883 rs8008020 C14orf2a T C 0.4175 6.062 1.35×10⁻⁹ ++++ 16 24693048 rs72768626 TNRC6Aa A G 0.9448 5.591 2.26×10⁻⁸ ++++ 16 53820813 rs9937709 FTOa A G 0.585 6.602 4.06×10⁻¹¹ ++++ 19 49206417 rs492602 FUT2a A G 0.5076 -6.143 8.08×10⁻¹⁰ ---- 161
Listed are the 29 independent variants that were genome-wide significant. Variants labeled in 162 bold are novel associations with PAU. A1, effect allele; A2, other allele; EAF, effective allele 163 frequency; Directions are for the A1 allele in MVP phase1, MVP phase2, PGC, and UKB 164 datasets. 165 aProtein-coding gene contains the lead SNP, 166 bProtein-coding gene nearest to the lead SNP. 167
168
Gene-based association analysis identified 66 genes that were associated with PAU 169
at GWS (p < 2.64 × 10⁻⁶, Supplementary Table 4). DRD2, which has been extensively studied in 170
many fields of neuroscience, was among these 66 genes and had been reported in both UKB [4] 171
and MVP phase1 [3]. Among the 66 genes, 46 are novel, including ADH4 (Alcohol 172
Dehydrogenase 4), ADH5 (Alcohol Dehydrogenase 5), and ADH7 (Alcohol Dehydrogenase 7), 173
extending alcohol metabolizing gene associations beyond the well-known ADH1B and ADH1C; 174
SYNGAP1 (Synaptic Ras GTPase Activating Protein 1), BDNF (Brain-Derived Neurotrophic 175
Factor), and others. Certain genes show associations with multiple traits including previous 176
associations with AUDIT-C (4 genes in MVP phase1, 12 genes in UKB), total AUDIT score (19 177
genes in UKB), and DrnkWk (46 genes in GSCAN, which includes results for DrnkWk after 178
MTAG [10] analysis). 179
Examination of the 66 associated genes for known drug-gene interactions through the 180
Drug Gene Interaction Database v3.0.2 [11] showed 327 interactions between 16 genes and 181
325 drugs (Supplementary Table 5). Of these 16 genes with interactions, DRD2 had the most 182
drug interactions (n = 177), followed by BDNF (n = 68) and PDE4B (n = 36). 183
184
.CC-BY-NC-ND 4.0 International licenseIt is made available under a (which was not peer-reviewed) is the author/funder, who has granted bioRxiv a license to display the preprint in perpetuity.
The copyright holder for this preprint. http://dx.doi.org/10.1101/738088doi: bioRxiv preprint first posted online Aug. 16, 2019;

10
SNP-based h2 and partitioning heritability enrichment 185
We used LD Score Regression (LDSC) [12] to estimate SNP-based h2 in the different datasests 186
and the meta-analyses (Figure 2). Because of the unbalanced case/control ratio, we used 187
effective sample size instead of actual sample size in MVP (following the PGC AD GWAS [2]). 188
The h2 of PAU (the meta result) was 0.068 (se = 0.004). The h2 of AUD in the MVP meta-189
analysis (phases 1 and 2) was 0.095 (se = 0.006), and was 0.094 (se = 0.005) in the meta-190
analysis combining MVP and PGC. 191
192
193
Figure 2. Estimated SNP-based h2. Blue bars show h2 results for single datasets or meta-194
analysis between datasets, from published studies or analyzed here. Red bar shows h2 for the 195
PAU discovery meta-analysis. Orange bars show h2 results of MTAG analysis for PAU in the 196
discovery sample and DrnkWk from GSCAN. Effective sample sizes (nE) were used in LDSC. 197
nEq is the GWAS-equivalent sample size reported by MTAG. 198
199
.CC-BY-NC-ND 4.0 International licenseIt is made available under a (which was not peer-reviewed) is the author/funder, who has granted bioRxiv a license to display the preprint in perpetuity.
The copyright holder for this preprint. http://dx.doi.org/10.1101/738088doi: bioRxiv preprint first posted online Aug. 16, 2019;

11
Partitioning heritability enrichment analyses using LDSC [13, 14] showed the most 200
significantly enriched cell type group to be central nervous system (CNS, p = 3.53 × 10⁻⁹), 201
followed by adrenal and pancreas (p = 1.89 × 10⁻³), and immune and hematopoietic (p = 3.82 × 202
10-3, Supplementary Figure 4). Significant enrichments were also observed in six baseline 203
annotations, including conserved regions, conserved regions with 500bp extended (ext), fetal 204
DHS (DNase I hypersensitive sites) ext, weak enhancers ext, histone mark H3K4me1 ext, and 205
TSS (transcription start site) ext (Supplementary Figure 5). We also investigated heritability 206
enrichments using Roadmap data, which contains six annotations (DHS, H3K27ac, H3K4me3, 207
H3K4me1, H3K9ac, and H3K36me3) in a subset of 88 primary cell types and tissues [14, 15]. 208
Significant enrichments were observed for H3K4me1 and DHS in fetal brain, and H3K4me3 in 209
fetal brain and in brain germinal matrix (Supplementary Table 6). Although no heritability 210
enrichment was observed in tissues using gene expression data from GTEx [16], the top 211
nominally enriched tissues were all in brain (Supplementary Figure 6). 212
213
Functional enrichments 214
MAGMA tissue expression analysis [17, 18] using GTEx showed significant enrichments in 215
several brain tissues including cerebellum and cortex (Supplementary Figure 7). Although no 216
enrichment was observed via MAGMA gene-set analysis using gene-based p-values of all 217
protein-coding genes, the 152 genes prioritized by positional, expression quantitative trait loci 218
(eQTL), and chromatin interaction mapping were enriched in several gene sets, including 219
ethanol metabolic processes (Supplementary Table 7). 220
221
Genetic correlations with other traits 222
We estimated the genetic correlations between PAU and 715 publicly available sets of GWAS 223
.CC-BY-NC-ND 4.0 International licenseIt is made available under a (which was not peer-reviewed) is the author/funder, who has granted bioRxiv a license to display the preprint in perpetuity.
The copyright holder for this preprint. http://dx.doi.org/10.1101/738088doi: bioRxiv preprint first posted online Aug. 16, 2019;

12
summary statistics which included 228 published sets and 487 unpublished sets from the UK 224
Biobank. After Bonferroni correction (p < 6.99 × 10⁻⁵), 138 traits were significantly correlated 225
with PAU (Supplementary Table 8). Among the 26 published traits, drinks per week showed the 226
highest rg with PAU (rg = 0.77, se = 0.02, p = 3.25 × 10-265), consistent with the overall quantity 227
of alcohol consumed being a key domain of PAU [5, 19]. Several smoking traits and lifetime 228
cannabis use were positively genetically correlated with PAU, consistent with the high 229
comorbidity between alcohol and other substance use disorders in the general population [20]. 230
Among psychiatric disorders, major depressive disorder (MDD, rg = 0.39, se = 0.03, p = 1.43 × 231
10-40) showed the highest genetic correlation with PAU, extending the evidence for the shared 232
genetic contribution to MDD and alcohol-related traits [21, 22]. PAU was positively genetically 233
correlated with risk-taking behavior, insomnia, lung cancer, and other traits, and negatively 234
correlated with cognitive traits and parents’ age at death. These finding are in line with the 235
known adverse medical, psychiatric, and social consequences of problem drinking (Figure 3). 236
237
.CC-BY-NC-ND 4.0 International licenseIt is made available under a (which was not peer-reviewed) is the author/funder, who has granted bioRxiv a license to display the preprint in perpetuity.
The copyright holder for this preprint. http://dx.doi.org/10.1101/738088doi: bioRxiv preprint first posted online Aug. 16, 2019;

13
Figure 3. Genetic correlations with published traits. Of 228 published traits, 26 were 238
genetically correlated with PAU after Bonferroni correction (p < 0.05/715). MDD, major 239
depressive disorder; ADHD, attention deficit hyperactivity disorder. 240
241
Transcriptomic analyses 242
We used S-PrediXcan [23] to predict gene expression and the mediating effects of variation on 243
gene expression on PAU. Forty-eight tissues from GTEx [16] release v7 and whole blood 244
samples from the Depression Genes and Networks study (DGN) [24] were analyzed as 245
reference transcriptomes (Supplementary Table 9). After Bonferroni correction, 103 gene-tissue 246
associations were significant, representing 39 different genes, some of which were identified in 247
multiple tissues (Supplementary Table 10). For example, C1QTNF4 (C1q and tumor necrosis 248
factor related protein 4) was detected in 18 tissues, including brain, gastrointestinal, adipose, 249
and liver. None of the four significant alcohol dehydrogenase genes (ADH1A, ADH1B, ADH4, 250
and ADH5) was associated with expression in brain tissue, but they were associated with 251
expression in other tissues -- adipose, thyroid, gastrointestinal and heart. This might be due to 252
the generally low expression level of these genes in brain [25]. These cross-tissue associations 253
indicate that there are widespread functional consequences of PAU-risk-associated genetic 254
variation at the expression level. 255
Although the sample size for tissues used for eQTL analysis limits our ability to detect 256
associations, there are substantial common eQTLs across tissues [16]. Integrating evidence 257
from multiple tissues can increase power to detect genes relative to the tissues tested 258
individually, at least for shared eQTLs. We applied S-MultiXcan [26] to the summary data for 259
PAU using all 48 GTEx tissues as reference transcriptomic data. The expression of 34 genes 260
was significantly associated with PAU, including ADH1B, ADH4, ADH5, C1QTNF4, GCKR, and 261
.CC-BY-NC-ND 4.0 International licenseIt is made available under a (which was not peer-reviewed) is the author/funder, who has granted bioRxiv a license to display the preprint in perpetuity.
The copyright holder for this preprint. http://dx.doi.org/10.1101/738088doi: bioRxiv preprint first posted online Aug. 16, 2019;

14
DRD2 (Supplementary Table 11). Among the 34 genes, 27 overlapped with genes detected by 262
S-PrediXcan. 263
264
PAU PRS for phenome-wide associations 265
We calculated PRS for PAU in 67,589 individuals of European descent from the Vanderbilt 266
University Medical Center’s biobank, BioVU. We conducted a phenome-wide association study 267
(PheWAS) of PRS for PAU adjusting for sex, age (calculated as the median age across an 268
individual’s medical record), and top 10 principal components of ancestry. We standardized the 269
PRS so that the odds ratios correspond to a standard deviation increase in the PRS. After 270
Bonferroni correction, 31 of the 1,372 phenotypes tested were significantly associated with PAU 271
PRS, including alcohol-related disorders (OR = 1.46, se = 0.03, p = 3.34 × 10-40), alcoholism 272
(OR = 1.33, se = 0.03, p = 3.85 × 10⁻²⁸), tobacco use disorder (OR = 1.21, se = 0.01, p = 2.71 × 273
10-38), 6 respiratory conditions, and 17 additional psychiatric conditions (Supplementary Figure 8, 274
Supplementary Table 12). 275
276
PAU PRS with AD in independent samples 277
We tested the association between PAU PRS and alcohol dependence in three independent 278
samples: the iPSYCH group (ncase = 944, ncontrol = 11,408, neffective = 3,487); University College 279
London (UCL) Psych Array (ncase = 1,698, ncontrol = 1,228, neffective = 2,851); and UCL Core 280
Exome Array (ncase = 637, ncontrol = 9,189, neffective = 2,383). The PAU PRSs were significantly 281
associated with AD in all three samples, with the most variance explained in the UCL Psych 282
Array sample, which includes the most cases (PTbest = 0.001, R2 = 2.12%, p = 8.64 × 10⁻¹⁴). In 283
the iPSYCH group and UCL Core Exome Array samples, the maximal variance explained was 284
1.61% (PTbest = 0.3, p = 1.87 × 10⁻²²), and 0.77% (PTbest = 5 × 10⁻⁸, p = 1.65 × 10⁻⁷), respectively 285
.CC-BY-NC-ND 4.0 International licenseIt is made available under a (which was not peer-reviewed) is the author/funder, who has granted bioRxiv a license to display the preprint in perpetuity.
The copyright holder for this preprint. http://dx.doi.org/10.1101/738088doi: bioRxiv preprint first posted online Aug. 16, 2019;

15
(Supplementary Table 13). 286
287
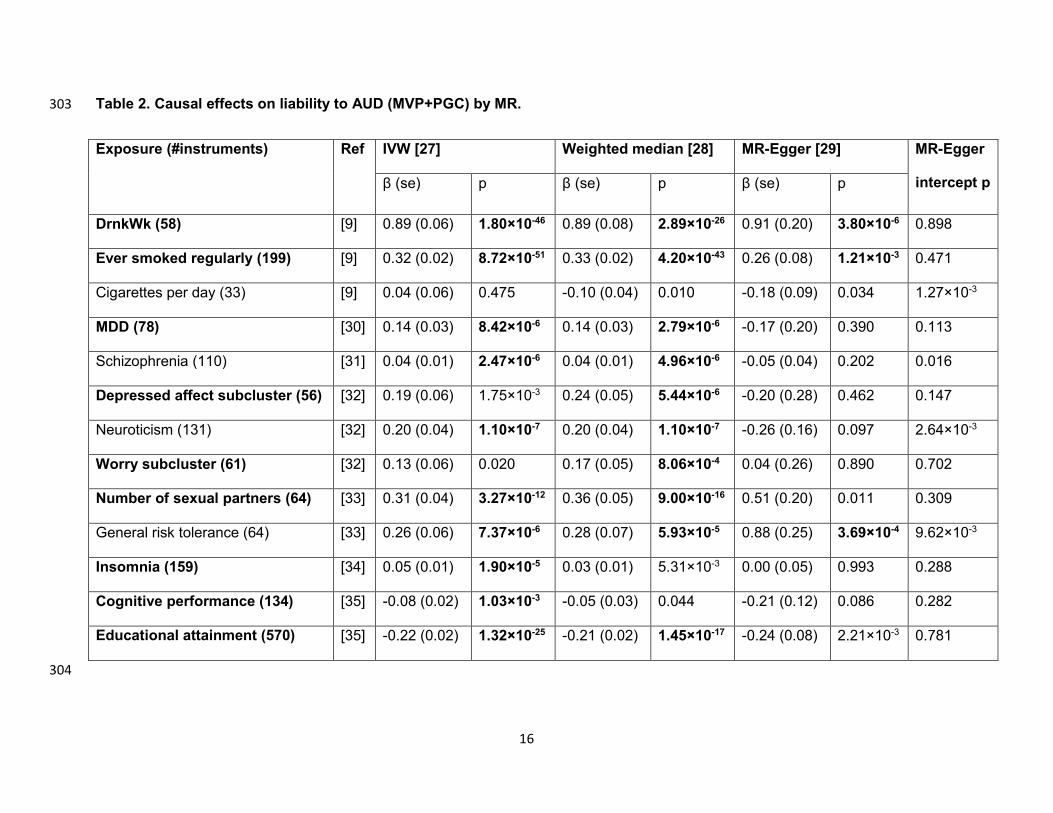
Mendelian Randomization 288
We tested the causal effects of liability to exposures on liability to AUD (MVP+PGC), rather than 289
PAU: the UKB AUDIT-P GWAS was excluded to minimize sample overlap with other GWAS for 290
putative exposures. We limited the exposures to those genetically correlated with PAU, and 291
have more than 30 available instruments. There were only 24 independent variants for AUD; 292
therefore the causal effects of liability to AUD on other traits (i.e., bidirectional) were not tested. 293
Among the 13 tested exposures, 12 showed evidence of a causal effect on liability to AUD, the 294
exception being cigarettes per day (Table 2). DrnkWk and ever smoked regularly have a 295
positive causal effect on AUD risk by all 3 methods, without violating MR assumptions through 296
horizontal pleiotropy (MR-Egger intercept p > 0.05). General risk tolerance was shown to be 297
causally related to AUD risk, though the estimate could be biased due to horizontal pleiotropy 298
(intercept p = 9.62 × 10⁻³). MDD, depressed affect neuroticism subcluster, worry neuroticism 299
subcluster, number of sexual partners, and insomnia show evidence of positive causal effects 300
on liability to AUD from at least one method, while cognitive performance and educational 301
attainment show evidence of negative causal effects.302
.CC-BY-NC-ND 4.0 International licenseIt is made available under a (which was not peer-reviewed) is the author/funder, who has granted bioRxiv a license to display the preprint in perpetuity.
The copyright holder for this preprint. http://dx.doi.org/10.1101/738088doi: bioRxiv preprint first posted online Aug. 16, 2019;
16
Table 2. Causal effects on liability to AUD (MVP+PGC) by MR. 303
Exposure (#instruments) Ref IVW [27] Weighted median [28] MR-Egger [29] MR-Egger
intercept p β (se) p β (se) p β (se) p
DrnkWk (58) [9] 0.89 (0.06) 1.80×10-46 0.89 (0.08) 2.89×10⁻²⁶ 0.91 (0.20) 3.80×10⁻⁶ 0.898
Ever smoked regularly (199) [9] 0.32 (0.02) 8.72×10-51 0.33 (0.02) 4.20×10-43 0.26 (0.08) 1.21×10⁻³ 0.471
Cigarettes per day (33) [9] 0.04 (0.06) 0.475 -0.10 (0.04) 0.010 -0.18 (0.09) 0.034 1.27×10⁻³
MDD (78) [30] 0.14 (0.03) 8.42×10⁻⁶ 0.14 (0.03) 2.79×10⁻⁶ -0.17 (0.20) 0.390 0.113
Schizophrenia (110) [31] 0.04 (0.01) 2.47×10⁻⁶ 0.04 (0.01) 4.96×10⁻⁶ -0.05 (0.04) 0.202 0.016
Depressed affect subcluster (56) [32] 0.19 (0.06) 1.75×10⁻³ 0.24 (0.05) 5.44×10⁻⁶ -0.20 (0.28) 0.462 0.147
Neuroticism (131) [32] 0.20 (0.04) 1.10×10⁻⁷ 0.20 (0.04) 1.10×10⁻⁷ -0.26 (0.16) 0.097 2.64×10⁻³
Worry subcluster (61) [32] 0.13 (0.06) 0.020 0.17 (0.05) 8.06×10⁻⁴ 0.04 (0.26) 0.890 0.702
Number of sexual partners (64) [33] 0.31 (0.04) 3.27×10⁻¹² 0.36 (0.05) 9.00×10⁻¹⁶ 0.51 (0.20) 0.011 0.309
General risk tolerance (64) [33] 0.26 (0.06) 7.37×10⁻⁶ 0.28 (0.07) 5.93×10⁻⁵ 0.88 (0.25) 3.69×10⁻⁴ 9.62×10⁻³
Insomnia (159) [34] 0.05 (0.01) 1.90×10⁻⁵ 0.03 (0.01) 5.31×10⁻³ 0.00 (0.05) 0.993 0.288
Cognitive performance (134) [35] -0.08 (0.02) 1.03×10⁻³ -0.05 (0.03) 0.044 -0.21 (0.12) 0.086 0.282
Educational attainment (570) [35] -0.22 (0.02) 1.32×10⁻²⁵ -0.21 (0.02) 1.45×10⁻¹⁷ -0.24 (0.08) 2.21×10⁻³ 0.781
304
.CC-BY-NC-ND 4.0 International licenseIt is made available under a (which was not peer-reviewed) is the author/funder, who has granted bioRxiv a license to display the preprint in perpetuity.
The copyright holder for this preprint. http://dx.doi.org/10.1101/738088doi: bioRxiv preprint first posted online Aug. 16, 2019;

17
P-values labeled in bold are significant after multiple testing correction. Traits labeled in bold are those having a causal effect on 305
AUD risk by at least one method without evidencing horizontal pleiotropy (MR-Egger intercept p > 0.05). IVW: inverse-variance 306
weighted (IVW) linear regression. DrnkWk: drinks per week. MDD: major depressive disorder. Depressed affect subcluster: 307
depressed affect subcluster of neuroticism. Worry subcluster: worry subcluster of neuroticism.308
.CC-BY-NC-ND 4.0 International licenseIt is made available under a (which was not peer-reviewed) is the author/funder, who has granted bioRxiv a license to display the preprint in perpetuity.
The copyright holder for this preprint. http://dx.doi.org/10.1101/738088doi: bioRxiv preprint first posted online Aug. 16, 2019;

18
Joint Analysis of PAU and DrnkWk Using MTAG 309
We conducted a joint analysis of PAU and DrnkWk using MTAG, which can increase the power 310
for each trait without introducing bias from sample overlap [10]. MTAG analysis increased the 311
GWAS-equivalent sample size (nEq) for PAU to 514,790, i.e., a 71.1% increase from the original 312
effective sample size (nE = 300,789, n = 435,563). In this analysis, we observed an increase in 313
the number of independent variants for PAU to 119, 76 of which were conditionally independent 314
(Supplementary Figure 9, Supplementary Table 14). For DrnkWk, the MTAG analysis increased 315
the nEq to 612,968 from 537,352, which yielded 141 independent variants, 86 of which were 316
conditionally independent (Supplementary Figure 10, Supplementary Table 15). MTAG analysis 317
increased the observed h2 of PAU to 0.113 (se = 0.005) from 0.068 (se = 0.004) and of DrnkWk 318
to 0.063 (se = 0.003) from the reported value of 0.042 (se = 0.002, Figure 2) [9]. 319
The MTAG analysis also increased the power for the functional enrichment analysis. 320
MAGMA gene set analysis for PAU after MTAG analysis detected 10 enriched Gene Ontology 321
terms, including ‘regulation of nervous system development’ (pBonferroni = 8.80 × 10⁻⁴), 322
‘neurogenesis’ (pBonferroni = 0.010), and ‘synapse’ (pBonferroni = 0.046) (Supplementary Table 16). 323
324
325
326
Discussion 327
We report here a genome-wide meta-analysis of PAU in 435,563 individuals of European 328
ancestry from the MVP, PGC, and UKB datasets. MVP is a mega-biobank that has 329
enrolled >750,000 subjects (for whom genotype data on 313,977 subjects was used in this 330
study), with rich phenotype data assessed by questionnaires and from the EHR. Currently, MVP 331
.CC-BY-NC-ND 4.0 International licenseIt is made available under a (which was not peer-reviewed) is the author/funder, who has granted bioRxiv a license to display the preprint in perpetuity.
The copyright holder for this preprint. http://dx.doi.org/10.1101/738088doi: bioRxiv preprint first posted online Aug. 16, 2019;

19
is the largest single cohort available with diagnostic information on AUD [3, 6]. PGC is a 332
collaborative consortium that has led the effort to collect smaller cohorts with DSM-IV AD [2]. 333
UKB is a population-level cohort with the largest available sample with AUDIT-P data [4]. 334
Our discovery meta-analysis of PAU yielded 29 independent variants, of which 19 were 335
novel, with 0.059 to 0.113 of the phenotypic variance explained in different cohorts or meta-336
analyses. The h2 in the Phase1-Phase2 MVP meta-analysis was 0.095 (se = 0.006), which was 337
higher than MVP phase1: 0.056 (se = 0.004, in MVP phase1 where only the actual (as opposed 338
to effective) sample size was used) [3] . The h2 of AD in PGC was 0.098 (se = 0.018), 339
comparable to the reported liability-scale h2 (0.090, se = 0.019) [2]. Functional and heritability 340
analyses consistently showed enrichments in brain regions and gene expression regulatory 341
regions, providing biological insights into the etiology of PAU. Variation associated with gene 342
expression in the brain is central to PAU risk, a conclusion that is also consistent with our 343
previous GWASs in MVP of both alcohol consumption and AUD diagnosis [3]. The enrichments 344
in regulatory regions point to specific brain tissues relevant to the causative genes; the specific 345
interactions between 16 genes and 325 drugs may provide targets for the development of 346
medications to manage PAU. Potential targets identified include the D2 dopamine receptor 347
(encoded by DRD2) and phosphodiesterase 4B (encoded by PDE4B). The presence of risk 348
variation at these loci also suggests the possibility that they may be “personalized medicine” 349
targets as well. 350
We also found that PAU was significantly genetically correlated with 138 other traits. The 351
top correlations were with substance use and substance-related disorders, MDD, schizophrenia, 352
and several other neuropsychiatric traits. In a conceptually similar analysis, we performed a 353
PheWAS of PAU PRS in BioVU, which confirmed the genetic correlations between PAU and 354
multiple substance use disorders, mood disorders, and other psychiatric traits in an independent 355
sample. We also used MR to infer causal effects of the above traits on liability to AUD (we 356
.CC-BY-NC-ND 4.0 International licenseIt is made available under a (which was not peer-reviewed) is the author/funder, who has granted bioRxiv a license to display the preprint in perpetuity.
The copyright holder for this preprint. http://dx.doi.org/10.1101/738088doi: bioRxiv preprint first posted online Aug. 16, 2019;
20
tested AUD excluding UKB samples to avoid sample overlap) using selected genetic 357
instruments. We found evidence of causal relationships from DrnkWk, ever smoked regularly, 358
MDD, depressed affect subcluster, worry subcluster, number of sexual partners, insomnia, 359
cognitive performance, and educational attainment to AUD risk, while cognitive performance 360
and educational attainment showed protective effects on liability to AUD. For some of these 361
observed effects, such as with schizophrenia, neuroticism, and general risk tolerance, we 362
cannot exclude horizontal pleiotropy among our instrument variables. We could not test the 363
reverse causality of AUD liability on other traits in the absence of large samples for those 364
targeted traits, which are required to draw causal inferences. Thus we cannot rule out the 365
possibility of bidirectional effects, which are plausible for several of these traits (e.g., MDD). 366
The study has other limitations. First, only European populations were included; 367
therefore, the genetic architecture of PAU in other populations remains largely unknown. To 368
date, the largest non-European sample to undergo GWAS for alcohol-related traits is African 369
American (AA), which was reported in the MVP phase1 sample (17,267 cases; 39,381 controls, 370
effective samples size 48,015), with the only associations detected being on chromosome 4 in 371
the ADH gene locus (where several ADH genes map) [3]. Collection of substantial numbers of 372
non-European subjects requires a concerted effort from our research field. Second, despite the 373
high genetic correlation between AUD and AUDIT-P, they are not identical traits. We conducted 374
a meta-analysis of the two traits to increase the power for the association study of PAU, 375
consequently, associations specific to AUD or AUDIT-P could have been attenuated. Third, 376
there was no opportunity for replication of the individual novel variants. Because the variants 377
were detected in more than 430,000 subjects and have small effect sizes, a replication sample 378
with adequate power would also have to be very large, and no such sample is currently 379
available. To validate the findings, we conducted PRS analyses in three independent cohorts, 380
which showed strong association with AUD. Although this indicates that our study had adequate 381
.CC-BY-NC-ND 4.0 International licenseIt is made available under a (which was not peer-reviewed) is the author/funder, who has granted bioRxiv a license to display the preprint in perpetuity.
The copyright holder for this preprint. http://dx.doi.org/10.1101/738088doi: bioRxiv preprint first posted online Aug. 16, 2019;

21
power for variant detection, it does not address the validity of the individual variants discovered. 382
This is the largest GWAS study of PAU so far. Previous work has shown that the genetic 383
architecture of AUD (and PAU) differs substantially from that of alcohol consumption [2-4]. 384
There have been larger studies of alcohol quantity-frequency measures [9, 36]; alcohol 385
consumption data are available in many EHRs, thus they were included in many studies of other 386
primary traits, like cardiac disease. AUD diagnoses are collected much less commonly. The 3-387
item AUDIT-C is a widely-used measure of alcohol consumption often available in EHRs, but 388
the full 10-item AUDIT, which allows the assessment of AUDIT-P, is not as widely available. 389
Despite the high genetic correlation between, for example, PAU and DrnkWk (rg=0.77), very 390
different patterns of genetic correlation and pleiotropy have been observed via LDSC and other 391
methods for these different kinds of indices of alcohol use [2-5]. PAU captures pathological 392
alcohol use: physiological dependence and/or significant medical consequences. 393
Quantity/frequency measures may capture alcohol use that is in the normal, or anyway 394
nonpathological, range. As such, we argue that although quantity/frequency measures are 395
important for understanding the biology of habitual alcohol use, PAU is the more important, and 396
more clearly pathological, trait. These circumstances underscore the importance of assembling 397
a large GWAS sample of PAU to inform the biology of PAU, and our study moves towards this 398
goal via the identification of numerous previously-unidentified risk loci: we increased known 399
PAU loci from 10 to 29, nearly tripling our knowledge of specific risk regions. Similarly, we 400
identified 66 gene-based associations, of which 46 were novel – again roughly tripling current 401
knowledge. MTAG analysis increased locus discovery to 119, representing 76 independent loci, 402
by levering information from DrnkWk [9]. By the same token, we provide a major increment in 403
information about the biology of PAU, providing considerable fodder for future in-vitro and 404
animal studies, which will be required to delineate the biology and function associated with each 405
risk variant. We anticipate that this knowledge may lead to improvements in treatment and 406
.CC-BY-NC-ND 4.0 International licenseIt is made available under a (which was not peer-reviewed) is the author/funder, who has granted bioRxiv a license to display the preprint in perpetuity.
The copyright holder for this preprint. http://dx.doi.org/10.1101/738088doi: bioRxiv preprint first posted online Aug. 16, 2019;

22
treatment personalization, a major ultimate goal of the work. 407
408
409
410
Methods 411
MVP datasets. The MVP is a mega-biobank supported by the U.S. Department of Veterans 412
Affairs (VA), enrollment for which began in 2011 and is ongoing. Phenotypic data were collected 413
using questionnaires and the VA electronic health records (EHR), and a blood sample was 414
obtained from each participant for genetic studies. Two phases of genotypic data have been 415
released and were included in this study. MVP phase1 contains 353,948 subjects, of whom 416
202,004 European Americans (EA) with AUD diagnoses were included in a previous GWAS and 417
the summary statistics were used in this study [3]. MVP phase2 released data on another 418
108,416 subjects, of whom 65,387 EAs with AUD diagnosis information were included in this 419
study. Following the same procedures as for MVP phase1, participants with at least one 420
inpatient or two outpatient alcohol-related ICD-9/10 codes from 2000 to 2018 were assigned a 421
diagnosis of AUD. 422
Ethics statement: The Central VA Institutional Review Board (IRB) and site-specific IRBs 423
approved the MVP study. All relevant ethical regulations for work with human subjects were 424
followed in the conduct of the study and informed consent was obtained from all participants. 425
Genotyping for both phases of MVP was performed using a customized Affymetrix 426
Biobank Array. Imputation and quality control methods for MVP phase1 were described in detail 427
in Kranzler et al. [3]. Similar methods were used for MVP phase2. Before imputation, phase2 428
subjects or SNPs with genotype call rate < 0.9 or high heterozygosity were removed, leaving 429
.CC-BY-NC-ND 4.0 International licenseIt is made available under a (which was not peer-reviewed) is the author/funder, who has granted bioRxiv a license to display the preprint in perpetuity.
The copyright holder for this preprint. http://dx.doi.org/10.1101/738088doi: bioRxiv preprint first posted online Aug. 16, 2019;

23
108,416 subjects and 668,324 SNPs. Imputation for MVP phase2 was done separately from 430
phase1; both were performed with EAGLE2 [37] and Minimac3 [38] using 1000 Genomes 431
Project phase 3 data [39] as the reference panel. Imputed genotypes with posterior probability ≥ 432
0.9 were transferred to best guess genotypes (the rest were treated as missing genotype calls). 433
A total of 6,635,093 SNPs with INFO scores > 0.7, genotype call rates or best guess rates > 434
0.95, Hardy Weinberg equilibrium p value < 1 × 10⁻⁶, minor allele frequency (MAF) > 0.001 were 435
remained for GWAS. 436
We removed subjects with mismatched genotypic and phenotypic sex and one subject 437
randomly from each pair of related individuals (kinship coefficient threshold = 0.0884), leaving 438
107,438 phase2 subjects for subsequent analyses. We used the same processes as MVP 439
phase1 to define EAs. First, we ran principal components analysis (PCA) on 74,827 common 440
SNPs (MAF > 0.05) shared by MVP and the 1000 Genomes phase 3 reference panels using 441
FastPCA [40]. Then we clustered each participant into the nearest reference population 442
according to the Euclidean distances between the participant and the centers of the 5 reference 443
populations using the first 10 PCs. A second PCA was performed for participants who were 444
clustered to the reference European population (EUR), and outliers were removed if any of the 445
first 10 PCs were > 3 standard deviations from the mean, leaving 67,268 EA subjects. 446
Individuals < 22 or > 90 years of age and those with a missing AUD diagnosis were 447
removed from the analyses, leaving 65,387 phase2 EAs (11,337 cases; 54,050 controls). 448
GWAS was then performed on the MVP phase2 dataset. We used logistic regression 449
implemented in PLINK v1.90b4.4 [41] for the AUD GWAS correcting for age, sex, and the first 450
10 PCs. 451
452
PGC summary statistics. We used the 46,568 European ancestry subjects (11,569 cases and 453
.CC-BY-NC-ND 4.0 International licenseIt is made available under a (which was not peer-reviewed) is the author/funder, who has granted bioRxiv a license to display the preprint in perpetuity.
The copyright holder for this preprint. http://dx.doi.org/10.1101/738088doi: bioRxiv preprint first posted online Aug. 16, 2019;

24
34,999 controls) from 27 cohorts that were analyzed by the Psychiatric Genomics Consortium 454
(PGC). The phenotype was lifetime DSM-IV diagnosis of alcohol dependence (AD). The 455
summary data were downloaded from the PGC website (https://www.med.unc.edu/pgc/) with full 456
agreement to the PGC conditions. Allele frequencies were not reported in the summary data. 457
We used allele frequencies from the 1000 Genome European sample as proxy measures in 458
PGC for some downstream analyses. 459
460
UK Biobank summary statistics. The UK Biobank (UKB) included 121,604 White-British 461
unrelated subjects with available AUDIT-P scores. Past-year AUDIT-P was assessed by 7 462
questions: 1). Frequency of inability to cease drinking; 2). Frequency of failure to fulfil normal 463
expectations due to drinking alcohol; 3). Frequency of needing morning drink of alcohol after 464
heavy drinking session; 4). Frequency of feeling guilt or remorse after drinking alcohol; 5). 465
Frequency of memory loss due to drinking alcohol; 6). Ever been injured or injured someone 466
else through drinking alcohol; 7). Ever had known person concerned about, or recommend 467
reduction of, alcohol consumption. The AUDIT-P was log10-transformed for GWAS (see ref [4] 468
for details). We removed SNPs with INFO < 0.7 or call rate < 0.95. 469
470
Meta-analyses. Meta-analyses were performed using METAL [42]. The meta-analysis within 471
MVP (for the purpose of genetic correlation analysis with PGC AD) was conducted using an 472
inverse variance weighted method because the two subsets were from the same cohort. The 473
meta-analyses for AUD (MVP+PGC) and PAU (MVP+PGC+UKB) were performed using the 474
sample size weighted method. Given the unbalanced ratios of cases to controls in MVP 475
samples, we calculated effective sample sizes for meta-analysis following the approach used by 476
the PGC: 477
.CC-BY-NC-ND 4.0 International licenseIt is made available under a (which was not peer-reviewed) is the author/funder, who has granted bioRxiv a license to display the preprint in perpetuity.
The copyright holder for this preprint. http://dx.doi.org/10.1101/738088doi: bioRxiv preprint first posted online Aug. 16, 2019;

25
41 1effective
case control
n
n n
=+
478
The calculated effective sample sizes in MVP and reported effective sample sizes in PGC were 479
used in meta-analyses and all downstream analyses. AUDIT-P in UKB is a continuous trait, so 480
we used actual sample sizes for that trait. For the AUD meta-analysis, variants present in only 481
one sample (except MVP phase1 which is much larger than the others) or with heterogeneity 482
test p-value < 5 × 10⁻⁸ were removed, leaving 7,003,540 variants. For the PAU meta-analysis, 483
variants present in only one sample (except MVP phase1 or UKB) or with heterogeneity test p-484
value < 5 × 10⁻⁸ and variants with effective sample size < 45,118 (15% of the total effective 485
sample size) were removed, leaving 14,069,427 variants. 486
487
AUD polygenic risk score in UKB. We calculated AUD polygenic risk scores (PRS) for each of 488
the 82,930 unrelated subjects in UKB who had AUDIT-P information [7]. A PRS was calculated 489
as the sum of the number of effective alleles with p-values less than a given threshold, weighted 490
by the effect sizes from AUD meta-analysis (MVP+PGC). We analyzed 10 p-value thresholds: 5 491
× 10-8, 1 × 10⁻⁷, 1 × 10⁻⁶, 1 × 10⁻⁵, 1 × 10⁻⁴, 0.001, 0.05, 0.3, 0.5, and 1, and clumped the AUD 492
summary data by LD with r2 < 0.3 in a 500 kb window. Then we tested the association between 493
AUD PRS and AUDIT-P, corrected for age, sex, and 10 PCs. The analysis was performed using 494
PRSice-2 [43]. 495
496
Independent variants and conditional analyses. We identified the independent variant (p < 5 497
× 10−8) in each locus (1 Mb genomic window) based on the smallest p value and r2 < 0.1 with 498
other independent variants. Variants with p < 1 × 10⁻⁸ and r2 > 0.1 with respect to the 499
independent variants were assigned to the independent variant’s clump. Any two independent 500
.CC-BY-NC-ND 4.0 International licenseIt is made available under a (which was not peer-reviewed) is the author/funder, who has granted bioRxiv a license to display the preprint in perpetuity.
The copyright holder for this preprint. http://dx.doi.org/10.1101/738088doi: bioRxiv preprint first posted online Aug. 16, 2019;
26
variants less than 1 Mb apart whose clumped regions overlapped were merged into one locus. 501
Given the known long-range LD for the ADH gene cluster on chromosome 4, we defined 502
chr4q23–q24 (~97.2 Mb – 102.6 Mb) as one locus. When multiple independent variants were 503
present in a locus, we ran conditional analyses using GCTA-COJO [44] to define conditionally 504
independent variants. For each variant other than the most significant one (index), we tested the 505
marginal associations conditioning on the index variant using Europeans (n = 503) from the 506
1000 Genomes as the LD reference sample. Variants with significant marginal associations (p < 507
5 × 10⁻⁸) were defined as conditionally independent variants (i.e., independent when 508
conditioned on other variants in the region) and subject to another round of conditional analyses 509
for each significant association. 510
For the conditionally independent variants for AUD or PAU, we also conducted a multi-511
trait analysis conditioning on GSCAN drinks per week [9] using GCTA-mtCOJO [45] to identify 512
variants associated with AUD or PAU, but not drinks per week, i.e., not alcohol consumption 513
alone. Europeans from the 1000 Genomes were used as the LD reference. For variants missing 514
in GSCAN, we used proxy variants (p < 5 × 10⁻⁸) in high LD with the locus for analyses. 515
Whereas conditional analyses require the beta (effect size) and standard error, we calculated 516
these using Z-scores (z), allele frequency (p) and sample size (n) from the meta-analyses [46]: 517
2
2
2 (1 )( )1
2 (1 )( )
zbetap p n z
SEp p n z
=− +
=− +
518
519
Gene-based association analysis. Gene-based association analysis for PAU was performed 520
using MAGMA implemented in FUMA [17, 18], which uses a multiple regression approach to 521
detect multi-marker effects that account for SNP p-values and LD between markers. We used 522
.CC-BY-NC-ND 4.0 International licenseIt is made available under a (which was not peer-reviewed) is the author/funder, who has granted bioRxiv a license to display the preprint in perpetuity.
The copyright holder for this preprint. http://dx.doi.org/10.1101/738088doi: bioRxiv preprint first posted online Aug. 16, 2019;

27
default settings to analyze 18,952 autosomal genes, with p < 2.64 × 10⁻⁶ (0.05/18,952) 523
considered GWS. 524
525
Drug-gene interaction. For the genes identified as significant by MAGMA, we examined drug-526
gene interaction through Drug Gene Interaction Database (DGIdb) v3.0.2 [11] 527
(http://www.dgidb.org/), a database integrated drug–gene interaction information resource 528
based on 30 sources. 529
530
SNP-based h2 and partitioning heritability enrichment. LDSC [12] was used to estimate the 531
SNP-based h2 for common SNPs mapped to HapMap3 [47], using Europeans from the 1000 532
Genomes Project [39] as the LD reference panel. We excluded the major histocompatibility 533
complex (MHC) region (chr6: 26–34Mb). 534
We conducted portioning h2 enrichment analyses for PAU using LDSC in different 535
models [13, 14]. First, a baseline model consisting of 52 functional categories was analyzed, 536
which included genomic features (coding, intron, UTR etc), regulatory annotations (promoter, 537
enhancer etc), epigenomic annotations (H3K27ac, H3K4me1, H3K3me3 etc) and others (see 538
ref [13] for details, Supplementary Figure 5). We then analyzed cell type group h2 enrichments 539
with 10 cell types: central nervous system (CNS), adrenal and pancreas, immune and 540
hematopoietic, skeletal muscle, gastrointestinal, liver, cardiovascular, connective tissue and 541
bone, kidney, and other (see ref [13] for details, Supplementary Figure 4). Third, we used LDSC 542
to test for enriched heritability in regions surrounding genes with the highest tissue-specific 543
expression using 53 human tissue or cell type RNA-seq data from the Genotype-Tissue 544
Expression Project (GTEx) [16], or enriched heritability in epigenetic markers from 396 human 545
epigenetic annotations (six features in a subset of 88 primary cell types or tissues) from the 546
.CC-BY-NC-ND 4.0 International licenseIt is made available under a (which was not peer-reviewed) is the author/funder, who has granted bioRxiv a license to display the preprint in perpetuity.
The copyright holder for this preprint. http://dx.doi.org/10.1101/738088doi: bioRxiv preprint first posted online Aug. 16, 2019;
28
Roadmap Epigenomics Consortium [15] (see ref [14] for details, Supplementary Figure 6, 547
Supplementary Table 6). For each model, the number of tested annotations was used to 548
calculate a Bonferroni corrected p-value < 0.05 as a significance threshold. 549
550
Gene-set and functional enrichment. We performed gene-set analysis for PAU for curated 551
gene sets and Gene Ontology (GO) terms using MAGMA [17, 18]. We then used MAGMA for 552
gene-property analyses to test the relationships between tissue-specific gene expression 553
profiles and PAU-gene associations. We analyzed gene expression data from 53 GTEx (v7) 554
tissues. We also performed gene-set analysis on the 152 prioritized genes using MAGMA. Gene 555
sets with adjusted p-value < 0.05 were considered as significant. 556
557
Genetic correlation. We estimated the genetic correlation (rg) between traits using LDSC [48]. 558
For PAU, we estimated the rg with 218 published traits in LD Hub [49], 487 unpublished traits 559
from the UK Biobank (integrated in LD Hub), and recently published psychiatric and behavioral 560
traits [9, 30, 32-35, 50-54], bringing the total number of tested traits to 715 (Supplementary 561
Table 8). For traits reported in multiple studies or in UKB, we selected the published version of 562
the phenotype or used the largest sample size. Bonferroni correction was applied and 563
correlation was considered significant at a p-value threshold of 6.99 × 10⁻⁵. 564
565
S-PrediXcan and S-MultiXcan. To perform transcriptome-wide association analysis, we used 566
S-PrediXcan [23] (a version of PrediXcan that uses GWAS summary statistics [55]) to integrate 567
transcriptomic data from GTEx [16] and the Depression Genes and Networks study (DGN) [24] 568
to analyze the summary data from the PAU meta-analysis. Forty-eight tissues with sample size > 569
70 from GTEx release v7 were analyzed, totaling 10,294 samples. DGN contains RNA 570
.CC-BY-NC-ND 4.0 International licenseIt is made available under a (which was not peer-reviewed) is the author/funder, who has granted bioRxiv a license to display the preprint in perpetuity.
The copyright holder for this preprint. http://dx.doi.org/10.1101/738088doi: bioRxiv preprint first posted online Aug. 16, 2019;

29
sequencing data from whole blood of 992 genotyped individuals. The transcriptome prediction 571
model database and the covariance matrices of the SNPs within each gene model were 572
downloaded from the PredictDB repository (http://predictdb.org/, 2018-01-08 release). Only 573
individuals of European ancestry in GTEx were analyzed. S-PrediXcan was performed for each 574
of the 49 tissues (48 from GTEx and 1 from DGN), for a total of 254,345 gene-tissue pairs. 575
Significant association was determined by Bonferroni correction (p < 1.97 × 10⁻⁷). 576
Considering the limited eQTL sample size for any single tissue and the substantial 577
sharing of eQTLs across tissues, we applied S-MultiXcan [26], which integrates evidence across 578
multiple tissues using multivariate regression to improve association detection. Forty-eight 579
tissues from GTEx were analyzed jointly. The threshold for condition number of eigenvalues 580
was set to 30 when truncating singular value decomposition (SVD) components. In total, 25,626 581
genes were tested in S-MultiXcan, leading to a significant p-value threshold of 1.95 × 10⁻⁶ 582
(0.05/25,626). 583
584
PAU PRS for phenome-wide associations. Polygenic scores were generated using PRS-CS 585
[56] on all genotyped individuals of European descent (n = 67,588) in Vanderbilt University 586
Medical Center’s EHR-linked biobank, BioVU. PRS-CS uses a Bayesian framework to model 587
linkage disequilibrium from an external reference set and a continuous shrinkage prior on SNP 588
effect sizes. We used 1000 Genomes Project Phase 3 European sample [39] as the LD 589
reference. Additionally, we used the PRS-CS-auto option, which allows the software to learn the 590
continuous shrinkage prior from the data. Polygenic scores were constructed from PRS-CS-auto 591
adjusted summary statistics containing 811,292 SNPs. All individuals used for polygenic scoring 592
were genotyped on the Illumina Multi-Ethnic Global Array (MEGA). Genotypes were filtered for 593
SNP (95%) and individual (98%) call rates, sex discrepancies, and excessive heterozygosity. 594
For related individuals, one of each pair was randomly removed (pi_hat > 0.2). SNPs showing 595
.CC-BY-NC-ND 4.0 International licenseIt is made available under a (which was not peer-reviewed) is the author/funder, who has granted bioRxiv a license to display the preprint in perpetuity.
The copyright holder for this preprint. http://dx.doi.org/10.1101/738088doi: bioRxiv preprint first posted online Aug. 16, 2019;

30
significant associations with genotyping batch were removed. Genetic ancestry was determined 596
by principal component analysis performed using EIGENSTRAT [57]. Imputation was completed 597
using the Michigan Imputation Server [38] and the Haplotype Reference Consortium [58] as the 598
reference panel. Genotypes were then converted to hard calls, and filtered for SNP imputation 599
quality (R2 > 0.3), individual missingness (>2%), SNP missingness (>2%), minor allele frequency 600
(<1%) and Hardy-Weinberg Equilibrium (p > 1 × 10⁻¹⁰). The resulting dataset contained 601
9,330,483 SNPs on 67,588 individuals of European ancestry. 602
We conducted a phenome-wide association study (PheWAS) [59] of the PAU PRS, by 603
fitting a logistic regression model to 1,372 case/control phenotypes to estimate the odds of each 604
diagnosis given the PAU polygenic score, controlling for sex, median age across the medical 605
record, top 10 principal components of ancestry, and genotyping batch. We required the 606
presence of at least two International Classification of Disease (ICD) codes that mapped to a 607
PheWAS disease category (Phecode Map 1.2) to assign “case” status. A phenotype was 608
required to have at least 100 cases to be included in the analysis. PheWAS analyses were run 609
using the PheWAS R package [60]. Bonferroni correction was applied to test for significance (p 610
< 0.05/1,372). 611
612
PAU PRS in independent samples. We calculated PAU PRS in three independent samples, 613
where we tested the association between PAU PRS and AD, corrected for age, sex, and 10 614
PCs. Ten p-value thresholds were applied in all samples. 615
iPSYCH Group. DNA samples for cases and controls were obtained from newborn bloodspots 616
linked to population registry data [61]. Cases were identified with the ICD-10 code F10.2 (AD; n 617
= 944); controls were from the iPSYCH group (n = 11,408; neffective = 3,487)). The iPSYCH 618
sample was genotyped on the Psych Array (Illumina, San Diego, CA, US). GWAS QC, 619
.CC-BY-NC-ND 4.0 International licenseIt is made available under a (which was not peer-reviewed) is the author/funder, who has granted bioRxiv a license to display the preprint in perpetuity.
The copyright holder for this preprint. http://dx.doi.org/10.1101/738088doi: bioRxiv preprint first posted online Aug. 16, 2019;

31
imputation against the 1,000 Genomes Project panel [39] and association analysis using the 620
Ricopili pipeline [62] were performed. 621
UCL Psych Array. Cases were identified with ICD-10 code F10.2 (n = 1,698) and comprised 492 622
individuals with a diagnosis of alcoholic hepatitis who had participated in the STOPAH (Steroids 623
or Pentoxifylline for Alcoholic Hepatitis) trial (ISRCTN88782125; EudraCT Number: 2009-624
013897-42) and 1,206 subjects recruited from the AD arm of the DNA Polymorphisms in Mental 625
Health (DPIM) study; controls were UK subjects who had either been screened for an absence 626
of mental illness and harmful substance use (n = 776), or were random blood donors (n-452; 627
total n = 1,228; neffective = 2,851). The sample was genotyped on the Psych Array (Illumina, San 628
Diego, CA, US). GWAS QC was performed using standard methods and imputation was done 629
using the haplotype reference consortium (HRC) panel [63] on the Sanger Imputation server 630
(https://imputation.sanger.ac.uk/). Association testing was performed using Plink1.9 [41]. 631
UCL Core Exome Array. Cases had an ICD-10 diagnosis of F10.2 (n = 637), including 324 632
individuals with a diagnosis of alcoholic hepatitis who had participated in the STOPAH trial and 633
313 subjects recruited from the AD arm of the DPIM study; controls were unrelated UK subjects 634
from the UK Household Longitudinal Study (UKHLS; n = 9,189; neffective = 2,383). The sample 635
was genotyped on the Illumina Human Core Exome Array (Illumina, San Diego, CA, US). 636
GWAS QC was performed using standard methods and imputation was done using the HRC 637
panel [63] on the Sanger Imputation server (https://imputation.sanger.ac.uk/). Association 638
testing was performed with Plink1.9 [41]. 639
640
Mendelian Randomization. We used Mendelian Randomization (MR) to investigate the causal 641
relationships with PAU liability of the many traits that were significantly genetically correlated (p 642
< 6.99 × 10⁻⁵). However, all or most of the published traits in recent large GWAS include UKB 643
.CC-BY-NC-ND 4.0 International licenseIt is made available under a (which was not peer-reviewed) is the author/funder, who has granted bioRxiv a license to display the preprint in perpetuity.
The copyright holder for this preprint. http://dx.doi.org/10.1101/738088doi: bioRxiv preprint first posted online Aug. 16, 2019;

32
data. To avoid biases caused by overlapping samples in MR analysis, we only tested the 644
relationship between published traits and AUD (MVP+PGC). For robust causal effect inference, 645
we limited the traits studied to those with more than 30 available instruments (association p < 5 646
× 10-8). Only the causal effects of liability to other exposures on AUD risk were tested given that 647
there are only 24 independent variants for AUD. In total, 13 exposures were analyzed (Table 2). 648
Three methods, weighted median [28], inverse-variance weighted (IVW, random-effects 649
model) [27], and MR-Egger [29], implemented in the R package “MendelianRandomization 650
v0.3.0” [64] were used for MR inference. Evidence of pleiotropic effects was examined by the 651
MR-Egger intercept test, where a non-zero intercept indicates directional pleiotropy [29]. 652
Instrumental variants that are associated with PAU (p < 5 × 10⁻⁸) were removed. For 653
instrumental variants missing in the PAU summary data, we used the results of the best-proxy 654
variant with the highest LD (r2 > 0.8) with the missing variant. If the MAF of the missing variant 655
was < 0.01, or none of the variants within 200 kb had LD r2 > 0.8, we removed the instrumental 656
variant from the analysis. 657
658
MTAG between PAU and drinks per week. Multiple trait analysis between PAU and drinks per 659
week (DrnkWk) from GSCAN was performed on summary statistics with multi-trait analysis of 660
GWAS (MTAG) v1.0.7 [10]. The summary data of DrnkWk were generated from 537,352 661
subjects, excluding the 23andMe samples that were not available to us for inclusion. We 662
analyzed variants with a minimum effective sample size of 80,603 (15%) in DrnkWk and a 663
minimum effective sample size of 45,118 (15%) in PAU, which left 10,613,246 overlapping 664
variants. 665
666
667
.CC-BY-NC-ND 4.0 International licenseIt is made available under a (which was not peer-reviewed) is the author/funder, who has granted bioRxiv a license to display the preprint in perpetuity.
The copyright holder for this preprint. http://dx.doi.org/10.1101/738088doi: bioRxiv preprint first posted online Aug. 16, 2019;

33
Acknowledgements 668
This research used data from the Million Veteran Program, Office of Research and 669 Development, Veterans Health Administration, and was supported by award #1I01BX003341 670 and CSP575B. This publication does not represent the views of the Department of Veterans 671 Affairs or the United States Government. Supported also by NIH (NIAAA) P50 AA12870, a 672 NARSAD Young Investigator Grant from the Brain & Behavior Research Foundation (HZ), and 673 NIH grants 5T32GM080178 (JMS) and K02DA32573 (AA); and the NIHR Imperial Biomedical 674 Research Centre (SRA and MRT). This research also used summary data from the Psychiatric 675 Genomics Consortium (PGC) Substance Use Disorders (SUD) working group. The PGC-SUD is 676 supported by funds from NIDA and NIMH to MH109532 and, previously, had analyst support 677 from NIAAA to U01AA008401 (COGA). PGC-SUD gratefully acknowledges its contributing 678 studies and the participants in those studies, without whom this effort would not be possible. 679 This research also used summary data from UK Biobank, a population-based sample of 680 participants whose contributions we gratefully acknowledge. We thank the iPSYCH-Broad 681 Consortium for access to data on the iPSYCH cohort. The iPSYCH project is funded by the 682 Lundbeck Foundation (R102-A9118 and R155-2014-1724) and the universities and university 683 hospitals of Aarhus and Copenhagen. Genotyping of iPSYCH samples was supported by grants 684 from the Lundbeck Foundation and the Stanley Foundation, The Danish National Biobank 685 resource was supported by the Novo Nordisk Foundation. Data handling and analysis on the 686 GenomeDK HPC facility was supported by NIMH (1U01MH109514-01 to ADB). High-687 performance computer capacity for handling and statistical analysis of iPSYCH data on the 688 GenomeDK HPC facility was provided by the Centre for Integrative Sequencing, iSEQ, Aarhus 689 University, Denmark (grant to ADB). 690
691
Disclosure: Dr. Kranzler is a member of the American Society of Clinical Psychopharmacology’s 692 Alcohol Clinical Trials Initiative, which was supported in the last three years by AbbVie, 693 Alkermes, Ethypharm, Indivior, Lilly, Lundbeck, Otsuka, Pfizer, Arbor, and Amygdala 694 Neurosciences. Drs. Kranzler and Gelernter are named as inventors on PCT patent application 695 #15/878,640 entitled: "Genotype-guided dosing of opioid agonists," filed January 24, 2018. 696
.CC-BY-NC-ND 4.0 International licenseIt is made available under a (which was not peer-reviewed) is the author/funder, who has granted bioRxiv a license to display the preprint in perpetuity.
The copyright holder for this preprint. http://dx.doi.org/10.1101/738088doi: bioRxiv preprint first posted online Aug. 16, 2019;

34
References 697
1. GBD 2016 Alcohol Collaborators., Alcohol use and burden for 195 countries and territories, 1990-698 2016: a systematic analysis for the Global Burden of Disease Study 2016. Lancet, 2018. 699 392(10152): p. 1015-1035. 700
2. Walters, R.K., et al., Transancestral GWAS of alcohol dependence reveals common genetic 701 underpinnings with psychiatric disorders. Nat Neurosci, 2018. 21(12): p. 1656-1669. 702
3. Kranzler, H.R., et al., Genome-wide association study of alcohol consumption and use disorder in 703 274,424 individuals from multiple populations. Nat Commun, 2019. 10(1): p. 1499. 704
4. Sanchez-Roige, S., et al., Genome-Wide Association Study Meta-Analysis of the Alcohol Use 705 Disorders Identification Test (AUDIT) in Two Population-Based Cohorts. Am J Psychiatry, 2019. 706 176(2): p. 107-118. 707
5. Gelernter, J., et al., Genome-wide Association Study of Maximum Habitual Alcohol Intake 708 in >140,000 U.S. European and African American Veterans Yields Novel Risk Loci. Biol Psychiatry, 709 2019. 710
6. Gaziano, J.M., et al., Million Veteran Program: A mega-biobank to study genetic influences on 711 health and disease. J Clin Epidemiol, 2016. 70: p. 214-23. 712
7. Bycroft, C., et al., The UK Biobank resource with deep phenotyping and genomic data. Nature, 713 2018. 562(7726): p. 203-209. 714
8. Gelernter, J., et al., Genome-wide association study of alcohol dependence:significant findings in 715 African- and European-Americans including novel risk loci. Mol Psychiatry, 2014. 19(1): p. 41-9. 716
9. Liu, M., et al., Association studies of up to 1.2 million individuals yield new insights into the 717 genetic etiology of tobacco and alcohol use. Nat Genet, 2019. 51(2): p. 237-244. 718
10. Turley, P., et al., Multi-trait analysis of genome-wide association summary statistics using MTAG. 719 Nat Genet, 2018. 50(2): p. 229-237. 720
11. Cotto, K.C., et al., DGIdb 3.0: a redesign and expansion of the drug-gene interaction database. 721 Nucleic Acids Res, 2018. 46(D1): p. D1068-D1073. 722
12. Bulik-Sullivan, B.K., et al., LD Score regression distinguishes confounding from polygenicity in 723 genome-wide association studies. Nat Genet, 2015. 47(3): p. 291-5. 724
13. Finucane, H.K., et al., Partitioning heritability by functional annotation using genome-wide 725 association summary statistics. Nat Genet, 2015. 47(11): p. 1228-35. 726
14. Finucane, H.K., et al., Heritability enrichment of specifically expressed genes identifies disease-727 relevant tissues and cell types. Nat Genet, 2018. 50(4): p. 621-629. 728
15. Roadmap Epigenomics Consortium, et al., Integrative analysis of 111 reference human 729 epigenomes. Nature, 2015. 518(7539): p. 317-30. 730
16. GTEx Consortium, Genetic effects on gene expression across human tissues. Nature, 2017. 731 550(7675): p. 204-213. 732
17. Watanabe, K., et al., Functional mapping and annotation of genetic associations with FUMA. Nat 733 Commun, 2017. 8(1): p. 1826. 734
18. de Leeuw, C.A., et al., MAGMA: generalized gene-set analysis of GWAS data. PLoS Comput Biol, 735 2015. 11(4): p. e1004219. 736
19. Marees, A.T., et al., Potential influence of socioeconomic status on genetic correlations between 737 alcohol consumption measures and mental health. Psychol Med, 2019: p. 1-15. 738
20. Grant, B.F., et al., Epidemiology of DSM-5 Alcohol Use Disorder: Results From the National 739 Epidemiologic Survey on Alcohol and Related Conditions III. JAMA Psychiatry, 2015. 72(8): p. 757-740 66. 741
.CC-BY-NC-ND 4.0 International licenseIt is made available under a (which was not peer-reviewed) is the author/funder, who has granted bioRxiv a license to display the preprint in perpetuity.
The copyright holder for this preprint. http://dx.doi.org/10.1101/738088doi: bioRxiv preprint first posted online Aug. 16, 2019;

35
21. Andersen, A.M., et al., Polygenic Scores for Major Depressive Disorder and Risk of Alcohol 742 Dependence. JAMA Psychiatry, 2017. 74(11): p. 1153-1160. 743
22. Zhou, H., et al., Genetic Risk Variants Associated With Comorbid Alcohol Dependence and Major 744 Depression. JAMA Psychiatry, 2017. 74(12): p. 1234-1241. 745
23. Barbeira, A.N., et al., Exploring the phenotypic consequences of tissue specific gene expression 746 variation inferred from GWAS summary statistics. Nat Commun, 2018. 9(1): p. 1825. 747
24. Battle, A., et al., Characterizing the genetic basis of transcriptome diversity through RNA-748 sequencing of 922 individuals. Genome Res, 2014. 24(1): p. 14-24. 749
25. Edenberg, H.J. and J.N. McClintick, Alcohol Dehydrogenases, Aldehyde Dehydrogenases, and 750 Alcohol Use Disorders: A Critical Review. Alcohol Clin Exp Res, 2018. 42(12): p. 2281-2297. 751
26. Barbeira, A.N., et al., Integrating predicted transcriptome from multiple tissues improves 752 association detection. PLoS Genet, 2019. 15(1): p. e1007889. 753
27. Bowden, J., et al., A framework for the investigation of pleiotropy in two-sample summary data 754 Mendelian randomization. Stat Med, 2017. 36(11): p. 1783-1802. 755
28. Bowden, J., et al., Consistent Estimation in Mendelian Randomization with Some Invalid 756 Instruments Using a Weighted Median Estimator. Genet Epidemiol, 2016. 40(4): p. 304-14. 757
29. Bowden, J., G. Davey Smith, and S. Burgess, Mendelian randomization with invalid instruments: 758 effect estimation and bias detection through Egger regression. Int J Epidemiol, 2015. 44(2): p. 759 512-25. 760
30. Howard, D.M., et al., Genome-wide meta-analysis of depression identifies 102 independent 761 variants and highlights the importance of the prefrontal brain regions. Nat Neurosci, 2019. 22(3): 762 p. 343-352. 763
31. Schizophrenia Working Group of the Psychiatric Genomics, C., Biological insights from 108 764 schizophrenia-associated genetic loci. Nature, 2014. 511(7510): p. 421-7. 765
32. Nagel, M., et al., Meta-analysis of genome-wide association studies for neuroticism in 449,484 766 individuals identifies novel genetic loci and pathways. Nat Genet, 2018. 50(7): p. 920-927. 767
33. Karlsson Linner, R., et al., Genome-wide association analyses of risk tolerance and risky 768 behaviors in over 1 million individuals identify hundreds of loci and shared genetic influences. Nat 769 Genet, 2019. 51(2): p. 245-257. 770
34. Jansen, P.R., et al., Genome-wide analysis of insomnia in 1,331,010 individuals identifies new risk 771 loci and functional pathways. Nat Genet, 2019. 51(3): p. 394-403. 772
35. Lee, J.J., et al., Gene discovery and polygenic prediction from a genome-wide association study of 773 educational attainment in 1.1 million individuals. Nat Genet, 2018. 50(8): p. 1112-1121. 774
36. Evangelou, E., et al., New alcohol-related genes suggest shared genetic mechanisms with 775 neuropsychiatric disorders. Nat Hum Behav, 2019. 776
37. Loh, P.R., et al., Reference-based phasing using the Haplotype Reference Consortium panel. Nat 777 Genet, 2016. 48(11): p. 1443-1448. 778
38. Das, S., et al., Next-generation genotype imputation service and methods. Nat Genet, 2016. 779 48(10): p. 1284-1287. 780
39. 1000 Genomes Project Consortium, A global reference for human genetic variation. Nature, 781 2015. 526(7571): p. 68-74. 782
40. Galinsky, K.J., et al., Fast Principal-Component Analysis Reveals Convergent Evolution of ADH1B 783 in Europe and East Asia. Am J Hum Genet, 2016. 98(3): p. 456-472. 784
41. Chang, C.C., et al., Second-generation PLINK: rising to the challenge of larger and richer datasets. 785 Gigascience, 2015. 4: p. 7. 786
42. Willer, C.J., Y. Li, and G.R. Abecasis, METAL: fast and efficient meta-analysis of genomewide 787 association scans. Bioinformatics, 2010. 26(17): p. 2190-1. 788
.CC-BY-NC-ND 4.0 International licenseIt is made available under a (which was not peer-reviewed) is the author/funder, who has granted bioRxiv a license to display the preprint in perpetuity.
The copyright holder for this preprint. http://dx.doi.org/10.1101/738088doi: bioRxiv preprint first posted online Aug. 16, 2019;

36
43. Euesden, J., C.M. Lewis, and P.F. O'Reilly, PRSice: Polygenic Risk Score software. Bioinformatics, 789 2015. 31(9): p. 1466-8. 790
44. Yang, J., et al., Conditional and joint multiple-SNP analysis of GWAS summary statistics identifies 791 additional variants influencing complex traits. Nat Genet, 2012. 44(4): p. 369-75, S1-3. 792
45. Zhu, Z., et al., Causal associations between risk factors and common diseases inferred from 793 GWAS summary data. Nat Commun, 2018. 9(1): p. 224. 794
46. Zhu, Z., et al., Integration of summary data from GWAS and eQTL studies predicts complex trait 795 gene targets. Nat Genet, 2016. 48(5): p. 481-7. 796
47. International HapMap Consortium, et al., Integrating common and rare genetic variation in 797 diverse human populations. Nature, 2010. 467(7311): p. 52-8. 798
48. Bulik-Sullivan, B., et al., An atlas of genetic correlations across human diseases and traits. Nat 799 Genet, 2015. 47(11): p. 1236-41. 800
49. Zheng, J., et al., LD Hub: a centralized database and web interface to perform LD score regression 801 that maximizes the potential of summary level GWAS data for SNP heritability and genetic 802 correlation analysis. Bioinformatics, 2017. 33(2): p. 272-279. 803
50. Pasman, J.A., et al., GWAS of lifetime cannabis use reveals new risk loci, genetic overlap with 804 psychiatric traits, and a causal influence of schizophrenia. Nat Neurosci, 2018. 21(9): p. 1161-805 1170. 806
51. Savage, J.E., et al., Genome-wide association meta-analysis in 269,867 individuals identifies new 807 genetic and functional links to intelligence. Nat Genet, 2018. 50(7): p. 912-919. 808
52. Demontis, D., et al., Discovery of the first genome-wide significant risk loci for attention 809 deficit/hyperactivity disorder. Nat Genet, 2019. 51(1): p. 63-75. 810
53. Jansen, I.E., et al., Genome-wide meta-analysis identifies new loci and functional pathways 811 influencing Alzheimer's disease risk. Nat Genet, 2019. 51(3): p. 404-413. 812
54. Stahl, E.A., et al., Genome-wide association study identifies 30 loci associated with bipolar 813 disorder. Nat Genet, 2019. 51(5): p. 793-803. 814
55. Gamazon, E.R., et al., A gene-based association method for mapping traits using reference 815 transcriptome data. Nat Genet, 2015. 47(9): p. 1091-8. 816
56. Ge, T., et al., Polygenic prediction via Bayesian regression and continuous shrinkage priors. Nat 817 Commun, 2019. 10(1): p. 1776. 818
57. Price, A.L., et al., Principal components analysis corrects for stratification in genome-wide 819 association studies. Nat Genet, 2006. 38(8): p. 904-9. 820
58. McCarthy, S., et al., A reference panel of 64,976 haplotypes for genotype imputation. Nat Genet, 821 2016. 48(10): p. 1279-83. 822
59. Denny, J.C., et al., Systematic comparison of phenome-wide association study of electronic 823 medical record data and genome-wide association study data. Nat Biotechnol, 2013. 31(12): p. 824 1102-10. 825
60. Carroll, R.J., L. Bastarache, and J.C. Denny, R PheWAS: data analysis and plotting tools for 826 phenome-wide association studies in the R environment. Bioinformatics, 2014. 30(16): p. 2375-6. 827
61. Pedersen, C.B., et al., The iPSYCH2012 case-cohort sample: new directions for unravelling genetic 828 and environmental architectures of severe mental disorders. Mol Psychiatry, 2018. 23(1): p. 6-14. 829
62. Lam, M., et al., RICOPILI: Rapid Imputation for COnsortias PIpeLIne. BioRxiv, 2019. 830 https://doi.org/10.1101/587196. 831
63. McCarthy, S., et al., A reference panel of 64,976 haplotypes for genotype imputation. Nat Genet, 832 2016. 48(10): p. 1279-83. 833
64. Yavorska, O.O. and S. Burgess, MendelianRandomization: an R package for performing 834 Mendelian randomization analyses using summarized data. Int J Epidemiol, 2017. 46(6): p. 1734-835 1739. 836
.CC-BY-NC-ND 4.0 International licenseIt is made available under a (which was not peer-reviewed) is the author/funder, who has granted bioRxiv a license to display the preprint in perpetuity.
The copyright holder for this preprint. http://dx.doi.org/10.1101/738088doi: bioRxiv preprint first posted online Aug. 16, 2019;
Recommended