ANALYTICS AND GRAPHS
GLOBAL CLEAN ENERGY REVIEW
www.cleanenergypipeline.com
1Q16

For any questions regarding the information contained herewith or to request additional data / information,
please contact:
Thomas SturgeHead of Research
Thai TranHead of Data
Amélie Labbé ThompsonEditor
Sonja van Linden TolGlobal Head of Sales
NOTE:
This material is protected by UK and international copyright.
You may reproduce this material citing “Clean Energy Pipeline” as a source.
Clean Energy Pipeline is a division of Centaur Media PLC.
CONTACT

TOTAL NEW CLEAN ENERGY INVESTMENT 4
VENTURE CAPITAL & PRIVATE EQUITY 6
MERGERS & ACQUISITIONS 10
PROJECT / ASSET FINANCE 20
GREEN BONDS 30
PUBLIC MARKETS 35
CONTENTS
3 © 2016 Clean Energy Pipeline. All rights reserved

TOTAL NEW CLEAN ENERGY INVESTMENT 1Q09 TO 1Q16
Note: This excludes corporate M&A transactions and private equity buyouts. Project finance includes debt and equity invested in projects above 1MW.
1Q09
2Q09
3Q09
4Q09
1Q10
2Q10
3Q10
4Q10
1Q11
2Q11
3Q11
4Q11
1Q12
2Q12
3Q12
4Q12
1Q13
2Q13
3Q13
4Q13
1Q14
2Q14
3Q14
4Q14
1Q15
2Q15
3Q15
4Q15
1Q16
4 © 2016 Clean Energy Pipeline. All rights reserved

BY ASSET REGION (2009 TO 1Q16) BY SECTOR (2009 TO 1Q16)
Asia Pacific Europe North America Latin & Central America Africa & Middle East
Solar Wind Biomass Other
TOTAL NEW CLEAN ENERGY INVESTMENT 1Q09 TO 1Q16
5 © 2016 Clean Energy Pipeline. All rights reserved

VENTURE CAPITAL & PRIVATE EQUITY

GLOBAL VENTURE CAPITAL AND PRIVATE EQUITY INVESTMENT 1Q09 TO 1Q16
AVERAGE QUARTERLY VC/PE INVESTMENTVenture Capital (early-stage)Venture Capital (late -stage)Private Equity (development capital)
1Q09 TO 1Q16$925 million$464 million$866 million
AVERAGE DEAL SIZE Venture Capital (early-stage)Venture Capital (late -stage)Private Equity (development capital)
1Q09 TO 1Q16$6.45 million$19.4 million$43.9 million
Note: This excludes private equity buyouts.
7 © 2016 Clean Energy Pipeline. All rights reserved

Solar Wind Energy Efficiency Agriculture Biomass Other
Energy Efficiency Solar Agriculture Energy Storage Wind Other
PERCENTAGE OF TOTAL DEAL VALUE
PERCENTAGE OF NUMBER OF DEALS
$2.0 BILLION
37%
15%
20%
18%
7%
3%
126DEALS
30%26%
21%10%
7%
6%
GLOBAL VENTURE CAPITAL & PRIVATE EQUITY (EXCLUDING BUYOUTS) BY SECTOR 1Q16
8 © 2016 Clean Energy Pipeline. All rights reserved

1Q16TOP TEN VENTURE CAPITAL/PRIVATE EQUITY TRANSACTIONS
COMPANY COUNTRY INVESTOR(S) DEAL VALUE ($M)
Sunnova Energy USA Energy Capital Partners 300
United Wind USA Forum Equity Partners 200
Laoting Wind Energy China China Suntien Green Energy, Hebei Construction & Investment New Co. Ltd., Jointo Energy Investment
156
Essel Infra Projects India Piramal Enterprises, APG Asset Management 132
Zynergy Projects and Services
India Kohli Ventures 100
Renew Financial USA Angeleno Group, Claremont Creek Ventures, NGEN Partners, Prelude Ven-tures, Apollo Global Management , LL Funds
70
Indigo USA Flagship Ventures 56
FCM Bioenergy UK Floreat Group 50
Sunverge Energy USA Siemens Venture Capital, AGL Energy, Softbank China Venture Capital, Total Energy Ventures International, Australia Renewable Energy Agency (ARENA)
37
Figtree Financing USA LL Funds 30
9 © 2016 Clean Energy Pipeline. All rights reserved

MERGERS & ACQUISITIONS

GLOBAL MERGERS & ACQUISITIONS 1Q09 TO 1Q16
11 © 2016 Clean Energy Pipeline. All rights reserved

GLOBAL MERGERS & ACQUISITIONS 1Q09 TO 1Q16
12 © 2016 Clean Energy Pipeline. All rights reserved

AVERAGE M&A INVESTMENT 1Q09 TO 1Q16
Average quarterly M&A deal volume $16.8 billion
Average number of deals per quarter 249 deals
Average M&A transaction value $67.6 million
GLOBAL MERGERS & ACQUISITIONS 1Q09 TO 1Q16
13 © 2016 Clean Energy Pipeline. All rights reserved
DEAL VALUE ($ BILLION) NUMBER OF DEALS
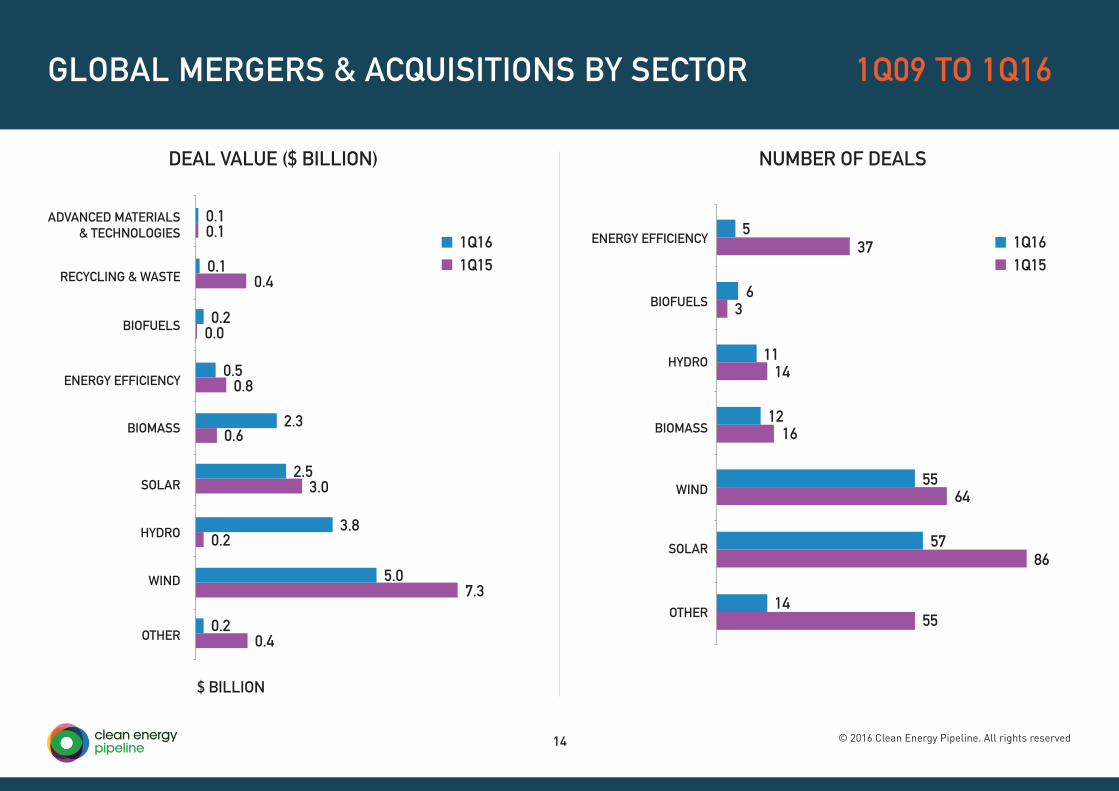
GLOBAL MERGERS & ACQUISITIONS BY SECTOR 1Q09 TO 1Q16
0.10.1
0.1
0.2
0.5
2.3
2.5
3.8
5.0
0.2
1Q16 1Q161Q15 1Q15
0.4
0.0
0.8
0.6
3.0
0.2
7.3
0.4
$ BILLION
5
6
11
12
55
57
14
37
3
14
16
64
86
55
14 © 2016 Clean Energy Pipeline. All rights reserved
1Q15 1Q15
1Q16 1Q16
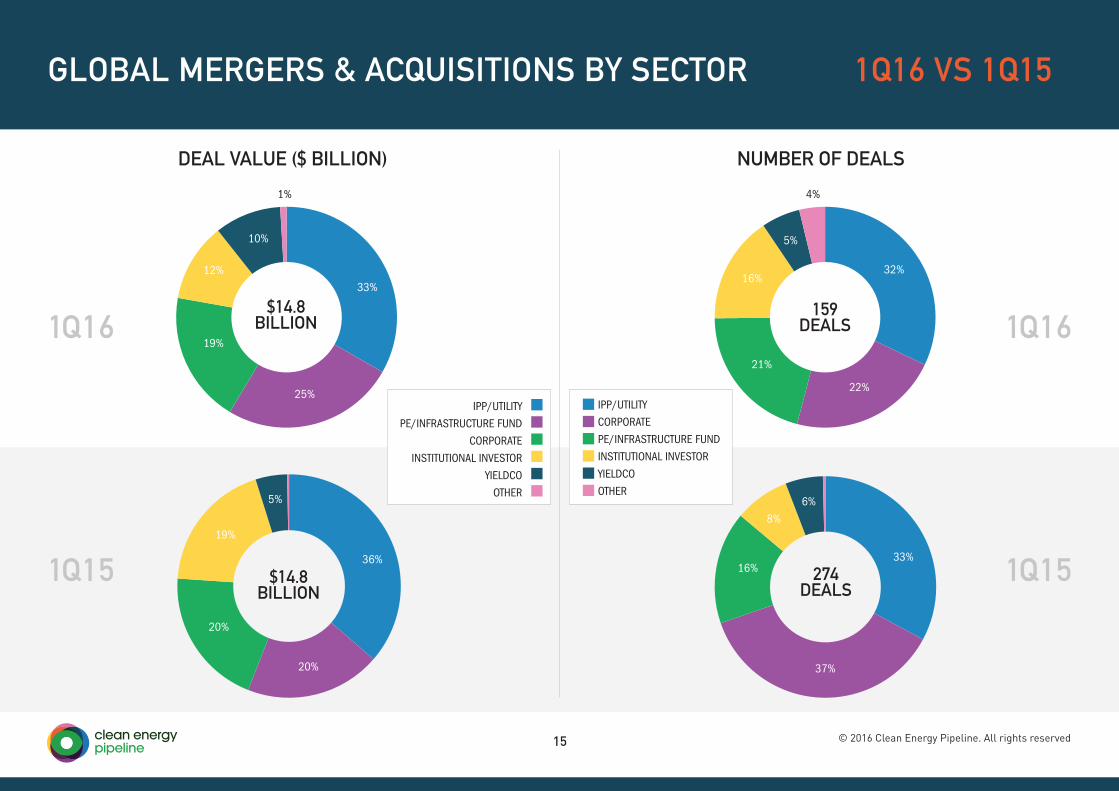
GLOBAL MERGERS & ACQUISITIONS BY SECTOR
DEAL VALUE ($ BILLION) NUMBER OF DEALS
IPP/UTILITY
PE/INFRASTRUCTURE FUND
CORPORATE
INSTITUTIONAL INVESTOR
YIELDCO
OTHER
1Q16 VS 1Q15
IPP/UTILITY
CORPORATE
PE/INFRASTRUCTURE FUND
INSTITUTIONAL INVESTOR
YIELDCO
OTHER
15 © 2016 Clean Energy Pipeline. All rights reserved
274DEALS
6%
8%
16%
37%
33%
$14.8 BILLION
5%
19%
20%
20%
36%
$14.8 BILLION
10%
12%
19%
25%
33%
1%
159DEALS
32%
22%
21%
16%
5%
4%

GLOBAL MERGERS & ACQUISITIONS BY TARGET TYPE
1Q16 VS 1Q15
1Q15 1Q15
1Q16 1Q16
DEAL VALUE ($ BILLION) NUMBER OF DEALS
159DEALS
274DEALS
$14.8 BILLION
$14.8 BILLION
88%
21%
77%
43%53%
4%
11%
58%
41%
1%
1%
2%
RENEWABLE ENERGY PROJECTS
SUPPLY CHAIN TARGETS
CLEAN TECHNOLOGY TARGETS
16 © 2016 Clean Energy Pipeline. All rights reserved

IN OPERATION
UNDER CONSTRUCTION
PRE-CONSTRUCTION
GLOBAL MERGERS & ACQUISITIONS OF RENEWABLE PROJECTS
1Q09 TO 1Q16
17 © 2016 Clean Energy Pipeline. All rights reserved
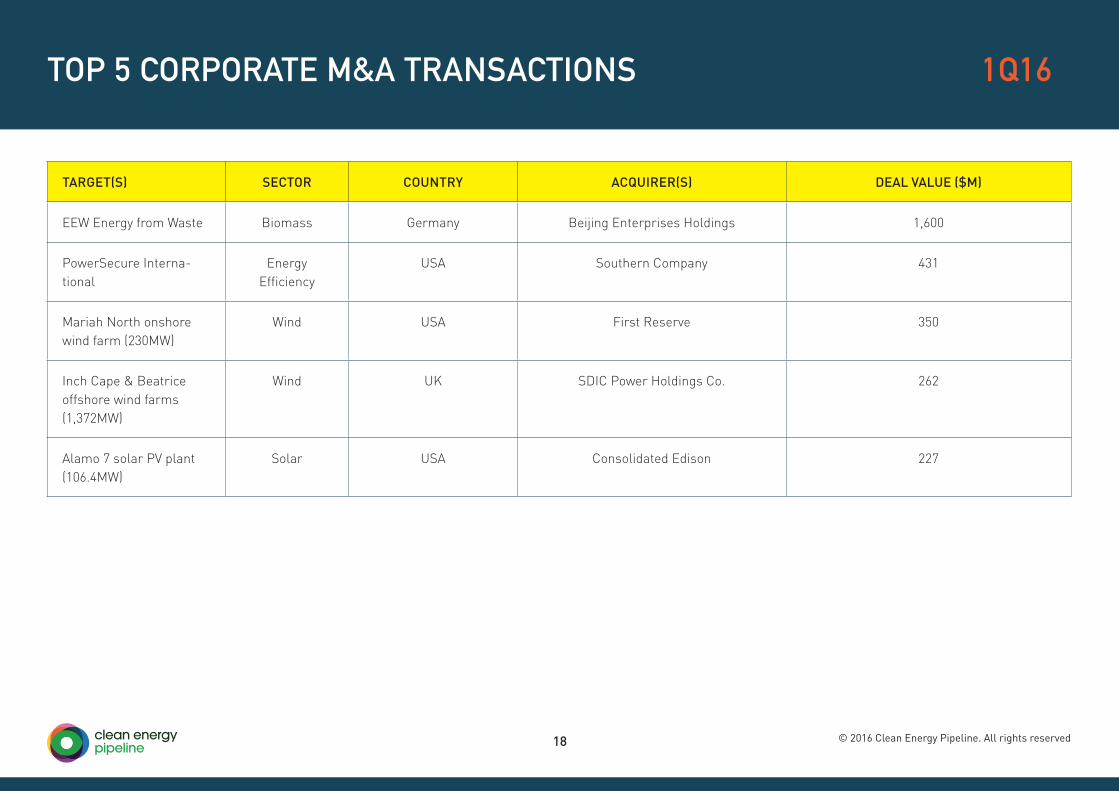
TARGET(S) SECTOR COUNTRY ACQUIRER(S) DEAL VALUE ($M)
EEW Energy from Waste Biomass Germany Beijing Enterprises Holdings 1,600
PowerSecure Interna-tional
Energy Efficiency
USA Southern Company 431
Mariah North onshore wind farm (230MW)
Wind USA First Reserve 350
Inch Cape & Beatrice offshore wind farms (1,372MW)
Wind UK SDIC Power Holdings Co. 262
Alamo 7 solar PV plant (106.4MW)
Solar USA Consolidated Edison 227
TOP 5 CORPORATE M&A TRANSACTIONS 1Q16
18 © 2016 Clean Energy Pipeline. All rights reserved

TARGET(S) SECTOR COUNTRY ACQUIRER(S) DEAL VALUE ($M)
Isagen Hydro Colombia Brookfield Renewable Energy Partners 2,200
Hydro plants in New England (1400MW)
Hydro USA Public Sector Pension Investment Board 1,200
Burbo Bank offshore wind farm Extension (258MW)
Wind UK PKA, KIRKBI 953
Clyde onshore wind farm (350MW)
Wind UK Greencoat UK Wind, GMPF & LPFA Infra-structure
510
China Ming Yang Wind Power Group
Wind China Dajun Guangcheng (Shanghai) Capital Fund I 408
TOP 5 PE BUYOUT TRANSACTIONS 1Q16
19 © 2016 Clean Energy Pipeline. All rights reserved
PROJECT / ASSET FINANCE
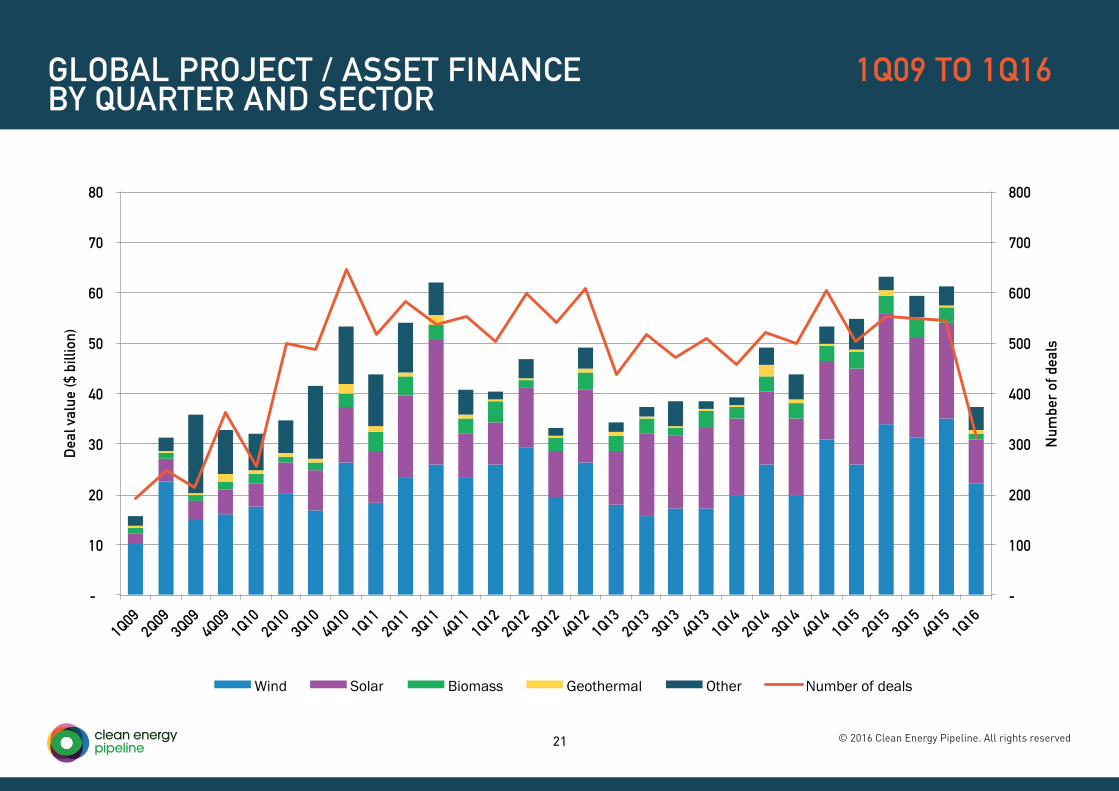
GLOBAL PROJECT / ASSET FINANCE BY QUARTER AND SECTOR
1Q09 TO 1Q16
21 © 2016 Clean Energy Pipeline. All rights reserved
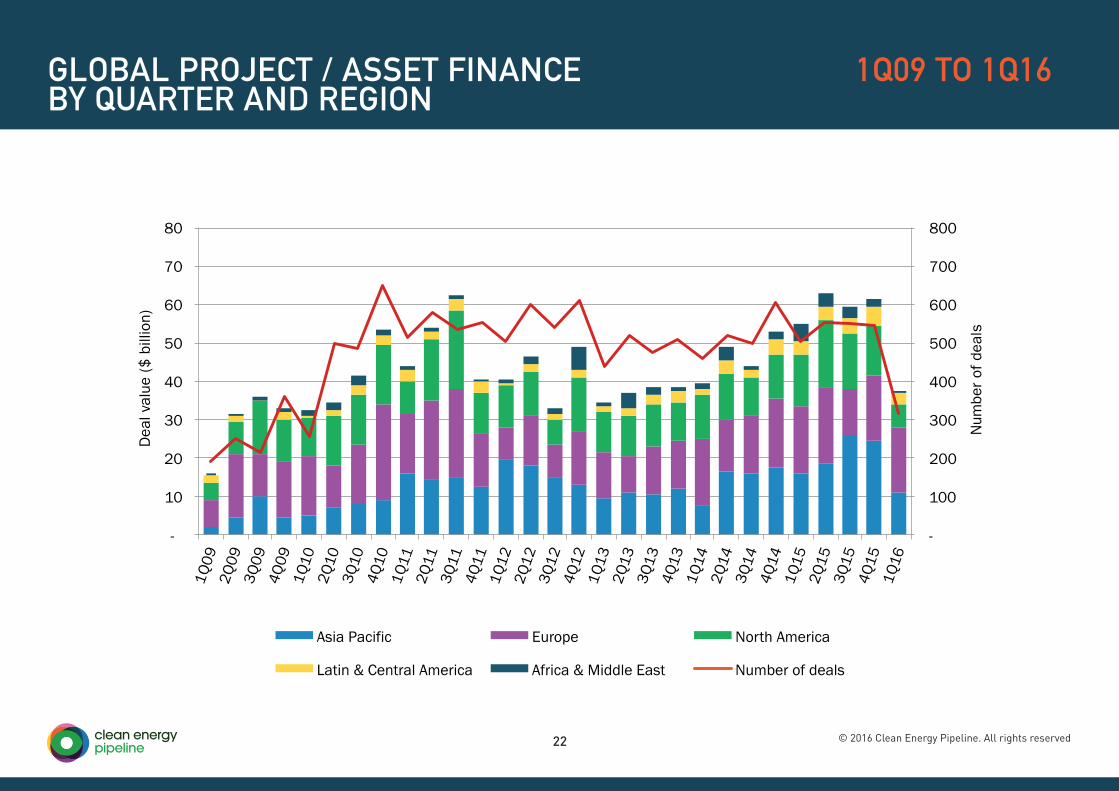
GLOBAL PROJECT / ASSET FINANCE BY QUARTER AND REGION
1Q09 TO 1Q16
22 © 2016 Clean Energy Pipeline. All rights reserved

ASIA PACIFIC PROJECT / ASSET FINANCE 1Q09 TO 1Q16
23 © 2016 Clean Energy Pipeline. All rights reserved
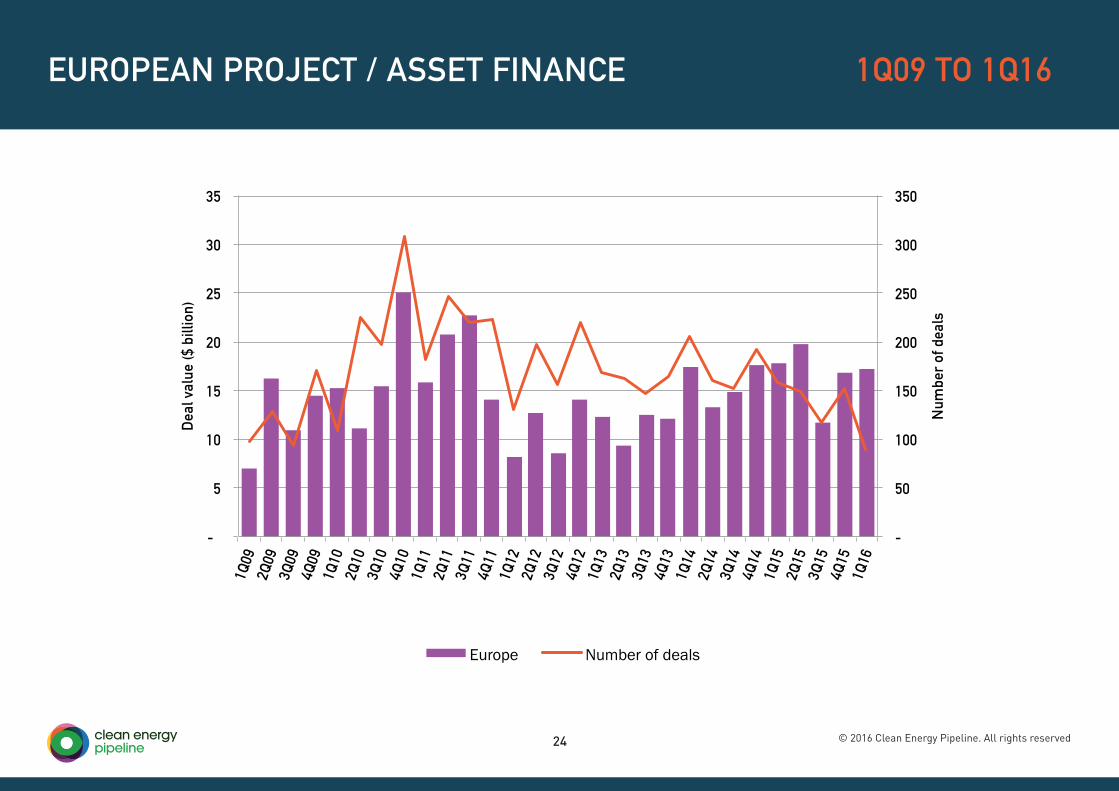
EUROPEAN PROJECT / ASSET FINANCE 1Q09 TO 1Q16
24 © 2016 Clean Energy Pipeline. All rights reserved

NORTH AMERICAN PROJECT / ASSET FINANCE
1Q09 TO 1Q16
25 © 2016 Clean Energy Pipeline. All rights reserved

LATIN AMERICA PROJECT / ASSET FINANCE
1Q09 TO 1Q16
26 © 2016 Clean Energy Pipeline. All rights reserved
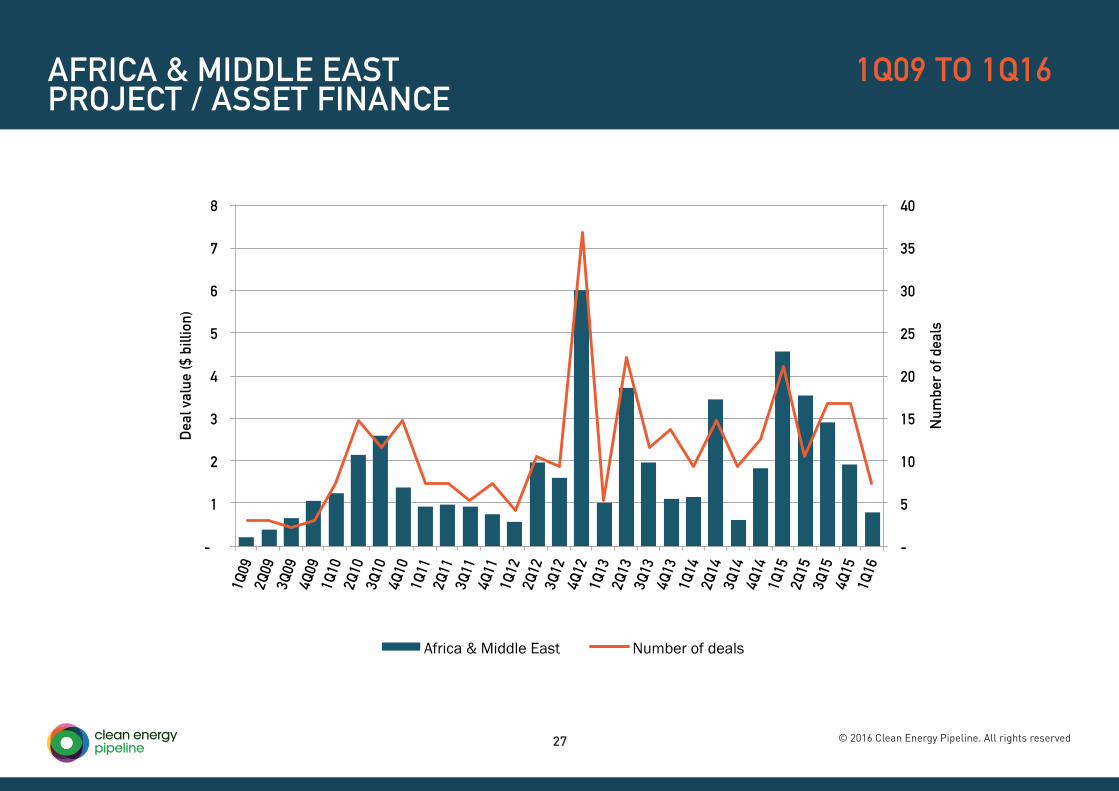
AFRICA & MIDDLE EAST PROJECT / ASSET FINANCE
1Q09 TO 1Q16
27 © 2016 Clean Energy Pipeline. All rights reserved

GLOBAL PROJECT / ASSET FINANCE BY SECTOR
1Q16 VS 1Q15
NOTE: FIGURES ARE IN $ BILLION
28 © 2016 Clean Energy Pipeline. All rights reserved

TOP 10 PROJECT FINANCE TRANSACTIONS 1Q16
PROJECT COUNTRY PROJECT SPONSOR(S) DEBT PROVIDER(S) INVESTMENT ($)
Hornsea Phase 1 offshore wind farm (1,200MW) UK DONG Energy 4,321
East Anglia 1 offshore wind farm (714MW) UK Scottish Power Renewables 3,525
Caithness Moray transmission line project UK SSE European Investment Bank 1,770
Lithium battery manufacturing facility - Lian City, Huzhou City, Zhejiang Province
China Zhejiang Baicheng New Energy Asian Development Bank 1,640
Fosen wind portfolio (1,000MW) Norway Nordic Windpower/ Statkraft/ Nord Trøndelag Elektrisitets-
verk (NTE) / TronderEnergi
1,218
Pirapora solar PV plants Brazil Canadian Solar / Solatio En-ergia
849
Seiling I & II onshore wind farms (299MW) USA NextEra Energy Partners 523
Las Pailas Expansion, Borinquen I&II geothermal plants (165MW)
Costa Rica Instituto Costarricense de Electricidad
Inter-American Development Bank 500
Luchterduinen offshore wind farm (129MW) Netherlands Eneco Holding / Mitsubishi Japan Bank for International 476
Noor Midelt solar PV plants (470MW) Morocco MASEN KfW Bankengruppe 438
29 © 2016 Clean Energy Pipeline. All rights reserved
GREENBONDS

GREEN BOND ISSUANCES 2007 TO DATE
31 © 2016 Clean Energy Pipeline. All rights reserved

GREEN BOND ISSUANCES BY ISSUER REGION 4Q15 VS 4Q14
1Q16 1Q15
ASIA PACIFIC
NORTH AMERICA
EUROPE
LATIN AMERICA
$20.8BILLION
$9.8BILLION
26%
44%
17%
37%
45%
1%
30%
32 © 2016 Clean Energy Pipeline. All rights reserved
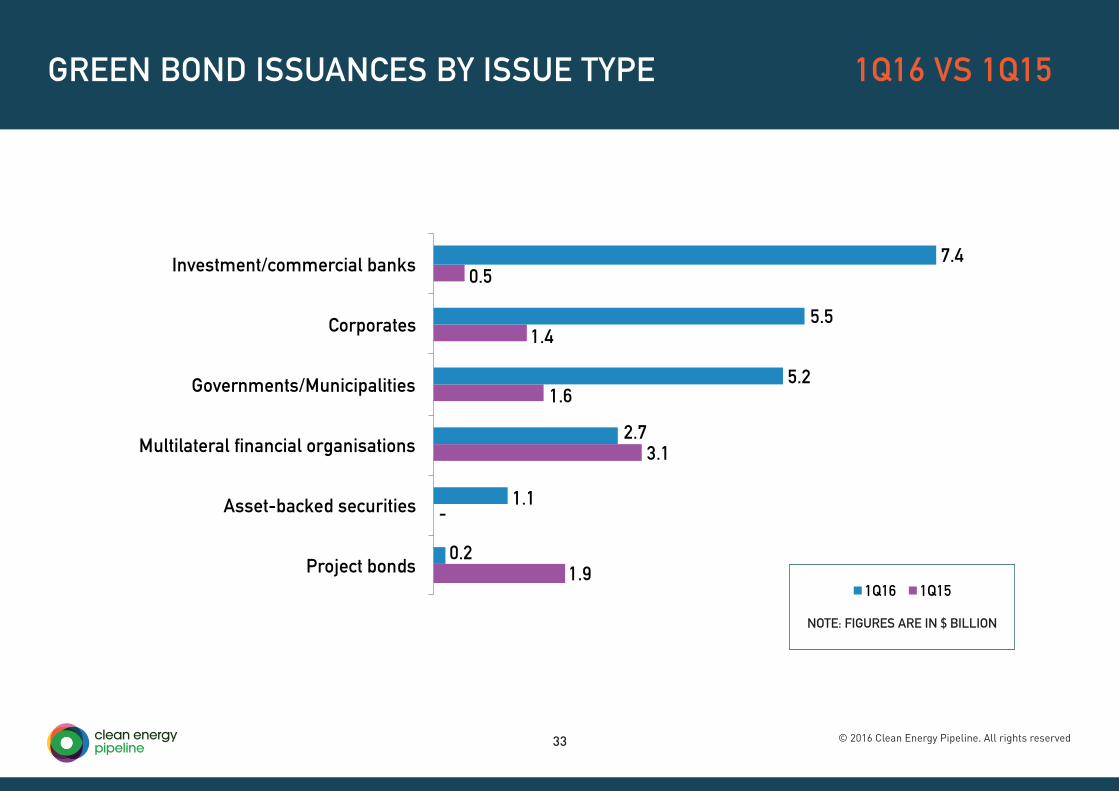
GREEN BOND ISSUANCES BY ISSUE TYPE 1Q16 VS 1Q15
NOTE: FIGURES ARE IN $ BILLION
33 © 2016 Clean Energy Pipeline. All rights reserved

TOP 10 GREEN BOND ISSUANCES 1Q16
ISSUER ISSUER COUNTRY
DATE DEAL SIZE ($M) ISSUER TYPE
Pudong Development Bank China Jan-16 3,000 Investment/commercial banks
Pudong Development Bank China Mar-16 2,300 Investment/commercial banks
State of North Rhine-Westphalia Germany Mar-16 1,750 Governments/Municipalities
Industrial Bank Co. Ltd China Jan-16 1,520 Investment/commercial banks
Apple Inc. USA Feb-16 1,500 Corporates
Nederlandse Waterschapsbank NV (NWB) Nether-lands
Mar-16 1,000 Governments/Municipalities
Metropolitan Transportation Authority (New York) USA Feb-16 783 Governments/Municipalities
European Investment Bank Luxem-bourg
Jan-16 712 Multilateral financial organisations
International Finance Corporation (IFC) USA Mar-16 700 Multilateral financial organisations
Nordex SE Germany Feb-16 622 Corporates
34 © 2016 Clean Energy Pipeline. All rights reserved

PUBLICMARKETS
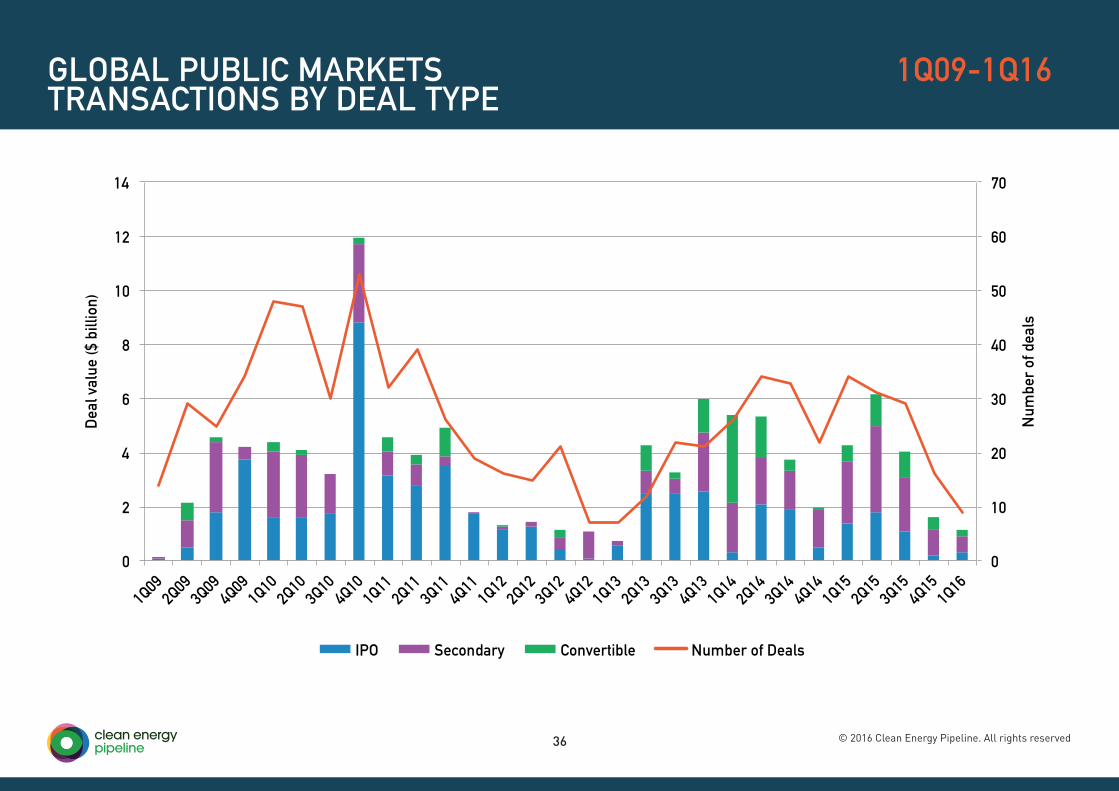
GLOBAL PUBLIC MARKETS TRANSACTIONS BY DEAL TYPE
1Q09-1Q16
36 © 2016 Clean Energy Pipeline. All rights reserved

GLOBAL PUBLIC MARKETS TRANSACTIONS BY REGION OF STOCK EXCHANGE
1Q09-1Q16
37 © 2016 Clean Energy Pipeline. All rights reserved

PUBLIC MARKETS TRANSACTIONS AS A PERCENTAGE OF DEAL VALUE
1Q16 VS 1Q15
1Q16 1Q15
SOLAR
WIND
ENERGY EFFICIENCY
OTHER
$1.1BILLION
$4.3BILLION
1%
47%
42%
46%
8%4%
52%
38 © 2016 Clean Energy Pipeline. All rights reserved
39 © 2016 Clean Energy Pipeline. All rights reserved
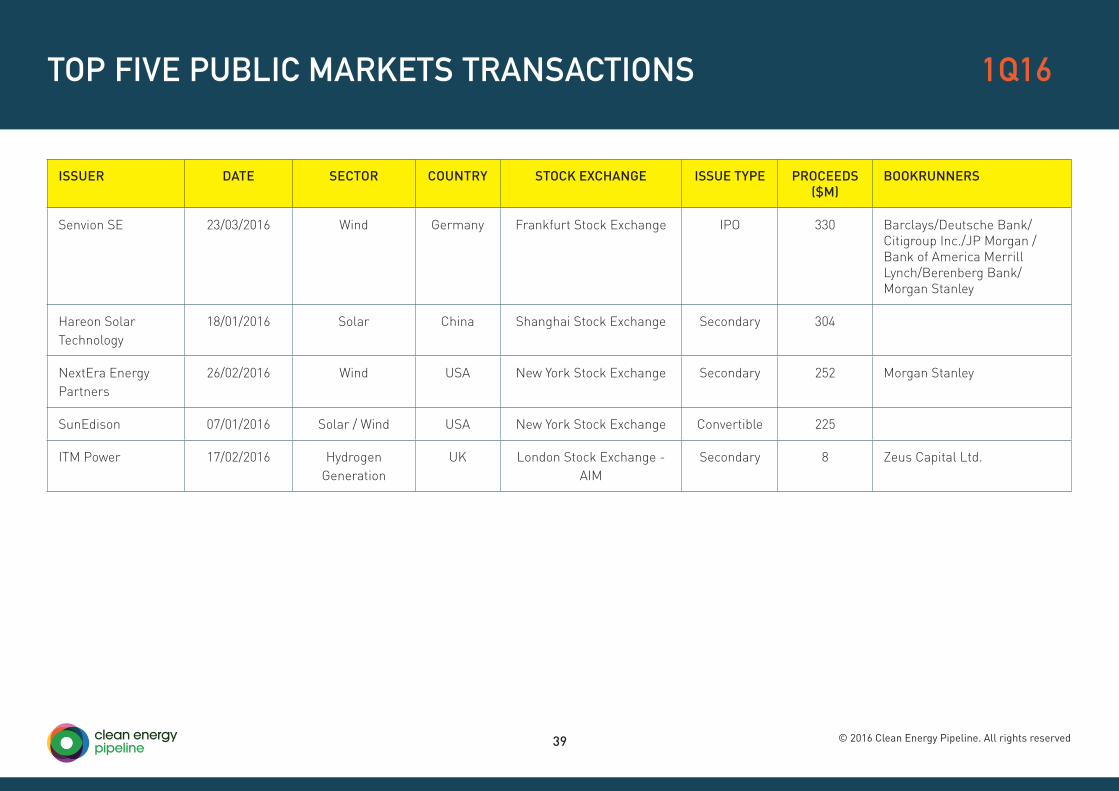
TOP FIVE PUBLIC MARKETS TRANSACTIONS 1Q16
ISSUER DATE SECTOR COUNTRY STOCK EXCHANGE ISSUE TYPE PROCEEDS ($M)
BOOKRUNNERS
Senvion SE 23/03/2016 Wind Germany Frankfurt Stock Exchange IPO 330 Barclays/Deutsche Bank/Citigroup Inc./JP Morgan /Bank of America Merrill Lynch/Berenberg Bank/Morgan Stanley
Hareon Solar Technology
18/01/2016 Solar China Shanghai Stock Exchange Secondary 304
NextEra Energy Partners
26/02/2016 Wind USA New York Stock Exchange Secondary 252 Morgan Stanley
SunEdison 07/01/2016 Solar / Wind USA New York Stock Exchange Convertible 225
ITM Power 17/02/2016 Hydrogen Generation
UK London Stock Exchange - AIM
Secondary 8 Zeus Capital Ltd.

PUBLIC MARKETS PERFORMANCE 1Q16-1Q16
40 © 2016 Clean Energy Pipeline. All rights reserved

www.cleanenergypipeline.com
ANALYTICS AND GRAPHS
GLOBAL CLEAN ENERGY REVIEW
1Q16
@CEpipeline
Clean Energy PipelineWells Point79 Wells StreetLondonW1T 3QN
+44 (0) 207 251 8000
www.cleanenergypipeline.com
Recommended