Medianmonthly
householdincome
Number ofhouseholds
(HK$) No.('000) (HK$)
Year-on-year
change No.('000)
Year-on-year
change (HK$)
Year-on-year
change No.('000)
Year-on-year
changeHouseholdsize1 14.12% -600 -1.3 13.79% -300 3.6 13.71%2 15,000 397.5 20.27% 15,000 0 406.5 9.0 20.34% 15,000 0 426.8 20.3 20.95%3 19,000 430.5 21.95% 18,200 -800 457.0 26.5 22.86% 19,000 800 471.3 14.3 23.14%4 20,000 502.2 25.60% 20,000 0 512.8 10.6 25.65% 20,000 0 523.0 10.2 25.68%5 22,000 237.8 12.12% 20,700 -1,300 232.9 -4.9 11.65% 21,200 500 229.7 -3.2 11.28%6 and above 26,700 116.6 5.94% 25,000 -1,700 114.2 -2.4 5.71% 24,500 -500 107.1 -7.1 5.26%Total 18,000 1961.5 100.00% 17,400 -600 1998.9 37.4 100.01% 18,000 600 2037.0 38.1 100.00%
(Note : Figures may not add up to the respective totals owing to rounding.)
% over thetotal no. ofhouseholdsof the same
year
% over thetotal no. ofhouseholdsof the same
year
% over thetotal no. ofhouseholdsof the same
year
Median monthlyhousehold income
Median monthlyhousehold incomeNumber of households
1999 20001998
7,600 276.9 7,000 275.6 6,700 279.2
Number of households
GENERAL HOUSEHOLD SURVEYTable 1 : Number of domestic households (excluding foreign domestic helpers) and median monthly household income of domestic households
(excluding income of foreign domestic helpers) by household size (excluding foreign domestic helpers), 1998-2004 & Q2 2005
Table 1 - Page 1
Householdsize123456 and aboveTotal
(HK$)
Year-on-year
change No.('000)
Year-on-year
change (HK$)
Year-on-year
change No.('000)
Year-on-year
change (HK$)
Year-on-year
change No.('000)
Year-on-year
change
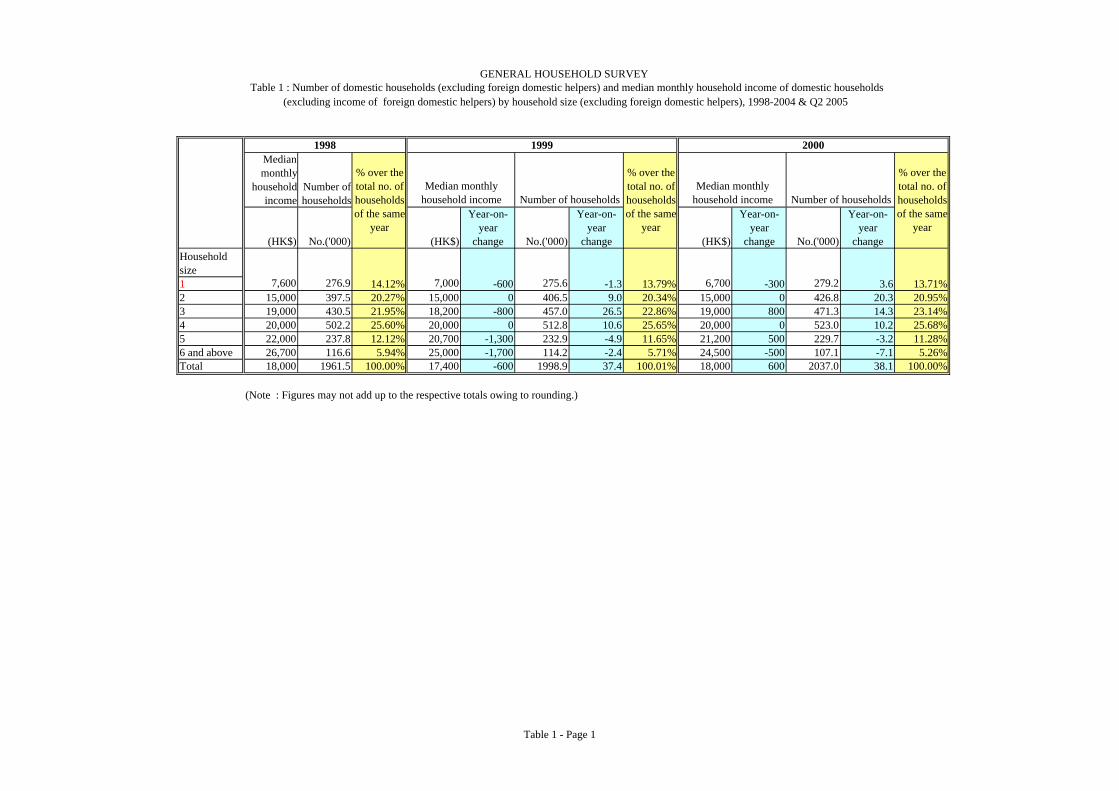
300 1.4 13.50% -1,000 25.4 14.34% 0 9.1 14.54%14,800 -200 448.3 21.5 21.57% 13,600 -1,200 477.8 29.5 22.40% 12,600 -1,000 496.1 18.3 22.89%19,000 0 489.7 18.4 23.56% 18,000 -1,000 505.0 15.3 23.67% 16,800 -1,200 523.5 18.5 24.15%20,000 0 536.6 13.6 25.82% 20,000 0 542.6 6.0 25.43% 19,000 -1,000 540.6 -2.0 24.94%22,000 800 222.0 -7.7 10.68% 20,500 -1,500 212.8 -9.2 9.97% 19,900 -600 206.0 -6.8 9.50%25,100 600 101.2 -5.9 4.87% 23,300 -1,800 89.3 -11.9 4.19% 22,300 -1,000 86.3 -3.0 3.98%18,000 0 2078.4 41.4 100.00% 16,400 -1,600 2133.5 55.1 100.00% 15,400 -1,000 2167.5 34.0 100.00%
(Note : Figures may not add up to the respective totals owing to rounding.)
% over thetotal no. ofhouseholdsof the same
year
Number of households
2002 20032001
306.0 6,000 315.1280.6
Median monthlyhousehold income
% over thetotal no. ofhouseholdsof the same
year
6,0007,000
% over thetotal no. ofhouseholdsof the same
year
Median monthlyhousehold income
Median monthlyhousehold incomeNumber of households Number of households
GENERAL HOUSEHOLD SURVEYTable 1 : Number of domestic households (excluding foreign domestic helpers) and median monthly household income of domestic households
(excluding income of foreign domestic helpers) by household size (excluding foreign domestic helpers), 1998-2004 & Q2 2005
Table 1 - Page 2
Householdsize123456 and aboveTotal
Comparedwith
1998(%)
(HK$)
Year-on-year
change No.('000)
Year-on-year
change (HK$)
Year-on-year
changeComparedwith 1998 No.('000)
Year-on-year
change
Comparedwith
1998('000)
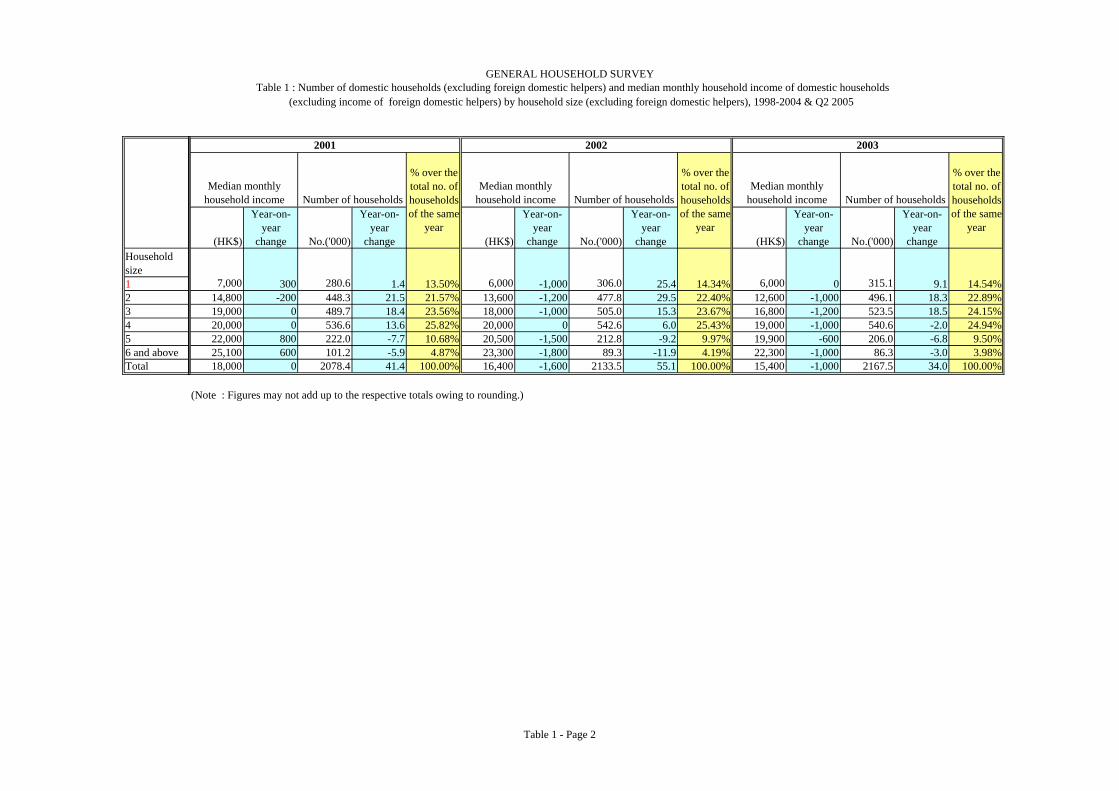
0 8.7 14.52% 0 -1,600 22.3 69.2 15.19% 1.08%12,400 -200 528.2 32.1 23.69% 13,000 600 -2,000 540.0 11.8 142.5 23.70% 3.44%17,100 300 549.5 26.0 24.64% 17,000 -100 -2,000 557.7 8.2 127.2 24.48% 2.53%19,000 0 546.7 6.1 24.52% 19,600 600 -400 553.3 6.6 51.1 24.29% -1.32%20,000 100 203.6 -2.4 9.13% 20,700 700 -1,300 202.7 -0.9 -35.1 8.90% -3.23%22,300 0 77.9 -8.4 3.49% 22,200 -100 -4,500 78.2 0.3 -38.4 3.43% -2.51%15,500 100 2229.7 62.2 100.00% 15,600 100 -2,400 2278.1 48.4 316.6 100.00%
(Note : Figures may not add up to the respective totals owing to rounding.)
Observations of Table 1
Point 1 : While the median monthly household income in most categories of households recorded a slight increase in the second quarter of 2005as compared to 2004, it is still below the 1998 level (e.g. the median monthly household income for a 4-person householdhas decreased from $20,000 in 1998 to $19,600 in the second quarter of 2005).
Point 2 : The median monthly household incomes for all household sizes were at their lowest between 2003 and 2004.
Point 3 : Despite the steady increase in population from 1998 to 2005, the size of household is reducing, i.e. 56.34% of households (1,104,900) in 1998has a household size of 1-3 persons whereas the percentage in the second quarter of 2005 is 63.37% (1,443,800).
% over thetotal no. ofhouseholdsof the same
year
Number of households
Q2 20052004
323.8 6,000
Number of households
% over thetotal no. ofhouseholdsof the same
year
346.1
Median monthlyhousehold income Median monthly household income
6,000
GENERAL HOUSEHOLD SURVEYTable 1 : Number of domestic households (excluding foreign domestic helpers) and median monthly household income of domestic households
(excluding income of foreign domestic helpers) by household size (excluding foreign domestic helpers), 1998-2004 & Q2 2005
Table 1 - Page 3
Male Female Male Female
Number ofemployedpersons
Number ofemployedpersons
Number ofemployedpersons
Number ofemployedpersons
Number ofemployedpersons
Number ofemployedpersons
Year-on-yearchange
('000) ('000) ('000) -- ('000) ('000) ('000) ('000) --Age
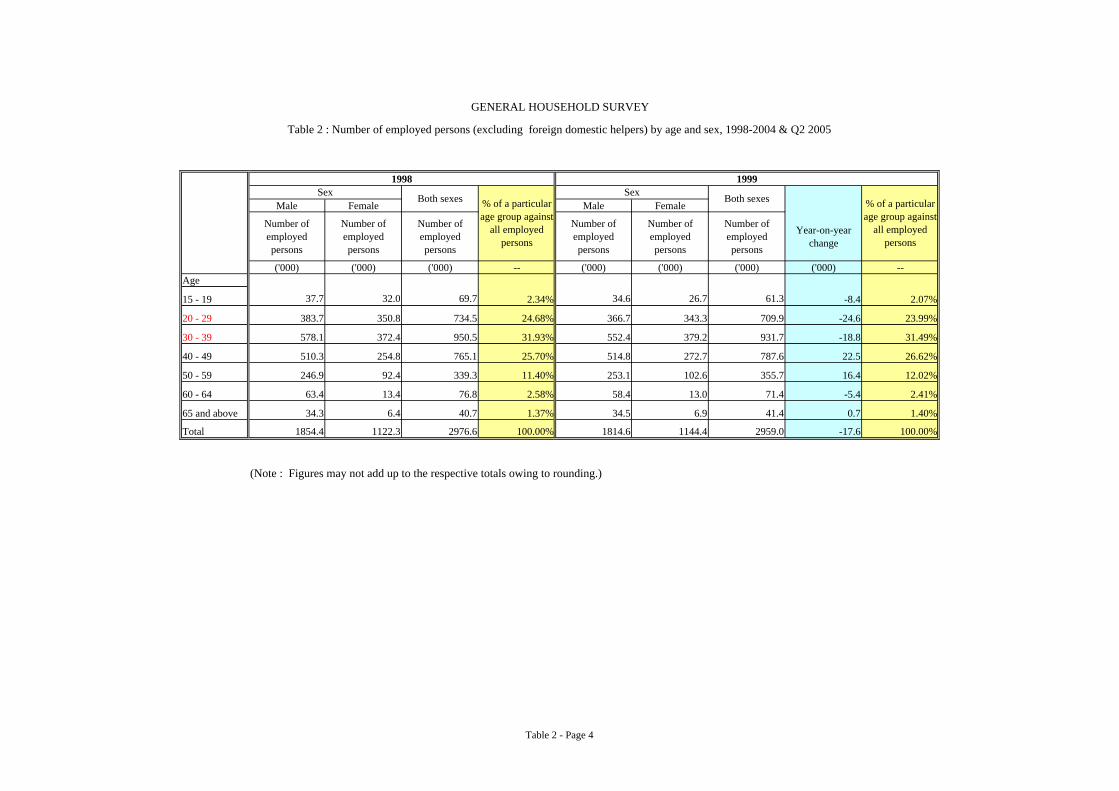
15 - 19 2.34% -8.4 2.07%
20 - 29 383.7 350.8 734.5 24.68% 366.7 343.3 709.9 -24.6 23.99%
30 - 39 578.1 372.4 950.5 31.93% 552.4 379.2 931.7 -18.8 31.49%
40 - 49 510.3 254.8 765.1 25.70% 514.8 272.7 787.6 22.5 26.62%
50 - 59 246.9 92.4 339.3 11.40% 253.1 102.6 355.7 16.4 12.02%
60 - 64 63.4 13.4 76.8 2.58% 58.4 13.0 71.4 -5.4 2.41%
65 and above 34.3 6.4 40.7 1.37% 34.5 6.9 41.4 0.7 1.40%
Total 1854.4 1122.3 2976.6 100.00% 1814.6 1144.4 2959.0 -17.6 100.00%
(Note : Figures may not add up to the respective totals owing to rounding.)
Table 2 : Number of employed persons (excluding foreign domestic helpers) by age and sex, 1998-2004 & Q2 2005
GENERAL HOUSEHOLD SURVEY
1998 1999
26.7 61.337.7 32.0 69.7 34.6
Both sexes % of a particularage group against
all employedpersons
Sex Both sexes Sex% of a particularage group against
all employedpersons
Table 2 - Page 4

Age
15 - 19
20 - 29
30 - 39
40 - 49
50 - 59
60 - 64
65 and above
Total
Male Female Male Female
Number ofemployedpersons
Number ofemployedpersons
Number ofemployedpersons
Year-on-yearchange
Number ofemployedpersons
Number ofemployedpersons
Number ofemployedpersons
Year-on-yearchange
('000) ('000) ('000) ('000) -- ('000) ('000) ('000) ('000) --
-3.6 1.90% -4.1 1.75%
373.1 347.8 720.9 11.0 23.70% 359.1 328.9 688.0 -32.9 22.45%
544.6 390.0 934.6 2.9 30.73% 524.4 401.9 926.3 -8.3 30.22%
535.9 290.9 826.8 39.2 27.18% 548.2 317.5 865.7 38.9 28.24%
273.4 115.8 389.2 33.5 12.80% 290.2 129.3 419.6 30.4 13.69%
57.5 13.2 70.7 -0.7 2.32% 59.1 11.6 70.7 0.0 2.31%
35.4 6.3 41.7 0.3 1.37% 34.0 7.3 41.4 -0.3 1.35%
1852.2 1189.5 3041.7 82.7 100.00% 1844.3 1220.9 3065.2 23.5 100.00%
(Note : Figures may not add up to the respective totals owing to rounding.)
GENERAL HOUSEHOLD SURVEY
Table 2 : Number of employed persons (excluding foreign domestic helpers) by age and sex, 1998-2004 & Q2 2005
2000 2001
57.7 29.3 24.3 53.632.2 25.5
Sex Both sexes Sex Both sexes% of a particularage group against
all employedpersons
% of a particularage group against
all employedpersons
Table 2 - Page 5
Age
15 - 19
20 - 29
30 - 39
40 - 49
50 - 59
60 - 64
65 and above
Total
Male Female Male Female
Number ofemployedpersons
Number ofemployedpersons
Number ofemployedpersons
Year-on-yearchange
Number ofemployedpersons
Number ofemployedpersons
Number ofemployedpersons
Year-on-yearchange
('000) ('000) ('000) ('000) -- ('000) ('000) ('000) ('000) --
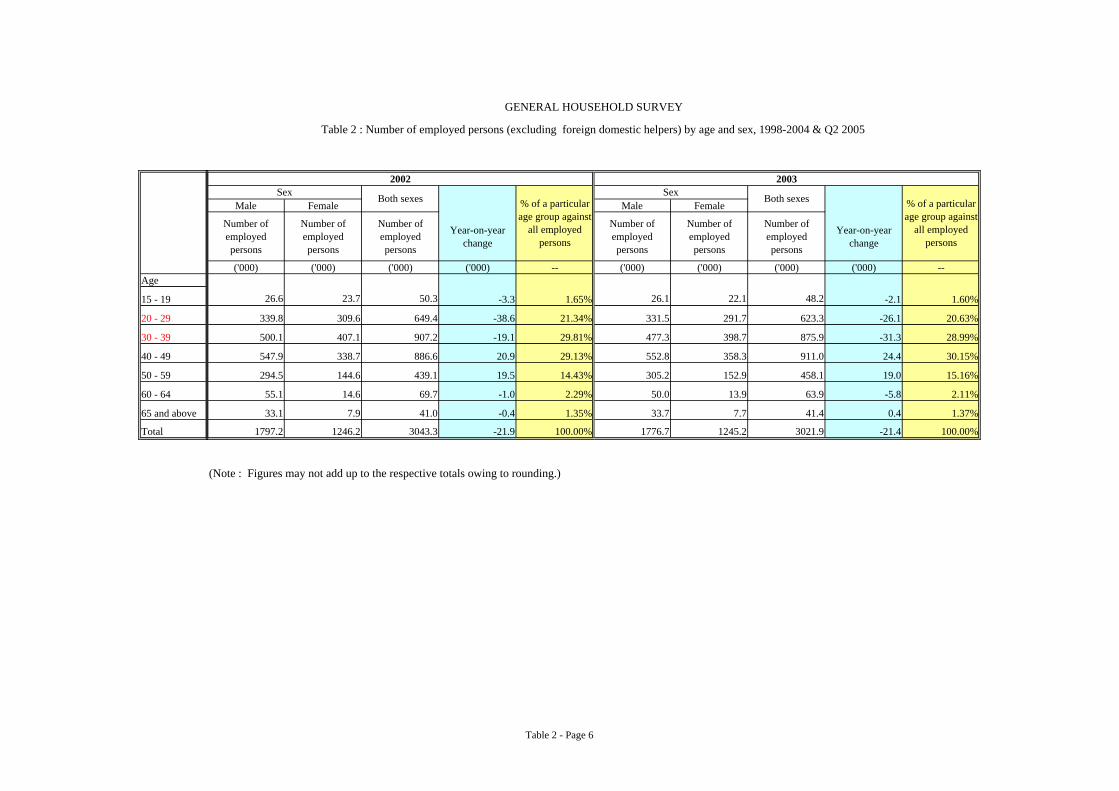
-3.3 1.65% -2.1 1.60%
339.8 309.6 649.4 -38.6 21.34% 331.5 291.7 623.3 -26.1 20.63%
500.1 407.1 907.2 -19.1 29.81% 477.3 398.7 875.9 -31.3 28.99%
547.9 338.7 886.6 20.9 29.13% 552.8 358.3 911.0 24.4 30.15%
294.5 144.6 439.1 19.5 14.43% 305.2 152.9 458.1 19.0 15.16%
55.1 14.6 69.7 -1.0 2.29% 50.0 13.9 63.9 -5.8 2.11%
33.1 7.9 41.0 -0.4 1.35% 33.7 7.7 41.4 0.4 1.37%
1797.2 1246.2 3043.3 -21.9 100.00% 1776.7 1245.2 3021.9 -21.4 100.00%
(Note : Figures may not add up to the respective totals owing to rounding.)
GENERAL HOUSEHOLD SURVEY
Table 2 : Number of employed persons (excluding foreign domestic helpers) by age and sex, 1998-2004 & Q2 2005
26.1
Both sexes
22.1 48.226.6 23.7 50.3
% of a particularage group against
all employedpersons
Sex2002 2003
% of a particularage group against
all employedpersons
Both sexes Sex
Table 2 - Page 6
Age
15 - 19
20 - 29
30 - 39
40 - 49
50 - 59
60 - 64
65 and above
Total
Male Female Male Female
Number ofemployedpersons
Number ofemployedpersons
Number ofemployedpersons
Year-on-yearchange
Number ofemployedpersons
Number ofemployedpersons
Number ofemployedpersons
Year-on-yearchange Compared with
1998('000) ('000) ('000) ('000) -- ('000) ('000) ('000) ('000) ('000) -- --
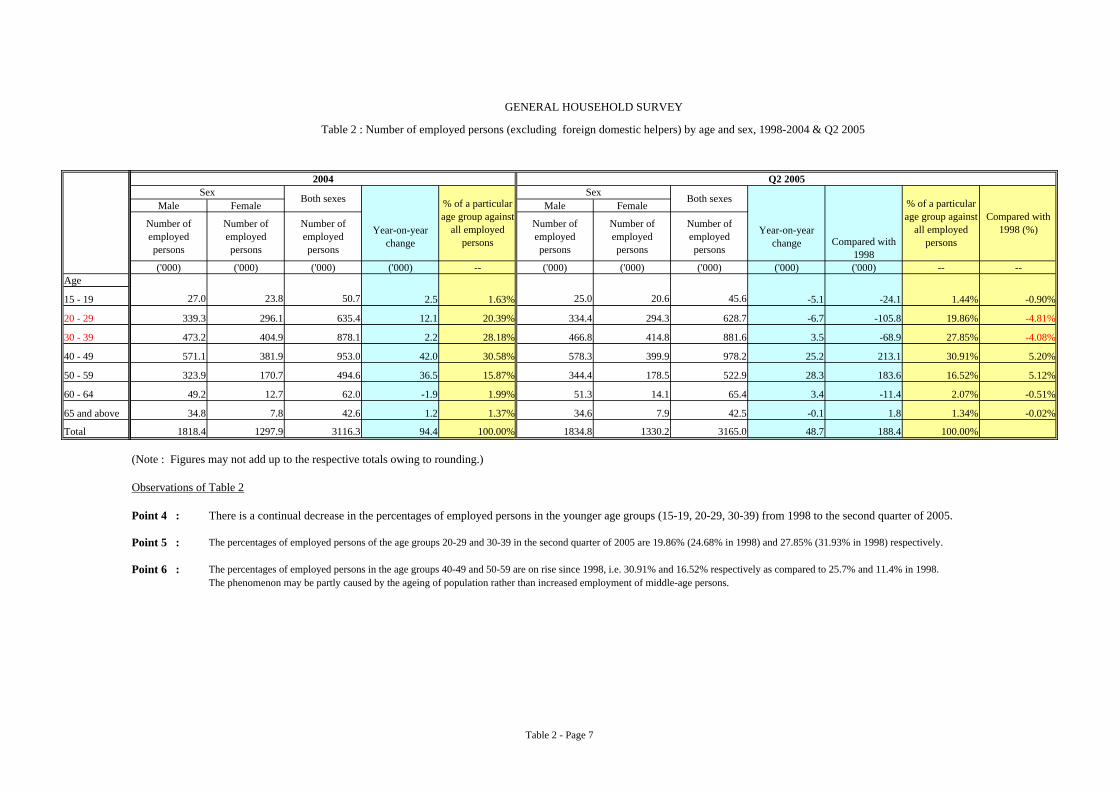
2.5 1.63% -5.1 -24.1 1.44% -0.90%
339.3 296.1 635.4 12.1 20.39% 334.4 294.3 628.7 -6.7 -105.8 19.86% -4.81%
473.2 404.9 878.1 2.2 28.18% 466.8 414.8 881.6 3.5 -68.9 27.85% -4.08%
571.1 381.9 953.0 42.0 30.58% 578.3 399.9 978.2 25.2 213.1 30.91% 5.20%
323.9 170.7 494.6 36.5 15.87% 344.4 178.5 522.9 28.3 183.6 16.52% 5.12%
49.2 12.7 62.0 -1.9 1.99% 51.3 14.1 65.4 3.4 -11.4 2.07% -0.51%
34.8 7.8 42.6 1.2 1.37% 34.6 7.9 42.5 -0.1 1.8 1.34% -0.02%
1818.4 1297.9 3116.3 94.4 100.00% 1834.8 1330.2 3165.0 48.7 188.4 100.00%
(Note : Figures may not add up to the respective totals owing to rounding.)
Observations of Table 2
Point 4 : There is a continual decrease in the percentages of employed persons in the younger age groups (15-19, 20-29, 30-39) from 1998 to the second quarter of 2005.
Point 5 : The percentages of employed persons of the age groups 20-29 and 30-39 in the second quarter of 2005 are 19.86% (24.68% in 1998) and 27.85% (31.93% in 1998) respectively.
Point 6 : The percentages of employed persons in the age groups 40-49 and 50-59 are on rise since 1998, i.e. 30.91% and 16.52% respectively as compared to 25.7% and 11.4% in 1998.The phenomenon may be partly caused by the ageing of population rather than increased employment of middle-age persons.
GENERAL HOUSEHOLD SURVEY
Table 2 : Number of employed persons (excluding foreign domestic helpers) by age and sex, 1998-2004 & Q2 2005
% of a particularage group against
all employedpersons
% of a particularage group against
all employedpersons
Compared with1998 (%)
Q2 2005Sex Both sexes
25.0 20.6 45.6
Sex
50.727.0 23.8
2004
Both sexes
Table 2 - Page 7
1998Number of
employed personsNumber of
employed personsYear-on-year
changeNumber of
employed personsYear-on-year
changeNumber of
employed personsYear-on-year
changeNumber of
employed personsYear-on-year
change('000) ('000) ('000) ('000) ('000) ('000) ('000) ('000) ('000)
Occupation
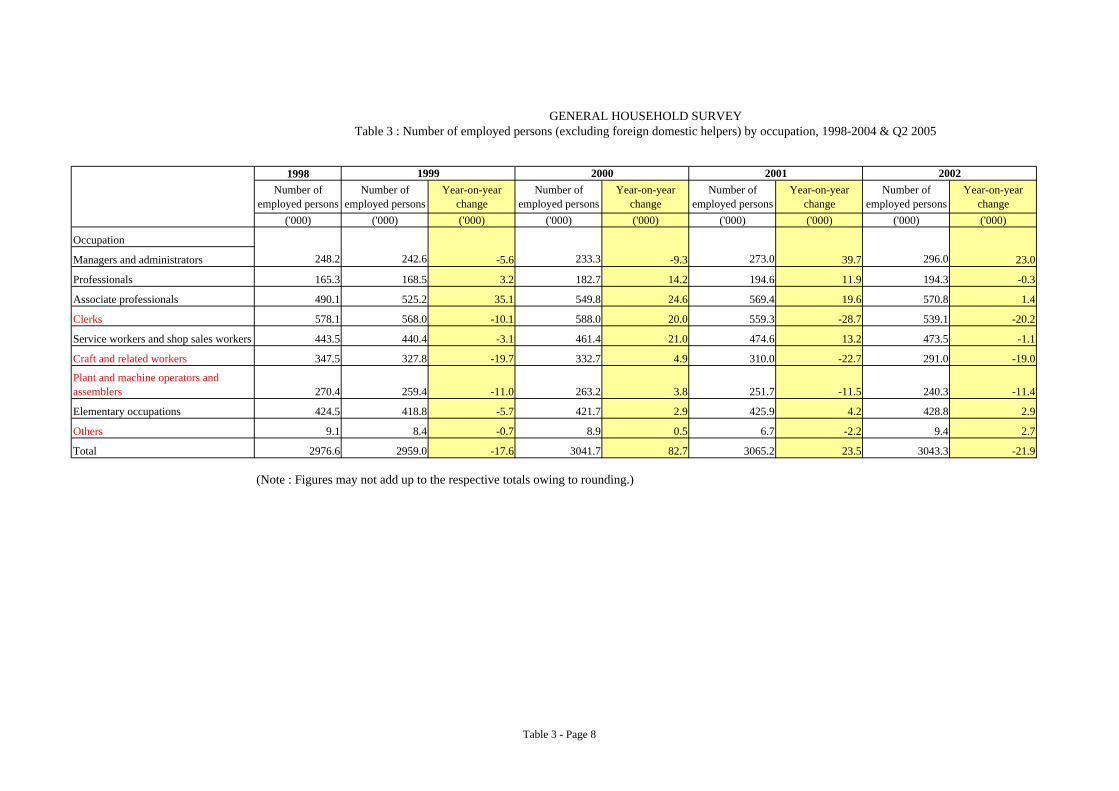
Managers and administrators -5.6 -9.3 39.7 23.0
Professionals 165.3 168.5 3.2 182.7 14.2 194.6 11.9 194.3 -0.3
Associate professionals 490.1 525.2 35.1 549.8 24.6 569.4 19.6 570.8 1.4
Clerks 578.1 568.0 -10.1 588.0 20.0 559.3 -28.7 539.1 -20.2
Service workers and shop sales workers 443.5 440.4 -3.1 461.4 21.0 474.6 13.2 473.5 -1.1
Craft and related workers 347.5 327.8 -19.7 332.7 4.9 310.0 -22.7 291.0 -19.0
Plant and machine operators andassemblers 270.4 259.4 -11.0 263.2 3.8 251.7 -11.5 240.3 -11.4
Elementary occupations 424.5 418.8 -5.7 421.7 2.9 425.9 4.2 428.8 2.9
Others 9.1 8.4 -0.7 8.9 0.5 6.7 -2.2 9.4 2.7
Total 2976.6 2959.0 -17.6 3041.7 82.7 3065.2 23.5 3043.3 -21.9
(Note : Figures may not add up to the respective totals owing to rounding.)
296.0248.2 242.6 233.3 273.0
1999
GENERAL HOUSEHOLD SURVEYTable 3 : Number of employed persons (excluding foreign domestic helpers) by occupation, 1998-2004 & Q2 2005
2000 2001 2002
Table 3 - Page 8
Occupation
Managers and administrators
Professionals
Associate professionals
Clerks
Service workers and shop sales workers
Craft and related workers
Plant and machine operators andassemblers
Elementary occupations
Others
Total
Number ofemployed persons
Year-on-yearchange
Number ofemployed persons
Year-on-yearchange
Number ofemployed persons
Year-on-yearchange
Compared with1998
('000) ('000) ('000) ('000) ('000) ('000) ('000)
-25.3 9.4 22.4 54.3
201.3 7.0 209.6 8.3 220.9 11.3 55.6
584.3 13.5 610.2 25.9 625.6 15.4 135.5
529.3 -9.8 546.2 16.9 551.4 5.2 -26.7
486.6 13.1 516.3 29.7 532.2 15.9 88.7
275.0 -16.0 272.8 -2.2 271.3 -1.5 -76.2
237.8 -2.5 238.9 1.1 226.7 -12.2 -43.7
429.5 0.7 433.9 4.4 427.1 -6.8 2.6
7.4 -2.0 8.4 1.0 7.3 -1.1 -1.8
3021.9 -21.4 3116.3 94.4 3165.0 48.7 188.4
(Note : Figures may not add up to the respective totals owing to rounding.)
Observations of Table 3
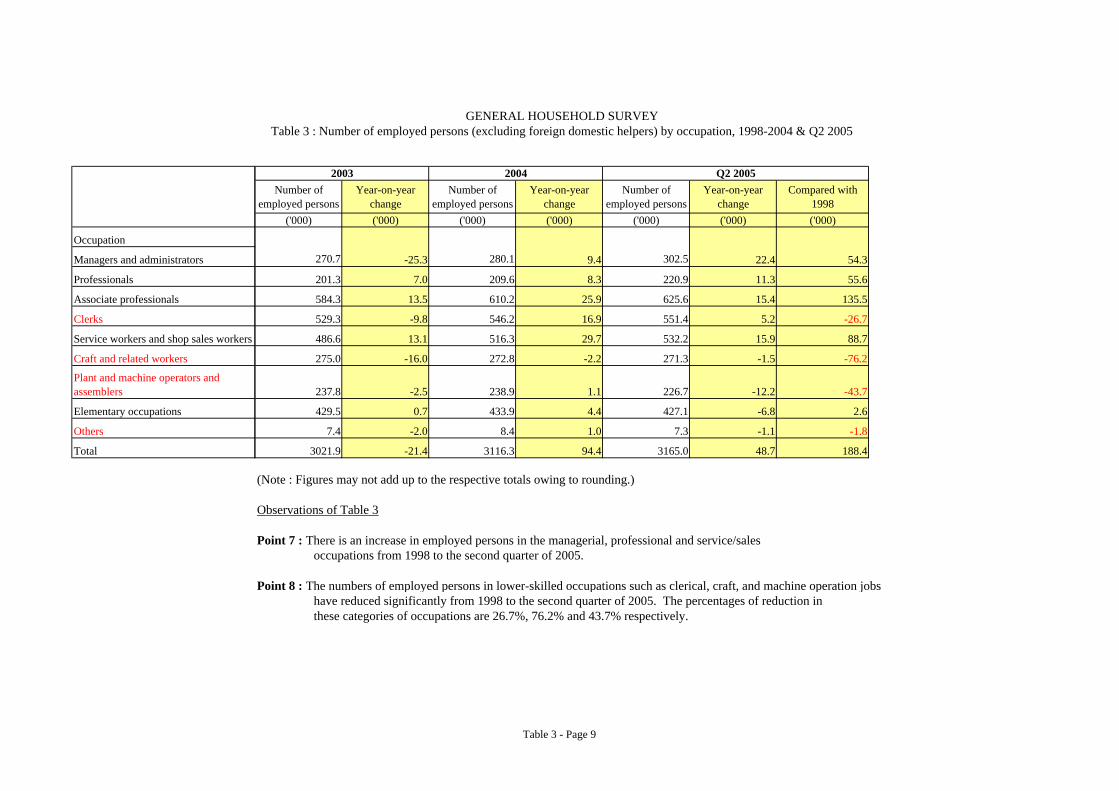
Point 7 : There is an increase in employed persons in the managerial, professional and service/sales occupations from 1998 to the second quarter of 2005.
Point 8 : The numbers of employed persons in lower-skilled occupations such as clerical, craft, and machine operation jobs have reduced significantly from 1998 to the second quarter of 2005. The percentages of reduction in these categories of occupations are 26.7%, 76.2% and 43.7% respectively.
302.5270.7 280.1
2004 Q2 2005
GENERAL HOUSEHOLD SURVEYTable 3 : Number of employed persons (excluding foreign domestic helpers) by occupation, 1998-2004 & Q2 2005
2003
Table 3 - Page 9
1998Number ofemployedpersons
Number ofemployedpersons
Year-on-yearchange
Number ofemployedpersons
Year-on-yearchange
Number ofemployedpersons
Year-on-yearchange
Number ofemployedpersons
Year-on-yearchange
Number ofemployedpersons
Year-on-yearchange
('000) ('000) ('000) ('000) ('000) ('000) ('000) ('000) ('000) ('000) ('000)Monthly employment earnings (HK$)< 5,000 41.4 -6.7 23.4 62.6 55.65,000 - 9,999 1011.6 986.2 -25.4 987.3 1.1 971.0 -16.3 1012.2 41.2 1044.0 31.810,000 - 19,999 1123.5 1080.7 -42.8 1120.9 40.2 1105.8 -15.1 1009.0 -96.8 928.5 -80.520,000 and over 661.8 671.0 9.2 718.9 47.9 750.5 31.6 721.7 -28.8 693.3 -28.4Total 2976.6 2959.0 -17.6 3041.7 82.7 3065.2 23.5 3043.3 -21.9 3021.9 -21.4
(Note : Figures may not add up to the respective totals owing to rounding.)
237.9 300.5 356.1179.8 221.2
200120001999
214.5
20032002
GENERAL HOUSEHOLD SURVEYTable 4 : Number of employed persons (excluding foreign domestic helpers) by monthly employment earnings, 1998-2004 & Q2 2005
Table 4 - Page 10
Monthly employment earnings (HK$)< 5,0005,000 - 9,99910,000 - 19,99920,000 and overTotal
Number ofemployedpersons
Year-on-yearchange
Number ofemployedpersons
Year-on-yearchange
Compared with1998 Compared with 1998 (%)
('000) ('000) ('000) ('000) ('000)
18.6 -21.8 173.1 196.27%1108.6 64.6 1136.1 27.5 124.5 112.31%934.3 5.8 991.7 57.4 -131.8 88.27%698.8 5.5 684.2 -14.6 22.4 103.38%
3116.3 94.4 3165.0 48.7 188.4
(Note : Figures may not add up to the respective totals owing to rounding.)
Observations of Table 4
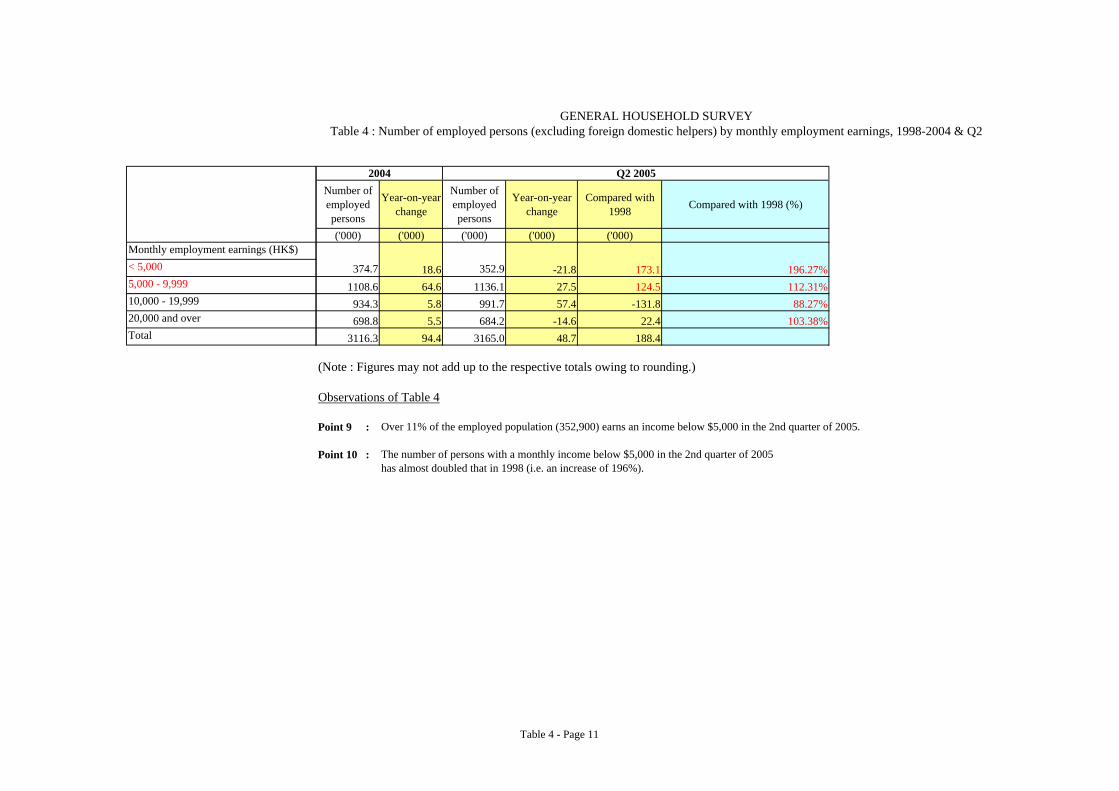
Point 9 : Over 11% of the employed population (352,900) earns an income below $5,000 in the 2nd quarter of 2005.
Point 10 : The number of persons with a monthly income below $5,000 in the 2nd quarter of 2005 has almost doubled that in 1998 (i.e. an increase of 196%).
352.9
2004 Q2 2005
374.7
GENERAL HOUSEHOLD SURVEYTable 4 : Number of employed persons (excluding foreign domestic helpers) by monthly employment earnings, 1998-2004 & Q2
Table 4 - Page 11
1998
(HK$) (HK$)
Year-on-year
change(HK$)
(HK$)
Year-on-year
change(HK$)
(HK$)
Year-on-year
change(HK$)
(HK$)
Year-on-year
change(HK$)
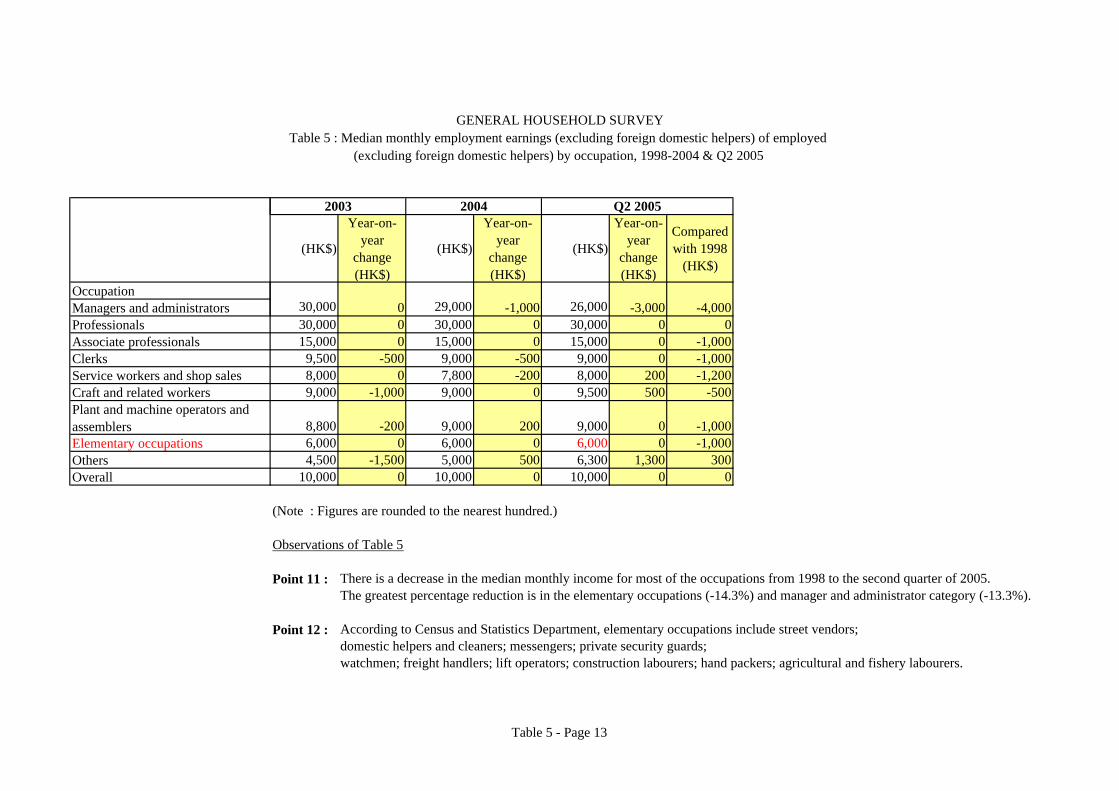
OccupationManagers and administrators -800 800 0 0Professionals 30,000 30,000 0 30,000 0 30,000 0 30,000 0Associate professionals 16,000 15,000 -1,000 16,000 1,000 16,000 0 15,000 -1,000Clerks 10,000 10,000 0 10,000 0 10,000 0 10,000 0Service workers and shop sales 9,200 9,000 -200 9,000 0 9,000 0 8,000 -1,000Craft and related workers 10,000 10,000 0 10,000 0 10,000 0 10,000 0Plant and machine operators andassemblers 10,000 9,800 -200 10,000 200 10,000 0 9,000 -1,000Elementary occupations 7,000 7,000 0 6,800 -200 6,500 -300 6,000 -500Others 6,000 7,000 1,000 6,000 -1,000 6,000 0 6,000 0Overall 10,000 10,000 0 10,000 0 11,000 1,000 10,000 -1,000
(Note : Figures are rounded to the nearest hundred.)
GENERAL HOUSEHOLD SURVEYTable 5 : Median monthly employment earnings (excluding foreign domestic helpers) of employed persons
(excluding foreign domestic helpers) by occupation, 1998-2004 & Q2 2005
30,000 29,200 30,000 30,000 30,000
1999 2000 2001 2002
Table 5 - Page 12
OccupationManagers and administratorsProfessionalsAssociate professionalsClerksService workers and shop salesCraft and related workersPlant and machine operators andassemblersElementary occupationsOthersOverall
(HK$)
Year-on-year
change(HK$)
(HK$)
Year-on-year
change(HK$)
(HK$)
Year-on-year
change(HK$)
Comparedwith 1998
(HK$)
0 -1,000 -3,000 -4,00030,000 0 30,000 0 30,000 0 015,000 0 15,000 0 15,000 0 -1,000
9,500 -500 9,000 -500 9,000 0 -1,0008,000 0 7,800 -200 8,000 200 -1,2009,000 -1,000 9,000 0 9,500 500 -500
8,800 -200 9,000 200 9,000 0 -1,0006,000 0 6,000 0 6,000 0 -1,0004,500 -1,500 5,000 500 6,300 1,300 300
10,000 0 10,000 0 10,000 0 0
(Note : Figures are rounded to the nearest hundred.)
Observations of Table 5
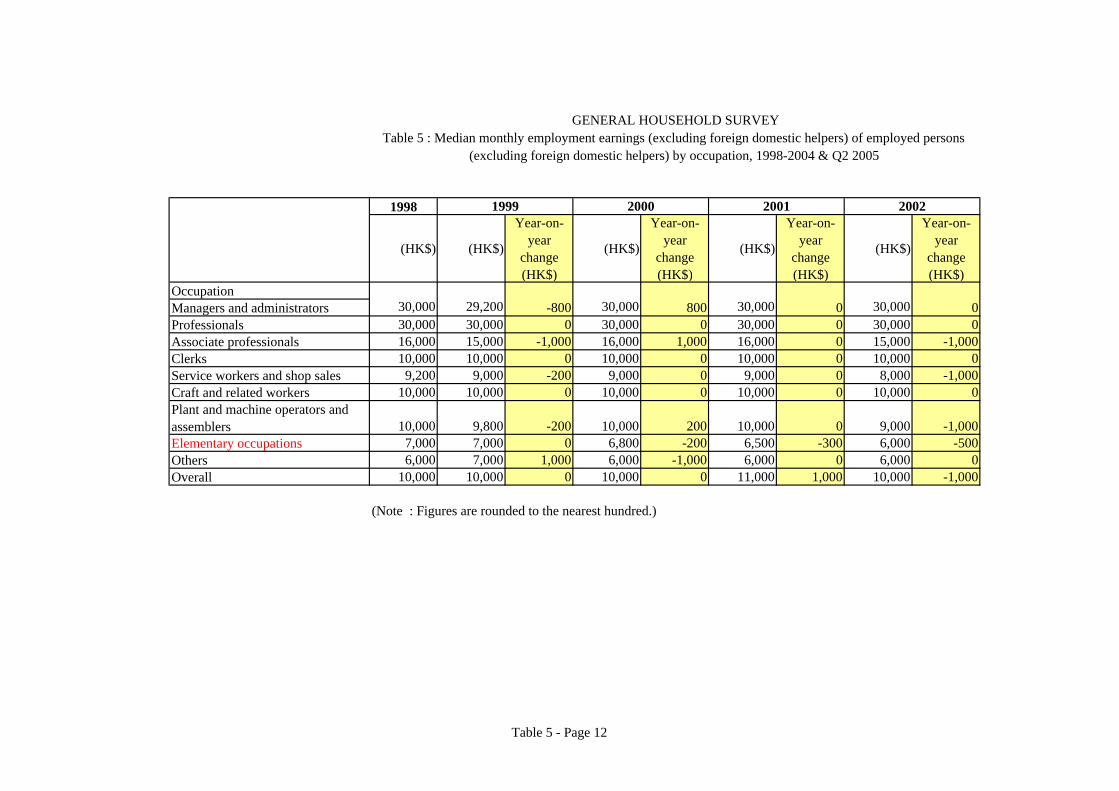
Point 11 : There is a decrease in the median monthly income for most of the occupations from 1998 to the second quarter of 2005. The greatest percentage reduction is in the elementary occupations (-14.3%) and manager and administrator category (-13.3%).
Point 12 : According to Census and Statistics Department, elementary occupations include street vendors; domestic helpers and cleaners; messengers; private security guards; watchmen; freight handlers; lift operators; construction labourers; hand packers; agricultural and fishery labourers.
GENERAL HOUSEHOLD SURVEYTable 5 : Median monthly employment earnings (excluding foreign domestic helpers) of employed
(excluding foreign domestic helpers) by occupation, 1998-2004 & Q2 2005
26,00030,000 29,000
2004 Q2 20052003
Table 5 - Page 13
Male Female Male FemaleNumber of
underemployedpersons
Number ofunderemployed
persons
Number ofunderemployed
persons
No. ofunderemployed
persons
No. ofunderemployed
persons
No. ofunderemployed
persons
Year-on-yearchange
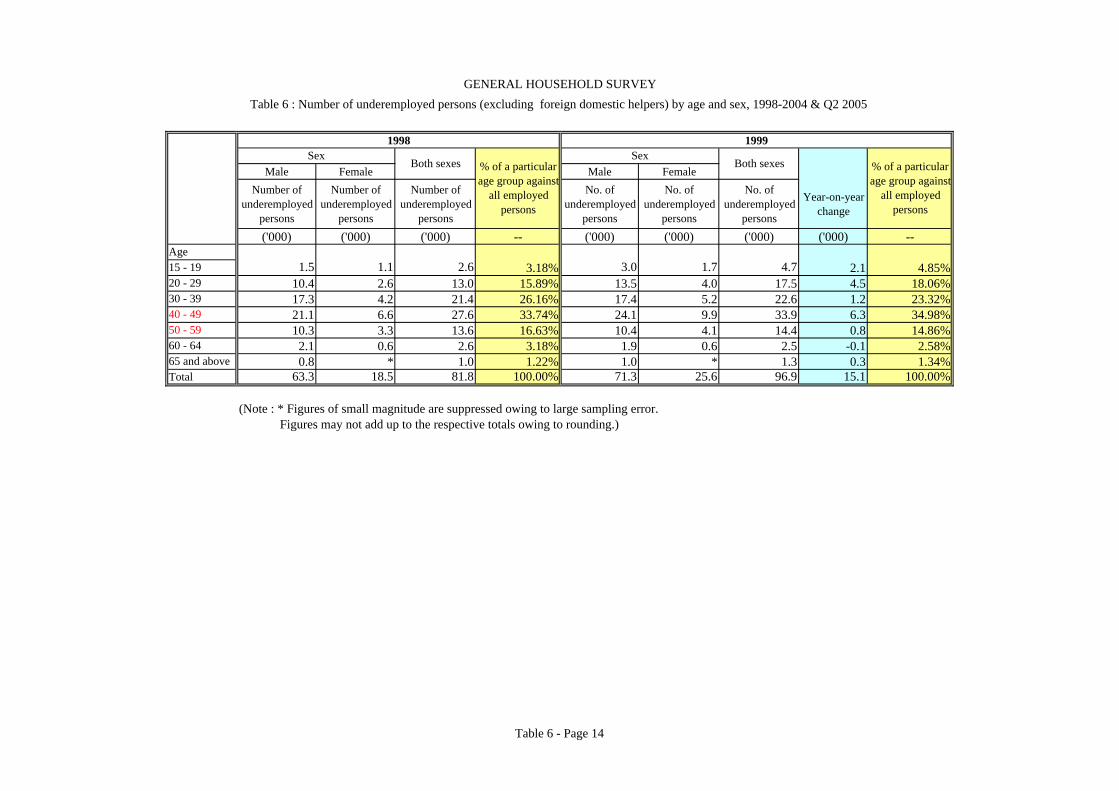
('000) ('000) ('000) -- ('000) ('000) ('000) ('000) --Age15 - 19 3.18% 2.1 4.85%20 - 29 10.4 2.6 13.0 15.89% 13.5 4.0 17.5 4.5 18.06%30 - 39 17.3 4.2 21.4 26.16% 17.4 5.2 22.6 1.2 23.32%40 - 49 21.1 6.6 27.6 33.74% 24.1 9.9 33.9 6.3 34.98%50 - 59 10.3 3.3 13.6 16.63% 10.4 4.1 14.4 0.8 14.86%60 - 64 2.1 0.6 2.6 3.18% 1.9 0.6 2.5 -0.1 2.58%65 and above 0.8 * 1.0 1.22% 1.0 * 1.3 0.3 1.34%Total 63.3 18.5 81.8 100.00% 71.3 25.6 96.9 15.1 100.00%
(Note : * Figures of small magnitude are suppressed owing to large sampling error. Figures may not add up to the respective totals owing to rounding.)
SexBoth sexes
Sex1998 1999
% of a particularage group against
all employedpersons
% of a particularage group against
all employedpersons
2.6 3.0 1.7 4.71.5 1.1
Both sexes
GENERAL HOUSEHOLD SURVEYTable 6 : Number of underemployed persons (excluding foreign domestic helpers) by age and sex, 1998-2004 & Q2 2005
Table 6 - Page 14
Age15 - 1920 - 2930 - 3940 - 4950 - 5960 - 6465 and aboveTotal
Male Female Male FemaleNo. of
underemployedpersons
No. ofunderemployed
persons
No. ofunderemployed
persons
Year-on-yearchange
No. ofunderemployed
persons
No. ofunderemployed
persons
No. ofunderemployed
persons
Year-on-yearchange
('000) ('000) ('000) ('000) -- ('000) ('000) ('000) ('000) --
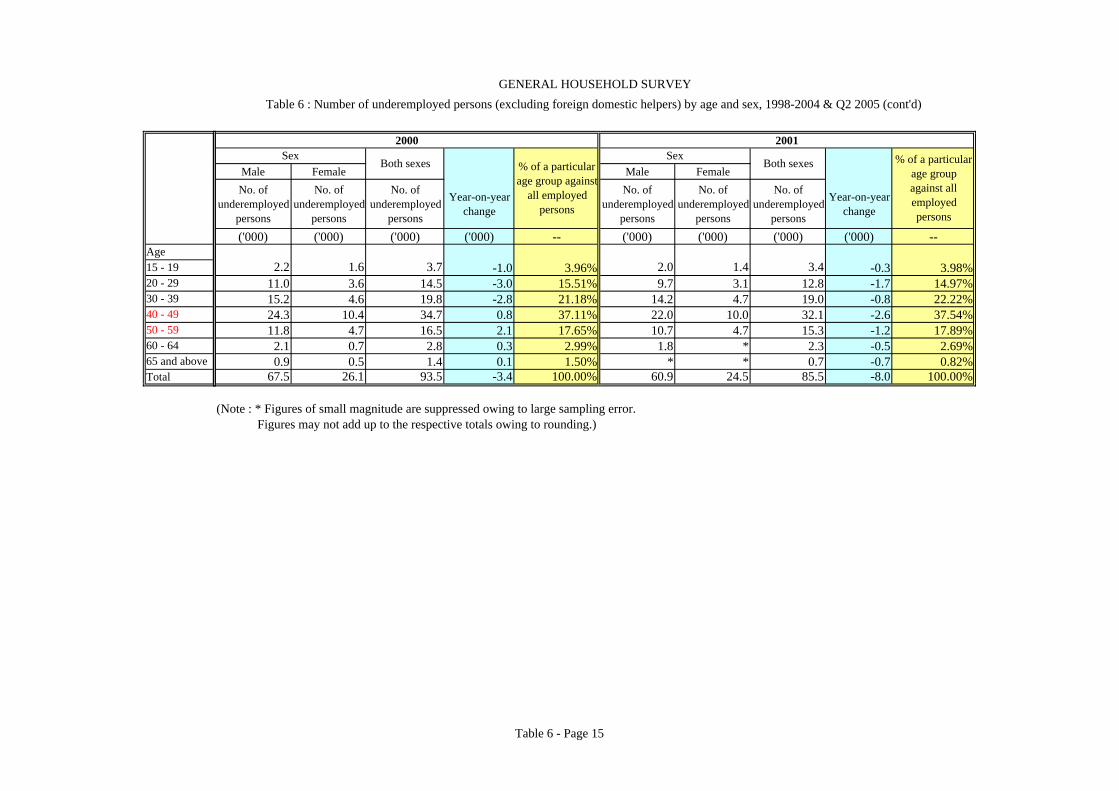
-1.0 3.96% -0.3 3.98%11.0 3.6 14.5 -3.0 15.51% 9.7 3.1 12.8 -1.7 14.97%15.2 4.6 19.8 -2.8 21.18% 14.2 4.7 19.0 -0.8 22.22%24.3 10.4 34.7 0.8 37.11% 22.0 10.0 32.1 -2.6 37.54%11.8 4.7 16.5 2.1 17.65% 10.7 4.7 15.3 -1.2 17.89%
2.1 0.7 2.8 0.3 2.99% 1.8 * 2.3 -0.5 2.69%0.9 0.5 1.4 0.1 1.50% * * 0.7 -0.7 0.82%
67.5 26.1 93.5 -3.4 100.00% 60.9 24.5 85.5 -8.0 100.00%
(Note : * Figures of small magnitude are suppressed owing to large sampling error. Figures may not add up to the respective totals owing to rounding.)
3.7 2.0 1.4 3.4
SexBoth sexes
SexBoth sexes
2.2 1.6
2000 2001
% of a particularage group against
all employedpersons
% of a particularage groupagainst allemployedpersons
GENERAL HOUSEHOLD SURVEYTable 6 : Number of underemployed persons (excluding foreign domestic helpers) by age and sex, 1998-2004 & Q2 2005 (cont'd)
Table 6 - Page 15
Age15 - 1920 - 2930 - 3940 - 4950 - 5960 - 6465 and aboveTotal
Male Female Male FemaleNo. of
underemployedpersons
No. ofunderemployed
persons
No. ofunderemployed
persons
Year-on-yearchange
No. ofunderemployed
persons
No. ofunderemployed
persons
No. ofunderemployed
persons
Year-on-yearchange
('000) ('000) ('000) ('000) -- ('000) ('000) ('000) ('000) --
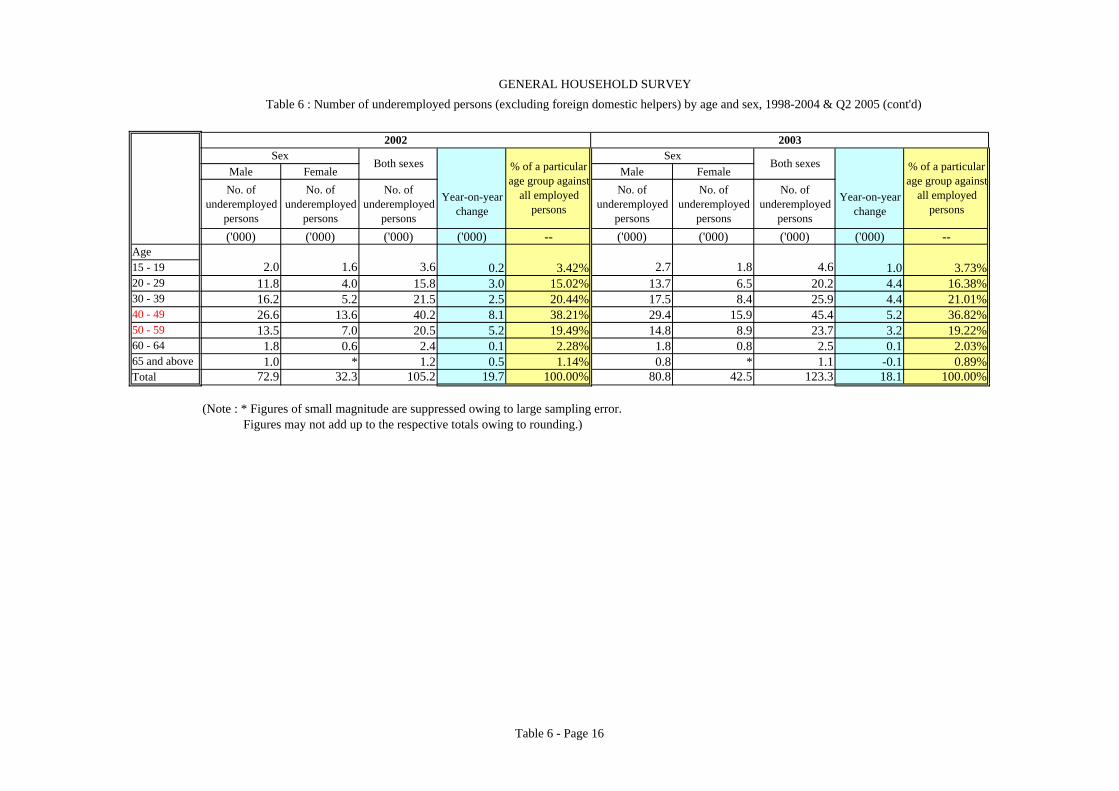
0.2 3.42% 1.0 3.73%11.8 4.0 15.8 3.0 15.02% 13.7 6.5 20.2 4.4 16.38%16.2 5.2 21.5 2.5 20.44% 17.5 8.4 25.9 4.4 21.01%26.6 13.6 40.2 8.1 38.21% 29.4 15.9 45.4 5.2 36.82%13.5 7.0 20.5 5.2 19.49% 14.8 8.9 23.7 3.2 19.22%
1.8 0.6 2.4 0.1 2.28% 1.8 0.8 2.5 0.1 2.03%1.0 * 1.2 0.5 1.14% 0.8 * 1.1 -0.1 0.89%
72.9 32.3 105.2 19.7 100.00% 80.8 42.5 123.3 18.1 100.00%
(Note : * Figures of small magnitude are suppressed owing to large sampling error. Figures may not add up to the respective totals owing to rounding.)
2.0 1.6
Both sexesSex
Both sexes
2.73.6
Sex
1.8 4.6
2002 2003
% of a particularage group against
all employedpersons
% of a particularage group against
all employedpersons
GENERAL HOUSEHOLD SURVEYTable 6 : Number of underemployed persons (excluding foreign domestic helpers) by age and sex, 1998-2004 & Q2 2005 (cont'd)
Table 6 - Page 16
Age15 - 1920 - 2930 - 3940 - 4950 - 5960 - 6465 and aboveTotal
Male Female Male FemaleNo. of
underemployedpersons
No. ofunderemployed
persons
No. ofunderemployed
persons
Year-on-yearchange
No. ofunderemployed
persons
No. ofunderemployed
persons
No. ofunderemployed
persons
Year-on-yearchange
Compared with1998
('000) ('000) ('000) ('000) -- ('000) ('000) ('000) ('000) ('000) -- --
-1.0 3.08% -0.8 0.2 2.79% -0.39%12.8 5.1 17.9 -2.3 15.34% 9.2 2.8 12.0 -5.9 -1.0 11.95% -3.94%15.5 7.0 22.5 -3.4 19.28% 11.8 5.3 17.1 -5.4 -4.3 17.03% -9.13%26.3 16.1 42.4 -3.0 36.33% 26.1 13.0 39.1 -3.3 11.5 38.94% 5.20%16.1 10.5 26.5 2.8 22.71% 18.1 7.7 25.8 -0.7 12.2 25.70% 9.07%
1.9 0.7 2.6 0.1 2.23% 2.1 * 2.8 0.2 0.2 2.79% -0.39%0.9 * 1.2 0.1 1.03% * * * * * * *
75.6 41.1 116.7 -6.6 100.00% 69.7 30.7 100.4 -16.3 18.6 100.00%
(Note : * Figures of small magnitude are suppressed owing to large sampling error. Figures may not add up to the respective totals owing to rounding.)
Observations of Table 6
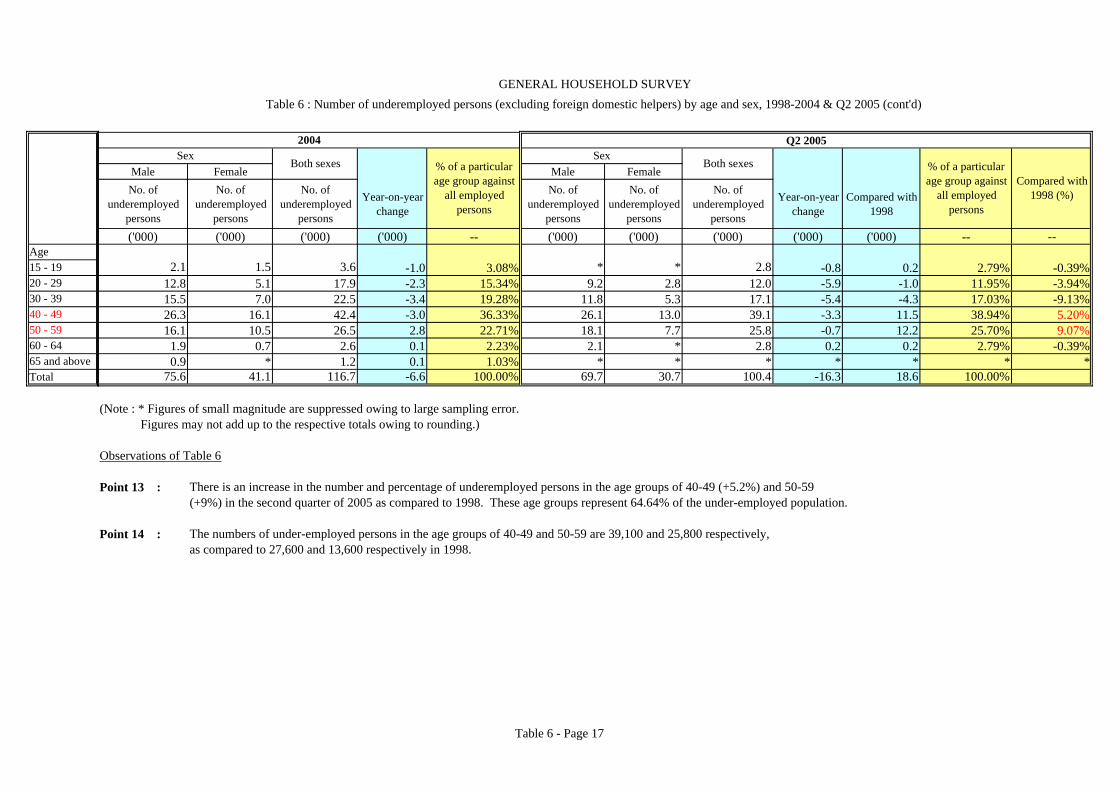
Point 13 : There is an increase in the number and percentage of underemployed persons in the age groups of 40-49 (+5.2%) and 50-59(+9%) in the second quarter of 2005 as compared to 1998. These age groups represent 64.64% of the under-employed population.
Point 14 : The numbers of under-employed persons in the age groups of 40-49 and 50-59 are 39,100 and 25,800 respectively, as compared to 27,600 and 13,600 respectively in 1998.
Compared with1998 (%)
Both sexesSex
1.5
Sex
*3.6 *2.1 2.8
% of a particularage group against
all employedpersons
% of a particularage group against
all employedpersons
Both sexes
Q2 20052004
GENERAL HOUSEHOLD SURVEYTable 6 : Number of underemployed persons (excluding foreign domestic helpers) by age and sex, 1998-2004 & Q2 2005 (cont'd)
Table 6 - Page 17
1998Number of
underemployedpersons
Number ofunderemployed
persons
Year-on-yearchange
Number ofunderemployed
persons
Year-on-yearchange
('000) ('000) ('000) ('000) ('000)OccupationManagers and administrators * *Professionals 0.5 * * 0.6 *Associate professionals 1.8 3.3 1.5 2.9 -0.4Clerks 2.7 4.7 2.0 4.9 0.2Service workers and shop sales 7.5 10.7 3.2 9.9 -0.8Craft and related workers 33.5 38.0 4.5 36.9 -1.1Plant and machine operators andassemblers 11.9 12.6 0.7 9.6 -3.0Elementary occupations 23.7 27.0 3.3 28.4 1.4Others * * * * *Total 81.8 96.9 15.1 93.5 -3.4
(Note : * Figures of small magnitude are suppressed owing to large sampling error. Figures may not add up to the respective totals owing to rounding.)
GENERAL HOUSEHOLD SURVEYTable 7 : Number of underemployed persons (excluding foreign domestic helpers)
by occupation, 1998-2004 & Q2 2005
* * *
1999 2000
Table 7 - Page 18
OccupationManagers and administratorsProfessionalsAssociate professionalsClerksService workers and shop salesCraft and related workersPlant and machine operators andassemblersElementary occupationsOthersTotal
Number ofunderemployed
persons
Year-on-yearchange
Number ofunderemployed
persons
Year-on-yearchange
Number ofunderemployed
persons
Year-on-yearchange
('000) ('000) ('000) ('000) ('000) ('000)
* * ** * 0.5 * 1.1 0.6
3.0 0.1 4.8 1.8 7.4 2.64.3 -0.6 6.3 2.0 7.6 1.38.7 -1.2 13.0 4.3 19.4 6.4
31.9 -5.0 38.2 6.3 38.2 0.0
9.0 -0.6 9.6 0.6 13.7 4.127.8 -0.6 32.1 4.3 35.2 3.1
* * * * * *85.5 -8.0 105.2 19.7 123.3 18.1
(Note : * Figures of small magnitude are suppressed owing to large sampling error. Figures may not add up to the respective totals owing to rounding.)
GENERAL HOUSEHOLD SURVEYTable 7 : Number of underemployed persons (excluding foreign domestic helpers) by occupation,
1998-2004 & Q2 2005
**
2001 2002 2003
*
Table 7 - Page 19
OccupationManagers and administratorsProfessionalsAssociate professionalsClerksService workers and shop salesCraft and related workersPlant and machine operators andassemblersElementary occupationsOthersTotal
Number ofunderemployed
persons
Year-on-yearchange
Number ofunderemployed
persons
Year-on-yearchange
Compared with1998
Increase/Decreaseagainst 1998'figures (%)
('000) ('000) ('000) ('000) ('000)
* * * * *1.3 0.2 * * * * *7.1 -0.3 6.0 5.98% -1.1 4.2 233.33%7.0 -0.6 4.6 4.58% -2.4 1.9 70.37%
17.2 -2.2 14.2 14.14% -3.0 6.7 89.33%36.4 -1.8 32.9 32.77% -3.5 -0.6 -1.79%
11.3 -2.4 9.7 9.66% -1.6 -2.2 -18.49%35.9 0.7 31.7 31.57% -4.2 8.0 33.76%
* * * * * * *116.7 -6.6 100.4 -16.3 18.6 22.74%
(Note : * Figures of small magnitude are suppressed owing to large sampling error. Figures may not add up to the respective totals owing to rounding.)
Observations of Table 7
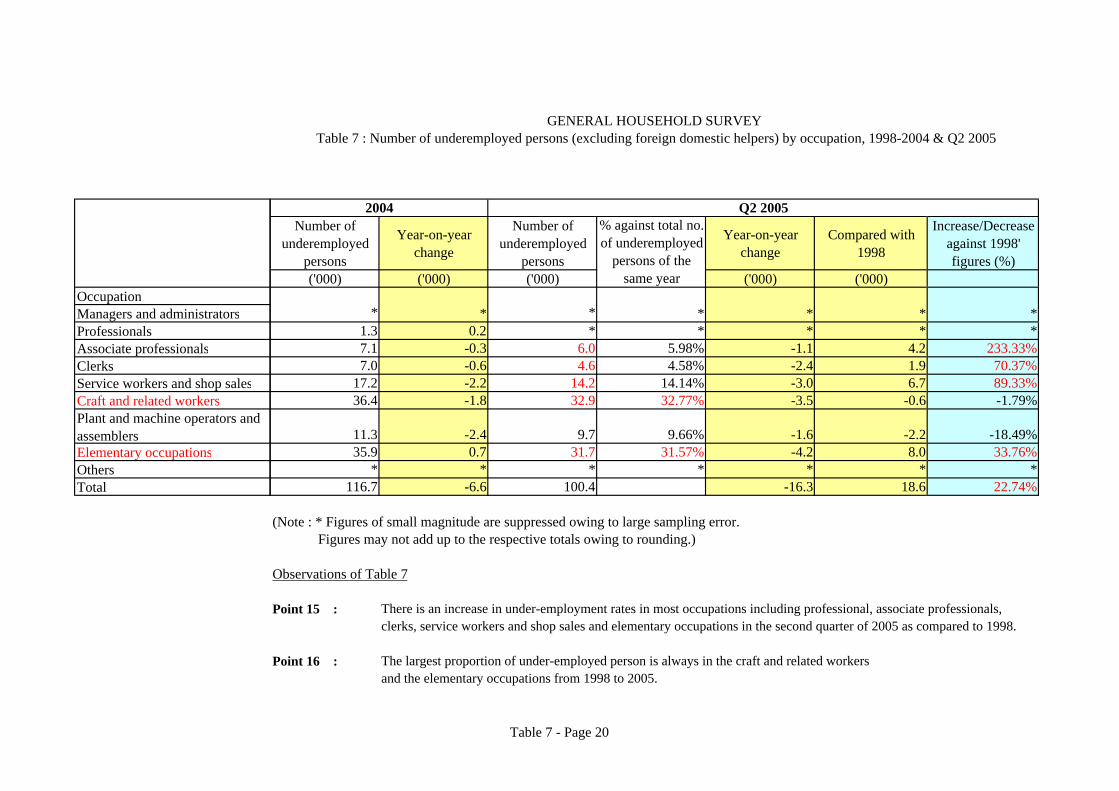
Point 15 : There is an increase in under-employment rates in most occupations including professional, associate professionals, clerks, service workers and shop sales and elementary occupations in the second quarter of 2005 as compared to 1998.
Point 16 : The largest proportion of under-employed person is always in the craft and related workersand the elementary occupations from 1998 to 2005.
GENERAL HOUSEHOLD SURVEYTable 7 : Number of underemployed persons (excluding foreign domestic helpers) by occupation, 1998-2004 & Q2 2005
% against total no.of underemployed
persons of thesame year
*
2004 Q2 2005
*
Table 7 - Page 20
1998Number of
underemployedpersons
Number ofunderemployed
persons
Year-on-yearchange
Number ofunderemployed
persons
Year-on-yearchange
Number ofunderemployed
persons
Year-on-yearchange
Number ofunderemployed
persons
Year-on-yearchange
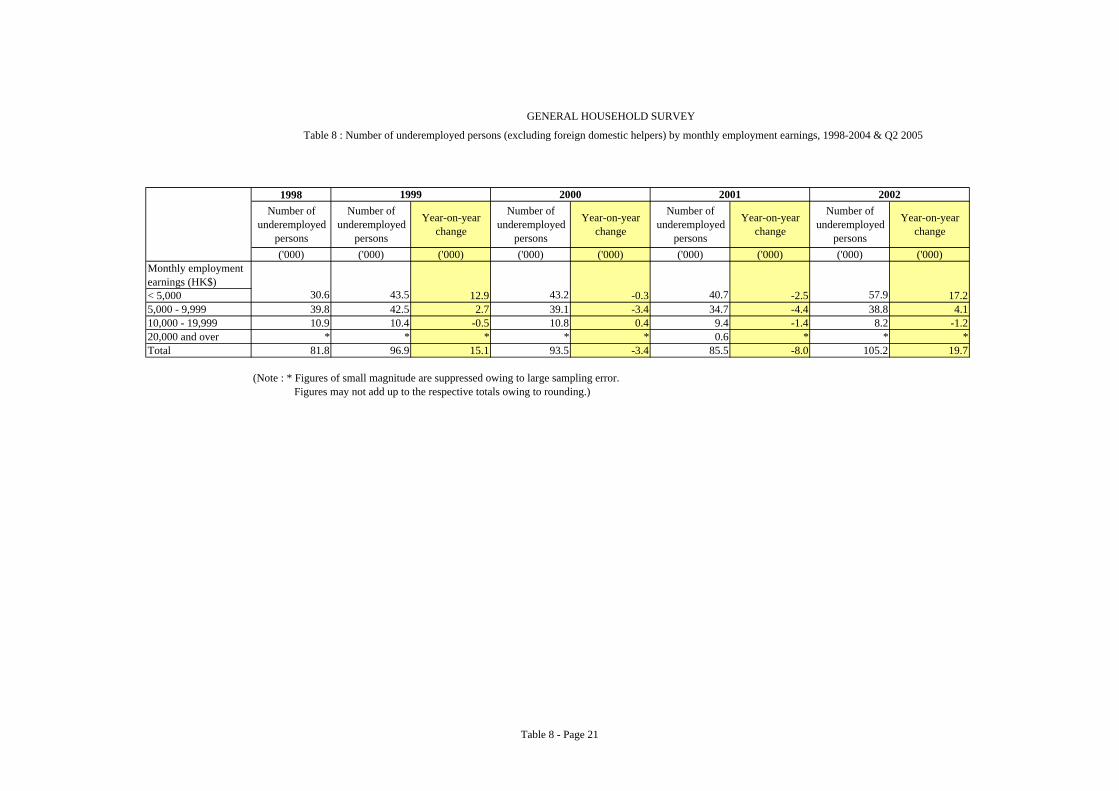
('000) ('000) ('000) ('000) ('000) ('000) ('000) ('000) ('000)Monthly employmentearnings (HK$)< 5,000 12.9 -0.3 -2.5 17.25,000 - 9,999 39.8 42.5 2.7 39.1 -3.4 34.7 -4.4 38.8 4.110,000 - 19,999 10.9 10.4 -0.5 10.8 0.4 9.4 -1.4 8.2 -1.220,000 and over * * * * * 0.6 * * *Total 81.8 96.9 15.1 93.5 -3.4 85.5 -8.0 105.2 19.7
(Note : * Figures of small magnitude are suppressed owing to large sampling error. Figures may not add up to the respective totals owing to rounding.)
GENERAL HOUSEHOLD SURVEY
Table 8 : Number of underemployed persons (excluding foreign domestic helpers) by monthly employment earnings, 1998-2004 & Q2 2005
43.2 40.7 57.930.6 43.5
1999 2000 2001 2002
Table 8 - Page 21
Monthly employmentearnings (HK$)< 5,0005,000 - 9,99910,000 - 19,99920,000 and overTotal
Number ofunderemployed
persons
Year-on-yearchange
Number ofunderemployed
persons
Year-on-yearchange
Number ofunderemployed
persons
Year-on-yearchange Compared with 1998
('000) ('000) ('000) ('000) ('000) ('000) ('000)
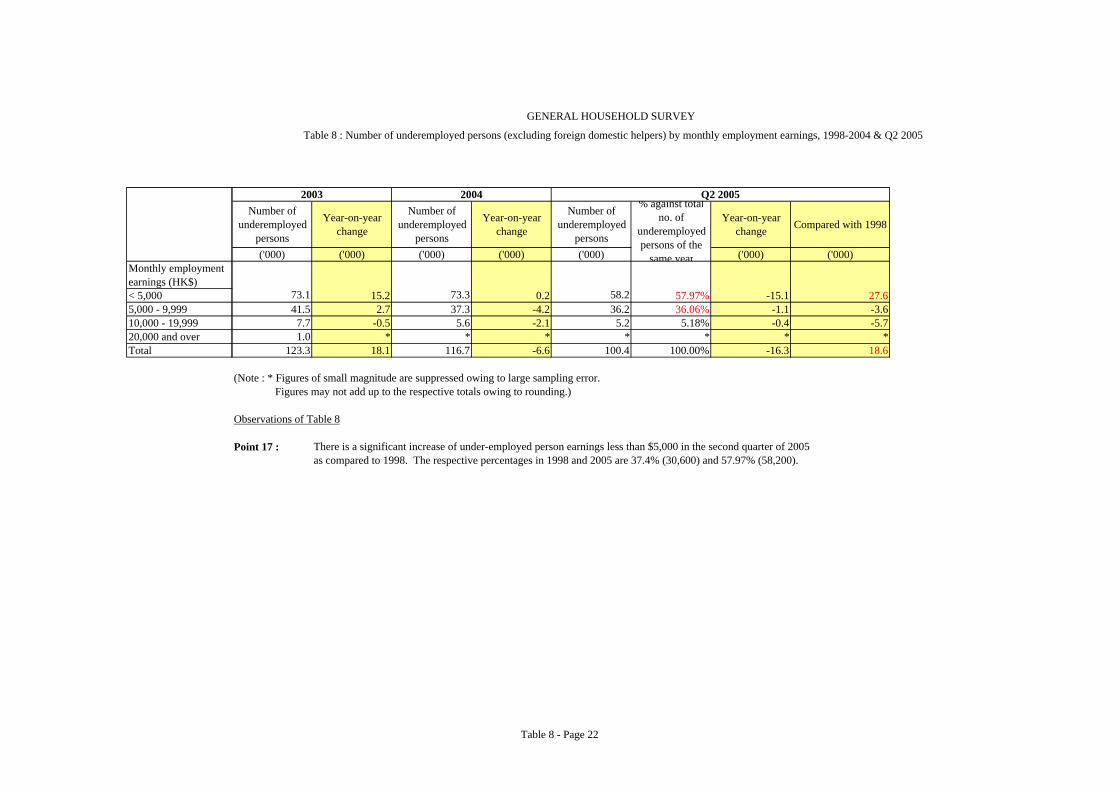
15.2 0.2 57.97% -15.1 27.641.5 2.7 37.3 -4.2 36.2 36.06% -1.1 -3.6
7.7 -0.5 5.6 -2.1 5.2 5.18% -0.4 -5.71.0 * * * * * * *
123.3 18.1 116.7 -6.6 100.4 100.00% -16.3 18.6
(Note : * Figures of small magnitude are suppressed owing to large sampling error. Figures may not add up to the respective totals owing to rounding.)
Observations of Table 8
Point 17 : There is a significant increase of under-employed person earnings less than $5,000 in the second quarter of 2005 as compared to 1998. The respective percentages in 1998 and 2005 are 37.4% (30,600) and 57.97% (58,200).
GENERAL HOUSEHOLD SURVEY
Table 8 : Number of underemployed persons (excluding foreign domestic helpers) by monthly employment earnings, 1998-2004 & Q2 2005
2003 2004
73.373.1
Q2 2005% against total
no. ofunderemployedpersons of the
same year
58.2
Table 8 - Page 22
Recommended