8/4/2019 19 Inventory
http://slidepdf.com/reader/full/19-inventory 1/29
INVENTORY
MANAGEMENT
8/4/2019 19 Inventory
http://slidepdf.com/reader/full/19-inventory 2/29
Operations Management 2 Lally School of Management and Technology
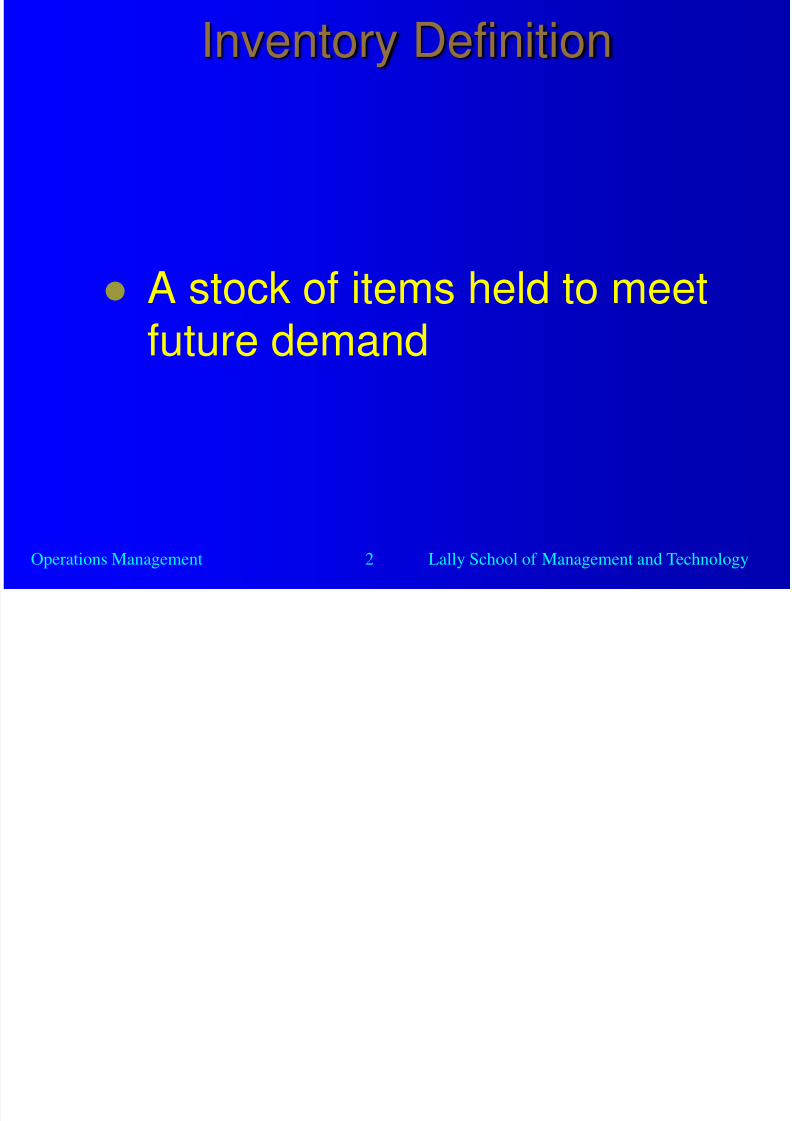
Inventory Definition
A stock of items held to meetfuture demand
8/4/2019 19 Inventory
http://slidepdf.com/reader/full/19-inventory 3/29
Operations Management 3 Lally School of Management and Technology
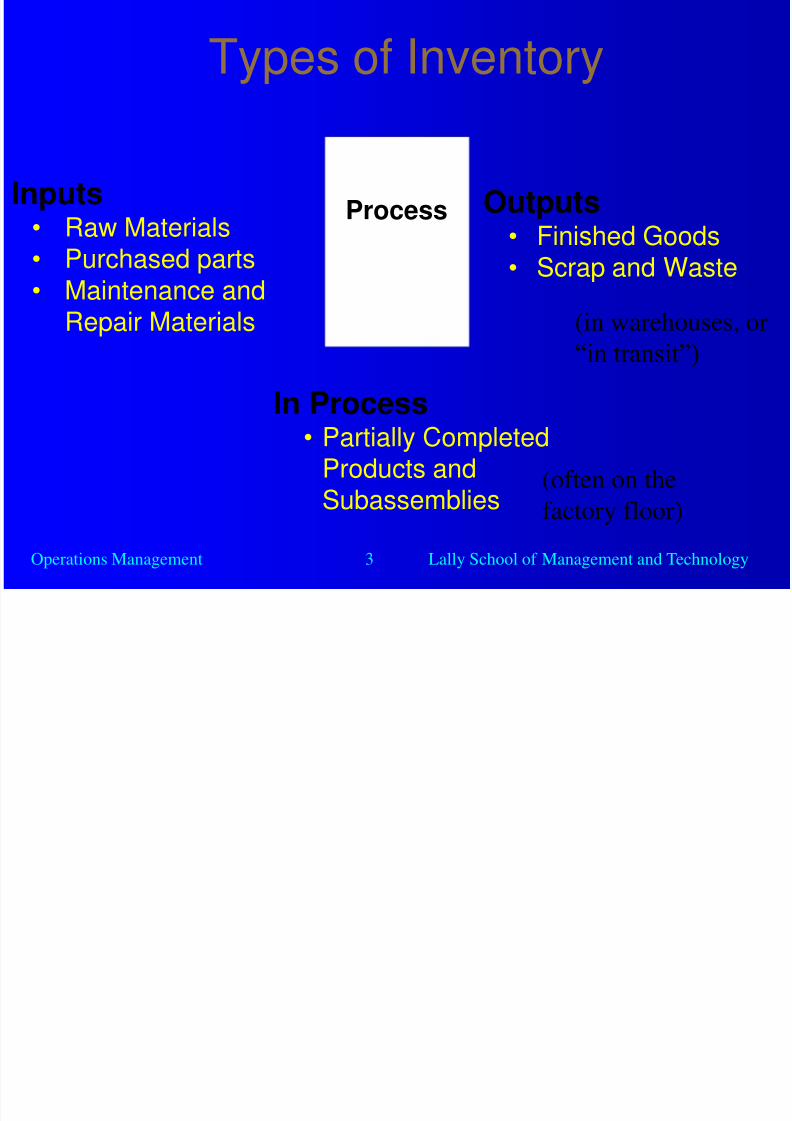
Types of Inventory
Inputs• Raw Materials• Purchased parts• Maintenance and
Repair Materials
Outputs• Finished Goods
• Scrap and Waste
Process
In Process• Partially CompletedProducts andSubassemblies
(in warehouses, or
“in transit”)
(often on the
factory floor)
8/4/2019 19 Inventory
http://slidepdf.com/reader/full/19-inventory 4/29
Operations Management 4 Lally School of Management and Technology
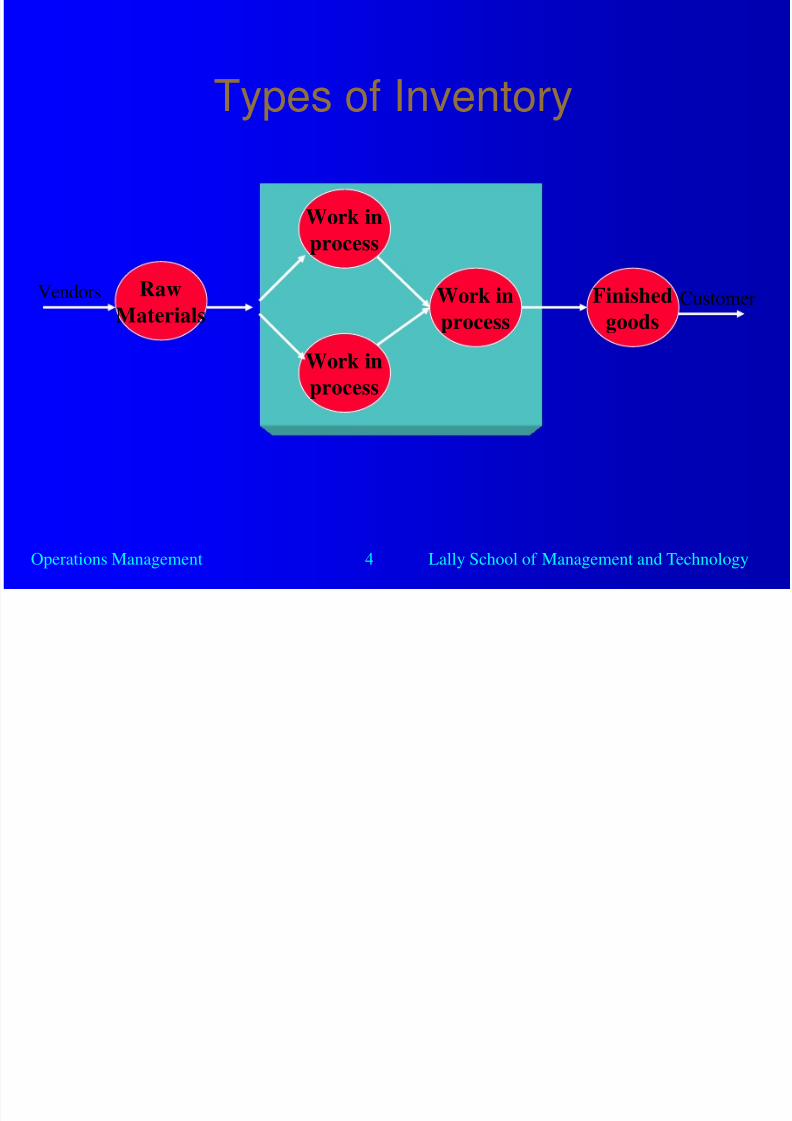
Types of Inventory
Work in
process
Work in
process
Work in
process
Finished
goods
Raw
MaterialsVendors Customer
8/4/2019 19 Inventory
http://slidepdf.com/reader/full/19-inventory 5/29
Operations Management 5 Lally School of Management and Technology
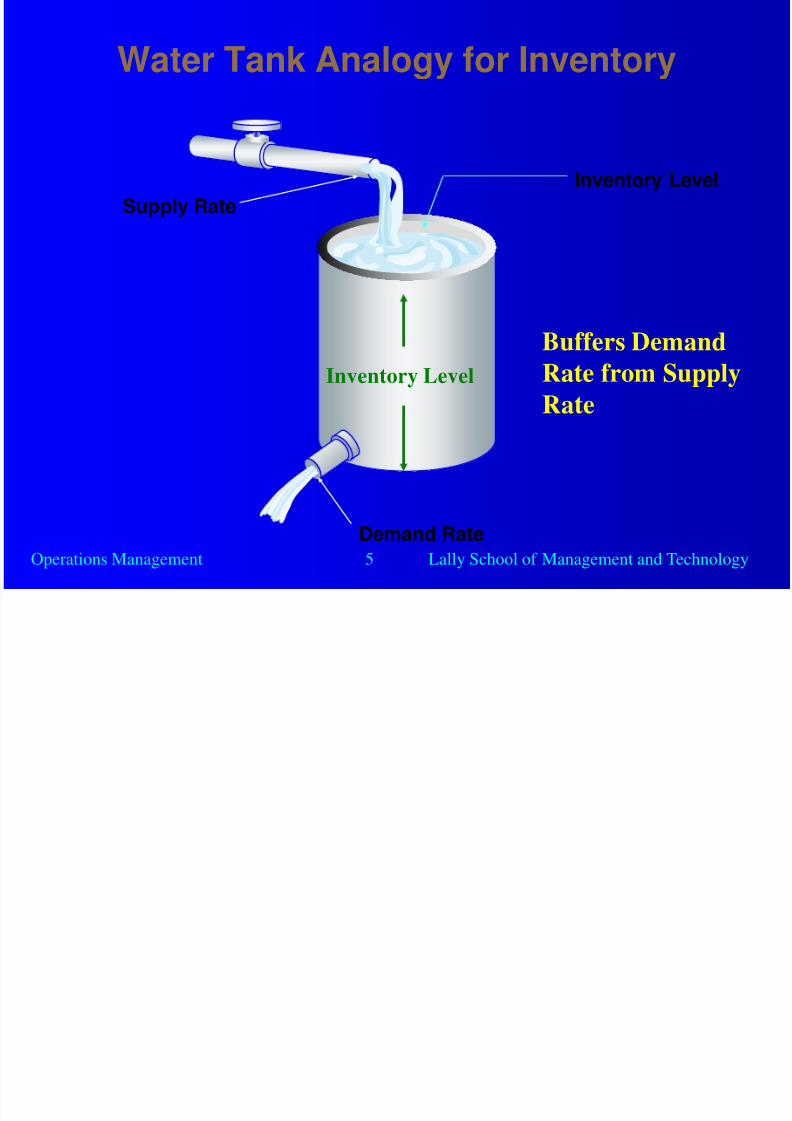
Water Tank Analogy for Inventory
Supply Rate
Inventory Level
Demand Rate
Inventory Level
Buffers Demand
Rate from Supply
Rate
8/4/2019 19 Inventory
http://slidepdf.com/reader/full/19-inventory 6/29
Operations Management 6 Lally School of Management and Technology
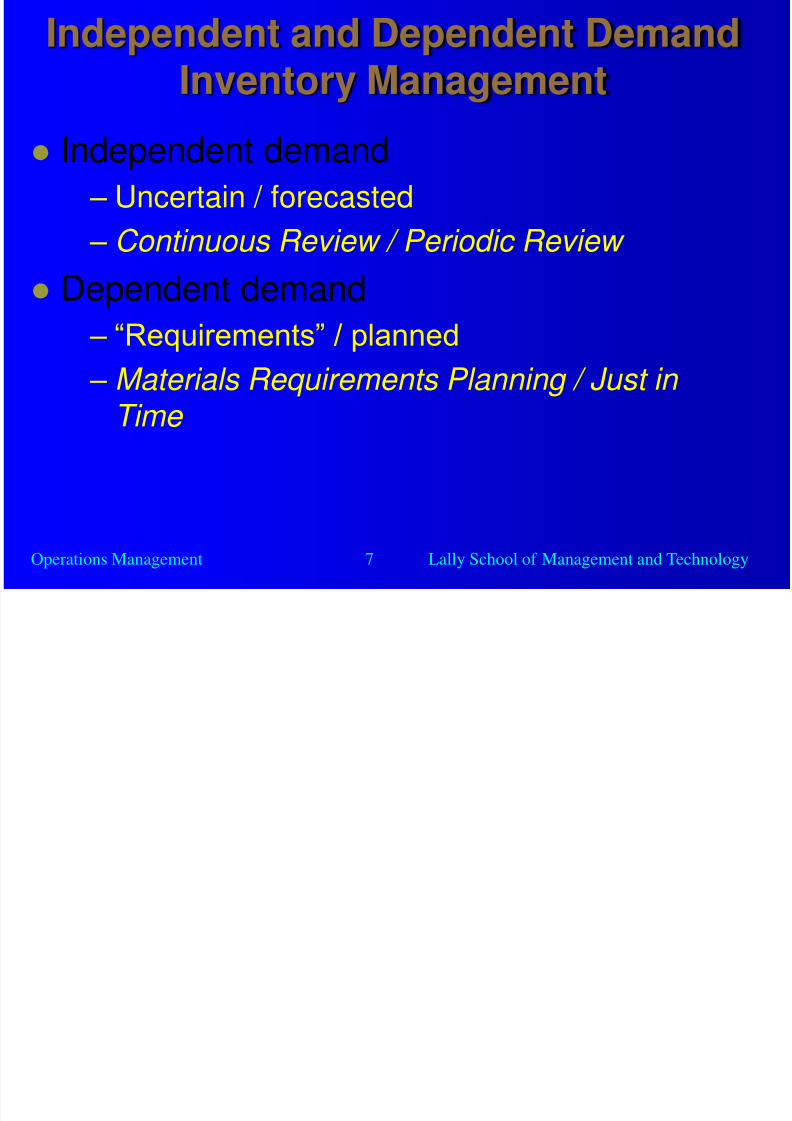
Independent and Dependent DemandInventory
Independent demand – items demanded by external customers
(Tables)
Dependent demand – items used to produce final products (fans,
computers, LCD projectors, etc.)
– Demand determined once we know the typeand number of final products
8/4/2019 19 Inventory
http://slidepdf.com/reader/full/19-inventory 7/29
Operations Management 7 Lally School of Management and Technology
Independent and Dependent DemandInventory Management
Independent demand – Uncertain / forecasted
– Continuous Review / Periodic Review
Dependent demand – “Requirements” / planned
– Materials Requirements Planning / Just in
Time
8/4/2019 19 Inventory
http://slidepdf.com/reader/full/19-inventory 8/29
Operations Management 8 Lally School of Management and Technology
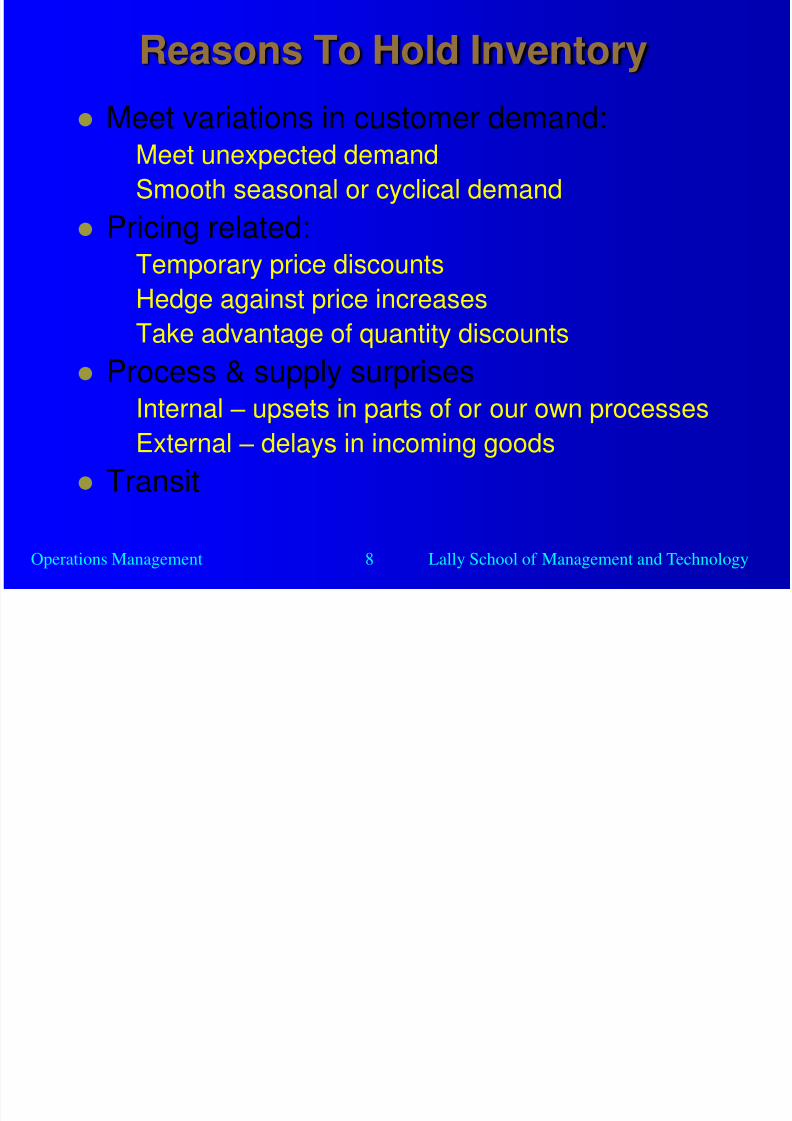
Reasons To Hold Inventory
Meet variations in customer demand:Meet unexpected demand
Smooth seasonal or cyclical demand
Pricing related:
Temporary price discountsHedge against price increases
Take advantage of quantity discounts
Process & supply surprises
Internal – upsets in parts of or our own processesExternal – delays in incoming goods
Transit
8/4/2019 19 Inventory
http://slidepdf.com/reader/full/19-inventory 9/29
Operations Management 9 Lally School of Management and Technology
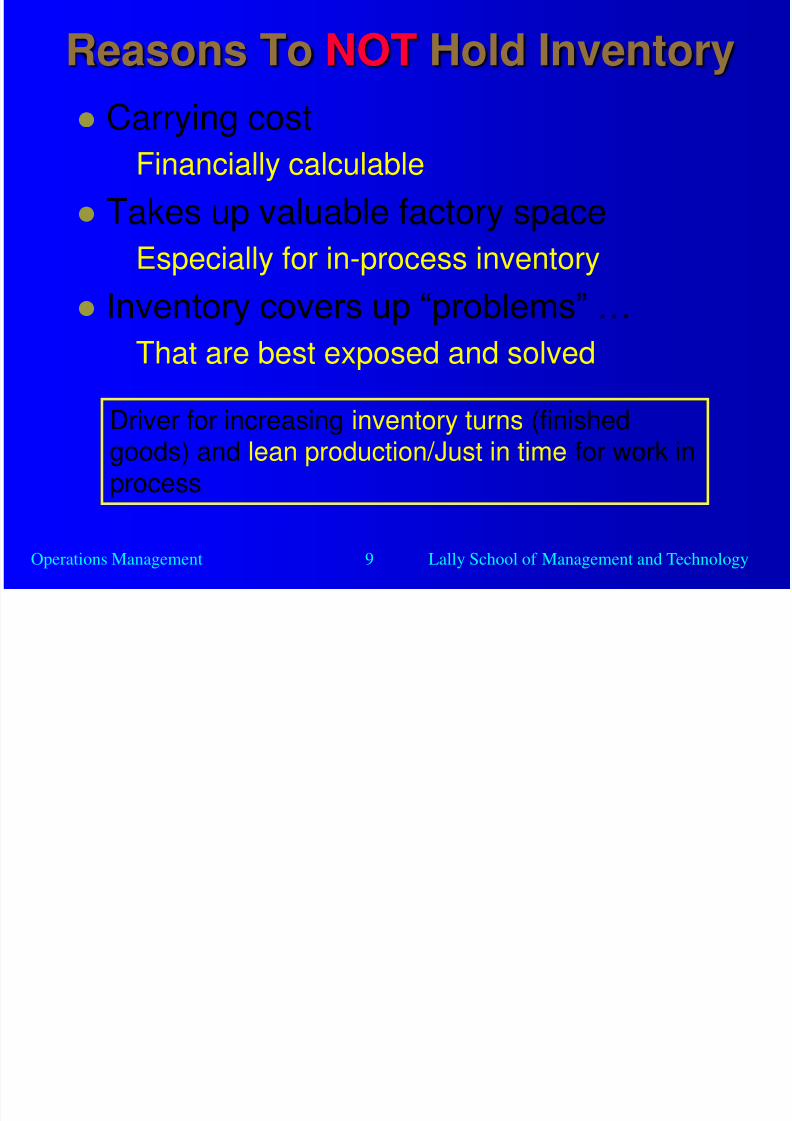
Reasons To NOT Hold Inventory
Carrying cost
Financially calculable
Takes up valuable factory space
Especially for in-process inventory
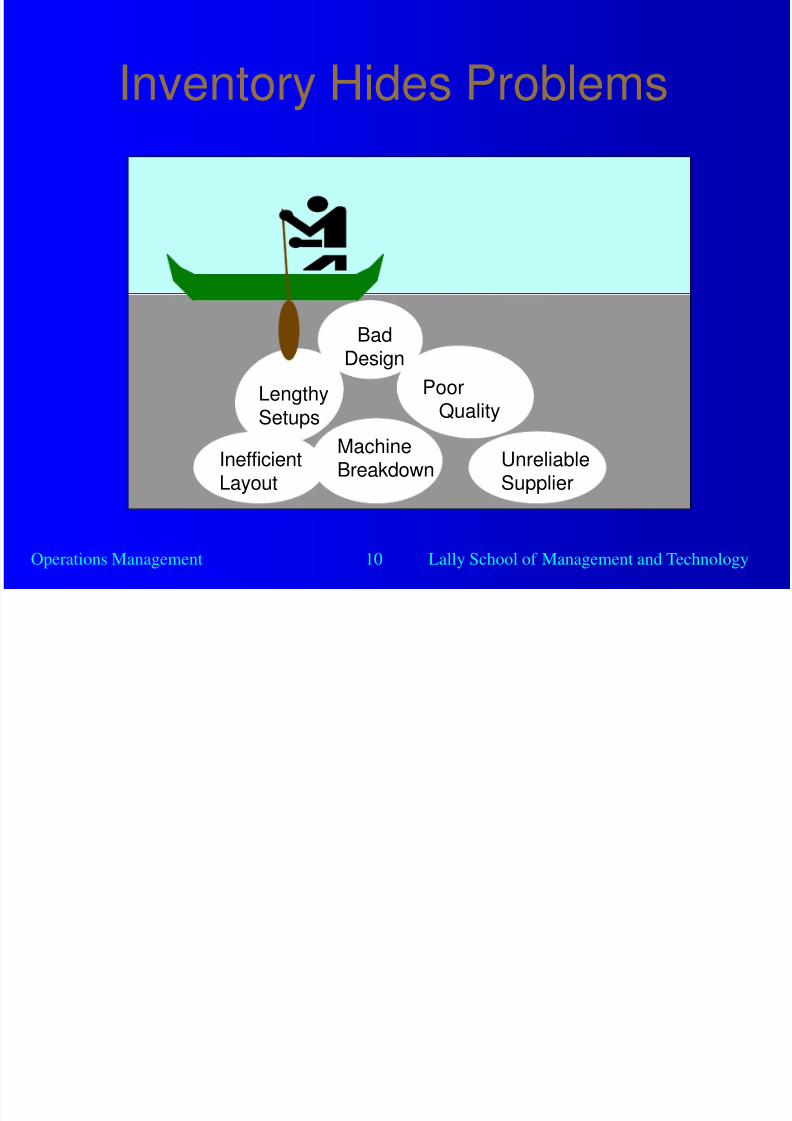
Inventory covers up “problems” …
That are best exposed and solved
Driver for increasing inventory turns (finishedgoods) and lean production/Just in time for work inprocess
8/4/2019 19 Inventory
http://slidepdf.com/reader/full/19-inventory 10/29
Operations Management 10 Lally School of Management and Technology
Inventory Hides Problems
Poor
Quality
UnreliableSupplier
MachineBreakdown
InefficientLayout
BadDesign
Lengthy
Setups
8/4/2019 19 Inventory
http://slidepdf.com/reader/full/19-inventory 11/29
Operations Management 11 Lally School of Management and Technology
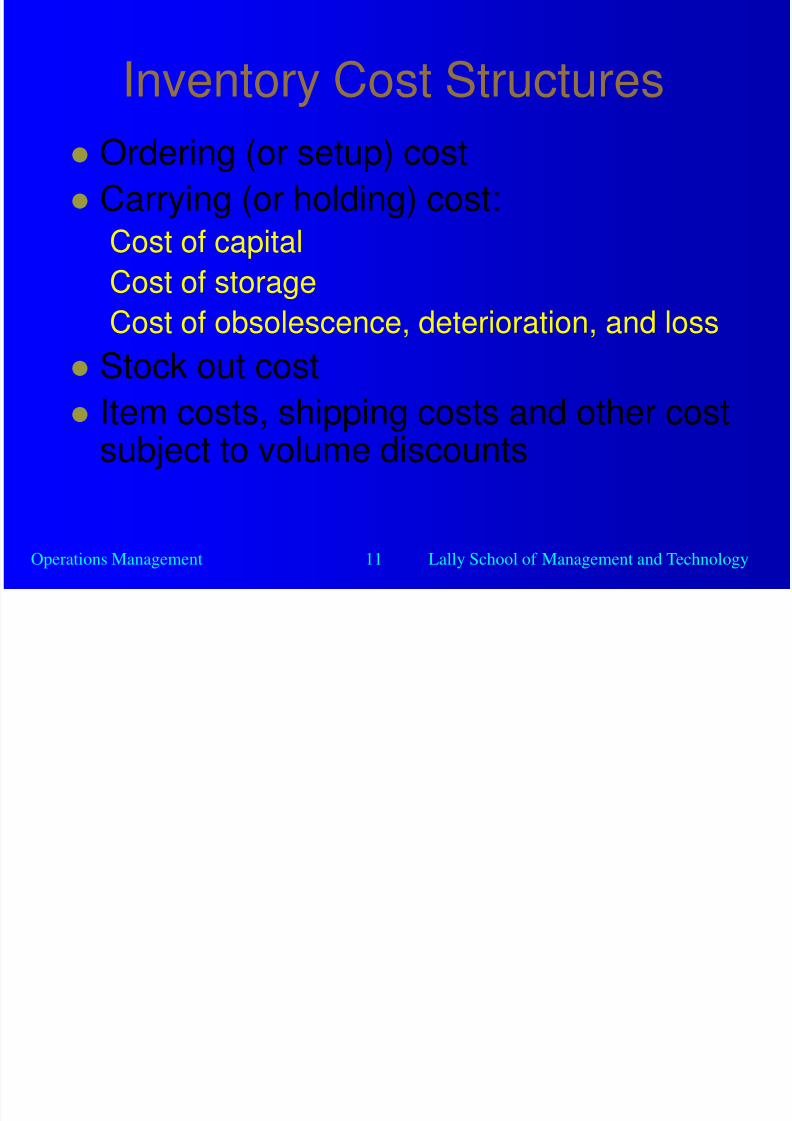
Inventory Cost Structures
Ordering (or setup) cost
Carrying (or holding) cost:Cost of capital
Cost of storageCost of obsolescence, deterioration, and loss
Stock out cost
Item costs, shipping costs and other costsubject to volume discounts
8/4/2019 19 Inventory
http://slidepdf.com/reader/full/19-inventory 12/29
Operations Management 12 Lally School of Management and Technology
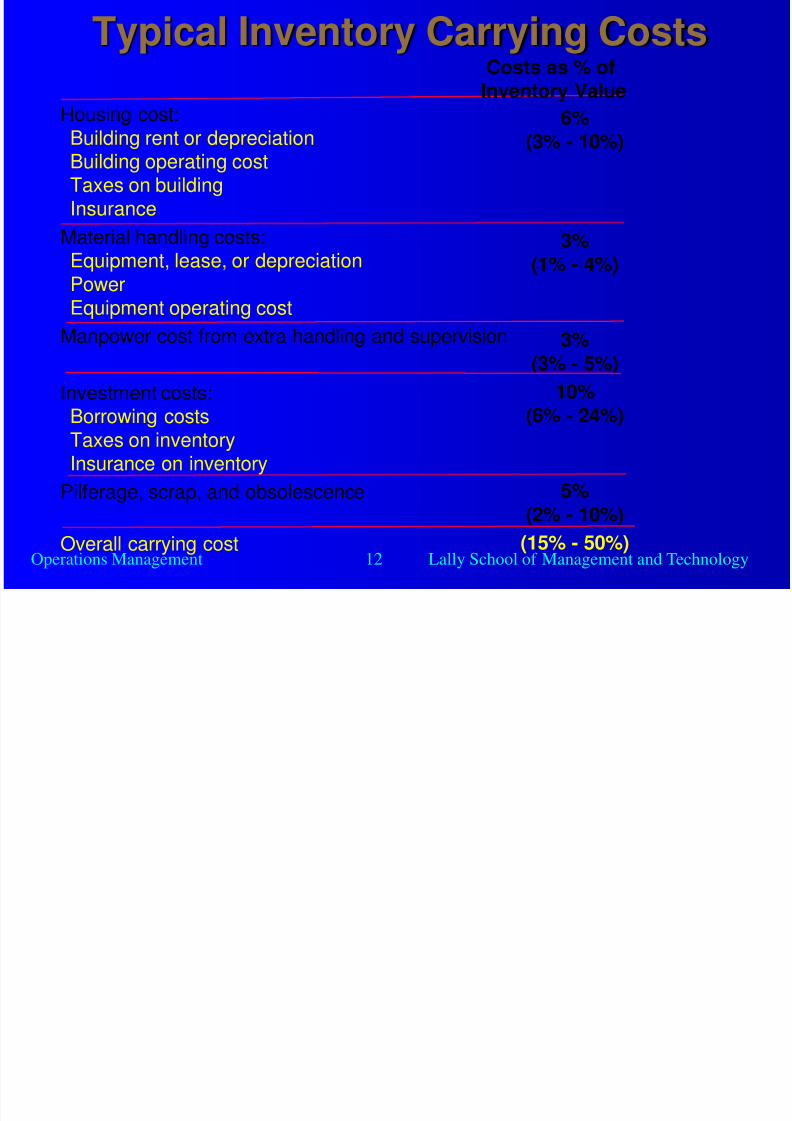
Typical Inventory Carrying Costs
Housing cost:
Building rent or depreciationBuilding operating costTaxes on buildingInsurance
Material handling costs:Equipment, lease, or depreciation
PowerEquipment operating cost
Manpower cost from extra handling and supervision
Investment costs:
Borrowing costsTaxes on inventoryInsurance on inventory
Pilferage, scrap, and obsolescence
Overall carrying cost
6%
(3% - 10%)
3%(1% - 4%)
3%(3% - 5%)
10%
(6% - 24%)
5%(2% - 10%)
(15% - 50%)
Costs as % ofInventory Value
8/4/2019 19 Inventory
http://slidepdf.com/reader/full/19-inventory 13/29
Operations Management 13 Lally School of Management and Technology
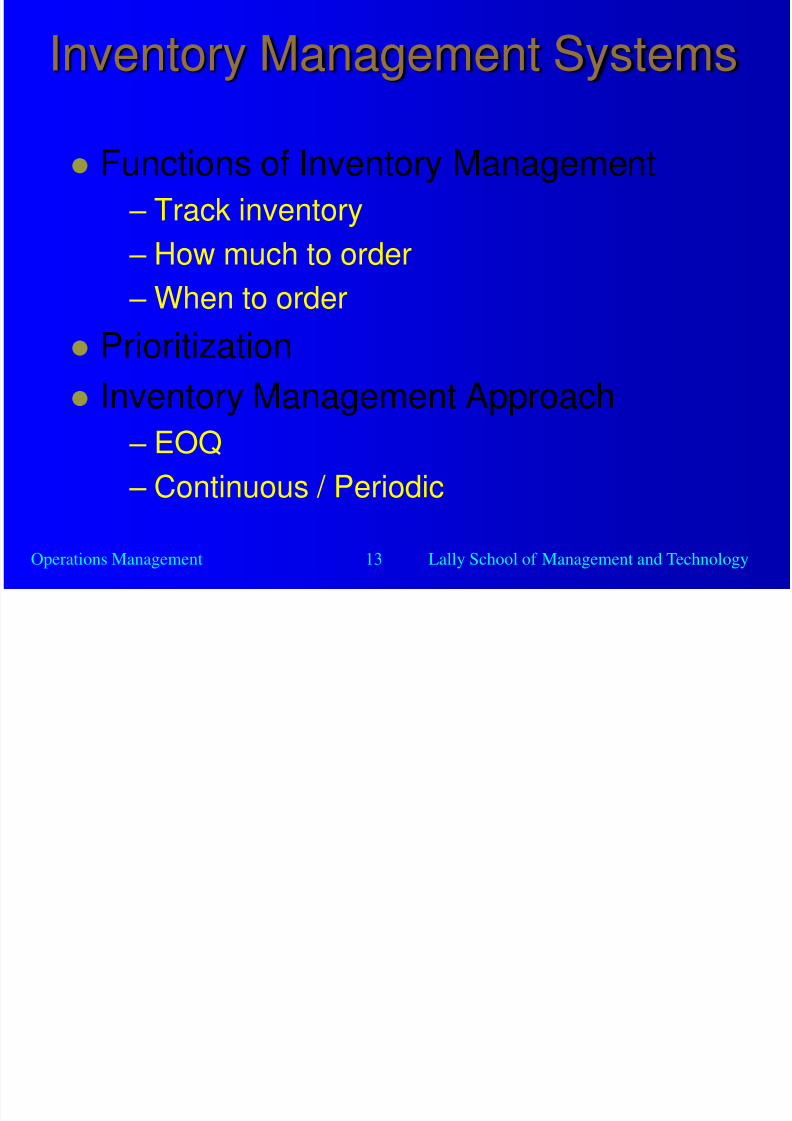
Inventory Management Systems
Functions of Inventory Management
– Track inventory
– How much to order
– When to order
Prioritization
Inventory Management Approach
– EOQ
– Continuous / Periodic
8/4/2019 19 Inventory
http://slidepdf.com/reader/full/19-inventory 14/29
Operations Management 14 Lally School of Management and Technology
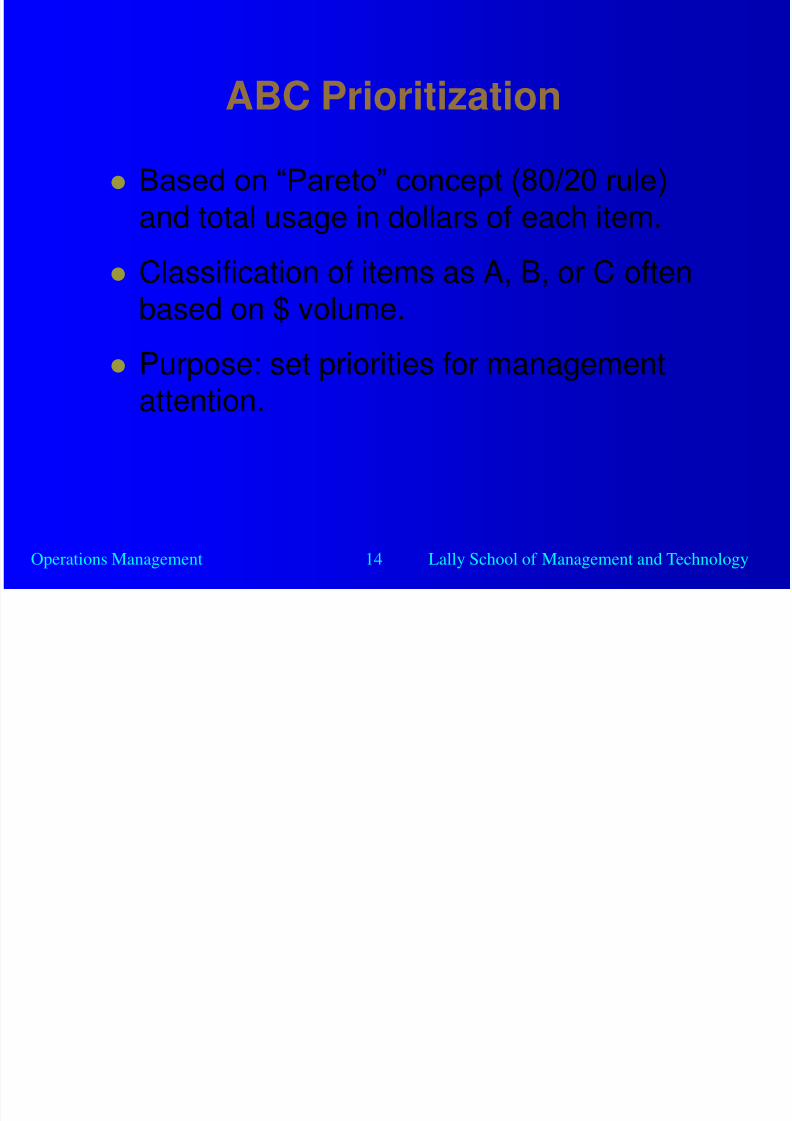
ABC Prioritization
Based on “Pareto” concept (80/20 rule)
and total usage in dollars of each item.
Classification of items as A, B, or C oftenbased on $ volume.
Purpose: set priorities for management
attention.
8/4/2019 19 Inventory
http://slidepdf.com/reader/full/19-inventory 15/29
Operations Management 15 Lally School of Management and Technology
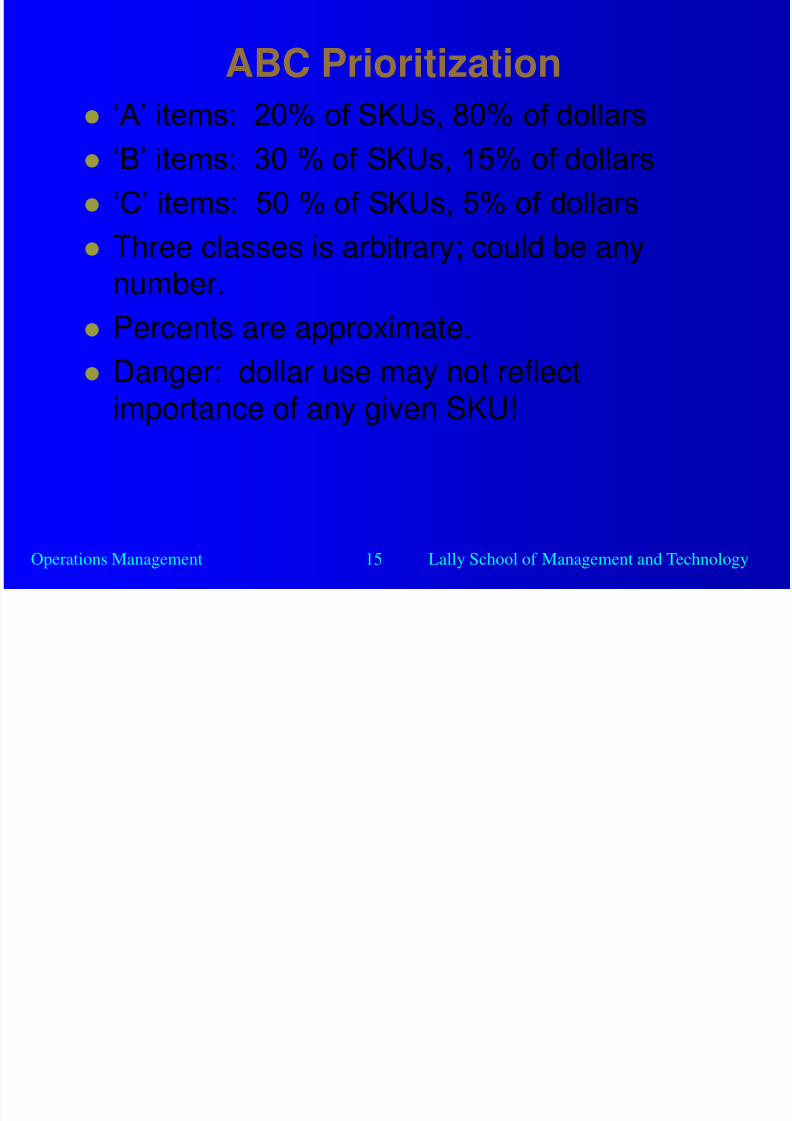
ABC Prioritization
„A‟ items: 20% of SKUs, 80% of dollars
„B‟ items: 30 % of SKUs, 15% of dollars
„C‟ items: 50 % of SKUs, 5% of dollars
Three classes is arbitrary; could be any
number. Percents are approximate.
Danger: dollar use may not reflect
importance of any given SKU!
8/4/2019 19 Inventory
http://slidepdf.com/reader/full/19-inventory 16/29
Operations Management 16 Lally School of Management and Technology
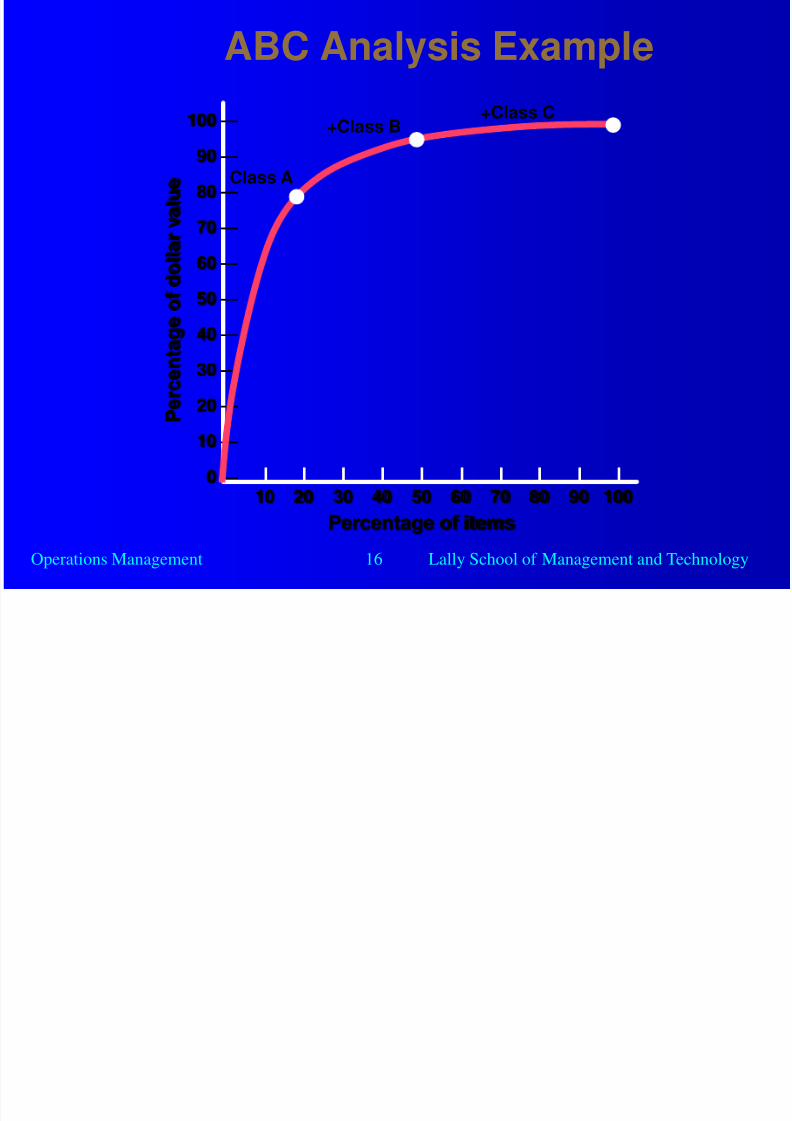
ABC Analysis Example
10 20 30 40 50 60 70 80 90 100
Percentage of items
P
e r c e n t a g e
o f d o l l a r v a l u e
100 —
90 —
80 —
70 —
60 —
50 —
40 —
30 —
20 —
10 —
0 —
+Class C
Class A
+Class B
8/4/2019 19 Inventory
http://slidepdf.com/reader/full/19-inventory 17/29
Operations Management 17 Lally School of Management and Technology
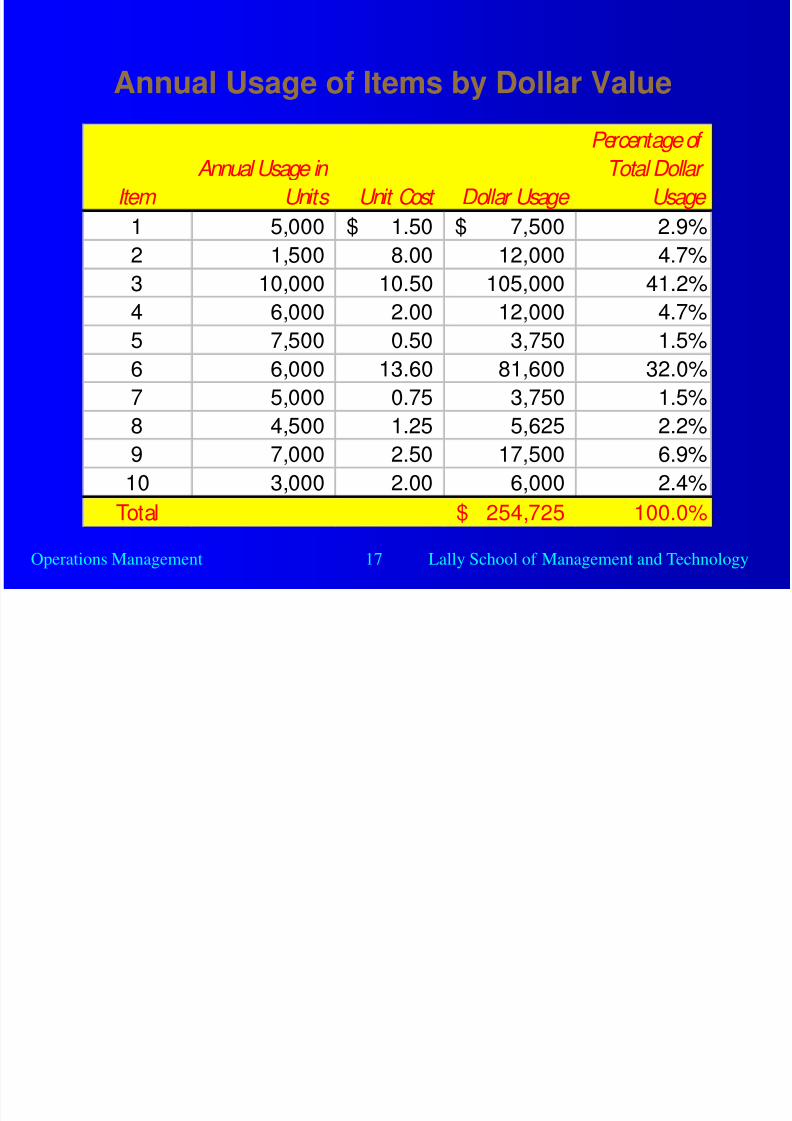
Annual Usage of Items by Dollar Value
Item
Annual Usage in
Units Unit Cost Dollar Usage
Percentage of Total Dollar
Usage
1 5,000 1.50$ 7,500$ 2.9%
2 1,500 8.00 12,000 4.7%
3 10,000 10.50 105,000 41.2%4 6,000 2.00 12,000 4.7%
5 7,500 0.50 3,750 1.5%
6 6,000 13.60 81,600 32.0%
7 5,000 0.75 3,750 1.5%
8 4,500 1.25 5,625 2.2%
9 7,000 2.50 17,500 6.9%
10 3,000 2.00 6,000 2.4%
Total 254,725$ 100.0%
8/4/2019 19 Inventory
http://slidepdf.com/reader/full/19-inventory 18/29
Operations Management 18 Lally School of Management and Technology
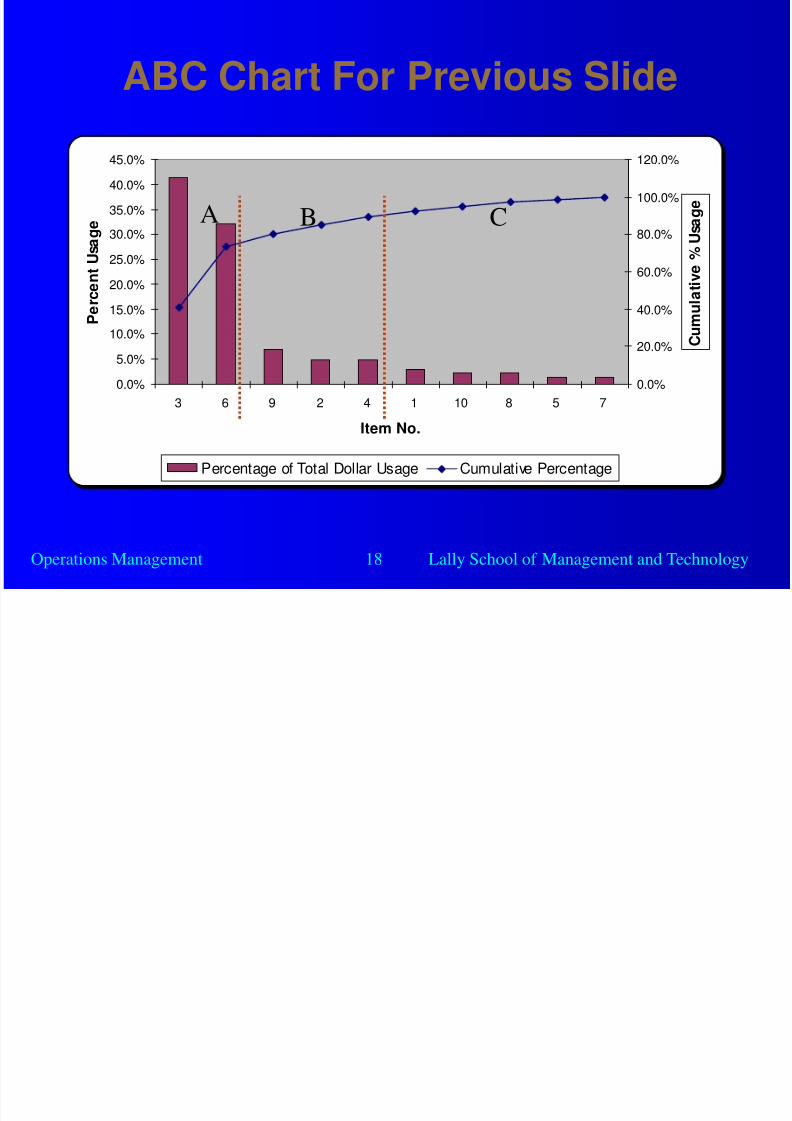
ABC Chart For Previous Slide
0.0%
5.0%
10.0%
15.0%
20.0%
25.0%
30.0%
35.0%
40.0%
45.0%
3 6 9 2 4 1 10 8 5 7
Item No.
P e r c e n
t U s a g e
0.0%
20.0%
40.0%
60.0%
80.0%
100.0%
120.0%
C u m u l a t i v
e % U s a g e
Percentage of Total Dollar Usage Cumulative Percentage
A B C
8/4/2019 19 Inventory
http://slidepdf.com/reader/full/19-inventory 19/29
Operations Management 19 Lally School of Management and Technology
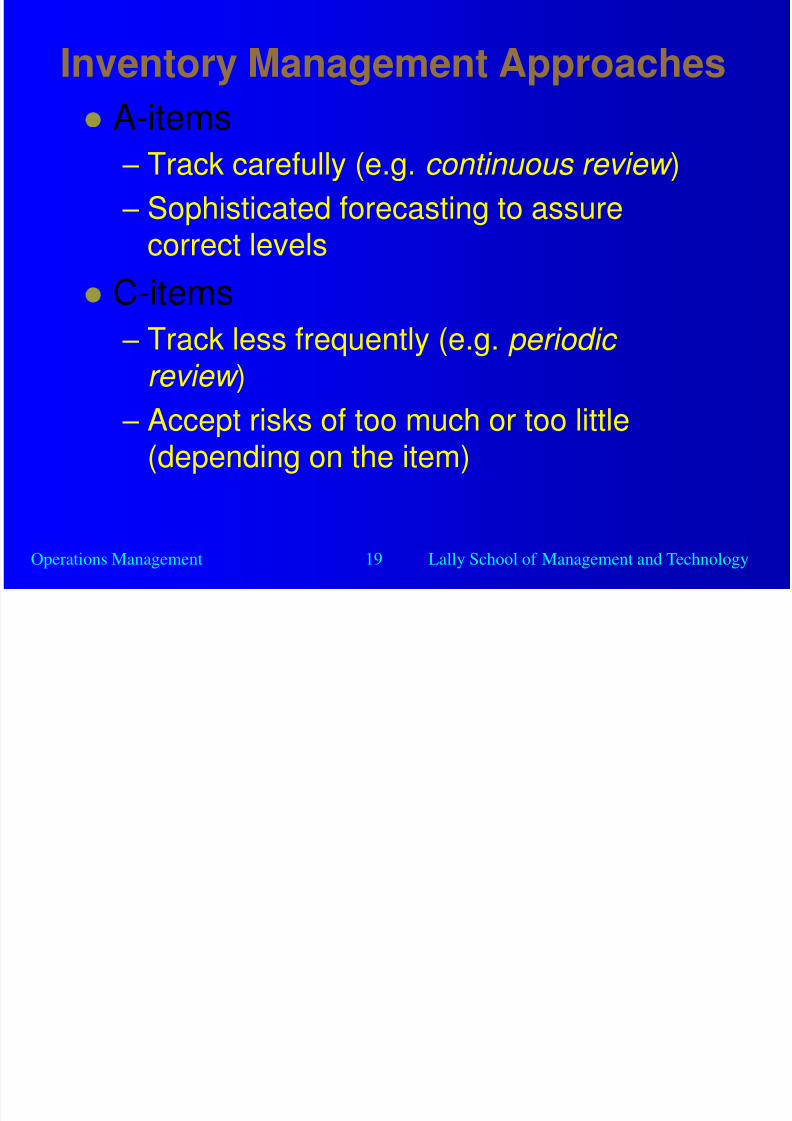
Inventory Management Approaches
A-items
– Track carefully (e.g. continuous review )
– Sophisticated forecasting to assurecorrect levels
C-items
– Track less frequently (e.g. periodic review )
– Accept risks of too much or too little(depending on the item)
8/4/2019 19 Inventory
http://slidepdf.com/reader/full/19-inventory 20/29
Operations Management 20 Lally School of Management and Technology
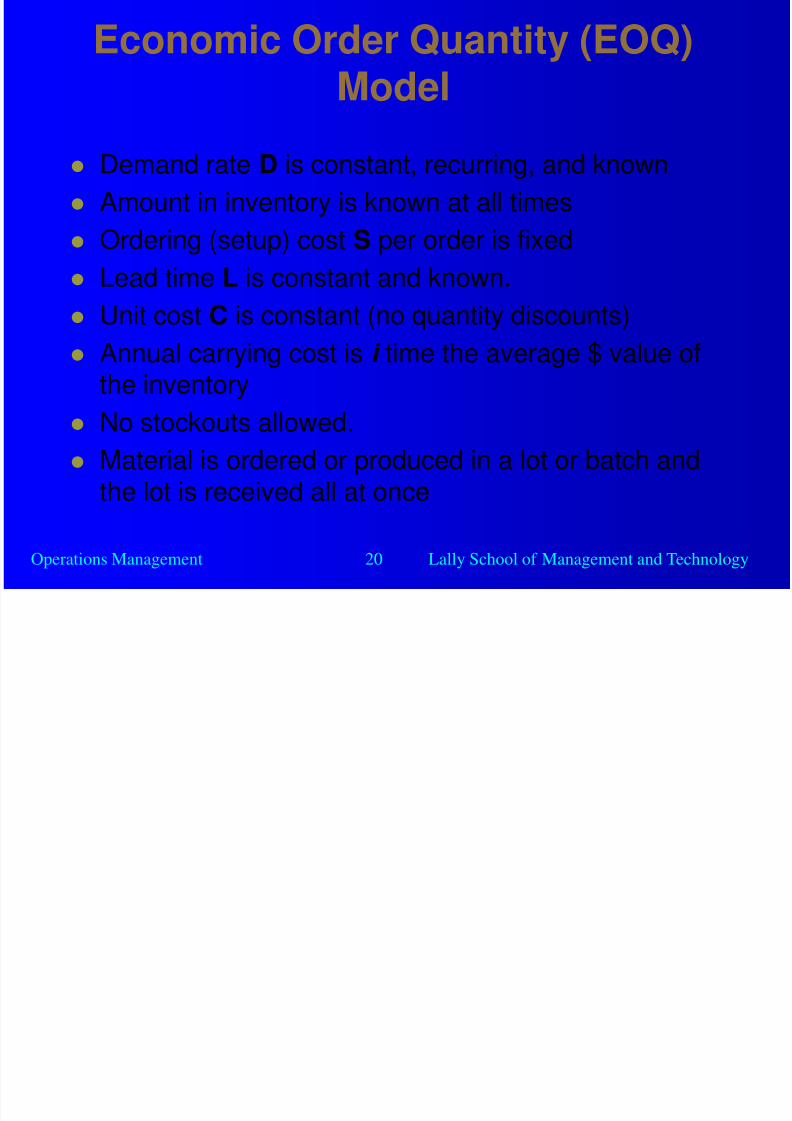
Economic Order Quantity (EOQ)Model
Demand rate D is constant, recurring, and known
Amount in inventory is known at all times
Ordering (setup) cost S per order is fixed
Lead time L is constant and known. Unit cost C is constant (no quantity discounts)
Annual carrying cost is i time the average $ value ofthe inventory
No stockouts allowed. Material is ordered or produced in a lot or batch and
the lot is received all at once
8/4/2019 19 Inventory
http://slidepdf.com/reader/full/19-inventory 21/29
Operations Management 21 Lally School of Management and Technology
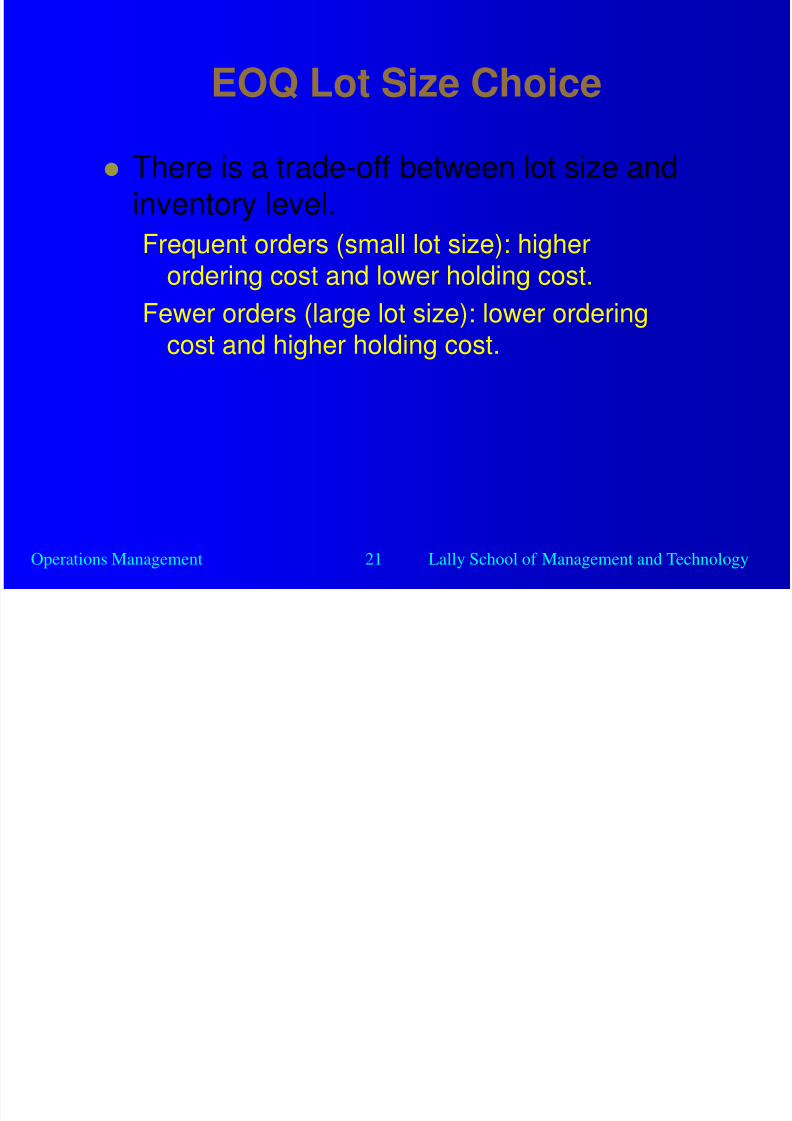
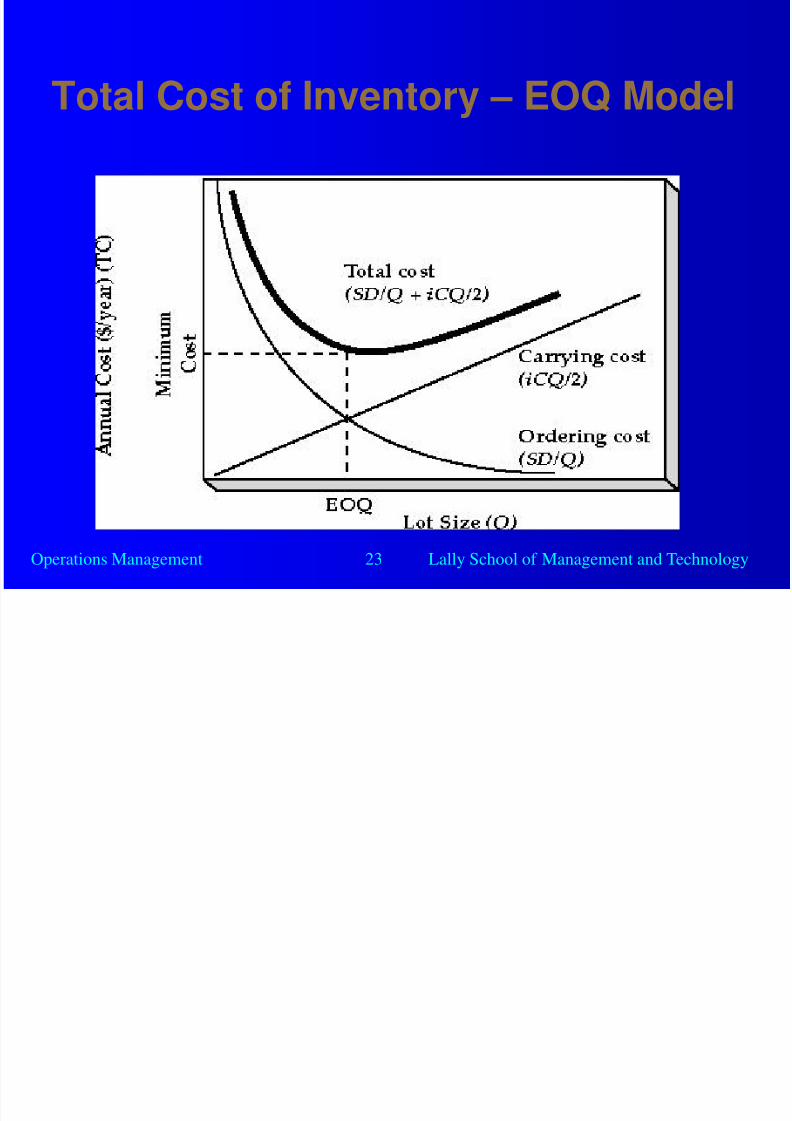
EOQ Lot Size Choice
There is a trade-off between lot size andinventory level.
Frequent orders (small lot size): higher
ordering cost and lower holding cost.Fewer orders (large lot size): lower ordering
cost and higher holding cost.
8/4/2019 19 Inventory
http://slidepdf.com/reader/full/19-inventory 22/29
Operations Management 22 Lally School of Management and Technology
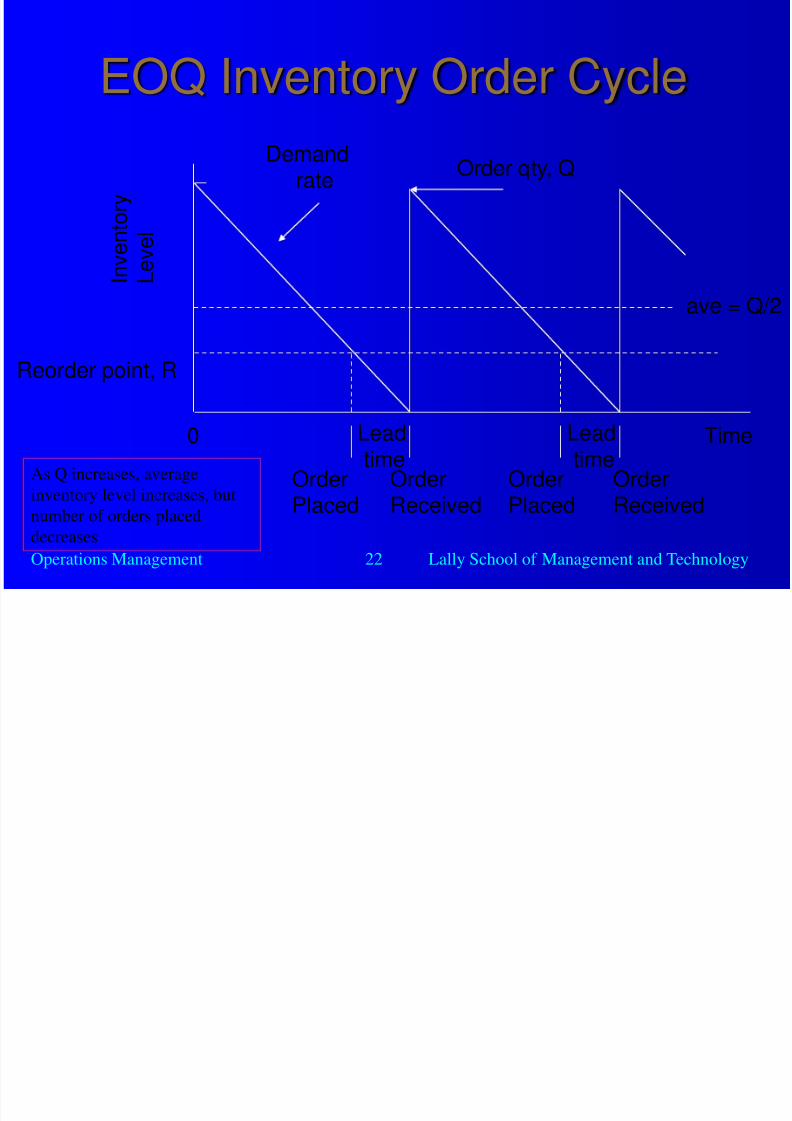
EOQ Inventory Order Cycle
Demandrate
0 TimeLeadtime
Leadtime
OrderPlaced
OrderPlaced
OrderReceived
OrderReceived
I n v e n t o r y
L
e v e l
Reorder point, R
Order qty, Q
As Q increases, average
inventory level increases, but
number of orders placed
decreases
ave = Q/2
8/4/2019 19 Inventory
http://slidepdf.com/reader/full/19-inventory 23/29
Operations Management 23 Lally School of Management and Technology
Total Cost of Inventory – EOQ Model
Answer to Inventory Management
8/4/2019 19 Inventory
http://slidepdf.com/reader/full/19-inventory 24/29
Operations Management 24 Lally School of Management and Technology
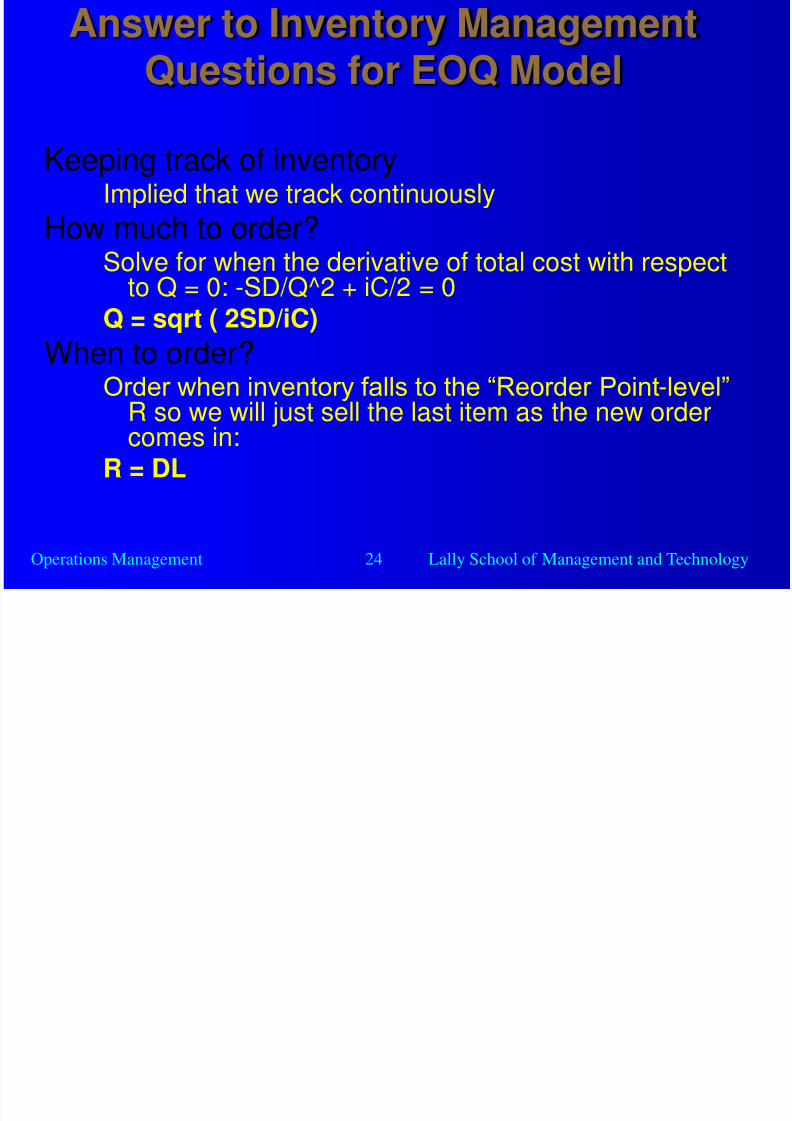
Answer to Inventory ManagementQuestions for EOQ Model
Keeping track of inventoryImplied that we track continuously
How much to order?Solve for when the derivative of total cost with respect
to Q = 0: -SD/Q^2 + iC/2 = 0Q = sqrt ( 2SD/iC)
When to order?Order when inventory falls to the “Reorder Point-level”
R so we will just sell the last item as the new ordercomes in:R = DL
8/4/2019 19 Inventory
http://slidepdf.com/reader/full/19-inventory 25/29
Operations Management 25 Lally School of Management and Technology
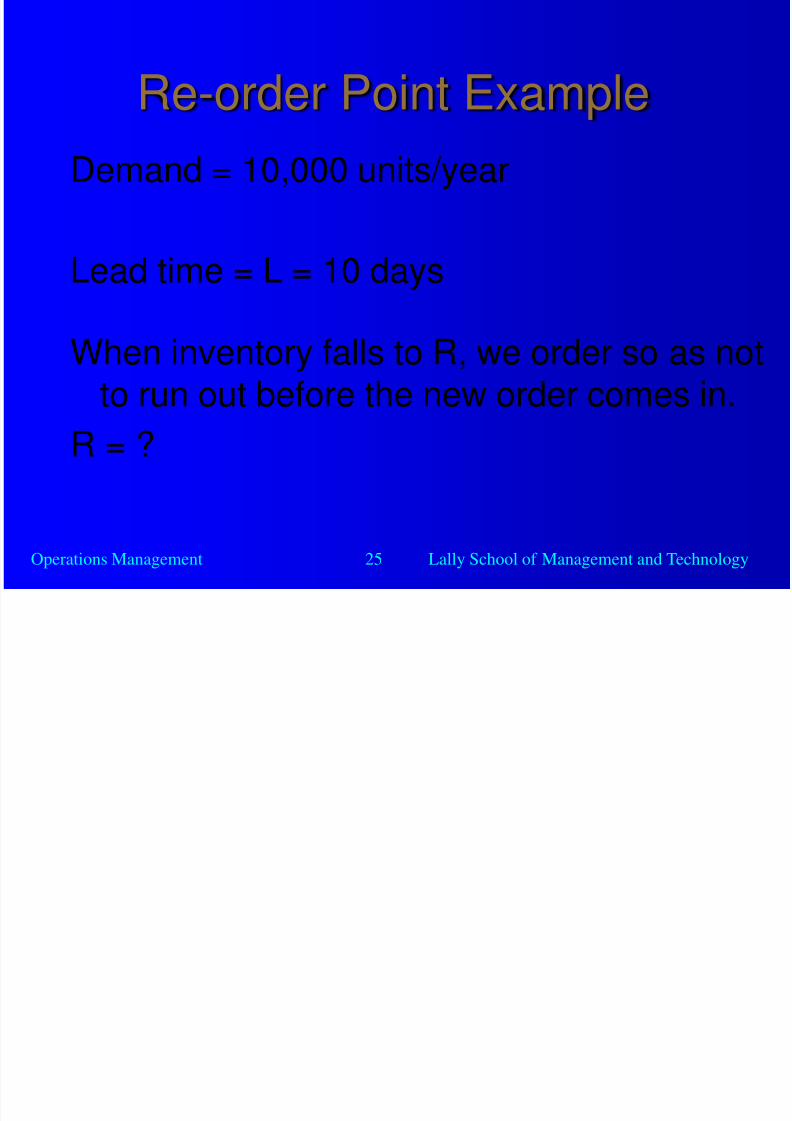
Re-order Point Example
Demand = 10,000 units/year
Lead time = L = 10 days
When inventory falls to R, we order so as notto run out before the new order comes in.
R = ?
8/4/2019 19 Inventory
http://slidepdf.com/reader/full/19-inventory 26/29
Operations Management 26 Lally School of Management and Technology
Re-order Point Example
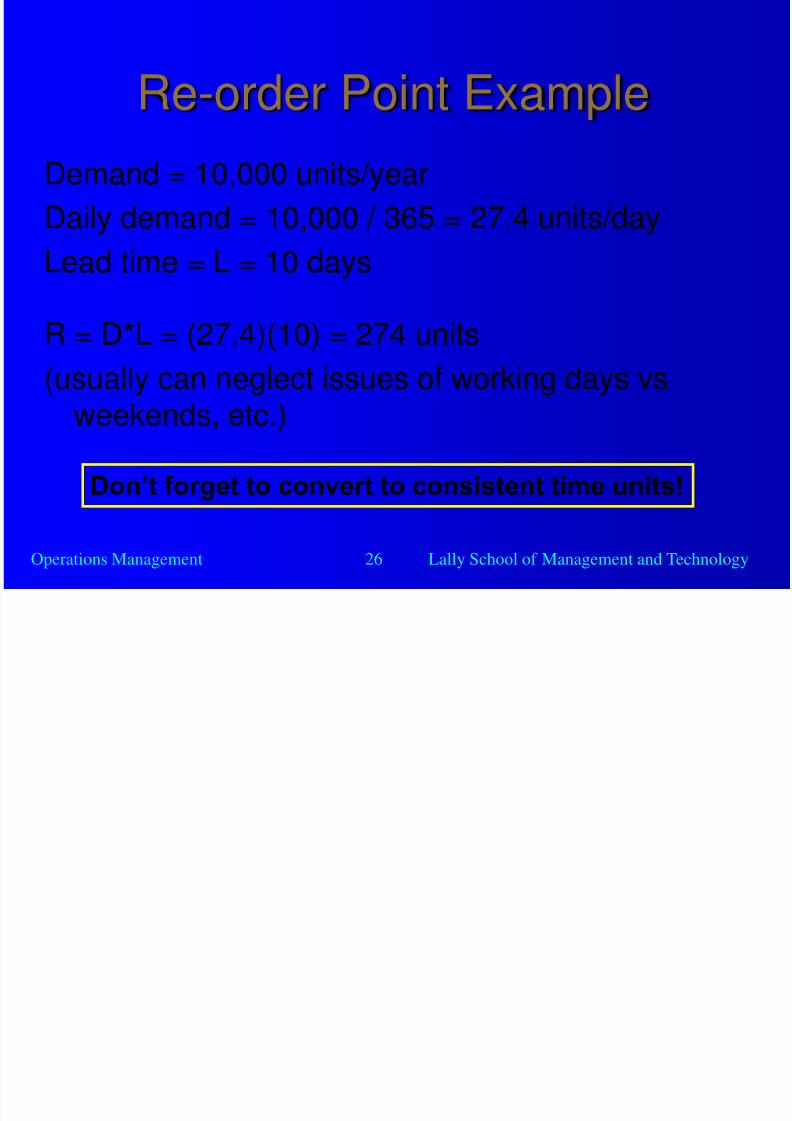
Demand = 10,000 units/year
Daily demand = 10,000 / 365 = 27.4 units/day
Lead time = L = 10 days
R = D*L = (27.4)(10) = 274 units
(usually can neglect issues of working days vs
weekends, etc.)
Don’t forget to convert to consistent time units!
8/4/2019 19 Inventory
http://slidepdf.com/reader/full/19-inventory 27/29
Operations Management 27 Lally School of Management and Technology
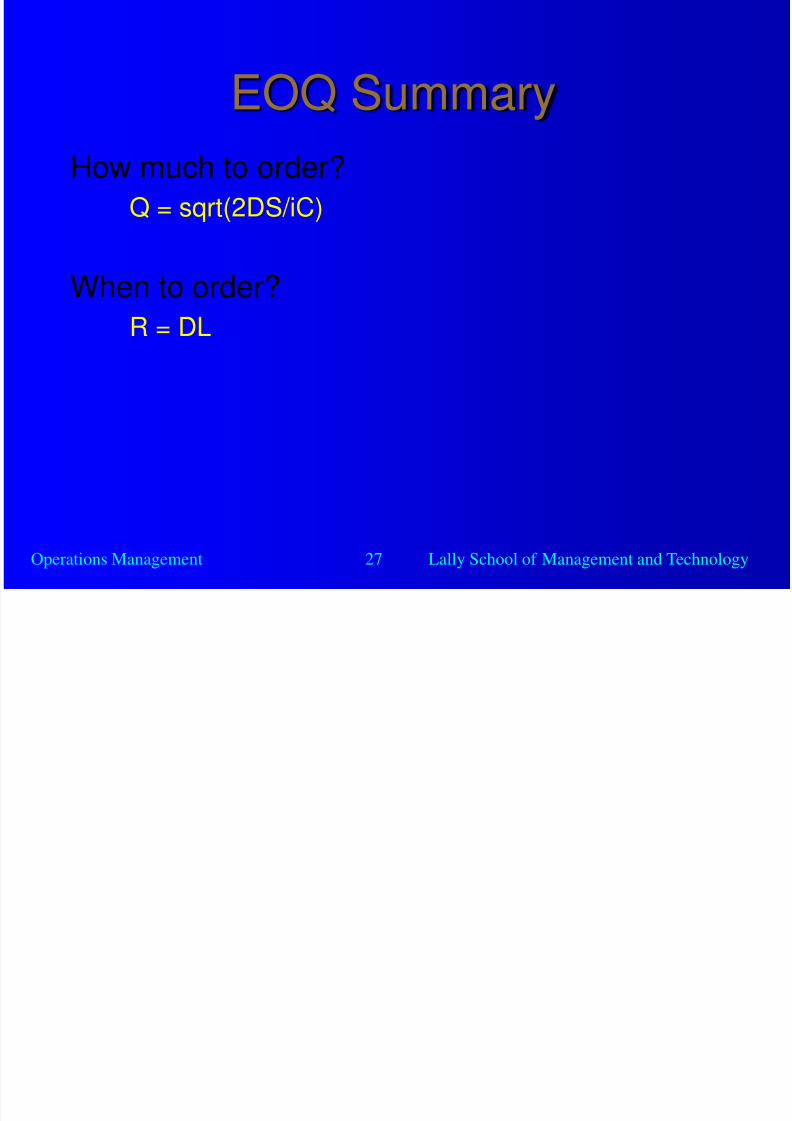
EOQ Summary
How much to order?
Q = sqrt(2DS/iC)
When to order?R = DL
8/4/2019 19 Inventory
http://slidepdf.com/reader/full/19-inventory 28/29
Operations Management 28 Lally School of Management and Technology
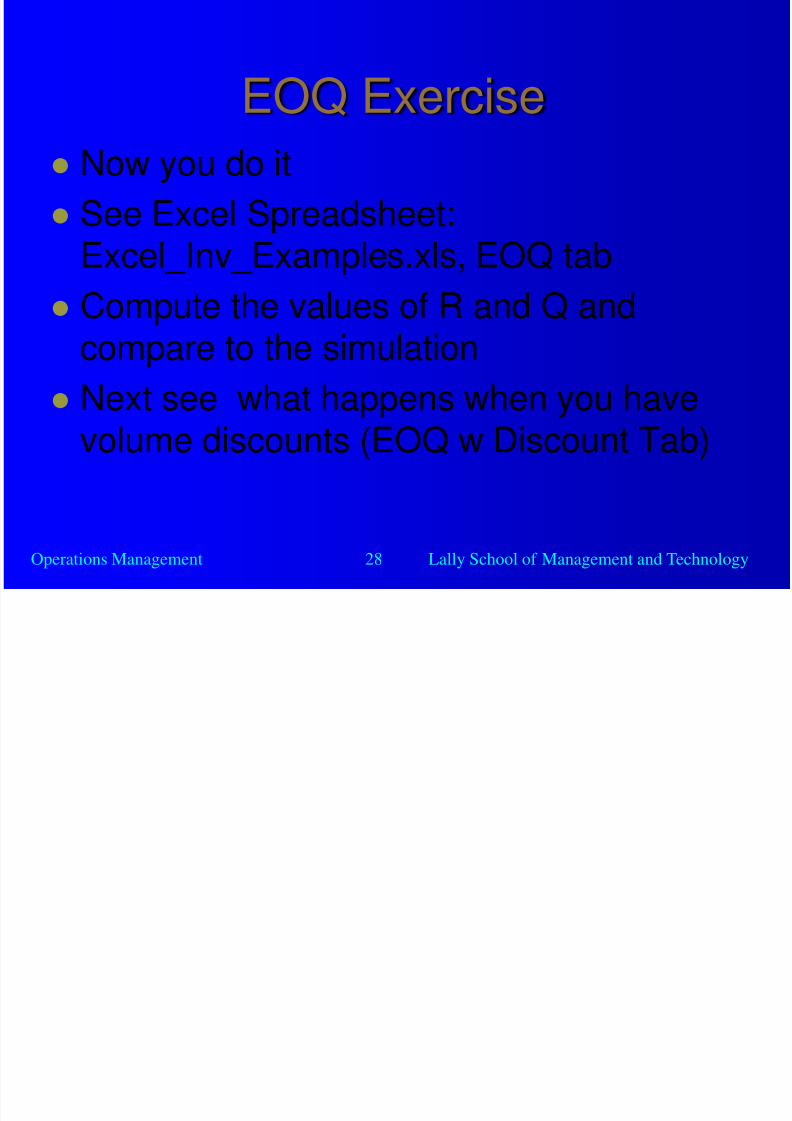
EOQ Exercise
Now you do it
See Excel Spreadsheet:Excel_Inv_Examples.xls, EOQ tab
Compute the values of R and Q andcompare to the simulation
Next see what happens when you havevolume discounts (EOQ w Discount Tab)
8/4/2019 19 Inventory
http://slidepdf.com/reader/full/19-inventory 29/29
Operations Management 29 Lally School of Management and Technology
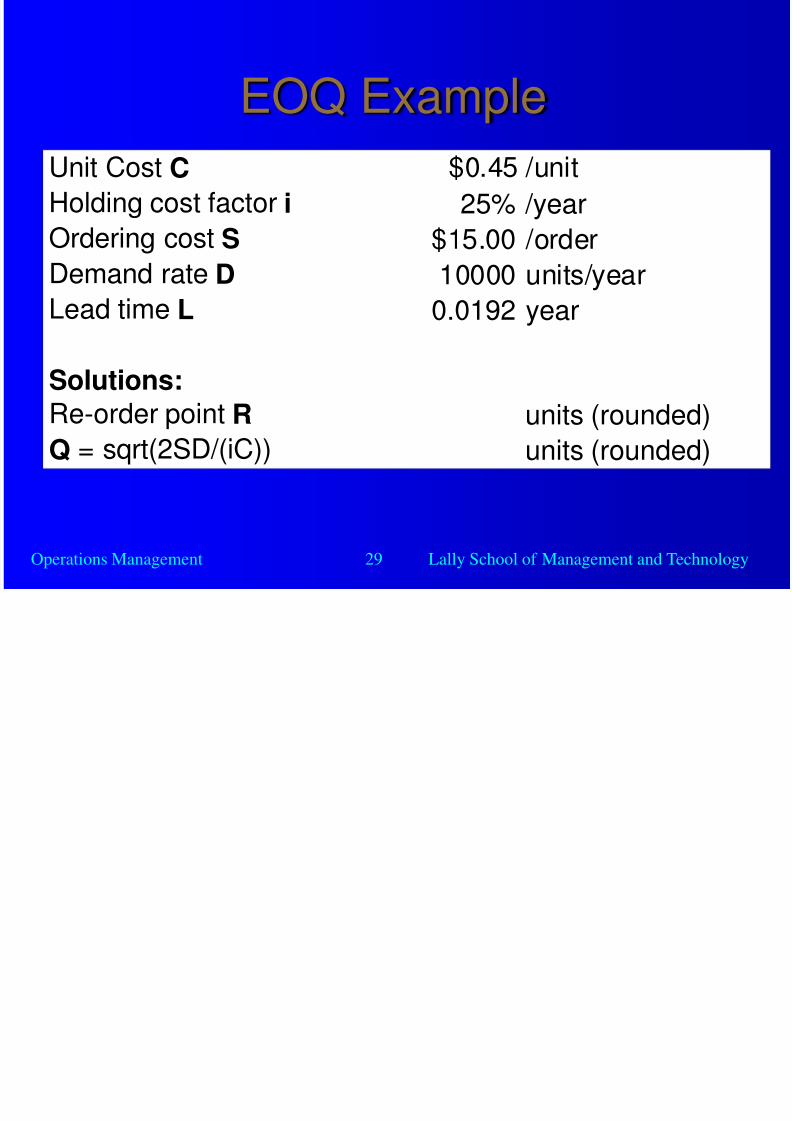
EOQ Example
Unit Cost C $0.45 /unit
Holding cost factor i 25% /yearOrdering cost S $15.00 /order
Demand rate D 10000 units/yearLead time L 0.0192 year
Solutions:
Re-order point R units (rounded)Q = sqrt(2SD/(iC)) units (rounded)
Recommended