Presented By:
Indian Farmers Fertiliser Cooperative Ltd.
Phulpur Unit-I30th August – 1st September, 2017
18th National Award for Excellence
in Energy Management - 2017

Installed/Revamped Annual Capacity (‟000 MT)
IFFCO: At a Glance
Urea : 4242.2
NP/NPK/DAP : 4335.4
Total „N‟ : 2630.7
Total „P2O5‟ : 1719.4
WSFs : 15.0
Zinc Sulphate Monohydrate : 30.0
Contributed about 21% to the total „N‟ and 31.8% to the total “P2O5”
produced in the Country during the year 2016-17.
IFFCO was established as the farmers‟ own initiative in Cooperative Sector on 3rd Nov. 1967
Largest producer of fertilisers in the country.
Nos. of Plant : Five (Kandla, Kalol, Phulpur, Aonla, Paradeep )
2

4

IFFCO Phulpur Unit-I : Profile
Plant Ammonia Urea
Process Licenser
MW Kellog, U.S.A
SnamprogettiItaly
DailyCapacity(MTPD)
1215 2115
AnnualCapacity(Lakhs MT)
4.0 7.0
Till Date Production(Lakhs MT)
119 205
5

Bagging Plant
COALRLNG
Utility Boiler
HP Steam
Power
Ammonia Plant
RLNG
AmmoniaCO2
Neem Urea
Urea Plant
HP
Steam
RAIL
ROAD
IFFCO Phulpur Unit-I : Production Outline
HP Steam
GTG-HRSG
6

3.853.34
4.32
3.49
4.4
6.52
5.78
7.58
6.32
7.65
0.0
1.0
2.0
3.0
4.0
5.0
6.0
7.0
8.0
9.0
2013-14 2014-15 2015-16 2016-17 2017-18
Ammonia Urea
Highest Ever Yearly Urea Production
3.11
1.89
ESTIMATED
Actual TillDate
Phulpur-I: Production Performance
7
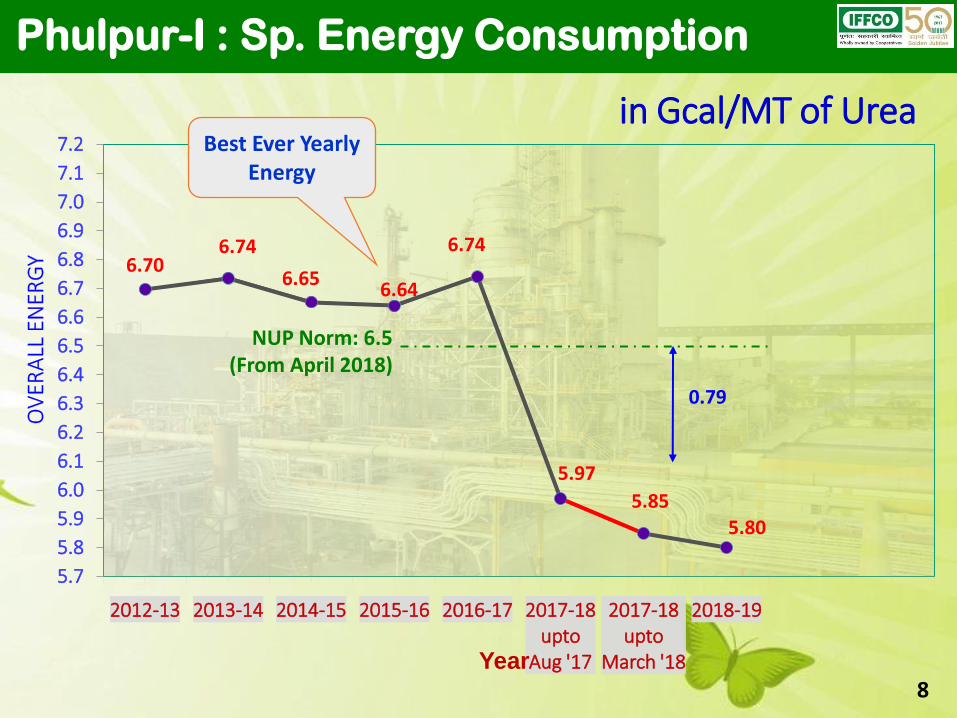
in Gcal/MT of Urea
Phulpur-I : Sp. Energy Consumption
6.706.74
6.656.64
6.74
5.97
5.855.80
5.7
5.8
5.9
6.0
6.1
6.2
6.3
6.4
6.5
6.6
6.7
6.8
6.9
7.0
7.1
7.2
2012-13 2013-14 2014-15 2015-16 2016-17 2017-18 upto
Aug '17
2017-18 upto
March '18
2018-19
Year
0.79
NUP Norm: 6.5(From April 2018)
Best Ever Yearly Energy
8

Major Energy Saving Schemes Implemented in
2016-17
S.No Energy Saving Schemes Energy Saving (Gcal)
Monetary Saving
(Rs. Lakh)
Investment
(Rs. Lakh)
1 Installation of New Gas Turbine Generator (GTG) - Heat Recovery Steam Generation (HRSG)
251262 7287 23914
2 Modification in CO2 RecoveryProcess- aMDEA Process in placeof Benfield Process
136851 3969 19004
3 Installation of New MediumPressure Process condensatestripper (1104-E)
73442 2130 1032
4 Old Synthesis Gas Converter(105-D) Internal Revamp
48961 1420 1331
5 Installation of Ammonia recoverysection to recover ammonia fromoff gases of synthesis loop
24481 710 1025
9
Major Energy Saving Schemes Implemented in
2016-17
S.No Energy Saving Schemes Energy Saving (Gcal)
Monetary Saving
(Rs. Lakh)
Investment
(Rs. Lakh)
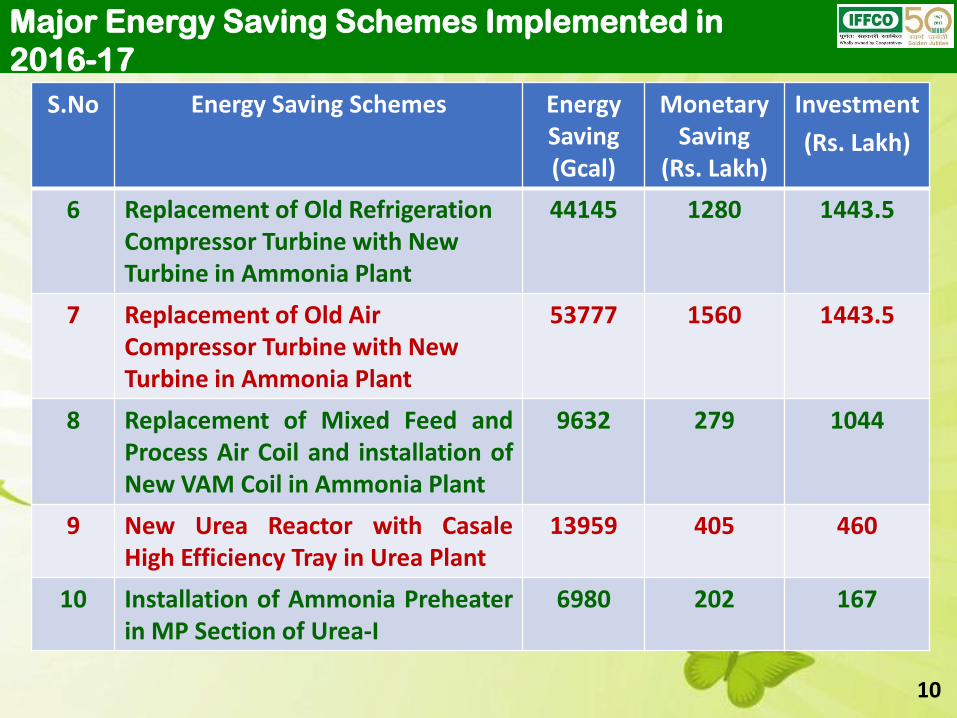
6 Replacement of Old Refrigeration Compressor Turbine with New Turbine in Ammonia Plant
44145 1280 1443.5
7 Replacement of Old Air Compressor Turbine with New Turbine in Ammonia Plant
53777 1560 1443.5
8 Replacement of Mixed Feed andProcess Air Coil and installation ofNew VAM Coil in Ammonia Plant
9632 279 1044
9 New Urea Reactor with CasaleHigh Efficiency Tray in Urea Plant
13959 405 460
10 Installation of Ammonia Preheaterin MP Section of Urea-I
6980 202 167
10
Major Energy Saving Schemes Implemented in
2016-17
S.No Energy Saving Schemes Energy Saving (Gcal)
Monetary Saving
(Rs. Lakh)
Investment
(Rs. Lakh)
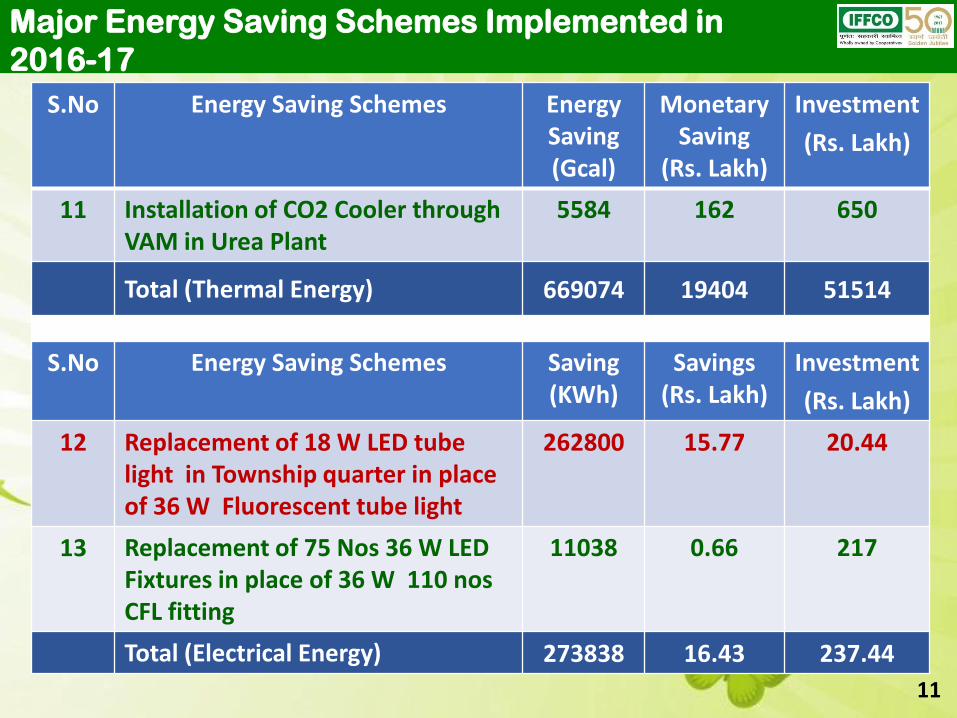
11 Installation of CO2 Cooler through VAM in Urea Plant
5584 162 650
Total (Thermal Energy) 669074 19404 51514
S.No Energy Saving Schemes Saving (KWh)
Savings (Rs. Lakh)
Investment
(Rs. Lakh)
12 Replacement of 18 W LED tube light in Township quarter in place of 36 W Fluorescent tube light
262800 15.77 20.44
13 Replacement of 75 Nos 36 W LED Fixtures in place of 36 W 110 nosCFL fitting
11038 0.66 217
Total (Electrical Energy) 273838 16.43 237.44
11

1. Installation of New GTG-HRSG
Key Features
Power Generation: 25 MW
Steam Generation: 60 MTPH
RLNG Saving : 3600 Sm3/Hr
Energy saving : 0.36 GCal/MT of Urea
Monetary saving :Rs. 73 Cr.
Investment :Rs. 239 Cr.
The new GTG is catering the total power demand (24 MW) of the
Phulpur Complex and existing Steam driven Turbo-generators TG-I
and TG-II have been stopped.
The 60 MT HP steam generated from HRSG is being used in
process plants 12

2. Modification in CO2 Recovery Processs
• With modification in CO2 Removal Section from Benfield to aMDEA,
Regeneration Energy of CO2 has reduced from 950 Kcal/NM3 of CO2
to 450 Kcal/Nm3 of CO2.
• Yearly Saving (Gcal) : 136851
• Yearly Saving (Rs. Crore) : 39.69
• Investment (Rs. Crore) : 190
Modification in CO2 Recovery Process
-aMDEA Process
New HP/LP Flash Tower
New CO2 Bulk Absorber
Modified HP Stripper
CO2 Lean Absorber
Old LP Stripper
dismantled
CO2 Strippers
CO2 Absorber
13

3. Installation of New Medium Pressure
Process Condensate Stripper (1104-E)
• In the Low Pressure Steam Process Condensate Stripper, around 8
MT/Hr of LP Steam was being consumed for Stripping.
• In new Medium Pressure Stripper, MP Steam is used as Process
Steam.
• Yearly Saving (Gcal) : 73342
• Yearly Saving (Rs. Crore) : 20.3
• Investment (Rs. Crore) : 10.3
New MP StripperOld LP Stripper
14

4. Synthesis Gas Converter Internal Revamp
New Converter Internals
Ammonia Conversion:Particular Old Converter
105-D(Out)
Before (%) 15.48
After Revamp (%) 17.32
Due to internal revamp, the
conversion efficiency of ammonia in
converter is increased & the recycle
gas flow rate is reduced which
resulted saving of Power in
Synthesis Gas Compressor.
• Yearly Saving (Gcal) : 48961
• Yearly Saving (Rs. Crore) : 14.2
• Investment (Rs. Crore) : 13.3
15

5. Installation of Ammonia recovery section
New Ammonia DistillationColumn (1501-E)
• Ammonia recovery section has
been installed to recover ammonia
from off gases of synthesis loop
under Energy Saving Schemes.
• Earlier, Off gases from Synthesis
loop was sent to Primary Reformer
& used as a fuel but after
implementation of this scheme
ammonia in Off gases has been
recovered & thereby reduction in
specific energy consumption.
• Yearly Saving (Gcal) : 24481
• Yearly Saving (Rs. Crore) : 7.10
• Investment (Rs. Crore) : 10.25
16

6. Installation of new Refrigeration Compressor
Turbine in place of old Turbine
New Refrig. Compressor Turbine
• Inefficient Old Refrigeration
Compressor Turbine has been
replaced with New efficient
Turbine which has resulted in
reduction in Specific Steam
consumption.
• Yearly Saving (Gcal) : 44145
• Yearly Saving (Rs. Crore) : 12.8
• Investment (Rs. Crore) : 14.4
17

7. Installation of new Process Air Compressor
Turbine in place of old Turbine
New Process Air Compressor Turbine
• Inefficient Old Refrigeration
Compressor Turbine has been
replaced with New efficient
Turbine which has resulted in
reduction in Specific Steam
consumption.
• Yearly Saving (Gcal) : 53777
• Yearly Saving (Rs. Crore) : 15.6
• Investment (Rs. Crore) : 14.4
18

8. Replacement of Primary Reformer Convection
Section Coils and new VAM Coil
• For higher heat recovery, old Mixed feed & Process Air coil has
been replaced with new coils in convection section of Primary
Reformer. Additional a new VAM Coil has been installed where the
process condensate is heated and this heated Process
condensate is utilized in VAM Machine. .
• Yearly Saving (Gcal) : 9632
• Yearly Saving (Rs. Crore) : 2.8
• Investment (Rs. Crore) : 10.419

9. New Urea Reactor High Efficiency Trays
• New Urea Reactor with High
Efficiency Trays (HET) in Urea
Plant has been installed.
• The function of the HET trays is to
increase the CO2 conversion, by
improving the heat and mass
transfer phenomena occurring
inside the reactor.
• Yearly Saving (Gcal) : 13959
• Yearly Saving (Rs. Crore) : 4.0
• Investment (Rs. Crore) : 4.6
High Efficiency Trays
20
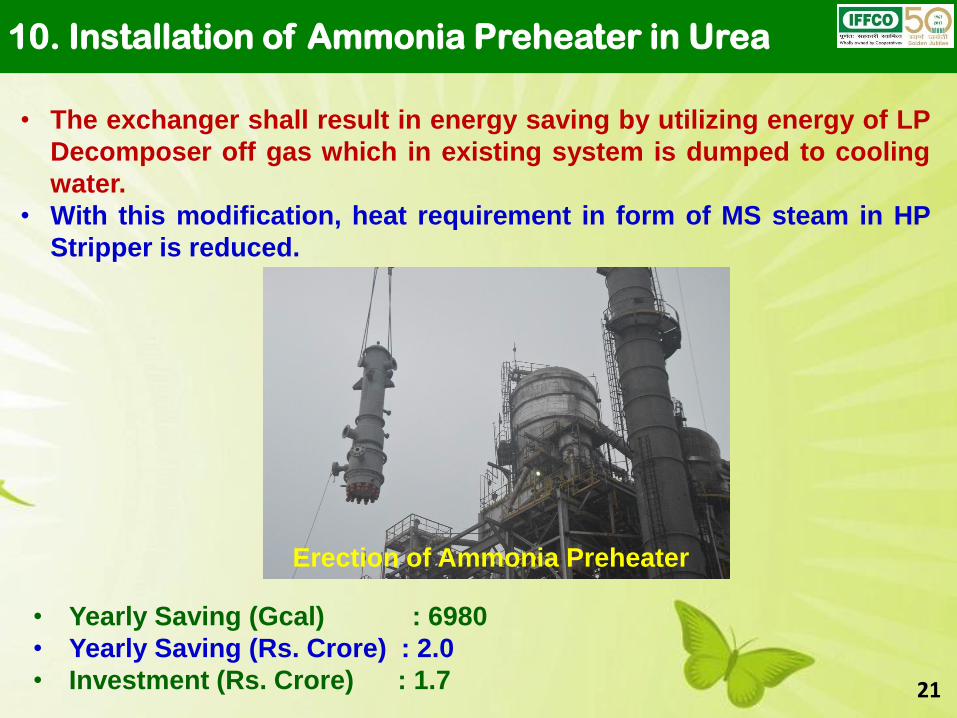
10. Installation of Ammonia Preheater in Urea
• The exchanger shall result in energy saving by utilizing energy of LP
Decomposer off gas which in existing system is dumped to cooling
water.
• With this modification, heat requirement in form of MS steam in HP
Stripper is reduced.
• Yearly Saving (Gcal) : 6980
• Yearly Saving (Rs. Crore) : 2.0
• Investment (Rs. Crore) : 1.7
Erection of Ammonia Preheater
21

11. Installation of CO2 Cooler through VAM
• A Vapour Absorption Machine (VAM) is installed to generate chilled
water required for CO2 Gas chiller at the suction of CO2 Compressor
of Urea plant, resulting in saving of steam consumption in CO2
Compressor turbine of Urea plant.
VAM CO2 Cooler
Chilled Water
Return Water
• Yearly Saving (Gcal) : 5584
• Yearly Saving (Rs. Crore) : 1..6
• Investment (Rs. Crore) : 6.5 22

Other Energy Saving Schemes
Yearly Savings
Power : 262800 kWh
Saving : Rs. 15.7 Lakh
Investment : Rs. 20.4 Lakh
22
(A) Replacement of 18 W LED tube light
in place of 36 W Fluorescent tube
light
(B) Replacement of 75 Nos 36 W LED
Fixtures for Control rooms in place of
36 W 110 nos CFL fitting
Yearly Savings
Power : 11038 kWh
Saving : Rs. 0.66 Lakh
Investment : Rs. 2.1 Lakh
23

INNOVATIVE SCHEME
• Utilization of waste heat of process condensate from Urea Plants to
generate chilled water through VAM. This chilled water is being used
for suction chilling of GTG Air which has helped to augment GTG
Capacity by 4 MW and running additional motor driven pump instead
of turbine driven pumps.
• Removal of check valve in the low pressure (0.65 kg/cm2g) CO2 gas
line between Ammonia & Urea Plant (HAZOP is essential) which
helped in increment of CO2 Compressor Suction Pressure by 0.04
kg/cm2. This has resulted in HP Steam saving of 1.8 MT/Hr equivalent
to 11120 Gcal / Annum.
• Utilization of excess chilled water available in the complex to reduce
CW temperature at the suction of syn gas cooler by installing spare
plate type exchanger which helped to reduce the syn gas temperature
at suction of compressor by 3 degC.
24

ROADMAP FOR ENERGY CONSERVATION
25
2018-19 2019-20 2020-21
1. Installation of
additional Syn loop waste
heat boiler for additional
process steam
production.
1. No planned Annual
shutdown to avoid
unproductive energy
consumption in the tune
of 0.05 Gcal/MT of Urea
which means special care
to be taken in maintaining
the Cooling water quality
and optimization of
process plants with
minimum variation.
1. Replacement of 40
years old CO2
Compressor Turbine
with highly efficient
Turbine.
2. Replacement of LT
Superheat coil in Primary
Reformer Convection
Section for higher steam
consumption and
bringing down the stack
temperature to around
130 degC.
3. Replacement of
Secondary Reformer Air
Burner for reduced Air
Compressor Discharge
Pressure.

6.57
5.49
7.50
6.18
1.010
0.950
0.9900.979
0.60
0.65
0.70
0.75
0.80
0.85
0.90
0.95
1.00
1.05
1.10
4.5
5.0
5.5
6.0
6.5
7.0
7.5
8.0
8.5
2013-14 2014-15 2015-16 2016-17
Sp
. C
O2 E
mis
sio
n M
T/M
T
CO
2 E
mis
sio
n in
Lakh
MT
Year
Carbon Foot Print
26

Benchmarking with other Fertilizer Plants
• The fertilizer sector has been divided in the respective Vintage
Groups by Department of Fertilizer based on the year of
commissioning and the original feed stock.
• IFFCO Phupur-I had original technology of the 70‟s and Naphtha as
feed stock.
• Based on the same, our SEC norm shall be less than 6.5 Gcal/MT.
• With SEC of 5.85 Gcal/MT of Urea, IFFCO Phulpur is sitting on top of
the chart.
27

• Product Steward Excellence Certification
by International Fertilizer Association (IFA).
INTERNATIONAL ACCREDITATIONS
28
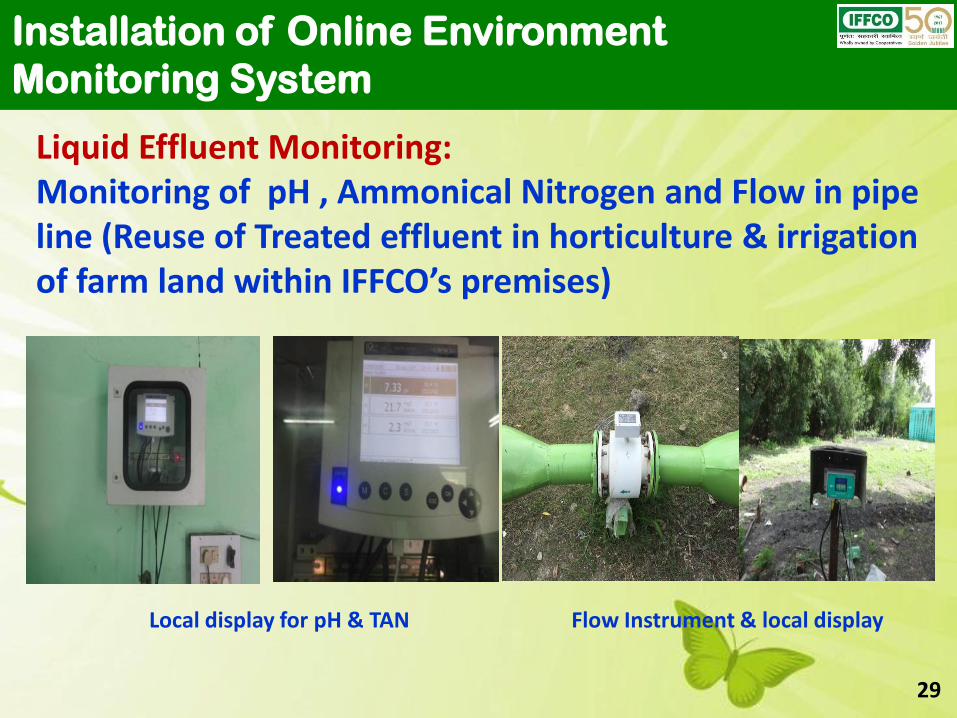
Installation of Online Environment
Monitoring System
Local display for pH & TAN
Liquid Effluent Monitoring: Monitoring of pH , Ammonical Nitrogen and Flow in pipe line (Reuse of Treated effluent in horticulture & irrigation of farm land within IFFCO’s premises)
Flow Instrument & local display
29
Installation of Online Environment
Monitoring System
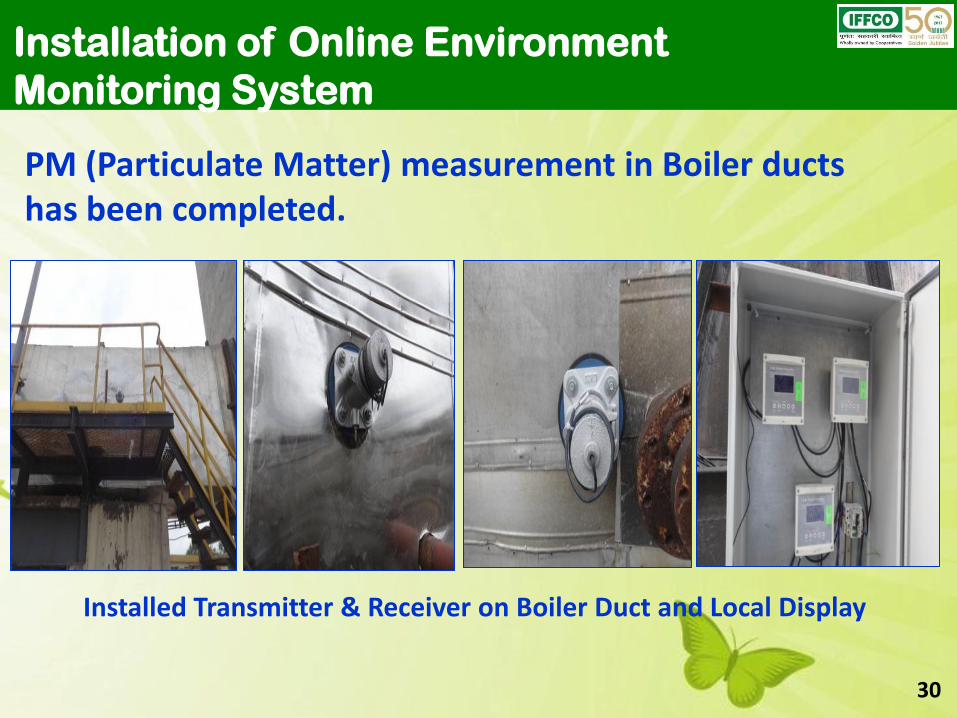
Installed Transmitter & Receiver on Boiler Duct and Local Display
PM (Particulate Matter) measurement in Boiler ducts has been completed.
30

Raw Water Consumption
5.0
5.5
6.0
6.5
7.0
7.5
8.0
8.5
9.0
Raw
Wat
er
, M3
/ M
T o
f U
rea
Year
CPCB Benchmark : 12 M3 / MT Urea
National Benchmark (FAI) : 7.3 M3 / MT Urea
Reduction : 47%
31
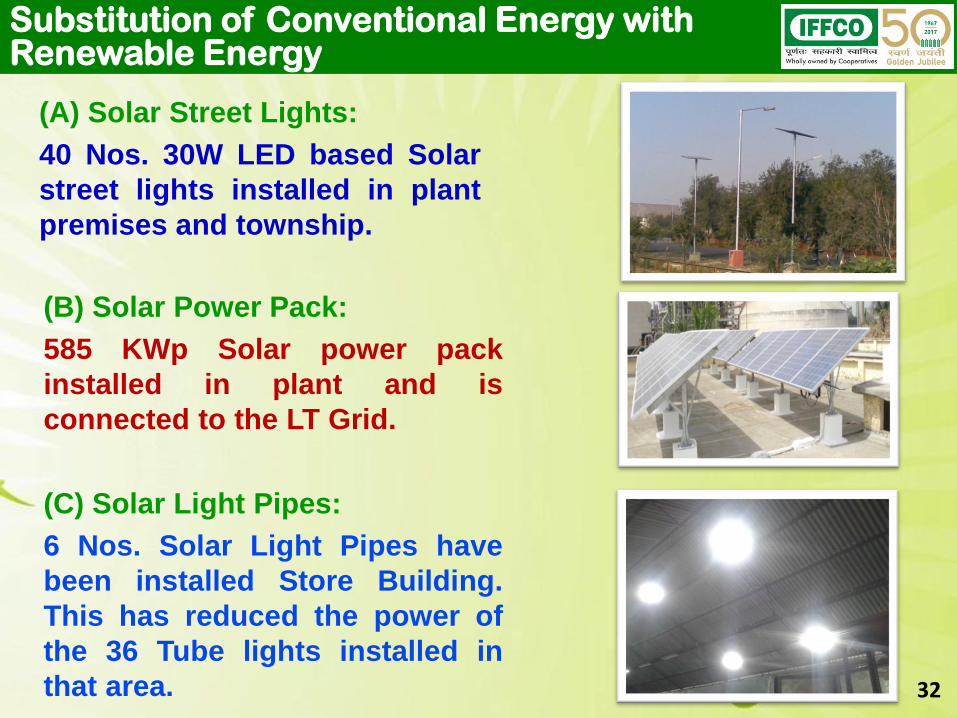
(A) Solar Street Lights:
40 Nos. 30W LED based Solar
street lights installed in plant
premises and township.
(B) Solar Power Pack:
585 KWp Solar power pack
installed in plant and is
connected to the LT Grid.
Substitution of Conventional Energy withRenewable Energy
(C) Solar Light Pipes:
6 Nos. Solar Light Pipes have
been installed Store Building.
This has reduced the power of
the 36 Tube lights installed in
that area. 32

Substitution of Conventional Energy withRenewable Energy
(D) Solar water Heaters
6 Nos. Water Heater in GuestHouse
(E) Bio-Methanation Plant
Capacity : 25 m3/day
33
Environment & Sustainability
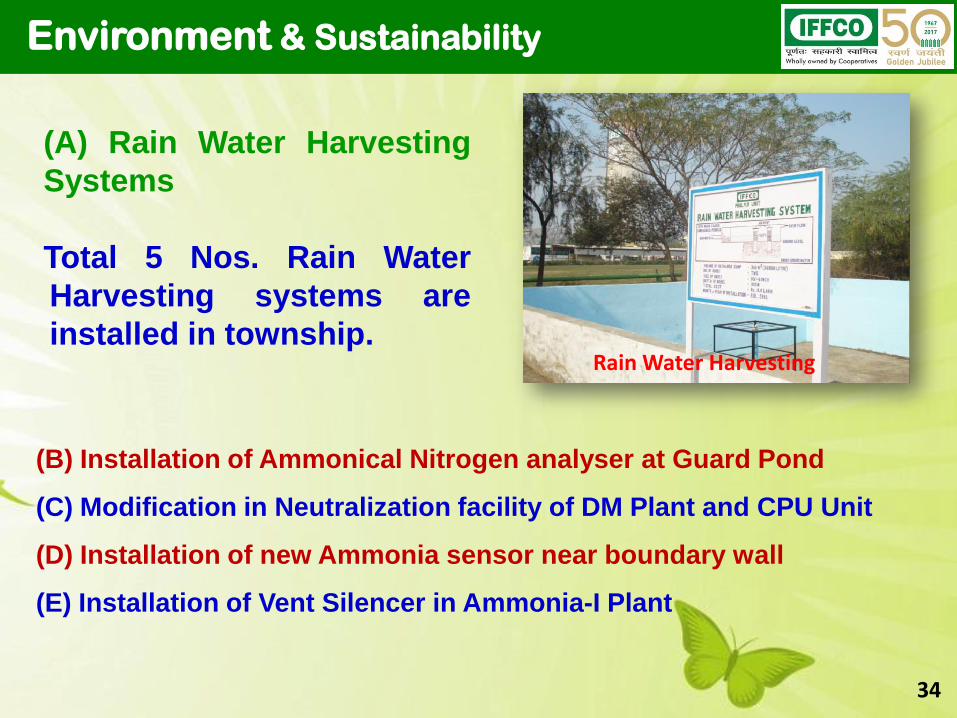
(A) Rain Water Harvesting
Systems
Total 5 Nos. Rain Water
Harvesting systems are
installed in township.Rain Water Harvesting
(B) Installation of Ammonical Nitrogen analyser at Guard Pond
(C) Modification in Neutralization facility of DM Plant and CPU Unit
(D) Installation of new Ammonia sensor near boundary wall
(E) Installation of Vent Silencer in Ammonia-I Plant
34
35

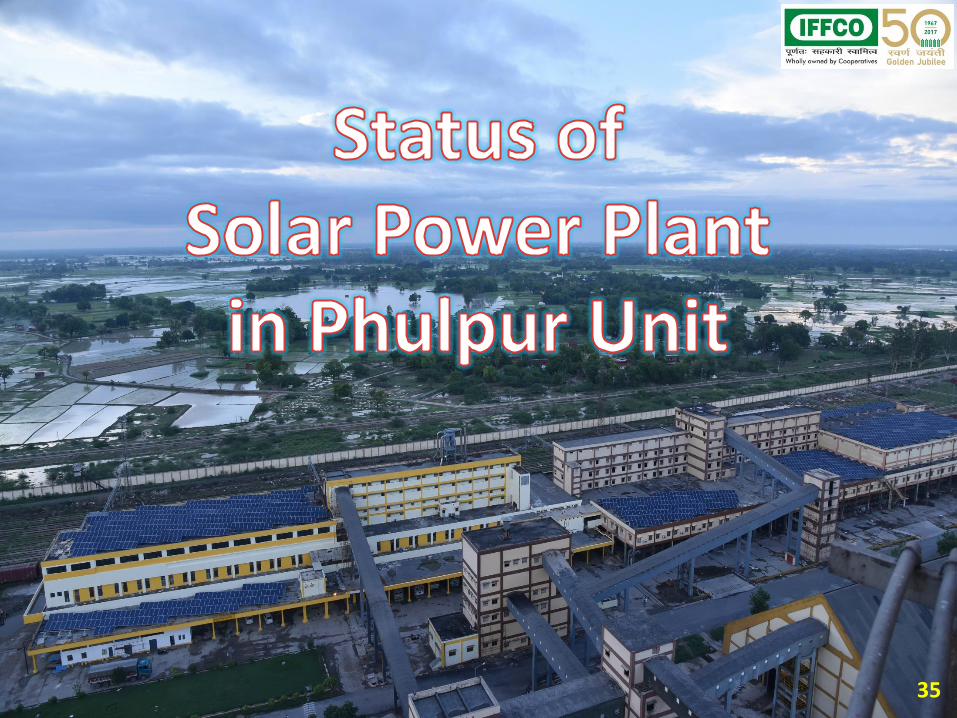
Solar Power Plant Installation Status:
• Two Units of Solar Power Plant of Capacity 585 KWp (235 KWp +350 KWp) were commissioned in the January and February 2016,respectively.
• Both the Solar Power Units are in continuous operationgenerating Electic Power in the tune of 740 KWh and 1140 KWhon daily basis.
• Additional Project for installation of 800 KWp Solar Power Panelscomprising of 7 different locations is in under progress.
36
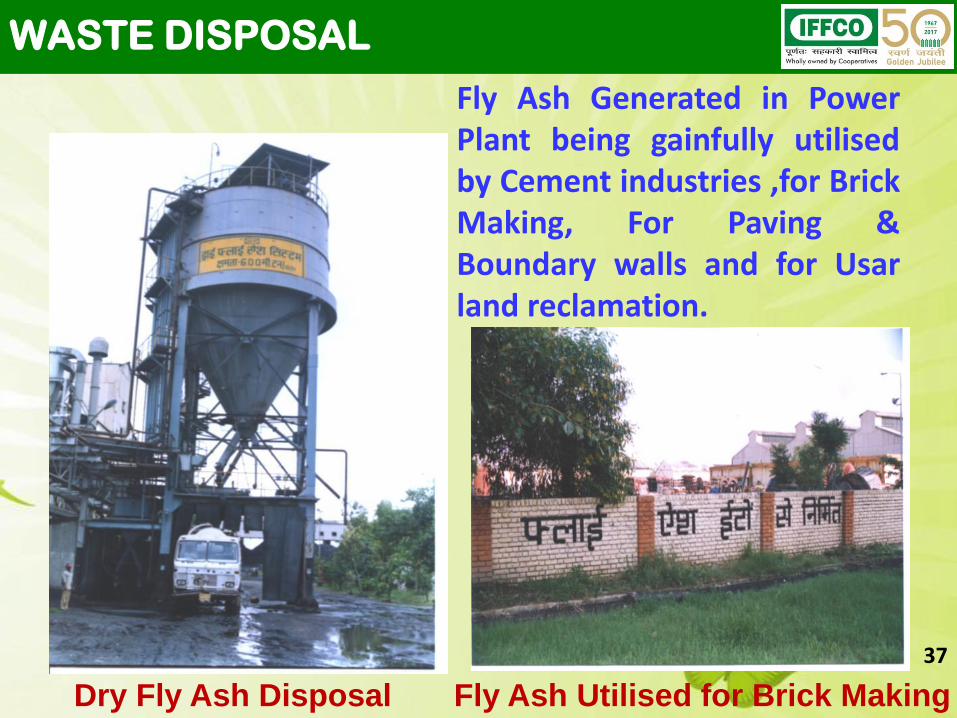
Fly Ash Utilised for Brick MakingDry Fly Ash Disposal
Fly Ash Generated in PowerPlant being gainfully utilisedby Cement industries ,for BrickMaking, For Paving &Boundary walls and for Usarland reclamation.
WASTE DISPOSAL
37

Kitchen and Horticulture Waste Bio degradable wastesfrom kitchen and horticulture are converted into verygood manure by vermi composting System. The manure isused in horticulture, green belt area & 150 Acres farmland
Vermi Compost Pits
WASTE DISPOSAL
38

No. of Reports are generated on daily/weekly/monthly/ quarterlyand yearly basis for Reporting & Monitoring the EnergyConsumption:
Daily• Performance Report• Steam Balance Report• Cost report of Ammonia, Urea and Steam & Power
generation Plant
Weekly• Weekly performance Report
Monthly
• Variance report actual vs. targeted as well as last year
• Form ECS/GC 4 to assess profitability
Monitoring & Reporting System
39

Sample Performance Reports
40

Employee Engagement
IFFCO Phulpur Unit encourages its employees through
Suggestion Scheme to give ideas of energy conservation
Approx. 1000 suggestions are received every year from
employees.
Selected suggestion are awarded by the management.
A View of Suggestion Award Ceremony on Republic Day 41

Procurement Process
IFFCO Phulpur has taken care of Energy optimization right from Procurement
process among Vendors / Suppliers / Contractors
The Evaluation of a Bid is done on the basis of Operating Cost
Loading is be done to take care of the Performance and Productivity of
equipment offered.
In case the consumption of utilities are different for different
Bidders. Extra operating cost over the minimum one shall be calculated as
below for loading.
Operating cost = Difference in utilities consumption x Unit cost of
Utility x 8760 x 0.9 x 5.5860 x NWhere:
8760 is number of available hours in a year
0.9 is availability factor
5.5860 is discount factor at an interest rate of 10% per annum for
one year erection/commissioning and ten years operational period.
N is the number of operating equipment items.
42

National Energy Conservation Award- 2016 : 2nd Prize
Awards & Recognition
43

FAI Environment Protection Award : Joint Winner
Awards & Recognition
44

45
46
Recommended
![Service Manual · Service Manual SiUS711114 [Applied Models] VAM 300GVJU VAM 470GVJU VAM 600GVJU VAM1200GVJU Energy Recovery Ventilator](https://img.pdfslide.us/doc/110x75/5b8f613509d3f20e308c4cbc/service-manual-service-manual-sius711114-applied-models-vam-300gvju-vam-470gvju.jpg)