Facilities Management
FM Key Performance Indicators
November 21, 2017

Facilities Management Key Volume Indicators
1
Key Volume FM Change Evanston ChicagoFull Time Equivalent (FTE) 371 +1 302 69Acres 296 0 281 15Buildings 222 0 204 18Square Feet 15.1M 0.0M 10.1M 5.0MNumber of Open Projects 78 0 66 12
Design 29 0 20 9Construction 15 0 12 3Punchlist 19 0 19 0Closeout 15 0 15 0
Value of Open Projects $2.5B $0.0B $1.9B $0.6BDesign $0.6B $0.0B $0.5B $0.1BConstruction $1.2B $0.0B $0.7B $0.5BPunchlist $0.5B $0.0B $498.4M $0.0MCloseout $0.2B $0.0B $234.9M $0.0M
Work Orders Per Reporting Month 7,813 +7.5% 5,986 1,827Work Orders Per Rolling 12 Months 74,242 +1.8% 55,812 18,430Operations and Maintenance $59.6M $0.0M $40.9M $18.7M

Key Performance Indicators
2
KPI Description Annual Goal Oct-17 Goal Actual TrendSD1. Service Request Closure 90% 78% 81% TBDSD2. Preventative Maintenance Closure 75% 77% 80% 4%SD3. Proactivity: FM-Identified Work Orders 30% 30% 29% 3%LO1. Common Space Program 10% 5% 5% 0%LO2. Facilities Connect Implementation 90% 57% 47% 4%LO3. Engagement: Sustainability Outreach 15% 3% 8% -1%CE1. Energy Use Intensity (kBtu/SF) -5% -5% -4% TBDCE2. Recordable Injury Incident Rate 2.90 2.90 3.70 -0.24CE3. Injury-Related Lost Workday Rate 1.34 1.34 0.62 -0.51CE4. Waste Diversion Rate 42% 42% 42% -3%CE5. Overtime <5% <5% 14% -4%CE6. Minority and Female Enterprise Use 15% 15% TBD TBDCE7. Local Business Enterprise Use 15% 15% TBD TBDCE8. Evanston Resident Employment 5% 5% 1% -1%F1. Capital Project Cash Flow Execution +/-2% +/-2% 16% -18%F2. FM Operating Budget Execution +/-1% +/-1% TBD TBDF3. Utility Commodity Budget Execution +/-5% +/-5% -19% TBDF4. Invoices: Number of Days to Pay 90% 90% 80% 3%

SD1. Service Request Closure
3
• KPI goal is to have a yearly average of 90% of service work orders within 30 days (excluding project-related work orders)• f(staffing, contracted services, seasonal work order volume variations, closeout procedures, service provider productivity,
parts/material availability, accessibility of work areas/equipment)• Initiatives: increase functionality of mobile technology; plan and schedule work order assignments including estimator and
kitter functions; adjust staffing levels to reflect workload; increase service provider productivity rates• FM Leader: James McKinney and Nadia Jackson
0
1,000
2,000
3,000
4,000
5,000
6,000
0%
10%
20%
30%
40%
50%
60%
70%
80%
90%
100%
Sep Oct Nov Dec Jan Feb Mar Apr May Jun Jul Aug
Tota
l Ser
vice
Wor
k O
rder
s (#
)
Serv
ice
Wor
k O
rder
s C
lose
d (%
)
Total Service Work Orders (#) Service Work Orders Closed (%) Service Work Orders Closed (%) Target

SD2. Preventative Maintenance Closure
4
0
500
1,000
1,500
2,000
2,500
0%
10%
20%
30%
40%
50%
60%
70%
80%
90%
100%
Sep Oct Nov Dec Jan Feb Mar Apr May Jun Jul Aug
Prev
enta
tive
Mai
nten
ance
W
ork
Ord
ers
(#)
Prev
enta
tive
Mai
nten
ance
W
ork
Ord
ers
Clo
sed
(%)
Preventative Maintenance Work Orders (#) Preventative Maintenance Work Orders Closed (%)Preventative Maintenance Work Orders Closed (%) Target
• KPI goal is to have yearly average of 75% of preventative maintenance tickets closed within 30 days• f(staffing, service provider productivity, planning and scheduling of work, accessibility of work areas/equipment, emergency
work, project and special event support)• Initiatives: plan and schedule preventative maintenance work assignments; revise task instructions; optimize recurring task
frequencies; adjust staffing levels to reflect workload• FM Leader: James McKinney and Nadia Jackson

SD3. Proactivity: FM-Identified Work Orders
5
• KPI goal is that at least 30% of corrective work orders are identified by Facilities Management Staff, as a measure of proactivity
• f(staffing, functionality of mobile technology, training)• Initiatives: expand commissioning and preventative maintenance programs; institute quality assurance and quality control
programs; increase functionality of mobile technology; implement a zone service model• FM Leader: James McKinney and Nadia Jackson
0%
10%
20%
30%
40%
50%
60%
70%
80%
90%
100%
Sep Oct Nov Dec Jan Feb Mar Apr May Jun Jul Aug
FM I
dent
ified
Wor
k O
rder
s (%
)
FM Identified Work Orders (%) FM Identified Work Orders (%) Target

0
50,000
100,000
150,000
200,000
250,000
300,000
350,000
400,000
450,000
Common Space Area Recapitalized (Square Feet) Common Space Area Recapitalized Target (Square Feet)
LO1. Common Space Program
6
• KPI goal is to recapitalize 55,000 square feet of common spaces per year.• f(funding availability, project staffing, efficient decision making, accessibility to work areas) • Initiatives: recapitalization of campus spaces• FM Leader: Carrie West
56,800 SF Impacted in FY17
Com
mon
Spa
ce A
rea
Rec
apit
aliz
ed ([
Squa
re F
eet)

LO2. Facilities Connect Implementation
7
0%
10%
20%
30%
40%
50%
60%
70%
80%
90%
100%
0%
10%
20%
30%
40%
50%
60%
70%
80%
90%
100%Se
p-16
Oct
-16
Nov
-16
Dec
-16
Jan-
17Fe
b-17
Mar
-17
Apr
-17
May
-17
Jun-
17Ju
l-17
Aug
-17
Sep-
17O
ct-1
7N
ov-1
7D
ec-1
7Ja
n-18
Feb-
18M
ar-1
8A
pr-1
8M
ay-1
8Ju
n-18
Jul-
18A
ug-1
8Se
p-18
Oct
-18
Nov
-18
Dec
-18
Impl
emen
tati
on B
udge
t (%
)
Impl
emen
tati
on C
ompl
etio
n (%
)
Implementation Budget (%) Implementation Completion (%) Implementation Completion (%) Target
• KPI goal is to complete 90% of project milestones by fiscal year 2018• f(stakeholder engagement, staffing, business process, IT capabilities, communication, effective decision making)• Initiatives: implement new integrated workplace management software; develop and implement process improvement;
utilize effective project management methodology • FM Leader: Liz Schaps

LO3. Engagement: Sustainability Outreach
8
• KPI goal is to increase newsletter subscription by 15% annually (1.25% per month); maintain open rate 10% above industry average
• Initiatives: actively promote newsletter across University communication; • FM Leader: Kathia Benitez
0
500
1,000
1,500
2,000
2,500
3,000
3,500
4,000
4,500
5,000
0%
10%
20%
30%
40%
50%
60%
70%
80%
90%
100%
New
slet
ter
Subs
crib
ers
(#)
New
slet
ter
Ope
n R
ate
Newsletter Subscribers (#) Newsletter Open Rate Newsletter Open Rate Target Newsletter Subscription Target

CE1. Energy Use Intensity
9
• KPI goal is to reduce the energy use intensity (EUI) by 20% by 2020 • f(occupant behavior, design, construction, technology, operations, weather)• Initiatives: engage occupants; formalize design specifications; perform retro-commissioning; physically audit space for
improvement• FM Leader: Kathia Benitez
0
50
100
150
200
250
300
350
Site
Ene
rgy
Use
Int
ensi
ty (k
Btu
/SF)
Site Energy Use Intensity (kBtu/SF) Site Energy Use Intensity (kBtu/SF) Target
CampusBaseline
EUI (12/10)
Current EUI
(8/17)
EUI Difference
% Reduction (2010
Baseline)Evanston 222 193 -29 12%Chicago 187 152 -35 19%Combined 210 180 -30 14%

CE2. Recordable Injury Incident Rate
10
• KPI goal is to reduce OSHA Recordable Injury Incident Rate by 20% from prior year rate of 3.65 to 2.90• f(equipment, training, behavior, personal protective equipment use)• Initiatives: inspect equipment and environment; manage personal protective equipment inventory; track personal protective
equipment use; train staff; enact monthly safety talks, near miss incident program, hearing conservation program• FM Leader: Rachel Gunn
0.0
1.0
2.0
3.0
4.0
5.0
6.0
7.0
8.0
Sep Oct Nov Dec Jan Feb Mar Apr May Jun Jul Aug
FY18
Rec
orda
ble
Inju
ry In
cide
nt R
ate
FY18 Recordable Injury Incident Rate Recordable Injury Incident Rate Target
Number of InjuriesOct: 0YTD: 3

CE3. Injury-Related Lost Workday Rate
11
• KPI goal is to achieve an injury-related lost workday rate of less than 1.34 lost workdays (days away, restricted, or transferred) per 100 full time employees
• f(equipment, training, behavior, personal protective equipment use)• Initiatives: inspect equipment and environment; manage personal protective equipment inventory; track personal protective
equipment use; train staff; enact monthly safety talks • FM Leader: Rachel Gunn
0.0
1.0
2.0
3.0
4.0
5.0
6.0
7.0
8.0
Sep Oct Nov Dec Jan Feb Mar Apr May Jun Jul Aug
FY18
Inju
ry-R
elat
ed L
ost W
orkd
ays
Per
100
FTE
FY18 Injury-Related Lost Workdays Per 100 FTE FY18 Injury-Related Lost Workdays Per 100 FTE Target

CE4. Waste Diversion Rate
12
• KPI goal is a 50% diversion rate by 2020 over 2009 baseline (4% increase in FY 2018 over FY 2017)• f(occupant behavior purchasing, reuse, recycling, diversion, market availability of diversion services)• Initiatives: audit waste; promote landfill diversion via new resource conversation working group, identify new landfill
diversion opportunities; train occupants on recycling • FM Leader: Kathia Benitez
0%
10%
20%
30%
40%
50%
60%
70%
80%
90%
100%
Was
te D
iver
sion
Rat
e (%
)
Waste Diversion Rate (%) Waste Diversion Rate (%) Target

CE5. Overtime
13
• KPI goal is to decrease overtime from 15% of total labor hours in FY17 to 5% of total hours.• f(staffing, contracted services, service provider productivity, planning and scheduling of work, accessibility of work
areas/equipment, emergency work, off hours project and special event support)• Initiatives: adjust staffing levels to reflect workload levels; supplement staff levels through temporary staff hires and
contracted services; increase service provider productivity; plan and schedule work order assignments; adjust shift schedulesto improve campus coverage
• FM Leader: Rachel Gunn
0%
5%
10%
15%
20%
25%
0%
5%
10%
15%
20%
25%
Sep Oct Nov Dec Jan Feb Mar Apr May Jun Jul Aug
FY18
Mon
thly
Ove
rtim
e H
ours
(%)
FY18
Cum
ulat
ive
Ove
rtim
e H
ours
(%)
FY18 Monthly Overtime Hours (%) FY18 Cumulative Overtime Hours (%) Target FY18 Cumulative Overtime Hours (%)

CE6. Minority and Female Enterprise Use
14
• KPI goal is to increase Minority and Female Enterprise work on campus to 15% of contracts awarded on projects over $25,000• f(contract, bid, qualifying vendor availability in marketplace)• Initiatives: implement new software system; train and educate Project Managers & Contractors; collaborate with Director of
Diversity; explore marketplace for new vendors to engage• FM Leader: Liz Schaps
0%
10%
20%
30%
40%
50%
Q1 Q2 Q3 Q4
FY18
Cum
ulat
ive
Con
stru
ctio
n C
ontr
act
Aw
arde
d (%
)
FY18 Cumulative Chicago Construction Contract Awarded (%) Construction Contract Awarded (%) Target
FY18 Cumulative Evanston Construction Contract Awarded (%)

CE7. Local Business Enterprise Use
15
• KPI goal is to increase Local Business Enterprise work on campus to 15% of contracts awarded on projects over $25,000• f(contract, bid, qualifying vendor availability in marketplace)• Initiatives: implement new software system; train and educate Project Managers & Contractors; collaborate with Director of
Diversity; explore marketplace for new vendors to engage• FM Leader: Liz Schaps
0%
10%
20%
30%
40%
50%
Q1 Q2 Q3 Q4
FY18
Cum
ulat
ive
Con
stru
ctio
nC
ontr
act
Aw
arde
d (%
)
FY18 Cumulative Chicago Construction Contract Awarded (%) Construction Contract Awarded (%) Target
FY18 Cumulative Evanston Construction Contract Awarded (%)

CE8. Evanston Resident Employment
16
0%
3%
5%
8%
10%
13%
15%
Sep Oct Nov Dec Jan Feb Mar Apr May Jun Jul Aug
FY18
Cum
ulat
ive
Eva
nsto
n R
esid
ent
Labo
r H
ours
(%)
FY18 Cumulative Evanston Resident Labor Hours (%) FY18 Cumulative Evanston Resident Labor Hours (%) Target
• KPI goal is 5% of total construction labor hours on qualifying campus projects greater than $1,000,000• f(project qualification, labor market, demand for labor hours, City of Evanston partnership, qualifying Contractor
participation)• Initiatives: implement new software system; train and educate Project Managers & Contractors; collaborate with Director of
Diversity• FM Leader: Liz Schaps

F1. Capital Project Cash Flow Execution
17
$0
$100
$200
$300
$400
$500
$600
Sep Oct Nov Dec Jan Feb Mar Apr May Jun Jul Aug
FY18
Fac
iliti
es M
anag
emen
t C
umul
ativ
e C
ash
Flow
(Mill
ions
)
FY18 Facilities Management Cumulative Cash Flow FY18 Projected Cash Flow Plan FY18 Cumulative Cash Flow
• KPI goal is to spend capital at a rate of +/-2% of committed capital cash flow plan• f(timely contractor invoicing, unforeseen project conditions, accurate budgeting, scope changes, weather, institutional
prioritization, accessibility to work areas/equipment)• Initiatives: develop and implement process improvement; improve accuracy of cash flow plan; drive timely contractor
invoicing; improve reporting; establish and execute project manager cash flow plan• FM Leader: Liz Schaps

F2. FM Operating Budget Execution
18
$0
$20
$40
$60
$80
$100
$120
$140
$160
$180
$200
Sep Oct Nov Dec Jan Feb Mar Apr May Jun Jul Aug
FY18
Cum
ulat
ive
Ope
rati
ng B
udge
t (M
illio
ns)
FY18 Cumulative Operating Budget FY18 Operating Budget
• KPI goal is to spend Facilities Management division operating expenses at a rate of +/- 1% of budget • f(accurate budgeting of FM Operations and Maintenance, FM Administration, FM Planning, FM Design and Construction, FM
Sustainability, FM HR, campus growth, unanticipated factors)• Initiatives: develop and implement process improvement; improve reporting; adhere to preventative maintenance plan;
manage overtime expenses• FM Leader: Liz Schaps
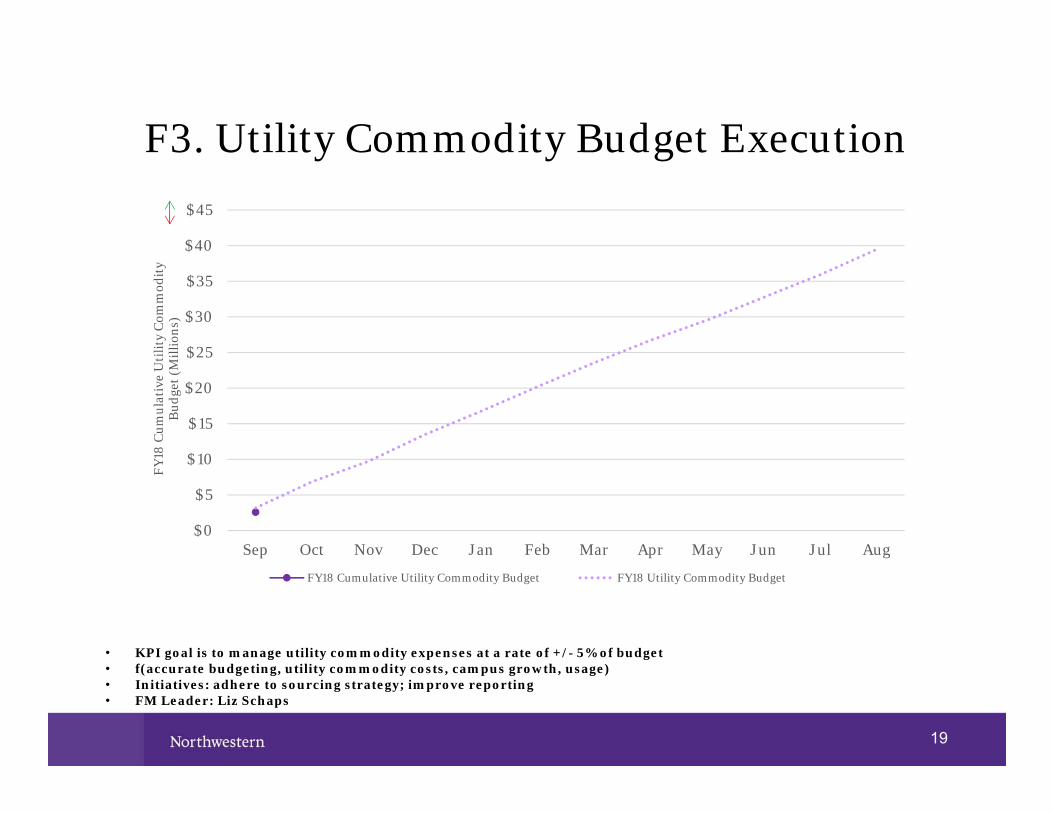
F3. Utility Commodity Budget Execution
19
$0
$5
$10
$15
$20
$25
$30
$35
$40
$45
Sep Oct Nov Dec Jan Feb Mar Apr May Jun Jul Aug
FY18
Cum
ulat
ive
Uti
lity
Com
mod
ity
Bud
get (
Mill
ions
)
FY18 Cumulative Utility Commodity Budget FY18 Utility Commodity Budget
• KPI goal is to manage utility commodity expenses at a rate of +/- 5% of budget • f(accurate budgeting, utility commodity costs, campus growth, usage)• Initiatives: adhere to sourcing strategy; improve reporting• FM Leader: Liz Schaps
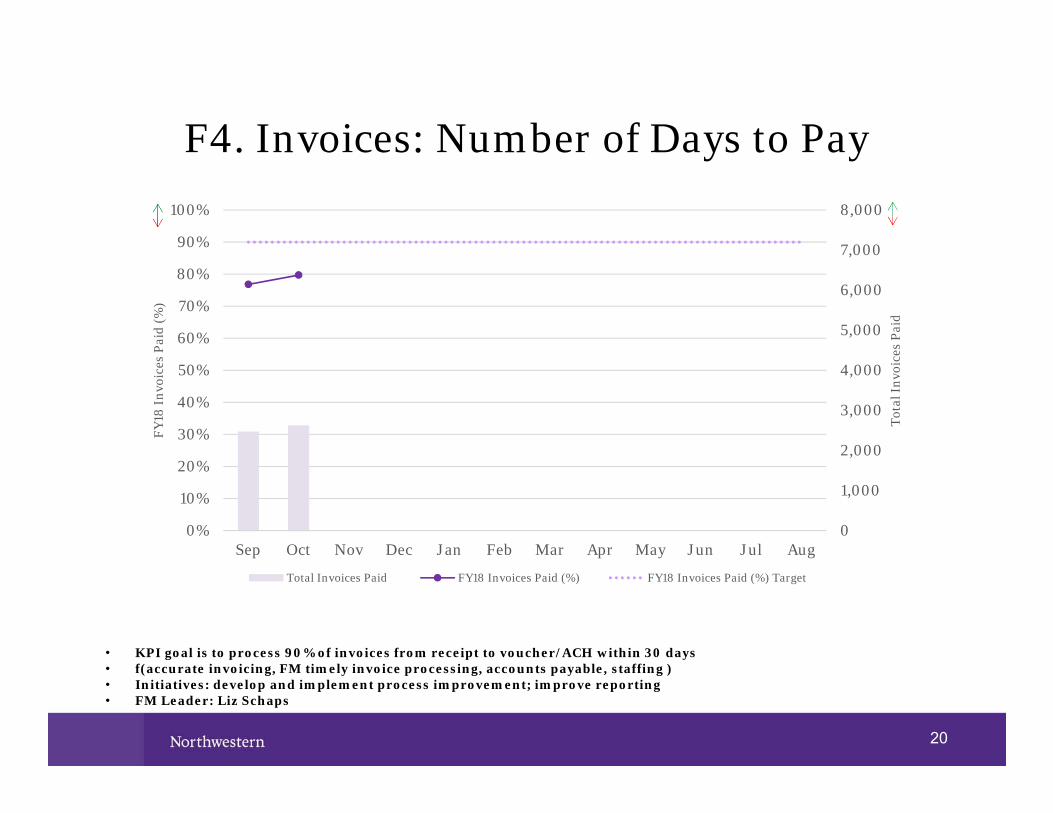
F4. Invoices: Number of Days to Pay
20
0
1,000
2,000
3,000
4,000
5,000
6,000
7,000
8,000
0%
10%
20%
30%
40%
50%
60%
70%
80%
90%
100%
Sep Oct Nov Dec Jan Feb Mar Apr May Jun Jul Aug
Tota
l Inv
oice
s Pa
id
FY18
Invo
ices
Pai
d (%
)
Total Invoices Paid FY18 Invoices Paid (%) FY18 Invoices Paid (%) Target
• KPI goal is to process 90% of invoices from receipt to voucher/ACH within 30 days • f(accurate invoicing, FM timely invoice processing, accounts payable, staffing )• Initiatives: develop and implement process improvement; improve reporting• FM Leader: Liz Schaps
Recommended