May 6, 2016May 6, 2016
I-66 Corridor Improvements Outside the Capital Beltway in Northern Virginia, USACase Study for Funding of Transit Service and Transportation Demand Management Strategies through Managed Lanes
15th International Conference on Managed Lanes

May 6, 2016
Overview Managed Lanes in Northern Virginia
Transform 66 Outside the Beltway Project
Preferred Alternative Elements
Transit Service and Transportation Demand Management (TDM) – Benefits, Costs, and Funding
Conclusions
May 6, 2016
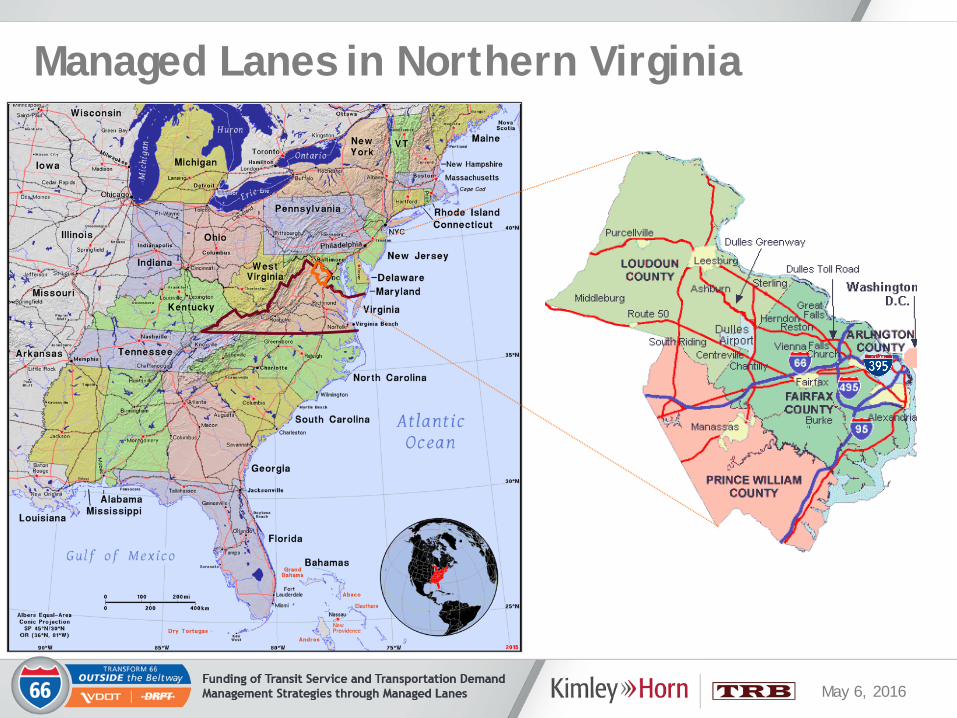
Managed Lanes in Northern Virginia
May 6, 2016
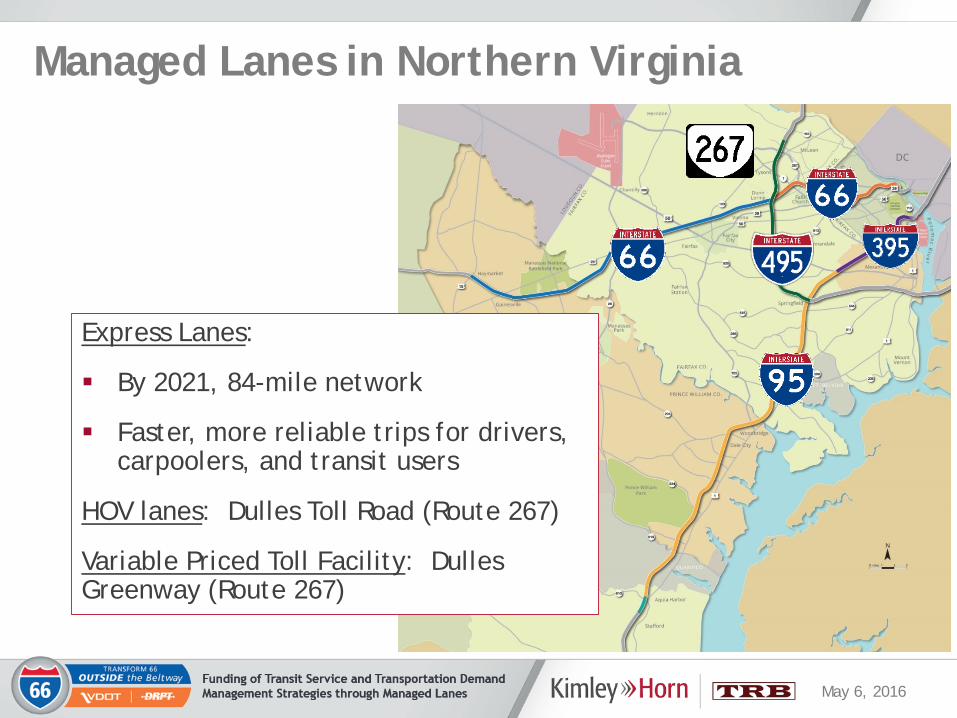
Managed Lanes in Northern Virginia
Express Lanes:
By 2021, 84-mile network
Faster, more reliable trips for drivers, carpoolers, and transit users
HOV lanes: Dulles Toll Road (Route 267)
Variable Priced Toll Facility: Dulles Greenway (Route 267)
May 6, 2016
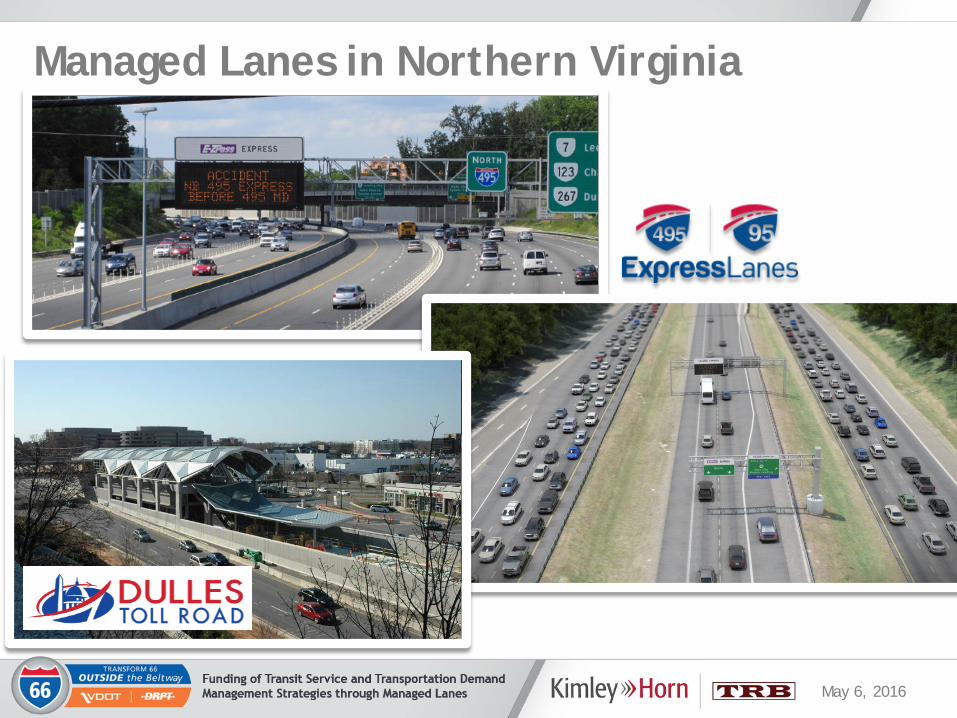
Managed Lanes in Northern Virginia
May 6, 2016
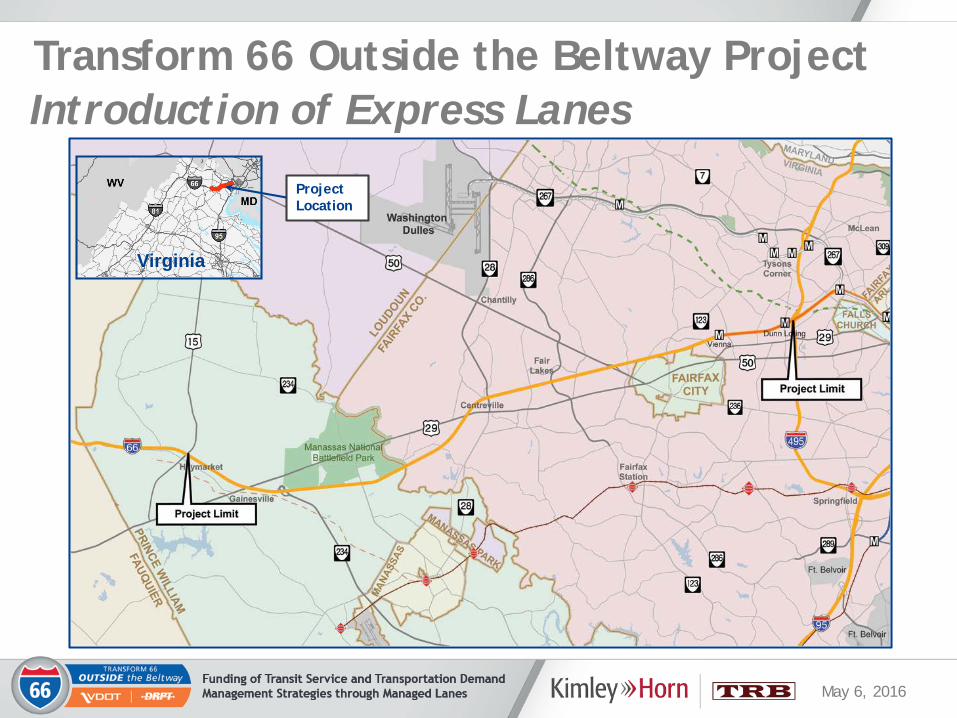
Transform 66 Outside the Beltway Project
Virginia
ProjectLocation
Introduction of Express Lanes
May 6, 2016
Transform 66 Outside the Beltway Project
May 6, 2016
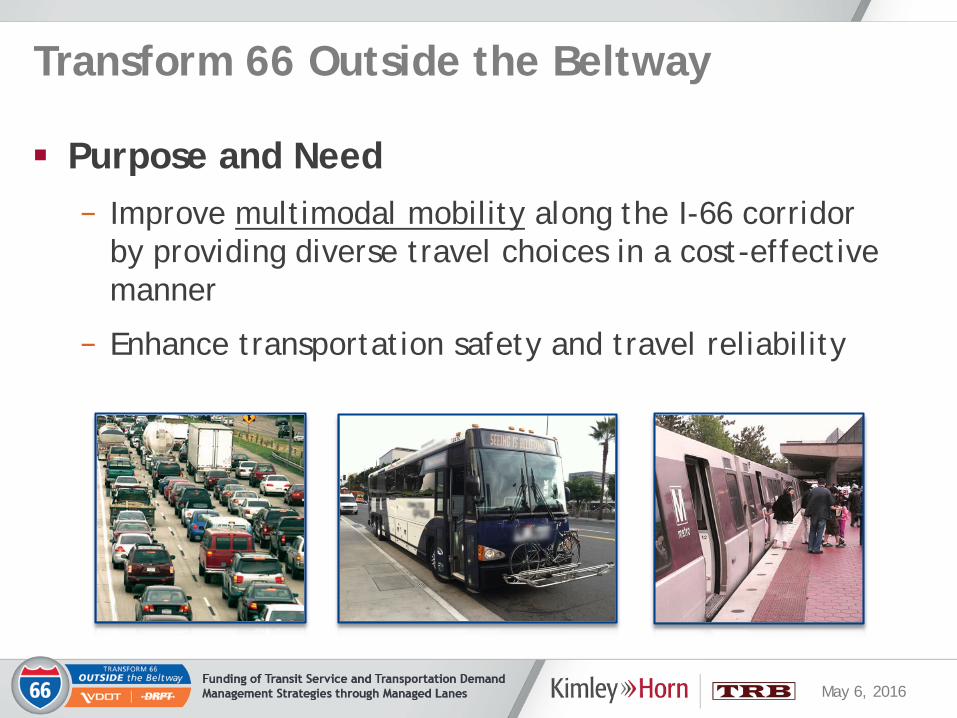
Transform 66 Outside the Beltway
Purpose and Need− Improve multimodal mobility along the I-66 corridor
by providing diverse travel choices in a cost-effective manner
− Enhance transportation safety and travel reliability
May 6, 2016
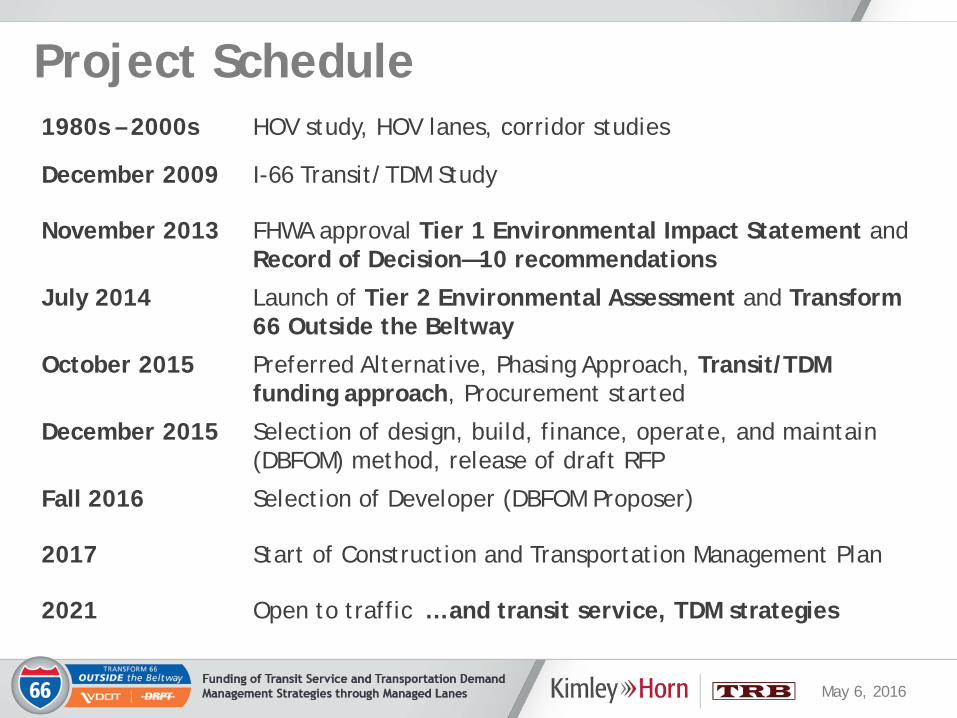
Project Schedule1980s – 2000s HOV study, HOV lanes, corridor studies
December 2009 I-66 Transit/TDM Study
November 2013 FHWA approval Tier 1 Environmental Impact Statement and Record of Decision—10 recommendations
July 2014 Launch of Tier 2 Environmental Assessment and Transform 66 Outside the Beltway
October 2015 Preferred Alternative, Phasing Approach, Transit/TDM funding approach, Procurement started
December 2015 Selection of design, build, finance, operate, and maintain (DBFOM) method, release of draft RFP
Fall 2016 Selection of Developer (DBFOM Proposer)
2017 Start of Construction and Transportation Management Plan
2021 Open to traffic … and transit service, TDM strategies
May 6, 2016
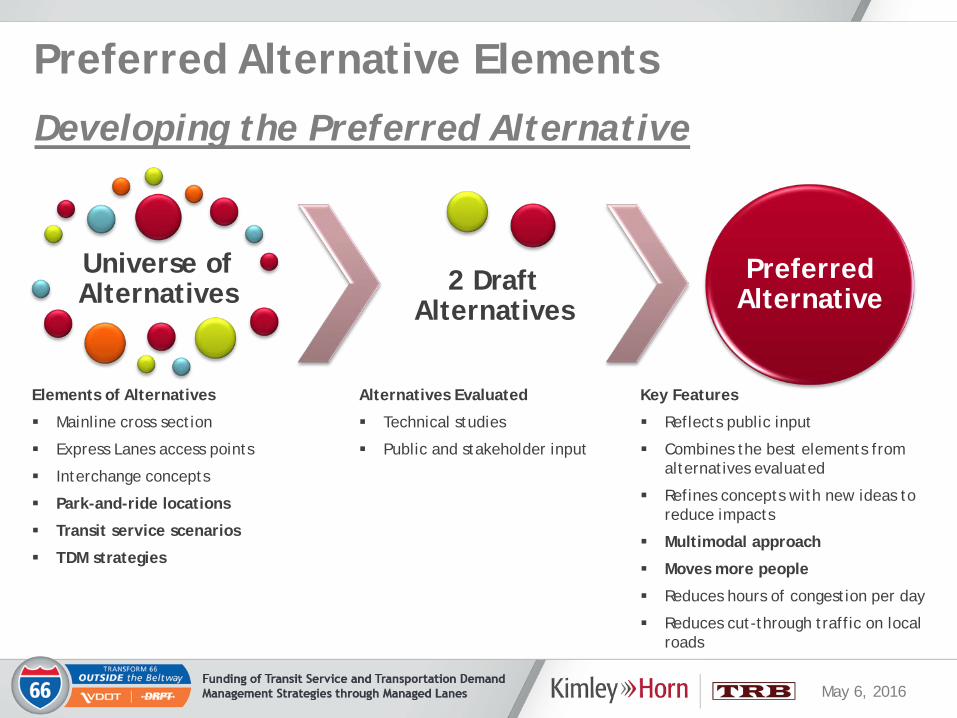
Elements of Alternatives
Mainline cross section
Express Lanes access points
Interchange concepts
Park-and-ride locations
Transit service scenarios
TDM strategies
2 Draft Alternatives
Alternatives Evaluated
Technical studies
Public and stakeholder input
Preferred Alternative
Developing the Preferred Alternative
Key Features
Reflects public input
Combines the best elements from alternatives evaluated
Refines concepts with new ideas to reduce impacts
Multimodal approach
Moves more people
Reduces hours of congestion per day
Reduces cut-through traffic on local roads
Preferred Alternative Elements
Universe of Alternatives
May 6, 2016
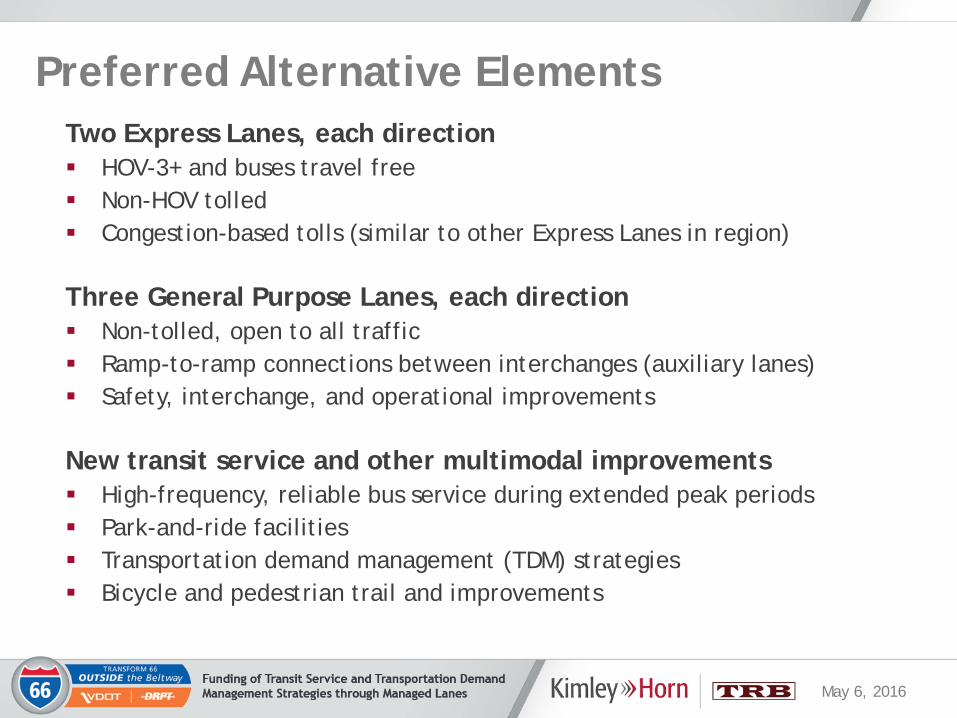
Preferred Alternative ElementsTwo Express Lanes, each direction HOV-3+ and buses travel free Non-HOV tolled Congestion-based tolls (similar to other Express Lanes in region)
Three General Purpose Lanes, each direction Non-tolled, open to all traffic Ramp-to-ramp connections between interchanges (auxiliary lanes) Safety, interchange, and operational improvements
New transit service and other multimodal improvements High-frequency, reliable bus service during extended peak periods Park-and-ride facilities Transportation demand management (TDM) strategies Bicycle and pedestrian trail and improvements
May 6, 2016
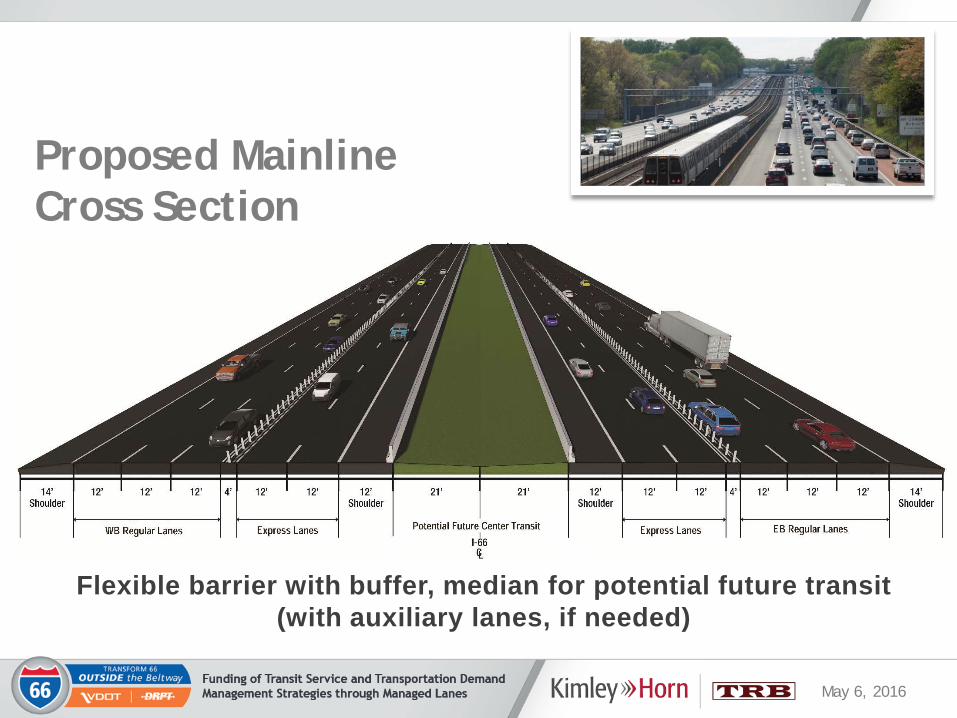
Proposed Mainline Cross Section
Flexible barrier with buffer, median for potential future transit(with auxiliary lanes, if needed)
May 6, 2016
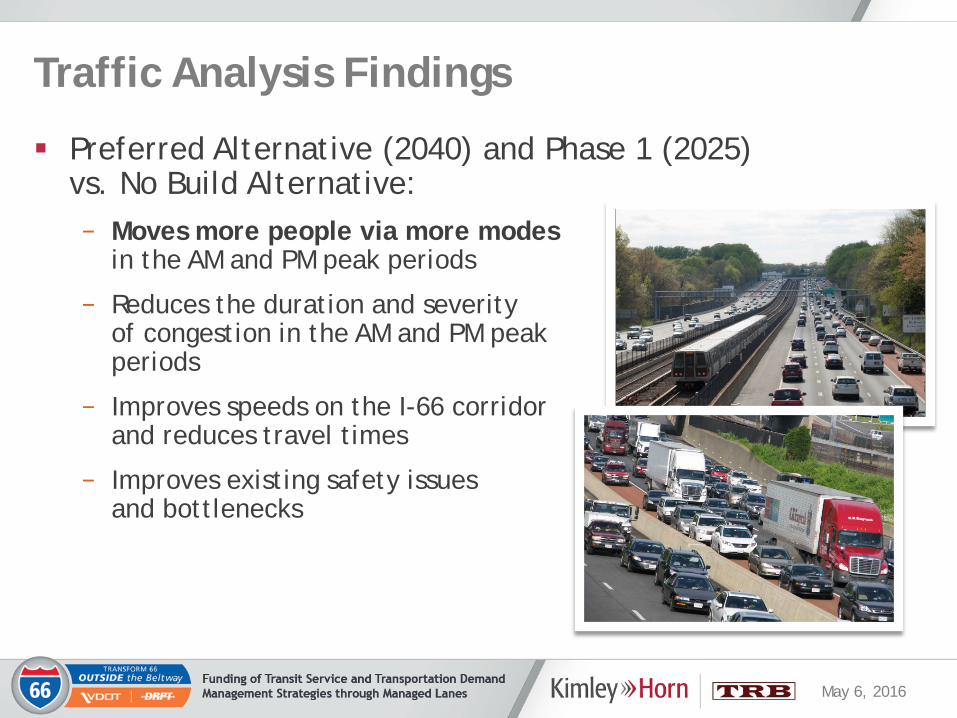
Traffic Analysis Findings
Preferred Alternative (2040) and Phase 1 (2025) vs. No Build Alternative:− Moves more people via more modes
in the AM and PM peak periods
− Reduces the duration and severityof congestion in the AM and PM peakperiods
− Improves speeds on the I-66 corridorand reduces travel times
− Improves existing safety issues and bottlenecks
May 6, 2016
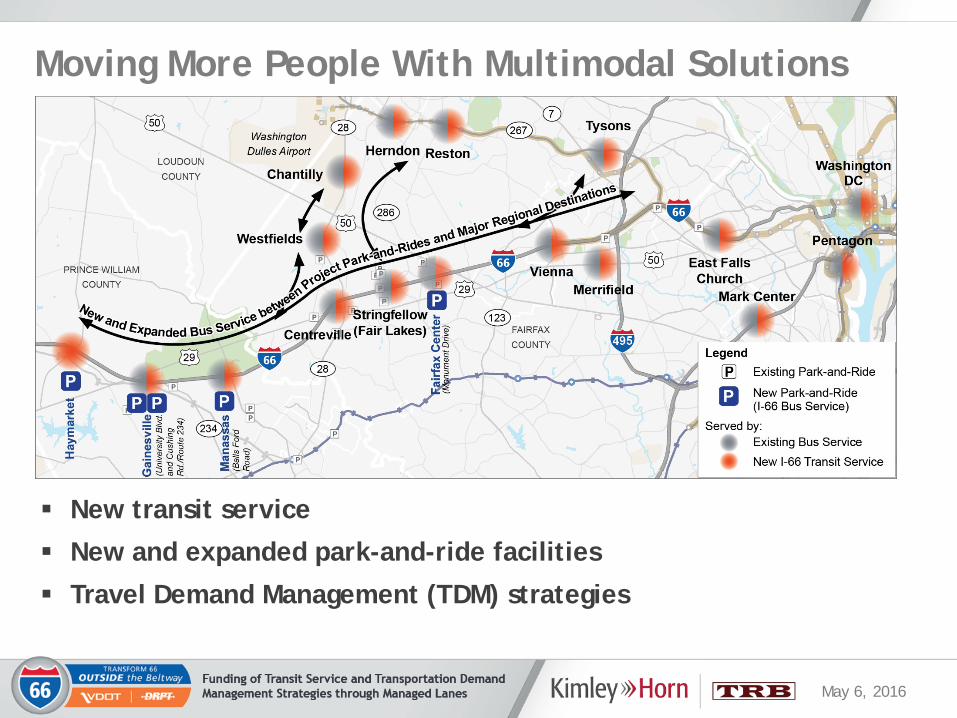
Moving More People With Multimodal Solutions
New transit service
New and expanded park-and-ride facilities
Travel Demand Management (TDM) strategies
May 6, 2016
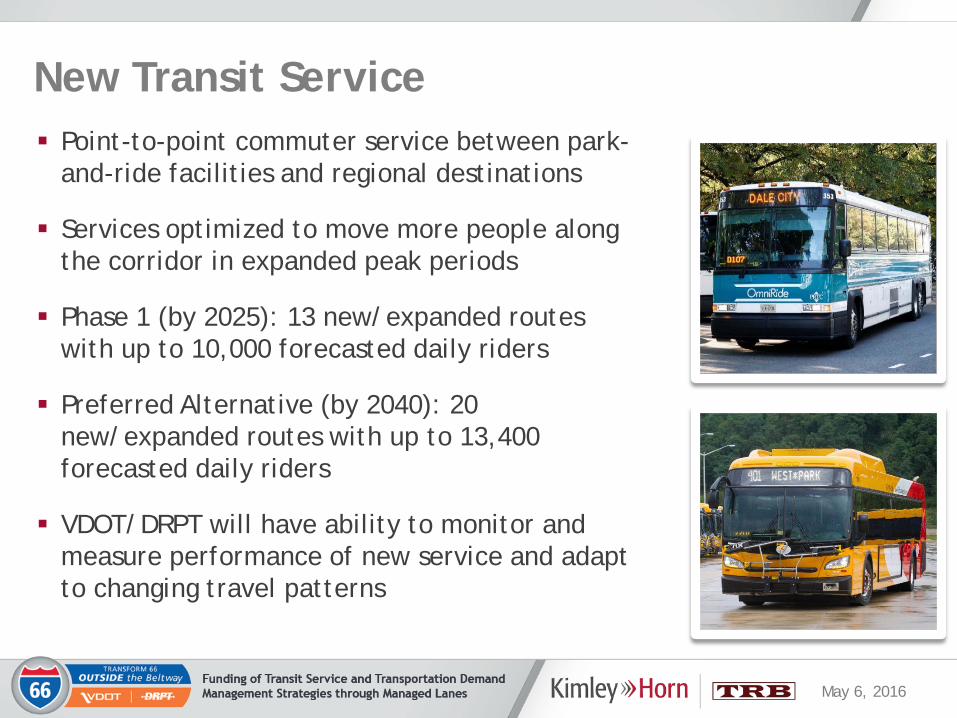
Point-to-point commuter service between park-and-ride facilities and regional destinations
Services optimized to move more people along the corridor in expanded peak periods
Phase 1 (by 2025): 13 new/expanded routes with up to 10,000 forecasted daily riders
Preferred Alternative (by 2040): 20 new/expanded routes with up to 13,400 forecasted daily riders
VDOT/DRPT will have ability to monitor and measure performance of new service and adapt to changing travel patterns
New Transit Service
May 6, 2016
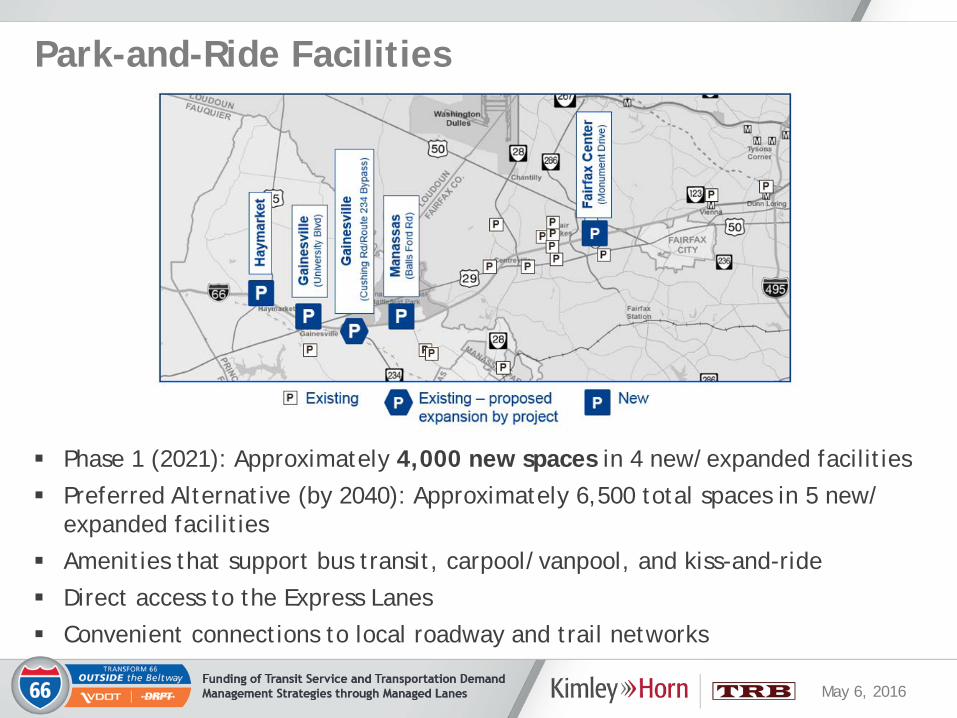
Park-and-Ride Facilities
Phase 1 (2021): Approximately 4,000 new spaces in 4 new/expanded facilities Preferred Alternative (by 2040): Approximately 6,500 total spaces in 5 new/
expanded facilities Amenities that support bus transit, carpool/vanpool, and kiss-and-ride Direct access to the Express Lanes Convenient connections to local roadway and trail networks
May 6, 2016
Transportation Demand Management (TDM) Strategies
Directly promote the use of the Express Lanes, new transit service, park-and-ride facilities, and ridesharing opportunities
Developed for I-66 corridor, supplements ongoing TDM efforts in region
Project strategies
− I-66 corridor marketing and outreach
− Limited-time fare buy-downs for new transit users
− Financial incentives and assistance for formation of carpools and vanpools
− Support bicycle and pedestrian travel within the corridor
− HOV-2 to HOV-3 conversion awareness
− Expanded employer outreach
− Innovative first/last mile solutions
To begin as part of the Transportation Management Plan (TMP) during construction
May 6, 2016
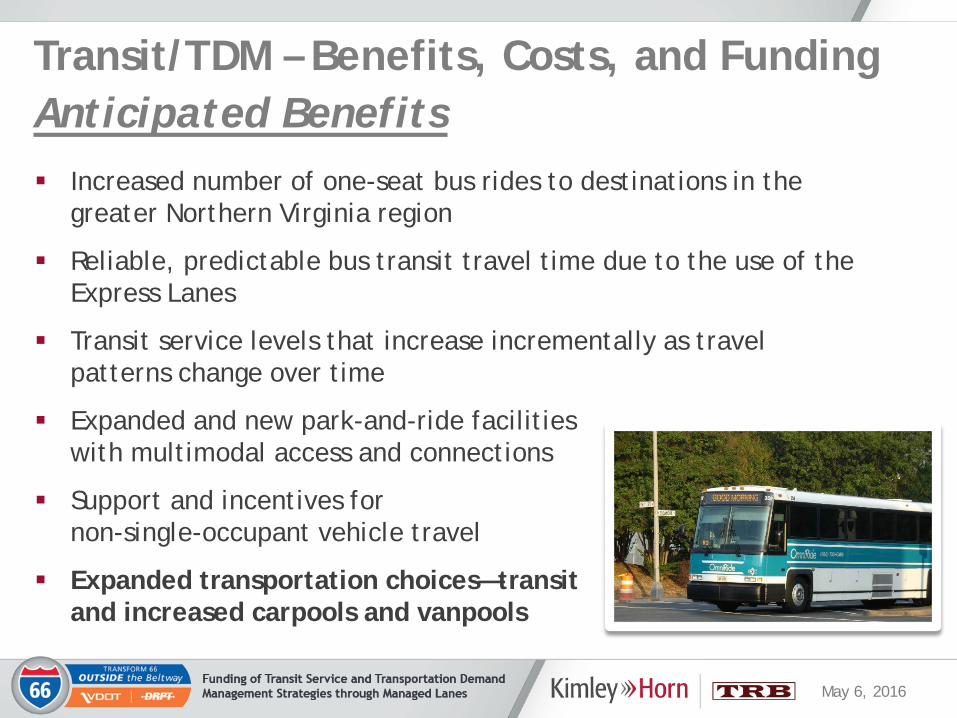
Anticipated Benefits Increased number of one-seat bus rides to destinations in the
greater Northern Virginia region
Reliable, predictable bus transit travel time due to the use of the Express Lanes
Transit service levels that increase incrementally as travel patterns change over time
Expanded and new park-and-ride facilitieswith multimodal access and connections
Support and incentives for non-single-occupant vehicle travel
Expanded transportation choices—transit and increased carpools and vanpools
Transit/TDM – Benefits, Costs, and Funding
May 6, 2016
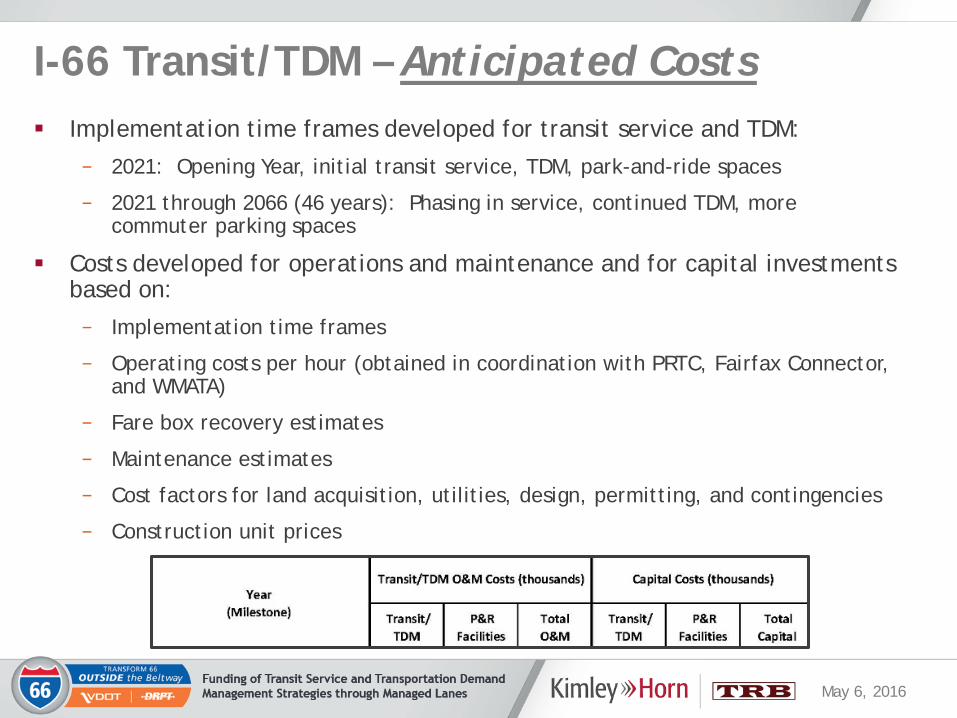
I-66 Transit/TDM – Anticipated Costs Implementation time frames developed for transit service and TDM:
− 2021: Opening Year, initial transit service, TDM, park-and-ride spaces
− 2021 through 2066 (46 years): Phasing in service, continued TDM, more commuter parking spaces
Costs developed for operations and maintenance and for capital investments based on:− Implementation time frames
− Operating costs per hour (obtained in coordination with PRTC, Fairfax Connector, and WMATA)
− Fare box recovery estimates
− Maintenance estimates
− Cost factors for land acquisition, utilities, design, permitting, and contingencies
− Construction unit prices
May 6, 2016
I-66 Transit/TDM – Annual Funding Calculation
Costs estimated for 2021 through 2066 for transit and TDM, then converted to year-of-expenditure (YOE)
Transit funding calculation methodology developed by DRPT and VAP3 as follows:− 100% of operations and maintenance costs
Including transit service and TDM strategies
Excluding park-and-ride facility costs
− 50% of capital costs
Including transit and TDM capital and recapitalization
Excluding expansion of park-and-ride facilities
− Costs combined for annual transit funding payout curve
May 6, 2016
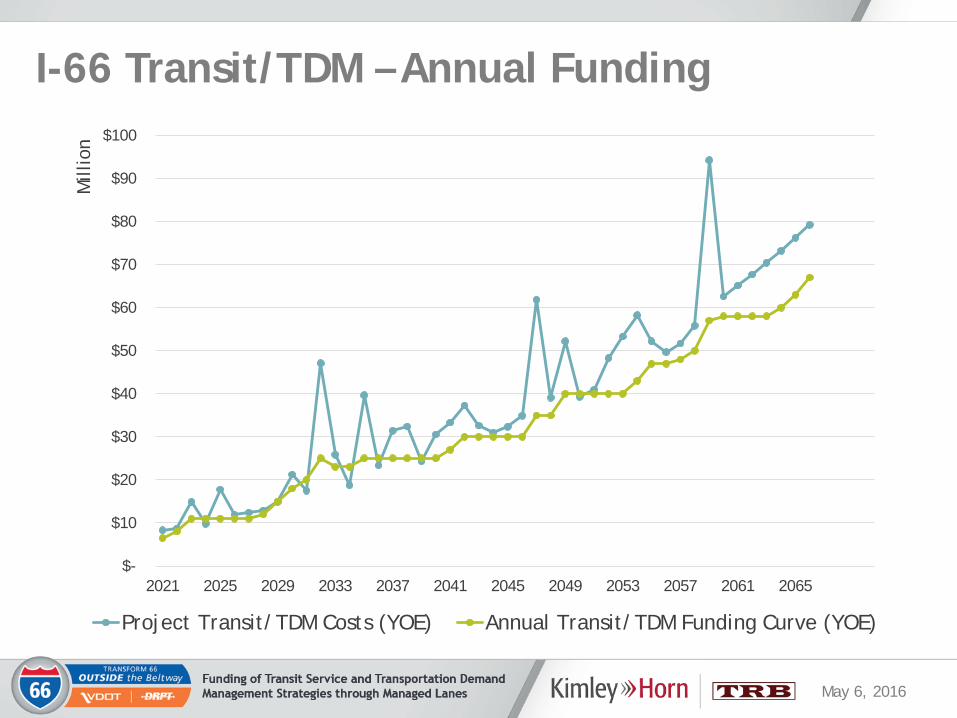
I-66 Transit/TDM – Annual Funding
$-
$10
$20
$30
$40
$50
$60
$70
$80
$90
$100
2021 2025 2029 2033 2037 2041 2045 2049 2053 2057 2061 2065
Mill
ion
Project Transit/TDM Costs (YOE) Annual Transit/TDM Funding Curve (YOE)
May 6, 2016
I-66 Transit/TDM – Annual Transit Funding
Defined annual transit payment schedule for P3 Developer for life of concession
− Developer will be responsible for funding transit service and TDM according payment schedule
− Developer will not be responsible for procuring, operating, and maintaining systems and programs
Transit payments included in the base financial model
Transit payments rank below debt service in the cash flow waterfall but above support for corridor improvements and equity distributions
May 6, 2016
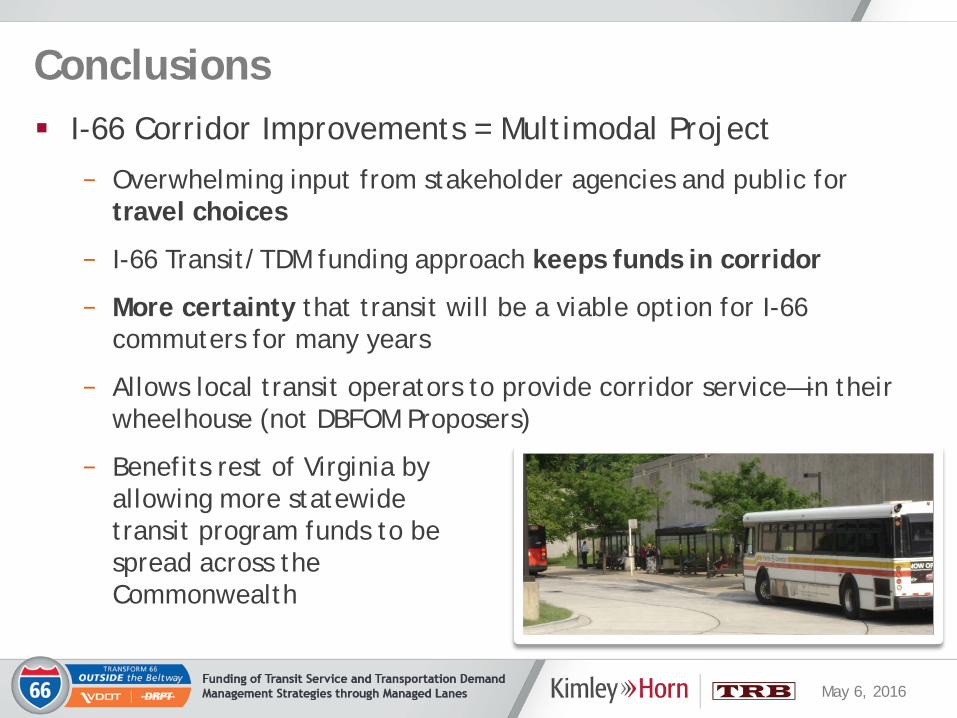
Conclusions I-66 Corridor Improvements = Multimodal Project
− Overwhelming input from stakeholder agencies and public for travel choices
− I-66 Transit/TDM funding approach keeps funds in corridor
− More certainty that transit will be a viable option for I-66 commuters for many years
− Allows local transit operators to provide corridor service—in their wheelhouse (not DBFOM Proposers)
− Benefits rest of Virginia by allowing more statewide transit program funds to be spread across the Commonwealth
May 6, 2016
Conclusions
Funding formula of 100% O&M and 50% capital:− Local operators benefit from having 100% of operating funds for
corridor-specific service
− Some federal funds should be available to help pay for capital expense
− Overall, a compromise to make project financial plan work
May 6, 2016
Conclusions Project is demonstrating that it is possible to fund transit
service and TDM through tolled Managed Lanes
− Transit service in I-66 corridor will not be fully dependent on traditional federal, state, or local funding
− Transit/TDM funding from toll revenue:
Policy decision by Virginia’s leadership, in coordination with FHWA
Project commitment of the P3 Proposers
− Project assumes $600 million in public funding
− Discussions with rating agencies about trade-offs was necessary and will continue through Financial Close
− Approach allows flexibility for Commonwealth to reexamine transit services in corridor over time (performance monitoring)
May 6, 2016May 6, 2016
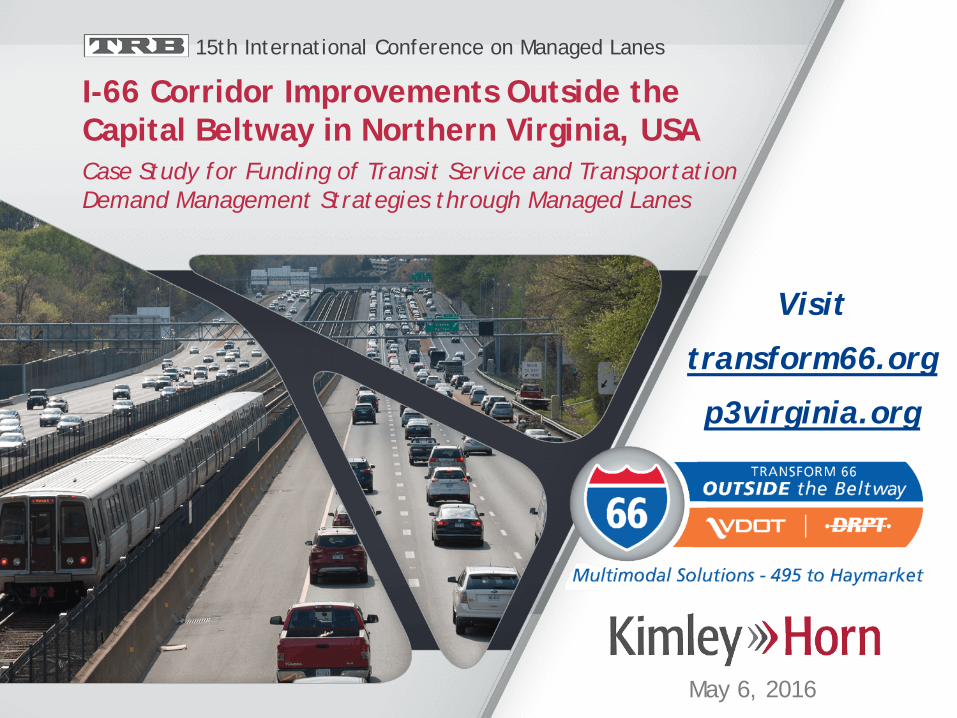
I-66 Corridor Improvements Outside the Capital Beltway in Northern Virginia, USACase Study for Funding of Transit Service and Transportation Demand Management Strategies through Managed Lanes
15th International Conference on Managed Lanes
Visit
transform66.org
p3virginia.org
Recommended