Analyst presentationFebruary 11, 2021
The Connection to the world of Sustainable Tropical Agriculture 1
SIPEF
Summary
The Connection to the world of Sustainable Tropical Agriculture 2
SIPEF group - Company profile
SIPEF group - Palm oil in the world
SIPEF group - Production & prices
SIPEF group – Financial performance
SIPEF group - Prospects

SIPEF group – Company profile
The Connection to the world of Sustainable Tropical Agriculture 3
Agriculture • 1st segment of the supply chain - commodities
Tropical • Recent industrialised countries
Sustainable • Audited certifications
Connection • Publicly quoted

SIPEF group – Company profile
The Connection to the world of Sustainable Tropical Agriculture 4
Continuous production
• Continuous crops
Diversified in product
• Palm oil : basic commodity for food (and recently energy)
• Rubber : cyclic business - tire industry
Diversified in origin
• Indonesia : leading producing country within Asian market
• PNG : export oriented with strong agronomical basics

SIPEF group – Company profileWorldwide
The Connection to the world of Sustainable Tropical Agriculture 5
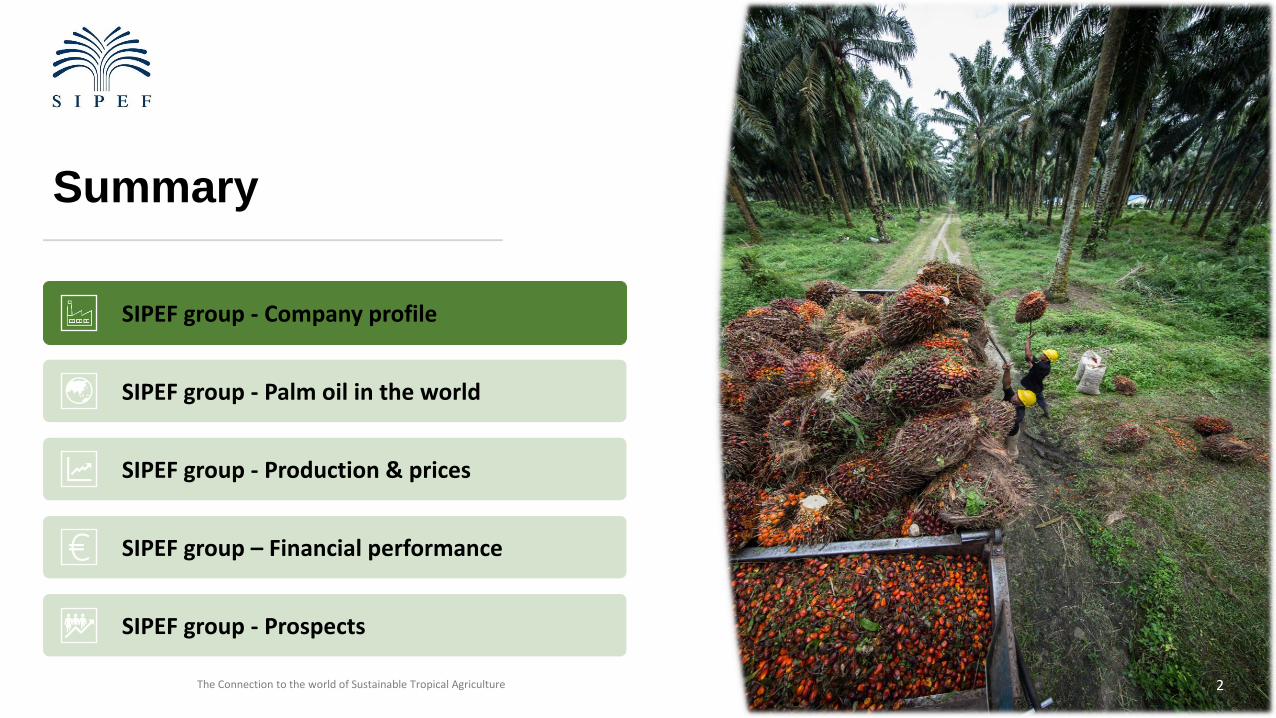
SIPEF group – Company profileIndonesia
6

SIPEF group – Company profilePapua New Guinea
The Connection to the world of Sustainable Tropical Agriculture 7

SIPEF group – Company profilePlanted hectares summary 100% – 31 December 2020
The Connection to the world of Sustainable Tropical Agriculture
8
2020 Indonesia PNG Ivory Coast Hectares 100% % of total Group share % of total
Palm 62.785 13.689 0 76.473 91% 71.130 91%
Rubber 4.816 0 0 4.816 6% 4.346 6%
Tea 1.786 0 0 1.786 2% 1.612 2%
Bananas 0 0 780 780 1% 780 1%
Other 0 0 38 38 0% 38 0%
Total planted 69.387 13.689 818 83.893 100% 77.907 93%
% of total 83% 16% 1% 100%
Group share 63.400 13.689 818

SIPEF group – Company profileIncrease in own total planted hectares (100%)
9
Mature + immature (incl. hectares PT TD)
0
10.000
20.000
30.000
40.000
50.000
60.000
70.000
80.000
90.000
100.000
2005 2008 2016 2017 2019 2020 2023 2030
North Sum North Sum expansion Bengkulu Bengkulu expansion PNG PNG expansion Musi Rawas Dendy Marker Ivory Coast Ivory Coast expansion
48 093 Ha
56 811 Ha
69 439 Ha
78 213 Ha82 968 Ha
84 634 Ha
93 143Ha 94 248Ha
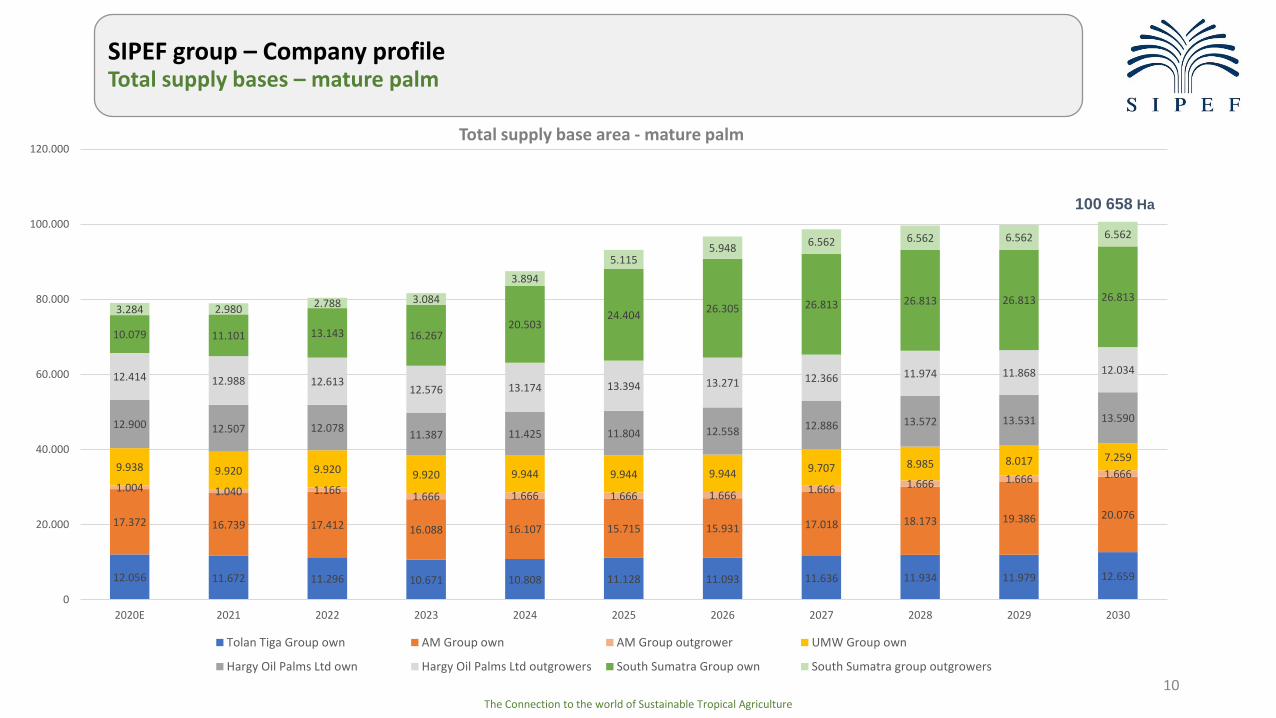
SIPEF group – Company profileTotal supply bases – mature palm
The Connection to the world of Sustainable Tropical Agriculture
10
100 658 Ha
12.056 11.672 11.296 10.671 10.808 11.128 11.093 11.636 11.934 11.979 12.659
17.372 16.739 17.412 16.088 16.107 15.715 15.931 17.018 18.173 19.386 20.076
1.004 1.040 1.1661.666 1.666 1.666 1.666
1.666 1.666 1.666 1.6669.938 9.920 9.920 9.920 9.944 9.944 9.944 9.707 8.985 8.017 7.259
12.900 12.507 12.07811.387 11.425 11.804 12.558 12.886 13.572 13.531 13.590
12.414 12.988 12.61312.576 13.174 13.394 13.271 12.366 11.974 11.868 12.034
10.079 11.101 13.143 16.26720.503
24.40426.305 26.813 26.813 26.813 26.813
3.284 2.980 2.788 3.084
3.894
5.1155.948
6.562 6.562 6.562 6.562
0
20.000
40.000
60.000
80.000
100.000
120.000
2020E 2021 2022 2023 2024 2025 2026 2027 2028 2029 2030
Total supply base area - mature palm
Tolan Tiga Group own AM Group own AM Group outgrower UMW Group own
Hargy Oil Palms Ltd own Hargy Oil Palms Ltd outgrowers South Sumatra Group own South Sumatra group outgrowers
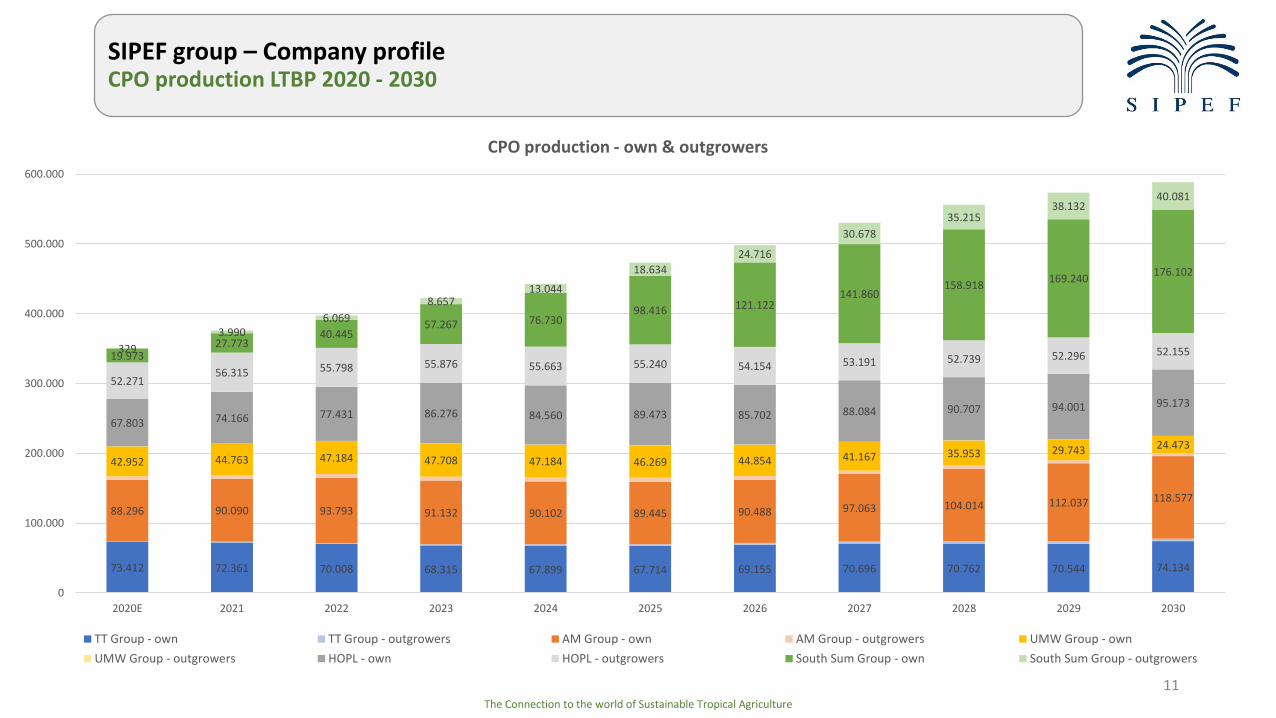
SIPEF group – Company profileCPO production LTBP 2020 - 2030
The Connection to the world of Sustainable Tropical Agriculture
11
73.412 72.361 70.008 68.315 67.899 67.714 69.155 70.696 70.762 70.544 74.134
88.296 90.090 93.793 91.132 90.102 89.445 90.488 97.063 104.014 112.037 118.577
42.952 44.763 47.184 47.708 47.184 46.269 44.854 41.167 35.953 29.743 24.473
67.803 74.166 77.431 86.276 84.560 89.473 85.702 88.084 90.707 94.001 95.173
52.27156.315 55.798 55.876 55.663 55.240 54.154 53.191 52.739 52.296 52.15519.97327.773
40.44557.267 76.730
98.416 121.122141.860
158.918169.240
176.102
329
3.9906.069
8.65713.044
18.634
24.716
30.678
35.21538.132
40.081
0
100.000
200.000
300.000
400.000
500.000
600.000
2020E 2021 2022 2023 2024 2025 2026 2027 2028 2029 2030
CPO production - own & outgrowers
TT Group - own TT Group - outgrowers AM Group - own AM Group - outgrowers UMW Group - own
UMW Group - outgrowers HOPL - own HOPL - outgrowers South Sum Group - own South Sum Group - outgrowers

SIPEF group – Company profileSouth Sumatra - progress December 2020
The Connection to the world of Sustainable Tropical Agriculture
12

SIPEF group – Company profileSouth Sumatra – full scope of development December 2020
The Connection to the world of Sustainable Tropical Agriculture
13
Latest update Musi rawas Dendymarker Total
Total Planted / Cleared 14 014 9 648 23 662
Identified 8 791 413 9 204
Potential development 22 805 10 061 32 866
INTI 19 004 7 280 26 284
PLASMA 3 801 2 781 6 582

SIPEF group – Company profileMusi Rawas progress December 2020
The Connection to the world of Sustainable Tropical Agriculture
14
MUSI RAWASAcquired Secured
Ha Ha
PT AKL 5.084 4.661 92%
PT ARU 3.764 2.956 79%
PT AMR 8.152 6.398 78%
Total OLD 17.000 14.015 82%
Potential Ha 18.507
91,9%
AMR III 33 0 0%
AMRS 247 0 0%
AKLE 144 0 0%
Total NEW 425 0 0%
Potential Ha 4.298
9,9%
GRAND TOTAL 17.424 14.015 80%
Potential HA 22.805 22.805 100%
% of total 76,4% 61,5%
Summary
The Connection to the world of Sustainable Tropical Agriculture 15
SIPEF group - Company profile
SIPEF group - Palm oil in the world
SIPEF group - Production & prices
SIPEF group – Financial performance
SIPEF group - Prospects

• In the coming 40 years, mankind will have to produce more food than in the previous 10 000 years put together
SIPEF group – Palm oil in the worldPalm oil in the world - Population growth
The Connection to the world of Sustainable Tropical Agriculture 16
• Population growth will have a huge impact on future food demands
• Rising middle class is causing diet changes in developing countries
• Agricultural land is increasingly becoming scarcer

SIPEF group – Palm oil in the worldOil and fat consumption
17
67,32
72,58
27,55
18,29
54,95
26,07
15,15
49,47
29,93
59,43
55,77
25,52
15,57
35,54
21,46
14,04
39,05
25,86
0
10
20
30
40
50
60
70
80
EU-28 USA China India Indonesia Pakistan Nigeria Brazil World
Oil and fat consumption per capita (in Kg)
2018 2012
+55%
Source: Oilworld

SIPEF group – Palm oil in the worldPalm oil in the world - Land input
The Connection to the world of Sustainable Tropical Agriculture 18
• Increased demand for meat/fat/processed foods
• Increased demand for biofuel
• Decreasing Agricultural land per capita
• Disposable income growth in developing countries

SIPEF group – Palm oil in the worldPalm oil in the world - Comparison to other oils
The Connection to the world of Sustainable Tropical Agriculture 19
Resources used per vegetable oil:

SIPEF group – Palm oil in the worldPalm oil in the world - Vegetable oils
20
Palm oil16%
Soya oil21%
Rape oil11%Sunflower oil
9%
Palm kernel and coconut oil
6%
Other oils/animal fats37%
Palm oil Soya oil Rape oil
Sunflower oil Palm kernel and coconut oil Other oils/animal fats
1994/95: 93,1 million tonnesSource: Oilworld
Palm oil32%
Soybean oil24%
Rapeseed oil11%
Sunflower oil9%
Palm kernel and coconut oil5%
Others19%
2019 : 234,7 million Ton
Palm oil Soybean oil
Rapeseed oil Sunflower oil

SIPEF group – Palm oil in the worldPalm oil in the world - Palm oil production
21
Source: Oilworld
Indonesia57%Malaysia
26%
Thailand4%
Africa2%
Middle & South America4%
Other countries7%
2019 Palm oil productionTotal of 75,6 Mn tonnes
Indonesia Malaysia Thailand Africa Middle & South America Other countries
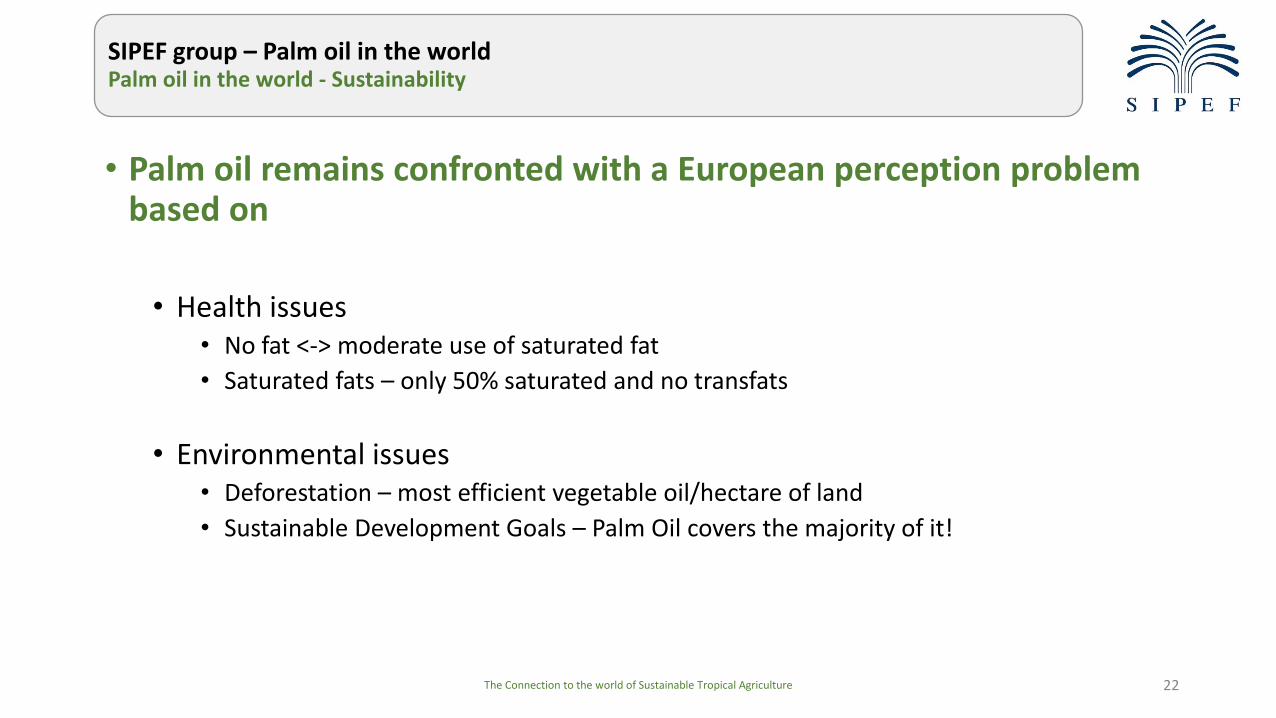
SIPEF group – Palm oil in the worldPalm oil in the world - Sustainability
The Connection to the world of Sustainable Tropical Agriculture 22
• Palm oil remains confronted with a European perception problem based on
• Health issues• No fat <-> moderate use of saturated fat
• Saturated fats – only 50% saturated and no transfats
• Environmental issues• Deforestation – most efficient vegetable oil/hectare of land
• Sustainable Development Goals – Palm Oil covers the majority of it!

SIPEF group – Palm oil in the worldPalm oil in the world - Sources for deforestation
The Connection to the world of Sustainable Tropical Agriculture 23

SIPEF group – Palm oil in the worldPalm oil in the world – Commodity commitment
The Connection to the world of Sustainable Tropical Agriculture 24

SIPEF group – Palm oil in the worldThe oil palm controversy
25

SIPEF group – Palm oil in the worldPalm oil in the world - Sustainable palm oil
The Connection to the world of Sustainable Tropical Agriculture 26
3,24 Million Ha RSPO certified production area in 2020
0
500
1 000
1 500
2 000
2 500
3 000
3 500
RSPO Certified Ha (in KHa)

SIPEF group – Palm oil in the worldPalm oil in the world - Biodiesel use of major feedstock (Mn T)
The Connection to the world of Sustainable Tropical Agriculture 27
2,804,32 4,34 5,34
7,37 6,85 7,07 8,06 7,649,19 9,78 10,74 11,39
1,22
2,16 3,474,08
5,30 6,979,06
10,168,62
10,7611,47
14,61
17,62
4,12
5,02
5,89
6,38
6,236,20
6,30
7,21
6,96
6,846,94
6,69
6,52
1,43
1,82
2,55
2,71
3,674,57
5,50
5,93
6,35
7,62
8,26
9,46
10,16
0,00
5,00
10,00
15,00
20,00
25,00
30,00
35,00
40,00
45,00
50,00
2007 2008 2009 2010 2011 2012 2013 2014 2015 2016 2017 2018 2019
Biodiesel use of major feedstock (Mn T)
Soya oil Palm oil Rape oil Other oils
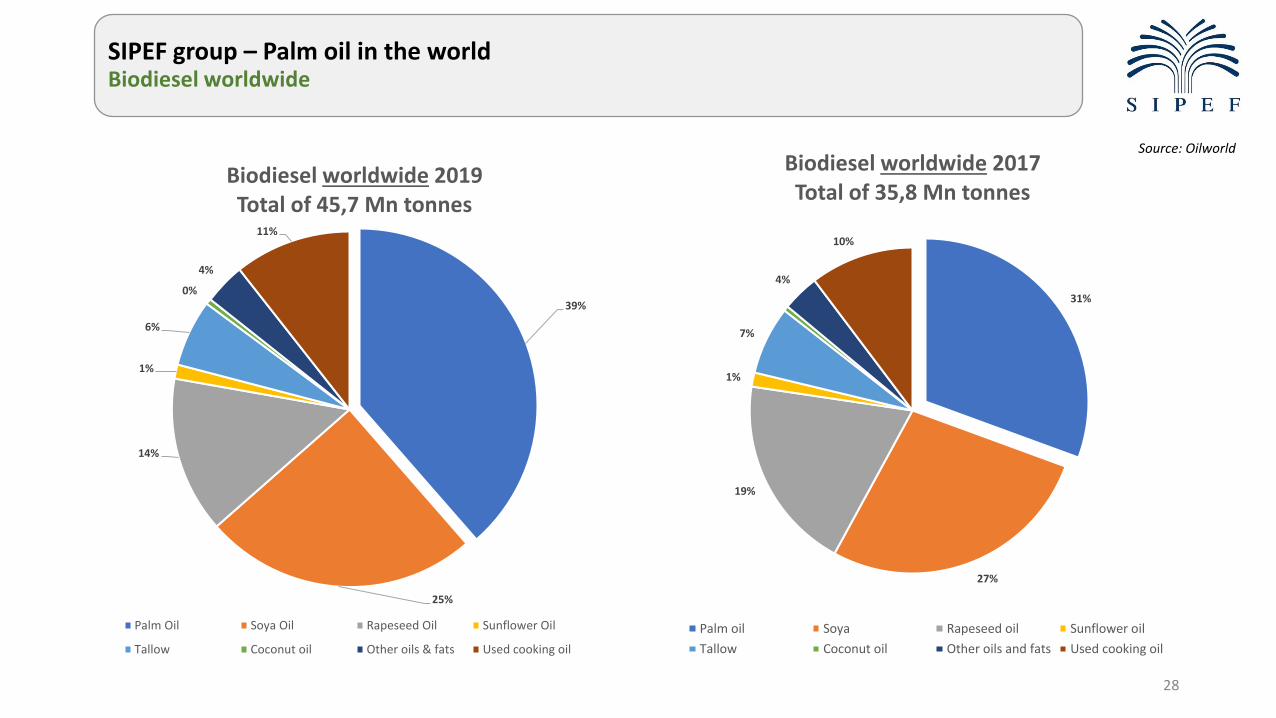
SIPEF group – Palm oil in the worldBiodiesel worldwide
28
31%
27%
19%
1%
7%
4%
10%
Biodiesel worldwide 2017Total of 35,8 Mn tonnes
Palm oil Soya Rapeseed oil Sunflower oil
Tallow Coconut oil Other oils and fats Used cooking oil
Source: Oilworld
39%
25%
14%
1%
6%
0%
4%
11%
Biodiesel worldwide 2019Total of 45,7 Mn tonnes
Palm Oil Soya Oil Rapeseed Oil Sunflower Oil
Tallow Coconut oil Other oils & fats Used cooking oil

SIPEF group – Palm oil in the worldPalm oil use for biodiesel EU
29
Source: Oilworld
EU 26%
NON EU74%
2019: Palm oil use for Biodiesel Total of 17,6 Mn tonnes
EU NON EU
4,5 Mn tonnes
13,1 Mn tonnes
EU36%
Non EU64%
2017 Palm oil use for Biodiesel Total of 11,7 Mn tonnes
EU Non EU
4,2 Mn tonnes
7,4 Mn tonnes
Summary
The Connection to the world of Sustainable Tropical Agriculture 30
SIPEF group - Company profile
SIPEF group - Palm oil in the world
SIPEF group - Production & prices
SIPEF group – Financial performance
SIPEF group - Prospects

SIPEF group – Productions & pricesGroup production PALM OIL – December 2020
The Connection to the world of Sustainable Tropical Agriculture 31
Palm Oil 2020 2019 Variance
Own
Tolan Tiga Group 67 310 70 489 -4,51%
Umbul Mas Wisesa Group 38 413 38 089 0,85%
Agro Muko Group 83 545 82 007 1,88%
South Sumatra Group 15 772 14 227 10,86%
Hargy Oil Palms 66 432 59 829 11,04%
Total own 271 472 264 641 2,58%
Outgrowers
Tolan Tiga Group 549 150 265,58%
Umbul Mas Wisesa Group 132 151 -12,58%
Agro Muko Group 3 671 3 541 3,68%
South Sumatra Group 1 769 1 023 72,92%
Hargy Oil Palms 51 691 43 008 20,19%
Total outgrowers 57 812 47 873 20,76%
Total Palm Oil 329 284 312 514 5,37%

SIPEF group – Productions & pricesGroup production RUBBER – December 2020
The Connection to the world of Sustainable Tropical Agriculture
32
Rubber 2020 2019 Variance
Own
Tolan Tiga Group 918 972 -5,51%
Melania 2 695 2 379 13,28%
Agro Muko 1 686 2 144 -21,34%
Total own 5 300 5 495 -3,55%
Outgrowers
Tolan Tiga Group 711 831 -14,44%
Total Rubber 6 011 6 326 -4,98%
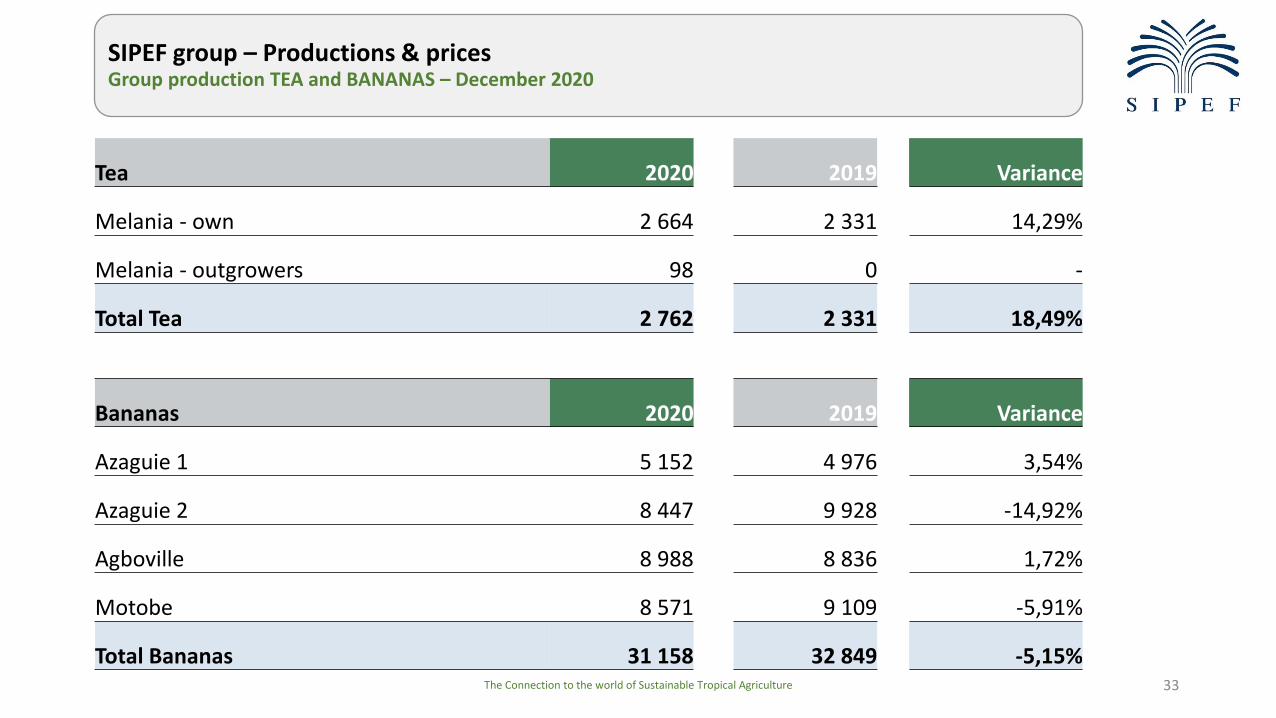
SIPEF group – Productions & pricesGroup production TEA and BANANAS – December 2020
The Connection to the world of Sustainable Tropical Agriculture 33
Tea 2020 2019 Variance
Melania - own 2 664 2 331 14,29%
Melania - outgrowers 98 0 -
Total Tea 2 762 2 331 18,49%
Bananas 2020 2019 Variance
Azaguie 1 5 152 4 976 3,54%
Azaguie 2 8 447 9 928 -14,92%
Agboville 8 988 8 836 1,72%
Motobe 8 571 9 109 -5,91%
Total Bananas 31 158 32 849 -5,15%

SIPEF group – Production & pricesBull & Bear
The Connection to the world of Sustainable Tropical Agriculture 34
Rating Bullish inputs Bearish inputs
Palm Oil
Feb 1045
Mar 1020
AMJ 900
JAS 820
OND 800
supported - Super tight stocks in Mal and Indo. Mal lowest
since 2007.
- Production has started the low cycle.
- B30 blending program supported by export levy.
- Inverses will probably continue to roll.
- Palm is still competitive vis-à-vis other oils
- Sun seed, soybean situation very tight globally.
Also bullish corn and wheat story…fight for acres.
- The Funds have exited their massive longs in the
recent sell-off
- Petro rally
- Absolute high price and massive inverses will reduce exports / kill
demand
- Market expects strong palm production in second half 2020 (once
they see the confirmation, it could trigger a sell off)
- India changed its import tax system at the disadvantage of palm vs
other oils
- Will China play with state reserves to enforce a lower market?
- High soybean price could lead to bigger new planting in Northern
Hemisphere (fight for acres)
- Gasoil still a significant discount to vegoil, it will continue to test
biodiesel mandates.
Rubber
RSS3 2240
SIR10 1600
Neutral - Short term supply deficit due to La Nina weather
in Indo, Thailand and Vietnam
- Strong demand for latex from glove industry due
to Covid-19
- Chinese economy seems to do well
- Still long term oversupply, once production hiccup is over, prices
tend to slide…
- The car industry is picking up again, but still running lower vs pre-
Covid
- Consolidation in prices, but a lack of physical demand
Tea Neutral - La Nina weather should bring a lot of rain,
hampering harvest.
- Kenyan record production in 2020 and high stocks still need to be
placed.
A higher or lower export levy and tax can trigger a rally
or a sell-off – a vicious circle

SIPEF group – Production & pricesCPO prices CIF Rotterdam 2019 – 2020
35
450
500
550
600
650
700
750
800
850
900
950
1 000
J F M A M J J A S O N D
Crude Palm Oil in $/mtCIF Rotterdam
2019 2020
Source: Oil World

The Connection to the world of Sustainable Tropical Agriculture
SIPEF group – Production & pricesSpread crude palm oil – soybean oil
36
500
600
700
800
900
1 000
1 100
1 200
1 300
1 400
20
10
M0
1
20
10
M0
3
20
10
M0
5
20
10
M0
7
20
10
M0
9
20
10
M1
1
20
11
M0
1
20
11
M0
3
20
11
M0
5
20
11
M0
7
20
11
M0
9
20
11
M1
1
20
12
M0
1
20
12
M0
3
20
12
M0
5
20
12
M0
7
20
12
M0
9
20
12
M1
1
20
13
M0
1
20
13
M0
3
20
13
M0
5
20
13
M0
7
20
13
M0
9
20
13
M1
1
20
14
M0
1
20
14
M0
3
20
14
M0
5
20
14
M0
7
20
14
M0
9
20
14
M1
1
20
15
M0
1
20
15
M0
3
20
15
M0
5
20
15
M0
7
20
15
M0
9
20
15
M1
1
20
16
M0
1
20
16
M0
3
20
16
M0
5
20
16
M0
7
20
16
M0
9
20
16
M1
1
20
17
M0
1
20
17
M0
3
20
17
M0
5
20
17
M0
7
20
17
M0
9
20
17
M1
1
20
18
M0
1
20
18
M0
3
20
18
M0
5
20
18
M0
7
20
18
M0
9
20
18
M1
1
20
19
M0
1
20
19
M0
3
20
19
M0
5
20
19
M0
7
20
19
M0
9
20
19
M1
1
20
20
M0
1
20
20
M0
3
20
20
M0
5
20
20
M0
7
20
20
M0
9
20
20
M1
1
20
21
M0
1
Spread CPO - Soybean oil
CPO Soybean oil
Source: Worldbank

SIPEF group – Production & pricesRSS3 Rubber prices 2019 – 2020
The Connection to the world of Sustainable Tropical Agriculture 37
1 200
1 400
1 600
1 800
2 000
2 200
2 400
J F M A M J J A S O N D
RSS3 in $/mt FOB Singapore
2019 2020
Source: Worldbank
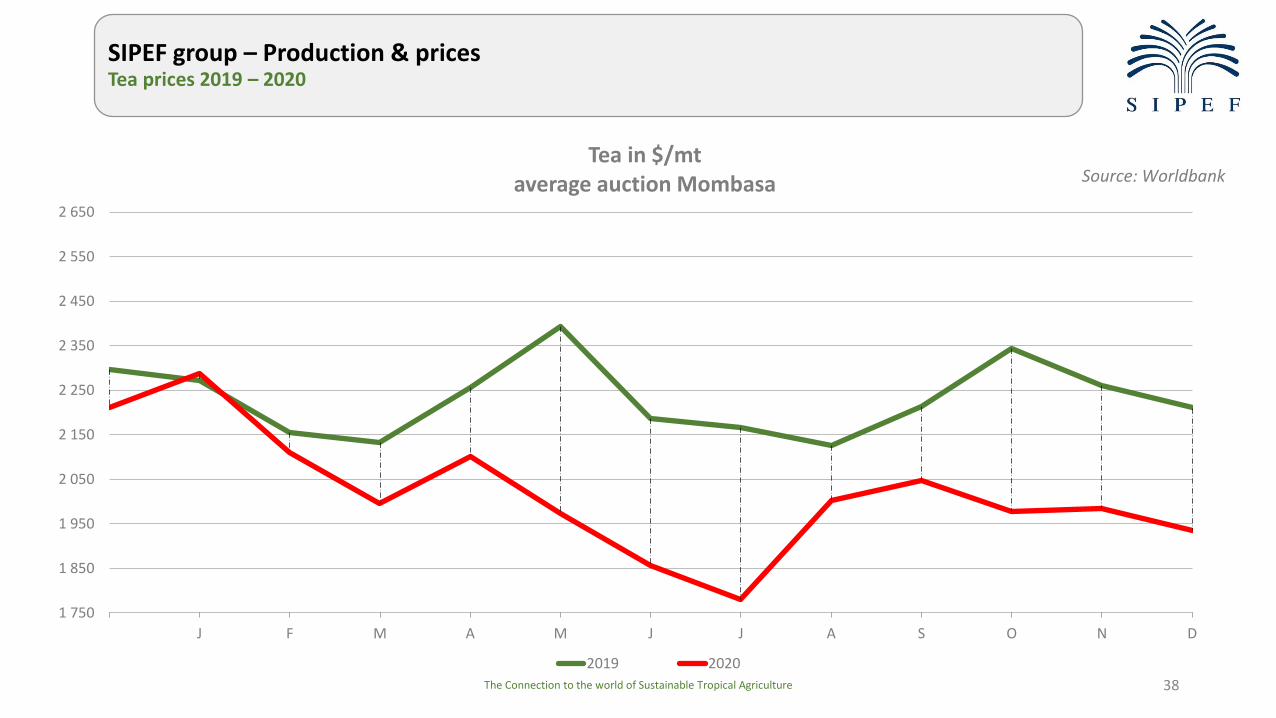
SIPEF group – Production & pricesTea prices 2019 – 2020
The Connection to the world of Sustainable Tropical Agriculture 38
1 750
1 850
1 950
2 050
2 150
2 250
2 350
2 450
2 550
2 650
J F M A M J J A S O N D
Tea in $/mt average auction Mombasa
2019 2020
Source: Worldbank

Summary
The Connection to the world of Sustainable Tropical Agriculture 39
SIPEF group - Company profile
SIPEF group - Palm oil in the world
SIPEF group - Production & prices
SIPEF group – Financial statements
SIPEF group - Prospects

SIPEF group – Financial statementsExchange rates
The Connection to the world of Sustainable Tropical Agriculture 40

SIPEF group - Financial statementsIncome statement – actuals CY vs actuals PY
The Connection to the world of Sustainable Tropical Agriculture
41
IN KUSD 2020 actuals 2019 actuals % diffGross margin Palm 59.746 34.445 +73%
Rubber -1.814 -2.244 -19%Tea -788 -370 113%Bananas 4.199 4.548 -8%Horticulture 191 148 29%
G&A including corporate -30.750 -30.846 0%Other operating -6 -741Operating result 30.778 4.940
Finance income/charges -4.459 -5.002Discount Sipef CI 1.368 1.689Exchange 378 -775Financial result -2.713 -4.088
Profit before tax 28.065 852Tax* -10.828 -6.772Profit after tax 17.237 -5.920Associated companies -1.059 -1.484Profit for the period 16.178 -7.404
Minority interests 2.055 600Group share 14.123 -8.004

SIPEF group - Financial statementsIncome statement – tax expense detail*
The Connection to the world of Sustainable Tropical Agriculture
42
Dec 2020 Jun 2020
Result before tax 28 065 2 468
23,3% 12,3%
Theoretical tax charge -6 545 -304
Corrections on last year +76 0
Change in tax-% +685 +685
Impairment/Reversal on DT -3 130 -964
Other non-deductible -1 915 -1 103
Tax charge -10 828 -1 686
Effective tax rate 38,6% 68,3%

SIPEF group - Financial statementsIncome statement per semester
The Connection to the world of Sustainable Tropical Agriculture 43
IN KUSD 31/12/2020 30/06/2020 2nd sem
Operating result 30.778 4.621 26.157
Financial result -2.713 -2.153 -560
Profit before tax 28.065 2.468 25.597
Tax -10.828 -1.686 -9.142
Profit after tax 17.237 782 16.455
Associated companies -1.059 -578 -481
Profit for the period 16.178 204 15.974

SIPEF group - Financial statementsConsolidated balance sheet (management presentation)
The Connection to the world of Sustainable Tropical Agriculture 44
In KUSD (management presentation) 2020 2019
Biological assets (depreciated costs) - bearer plants 315 826 306 342
Goodwill 104 782 104 782
Other fixed assets 359 994 365 412
Receivables > 1 year 16 101 13 442
Net current assets, net of cash 86 137 94 013
Net cash position -151 165 -164 623
Total net assets 731 675 719 368
Shareholders' equity, group share 638 688 628 686
Non controlling interest 35 862 34 325
Provisions and deferred tax liabilities 57 126 56 358
Total net liabilities 731 675 719 368
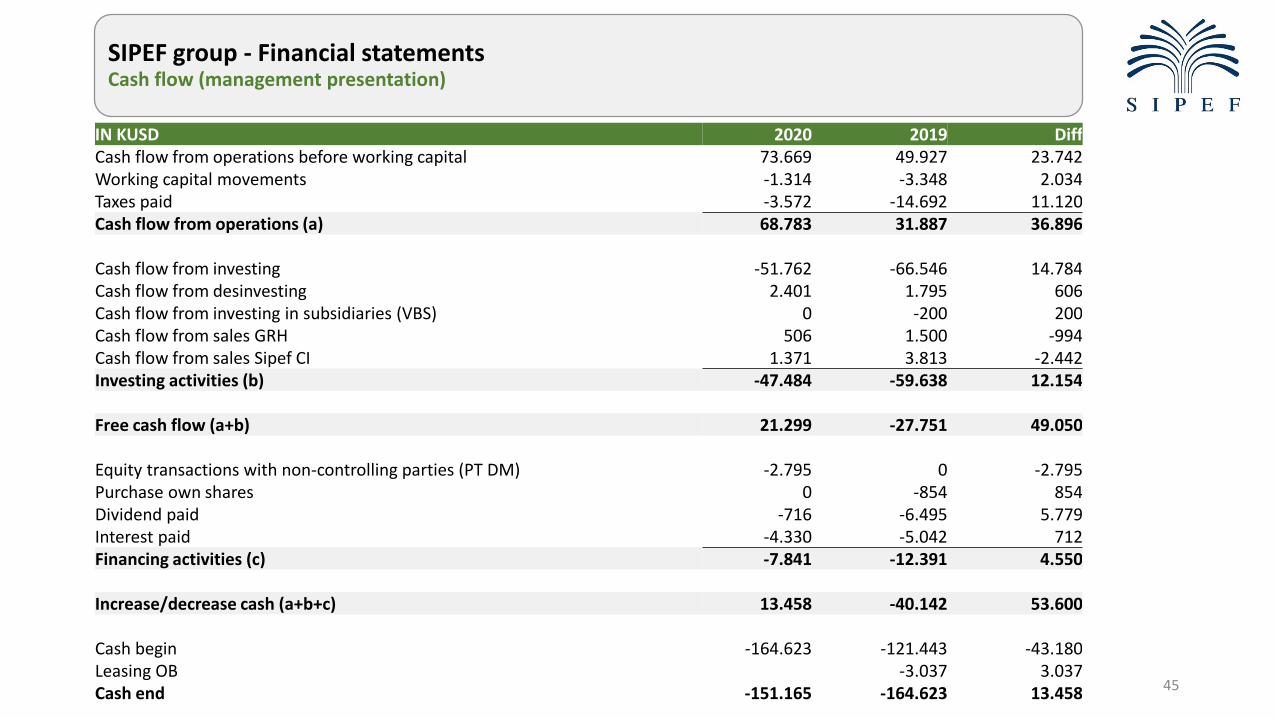
SIPEF group - Financial statementsCash flow (management presentation)
45
IN KUSD 2020 2019 DiffCash flow from operations before working capital 73.669 49.927 23.742Working capital movements -1.314 -3.348 2.034Taxes paid -3.572 -14.692 11.120Cash flow from operations (a) 68.783 31.887 36.896
Cash flow from investing -51.762 -66.546 14.784Cash flow from desinvesting 2.401 1.795 606Cash flow from investing in subsidiaries (VBS) 0 -200 200Cash flow from sales GRH 506 1.500 -994Cash flow from sales Sipef CI 1.371 3.813 -2.442Investing activities (b) -47.484 -59.638 12.154
Free cash flow (a+b) 21.299 -27.751 49.050
Equity transactions with non-controlling parties (PT DM) -2.795 0 -2.795Purchase own shares 0 -854 854Dividend paid -716 -6.495 5.779Interest paid -4.330 -5.042 712Financing activities (c) -7.841 -12.391 4.550
Increase/decrease cash (a+b+c) 13.458 -40.142 53.600
Cash begin -164.623 -121.443 -43.180Leasing OB -3.037 3.037Cash end -151.165 -164.623 13.458

SIPEF group - Financial statementsFinancial covenant LT loan per 31 December 2020
46
• Level of financial covenant according to new LT loan dd August 2019:
• At December 31, 2020 debt/ebitda was 2,06x→ covenant respected
• This lower covenant level will reduce the interest margin on long term loans to market +2.0% as from April 2021 (against market +2.5% currently).
• Simulations show that for June 2021 and December 2021 no issues are expected
31/12/2019 3,50x
30/06/2020 3,25x
31/12/2020 3,00x
30/06/2021 2,75x
31/12/2021 and thereafter 2,50x

SIPEF group - Financial statementsDividend proposal
The Connection to the world of Sustainable Tropical Agriculture
47

Summary
The Connection to the world of Sustainable Tropical Agriculture 48
SIPEF group - Company profile
SIPEF group - Palm oil in the world
SIPEF group - Production & prices
SIPEF group – Financial performance
SIPEF Group – Prospects

SIPEF group – ProspectsProspects – 11/02/2021
49
✓ Production➢ Prospects for palm oil production for the first quarter, based on the count of the hanging fruits, remains
positive for the Indonesian activity with the main growth expected in Musi Rawas;➢ Prospects for palm oil production in HOPL in the first quarter are positive (recovery volcanic eruption);➢ Production of palm oil for 2021 expected to increase more than 10% compared to volumes of 2020.
✓ Markets➢ High prices and massive inverses on the palm oil market; ➢ Stocks expected to remain low until the middle of the summer → very solid foundation for an elevated price
level for entire 2021;➢ Rubber market still suffers from insufficient production due to La Niña;➢ High carry-forward tea stock in Mombasa → hampers significant price increases;

SIPEF group – ProspectsProspects – 11/02/2021
50
✓ Cash flow and expansion➢ Investment policy remains to be fully focused on development of palm oil activities in South Sumatra;➢ Steadily continuing on replanting of own palm plantation areas in Dendymarker and plasma;➢ Expansion of the processing capacity in Dendymarker mill from 20 to 60 tonnes per hour, delayed by the
pandemic, is now priority;➢ New 10% shareholder in VBS => Indonesian listed plantation company Dharma Satya Nusantara (DSNG).
✓ Result➢ 36% of expected production volumes have been sold at an average price of USD 827 CIF Rotterdam,
premiums included;➢ The excessive government levies on Indonesian palm oil supplies are limiting the profit potential for the
Group;➢ Due to the strong market and good production expectations better results are to be expected in 2021
structure in Indonesia.

The Connection to the world of Sustainable Tropical Agriculture 51
Recommended