“The text was adapted by The Saylor Foundation under the CC BY-NC-SA without attribution as requested by the works original creator or l icensee”
Saylor.org Saylor URL: http://www.saylor.org/books/
1
“The text was adapted by The Saylor Foundation under the
CC BY-NC-SA without attribution as requested by the works original creator or licensee”
11.2 Oligopoly: Competition Among the Few
LEARNING OBJECTIVES
1. Explain the main characteristics of an oligopoly, differentiating it from other
types of market structures.
2. Explain the measures that are used to determine the degree of
concentration in an industry.
3. Explain and illustrate the collusion model of oligopoly.
4. Discuss how game theory can be used to understand the behavior of firms in
an oligopoly.
In July, 2005, General Motors Corporation (GMC) offered “employee discount
pricing” to virtually all GMC customers, not just employees and their relatives. This
new marketing strategy introduced by GMC obviously affected Ford, Chrysler,
Toyota and other automobile and truck manufacturers; Ford matched GMC’s
employee-discount plan by offering up to $1,000 to its own employees who
convinced friends to purchase its cars and trucks. Ford also offered its customers
the same prices paid by its employees. By mid-July, Chrysler indicated that it was
looking at many alternatives, but was waiting for GMC to make its next move.
Ultimately, Chrysler also offered employee discount pricing.
“The text was adapted by The Saylor Foundation under the CC BY-NC-SA without attribution as requested by the works original creator or l icensee”
Saylor.org Saylor URL: http://www.saylor.org/books/
2
Toyota had to respond. It quickly developed a new marketing strategy of its own,
which included lowering the prices of its cars and offering new financing terms. The
responses of Ford, Chrysler, and Toyota to GMC’s pricing strategy obviously affected
the outcome of that strategy. Similarly, a decision by Procter & Gamble to lower the
price of Crest toothpaste may elicit a response from Colgate-Palmolive, and that
response will affect the sales of Crest. In an oligopoly, the fourth and final market
structure that we will study, the market is dominated by a few firms, each of which
recognizes that its own actions will produce a response from its rivals and that
those responses will affect it.
The firms that dominate an oligopoly recognize that they are interdependent: What
one firm does affects each of the others. This interdependence stands in sharp
contrast to the models of perfect competition and monopolistic competition, where
we assume that each firm is so small that it assumes the rest of the market will, in
effect, ignore what it does. A perfectly competitive firm responds to the market, not
to the actions of any other firm. A monopolistically competitive firm responds to its
own demand, not to the actions of specific rivals. These presumptions greatly
simplify the analysis of perfect competition and monopolistic competition. We do
not have that luxury in oligopoly, where the interdependence of firms is the defining
characteristic of the market.
Some oligopoly industries make standardized products: steel, aluminum, wire, and
industrial tools. Others make differentiated products: cigarettes, automobiles,
computers, ready-to-eat breakfast cereal, and soft drinks.
“The text was adapted by The Saylor Foundation under the CC BY-NC-SA without attribution as requested by the works original creator or l icensee”
Saylor.org Saylor URL: http://www.saylor.org/books/
3
Measuring Concentration in Oligopoly
Oligopoly means that a few firms dominate an industry. But how many is “a few,”
and how large a share of industry output does it take to “dominate” the industry?
Compare, for example, the ready-to-eat breakfast cereal industry and the ice cream
industry. The cereal market is dominated by two firms, Kellogg’s and General Mills,
which together hold more than half the cereal market. This oligopoly operates in a
highly concentrated market. The market for ice cream, where the four largest firms
account for just less than a third of output, is much less concentrated.
One way to measure the degree to which output in an industry is concentrated
among a few firms is to use a concentration ratio, which reports the percentage of
output accounted for by the largest firms in an industry. The higher the
concentration ratio, the more the firms in the industry take account of their rivals’
behavior. The lower the concentration ratio, the more the industry reflects the
characteristics of monopolistic competition or perfect competition.
The U.S. Census Bureau, based on surveys it conducts of manufacturing firms every
five years, reports concentration ratios. These surveys show concentration ratios for

“The text was adapted by The Saylor Foundation under the CC BY-NC-SA without attribution as requested by the works original creator or l icensee”
Saylor.org Saylor URL: http://www.saylor.org/books/
4
the largest 4, 8, 20, and 50 firms in each industry category. Some concentration
ratios from the 2002 survey, the latest available, are reported in Table 11.1
"Concentration Ratios and Herfindahl–Hirschman Indexes". Notice that the four-
firm concentration ratio for breakfast cereals is 78%; for ice cream it is 48%.
Table 11.1 Concentration Ratios and Herfindahl–Hirschman Indexes
Industry
Largest 4 firms
Largest 8 firms
Largest 20 firms
Largest 50 firms HHI
Ice cream 48 64 82 93 736
Breakfast cereals 78 91 99 100 2521
Cigarettes 95 99 100
*D
Men’s and boys’ shirts 38 53 73 89 481
Women’s and girls’ blouses and shirts 21 32 49 70 186
Automobiles 76 94 99 100 1911
Sporting and athletic goods 23 32 46 62 182
Dental laboratories 13 18 23 30 54
*D, data withheld by the government to avoid revealing information about specific firms.
“The text was adapted by The Saylor Foundation under the CC BY-NC-SA without attribution as requested by the works original creator or l icensee”
Saylor.org Saylor URL: http://www.saylor.org/books/
5
Two measures of industry concentration are reported by the Census Bureau:
concentration ratios and the Herfindahl–Hirschman Index (HHI).
Source: Selected statistics from Sector 31: Manufacturing: Subject Series—
Concentration Ratios: Share of Value of Shipments Accounted for by the 4, 8, 20, and
50 Largest Companies for Industries: 2002
at http://www.census.gov/epcd/www/concentration.html.
An alternative measure of concentration is found by squaring the percentage share
(stated as a whole number) of each firm in an industry, then summing these squared
market shares to derive aHerfindahl–Hirschman Index (HHI). The largest HHI
possible is the case of monopoly, where one firm has 100% of the market; the index
is 1002, or 10,000. An industry with two firms, each with 50% of total output, has an
HHI of 5,000 (502 + 502). In an industry with 10,000 firms that have 0.01% of the
market each, the HHI is 1. Herfindahl–Hirschman Indexes reported by the Census
Bureau are also given in Table 11.1 "Concentration Ratios and Herfindahl–
Hirschman Indexes". Notice that the HHI is 2,521 for breakfast cereals and only 736
for ice cream, suggesting that the ice cream industry is more competitive than the
breakfast cereal industry.
In some cases, the census data understate the degree to which a few firms dominate
the market. One problem is that industry categories may be too broad to capture
significant cases of industry dominance. The sporting goods industry, for example,
appears to be highly competitive if we look just at measures of concentration, but
markets for individual goods, such as golf clubs, running shoes, and tennis rackets,

“The text was adapted by The Saylor Foundation under the CC BY-NC-SA without attribution as requested by the works original creator or l icensee”
Saylor.org Saylor URL: http://www.saylor.org/books/
6
tend to be dominated by a few firms. Further, the data reflect shares of the national
market. A tendency for regional domination does not show up. For example, the
concrete industry appears to be highly competitive. But concrete is produced in
local markets—it is too expensive to ship it very far—and many of these local
markets are dominated by a handful of firms.
The census data can also overstate the degree of actual concentration. The
“automobiles” category, for example, has a four-firm concentration ratio that
suggests the industry is strongly dominated by four large firms (in fact, U.S.
production is dominated by three: General Motors, Ford, and Chrysler). Those firms
hardly account for all car sales in the United States, however, as other foreign
producers have captured a large portion of the domestic market. Including those
foreign competitors suggests a far less concentrated industry than the census data
imply.
The Collusion Model
There is no single model of profit-maximizing oligopoly behavior that corresponds
to economists’ models of perfect competition, monopoly, and monopolistic
competition. Uncertainty about the interaction of rival firms makes specification of a
single model of oligopoly impossible. Instead, economists have devised a variety of
models that deal with the uncertain nature of rivals’ responses in different ways. In
this section we review one type of oligopoly model, the collusion model. After
“The text was adapted by The Saylor Foundation under the CC BY-NC-SA without attribution as requested by the works original creator or l icensee”
Saylor.org Saylor URL: http://www.saylor.org/books/
7
examining this traditional approach to the analysis of oligopoly behavior, we shall
turn to another method of examining oligopolistic interaction: game theory.
Firms in any industry could achieve the maximum profit attainable if they all agreed
to select the monopoly price and output and to share the profits. One approach to
the analysis of oligopoly is to assume that firms in the industry collude, selecting the
monopoly solution.
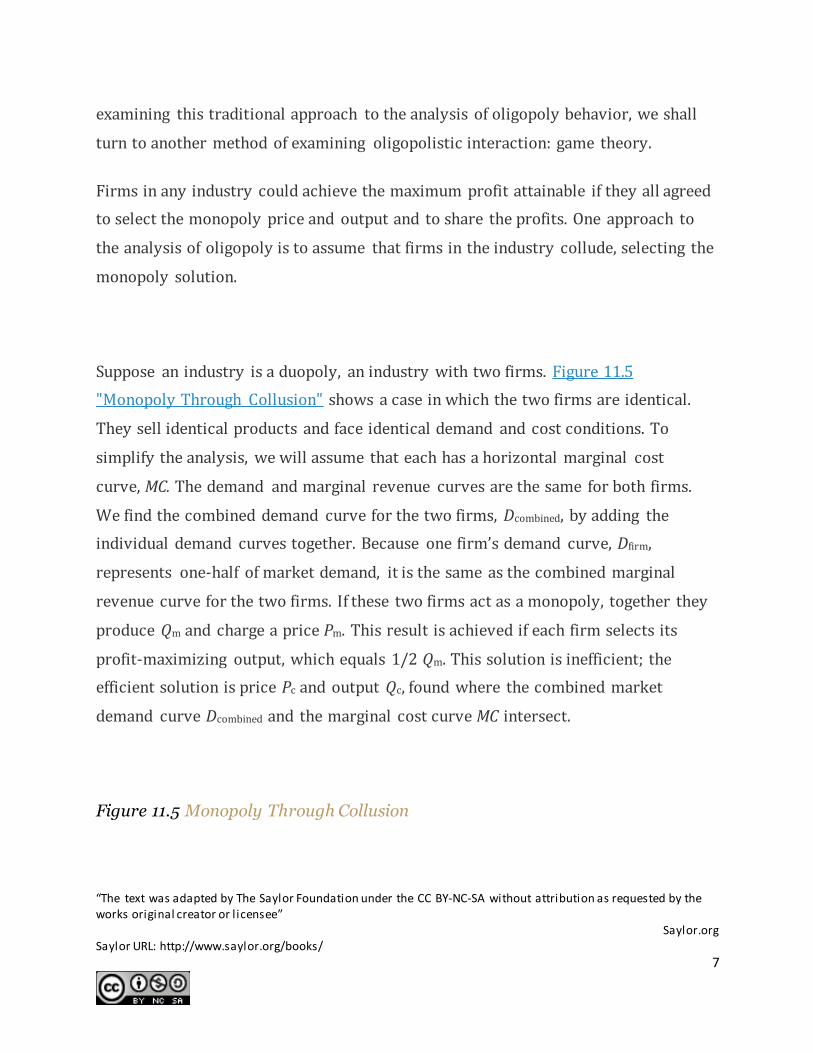
Suppose an industry is a duopoly, an industry with two firms. Figure 11.5
"Monopoly Through Collusion" shows a case in which the two firms are identical.
They sell identical products and face identical demand and cost conditions. To
simplify the analysis, we will assume that each has a horizontal marginal cost
curve, MC. The demand and marginal revenue curves are the same for both firms.
We find the combined demand curve for the two firms, Dcombined, by adding the
individual demand curves together. Because one firm’s demand curve, Dfirm,
represents one-half of market demand, it is the same as the combined marginal
revenue curve for the two firms. If these two firms act as a monopoly, together they
produce Qm and charge a price Pm. This result is achieved if each firm selects its
profit-maximizing output, which equals 1/2 Qm. This solution is inefficient; the
efficient solution is price Pc and output Qc, found where the combined market
demand curve Dcombined and the marginal cost curve MC intersect.
Figure 11.5 Monopoly Through Collusion

“The text was adapted by The Saylor Foundation under the CC BY-NC-SA without attribution as requested by the works original creator or l icensee”
Saylor.org Saylor URL: http://www.saylor.org/books/
8
Two identical firms have the same horizontal marginal cost curve MC. Their
demand curvesDfirm and marginal revenue curves MRfirm are also identical. The
combined demand curve isDcombined; the combined marginal revenue curve
is MRcombined. The profits of the two firms are maximized if each produces
1/2 Qm at point A. Industry output at point B is thus Qm and the price is Pm. At
point C, the efficient solution output would be Qc, and the price would equal MC.
In the simplest form of collusion, overt collusion, firms openly agree on price,
output, and other decisions aimed at achieving monopoly profits. Firms that
coordinate their activities through overt collusion and by forming collusive
coordinating mechanisms make up a cartel.
Firms form a cartel to gain monopoly power. A successful cartel can earn large
profits, but there are several problems with forming and maintaining one. First, in
many countries, including the United States, cartels are generally illegal. [1] They are
banned, because their purpose is to raise prices and restrict output. Second, the
cartel may not succeed in inducing all firms in the industry to join. Firms that
remain outside the cartel can compete by lowering price, and thus they prevent the
cartel from achieving the monopoly solution. Third, there is always an incentive for
individual members to cheat on cartel agreements. Suppose the members of a cartel
have agreed to impose the monopoly price in their market and to limit their output
accordingly. Any one firm might calculate that it could charge slightly less than the
cartel price and thus capture a larger share of the market for itself. Cheating firms
expand output and drive prices down below the level originally chosen.

“The text was adapted by The Saylor Foundation under the CC BY-NC-SA without attribution as requested by the works original creator or l icensee”
Saylor.org Saylor URL: http://www.saylor.org/books/
9
The Organization of Petroleum Exporting Countries (OPEC), perhaps the best-
known cartel, is made up of 13 oil-producing countries. In the 1970s, OPEC
successfully acted like a monopoly by restricting output and raising prices. By the
mid-1980s, however, the monopoly power of the cartel had been weakened by
expansion of output by nonmember producers such as Mexico and Norway and by
cheating among the cartel members.
An alternative to overt collusion is tacit collusion, an unwritten, unspoken
understanding through which firms agree to limit their competition. Firms may, for
example, begin following the price leadership of a particular firm, raising or
lowering their prices when the leader makes such a change. The price leader may be
the largest firm in the industry, or it may be a firm that has been particularly good at
assessing changes in demand or cost. At various times, tacit collusion has been
alleged to occur in a wide range of industries, including steel, cars, and breakfast
cereals.
It is difficult to know how common tacit collusion is. The fact that one firm changes
its price shortly after another one does cannot prove that a tacit conspiracy exists.
After all, we expect to see the prices of all firms in a perfectly competitive industry
moving together in response to changes in demand or production costs.
“The text was adapted by The Saylor Foundation under the CC BY-NC-SA without attribution as requested by the works original creator or l icensee”
Saylor.org Saylor URL: http://www.saylor.org/books/
10
Game Theory and Oligopoly Behavior
Oligopoly presents a problem in which decision makers must select strategies by
taking into account the responses of their rivals, which they cannot know for sure in
advance. The Start Up feature at the beginning of this chapter suggested the
uncertainty eBay faces as it considers the possibility of competition from Google. A
choice based on the recognition that the actions of others will affect the outcome of
the choice and that takes these possible actions into account is called
a strategic choice. Game theory is an analytical approach through which strategic
choices can be assessed.
Among the strategic choices available to an oligopoly firm are pricing choices,
marketing strategies, and product-development efforts. An airline’s decision to raise
or lower its fares—or to leave them unchanged—is a strategic choice. The other
airlines’ decision to match or ignore their rival’s price decision is also a strategic
choice. IBM boosted its share in the highly competitive personal computer market in
large part because a strategic product-development strategy accelerated the firm’s
introduction of new products.
Once a firm implements a strategic decision, there will be an outcome. The outcome
of a strategic decision is called a payoff. In general, the payoff in an oligopoly game is
the change in economic profit to each firm. The firm’s payoff depends partly on the
strategic choice it makes and partly on the strategic choices of its rivals. Some firms
in the airline industry, for example, raised their fares in 2005, expecting to enjoy
increased profits as a result. They changed their strategic choices when other
“The text was adapted by The Saylor Foundation under the CC BY-NC-SA without attribution as requested by the works original creator or l icensee”
Saylor.org Saylor URL: http://www.saylor.org/books/
11
airlines chose to slash their fares, and all firms ended up with a payoff of lower
profits—many went into bankruptcy.
We shall use two applications to examine the basic concepts of game theory. The
first examines a classic game theory problem called the prisoners’ dilemma. The
second deals with strategic choices by two firms in a duopoly.
The Prisoners’ Dilemma
Suppose a local district attorney (DA) is certain that two individuals, Frankie and
Johnny, have committed a burglary, but she has no evidence that would be
admissible in court.
The DA arrests the two. On being searched, each is discovered to have a small
amount of cocaine. The DA now has a sure conviction on a possession of cocaine
charge, but she will get a conviction on the burglary charge only if at least one of the
prisoners confesses and implicates the other.
The DA decides on a strategy designed to elicit confessions. She separates the two
prisoners and then offers each the following deal: “If you confess and your partner
doesn’t, you will get the minimum sentence of one year in jail on the possession and
burglary charges. If you both confess, your sentence will be three years in jail. If

“The text was adapted by The Saylor Foundation under the CC BY-NC-SA without attribution as requested by the works original creator or l icensee”
Saylor.org Saylor URL: http://www.saylor.org/books/
12
your partner confesses and you do not, the plea bargain is off and you will get six
years in prison. If neither of you confesses, you will each get two years in prison on
the drug charge.”
The two prisoners each face a dilemma; they can choose to confess or not confess.
Because the prisoners are separated, they cannot plot a joint strategy. Each must
make a strategic choice in isolation.
The outcomes of these strategic choices, as outlined by the DA, depend on the
strategic choice made by the other prisoner. The payoff matrix for this game is given
in Figure 11.6 "Payoff Matrix for the Prisoners’ Dilemma" . The two rows represent
Frankie’s strategic choices; she may confess or not confess. The two columns
represent Johnny’s strategic choices; he may confess or not confess. There are four
possible outcomes: Frankie and Johnny both confess (cell A), Frankie confesses but
Johnny does not (cell B), Frankie does not confess but Johnny does (cell C), and
neither Frankie nor Johnny confesses (cell D). The portion at the lower left in each
cell shows Frankie’s payoff; the shaded portion at the upper right shows Johnny’s
payoff.
Figure 11.6 Payoff Matrix for the Prisoners’ Dilemma
The four cells represent each of the possible outcomes of the prisoners’ game.
“The text was adapted by The Saylor Foundation under the CC BY-NC-SA without attribution as requested by the works original creator or l icensee”
Saylor.org Saylor URL: http://www.saylor.org/books/
13
If Johnny confesses, Frankie’s best choice is to confess—she will get a three-year
sentence rather than the six-year sentence she would get if she did not confess. If
Johnny does not confess, Frankie’s best strategy is still to confess—she will get a
one-year rather than a two-year sentence. In this game, Frankie’s best strategy is to
confess, regardless of what Johnny does. When a player’s best strategy is the same
regardless of the action of the other player, that strategy is said to be
a dominant strategy. Frankie’s dominant strategy is to confess to the burglary.
For Johnny, the best strategy to follow, if Frankie confesses, is to confess. The best
strategy to follow if Frankie does not confess is also to confess. Confessing is a
dominant strategy for Johnny as well. A game in which there is a dominant strategy
for each player is called adominant strategy equilibrium. Here, the dominant
strategy equilibrium is for both prisoners to confess; the payoff will be given by cell
A in the payoff matrix.
From the point of view of the two prisoners together, a payoff in cell D would have
been preferable. Had they both denied participation in the robbery, their combined
sentence would have been four years in prison—two years each. Indeed, cell D
offers the lowest combined prison time of any of the outcomes in the payoff matrix.
But because the prisoners cannot communicate, each is likely to make a strategic
choice that results in a more costly outcome. Of course, the outcome of the game
depends on the way the payoff matrix is structured.
“The text was adapted by The Saylor Foundation under the CC BY-NC-SA without attribution as requested by the works original creator or l icensee”
Saylor.org Saylor URL: http://www.saylor.org/books/
14
Repeated Oligopoly Games
The prisoners’ dilemma was played once, by two players. The players were given a
payoff matrix; each could make one choice, and the game ended after the first round
of choices.
The real world of oligopoly has as many players as there are firms in the industry.
They play round after round: a firm raises its price, another firm introduces a new
product, the first firm cuts its price, a third firm introduces a new marketing
strategy, and so on. An oligopoly game is a bit like a baseball game with an unlimited
number of innings—one firm may come out ahead after one round, but another will
emerge on top another day. In the computer industry game, the introduction of
personal computers changed the rules. IBM, which had won the mainframe game
quite handily, struggles to keep up in a world in which rivals continue to slash prices
and improve quality.
Oligopoly games may have more than two players, so the games are more complex,
but this does not change their basic structure. The fact that the games are repeated
introduces new strategic considerations. A player must consider not just the ways in
which its choices will affect its rivals now, but how its choices will affect them in the
future as well.

“The text was adapted by The Saylor Foundation under the CC BY-NC-SA without attribution as requested by the works original creator or l icensee”
Saylor.org Saylor URL: http://www.saylor.org/books/
15
We will keep the game simple, however, and consider a duopoly game. The two
firms have colluded, either tacitly or overtly, to create a monopoly solution. As long
as each player upholds the agreement, the two firms will earn the maximum
economic profit possible in the enterprise.
There will, however, be a powerful incentive for each firm to cheat. The monopoly
solution may generate the maximum economic profit possible for the two firms
combined, but what if one firm captures some of the other firm’s profit? Suppose, for
example, that two equipment rental firms, Quick Rent and Speedy Rent, operate in a
community. Given the economies of scale in the business and the size of the
community, it is not likely that another firm will enter. Each firm has about half the
market, and they have agreed to charge the prices that would be chosen if the two
combined as a single firm. Each earns economic profits of $20,000 per month.
Quick and Speedy could cheat on their arrangement in several ways. One of the
firms could slash prices, introduce a new line of rental products, or launch an
advertising blitz. This approach would not be likely to increase the total profitability
of the two firms, but if one firm could take the other by surprise, it might profit at
the expense of its rival, at least for a while.
We will focus on the strategy of cutting prices, which we will call a strategy of
cheating on the duopoly agreement. The alternative is not to cheat on the
agreement. Cheating increases a firm’s profits if its rival does not respond. Figure
“The text was adapted by The Saylor Foundation under the CC BY-NC-SA without attribution as requested by the works original creator or l icensee”
Saylor.org Saylor URL: http://www.saylor.org/books/
16
11.7 "To Cheat or Not to Cheat: Game Theory in Oligopoly" shows the payoff matrix
facing the two firms at a particular time. As in the prisoners’ dilemma matrix, the
four cells list the payoffs for the two firms. If neither firm cheats (cell D), profits
remain unchanged.
Figure 11.7 To Cheat or Not to Cheat: Game Theory in Oligopoly
Two rental firms, Quick Rent and Speedy Rent, operate in a duopoly market.
They have colluded in the past, achieving a monopoly solution. Cutting prices
means cheating on the arrangement; not cheating means maintaining current
prices. The payoffs are changes in monthly profits, in thousands of dollars. If
neither firm cheats, then neither firm’s profits will change. In this game,
cheating is a dominant strategy equilibrium.
This game has a dominant strategy equilibrium. Quick’s preferred strategy,
regardless of what Speedy does, is to cheat. Speedy’s best strategy, regardless of
what Quick does, is to cheat. The result is that the two firms will select a strategy
that lowers their combined profits!
Quick Rent and Speedy Rent face an unpleasant dilemma. They want to maximize
profit, yet each is likely to choose a strategy inconsistent with that goal. If they
continue the game as it now exists, each will continue to cut prices, eventually
driving prices down to the point where price equals average total cost (presumably,
“The text was adapted by The Saylor Foundation under the CC BY-NC-SA without attribution as requested by the works original creator or l icensee”
Saylor.org Saylor URL: http://www.saylor.org/books/
17
the price-cutting will stop there). But that would leave the two firms with zero
economic profits.
Both firms have an interest in maintaining the status quo of their collusive
agreement. Overt collusion is one device through which the monopoly outcome may
be maintained, but that is illegal. One way for the firms to encourage each other not
to cheat is to use a tit-for-tat strategy. In a tit-for-tat strategy a firm responds to
cheating by cheating, and it responds to cooperative behavior by cooperating. As
each firm learns that its rival will respond to cheating by cheating, and to
cooperation by cooperating, cheating on agreements becomes less and less likely.
Still another way firms may seek to force rivals to behave cooperatively rather than
competitively is to use a trigger strategy, in which a firm makes clear that it is
willing and able to respond to cheating by permanently revoking an agreement. A
firm might, for example, make a credible threat to cut prices down to the level of
average total cost—and leave them there—in response to any price-cutting by a
rival. A trigger strategy is calculated to impose huge costs on any firm that cheats—
and on the firm that threatens to invoke the trigger. A firm might threaten to invoke
a trigger in hopes that the threat will forestall any cheating by its rivals.
Game theory has proved to be an enormously fruitful approach to the analysis of a
wide range of problems. Corporations use it to map out strategies and to anticipate
rivals’ responses. Governments use it in developing foreign-policy strategies.
“The text was adapted by The Saylor Foundation under the CC BY-NC-SA without attribution as requested by the works original creator or l icensee”
Saylor.org Saylor URL: http://www.saylor.org/books/
18
Military leaders play war games on computers using the basic ideas of game theory.
Any situation in which rivals make strategic choices to which competitors will
respond can be assessed using game theory analysis.
One rather chilly application of game theory analysis can be found in the period of
the Cold War when the United States and the former Soviet Union maintained a
nuclear weapons policy that was described by the acronym MAD, which stood
for mutually assured destruction. Both countries had enough nuclear weapons to
destroy the other several times over, and each threatened to launch sufficient
nuclear weapons to destroy the other country if the other country launched a
nuclear attack against it or any of its allies. On its face, the MAD doctrine seems, well,
mad. It was, after all, a commitment by each nation to respond to any nuclear attack
with a counterattack that many scientists expected would end human life on earth.
As crazy as it seemed, however, it worked. For 40 years, the two nations did not go
to war. While the collapse of the Soviet Union in 1991 ended the need for a MAD
doctrine, during the time that the two countries were rivals, MAD was a very
effective trigger indeed.
Of course, the ending of the Cold War has not produced the ending of a nuclear
threat. Several nations now have nuclear weapons. The threat that Iran will
introduce nuclear weapons, given its stated commitment to destroy the state of
Israel, suggests that the possibility of nuclear war still haunts the world community.
“The text was adapted by The Saylor Foundation under the CC BY-NC-SA without attribution as requested by the works original creator or l icensee”
Saylor.org Saylor URL: http://www.saylor.org/books/
19
KEY TAKEAWAYS
The key characteristics of oligopoly are a recognition that the actions of one
firm will produce a response from rivals and that these responses will affect
it. Each firm is uncertain what its rivals’ responses might be.
The degree to which a few firms dominate an industry can be measured
using a concentration ratio or a Herfindahl–Hirschman Index.
One way to avoid the uncertainty firms face in oligopoly is through collusion.
Collusion may be overt, as in the case of a cartel, or tacit, as in the case of
price leadership.
Game theory is a tool that can be used to understand strategic choices by
firms.
Firms can use tit-for-tat and trigger strategies to encourage cooperative
behavior by rivals.
TRY IT!
Which model of oligopoly would seem to be most appropriate for analyzing
firms’ behavior in each of the situations given below?
1. When South Airlines lowers its fare between Miami and New York City,
North Airlines lowers its fare between the two cities. When South Airlines
raises its fare, North Airlines does too.
2. Whenever Bank A raises interest rates on car loans, other banks in the area
do too.
“The text was adapted by The Saylor Foundation under the CC BY-NC-SA without attribution as requested by the works original creator or l icensee”
Saylor.org Saylor URL: http://www.saylor.org/books/
20
3. In 1986, Saudi Arabia intentionally flooded the market with oil in order to
punish fellow OPEC members for cheating on their production quotas.
4. In July 1998, Saudi Arabia floated a proposal in which a group of eight or
nine major oil-exporting countries (including OPEC members and some
nonmembers, such as Mexico) would manage world oil prices by adjusting
their production.
Case in Point: Memory Chip Makers Caught in Global Price-Fixing Scheme
It may have been the remark by T.L. Chang, vice president of the Taiwan-based
memory chip manufacturer Mosel-Vitelic that sparked the investigation by the U.S.
Department of Justice Antitrust Division. Mr. Chang was quoted in
Taiwan’s Commercial Times in May 2002 as admitting to price-fixing meetings held
in Asia among the major producers of DRAM, or dynamic random access memory.
DRAM is the most common semi-conductor main memory format for storage and
retrieval of information that is used in personal computers, mobile phones, digital
cameras, MP3 music players, and other electronics products. At those meetings, as
well as through emails and telephone conferences, the main manufacturers of DRAM
decided not only what prices to charge and how much to make available, but also
exchanged information on DRAM sales for the purpose of monitoring and enforcing
adherence to the agreed prices. The collusion lasted for three years—from 1999 to
2002. In December 2001, DRAM prices were less than $1.00. By May of 2002, price
had risen to the $4 to $5 range.
“The text was adapted by The Saylor Foundation under the CC BY-NC-SA without attribution as requested by the works original creator or l icensee”
Saylor.org Saylor URL: http://www.saylor.org/books/
21
The companies that were directly injured by the higher chip prices included Dell,
Compaq, Hewlett-Packard, Apple, IBM, and Gateway. In the end, though, the
purchasers of their products paid in the form of higher prices or less memory.
In December 2003, a Micron Technology sales manager pled guilty to obstruction of
justice and served six months of home detention. The first chipmaker to plead guilty
a year later was Germany-based Infineon Technologies, which was fined $160
million. As of September 2007, five companies, Samsung being the largest, had been
charged fines of more than $732 million, and over 3,000 days of jail time had been
meted out to eighteen corporate executives.
The sharp reduction in the number of DRAM makers in the late 1990s undoubtedly
made it easier to collude. The industry is still quite concentrated with Samsung
holding 27.7% of the market and Hynix 21.3%. The price, however, has fallen quite
sharply in recent years.
Sources: Department of Justice, “Sixth Samsung Executive Agrees to Plead Guilty to
Participating in DRAM Price-Fixing Cartel,” Press Release April 19, 2007; Stephen
Labaton, “Infineon To Pay a Fine in the Fixing of Chip Prices,” The New York Times,
September 16, 2004; George Leopold and David Lammers, “DRAMs Under Gun in
Antitrust Probe”,Electronic Engineering Times, 1124 (June 24, 2002):1, 102; Lee
Sun-Young, “Samsung Cements DRAM Leadership,” Korea Herald, online, March 31,
2008.

“The text was adapted by The Saylor Foundation under the CC BY-NC-SA without attribution as requested by the works original creator or l icensee”
Saylor.org Saylor URL: http://www.saylor.org/books/
22
ANSWERS TO TRY IT! PROBLEMS
1. North Airlines seems to be practicing a price strategy known in game theory
as tit-for-tat.
2. The banks could be engaged in tacit collusion, with Bank A as the price
leader.
3. Saudi Arabia appears to have used a trigger strategy, another aspect of game
theory. In general, of course, participants hope they will never have to “pull”
the trigger, because doing so harms all participants. After years of cheating
by other OPEC members, Saudi Arabia did undertake a policy that hurt all
members of OPEC, including itself; OPEC has never since regained the
prominent role it played in oil markets.
4. Saudi Arabia seems to be trying to create another oil cartel, a form of overt
collusion.
[1] One legal cartel is the NCAA, which many economists regard as a successful device
through which member firms (colleges and universities) collude on a wide range of rules through which they produce sports.
11.3 Extensions of Imperfect Competition: Advertising and Price Discrimination
“The text was adapted by The Saylor Foundation under the CC BY-NC-SA without attribution as requested by the works original creator or l icensee”
Saylor.org Saylor URL: http://www.saylor.org/books/
23
LEARNING OBJECTIVES
1. Discuss the possible effects of advertising on competition, price, and output.
2. Define price discrimination, list the conditions that make it possible, and
explain the relationship between the price charged and price elasticity of
demand.
The models of monopoly and of imperfectly competitive markets allow us to explain
two commonly observed features of many markets: advertising and price
discrimination. Firms in markets that are not perfectly competitive try to influence
the positions of the demand curves they face, and hence profits, through advertising.
Profits may also be enhanced by charging different customers different prices. In
this section we will discuss these aspects of the behavior of firms in markets that are
not perfectly competitive.
Advertising
Firms in monopoly, monopolistic competition, and oligopoly use advertising when
they expect it to increase their profits. We see the results of these expenditures in a
daily barrage of advertising on television, radio, newspapers, magazines, billboards,
passing buses, park benches, the mail, home telephones, and the ubiquitous pop-up
advertisements on our computers—in virtually every medium imaginable. Is all this
advertising good for the economy?
“The text was adapted by The Saylor Foundation under the CC BY-NC-SA without attribution as requested by the works original creator or l icensee”
Saylor.org Saylor URL: http://www.saylor.org/books/
24
We have already seen that a perfectly competitive economy with fully defined and
easily transferable property rights will achieve an efficient allocation of resources.
There is no role for advertising in such an economy, because everyone knows that
firms in each industry produce identical products. Furthermore, buyers already
have complete information about the alternatives available to them in the market.
But perfect competition contrasts sharply with imperfect competition. Imperfect
competition can lead to a price greater than marginal cost and thus generate an
inefficient allocation of resources. Firms in an imperfectly competitive market may
advertise heavily. Does advertising cause inefficiency, or is it part of the solution?
Does advertising insulate imperfectly competitive firms from competition and allow
them to raise their prices even higher, or does it encourage greater competition and
push prices down?
There are two ways in which advertising could lead to higher prices for consumers.
First, the advertising itself is costly; in 2007, firms in the United States spent about
$149 billion on advertising. By pushing up production costs, advertising may push
up prices. If the advertising serves no socially useful purpose, these costs represent
a waste of resources in the economy. Second, firms may be able to use advertising to
manipulate demand and create barriers to entry. If a few firms in a particular
market have developed intense brand loyalty, it may be difficult for new firms to
enter—the advertising creates a kind of barrier to entry. By maintaining barriers to
entry, firms may be able to sustain high prices.

“The text was adapted by The Saylor Foundation under the CC BY-NC-SA without attribution as requested by the works original creator or l icensee”
Saylor.org Saylor URL: http://www.saylor.org/books/
25
But advertising has its defenders. They argue that advertising provides consumers
with useful information and encourages price competition. Without advertising,
these defenders argue, it would be impossible for new firms to enter an industry.
Advertising, they say, promotes competition, lowers prices, and encourages a
greater range of choice for consumers.
Advertising, like all other economic phenomena, has benefits as well as costs. To
assess those benefits and costs, let us examine the impact of advertising on the
economy.
Advertising and Information
Advertising does inform us about products and their prices. Even critics of
advertising generally agree that when advertising advises consumers about the
availability of new products, or when it provides price information, it serves a useful
function. But much of the information provided by advertising appears to be of
limited value. Hearing that “Pepsi is the right one, baby” or “Tide gets your clothes
whiter than white” may not be among the most edifying lessons consumers could
learn.
Some economists argue, however, that even advertising that seems to tell us nothing
may provide useful information. They note that a consumer is unlikely to make a
“The text was adapted by The Saylor Foundation under the CC BY-NC-SA without attribution as requested by the works original creator or l icensee”
Saylor.org Saylor URL: http://www.saylor.org/books/
26
repeat purchase of a product that turns out to be a dud. Advertising an inferior
product is likely to have little payoff; people who do try it are not likely to try it
again. It is not likely a firm could profit by going to great expense to launch a
product that produced only unhappy consumers. Thus, if a product is heavily
advertised, its producer is likely to be confident that many consumers will be
satisfied with it and make repeat purchases. If this is the case, then the fact that the
product is advertised, regardless of the content of that advertising, signals
consumers that at least its producer is confident that the product will satisfy them.
Advertising and Competition
If advertising creates consumer loyalty to a particular brand, then that loyalty may
serve as a barrier to entry to other firms. Some brands of household products, such
as laundry detergents, are so well established they may make it difficult for other
firms to enter the market.
In general, there is a positive relationship between the degree of concentration of
market power and the fraction of total costs devoted to advertising. This
relationship, critics argue, is a causal one; the high expenditures on advertising are
the cause of the concentration. To the extent that advertising increases industry
concentration, it is likely to result in higher prices to consumers and lower levels of
output. The higher prices associated with advertising are not simply the result of
“The text was adapted by The Saylor Foundation under the CC BY-NC-SA without attribution as requested by the works original creator or l icensee”
Saylor.org Saylor URL: http://www.saylor.org/books/
27
passing on the cost of the advertising itself to consumers; higher prices also derive
from the monopoly power the advertising creates.
But advertising may encourage competition as well. By providing information to
consumers about prices, for example, it may encourage price competition. Suppose a
firm in a world of no advertising wants to increase its sales. One way to do that is to
lower price. But without advertising, it is extremely difficult to inform potential
customers of this new policy. The likely result is that there would be little response,
and the price experiment would probably fail. Price competition would thus be
discouraged in a world without advertising.
Empirical studies of markets in which advertising is not allowed have confirmed
that advertising encourages price competition. One of the most famous studies of
the effects of advertising looked at pricing for prescription eyeglasses. In the early
1970s, about half the states in the United States banned advertising by firms making
prescription eyeglasses; the other half allowed it. A comparison of prices in the two
groups of states by economist Lee Benham showed that the cost of prescription
eyeglasses was far lower in states that allowed advertising than in states that
banned it. [1] Mr. Benham’s research proved quite influential—virtually all states
have since revoked their bans on such advertising. Similarly, a study of the cigarette
industry revealed that before the 1970 ban on radio and television advertising
market shares of the leading cigarette manufacturers had been declining, while after
the ban market shares and profit margins increased. [2]
“The text was adapted by The Saylor Foundation under the CC BY-NC-SA without attribution as requested by the works original creator or l icensee”
Saylor.org Saylor URL: http://www.saylor.org/books/
28
Advertising may also allow more entry by new firms. When Kia, a South Korean
automobile manufacturer, entered the U.S. low-cost compact car market in 1994, it
flooded the airwaves with advertising. Suppose such advertising had not been
possible. Could Kia have entered the market in the United States? It seems highly
unlikely that any new product could be launched without advertising. The absence
of advertising would thus be a barrier to entry that would increase the degree of
monopoly power in the economy. A greater degree of monopoly power would, over
time, translate into higher prices and reduced output.
Advertising is thus a two-edged sword. On the one hand, the existence of established
and heavily advertised rivals may make it difficult for a new firm to enter a market.
On the other hand, entry into most industries would be virtually impossible without
advertising.
Economists do not agree on whether advertising helps or hurts competition in
particular markets, but one general observation can safely be made—a world with
advertising is more competitive than a world without advertising would be. The
important policy question is more limited—and more difficult to answer: Would a
world with less advertising be more competitive than a world with more?
Price Discrimination
“The text was adapted by The Saylor Foundation under the CC BY-NC-SA without attribution as requested by the works original creator or l icensee”
Saylor.org Saylor URL: http://www.saylor.org/books/
29
Throughout the text up to this point, we have assumed that firms sold all units of
output at the same price. In some cases, however, firms can charge different prices
to different consumers. If such an opportunity exists, the firm can increase profits
further.
When a firm charges different prices for the same good or service to different
consumers, even though there is no difference in the cost to the firm of supplying
these consumers, the firm is engaging in price discrimination. Except for a few
situations of price discrimination that have been declared illegal, such as
manufacturers selling their goods to distributors at different prices when there are
no differences in cost, price discrimination is generally legal.
The potential for price discrimination exists in all market structures except perfect
competition. As long as a firm faces a downward-sloping demand curve and thus has
some degree of monopoly power, it may be able to engage in price discrimination.
But monopoly power alone is not enough to allow a firm to price discriminate.
Monopoly power is one of three conditions that must be met:
1. A Price-Setting Firm The firm must have some degree of monopoly power—
it must be a price setter. A price-taking firm can only take the market price as
given—it is not in a position to make price choices of any kind. Thus, firms in
perfectly competitive markets will not engage in price discrimination. Firms
“The text was adapted by The Saylor Foundation under the CC BY-NC-SA without attribution as requested by the works original creator or l icensee”
Saylor.org Saylor URL: http://www.saylor.org/books/
30
in monopoly, monopolistically competitive, or oligopolistic markets may
engage in price discrimination.
2. Distinguishable Customers The market must be capable of being fairly
easily segmented—separated so that customers with different elasticities of
demand can be identified and treated differently.
3. Prevention of Resale The various market segments must be isolated in some
way from one another to prevent customers who are offered a lower price
from selling to customers who are charged a higher price. If consumers can
easily resell a product, then discrimination is unlikely to be successful. Resale
may be particularly difficult for certain services, such as dental checkups.
Examples of price discrimination abound. Senior citizens and students are often
offered discount fares on city buses. Children receive discount prices for movie
theater tickets and entrance fees at zoos and theme parks. Faculty and staff at
colleges and universities might receive discounts at the campus bookstore. Airlines
give discount prices to customers who are willing to stay over a Saturday night.
Physicians might charge wealthy patients more than poor ones. People who save
coupons are able to get discounts on many items. In all these cases a firm charges
different prices to different customers for what is essentially the same product.
Not every instance of firms charging different prices to different customers
constitutes price discrimination. Differences in prices may reflect different costs
associated with providing the product. One buyer might require special billing
practices, another might require delivery on a particular day of the week, and yet
“The text was adapted by The Saylor Foundation under the CC BY-NC-SA without attribution as requested by the works original creator or l icensee”
Saylor.org Saylor URL: http://www.saylor.org/books/
31
another might require special packaging. Price differentials based on differences in
production costs are not examples of price discrimination.
Why would a firm charge different prices to different consumers? The answer can
be found in the marginal decision rule and in the relationship between marginal
revenue and elasticity.
Suppose an airline has found that its long-run profit-maximizing solution for a
round-trip flight between Minneapolis and Cleveland, when it charges the same
price to all passengers, is to carry 300 passengers at $200 per ticket. The airline has
a degree of monopoly power, so it faces a downward-sloping demand curve. The
airline has noticed that there are essentially two groups of customers on each flight:
people who are traveling for business reasons and people who are traveling for
personal reasons (visiting family or friends or taking a vacation). We will call this
latter group “tourists.” Of the 300 passengers, 200 are business travelers and 100
are tourists. The airline’s revenue from business travelers is therefore currently
$40,000 ($200 times 200 business travelers) and from tourists is currently $20,000
($200 times 100 tourists).
It seems likely that the price elasticities of demand of these two groups for a
particular flight will differ. Tourists may have a wide range of substitutes: They
could take their trips at a different time, they could vacation in a different area, or
they could easily choose not to go at all. Business travelers, however, might be
“The text was adapted by The Saylor Foundation under the CC BY-NC-SA without attribution as requested by the works original creator or l icensee”
Saylor.org Saylor URL: http://www.saylor.org/books/
32
attending meetings or conferences at a particular time and in a particular city. They
have options, of course, but the range of options is likely to be more limited than the
range of options facing tourists. Given all this, tourists are likely to have relatively
more price elastic demand than business travelers for a particular flight.
The difference in price elasticities suggests the airline could increase its profit by
adjusting its pricing. To simplify, suppose that at a price of about $200 per ticket,
demand by tourists is relatively price elastic and by business travelers is relatively
less price elastic. It is plausible that the marginal cost of additional passengers is
likely to be quite low, since the number of crewmembers will not vary and no food is
served on short flights. Thus, if the airline can increase its revenue, its profits will
increase. Suppose the airline lowers the price for tourists to $190. Suppose that the
lower price encourages 10 more tourists to take the flight. Of course, the airline
cannot charge different prices to different tourists; rather it charges $190 to all, now
110, tourists. Still, the airline’s revenue from tourist passengers increases from
$20,000 to $20,900 ($190 times 110 tourists). Suppose it charges $250 to its
business travelers. As a result, only 195 business travelers take the flight. The
airline’s revenue from business travelers still rises from $40,000 to $48,750 ($250
times 195 business travelers). The airline will continue to change the mix of
passengers, and increase the number of passengers, so long as doing so increases its
profit. Because tourist demand is relatively price elastic, relatively small reductions
in price will attract relatively large numbers of additional tourists. Because business
demand is relatively less elastic, relatively large increases in price will discourage
relatively small numbers of business travelers from making the trip. The airline will
continue to reduce its price to tourists and raise its price to business travelers as
long as it gains profit from doing so.
“The text was adapted by The Saylor Foundation under the CC BY-NC-SA without attribution as requested by the works original creator or l icensee”
Saylor.org Saylor URL: http://www.saylor.org/books/
33
Of course, the airline can impose a discriminatory fare structure only if it can
distinguish tourists from business travelers. Airlines typically do this by looking at
the travel plans of their customers. Trips that involve a stay over a weekend, for
example, are more likely to be tourist related, whereas trips that begin and end
during the workweek are likely to be business trips. Thus, airlines charge much
lower fares for trips that extend through a weekend than for trips that begin and
end on weekdays.
In general, price-discrimination strategies are based on differences in price
elasticity of demand among groups of customers and the differences in marginal
revenue that result. A firm will seek a price structure that offers customers with
more elastic demand a lower price and offers customers with relatively less elastic
demand a higher price.
It is always in the interest of a firm to discriminate. Yet most of the goods and
services that we buy are not offered on a discriminatory basis. A grocery store does
not charge a higher price for vegetables to vegetarians, whose demand is likely to be
less elastic than that of its omnivorous customers. An audio store does not charge a
different price for Pearl Jam’s compact disks to collectors seeking a complete
collection than it charges to casual fans who could easily substitute a disk from
another performer. In these cases, firms lack a mechanism for knowing the different
demands of their customers and for preventing resale.
“The text was adapted by The Saylor Foundation under the CC BY-NC-SA without attribution as requested by the works original creator or l icensee”
Saylor.org Saylor URL: http://www.saylor.org/books/
34
KEY TAKEAWAYS
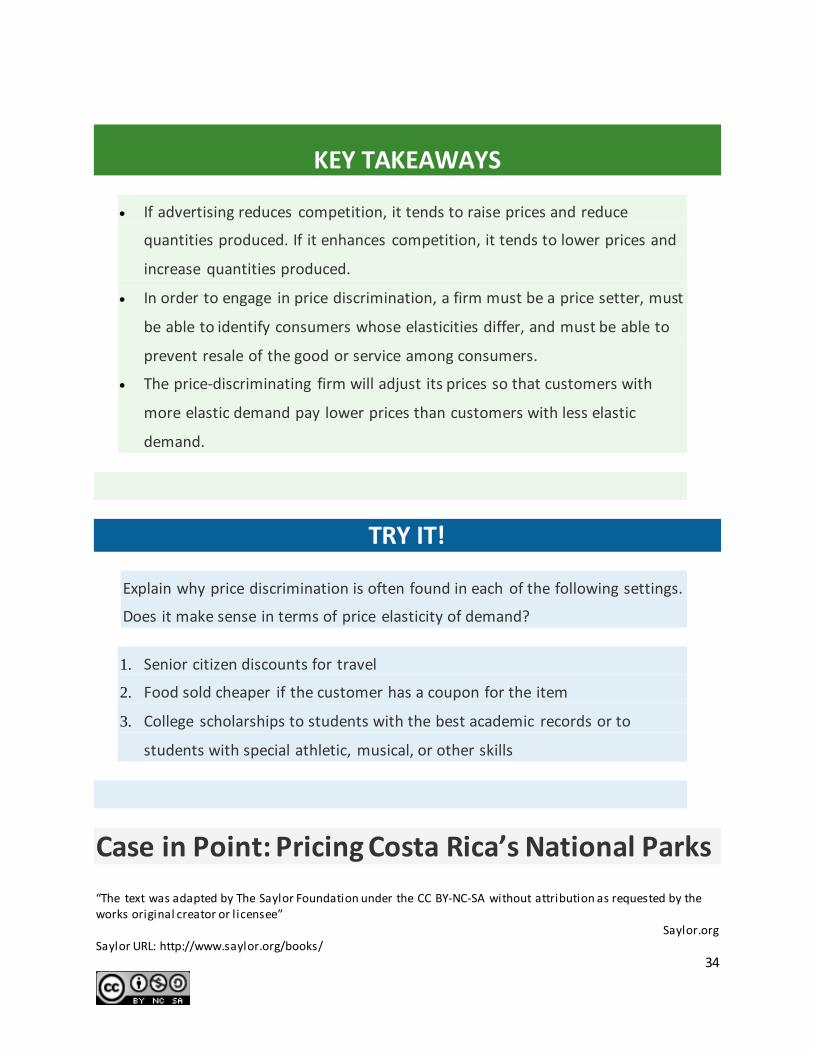
If advertising reduces competition, it tends to raise prices and reduce
quantities produced. If it enhances competition, it tends to lower prices and
increase quantities produced.
In order to engage in price discrimination, a firm must be a price setter, must
be able to identify consumers whose elasticities differ, and must be able to
prevent resale of the good or service among consumers.
The price-discriminating firm will adjust its prices so that customers with
more elastic demand pay lower prices than customers with less elastic
demand.
TRY IT!
Explain why price discrimination is often found in each of the following settings.
Does it make sense in terms of price elasticity of demand?
1. Senior citizen discounts for travel
2. Food sold cheaper if the customer has a coupon for the item
3. College scholarships to students with the best academic records or to
students with special athletic, musical, or other skills
Case in Point: Pricing Costa Rica’s National Parks
“The text was adapted by The Saylor Foundation under the CC BY-NC-SA without attribution as requested by the works original creator or l icensee”
Saylor.org Saylor URL: http://www.saylor.org/books/
35
Costa Rica boasts some of the most beautiful national parks in the world. An analysis
by Francisco Alpizar, an economist with Gothenburg University in Sweden and
CATIE, a tropical research institute in Costa Rica, suggests that Costa Rica should
increase the degree to which it engages in price discrimination in pricing its national
parks.
The country has experimented with a wide range of prices for its national parks,
with the price varying between $.80 and $15 for a daily visit. With data on the
resultant number of visitors at each price, Professor Alpizar was able to estimate the
demand curve, compute the price elasticity of demand, and develop a
recommendation for pricing the country’s national parks.
Presumably, foreign visitors have a relatively less elastic demand for visiting the
parks than do local citizens. Local citizens have better knowledge of substitutes for
the parks—namely other areas in Costa Rica. And, of course, once foreign travelers
are in the country, they have already committed the expense of getting there, and
are less likely to be willing to pass up a visit to national parks based on pricing
considerations.
Costa Rica already discriminates to a large degree. Foreigners are charged $7 per
day to visit the parks; locals are charged $2. Professor Alpizar proposes increasing
the degree of discrimination.
“The text was adapted by The Saylor Foundation under the CC BY-NC-SA without attribution as requested by the works original creator or l icensee”
Saylor.org Saylor URL: http://www.saylor.org/books/
36
He estimates that the price elasticity of foreign demand for visits to Costa Rica’s
national parks is −0.68. That, of course, suggests inelastic demand. Costa Rica could
increase its revenue from foreign visitors by increasing the fee. Professor Alpizar
proposes increasing the fee for foreigners to $10. He proposes that the price
charged to Costa Ricans remain at $2—a price that he calculates equals the marginal
cost of an additional visit.
Professor Alpizar calculates a fee of $10 per visit by a foreigner would more than
pay the country’s fixed cost of maintaining its extensive park system, which utilizes
24% of the country’s land. The higher price would thus allow the government to
meet the major costs of operating the national parks. Charging a $2 fee to locals
would satisfy the efficiency requirement that price equal marginal cost for local
visitors; the $10 fee to foreigners would permit the country to exploit its monopoly
power in permitting people to visit the parks. The Costa Rican government has
asked Professor Alpizar to design three pilot projects aimed at incorporating his
proposal to raise park fees to foreign visitors.
Source: Francisco Alpizar, “The Pricing of Protected Areas in Nature-Based Tourism:
A Local Prospective,” Ecological Economics, 56(2) (February 2006): 294–307 and
personal correspondence with Professor Alpizar.
ANSWERS TO TRY IT! PROBLEMS
1. Senior citizens are (usually!) easy to identify, and for travel, preventing
resale is usually quite easy as well. For example, a picture ID is required to
“The text was adapted by The Saylor Foundation under the CC BY-NC-SA without attribution as requested by the works original creator or l icensee”
Saylor.org Saylor URL: http://www.saylor.org/books/
37
board an airplane. Airlines might be expected to oppose implementing the
rule since it is costly for them. The fact that they support the rule can be
explained by how it aids them in practicing price discrimination, by
preventing the resale of discount tickets, which now can easily be matched
to the purchasing customers. The demand for air travel by senior citizens is
likely to be more elastic than it is for other passengers, especially business
travelers, since the purpose of their travel is largely discretionary (often
touristic in nature) and since their time is likely to be less costly, making
them more willing to seek out information on travel alternatives than the
rest of the population.
2. Since the customer must present the coupon at the point of sale,
identification is easy. Willingness to search for and cut out coupons suggests
a high degree of price consciousness and thus a greater price elasticity of
demand.
3. Such students are likely to have more choices of where to attend college. As
we learned in an earlier chapter on elasticity, demand is likely to be more
elastic when substitutes are available for it. Enrollment procedures make
identification and prevention of resale very easy.
[1] Lee Benham, “The Effect of Advertising on the Price of Eyeglasses,” Journal of Law
and Economics 15(2) (1972): 337–352.
[2] Woodrow Eckard, “Competition and the Cigarette TV Advertising Ban,” Economic
Inquiry 29(1) (January 1991), 119–133.

“The text was adapted by The Saylor Foundation under the CC BY-NC-SA without attribution as requested by the works original creator or l icensee”
Saylor.org Saylor URL: http://www.saylor.org/books/
38
11.4 Review and Practice
Summary
This chapter examined the world of imperfect competition that exists between the
idealized extremes of perfect competition and monopoly. Imperfectly competitive
markets exist whenever there is more than one seller in a market and at least one
seller has some degree of control over price.
We discussed two general types of imperfectly competitive markets: monopolistic
competition and oligopoly. Monopolistic competition is characterized by many firms
producing similar but differentiated goods and services in a market with easy entry
and exit. Oligopoly is characterized by relatively few firms producing either
standardized or differentiated products. There may be substantial barriers to entry
and exit.
In the short run, a monopolistically competitive firm’s pricing and output decisions
are the same as those of a monopoly. In the long run, economic profits will be
whittled away by the entry of new firms and new products that increase the number
of close substitutes. An industry dominated by a few firms is an oligopoly. Each
oligopolist is aware of its interdependence with other firms in the industry and is
“The text was adapted by The Saylor Foundation under the CC BY-NC-SA without attribution as requested by the works original creator or l icensee”
Saylor.org Saylor URL: http://www.saylor.org/books/
39
constantly aware of the behavior of its rivals. Oligopolists engage in strategic
decision making in order to determine their best output and pricing strategies as
well as the best forms of nonprice competition.
Advertising in imperfectly competitive markets can increase the degree of
competitiveness by encouraging price competition and promoting entry. It can also
decrease competition by establishing brand loyalty and thus creating barriers to
entry.
Where conditions permit, a firm can increase its profits by price discrimination,
charging different prices to customers with different elasticities of demand. To
practice price discrimination, a price-setting firm must be able to segment
customers that have different elasticities of demand and must be able to prevent
resale among its customers.
CONCEPT PROBLEMS
1. What are the major distinctions between a monopolistically competitive
industry and an oligopolistic industry?
2. What is the difference between a price taker and a price setter? Which do
you think a firm would prefer to be? Why?
“The text was adapted by The Saylor Foundation under the CC BY-NC-SA without attribution as requested by the works original creator or l icensee”
Saylor.org Saylor URL: http://www.saylor.org/books/
40
3. In the model of monopolistic competition, we say that there is product
differentiation. What does this mean, and how does it differ from the
assumption of homogeneous goods in perfect competition?
4. In the following list of goods and services, determine whether the item
is produced under conditions of monopolistic competition or of
oligopoly.
1. soft drinks
2. exercise drinks
3. office supply stores
4. massage therapists
5. accountants
6. colleges and universities
7. astrologists
5. Suppose a city experiences substantial population growth. What is likely to
happen to profits in the short run and in the long run in the market for
haircuts, a monopolistically competitive market?
6. Some professors grade students on the basis of an absolute percentage of
the highest score earned on each test given during the semester. All
students who get within a certain percentage of the highest score earned
get an A. Why do these professors not worry that the students will get
together and collude in such a way as to keep the high score in the class
equal to a very low total?
“The text was adapted by The Saylor Foundation under the CC BY-NC-SA without attribution as requested by the works original creator or l icensee”
Saylor.org Saylor URL: http://www.saylor.org/books/
41
7. Your parents probably told you to avoid tit-for-tat behavior. Why does it
make sense for firms to do it?
8. What model of oligopoly behavior were the DRAM producers discussed in
the Case in Point following? How might the DRAM producers have achieved
their goal and still stayed within the law?
9. Explain why a price increase for foreigners would increase Costa Rica’s total
revenue and profits from operating its national park system.
10. Restaurants typically charge much higher prices for dinner than for lunch,
despite the fact that the cost of serving these meals is about the same. Why
do you think this is the case? (Hint: Think about the primary consumers of
these meals and their respective elasticities.)
11. What effect do you think advertising to discourage cigarette smoking will
have on teens? On adults? What changes might occur in the cigarette
market as a result?
12. Many manufacturers of clothing and other consumer goods open stores in
outlet malls where they charge much lower prices than they charge in their
own stores located within cities. Outlet malls are typically located a
considerable distance from major metropolitan areas, and stores in them
typically charge much lower prices than do stores located within cities. Given
that both sets of stores are often owned by the same firm, explain this price
discrimination based on likely differences in the price elasticity of demand
between consumers in the two types of stores.
13. Suppose a particular state were to ban the advertising of prices charged by
firms that provide laser eye surgery. What effect do you think that would
have on the price of this service?
14. The Case in Point on microbreweries noted that a large number of such
breweries open every year. Yet, the model of monopolistic competition
“The text was adapted by The Saylor Foundation under the CC BY-NC-SA without attribution as requested by the works original creator or l icensee”
Saylor.org Saylor URL: http://www.saylor.org/books/
42
predicts that the long run equilibrium solution in such markets is one of zero
economic profits. Why do firms enter such industries?
15. Many lawyers advertise their services. Do you think this raises or lowers the
price of legal services? Explain your answer carefully.
NUMERICAL PROBLEMS
1. Suppose the monopolistically competitive barber shop industry in a
community is in long-run equilibrium, and that the typical price is $20
per haircut. Moreover, the population is rising.
1. Illustrate the short-run effects of a change on the price and
output of a typical firm in the market.
2. Show what happens in the long run. Will the final price be higher
than $20? Equal $20? Be less than $20? Assume that nothing
happens to the cost of producing haircuts.
3. Suppose that, initially, the price of a typical children’s haircut is
$10. Do you think this represents price discrimination? Why or
why not?
2. Consider the same industry as in Problem 1. Suppose the market is in
long-run equilibrium and that an annual license fee is imposed on
barber shops.
1. Illustrate the short-run effects of the change on the price and
output of haircuts for a typical firm in the community.
“The text was adapted by The Saylor Foundation under the CC BY-NC-SA without attribution as requested by the works original creator or l icensee”
Saylor.org Saylor URL: http://www.saylor.org/books/
43
2. Now show what happens to price and output for a typical firm in
the long run.
3. Who pays the fee in the long run? How does this compare to the
conclusions of the model of perfect competition?
3. Industry A consists of four firms, each of which has an equal share of
the market.
1. Compute the Herfindahl-Hirschman index for the industry.
2. Industry B consists of 10 firms, each of which has an equal share
of the market. Compare the Herfindahl–Hirschman Indexes for
the two industries.
3. Now suppose that there are 100 firms in the industry, each with
equal shares. What is the Herfindahl-Hirschman index for this
industry?
4. State the general relationship between the competitiveness of an
industry and its Herfindahl-Hirschman index.
4. Given the payoff matrix (shown below) for a duopoly, consisting of Firm
A and Firm B, in which each firm is considering an expanded advertising
campaign, answer the following questions (all figures in the payoff
matrix give changes in annual profits in millions of dollars):
1. Does Firm A have a dominant strategy?
2. Does Firm B have a dominant strategy?
3. Is there a dominant strategy equilibrium? Explain.

“The text was adapted by The Saylor Foundation under the CC BY-NC-SA without attribution as requested by the works original creator or l icensee”
Saylor.org Saylor URL: http://www.saylor.org/books/
44
Figure 11.10
5. Suppose that two industries each have a four-firm concentration ratio
of 75%.
1. Explain what this means.
2. Suppose that the HHI of the first industry is 425, and that the HHI
of the second is 260. Which would you say is the more
competitive? Why?
6. Suppose that a typical firm in a monopolistically competitive industry
faces a demand curve given by:
q = 60 − (1/2)p, where q is quantity sold per week.
The firm’s marginal cost curve is given by: MC = 60.
1. How much will the firm produce in the short run?
2. What price will it charge?
3. Draw the firm’s demand, marginal revenue, and marginal cost
curves. Does this solution represent a long-run equilibrium? Why
or why not?

“The text was adapted by The Saylor Foundation under the CC BY-NC-SA without attribution as requested by the works original creator or l icensee”
Saylor.org Saylor URL: http://www.saylor.org/books/
45
Recommended