11th International QUENCH Workshop - Karlsruhe - October 25-27, 2005 1
Reflooding of a degraded core with Reflooding of a degraded core with ICARE/CATHARE V2ICARE/CATHARE V2
Florian Fichot1 - Fabien Duval1 - Nicolas Trégourès1 Céline Béchaud2 - Michel Quintard3 - Magali Zabiégo1
1 Institut de Radioprotection et de Sûreté Nucléaire (IRSN)2 Electricité de France (EdF)
3 Institut de Mécanique des Fluides de Toulouse (IMFT)
11th International QUENCH Workshop - Karlsruhe - October 25-27, 2005 2
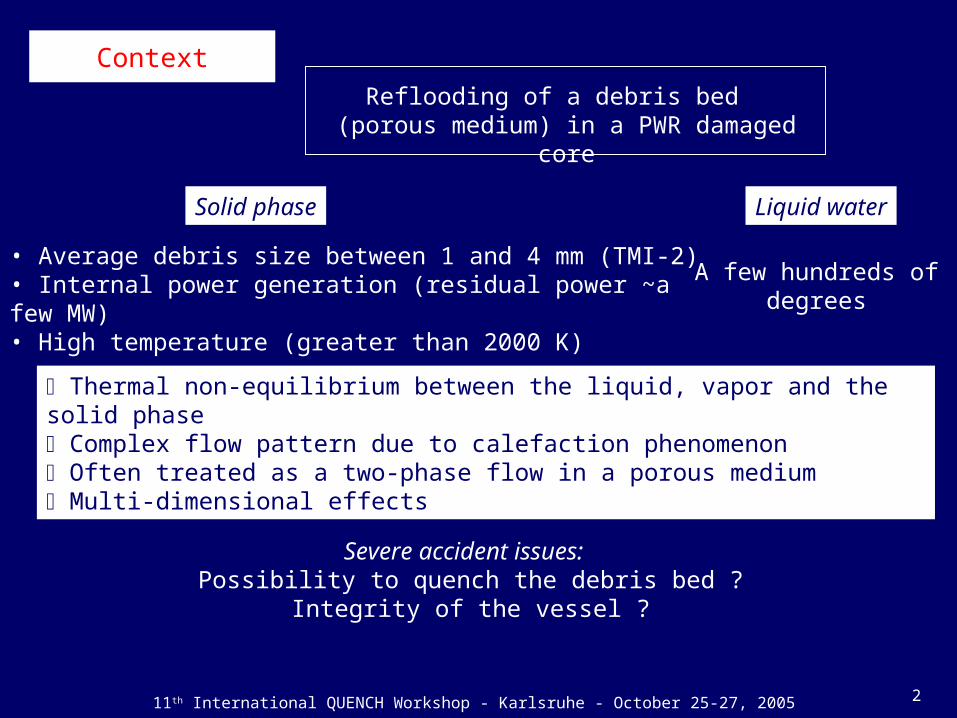
Context
Thermal non-equilibrium between the liquid, vapor and the solid phase Complex flow pattern due to calefaction phenomenon Often treated as a two-phase flow in a porous medium Multi-dimensional effects
• Average debris size between 1 and 4 mm (TMI-2)• Internal power generation (residual power ~a few MW)• High temperature (greater than 2000 K)
Solid phase
A few hundreds of degrees
Liquid water
Severe accident issues: Possibility to quench the debris bed ?
Integrity of the vessel ?
Reflooding of a debris bed (porous medium) in a PWR damaged
core
11th International QUENCH Workshop - Karlsruhe - October 25-27, 2005 3
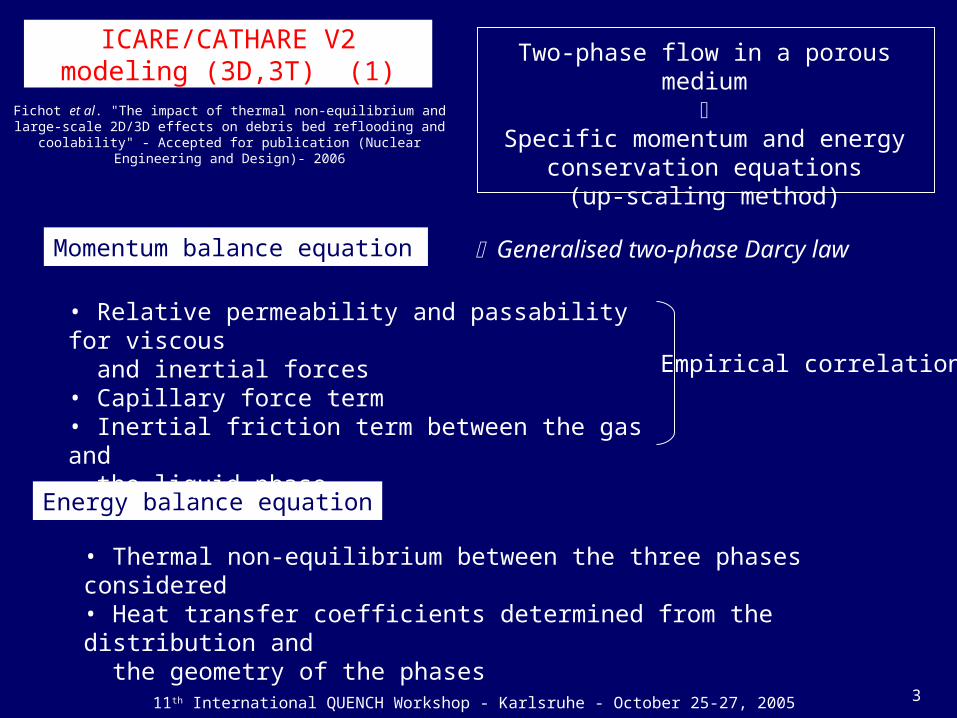
ICARE/CATHARE V2 modeling (3D,3T) (1)
Energy balance equation
• Thermal non-equilibrium between the three phases considered• Heat transfer coefficients determined from the distribution and the geometry of the phases
Two-phase flow in a porous medium
Specific momentum and energy
conservation equations(up-scaling method)
• Relative permeability and passability for viscous and inertial forces• Capillary force term• Inertial friction term between the gas and the liquid phase
Momentum balance equation Generalised two-phase Darcy law
Empirical correlations
Fichot et al. "The impact of thermal non-equilibrium and large-scale 2D/3D effects on debris bed reflooding and coolability" -
Accepted for publication (Nuclear Engineering and Design)- 2006

11th International QUENCH Workshop - Karlsruhe - October 25-27, 2005 4
ICARE/CATHARE V2 modeling (3D,3T) (2) Up-scaling method (averaging of the
local conservation equations)
Knowing: • phase distribution
(Solid-Liquid-Gas or Solid-Gas-Liquid) • void fraction, porosity, particle diam.
Heat transfer fluxes (Qsl, Qsg, Qlg) can
be derived from simplified representations of the porous medium
TBo
Film boilingNucleate boiling
SGLSLG
Selection of the flow regime: phase distribution map
SGL+SLGconfiguration
SLGconfiguration
Transitionzone
SGLconfiguration
0.8
T burn-out Tmsf(P)Solid phase temperature
=0.5
(K)
11th International QUENCH Workshop - Karlsruhe - October 25-27, 2005 5
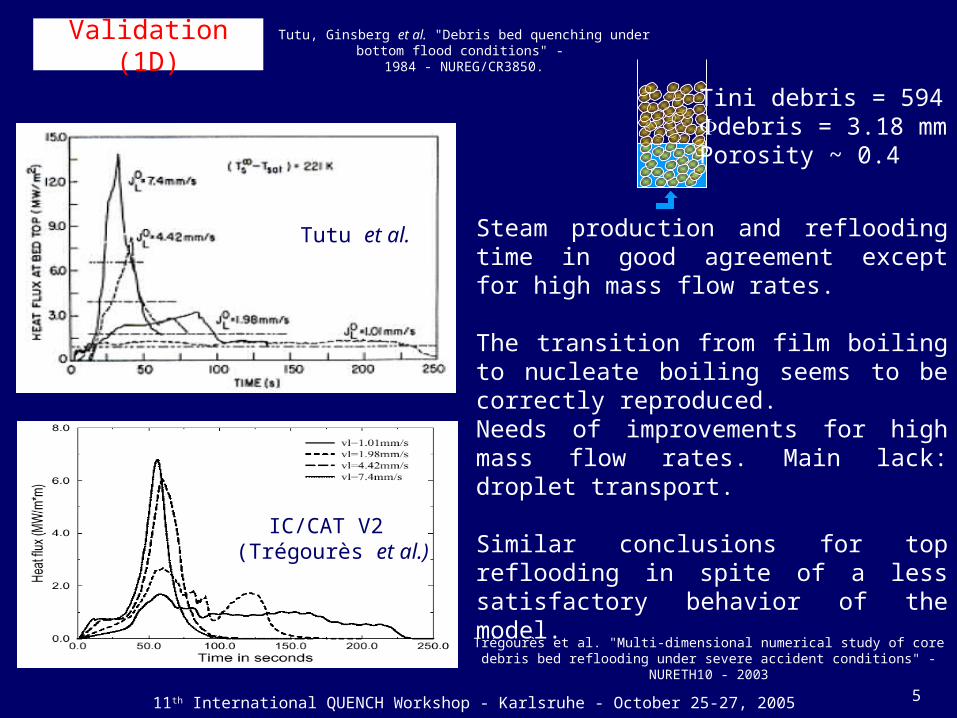
Validation (1D)
Tutu et al.
IC/CAT V2 (Trégourès et al.)
Tini debris = 594 Kdebris = 3.18 mmPorosity ~ 0.4
Steam production and reflooding time in good agreement except for high mass flow rates.
The transition from film boiling to nucleate boiling seems to be correctly reproduced.Needs of improvements for high mass flow rates. Main lack: droplet transport.
Similar conclusions for top reflooding in spite of a less satisfactory behavior of the model.
Tutu, Ginsberg et al. "Debris bed quenching under bottom flood conditions" -
1984 - NUREG/CR3850.
Trégourès et al. "Multi-dimensional numerical study of core debris bed reflooding under severe accident conditions" - NURETH10 - 2003
11th International QUENCH Workshop - Karlsruhe - October 25-27, 2005 6
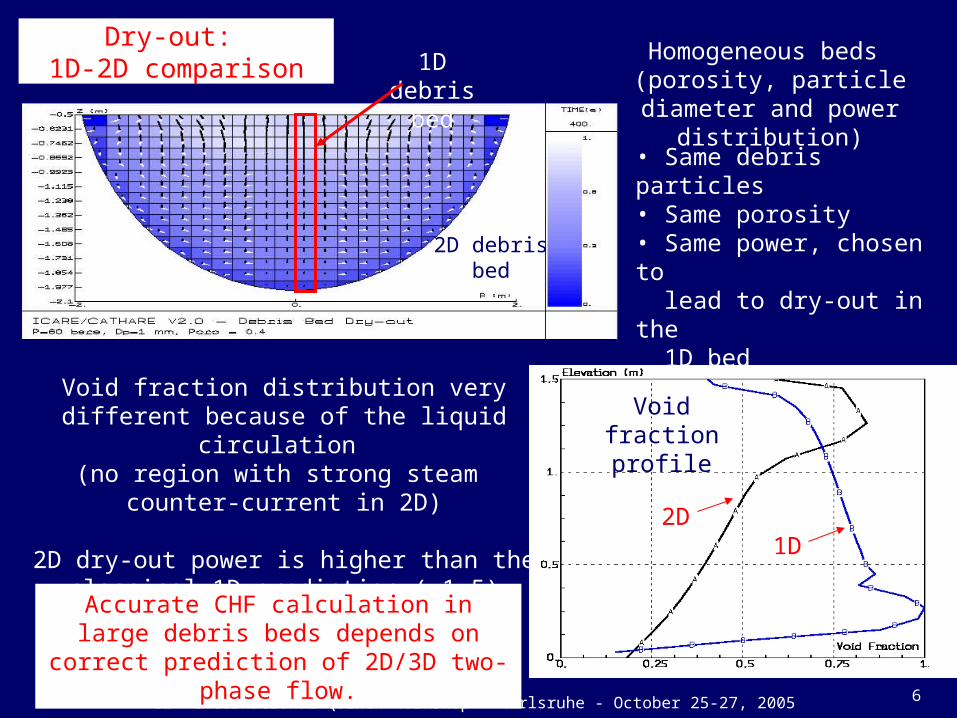
Dry-out: 1D-2D comparison 1D debris
bed
2D debris bed
• Same debris particles• Same porosity• Same power, chosen to lead to dry-out in the 1D bed• Saturated debris bed at time 0
Homogeneous beds (porosity, particle diameter
and power distribution)
1D2D
Void fraction profile
Void fraction distribution very different because of the liquid circulation
(no region with strong steam counter-current in 2D)
2D dry-out power is higher than the classical 1D prediction (~1.5)
Accurate CHF calculation in large debris beds depends on correct
prediction of 2D/3D two-phase flow.

11th International QUENCH Workshop - Karlsruhe - October 25-27, 2005 7
2D debris bed reflooding : Initial state
ICARE/CATHARE V2 simulation
Water injection
Initial temperature map
• Dry, overheated debris bed
• P = 60 bar, Tini max = 1300 K = 2 mm, Porosity = 0.4
• Power = 200 W/Kg (homogeneous)
• No debris oxidation
Water injected into the downcomer(simulation of the safety injection system)
Lower head geometry
8
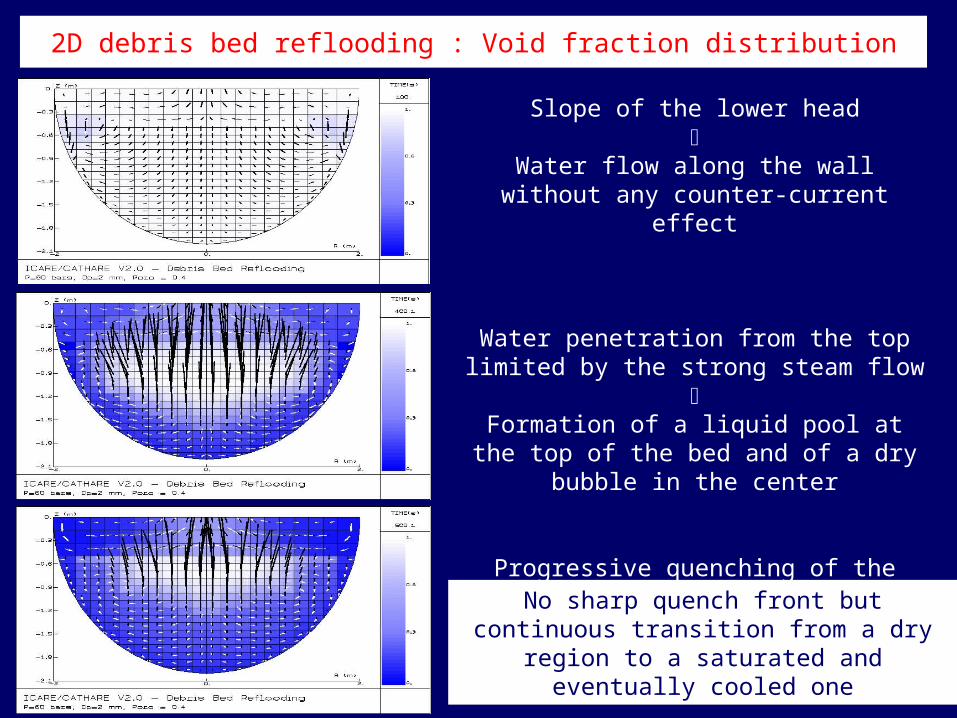
2D debris bed reflooding : Void fraction distribution
Slope of the lower head
Water flow along the wall without any counter-current effect
Water penetration from the top limited by the strong steam flow
Formation of a liquid pool at the top of
the bed and of a dry bubble in the center
Progressive quenching of the bubble
No sharp quench front but continuous transition from a dry region to a
saturated and eventually cooled one
9
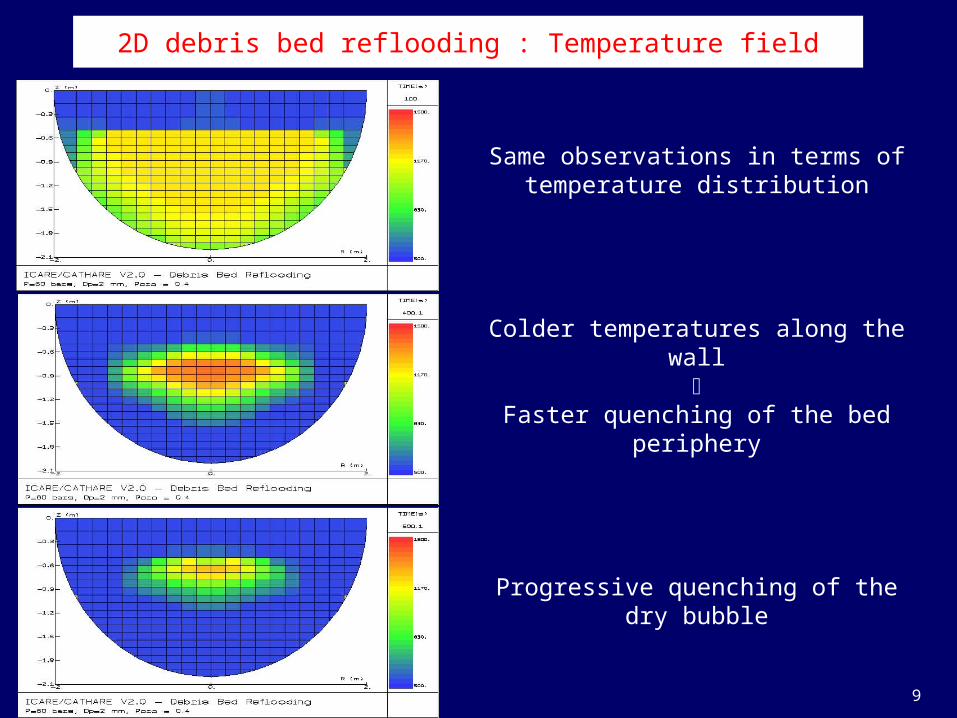
2D debris bed reflooding : Temperature field
Same observations in terms of temperature distribution
Colder temperatures along the wall
Faster quenching of the bed periphery
Progressive quenching of the dry bubble
11th International QUENCH Workshop - Karlsruhe - October 25-27, 2005 10
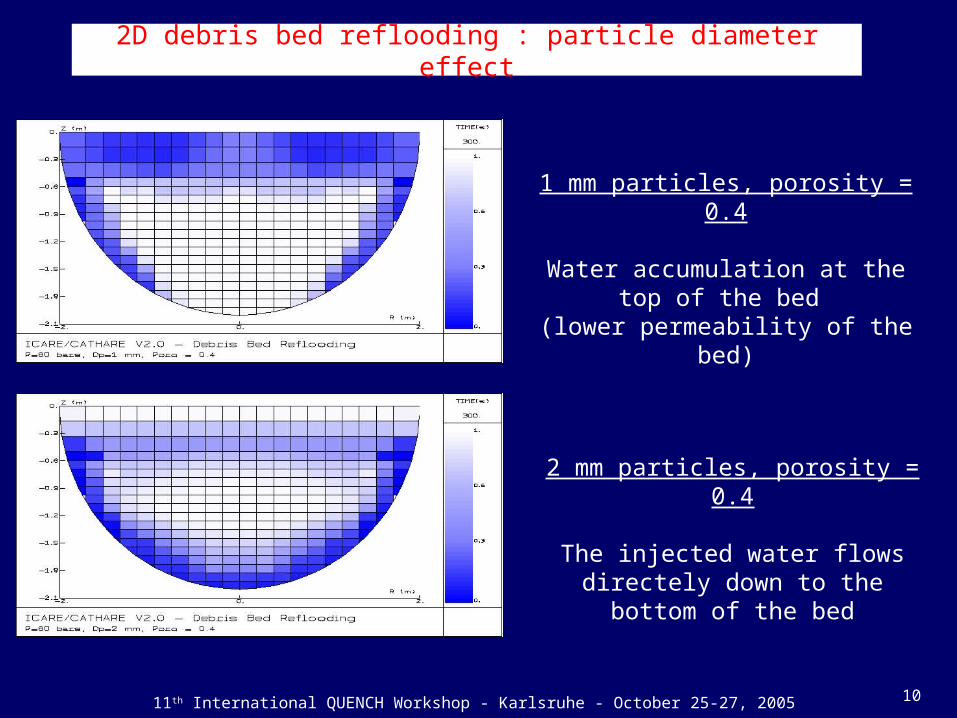
2D debris bed reflooding : particle diameter effect
1 mm particles, porosity = 0.4
Water accumulation at the top of the bed
(lower permeability of the bed)
2 mm particles, porosity = 0.4
The injected water flows directely down to the bottom of
the bed
11th International QUENCH Workshop - Karlsruhe - October 25-27, 2005 11
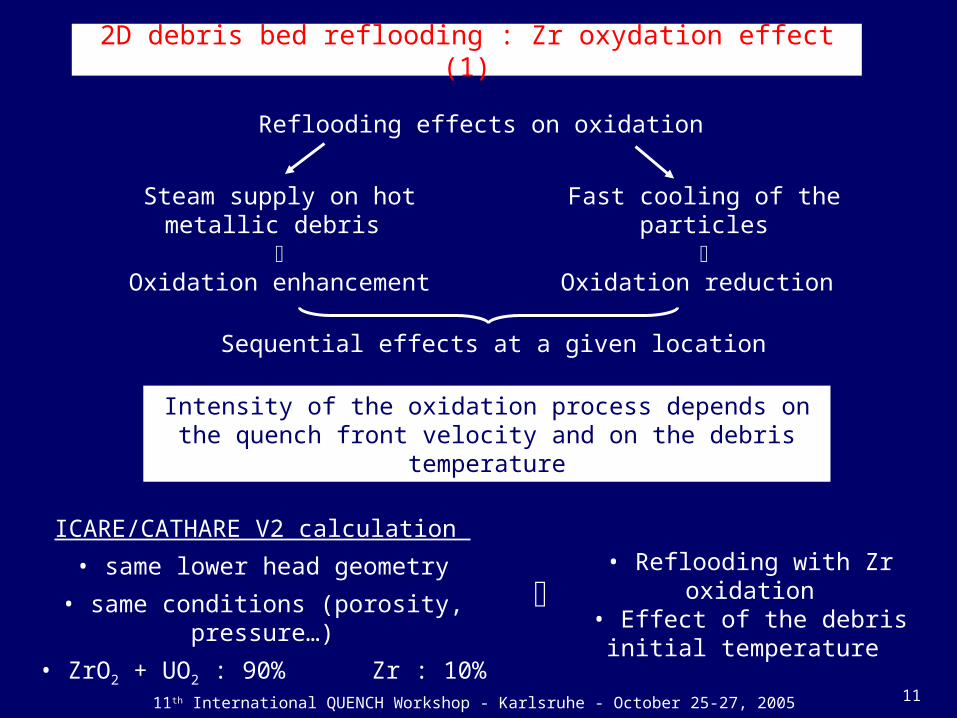
2D debris bed reflooding : Zr oxydation effect (1)
Intensity of the oxidation process depends on the quench front velocity and on the debris temperature
Reflooding effects on oxidation
Steam supply on hot metallic debris
Oxidation enhancement
Fast cooling of the particles
Oxidation reduction
Sequential effects at a given location
ICARE/CATHARE V2 calculation
• same lower head geometry
• same conditions (porosity, pressure…)
• ZrO2 + UO2 : 90% Zr : 10%
• Reflooding with Zr oxidation• Effect of the debris initial
temperature

11th International QUENCH Workshop - Karlsruhe - October 25-27, 2005 12
2D debris bed reflooding : Zr oxydation effect (2)
Tini = 1350 K
Tini = 1050 K
Start of reflooding
Center bed temperature
with time
Tini = 1050 K• Oxidation slower than quench front progression• Reaction quickly stopped due to quenching
Tini = 1350 K• Much faster oxidation reaction• Strong H2 increase after start of reflooding (delay corresponds to the time to reach higher temperatures within the bed) Start of reflooding
Tini = 1350 K
Tini = 1050 K
Cumul. H2 prod. with timeK
g
11th International QUENCH Workshop - Karlsruhe - October 25-27, 2005 13
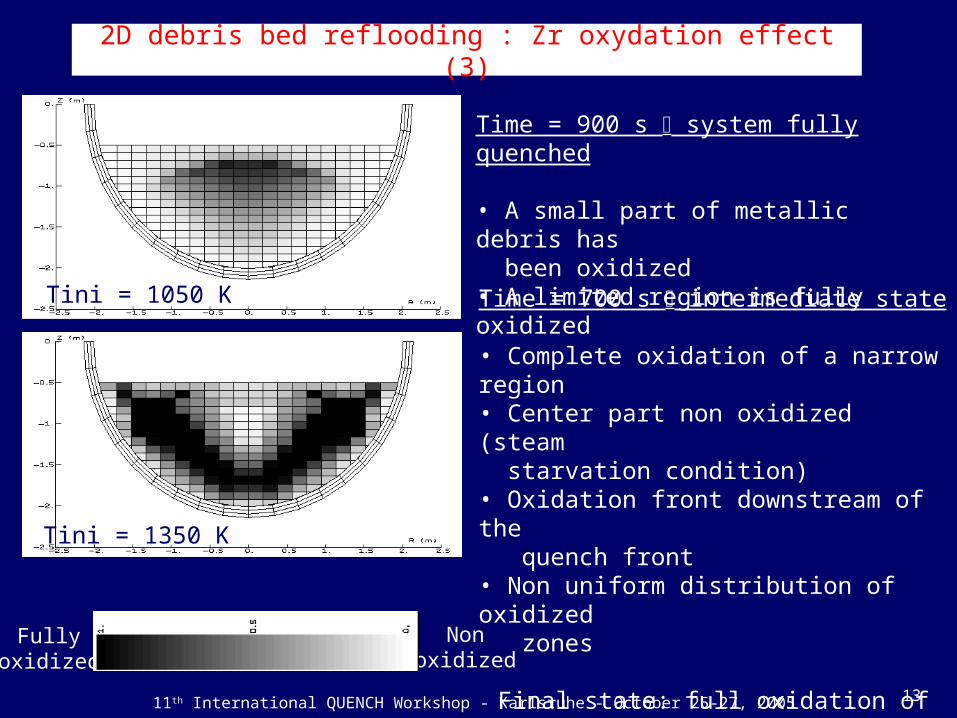
2D debris bed reflooding : Zr oxydation effect (3)
Tini = 1050 K
Tini = 1350 K
Time = 900 s system fully quenched
• A small part of metallic debris has been oxidized• A limited region is fully oxidized
Fully oxidized
Non oxidized
Time = 700 s intermediate state
• Complete oxidation of a narrow region• Center part non oxidized (steam starvation condition)• Oxidation front downstream of the quench front• Non uniform distribution of oxidized zones
Final state: full oxidation of the center part of the debris bed

11th International QUENCH Workshop - Karlsruhe - October 25-27, 2005 14
Reflooding of a reactor-like vessel (1)
Initial temperature map
Initial state
Simplified PWR vesselHot, partially oxidized rods
No debris
Main models activated
Thermal exchangesRod and mixture oxidationMolten material relocation
Reflooding
Reflooding Standard CATHARE2 laws for still-standing rods Porous medium model for debris particles
ICARE/CATHARE V2 calculation
11th International QUENCH Workshop - Karlsruhe - October 25-27, 2005 15
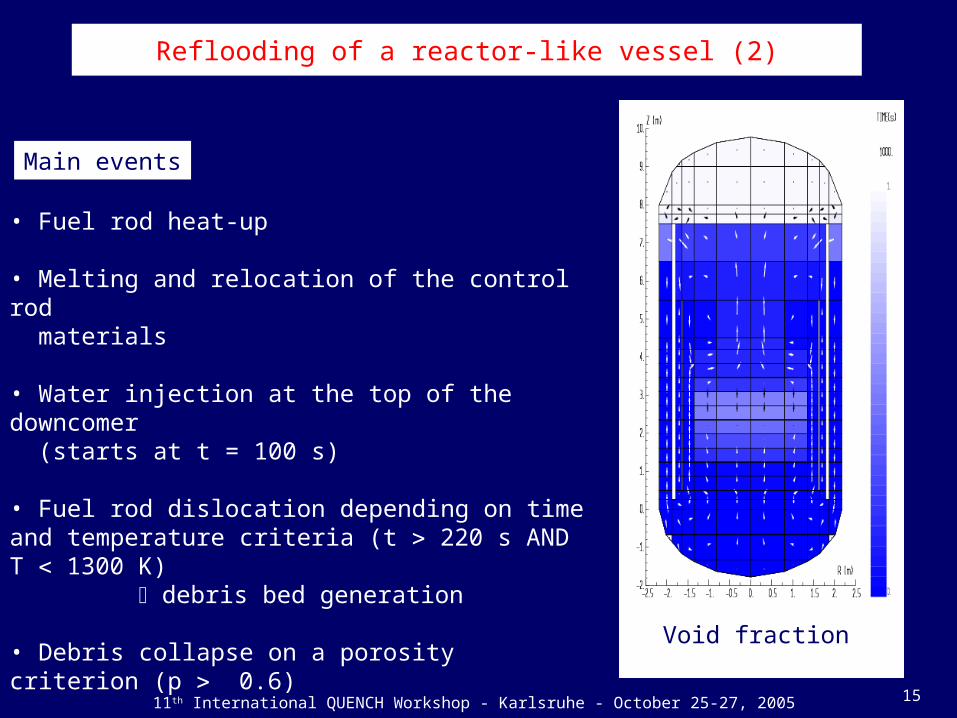
Reflooding of a reactor-like vessel (2)
• Fuel rod heat-up
• Melting and relocation of the control rod materials
• Water injection at the top of the downcomer (starts at t = 100 s)
• Fuel rod dislocation depending on time and temperature criteria (t 220 s AND T 1300 K) debris bed generation
• Debris collapse on a porosity criterion (p 0.6)
Main events
Void fraction
11th International QUENCH Workshop - Karlsruhe - October 25-27, 2005 16
Summary
• 3D non-equilibrium model implemented in ICARE/CATHARE V2
• Reflooding of a debris bed can be calculated
• Debris oxidation can be taken into account
• 2D significant effects on dry-out, reflooding and oxidation
• Correct behavior when reflooding a damaged core-like medium rods + debris collapse
11th International QUENCH Workshop - Karlsruhe - October 25-27, 2005 17
Work under way
Continuous transition from rod geometry to debris geometry Possibility to treat more realistic configurations Post-doc work based on the study of the PHEBUS-FP tomography
• Link between temperature and specific parameters of the state of the bundle (solid "particle" size, porosity size)
• Improvement of the heat transfer coefficient calculation• Improvement of the flow map
Building of a general reflooding model
Definition of experimental needs for the 2D model validation Synthesis of the experiments already performed
Need of a 2D, high temperature debris bed reflooding experiment SARNET WP 11.1 : IKE (DEBRIS facility), VTT (STYX facility)
Could give answers ?
Validation
11th International QUENCH Workshop - Karlsruhe - October 25-27, 2005 18
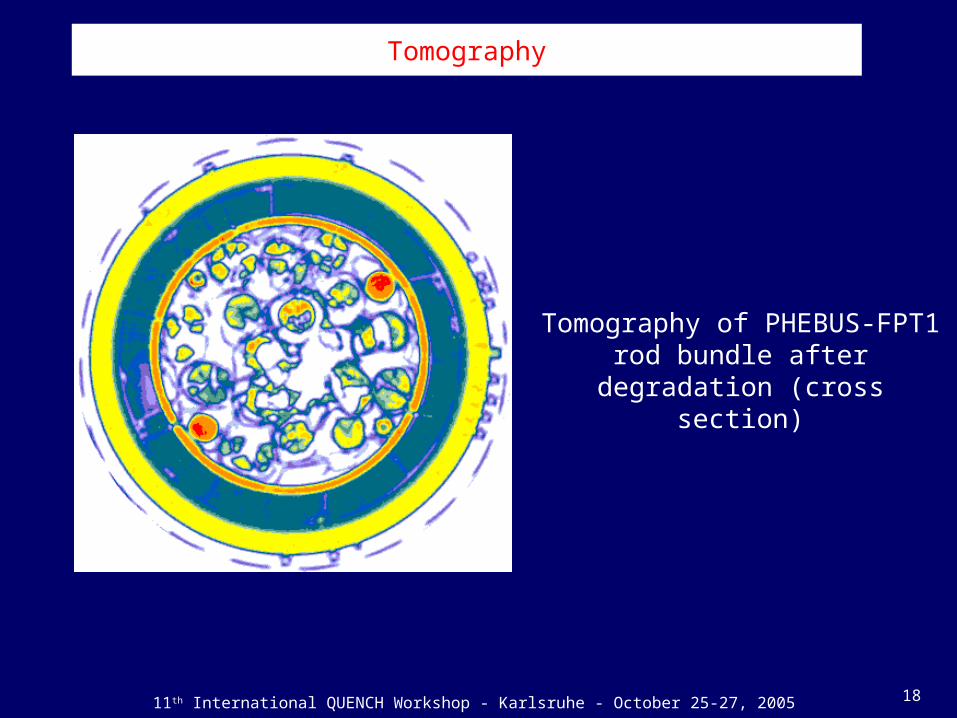
Tomography
Tomography of PHEBUS-FPT1rod bundle after degradation
(cross section)
11th International QUENCH Workshop - Karlsruhe - October 25-27, 2005 19
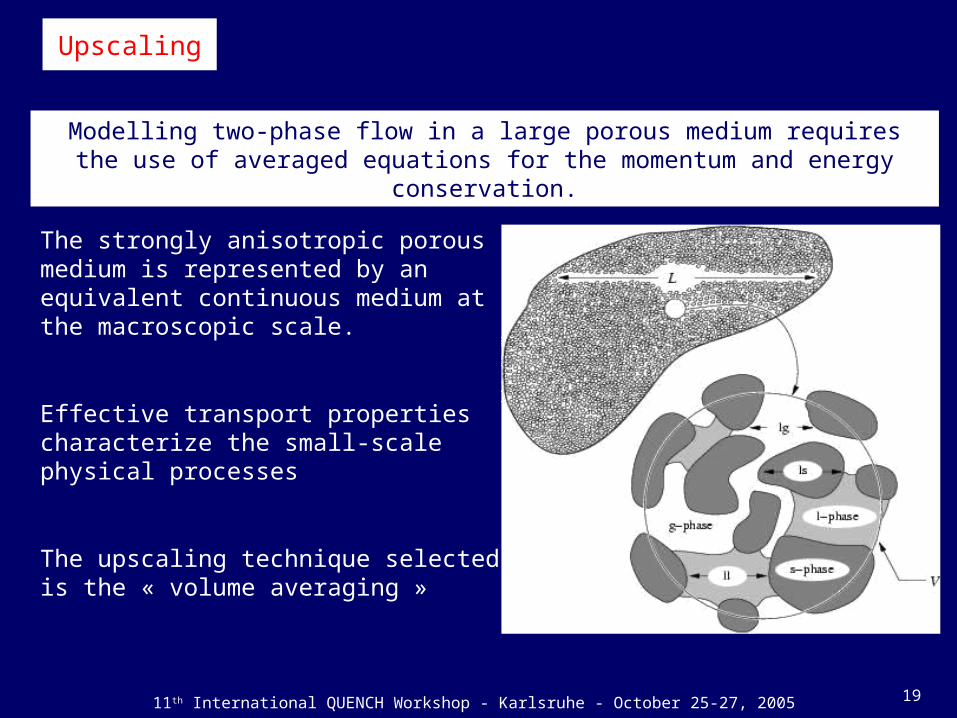
Upscaling
The strongly anisotropic porous medium is represented by an equivalent continuous medium at the macroscopic scale.
Effective transport properties characterize the small-scale physical processes
The upscaling technique selected is the « volume averaging »
Modelling two-phase flow in a large porous medium requires the use of averaged equations for the momentum and energy conservation.
Recommended


![L’hérésie cathare et la répression de l’Eglise...Les Cathares croient au message des Evangiles [la Bible], mais ils ont des conceptions religieuses différentes de celle de](https://img.pdfslide.us/doc/110x75/604640be377d95327c7edc7f/lahrsie-cathare-et-la-rpression-de-laeglise-les-cathares-croient-au.jpg)